Uncommitted Capacity Report
33
Staff Report W21-032 To: Chair and Corporate Services Committee From: Derek Burke, Director of Public Works Date: 25 Aug 2021 Subject: Uncommitted Capacity Report Report Highlights • 2020 Uncommitted Capacity Report • Enhanced Serviced Area Mapping • Coldwater Wastewater requires expansion (currently under Environmental Assessment) Recommendation THAT Public Works Report No. W21-032, dated August 12, 2021, with respect to Uncommitted Capacity Report be received as information. Background In 2019, the Township created the Allocation of Services Policy to provide a systematic, consistent, and repeatable process for the allocation of drinking water and/or wastewater treatment capacity. Capacity is reserved first for existing lots where no Planning Act application or planning approval is required. Unallocated capacity is available on a first come first serve basis with allocation control to ensure development does not exceed the Townships ability to provide drinking water and/or wastewater treatment. To support recommendations from staff and to inform Council decisions on servicing allocations, Council receives an annual report from the Public Works Department of the remaining allocated and unallocated capacity available for each of the municipal water and wastewater systems. Analysis Staff retained the services of Tatham Engineering to prepare the 2020 Uncommitted Capacity Report for the purpose of determining the adequacy of municipal drinking water and wastewater capacity for all six (6) water systems and three (3) wastewater systems to assist with making decisions on service allocations for development. The detailed report is available in Appendix 1 and enhanced mapping is provided in Appendix 2. Westshore The 2020 report suggests that Westshore is currently operating at 48% of rated wastewater capacity (5-year trend) and approximately 37% of rated drinking water capacity (maximum daily flow). With all current approved lots including registered plans of subdivisions, infill lot potentials and draft plan approvals, the system has approximately 34% uncommitted wastewater capacity and approximately 49% of uncommitted drinking water capacity.
Transcript of Uncommitted Capacity Report

Staff Report
W21-032
To: Chair and Corporate Services Committee From: Derek Burke, Director of Public Works Date: 25 Aug 2021 Subject: Uncommitted Capacity Report
Report Highlights • 2020 Uncommitted Capacity Report • Enhanced Serviced Area Mapping • Coldwater Wastewater requires expansion (currently under Environmental Assessment)
Recommendation
THAT Public Works Report No. W21-032, dated August 12, 2021, with respect to Uncommitted Capacity Report be received as information.
Background
In 2019, the Township created the Allocation of Services Policy to provide a systematic, consistent, and repeatable process for the allocation of drinking water and/or wastewater treatment capacity. Capacity is reserved first for existing lots where no Planning Act application or planning approval is required. Unallocated capacity is available on a first come first serve basis with allocation control to ensure development does not exceed the Townships ability to provide drinking water and/or wastewater treatment. To support recommendations from staff and to inform Council decisions on servicing allocations, Council receives an annual report from the Public Works Department of the remaining allocated and unallocated capacity available for each of the municipal water and wastewater systems.
Analysis
Staff retained the services of Tatham Engineering to prepare the 2020 Uncommitted Capacity Report for the purpose of determining the adequacy of municipal drinking water and wastewater capacity for all six (6) water systems and three (3) wastewater systems to assist with making decisions on service allocations for development. The detailed report is available in Appendix 1 and enhanced mapping is provided in Appendix 2.
Westshore
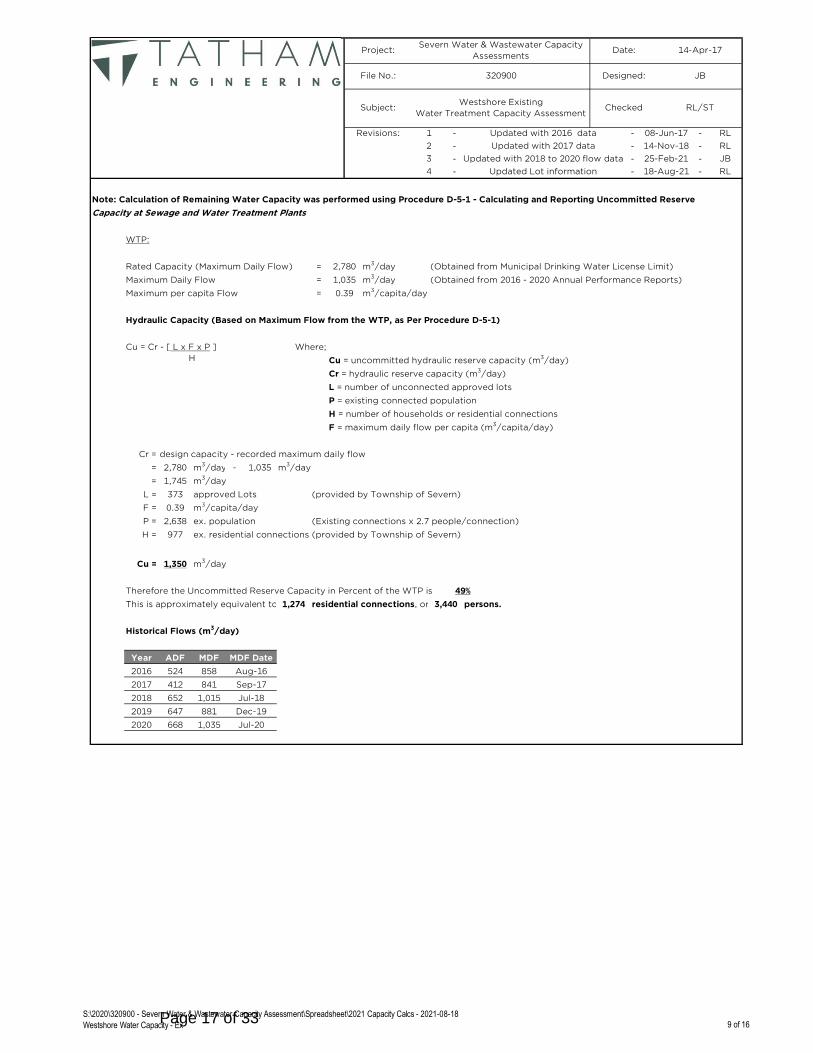
The 2020 report suggests that Westshore is currently operating at 48% of rated wastewater capacity (5-year trend) and approximately 37% of rated drinking water capacity (maximum daily flow). With all current approved lots including registered plans of subdivisions, infill lot potentials and draft plan approvals, the system has approximately 34% uncommitted wastewater capacity and approximately 49% of uncommitted drinking water capacity.
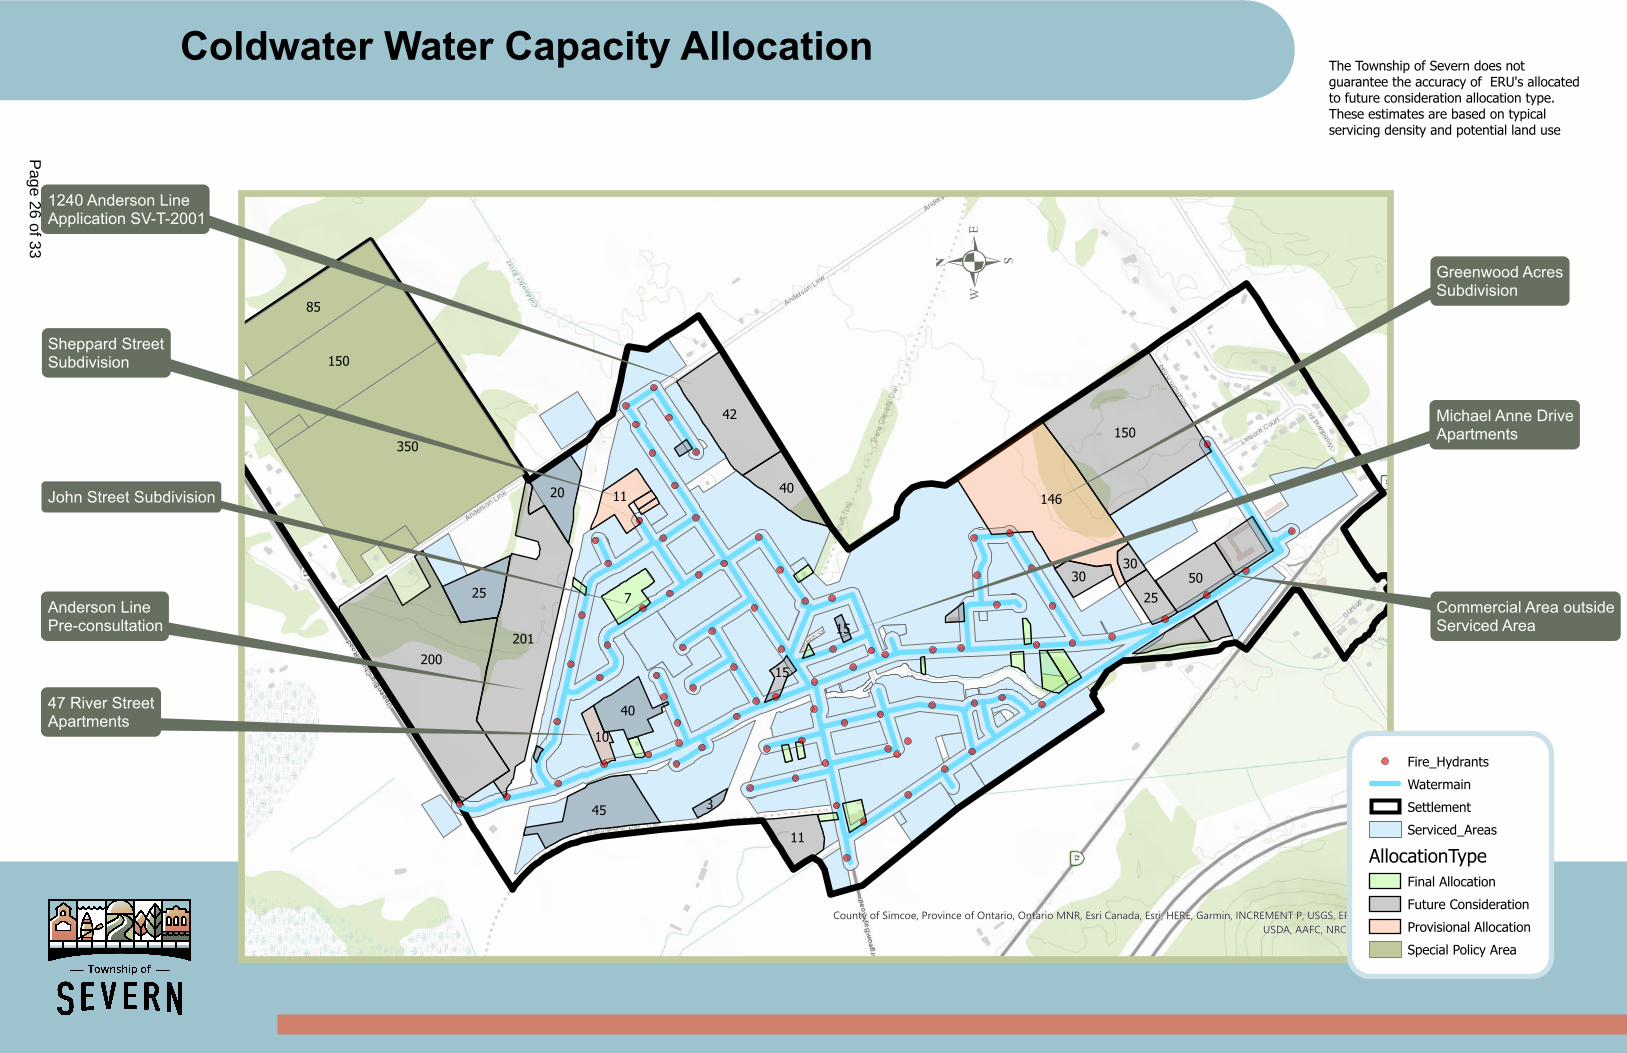
Coldwater
The 2020 report suggests that Coldwater is currently operating at 64% of rated wastewater capacity (5-year trend) and approximately 35% of rated drinking water capacity (maximum daily flow). With all current approved lots including registered plans of subdivisions, infill lot potentials and draft plan approvals, the system has approximately 14% uncommitted wastewater capacity and approximately 54% of uncommitted drinking water capacity.
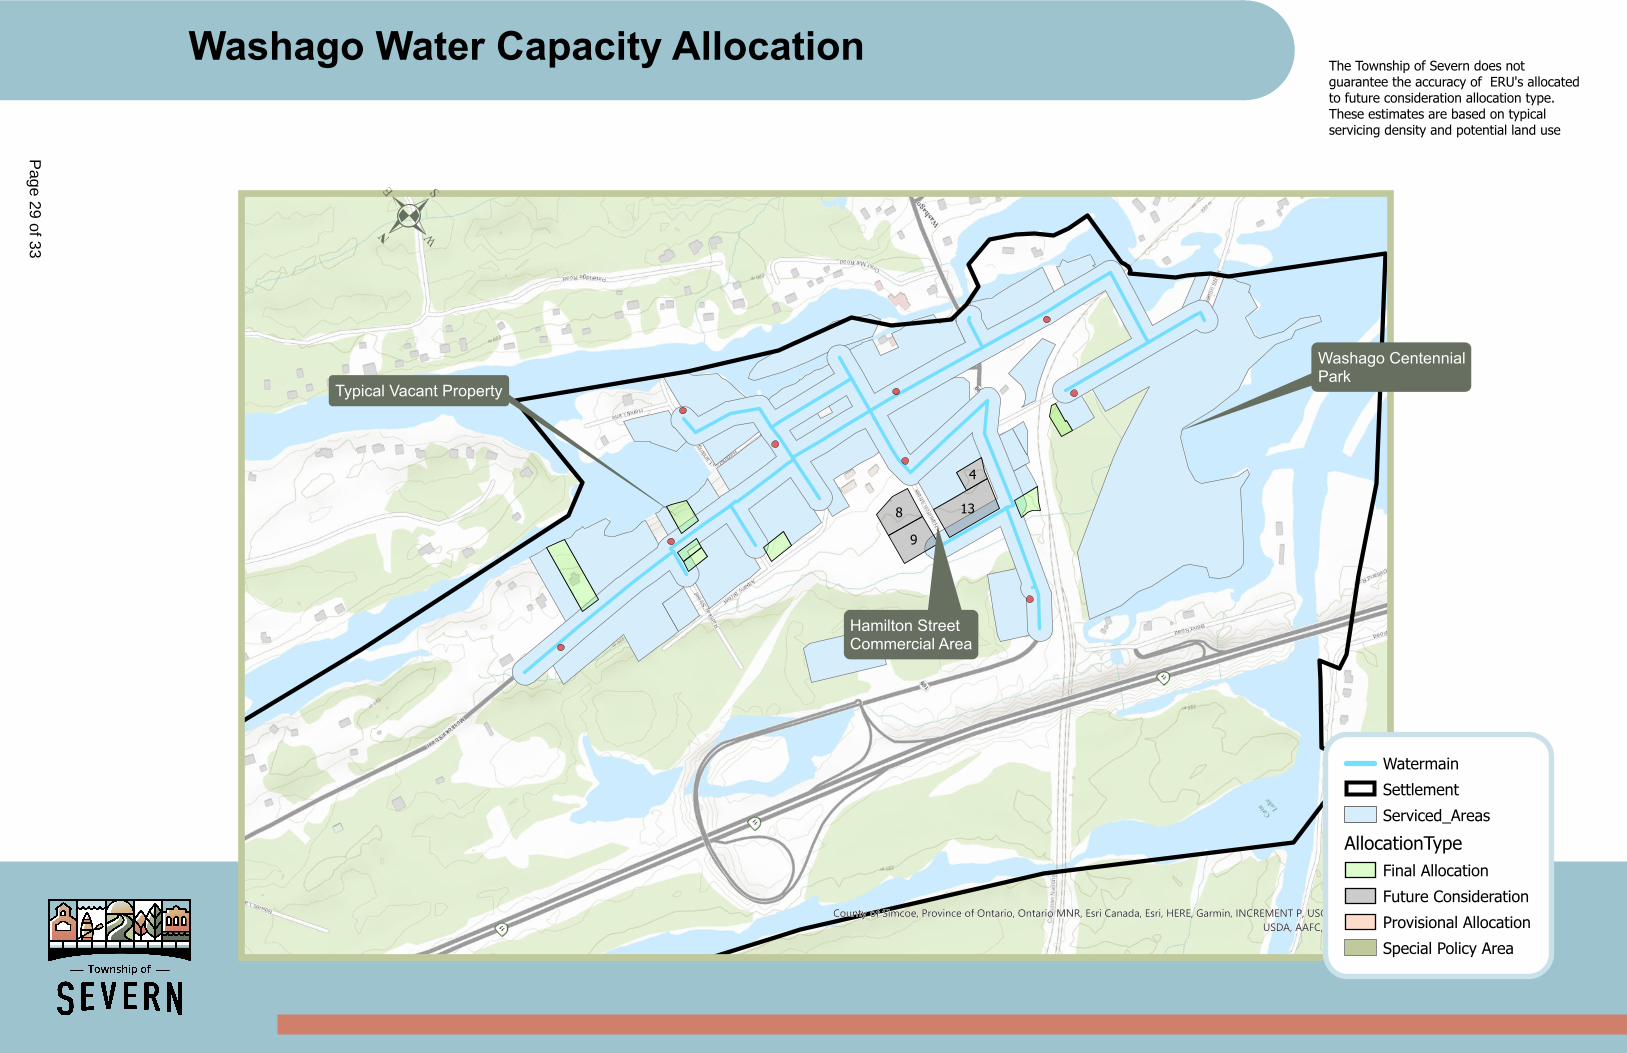
Washago
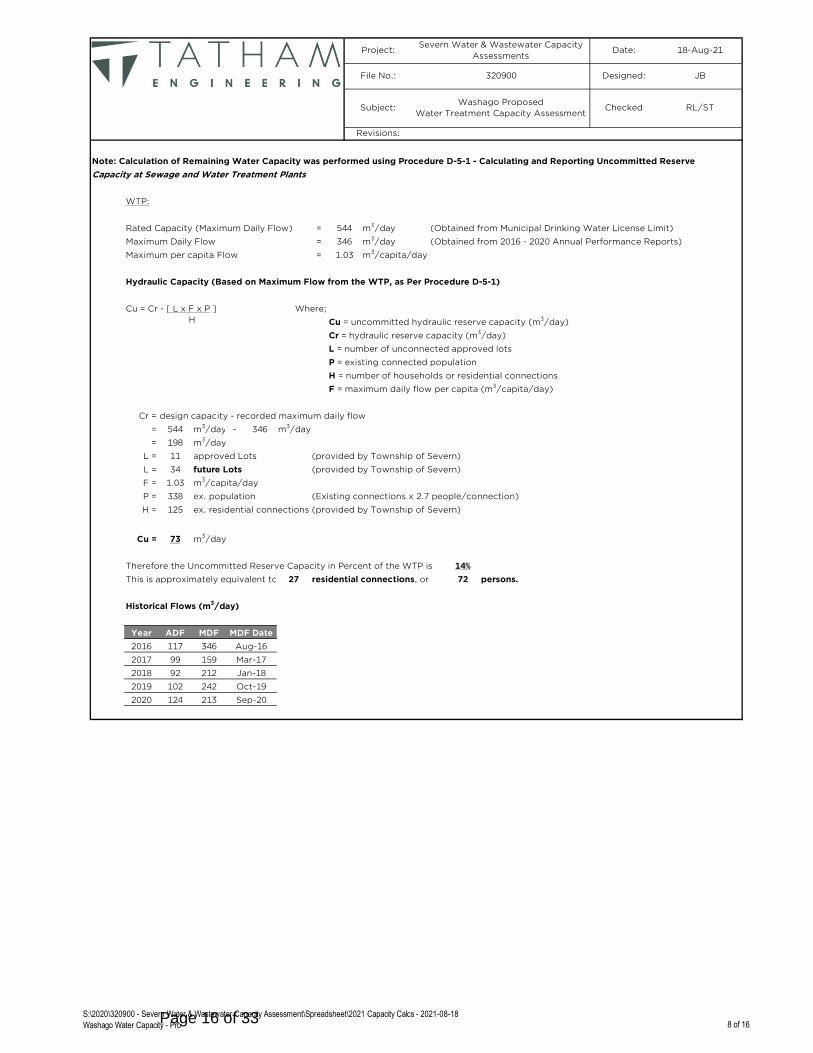
The 2020 report suggests that Washago is currently operating at 71% of rated wastewater capacity (5-year trend) and approximately 64% of rated drinking water capacity (maximum daily flow). With all current approved lots including registered plans of subdivisions, infill lot potentials and draft plan approvals, the system has approximately 10% uncommitted wastewater capacity and approximately 31% of uncommitted drinking water capacity.
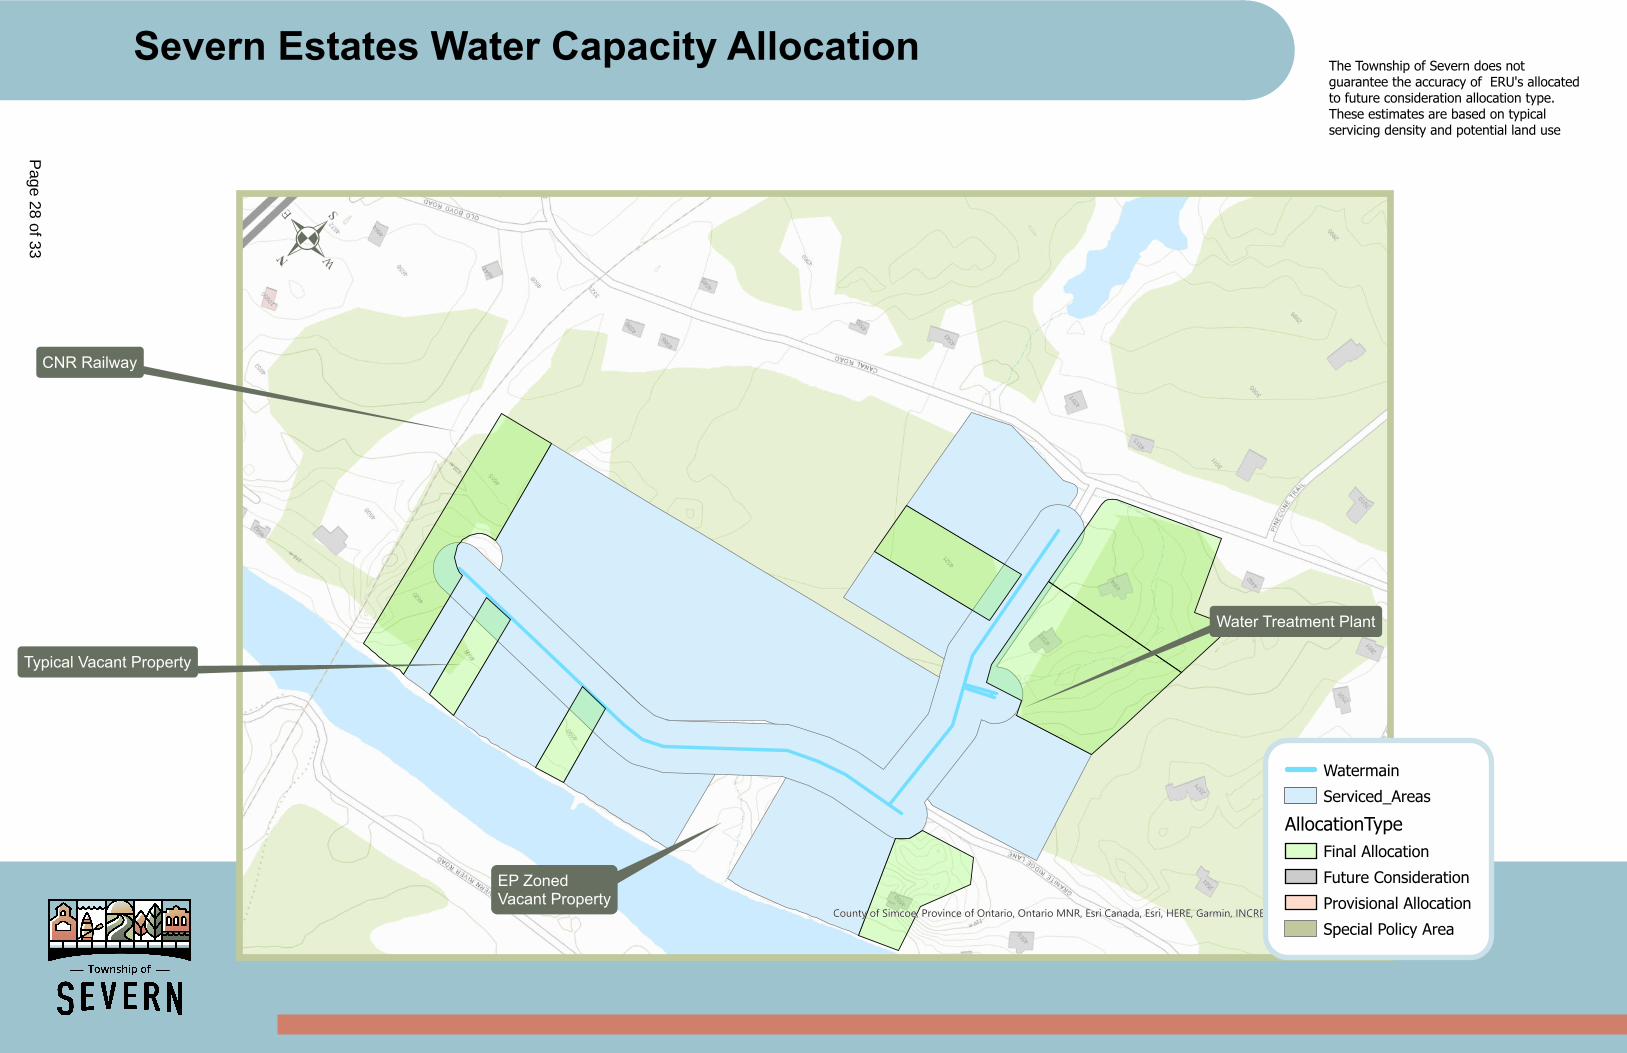
Bass Lake, Severn Estates, Sandcastle
The 2020 report suggests that Bass Lake is currently operating at 49% of rated drinking water capacity (maximum daily flow), Severn Estates is currently operating at 28% of rated drinking water capacity (maximum daily flow), and Sandcastle Estates is currently operating at 23% of rated drinking water capacity (maximum daily flow). These three (3) serviced areas are not part of the focused growth in Severn and do not have any registered plans of subdivision that affect future capacity of these systems.
In future Uncommitted Capacity Reports, staff will provide a detailed summary of the individual conveyance system capacities for each wastewater collection system. It is important to ensure that treatment capacity is available for future growth as well as having the capacity to handle sewage flows from the proposed development location to the wastewater treatment plant location.
Financial Considerations
The cost of the consulting engineer assistance with the calculations and preparation of the 2020 Uncommitted Capacity Report was $10,000 plus HST. This work is adequately funded by the approved operating budget for consulting services throughout the six (6) water systems and three (3) wastewater systems.
Report Supported By Strategic Plan: ☐ Fiscal Responsibility ☑ Communications ☐ Service Excellence
☑ Maintain and Enhance Infrastructure ☑ Community Development ☐ Does Not Impact Strategic Plan
Relevant Background Report • W19-028 Allocation of Servicing Policy
Attachments
W21-032 - Uncommitted Capacity Report W21-032 - Appendix 2
Page 2 of 33
Reviewed By Status: Andrew Plunkett, Director of Finance/Treasurer
Approved - 16 Aug 2021
Laurie Kennard, Chief Administrative Officer
Approved - 16 Aug 2021
Page 3 of 33
File 320900
August 18, 2021
Derek Burke Director of Public Works Township of Severn 1024 Hurlwood Lane PO Box 159 Orillia, Ontario L3V 6J3 [email protected] Re: Water & Wastewater Capacity Assessments, Township of Severn 2020 Assessment Update Dear Derek:
Further to our telephone discussion on August 6, 2021, we are pleased to present the following summary
of our assessment of the reserve capacity in the Township’s water and wastewater systems, based on 2020
flow and population/growth data.
The reserve capacity assessments have been completed in accordance with the Ministry of the
Environment, Conservation and Parks’ (MECP) Procedure D-5-1 “Calculating and Reporting Uncommitted
Reserve Capacity at Sewage and Water Treatment Plants,” March 1995 (Procedure).
The assessments are based on the following information:
▪ The rated capacity, as an average daily flow (ADF), and the peak flow rate (PF) of each sewage
treatment system, as stated in the Certificates of Approval (C of A) or Environmental Compliance
Approvals (ECA).
▪ The rated capacity, as a maximum daily flow (MDF), of each drinking water system, as stated in the
Municipal Drinking Water Licences (MDWL).
▪ A summary of actual monthly flows for each system that were obtained from the Township’s annual
performance reports for 2016 to 2020 (five years).
▪ The existing population, number of service connections, number of unconnected but approved lots,
and number of future lots, as provided by the Township.
Page 4 of 33

We note the Procedure calculates reserve capacity for sewage treatment plants based on ADF, which we
did for each system. However, for the Washago Lagoon system, it is more appropriate to consider the
reserve capacity based on the maximum discharge volume, rather than the average volume, because a
lagoon does not have the same flow through characteristic as a continuous discharge treatment system
such as the Coldwater and Westshore facilities. The Washago Lagoon system must be capable of retaining
the maximum volume of sewage and precipitation received until it can be batch treated and discharged
on a seasonal basis.
A summary of the capacity assessments is presented in Tables 1 and 2, overleaf. The detailed calculations
are attached. A brief synopsis of the reserve capacity for each system is as follows:
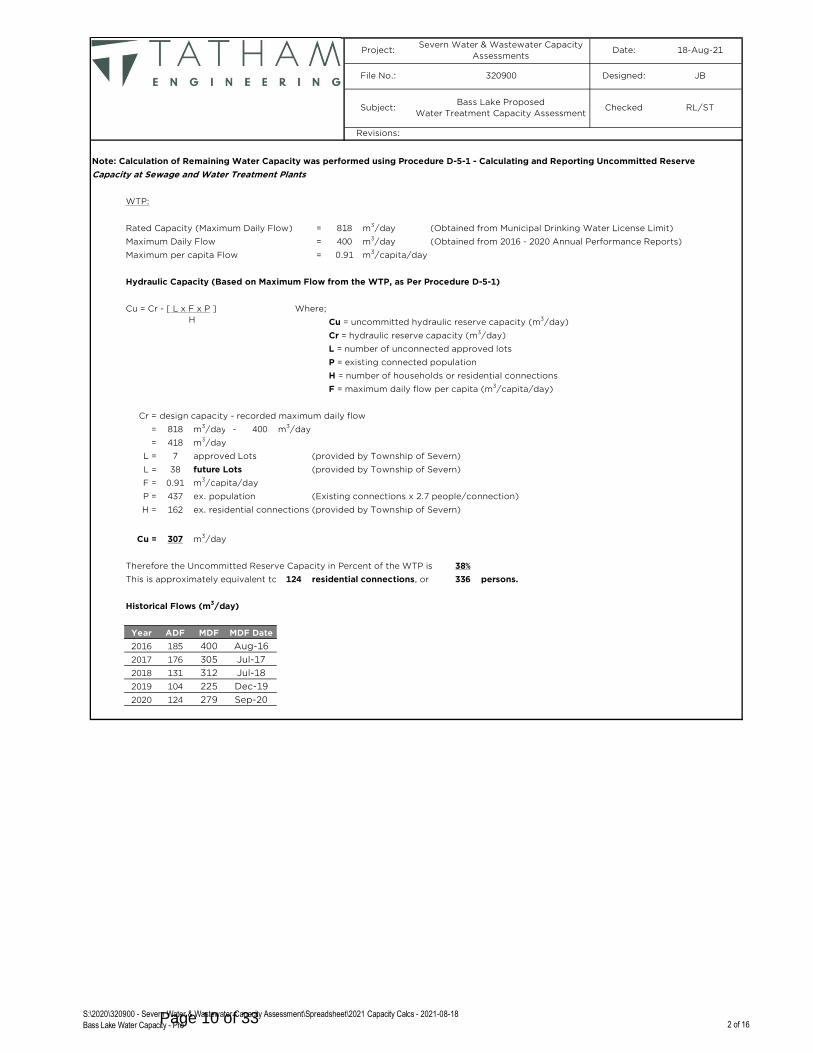
The existing water treatment system in Bass Lake has capacity to serve the currently approved 7 units
plus the forecasted growth of 38 units. The system has a remaining reserve capacity of 38%, equivalent to
124 residential units.
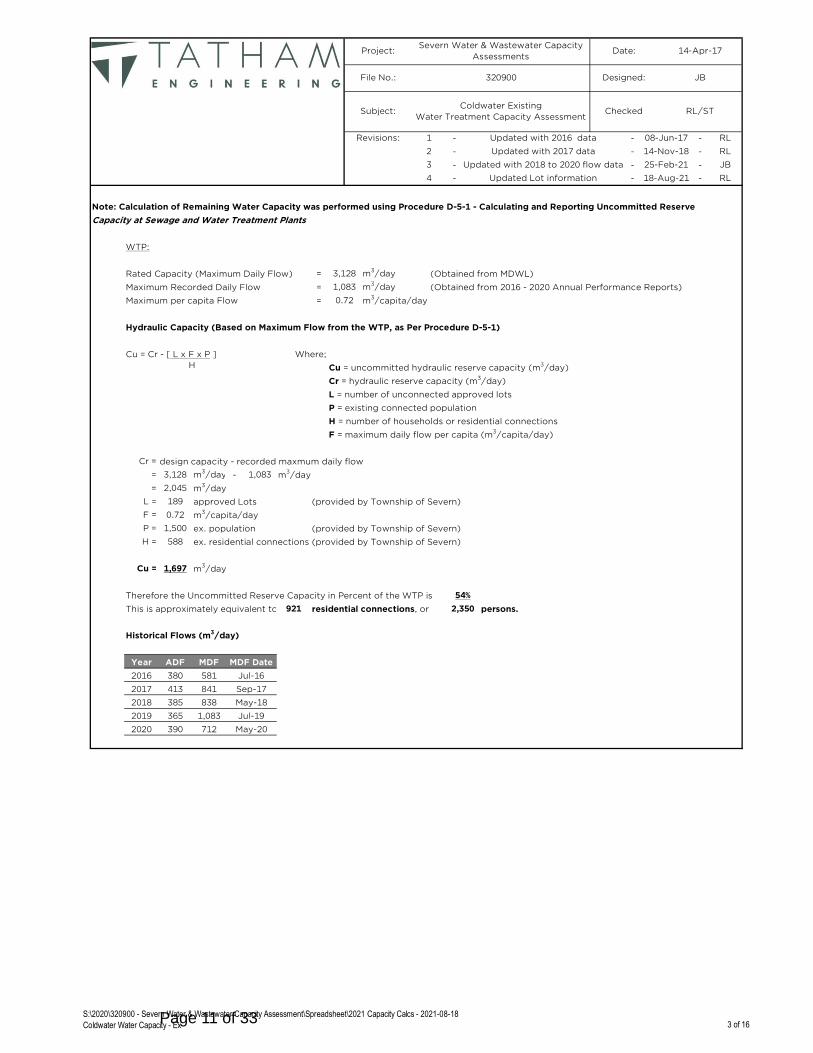
The existing water treatment system in Coldwater has capacity to serve the currently approved 189 units
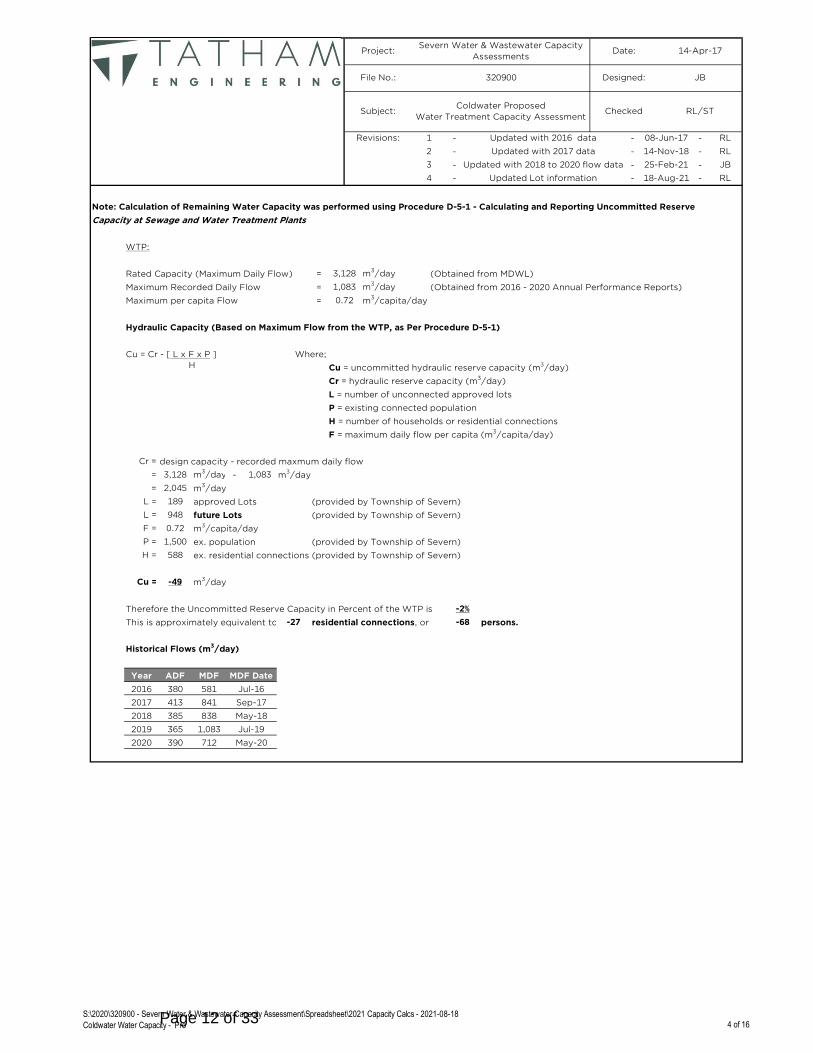
plus an additional 921 units (total of 1,110 units). This is 27 units short of the forecasted growth of 948
units. Therefore, the water treatment system will need to be expanded to accommodate the full 948 units.
The existing water treatment system in Sandcastle has a reserve capacity of 77%, equivalent to 219
residential units.
The existing water treatment system in Severn Estates has capacity to serve the currently approved 7
units. It has a remaining reserve capacity of 63%, equivalent to 51 residential units.
The existing water treatment system in Washago has capacity to serve the currently approved 11 units
plus the forecasted growth of 34 units. The system has a remaining reserve capacity of 14%, equivalent to
27 residential units.
The existing water treatment system in Westshore has capacity to serve the currently approved 373 units
plus the forecasted growth of 991 units. The system has a remaining reserve capacity of 11%, equivalent
to 283 units.
Page 5 of 33

Rated MDF (m3/day)
818 3,128 389 109 544 2,780
Actual MDF (m3/day)
400 1,083 90 31 346 1,035
MDF
Uncommitted Reserve Capacity
49% 38% 54% -2% 77% 63% 31% 14% 49% 11%
Equivalent Units
162 124 921 -27 219 51 61 27 1,274 283
Page 6 of 33
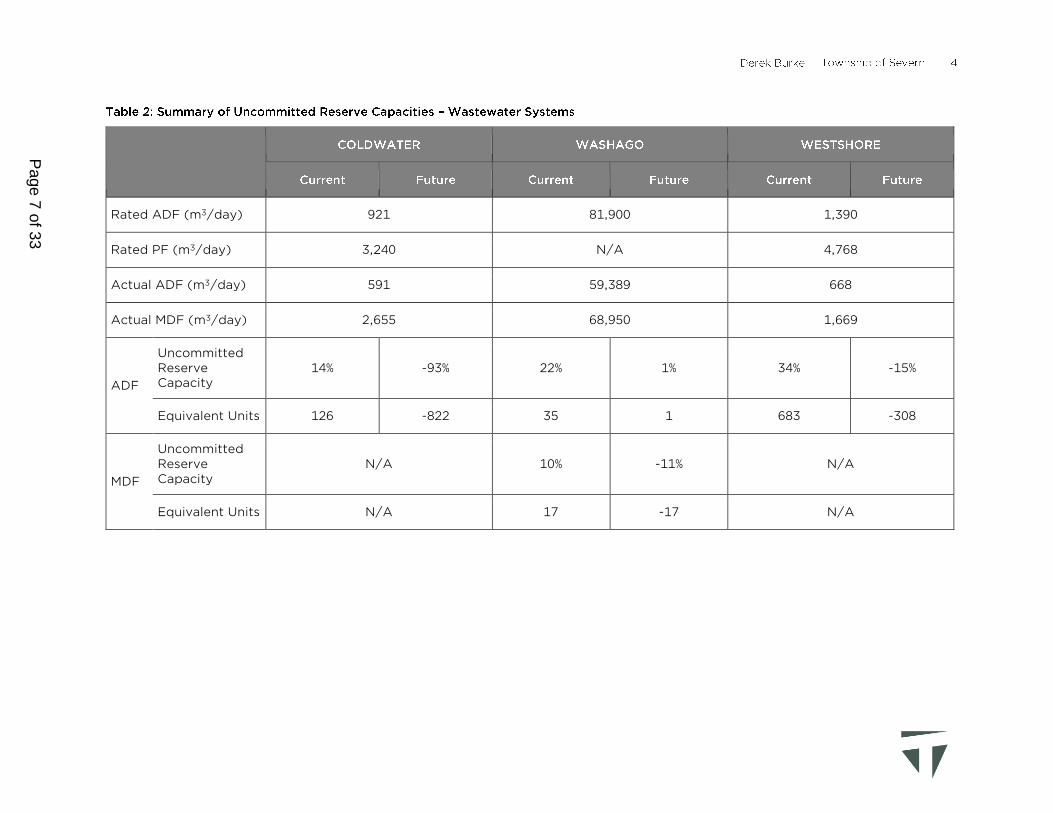
Rated ADF (m3/day) 921 81,900 1,390
Rated PF (m3/day) 3,240 N/A 4,768
Actual ADF (m3/day) 591 59,389 668
Actual MDF (m3/day) 2,655 68,950 1,669
ADF
Uncommitted Reserve Capacity
14% -93% 22% 1% 34% -15%
Equivalent Units 126 -822 35 1 683 -308
MDF
Uncommitted Reserve Capacity
N/A 10% -11% N/A
Equivalent Units N/A 17 -17 N/A
Page 7 of 33
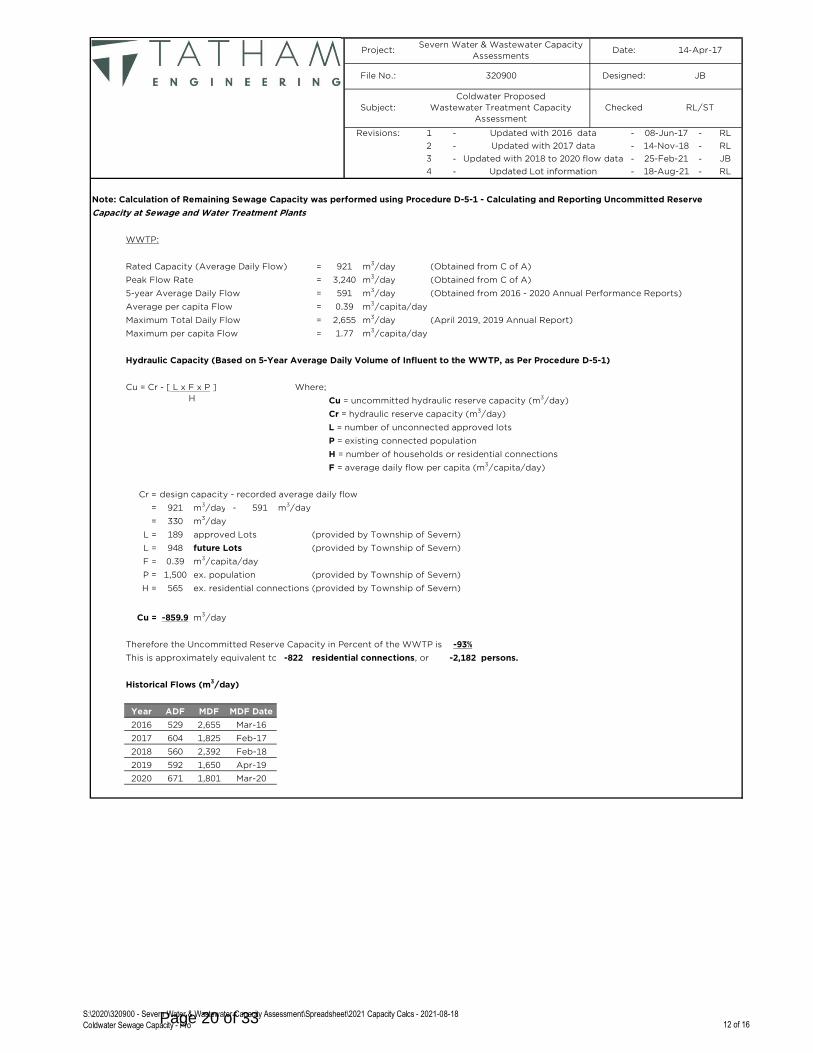
The existing wastewater treatment system in Coldwater has capacity to serve the currently approved 189
units plus an additional 126 units (total of 315 units). This is 822 units short of the forecasted growth of
948 units. Therefore, the wastewater treatment system will need to be expanded to accommodate the
full 948 units.
The existing wastewater treatment system in Washago has capacity to serve the currently approved 11
units plus an additional 17 units (total of 28 units). This is 17 units short of the forecasted growth of 34
units. Therefore, the wastewater treatment system will need to be expanded to accommodate the full 34
units.
The existing wastewater treatment system in Westshore has capacity to serve the currently approved 373
units plus an additional 683 units (total of 1,056 units). This is 308 units short of the forecasted growth of
991 units. Therefore, the wastewater treatment system will need to be expanded to accommodate the
full 991 units.
Although not mandated by the MECP, it is good engineering practice to initiate treatment facility
expansions when the current capacity reaches approximately 85% (15% reserve capacity). Therefore, it is
recommended the Township forecast when the anticipated growth in Coldwater, Washago and Westshore
may occur in order to start planning the water and wastewater treatment facilities expansion designs and
construction at the appropriate time. Tatham is currently completing the Municipal Class Environmental
Assessment for the expansion of the Coldwater wastewater treatment system.
We trust the above is satisfactory. Please feel free to contact us should you have any questions or require
additional information.
Yours truly,
Rod Langford, C.E.T., LET Suzanne Troxler, B.Sc., M.Eng., P.Eng.
Senior Technologist, Project Manager Manager of Water & Wastewater Engineering
RL:rl
Attachments copy: Tony Drouin Township of Severn [email protected] S:\2020\320900 - Severn Water & Wastewater Capacity Assessment\Documents\Correspondence\Assessment Summary\L - DBurke - Capacity Assessment Summary - 2021-08-18.docx
Page 8 of 33

- - -
Note: Calculation of Remaining Water Capacity was performed using Procedure D-5-1 - Calculating and Reporting Uncommitted Reserve
Capacity at Sewage and Water Treatment Plants
WTP:
Rated Capacity (Maximum Daily Flow) = (Obtained from Municipal Drinking Water License Limit)
Maximum Daily Flow = (Obtained from 2016 - 2020 Annual Performance Reports)
Maximum per capita Flow = m3/capita/day
Hydraulic Capacity (Based on Maximum Flow from the WTP, as Per Procedure D-5-1)
Cu = Cr - [ L x F x P ] Where;
Cu = uncommitted hydraulic reserve capacity (m3/day)
Cr = hydraulic reserve capacity (m3/day)
L = number of unconnected approved lots
P = existing connected population
H = number of households or residential connections
F = maximum daily flow per capita (m3/capita/day)
design capacity - recorded maximum daily flow
= - m3/day
= m3/day
approved Lots (provided by Township of Severn)
m3/capita/day
ex. population (Existing connections x 2.7 people/connection)
ex. residential connections (provided by Township of Severn)
m3/day
Therefore the Uncommitted Reserve Capacity in Percent of the WTP is
This is approximately equivalent to residential connections, or persons.
Historical Flows (m3/day)
2020 124 279 Sep-20
Jul-17
2018 131 312 Jul-18
2019 104 225 Dec-19
Cu = 401
49%
162 438
Year ADF MDF MDF Date
2016 185 400 Aug-16
2017 176 305
F = 0.91
P = 437
H = 162
Cr =
818 m3/day
Revisions: 1 Updated Lot information 18-Aug-21 RL
400
418
L = 7
818 m3/day
400 m3/day
0.91
H
Project:Severn Water & Wastewater Capacity
AssessmentsDate: 29-Jan-21
File No.: 320900 Designed: JB
Subject:Bass Lake Existing
Water Treatment Capacity AssessmentChecked RL/ST
S:\2020\320900 - Severn Water & Wastewater Capacity Assessment\Spreadsheet\2021 Capacity Calcs - 2021-08-18
Bass Lake Water Capacity - Ex 1 of 16Page 9 of 33
Note: Calculation of Remaining Water Capacity was performed using Procedure D-5-1 - Calculating and Reporting Uncommitted Reserve
Capacity at Sewage and Water Treatment Plants
WTP:
Rated Capacity (Maximum Daily Flow) = (Obtained from Municipal Drinking Water License Limit)
Maximum Daily Flow = (Obtained from 2016 - 2020 Annual Performance Reports)
Maximum per capita Flow = m3/capita/day
Hydraulic Capacity (Based on Maximum Flow from the WTP, as Per Procedure D-5-1)
Cu = Cr - [ L x F x P ] Where;
Cu = uncommitted hydraulic reserve capacity (m3/day)
Cr = hydraulic reserve capacity (m3/day)
L = number of unconnected approved lots
P = existing connected population
H = number of households or residential connections
F = maximum daily flow per capita (m3/capita/day)
design capacity - recorded maximum daily flow
= - m3/day
= m3/day
approved Lots (provided by Township of Severn)
future Lots (provided by Township of Severn)
m3/capita/day
ex. population (Existing connections x 2.7 people/connection)
ex. residential connections (provided by Township of Severn)
m3/day
Therefore the Uncommitted Reserve Capacity in Percent of the WTP is
This is approximately equivalent to residential connections, or persons.
Historical Flows (m3/day)
Project:Severn Water & Wastewater Capacity
AssessmentsDate: 18-Aug-21
File No.: 320900 Designed: JB
Subject:Bass Lake Proposed
Water Treatment Capacity AssessmentChecked RL/ST
Revisions:
400
418
L = 7
818 m3/day
400 m3/day
0.91
H
F = 0.91
P = 437
H = 162
Cr =
818 m3/day
Cu = 307
38%
124 336
Year ADF MDF MDF Date
2018 131 312 Jul-18
2019 104 225 Dec-19
2016 185 400 Aug-16
2017 176 305 Jul-17
2020 124 279 Sep-20
L = 38
S:\2020\320900 - Severn Water & Wastewater Capacity Assessment\Spreadsheet\2021 Capacity Calcs - 2021-08-18
Bass Lake Water Capacity - Pro 2 of 16Page 10 of 33
- - -
- - -
- - -
- - -
Note: Calculation of Remaining Water Capacity was performed using Procedure D-5-1 - Calculating and Reporting Uncommitted Reserve
Capacity at Sewage and Water Treatment Plants
WTP:
Rated Capacity (Maximum Daily Flow) = (Obtained from MDWL)
Maximum Recorded Daily Flow = (Obtained from 2016 - 2020 Annual Performance Reports)
Maximum per capita Flow = m3/capita/day
Hydraulic Capacity (Based on Maximum Flow from the WTP, as Per Procedure D-5-1)
Cu = Cr - [ L x F x P ] Where;
Cu = uncommitted hydraulic reserve capacity (m3/day)
Cr = hydraulic reserve capacity (m3/day)
L = number of unconnected approved lots
P = existing connected population
H = number of households or residential connections
F = maximum daily flow per capita (m3/capita/day)
design capacity - recorded maxmum daily flow
= - m3/day
= m3/day
approved Lots (provided by Township of Severn)
m3/capita/day
ex. population (provided by Township of Severn)
ex. residential connections (provided by Township of Severn)
m3/day
Therefore the Uncommitted Reserve Capacity in Percent of the WTP is
This is approximately equivalent to residential connections, or persons.
Historical Flows (m3/day)
54%
Year ADF MDF MDF Date
2016 380 581 Jul-16
2017 413
2020 390 712 May-20
841
RL
385 838 May-18
2019 365 1,083 Jul-19
1,083
1,083
P = 1,500
JB
Project:Severn Water & Wastewater Capacity
AssessmentsDate: 14-Apr-17
File No.: 320900 Designed: JB
Coldwater Existing
Water Treatment Capacity AssessmentChecked RL/ST
1 Updated with 2016 data 08-Jun-17 RL
2 RL
3,128 m3/day
Revisions:
H
Cr =
3,128 m3/day
2,045
m3/day
0.72
F = 0.72
Updated with 2017 data 14-Nov-18
3 Updated with 2018 to 2020 flow data 25-Feb-21
Sep-17
2018
H = 588
Cu = 1,697
921 2,350
4 Updated Lot information 18-Aug-21
Subject:
L = 189
S:\2020\320900 - Severn Water & Wastewater Capacity Assessment\Spreadsheet\2021 Capacity Calcs - 2021-08-18
Coldwater Water Capacity - Ex 3 of 16Page 11 of 33
- - -
- - -
- - -
- - -
Note: Calculation of Remaining Water Capacity was performed using Procedure D-5-1 - Calculating and Reporting Uncommitted Reserve
Capacity at Sewage and Water Treatment Plants
WTP:
Rated Capacity (Maximum Daily Flow) = (Obtained from MDWL)
Maximum Recorded Daily Flow = (Obtained from 2016 - 2020 Annual Performance Reports)
Maximum per capita Flow = m3/capita/day
Hydraulic Capacity (Based on Maximum Flow from the WTP, as Per Procedure D-5-1)
Cu = Cr - [ L x F x P ] Where;
Cu = uncommitted hydraulic reserve capacity (m3/day)
Cr = hydraulic reserve capacity (m3/day)
L = number of unconnected approved lots
P = existing connected population
H = number of households or residential connections
F = maximum daily flow per capita (m3/capita/day)
design capacity - recorded maxmum daily flow
= - m3/day
= m3/day
approved Lots (provided by Township of Severn)
future Lots (provided by Township of Severn)
m3/capita/day
ex. population (provided by Township of Severn)
ex. residential connections (provided by Township of Severn)
m3/day
Therefore the Uncommitted Reserve Capacity in Percent of the WTP is
This is approximately equivalent to residential connections, or persons.
Historical Flows (m3/day)
4 Updated Lot information 18-Aug-21 RL
2020 390 712 May-20
2017 413 841 Sep-17
2018 385 838 May-18
2019 365 1,083 Jul-19
-68
2,045
L = 189
Updated with 2016 data 08-Jun-17 RL
Year ADF MDF MDF Date
2016 380 581 Jul-16
1,083 m3/day
0.72
H
JB
3,128 m3/day
3 Updated with 2018 to 2020 flow data 25-Feb-21
Revisions: 1
Cr =
14-Apr-17
File No.: 320900 Designed: JB
Project:Severn Water & Wastewater Capacity
AssessmentsDate:
RL/STSubject:Coldwater Proposed
Water Treatment Capacity AssessmentChecked
F = 0.72
P = 1,500
L = 948
H = 588
Cu = -49
m3/day 1,083
-27
2 Updated with 2017 data 14-Nov-18 RL
-2%
3,128
S:\2020\320900 - Severn Water & Wastewater Capacity Assessment\Spreadsheet\2021 Capacity Calcs - 2021-08-18
Coldwater Water Capacity - Pro 4 of 16Page 12 of 33
Note: Calculation of Remaining Water Capacity was performed using Procedure D-5-1 - Calculating and Reporting Uncommitted Reserve
Capacity at Sewage and Water Treatment Plants
WTP:
Rated Capacity (Maximum Daily Flow) = (Obtained from Municipal Drinking Water License Limit)
Maximum Daily Flow = (Obtained from 2016 - 2020 Annual Performance Reports)
Maximum per capita Flow = m3/capita/day
Hydraulic Capacity (Based on Maximum Flow from the WTP, as Per Procedure D-5-1)
Cu = Cr - [ L x F x P ] Where;
Cu = uncommitted hydraulic reserve capacity (m3/day)
Cr = hydraulic reserve capacity (m3/day)
L = number of unconnected approved lots
P = existing connected population
H = number of households or residential connections
F = maximum daily flow per capita (m3/capita/day)
design capacity - recorded maximum daily flow
= - m3/day
= m3/day
approved Lots (provided by Township of Severn)
m3/capita/day
ex. population (Existing connections x 2.7 people/connection)
ex. residential connections (provided by Township of Severn)
m3/day
Therefore the Uncommitted Reserve Capacity in Percent of the WTP is
This is approximately equivalent to residential connections, or persons.
Historical Flows (m3/day)
2018
592
Dec-19
Sep-21
Jul-18
Year ADF MDF MDF Date
2016 28 90 Jun-16
2017 32 57 Jul-17
2019 30 64
Cu = 299
2020 34 68
29 77
F = 0.51
P = 178
H = 66
77%
219
90
299
L = 0
389 m3/day
90 m3/day
0.51
H
m3/day
Revisions:
Cr =
389
Project:Severn Water & Wastewater Capacity
AssessmentsDate: 29-Jan-21
File No.: 320900 Designed: JB
Subject:Sandcastle Existing
Water Treatment Capacity AssessmentChecked RL/ST
S:\2020\320900 - Severn Water & Wastewater Capacity Assessment\Spreadsheet\2021 Capacity Calcs - 2021-08-18
Sandcastle Water Capacity - Ex 5 of 16Page 13 of 33

- - -
Note: Calculation of Remaining Water Capacity was performed using Procedure D-5-1 - Calculating and Reporting Uncommitted Reserve
Capacity at Sewage and Water Treatment Plants
WTP:
Rated Capacity (Maximum Daily Flow) = (Obtained from Municipal Drinking Water License Limit)
Maximum Daily Flow = (Obtained from 2016 - 2020 Annual Performance Reports)
Maximum per capita Flow = m3/capita/day
Hydraulic Capacity (Based on Maximum Flow from the WTP, as Per Procedure D-5-1)
Cu = Cr - [ L x F x P ] Where;
Cu = uncommitted hydraulic reserve capacity (m3/day)
Cr = hydraulic reserve capacity (m3/day)
L = number of unconnected approved lots
P = existing connected population
H = number of households or residential connections
F = maximum daily flow per capita (m3/capita/day)
design capacity - recorded maximum daily flow
= - m3/day
= m3/day
approved Lots (provided by Township of Severn)
m3/capita/day
ex. population (Existing connections x 2.7 people/connection)
ex. residential connections (provided by Township of Severn)
m3/day
Therefore the Uncommitted Reserve Capacity in Percent of the WTP is
This is approximately equivalent to residential connections, or persons.
Historical Flows (m3/day)
2020 9 15 20-May
2018 9 18 Jun-18
2019 9 25 Feb-19
2017 10 31 May-17
21 Aug-16
MDF DateMDFADFYear
2016 11
Cu = 69
63%
51 137
F = 0.50
P = 62
H = 23
m3/day
31 m3/day
0.50
H
31
78
L = 7
109
Cr =
109 m3/day
Subject:Severn Estates Existing
Water Treatment Capacity AssessmentChecked RL/ST
Revisions: 1 Updated Lot information 18-Aug-21 RL
Project:Severn Water & Wastewater Capacity
AssessmentsDate: 29-Jan-21
File No.: 320900 Designed: JB
S:\2020\320900 - Severn Water & Wastewater Capacity Assessment\Spreadsheet\2021 Capacity Calcs - 2021-08-18
Severn Est Water Capacity - Ex 6 of 16Page 14 of 33

- - -
- - -
- - -
- - -
Note: Calculation of Remaining Water Capacity was performed using Procedure D-5-1 - Calculating and Reporting Uncommitted Reserve
Capacity at Sewage and Water Treatment Plants
WTP:
Rated Capacity (Maximum Daily Flow) = (Obtained from Municipal Drinking Water License Limit)
Maximum Daily Flow = (Obtained from 2016 - 2020 Annual Performance Reports)
Maximum per capita Flow = m3/capita/day
Hydraulic Capacity (Based on Maximum Flow from the WTP, as Per Procedure D-5-1)
Cu = Cr - [ L x F x P ] Where;
Cu = uncommitted hydraulic reserve capacity (m3/day)
Cr = hydraulic reserve capacity (m3/day)
L = number of unconnected approved lots
P = existing connected population
H = number of households or residential connections
F = maximum daily flow per capita (m3/capita/day)
design capacity - recorded maximum daily flow
= - m3/day
= m3/day
approved Lots (provided by Township of Severn)
m3/capita/day
ex. population (Existing connections x 2.7 people/connection)
ex. residential connections (provided by Township of Severn)
m3/day
Therefore the Uncommitted Reserve Capacity in Percent of the WTP is
This is approximately equivalent to residential connections, or persons.
Historical Flows (m3/day)
163
2018 92 212 Jan-18
2019 102 242 Oct-19
ADF MDF MDF Date
2016 117 346 Aug-16
2017 99 159 Mar-17
2020 124 213 Sep-20
Washago Existing
Water Treatment Capacity AssessmentChecked RL/ST
Project:Severn Water & Wastewater Capacity
AssessmentsDate: 14-Apr-17
File No.: 320900 Designed: JB
544 m3/day
3 Updated with 2018 to 2020 flow data 25-Feb-21 JB
Subject:
P = 338
346
Year
m3/day
1.03
H
Cr =
544 m3/day 346
198
L = 11
F = 1.03
H = 125
Cu = 168
61
31%
4 Updated Lot information 18-Aug-21 RL
Revisions: 1 Updated with 2016 data 08-Jun-17 RL
2 Updated with 2017 data 14-Nov-18 RL
S:\2020\320900 - Severn Water & Wastewater Capacity Assessment\Spreadsheet\2021 Capacity Calcs - 2021-08-18
Washago Water Capacity - Ex 7 of 16Page 15 of 33
Note: Calculation of Remaining Water Capacity was performed using Procedure D-5-1 - Calculating and Reporting Uncommitted Reserve
Capacity at Sewage and Water Treatment Plants
WTP:
Rated Capacity (Maximum Daily Flow) = (Obtained from Municipal Drinking Water License Limit)
Maximum Daily Flow = (Obtained from 2016 - 2020 Annual Performance Reports)
Maximum per capita Flow = m3/capita/day
Hydraulic Capacity (Based on Maximum Flow from the WTP, as Per Procedure D-5-1)
Cu = Cr - [ L x F x P ] Where;
Cu = uncommitted hydraulic reserve capacity (m3/day)
Cr = hydraulic reserve capacity (m3/day)
L = number of unconnected approved lots
P = existing connected population
H = number of households or residential connections
F = maximum daily flow per capita (m3/capita/day)
design capacity - recorded maximum daily flow
= - m3/day
= m3/day
approved Lots (provided by Township of Severn)
future Lots (provided by Township of Severn)
m3/capita/day
ex. population (Existing connections x 2.7 people/connection)
ex. residential connections (provided by Township of Severn)
m3/day
Therefore the Uncommitted Reserve Capacity in Percent of the WTP is
This is approximately equivalent to residential connections, or persons.
Historical Flows (m3/day)
Project:Severn Water & Wastewater Capacity
AssessmentsDate: 18-Aug-21
File No.: 320900 Designed: JB
Subject:Washago Proposed
Water Treatment Capacity AssessmentChecked RL/ST
Revisions:
Cr =
544 m3/day 346
198
L = 11
544 m3/day
346 m3/day
1.03
H
14%
27 72
Year ADF MDF MDF Date
F = 1.03
P = 338
H = 125
2016 117 346 Aug-16
2017 99 159 Mar-17
Cu = 73
2020 124 213 Sep-20
2018 92 212 Jan-18
2019 102 242 Oct-19
L = 34
S:\2020\320900 - Severn Water & Wastewater Capacity Assessment\Spreadsheet\2021 Capacity Calcs - 2021-08-18
Washago Water Capacity - Pro 8 of 16Page 16 of 33
- - -
- - -
- - -
- - -
Note: Calculation of Remaining Water Capacity was performed using Procedure D-5-1 - Calculating and Reporting Uncommitted Reserve
Capacity at Sewage and Water Treatment Plants
WTP:
Rated Capacity (Maximum Daily Flow) = (Obtained from Municipal Drinking Water License Limit)
Maximum Daily Flow = (Obtained from 2016 - 2020 Annual Performance Reports)
Maximum per capita Flow = m3/capita/day
Hydraulic Capacity (Based on Maximum Flow from the WTP, as Per Procedure D-5-1)
Cu = Cr - [ L x F x P ] Where;
Cu = uncommitted hydraulic reserve capacity (m3/day)
Cr = hydraulic reserve capacity (m3/day)
L = number of unconnected approved lots
P = existing connected population
H = number of households or residential connections
F = maximum daily flow per capita (m3/capita/day)
design capacity - recorded maximum daily flow
= - m3/day
= m3/day
approved Lots (provided by Township of Severn)
m3/capita/day
ex. population (Existing connections x 2.7 people/connection)
ex. residential connections (provided by Township of Severn)
m3/day
Therefore the Uncommitted Reserve Capacity in Percent of the WTP is
This is approximately equivalent to residential connections, or persons.
Historical Flows (m3/day)
Dec-19
2020 668 1,035 Jul-20
2016 524 858 Aug-16
2017 412 841 Sep-17
2018 652 Jul-18
1,274
Project:Severn Water & Wastewater Capacity
Assessments
1,745
L = 373
F = 0.39
P = 2,638
0.39
H
Cr =
2,780 m3/day 1,035
2 Updated with 2017 data
Date:
MDF Date
Checked
Revisions: 1 Updated with 2016 data 08-Jun-17 RL
14-Nov-18 RL
49%
4 Updated Lot information 18-Aug-21 RL
14-Apr-17
File No.: 320900 Designed: JB
1,035 m3/day
RL/ST
2,780 m3/day
3 Updated with 2018 to 2020 flow data 25-Feb-21 JB
Subject:Westshore Existing
Water Treatment Capacity Assessment
1,015
Year ADF MDF
3,440
H = 977
Cu = 1,350
2019 647 881
S:\2020\320900 - Severn Water & Wastewater Capacity Assessment\Spreadsheet\2021 Capacity Calcs - 2021-08-18
Westshore Water Capacity - Ex 9 of 16Page 17 of 33

- - -
- - -
- - -
- - -
Note: Calculation of Remaining Water Capacity was performed using Procedure D-5-1 - Calculating and Reporting Uncommitted Reserve
Capacity at Sewage and Water Treatment Plants
WTP:
Rated Capacity (Maximum Daily Flow) = (Obtained from Municipal Drinking Water License Limit)
Maximum Daily Flow = (Obtained from 2016 - 2020 Annual Performance Reports)
Maximum per capita Flow = m3/capita/day
Hydraulic Capacity (Based on Maximum Flow from the WTP, as Per Procedure D-5-1)
Cu = Cr - [ L x F x P ] Where;
Cu = uncommitted hydraulic reserve capacity (m3/day)
Cr = hydraulic reserve capacity (m3/day)
L = number of unconnected approved lots
P = existing connected population
H = number of households or residential connections
F = maximum daily flow per capita (m3/capita/day)
design capacity - recorded maximum daily flow
= - m3/day
= m3/day
approved Lots (provided by Township of Severn)
future Lots (provided by Township of Severn)
m3/capita/day
ex. population (Existing connections x 2.7 people/connection)
ex. residential connections (provided by Township of Severn)
m3/day
Therefore the Uncommitted Reserve Capacity in Percent of the WTP is
This is approximately equivalent to residential connections, or persons.
Historical Flows (m3/day)
4 Updated Lot information 18-Aug-21 RL
3 Updated with 2018 to 2020 flow data 25-Feb-21
Westshore Proposed
Water Treatment Capacity AssessmentChecked RL/ST
Project:Severn Water & Wastewater Capacity
AssessmentsDate: 14-Apr-17
File No.: 320900 Designed: JB
JB
Subject:
Revisions: 1 Updated with 2016 data 08-Jun-17 RL
2 Updated with 2017 data 14-Nov-18 RL
m3/day
0.39
H
Cr =
2,780 m3/day 1,035
2,780 m3/day
P = 2,638
L = 991
1,035
1,745
L = 373
F = 0.39
2016 524 858 Aug-16
2017 412 841 Sep-17
2020 668 1,035 Jul-20
2018 652 1,015 Jul-18
2019 647 881 Dec-19
H = 977
Cu = 300
11%
283 765
Year ADF MDF MDF Date
S:\2020\320900 - Severn Water & Wastewater Capacity Assessment\Spreadsheet\2021 Capacity Calcs - 2021-08-18
Westshore Water Capacity - Pro 10 of 16Page 18 of 33
- - -
- - -
- - -
- - -
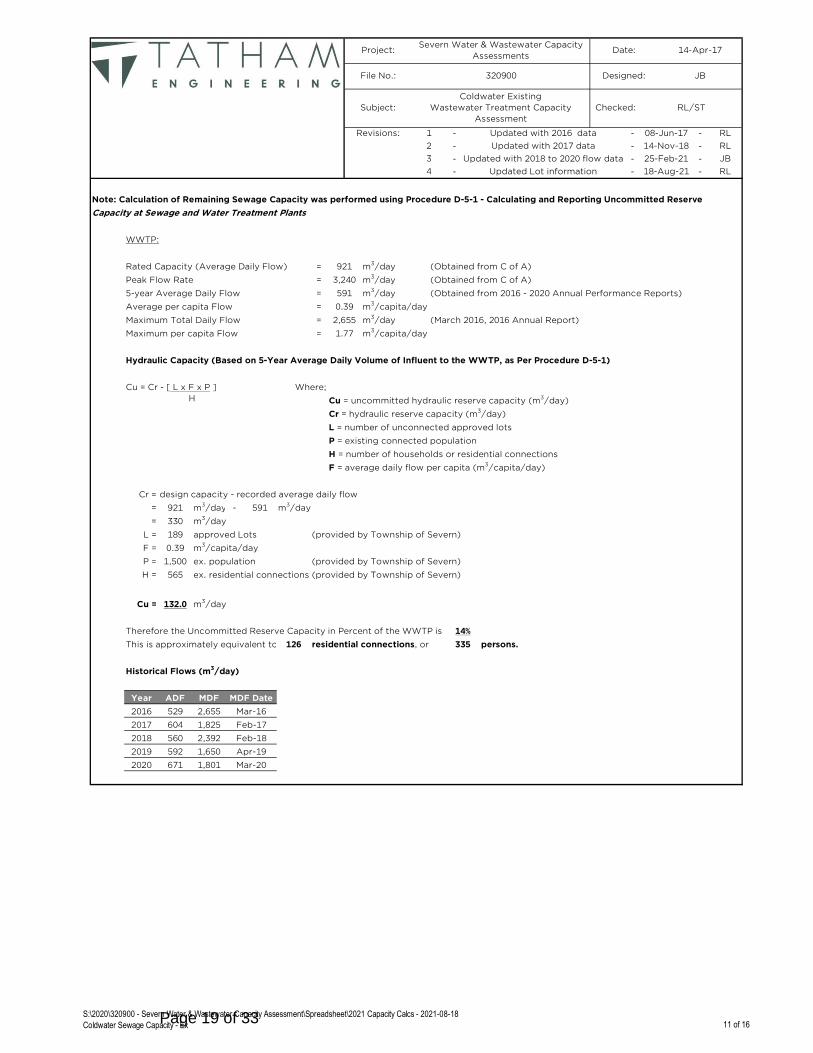
Note: Calculation of Remaining Sewage Capacity was performed using Procedure D-5-1 - Calculating and Reporting Uncommitted Reserve
Capacity at Sewage and Water Treatment Plants
WWTP:
Rated Capacity (Average Daily Flow) = m3/day (Obtained from C of A)
Peak Flow Rate = (Obtained from C of A)
5-year Average Daily Flow = (Obtained from 2016 - 2020 Annual Performance Reports)
Average per capita Flow = m3/capita/day
Maximum Total Daily Flow = (March 2016, 2016 Annual Report)
Maximum per capita Flow = m3/capita/day
Hydraulic Capacity (Based on 5-Year Average Daily Volume of Influent to the WWTP, as Per Procedure D-5-1)
Cu = Cr - [ L x F x P ] Where;
Cu = uncommitted hydraulic reserve capacity (m3/day)
Cr = hydraulic reserve capacity (m3/day)
L = number of unconnected approved lots
P = existing connected population
H = number of households or residential connections
F = average daily flow per capita (m3/capita/day)
design capacity - recorded average daily flow
= - m3/day
= m3/day
approved Lots (provided by Township of Severn)
m3/capita/day
ex. population (provided by Township of Severn)
ex. residential connections (provided by Township of Severn)
m3/day
Therefore the Uncommitted Reserve Capacity in Percent of the WWTP is
This is approximately equivalent to residential connections, or persons.
Historical Flows (m3/day)
2016 529 2,655 Mar-16
2019 592 1,650 Apr-19
2020 671 1,801 Mar-20
2017 604 1,825 Feb-17
2018 560 2,392 Feb-18
Cr =
921 m3/day
330
H
3,240 m3/day
591
Year ADF MDF MDF Date
Project:Severn Water & Wastewater Capacity
AssessmentsDate:
m3/day
0.39
4 Updated Lot information 18-Aug-21
14-Apr-17
File No.: 320900 Designed: JB
921
Revisions: 1 08-Jun-17 RLUpdated with 2016 data
Subject:
Coldwater Existing
Wastewater Treatment Capacity
Assessment
RL/STChecked:
2 Updated with 2017 data 14-Nov-18 RL
3 Updated with 2018 to 2020 flow data 25-Feb-21 JB
RL
H = 565
Cu = 132.0
L = 189
F = 0.39
P = 1,500
591
126 335
2,655 m3/day
1.77
14%
S:\2020\320900 - Severn Water & Wastewater Capacity Assessment\Spreadsheet\2021 Capacity Calcs - 2021-08-18
Coldwater Sewage Capacity - Ex 11 of 16Page 19 of 33
- - -
- - -
- - -
- - -
Note: Calculation of Remaining Sewage Capacity was performed using Procedure D-5-1 - Calculating and Reporting Uncommitted Reserve
Capacity at Sewage and Water Treatment Plants
WWTP:
Rated Capacity (Average Daily Flow) = (Obtained from C of A)
Peak Flow Rate = (Obtained from C of A)
5-year Average Daily Flow = (Obtained from 2016 - 2020 Annual Performance Reports)
Average per capita Flow = m3/capita/day
Maximum Total Daily Flow = (April 2019, 2019 Annual Report)
Maximum per capita Flow = m3/capita/day
Hydraulic Capacity (Based on 5-Year Average Daily Volume of Influent to the WWTP, as Per Procedure D-5-1)
Cu = Cr - [ L x F x P ] Where;
Cu = uncommitted hydraulic reserve capacity (m3/day)
Cr = hydraulic reserve capacity (m3/day)
L = number of unconnected approved lots
P = existing connected population
H = number of households or residential connections
F = average daily flow per capita (m3/capita/day)
design capacity - recorded average daily flow
= - m3/day
= m3/day
approved Lots (provided by Township of Severn)
future Lots (provided by Township of Severn)
m3/capita/day
ex. population (provided by Township of Severn)
ex. residential connections (provided by Township of Severn)
m3/day
Therefore the Uncommitted Reserve Capacity in Percent of the WWTP is
This is approximately equivalent to residential connections, or persons.
Historical Flows (m3/day)
Year
2020 671 1,801 Mar-20
2018 560 2,392 Feb-18
2019 592 1,650 Apr-19
Project:Severn Water & Wastewater Capacity
AssessmentsDate:
3 Updated with 2018 to 2020 flow data 25-Feb-21
14-Apr-17
File No.: 320900 Designed: JB
JB
Subject: RL/STChecked
Coldwater Proposed
Wastewater Treatment Capacity
Assessment
Revisions: 1 Updated with 2016 data 08-Jun-17 RL
Updated with 2017 data 14-Nov-18 RL2
604 1,825
591
330
MDF Date
2,655 m3/day
3,240 m3/day
591 m3/day
ADF MDF
921 m3/day
-859.9
1.77
H
-93%
921 m3/day
4 Updated Lot information 18-Aug-21 RL
0.39
L = 189
F = 0.39
L = 948
Cu =
Cr =
P = 1,500
H = 565
-822
2016 529 2,655 Mar-16
2017 Feb-17
-2,182
S:\2020\320900 - Severn Water & Wastewater Capacity Assessment\Spreadsheet\2021 Capacity Calcs - 2021-08-18
Coldwater Sewage Capacity - Pro 12 of 16Page 20 of 33
- - -
- - -
- - -
- - -
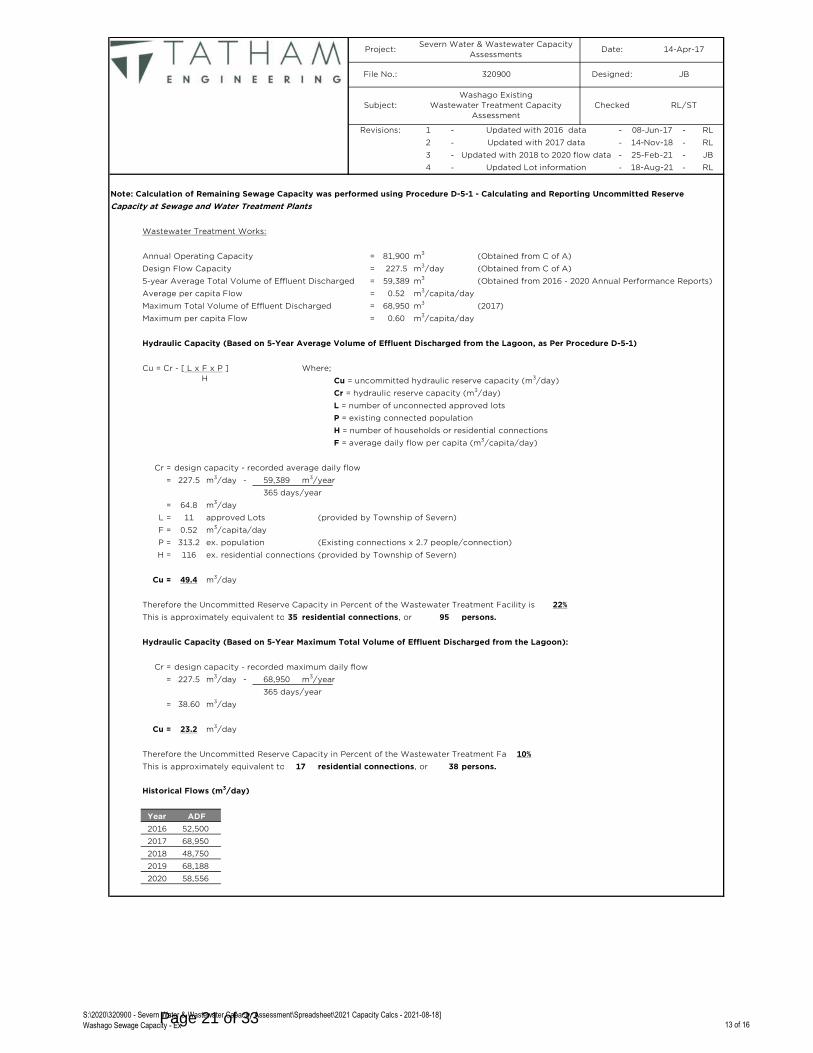
Note: Calculation of Remaining Sewage Capacity was performed using Procedure D-5-1 - Calculating and Reporting Uncommitted Reserve
Capacity at Sewage and Water Treatment Plants
Wastewater Treatment Works:
Annual Operating Capacity = m3 (Obtained from C of A)
Design Flow Capacity = (Obtained from C of A)
5-year Average Total Volume of Effluent Discharged = m3 (Obtained from 2016 - 2020 Annual Performance Reports)
Average per capita Flow = m3/capita/day
Maximum Total Volume of Effluent Discharged = m3 (2017)
Maximum per capita Flow = m3/capita/day
Hydraulic Capacity (Based on 5-Year Average Volume of Effluent Discharged from the Lagoon, as Per Procedure D-5-1)
Cu = Cr - [ L x F x P ] Where;
Cu = uncommitted hydraulic reserve capacity (m3/day)
Cr = hydraulic reserve capacity (m3/day)
L = number of unconnected approved lots
P = existing connected population
H = number of households or residential connections
F = average daily flow per capita (m3/capita/day)
design capacity - recorded average daily flow
= - m3/year
= m3/day
approved Lots (provided by Township of Severn)
m3/capita/day
ex. population (Existing connections x 2.7 people/connection)
ex. residential connections (provided by Township of Severn)
m3/day
Therefore the Uncommitted Reserve Capacity in Percent of the Wastewater Treatment Facility is
This is approximately equivalent to 35 residential connections, or persons.
Hydraulic Capacity (Based on 5-Year Maximum Total Volume of Effluent Discharged from the Lagoon):
design capacity - recorded maximum daily flow
= - m3/year
365 days/year
=
m3/day
Therefore the Uncommitted Reserve Capacity in Percent of the Wastewater Treatment Facility is
This is approximately equivalent to residential connections, or 38 persons.
Historical Flows (m3/day)
F = 0.52
P = 313.2
H = 116
2019
2020
52,500
68,950
ADF
2017
2018
38.60 m3/day
Cu = 23.2
Cu = 49.4
64.8
Updated with 2017 data 14-Nov-18
Revisions: 1 Updated with 2016 data 08-Jun-17
RL
4
Project:Severn Water & Wastewater Capacity
AssessmentsDate: 14-Apr-17
File No.: 320900 Designed: JB
81,900
3 Updated with 2018 to 2020 flow data 25-Feb-21 JB
Subject:
Washago Existing
Wastewater Treatment Capacity
Assessment
RL
2
Checked
48,750
68,188
58,556
RL/ST
10%
17
227.5 m3/day
0.52
68,950
0.60
L = 11
H
Cr =
227.5 m3/day 59,389
365 days/year
22%
Cr =
227.5 m3/day 68,950
Year
2016
95
Updated Lot information 18-Aug-21 RL
59,389
S:\2020\320900 - Severn Water & Wastewater Capacity Assessment\Spreadsheet\2021 Capacity Calcs - 2021-08-18]
Washago Sewage Capacity - Ex 13 of 16Page 21 of 33

Note: Calculation of Remaining Sewage Capacity was performed using Procedure D-5-1 - Calculating and Reporting Uncommitted Reserve
Capacity at Sewage and Water Treatment Plants
Wastewater Treatment Works:
Annual Operating Capacity = m3 (Obtained from C of A)
Design Flow Capacity = (Obtained from C of A)
5-year Average Total Volume of Effluent Discharged = m3 (Obtained from 2016 - 2020 Annual Performance Reports)
Average per capita Flow = m3/capita/day
Maximum Total Volume of Effluent Discharged = m3 (2017)
Maximum per capita Flow = m3/capita/day
Hydraulic Capacity (Based on 5-Year Average Volume of Effluent Discharged from the Lagoon, as Per Procedure D-5-1)
Cu = Cr - [ L x F x P ] Where;
Cu = uncommitted hydraulic reserve capacity (m3/day)
Cr = hydraulic reserve capacity (m3/day)
L = number of unconnected approved lots
P = existing connected population
H = number of households or residential connections
F = average daily flow per capita (m3/capita/day)
design capacity - recorded average daily flow
= - m3/year
= m3/day
approved Lots (provided by Township of Severn)
future Lots (provided by Township of Severn)
m3/capita/day
ex. population (Existing connections x 2.7 people/connection)
ex. residential connections (provided by Township of Severn)
m3/day
Therefore the Uncommitted Reserve Capacity in Percent of the Wastewater Treatment Facility is
This is approximately equivalent to 1 residential connections, or persons.
Hydraulic Capacity (Based on 5-Year Maximum Total Volume of Effluent Discharged from the Lagoon):
design capacity - recorded maximum daily flow
= - m3/year
365 days/year
=
m3/day
Therefore the Uncommitted Reserve Capacity in Percent of the Wastewater Treatment Facility is
This is approximately equivalent to residential connections, or -41 persons.
Historical Flows (m3/day)
Project:Severn Water & Wastewater Capacity
AssessmentsDate: 18-Aug-21
File No.: 320900 Designed: JB
Subject:
Washago Proposed
Wastewater Treatment Capacity
Assessment
Checked RL/ST
Revisions:
0.60
H
Cr =
227.5 m3/day 59,389
81,900
227.5 m3/day
59,389
0.52
68,950
P = 313.2
H = 116
Cu = 1.7
365 days/year
64.8
L = 11
F = 0.52
38.60 m3/day
Cu = -24.5
-11%
-17
1%
3
Cr =
227.5 m3/day 68,950
2018 48,750
2019 68,188
2020 58,556
Year ADF
2016 52,500
2017 68,950
L = 34
S:\2020\320900 - Severn Water & Wastewater Capacity Assessment\Spreadsheet\2021 Capacity Calcs - 2021-08-18]
Washago Sewage Capacity - Pro 14 of 16Page 22 of 33

- - -
- - -
- - -
- - -
Note: Calculation of Remaining Sewage Capacity was performed using Procedure D-5-1 - Calculating and Reporting Uncommitted Reserve
Capacity at Sewage and Water Treatment Plants
WWTP:
Rated Capacity (Average Daily Flow) = (Obtained from C of A)
Peak Flow Rate = (Obtained from C of A)
5-year Average Daily Flow = (Obtained from 2016 - 2020 Annual Performance Reports)
Average per capita Flow = m3/capita/day
Maximum Total Daily Flow = (March 2016)
Maximum per capita Flow = m3/capita/day
Hydraulic Capacity (Based on 5-Year Average Daily Volume of Influent to the WWTP, as Per Procedure D-5-1)
Cu = Cr - [ L x F x P ] Where;
Cu = uncommitted hydraulic reserve capacity (m3/day)
Cr = hydraulic reserve capacity (m3/day)
L = number of unconnected approved lots
P = existing connected population
H = number of households or residential connections
F = average daily flow per capita (m3/capita/day)
design capacity - recorded average daily flow
= - m3/day
= m3/day
approved Lots (provided by Township of Severn)
m3/capita/day
ex. population (Existing connections x 2.7 people/connection)
ex. residential connections (provided by Township of Severn)
m3/day
Therefore the Uncommitted Reserve Capacity in Percent of the WWTP is
This is approximately equivalent to residential connections, or persons.
Historical Flows (m3/day)
4 Updated Lot information 18-Aug-21 RL
2018 634 1,374 Feb-18
2019 708 1,476 Apr-19
2020 712 1,362 Mar-20
ADF MDF MDF Date
2016 540 1,669 Mar-16
2017 746 1,472 May-17
Westshore Existing
Wastewater Treatment Capacity
Assessment
Checked RL/ST
Project:Severn Water & Wastewater Capacity
AssessmentsDate: 14-Apr-17
File No.: 320900 Designed: JB
1,390 m3/day
3 Updated with 2018 to 2020 flow data 25-Feb-21 JB
Subject:
L = 373
4,768
Year
m3/day
668 m3/day
0.25
H
Cr =
1,390 m3/day 668
722
0.63
m3/day1,669
F = 0.25
P = 2,638
H = 977
Cu = 467
34%
683 1,844
Revisions: 1 Updated with 2016 data 08-Jun-17 RL
2 Updated with 2017 data 14-Nov-18 RL
S:\2020\320900 - Severn Water & Wastewater Capacity Assessment\Spreadsheet\2021 Capacity Calcs - 2021-08-18
Westshore Sewage Capacity - Ex 15 of 16Page 23 of 33

- - -
- - -
- - -
- - -
Note: Calculation of Remaining Sewage Capacity was performed using Procedure D-5-1 - Calculating and Reporting Uncommitted Reserve
Capacity at Sewage and Water Treatment Plants
WWTP:
Rated Capacity (Average Daily Flow) = (Obtained from C of A)
Peak Flow Rate = (Obtained from C of A)
5-year Average Daily Flow = (Obtained from 2016 - 2020 Annual Performance Reports)
Average per capita Flow = m3/capita/day
Maximum Total Daily Flow = (March 2016)
Maximum per capita Flow = m3/capita/day
Hydraulic Capacity (Based on 5-Year Average Daily Volume of Influent to the WWTP, as Per Procedure D-5-1)
Cu = Cr - [ L x F x P ] Where;
Cu = uncommitted hydraulic reserve capacity (m3/day)
Cr = hydraulic reserve capacity (m3/day)
L = number of unconnected approved lots
P = existing connected population
H = number of households or residential connections
F = average daily flow per capita (m3/capita/day)
design capacity - recorded average daily flow
= - m3/day
= m3/day
approved Lots (provided by Township of Severn)
future Lots (provided by Township of Severn)
m3/capita/day
ex. population (Existing connections x 2.7 people/connection)
ex. residential connections(provided by Township of Severn)
m3/day
Therefore the Uncommitted Reserve Capacity in Percent of the WWTP is
This is approximately equivalent to residential connections, or persons.
Historical Flows (m3/day)
RL
2019 708 1,476 Apr-19
2020 712 1,362 Mar-20
2017 746 1,472 May-17
2018 634 1,374 Feb-18
Year ADF MDF MDF Date
Cr =
1,390 m3/day 668
L = 373
F = 0.25
4
Checked
1,390 m3/day
0.63
H
1,669 m3/day
4,768 m3/day
668 m3/day
0.25
Updated Lot information 18-Aug-21
RL/ST
JB3 Updated with 2018 to 2020 flow data
Project:Severn Water & Wastewater Capacity
AssessmentsDate: 14-Apr-17
File No.: 320900 Designed: JB
Subject:
Westshore Proposed
Wastewater Treatment Capacity
Assessment
25-Feb-21
Revisions: 1 Updated with 2016 data 08-Jun-17 RL
2 Updated with 2017 data 14-Nov-18 RL
-308 -832
722
-15%
P = 2,638
H = 977
Cu = -211
L = 991
2016 540 1,669 Mar-16
S:\2020\320900 - Severn Water & Wastewater Capacity Assessment\Spreadsheet\2021 Capacity Calcs - 2021-08-18
Westshore Sewage Capacity - Pro 16 of 16Page 24 of 33
253
10
County of Simcoe, Province of Ontario, Ontario MNR, Esri Canada, Esri, HERE, Garmin, INCREMENT P, USGS, EPA,USDA, AAFC, NRCan
Watermain
Settlement
Serviced_Areas
AllocationTypeFinal Allocation
Future Consideration
Provisional Allocation
Special Policy Area
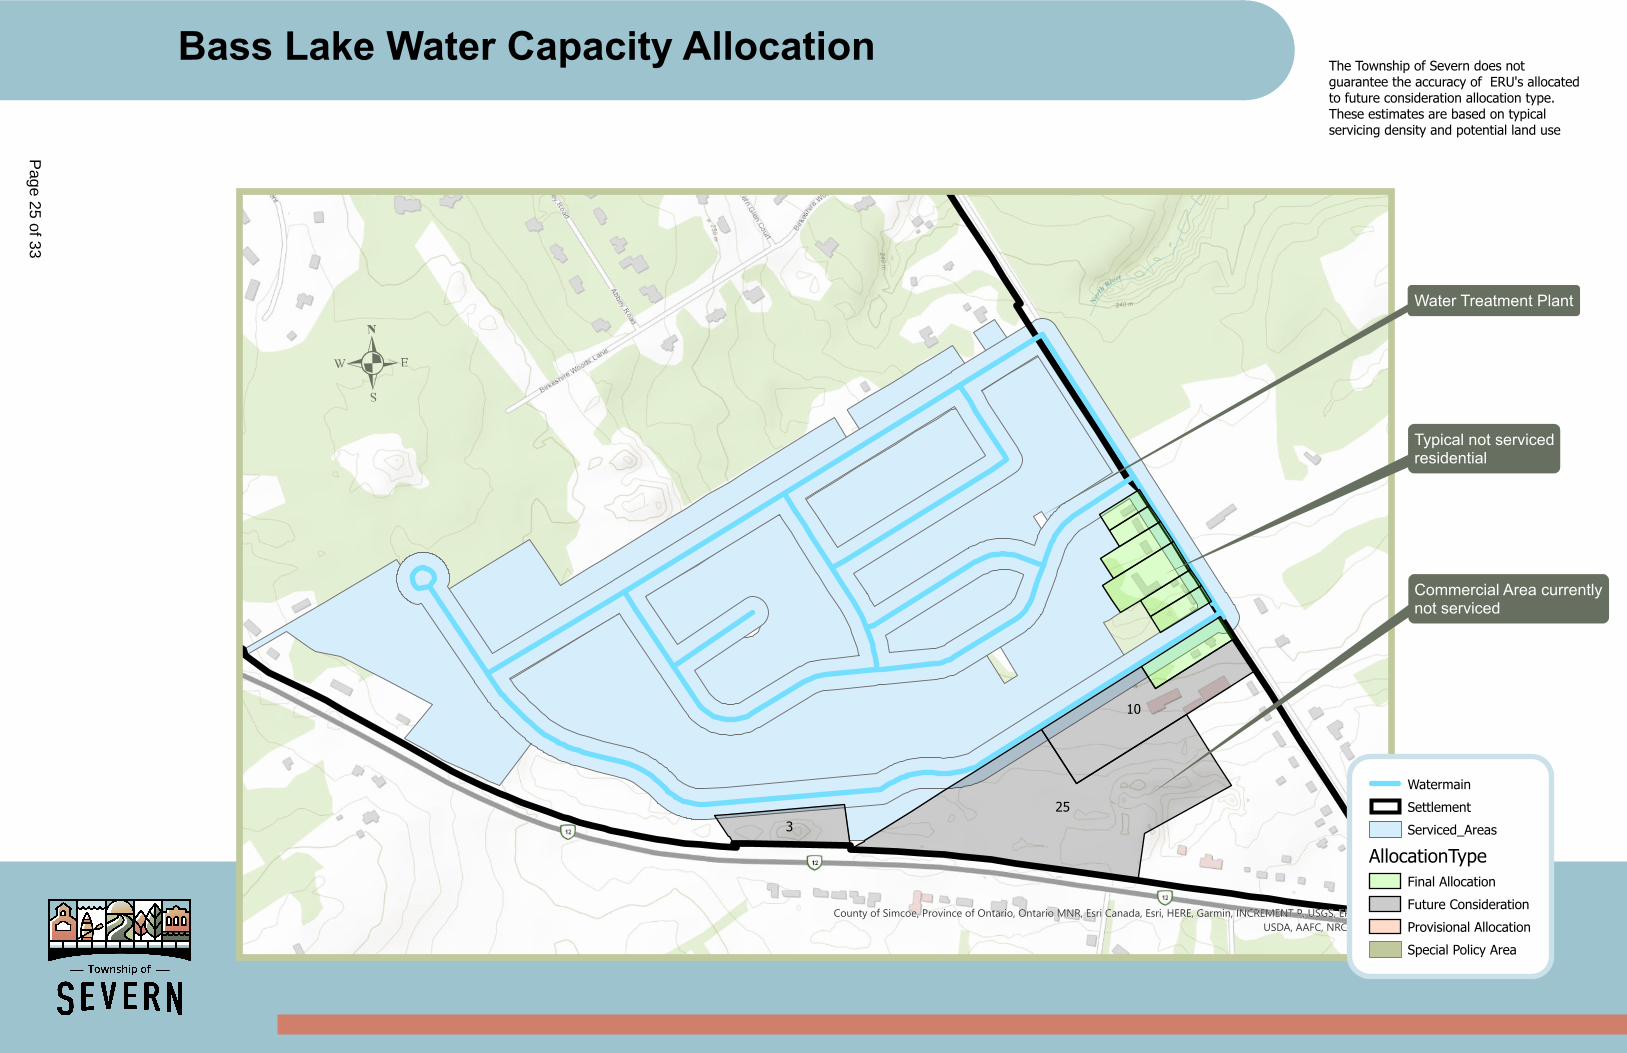
Bass Lake Water Capacity Allocation
Water Treatment Plant
Typical not servicedresidential
Commercial Area currentlynot serviced
The Township of Severn does notguarantee the accuracy of ERU's allocatedto future consideration allocation type.These estimates are based on typicalservicing density and potential land use
Page 25 of 33
2550
15
11 146
7
15
10
40
42
3030
40
201
150350
200
150
85
11
345
25
20
County of Simcoe, Province of Ontario, Ontario MNR, Esri Canada, Esri, HERE, Garmin, INCREMENT P, USGS, EPA,USDA, AAFC, NRCan
Fire_Hydrants
Watermain
Settlement
Serviced_Areas
AllocationTypeFinal Allocation
Future Consideration
Provisional Allocation
Special Policy Area
Coldwater Water Capacity Allocation
47 River StreetApartments
John Street Subdivision
1240 Anderson LineApplication SV-T-2001
Greenwood AcresSubdivision
Michael Anne DriveApartments
Commercial Area outsideServiced Area
Sheppard StreetSubdivision
Anderson LinePre-consultation
The Township of Severn does notguarantee the accuracy of ERU's allocatedto future consideration allocation type.These estimates are based on typicalservicing density and potential land use
Page 26 of 33

County of Simcoe, Province of Ontario, Ontario MNR, Esri Canada, Esri, HERE, Garmin, INCREMENT P, USGS, EPA,USDA, AAFC, NRCan
Watermain
Serviced_Areas
AllocationTypeFinal Allocation
Future Consideration
Provisional Allocation
Special Policy Area
Sandcastle Water Capacity Allocation
Simcoe CountyAmbulance
Water Treatment Plant
The Township of Severn does notguarantee the accuracy of ERU's allocatedto future consideration allocation type.These estimates are based on typicalservicing density and potential land use
Page 27 of 33
County of Simcoe, Province of Ontario, Ontario MNR, Esri Canada, Esri, HERE, Garmin, INCREMENT P, USGS, EPA,USDA, AAFC, NRCan
Watermain
Serviced_Areas
AllocationTypeFinal Allocation
Future Consideration
Provisional Allocation
Special Policy Area
Severn Estates Water Capacity Allocation
Typical Vacant Property
Water Treatment Plant
CNR Railway
EP ZonedVacant Property
The Township of Severn does notguarantee the accuracy of ERU's allocatedto future consideration allocation type.These estimates are based on typicalservicing density and potential land use
Page 28 of 33
Washago Water Capacity Allocation
4
13
9
8
County of Simcoe, Province of Ontario, Ontario MNR, Esri Canada, Esri, HERE, Garmin, INCREMENT P, USGS, EPA,USDA, AAFC, NRCan
Hamilton StreetCommercial Area
Typical Vacant Property
Washago CentennialPark
Watermain
Settlement
Serviced_Areas
AllocationTypeFinal Allocation
Future Consideration
Provisional Allocation
Special Policy Area
The Township of Severn does notguarantee the accuracy of ERU's allocatedto future consideration allocation type.These estimates are based on typicalservicing density and potential land use
Page 29 of 33

Westshore Water Capacity Allocation
181
70
92
8
40
99
811
9
567
291
3
569
120
222
146
129
24
12
236
38
69
1930
2611115115 57
1617
66
506
1359 21
County of Simcoe, Province of Ontario, Ontario MNR, Esri Canada, Esri, HERE, Garmin, INCREMENT P, USGS, EPA, USDA, AAFC, NRCan
Watermain
Settlement
Serviced_Areas
AllocationTypeFinal Allocation
Future Consideration
Provisional Allocation
Special Policy Area
North Turnbull
Turnbull Subdivision(Pre-Servicing Anticipated)
Menoke Subdivision
Westshore Crescent
Shadow Creek
Menoke BeachPre-Consultation
Menoke SubdivisionPhase 2
UnopenedSimcoe Street
The Township of Severn does notguarantee the accuracy of ERU's allocatedto future consideration allocation type.These estimates are based on typicalservicing density and potential land use
Page 30 of 33

&&
&
&
&&&
&&&
&&&&&
&
&
&&&
&
&
&&
&& &
&&
&
&&
&
&
&
&
&&
&
&
&
&&
&
& &
&&
&
&&
&
&&
&&
&
&
&&
&&
&
&&
&
&
&
&
&&
&
&
&
&
&
&
&&
&&
&
&
&&
&
&&
&
&
&&
&&
&&
&
&
&
& &
&
&
&
&
&&
&
&
&
&&
&&
&
&
&&
&
2550
15
11 146
7
15
10
40
42
3030
40
201
150350
200
150
85
11
345
25
20
County of Simcoe, Province of Ontario, Ontario MNR, Esri Canada, Esri, HERE, Garmin, INCREMENT P, USGS, EPA,USDA, AAFC, NRCan
Pumping Stations& Sewers
Settlement
AllocationType
Final Allocation
Future Consideration
Provisional Allocation
Special Policy Area
Coldwater Wastewater Capacity Allocation
47 River StreetApartments
John Street Subdivision
1240 Anderson LineApplication SV-T-2001 Greenwood Acres
Subdivision
Michael Anne DriveApartments
Commercial Area outsideServiced Area
Sheppard StreetSubdivision
Anderson LinePre-consultation
The Township of Severn does notguarantee the accuracy of ERU's allocatedto future consideration allocation type.These estimates are based on typicalservicing density and potential land use
Page 31 of 33

&&
&
&
&
&
&
&
&
&
&
&
&
&
&
&
&
&
&
&
&
&
&
&
&
&
&
&
&
&
&
&
4
13
9
8
County of Simcoe, Province of Ontario, Ontario MNR, Esri Canada, Esri, HERE, Garmin, INCREMENT P, USGS, EPA,USDA, AAFC, NRCan
Pumping Stations& Sewers
Settlement
AllocationType
Final Allocation
Future Consideration
Provisional Allocation
Special Policy Area
Washago Wastewater Capacity Allocation
Hamilton StreetCommercial Area
Typical Vacant Property
Washago CentennialPark
The Township of Severn does notguarantee the accuracy of ERU's allocatedto future consideration allocation type.These estimates are based on typicalservicing density and potential land use
Page 32 of 33

Westshore Wastewater Capacity Allocation
&&
&
&&
&
&&&
&
&
&&
&
&&
&
&
&&
&
&
&
&&&
&&
&&
&
&&
&& &
&&
&&&
&
&&
&
&
&&
&
&&&&&&
&
&
&&&
&&&
&
&
&
&&
&&&&
&
&
&&
&&
&
&
&&
&
&&
&&
&
&
&&
&&
&&
&&
&&
&&
&&
&&
&&
&&
&&
&&
&
&
&&
&&
&&
&
&&
&&
&&
&&
&&
&
&&
&&
&&&&&
&&&&
&&
&&
&&
&&&&&
&&
& &&
&&
&&
&&
&
&&
&&
&
&&
&&
&&
&
&&
&&
&&
&
&&
&&&
&&
&&&
& &
&&&
&&
&
&
&
&&
&&
&&
&
&&&
&&&&
&
&
&
&
&
&
&
&&&
&
&&
&&
&&&
&
&
&
181
70
92
8
40
99
811
9
567
291
3
569
120
222
146
129
24
12
236
38
69
1930
2611115115 57
1617
66
506
1359 21
County of Simcoe, Province of Ontario, Ontario MNR, Esri Canada, Esri, HERE, Garmin, INCREMENT P, Intermap, USGS, METI/NASA, EPA,USDA, AAFC, NRCan
Pumping Stations& Sewers
Settlement
AllocationTypeFinal Allocation
Future Consideration
Provisional Allocation
Special Policy Area
North Turnbull
Turnbull Subdivision(Pre-Servicing Anticipated)
Menoke Subdivision
Westshore Crescent
Shadow Creek
Menoke BeachPre-Consultation
Menoke SubdivisionPhase 2
UnopenedSimcoe Street
The Township of Severn does notguarantee the accuracy of ERU's allocatedto future consideration allocation type.These estimates are based on typicalservicing density and potential land use
Page 33 of 33