(U) Annual Demographic Report: Hiring and Retention of ... 2015 Annual Report.pdf · Table 08:...
85
UNCLASSIFIED UNCLASSIFIED (U) Annual Demographic Report: Hiring and Retention of Minorities, Women, and Persons with Disabilities in the United States Intelligence Community Fiscal Year 2015
Transcript of (U) Annual Demographic Report: Hiring and Retention of ... 2015 Annual Report.pdf · Table 08:...
UNCLASSIFIED
UNCLASSIFIED
(U) Annual Demographic Report:
Hiring and Retention of Minorities, Women, and
Persons with Disabilities in the
United States Intelligence Community
Fiscal Year 2015

ii
[THIS PAGE LEFT BLANK]
iii
Annual Demographic Report:
Hiring and Retention of Minorities, Women, and
Persons with Disabilities in the
United States Intelligence Community
Fiscal Year 2015
This report was prepared by the Office of Intelligence Community Equal Employment
Opportunity and Diversity (IC EEOD) in the Office of the Director of National
Intelligence (ODNI). Please direct inquiries regarding this report to the ODNI Office
of Legislative Affairs at (703) 275–2474.

iv
[THIS PAGE LEFT BLANK]

5
Table of Contents
Acronyms.............................................................................................................................................................. 9
Understanding and Using this Report ..............................................................................................................11
Population Studied .......................................................................................................................................... 11
Data Collection Methods ................................................................................................................................ 11
Data Conditions and Anomalies...................................................................................................................... 12
Data Definitions .............................................................................................................................................. 13
Statistical Measures and Percentages of Small Populations .......................................................................... 13
Executive Summary ............................................................................................................................................15
Minorities in the IC ......................................................................................................................................... 16
Women in the IC .............................................................................................................................................. 18
Persons with Disabilities in the IC .................................................................................................................. 19
Future Plans: FY 2016 and Beyond ................................................................................................................ 21
Chapter 1. IC Best Practices in EEO, Diversity, and Inclusion .....................................................................23
Using Technology to Increase Outreach: IC Virtual Fairs and Applicant Website ........................................ 23
Bringing Diversity to the Mission: Employee Resource Groups ..................................................................... 24
Reaching Minorities through Collaborative IC Recruitment Events............................................................... 25
Providing Foreign Language Training: STARTALK Program ....................................................................... 26
Providing Grants to Increase Diversity: IC Centers of Academic Excellence (CAE) in National Security .... 27
Providing Opportunities for Service Members: IC Wounded Warrior Program ............................................ 29
Undergraduate Scholar Program: Stokes ....................................................................................................... 29
Awards to Recruit and Train to Develop Intelligence Skills: PRISP .............................................................. 31
Measuring the Diversity Pipeline: IC Civilian Joint Duty Program ............................................................... 32
Bridging Language and Cultural Gaps: IC Heritage Community Liaison Council ........................................ 32
Best Practices in Leadership and Accountability ............................................................................................ 35
Best Practices in Workforce Development and Succession Planning ............................................................. 36
Best Practices in Recruitment, Hiring, and Retention..................................................................................... 36
Best Practices in Career Development and Advancement .............................................................................. 37
Best Practices in Equal Employment Opportunity and Inclusion ................................................................... 37
Chapter 2. Minorities in the IC ........................................................................................................................39
Highlights of the Minority Workforce ............................................................................................................. 39
Detailed Data on Minorities in the IC ............................................................................................................. 43
Workforce Composition ............................................................................................................................43 Managers ..................................................................................................................................................45 Hiring and Attrition ...................................................................................................................................46 Promotions ................................................................................................................................................51
6
Awards (Monetary and Honorary) and Quality Step Increases (QSI) ......................................................52 Selected Education and Development Programs ......................................................................................55 PRISP and Stokes ......................................................................................................................................57 Joint Duty Program ...................................................................................................................................58
Chapter 3. Women in the IC ..............................................................................................................................59
Highlights of the Female Workforce ............................................................................................................... 59
Detailed Data on Gender in the IC ................................................................................................................. 62
Workforce Composition ............................................................................................................................62 Managers ..................................................................................................................................................63 Hiring and Attrition ...................................................................................................................................63 Promotions ................................................................................................................................................68 Awards (Monetary and Honorary) and Quality Step Increases (QSI) ......................................................68 Selected Education and Development Programs ......................................................................................71 PRISP and Stokes ......................................................................................................................................72 Joint Duty Program ...................................................................................................................................73
Chapter 4. Persons with Disabilities (PWD) in the IC ....................................................................................75
Highlights of PWD Workforce ........................................................................................................................ 75
Detailed Data on PWD in the IC..................................................................................................................... 77
PWD in the IC Workforce .........................................................................................................................77 Hiring and Attrition ...................................................................................................................................78 Promotions ................................................................................................................................................80 Joint Duty Program ...................................................................................................................................81
Appendix A – IC Centers of Academic Excellence Program ..........................................................................83
Appendix B – Principles of Professional Ethics for the IC .............................................................................85
7
List of Tables
Table 01: 6 Agencies and 11 Other Components ........................................................................................................ 11 Table 02: Measures of Attrition ................................................................................................................................... 14 Table 03: Employee Resource Groups ........................................................................................................................ 25 Table 04: IC CAE Institutions ..................................................................................................................................... 27 Table 05: Stokes Scholar Schools ................................................................................................................................ 30 Table 06: Member Organizations of the IC Heritage Community Liaison Council .................................................... 33 Table 07: FY 2015 IC EEOD-Sponsored and Related Community-Wide Events ....................................................... 33 Table 08: Hiring, Attrition and Workforce by RNO Group and Pay Grade (FY 2015) ................................................ 39 Table 09: Five-Year Workforce Dynamic Trends by RNO Groups (FY 2011 to FY 2015) ....................................... 40 Table 10: Stokes Five-Year Trend by RNO (FY 2011 to FY 2015) ............................................................................ 40 Table 11: The IC’s Workforce by RNO and Pay Grade (FY 2015) ............................................................................ 44 Table 12: Hiring by RNO and Pay Grade (FY 2015) .................................................................................................. 47 Table 13: Overall Share of Attrition by RNO and Grade (FY 2015) ........................................................................... 48 Table 14: Promotions by RNO and Grade (FY 2015) ................................................................................................. 51 Table 15: Monetary Awards by RNO and Award Amount (FY 2015) ........................................................................ 52 Table 16: Monetary Awards by Award Amount, RNO Group and IC Group (FY 2015) ........................................... 52 Table 17: Honorary Awards by Grade and RNO (FY 2015) ....................................................................................... 53 Table 18: QSIs by RNO and Grade (FY 2015)............................................................................................................ 54 Table 19: Five-Year Trends in PRISP by RNO (FY 2011 – FY 2015) ....................................................................... 57 Table 20: Joint Duty Credits and Promotions by RNO Group and Grade (FY 2015) ................................................. 58 Table 21: Workforce Composition by Pay Grade (FY 2015) ..................................................................................... 62 Table 22: Five-Year Workforce Dynamic Trends by Gender (FY 2011 to FY 2015) ................................................. 63 Table 23: Hiring by Gender and Pay Grade (FY 2015) ............................................................................................... 64 Table 24: Overall Share of Attrition by Gender and Pay Grade (FY 2015) .................................................................. 66 Table 25: Promotions by Gender and Pay Grade (FY 2015) ........................................................................................ 68 Table 26: Monetary Awards by Gender and Award Amount (FY 2015) .................................................................... 68 Table 27: Honorary Awards in the IC by Gender and Pay Grade (FY 2015) .............................................................. 69 Table 28: QSIs by Gender and Pay Grade (FY 2015) ................................................................................................. 70 Table 29: Five-Year Trends in PRISP by Gender (FY 2011-FY 2015) ...................................................................... 72 Table 30: Five-Year Trends in the Stokes Program by Gender (FY 2011 to FY 2015) ................................................ 73 Table 31: Joint Duty Credits and Promotions by Gender and Grade (FY 2015) ......................................................... 73 Table 32: PWD Hiring, Attrition and Workforce Representation by Pay Grade (FY 2015) ........................................ 76 Table 33: PWD JD Credit and Promotions (FY 2015) ................................................................................................ 81
8
List of Figures
Figure 01: Five-Year Minority Trends (FY 2011 to FY 2015) .................................................................................... 16 Figure 02: Five-Year Gender Trends (FY 2011 to FY 2015) ...................................................................................... 18 Figure 03: PWD Five-Year Trends (FY 2011 to FY 2015) ......................................................................................... 19 Figure 04: Attrition Rates in the IC, Other Components, and Six Agencies (FY 2015) .............................................. 41 Figure 05: Minority Workforce by RNO Compared to Benchmarks (FY 2015) ......................................................... 42 Figure 06: Minority Workforce by RNO (FY 2015) ................................................................................................... 43 Figure 07: Representation Among Managers by Pay Grade Group (FY 2015) ........................................................... 45 Figure 08: Minority Hiring by RNO (FY 2015) .......................................................................................................... 46 Figure 09: Attrition Rates by RNO Compared to the IC’s Overall Rate (FY 2015) .................................................... 49 Figure 10: Minority Share of Attrition by Type (FY 2015) ......................................................................................... 50 Figure 11: Minority Promotions by RNO (FY 2015) ................................................................................................. 51 Figure 12: Participation in All Educational Development Programs by RNO (FY 2015) ........................................... 55 Figure 13: Selected Educational Development by Program and RNO (FY 2015) ...................................................... 56 Figure 14: FY 2015 Gender Composition, Hires, and Attrition .................................................................................. 59 Figure 15: Gender Workforce Compared to Benchmarks (FY 2015) .......................................................................... 60 Figure 16: Promotions in the IC by Gender (FY 2015) ............................................................................................... 61 Figure 17: Comparison of Gender Representation Rates between the Overall IC Workforce and Recipients of
Honorary Awards ............................................................................................................................................... 61 Figure 18: Managers by Gender and Pay Grade as a Proportion of the Workforce (FY 2015) .................................... 63 Figure 19: Hiring by Gender (FY 2015) ...................................................................................................................... 64 Figure 20: Attrition Rates by Gender Compared to Overall Rates (FY 2015) .............................................................. 65 Figure 21: Gender Overall Share of Attrition by Type (FY 2015) .............................................................................. 67 Figure 22: Female versus Male Attrition Type ............................................................................................................ 67 Figure 23: Selected Education and Development Programs by Gender ...................................................................... 71 Figure 24: Selected Educational Development by Program and Gender (FY 2015) ................................................... 72 Figure 25: Five-Year PWD Trends (FY 2011 to FY 2015) ......................................................................................... 75 Figure 26: PWD Workforce Compared to Benchmark (FY 2015) .............................................................................. 77 Figure 27: Hiring PWD in the IC (FY 2015) ............................................................................................................... 78 Figure 28: Attrition Rates for PWD in the IC (FY 2015) ............................................................................................ 79 Figure 29: PWD Workforce Compared to Promotions (FY 2015) .............................................................................. 80
9
Acronyms
AIAN American Indian/Alaska Native
CAE Centers of Academic Excellence
CAPAL Conference for Asian Pacific American Leadership
CIA Central Intelligence Agency
CLF Civilian Labor Force
CMDI Center for Mission Diversity and Inclusion
DAG Director’s Advisory Group
DEA ONSI Drug Enforcement Administration, Office of National Security Intelligence
DHS Department of Homeland Security
DIA Defense Intelligence Agency
DISP Diversity and Inclusion Strategic Plan
DNI Director of National Intelligence
DoD Department of Defense
DoE IN Department of Energy, Office of Intelligence and Counterintelligence
EASE Equal Accessibility Services Environment
EEOC Equal Employment Opportunity Commission
MD-715 EEOC Management Directive-715
EEOD EEO and Diversity
ERG Employee Resource Group
FBI/IB Federal Bureau of Investigation, Intelligence Branch
FMLA Family Medical Leave Act
FW Federal Workforce
FY Fiscal Year
GS/GG General Schedule/General Grade
HBCU Historically Black College or University
IC Intelligence Community
ICAN IC Affinity Network
ICD IC Directive
IC CHCO IC Chief Human Capital Office
IC EEOD Office of IC Equal Employment Opportunity and Diversity
ICRC IC Recruitment Committee
ICWWP IC Wounded Warrior Program
IQ Inclusion Quotient
IRTPA Intelligence Reform and Terrorism Prevention Act
JD Joint Duty
LGBTA Lesbian, Gay, Bisexual, Transgender, and Allies
MCISR-E Marine Corps Intelligence, Surveillance, and Reconnaissance Enterprise
NASIC United States Air Force, 25 AF, National Air and Space Intelligence Center
NCTC National Counterterrorism Center
NDIC National Defense Intelligence College
NGA National Geospatial-Intelligence Agency
NHPI Native Hawaiian/Pacific Islander
NIS National Intelligence Strategy
NRO National Reconnaissance Office
10
NSA National Security Agency
NSEP National Security Education Program
NSLI National Security Language Initiative
ODNI Office of the Director of National Intelligence
OPM United States Office of Personnel Management
PDDNI Principal Deputy Director of National Intelligence
PPIA Public Policy and International Affairs
PRISP Pat Roberts Intelligence Scholars Program
PWD Persons with Disabilities
PWTD People with Targeted Disabilities
QSI Quality Step Increase
RNO Race and National Origin
State INR United States Department of State’s Bureau of Intelligence and Research
STEM Science, Technology, Engineering, and Math
USA United States Army, Intelligence and Security Command,
National Ground Intelligence Center
USAF United States Air Force, 25 AF, National Air and Space Intelligence Center
USCG United States Coast Guard, CG Intelligence
USMC United States Marine Corps, Marine Corps Intelligence Activity
USN NIA United States Navy, Naval Intelligence Activity
UST OIA United States Department of the Treasury, Office of Intelligence and Analysis
UTAP DIA’s Undergraduate Training and Assistance Program (aka Stokes)
UTP NSA’s Undergraduate Training Program (aka Stokes)
WLF Women’s Leadership Forum
11
Understanding and Using this Report
Population Studied
This report is prepared in accordance with Section 114 of the National Security Act of
1947, as amended by Section 324 of the Intelligence Authorization Act of 2003. This report
summarizes demographic data on the population of minorities, women, and persons with
disabilities (PWD) employed within the U.S. Intelligence Community (IC) during
fiscal year (FY) 2015 (between 1 October 2014 and 30 September 2015).
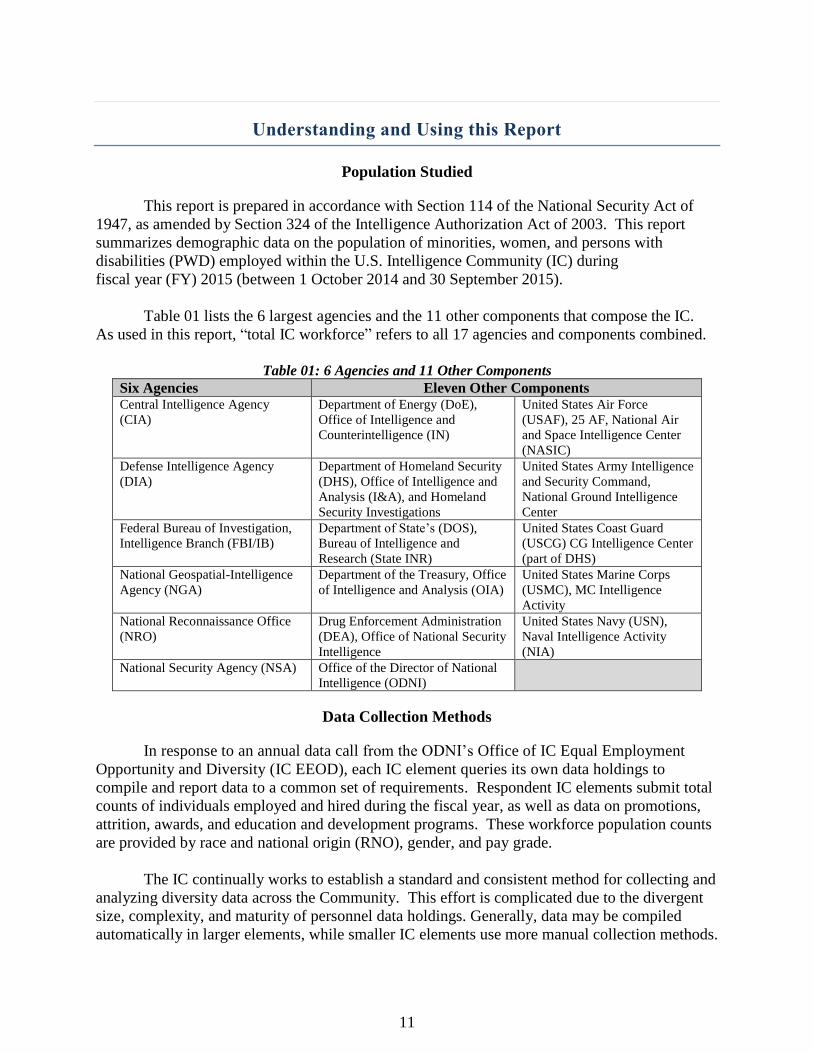
Table 01 lists the 6 largest agencies and the 11 other components that compose the IC.
As used in this report, “total IC workforce” refers to all 17 agencies and components combined.
Table 01: 6 Agencies and 11 Other Components
Six Agencies Eleven Other Components Central Intelligence Agency
(CIA)
Department of Energy (DoE),
Office of Intelligence and
Counterintelligence (IN)
United States Air Force
(USAF), 25 AF, National Air
and Space Intelligence Center
(NASIC)
Defense Intelligence Agency
(DIA)
Department of Homeland Security
(DHS), Office of Intelligence and
Analysis (I&A), and Homeland
Security Investigations
United States Army Intelligence
and Security Command,
National Ground Intelligence
Center
Federal Bureau of Investigation,
Intelligence Branch (FBI/IB)
Department of State’s (DOS),
Bureau of Intelligence and
Research (State INR)
United States Coast Guard
(USCG) CG Intelligence Center
(part of DHS)
National Geospatial-Intelligence
Agency (NGA)
Department of the Treasury, Office
of Intelligence and Analysis (OIA)
United States Marine Corps
(USMC), MC Intelligence
Activity
National Reconnaissance Office
(NRO)
Drug Enforcement Administration
(DEA), Office of National Security
Intelligence
United States Navy (USN),
Naval Intelligence Activity
(NIA)
National Security Agency (NSA) Office of the Director of National
Intelligence (ODNI)
Data Collection Methods
In response to an annual data call from the ODNI’s Office of IC Equal Employment
Opportunity and Diversity (IC EEOD), each IC element queries its own data holdings to
compile and report data to a common set of requirements. Respondent IC elements submit total
counts of individuals employed and hired during the fiscal year, as well as data on promotions,
attrition, awards, and education and development programs. These workforce population counts
are provided by race and national origin (RNO), gender, and pay grade.
The IC continually works to establish a standard and consistent method for collecting and
analyzing diversity data across the Community. This effort is complicated due to the divergent
size, complexity, and maturity of personnel data holdings. Generally, data may be compiled
automatically in larger elements, while smaller IC elements use more manual collection methods.
12
The ODNI does not have a central data repository of personnel records across the IC.
Therefore, IC EEOD applies quality controls to each data submission, and several months of
reconciliation and checks are required. IC EEOD compares each agency’s data in the various
categories (e.g., RNO, hiring, attrition, etc.) to the prior fiscal year, and IC elements are asked to
verify changes or send corrections if an error is discovered. This quality assurance process
improves the validity and reliability of the reported data.
This report, covering FY 2015, is the first UNCLASSIFIED version of the annual
Congressional report.
Data Conditions and Anomalies
As noted above, this report details the percentage of minorities, women, and PWD
employed during FY 2015. Key indicators are also reported with regard to promotions, attrition,
awards, and education programs. Standard definitions for these attributes are provided; however,
IC elements may not store, categorize, and sort data in the same way for all personnel actions.
For example, an IC element may be able to readily provide attrition counts by pay grade, RNO,
and gender through automated data retrieval, but manual counting may be required to determine
whether personnel attrition was due to resignation, retirement, or termination.
Smaller IC elements present unique challenges in data compilation, as the members of the
workforce may be colocated with non-IC members of a larger non-IC workforce, and personnel
may not readily be identified as having an IC affiliation. In some instances, data points were
unavailable or incomplete for a full analysis of some attributes. The following data collection
anomalies should be considered when reviewing this report:
Since the USMC is a component of the USN, its data were reported with USN.
Hiring and attrition measures at the NRO should be interpreted differently from other
agencies because the civilian workforce is primarily made up of employees who are
detailed from other IC elements. Detailed employees return to their home IC elements
when their assignment is completed; therefore, the NRO reports gains and losses. Gains
are people detailed to work at the NRO at the end of the year who were not there at the
beginning. Losses are start-of-year detailees who were no longer employed there at
year’s end.
In addition, NRO's FY 2015 submission includes only full-time and part-time civilian
employees funded by NRO (primarily CIA non-Directorate of Science &Technology, Air
Force, Navy, and Defense Logistics Agency civilians). Part-time employees accounted
for 6 percent of the total population of this submission. NRO data does not include
uniformed military personnel or employees funded by other organizations.
To avoid double-counting in the aggregated report, CIA’s workforce numbers do not
include CIA officers assigned to NRO or NGA.
UST OIA’s workforce appeared to drop precipitously in FY 2015 due to an FY 2014
error. Since UST composes a tiny portion of the IC workforce, these data conditions
will not have a significant impact on the final results.
The IC lacks RNO and gender data on some Pat Roberts Intelligence Scholars
13
Program (PRISP) Awardee participants (fewer than 70); therefore, they are not included
in the counts in this report. The IC will review the processes for data collection and
recordkeeping to seek more accuracy in this demographic.
Data Definitions
Grades and Senior Positions. For the purposes of this report, “higher pay grades” refer
to General Schedule/General Grade (GS/GG) 13–15—the “feeder” grades for senior executive
positions. “Senior” Positions refer to positions higher than GS/GG 15; these are defined by each
IC element’s executive service system and senior professional populations (e.g., the Department
of Defense’s (DOD’s) Defense Intelligence Senior Executive Service, DoD’s Defense
Intelligence Senior Level employees, CIA’s Senior Intelligence Service, or ODNI’s Senior
National Intelligence Service).
RNO Categories. The FY 2015 RNO data were collected in accordance with the race
and ethnicity reporting requirements in the U.S. Equal Employment Opportunity Commission
(EEOC) Management Directive-715 (MD-715). Under this directive, employees who selected
“Hispanic or Latino” as their ethnicity were counted as “Hispanic or Latino,” regardless of race.
In addition, EEOC data for individuals of Native Hawaiian or Pacific Islander origin were
reported separately from Asians. In some figures and tables, RNO categories are abbreviated as
follows: “AIAN” for American Indian/Alaska Native and “NHPI” for Native Hawaiian/Pacific
Islander. Also, “Whites” or “Non-Minority” refers to non-Hispanic Whites throughout the
report.
Statistical Measures and Percentages of Small Populations
Statistical Significance. Results are expressed as percentages of the total IC workforce,
or of some subset of the workforce. When making observations of a population, there is always
the possibility that an observed effect may have occurred due to a collection error.
Percentages of Small Populations May Be Misleading. Percentages can fluctuate
significantly if there is a one- or two-person change, due to the small population counts. For
example, data points relating to participation in senior service schools could appear to be
unusually high, but it is important to understand that such calculations are based on small
numbers relative to the IC workforce as a whole.
14
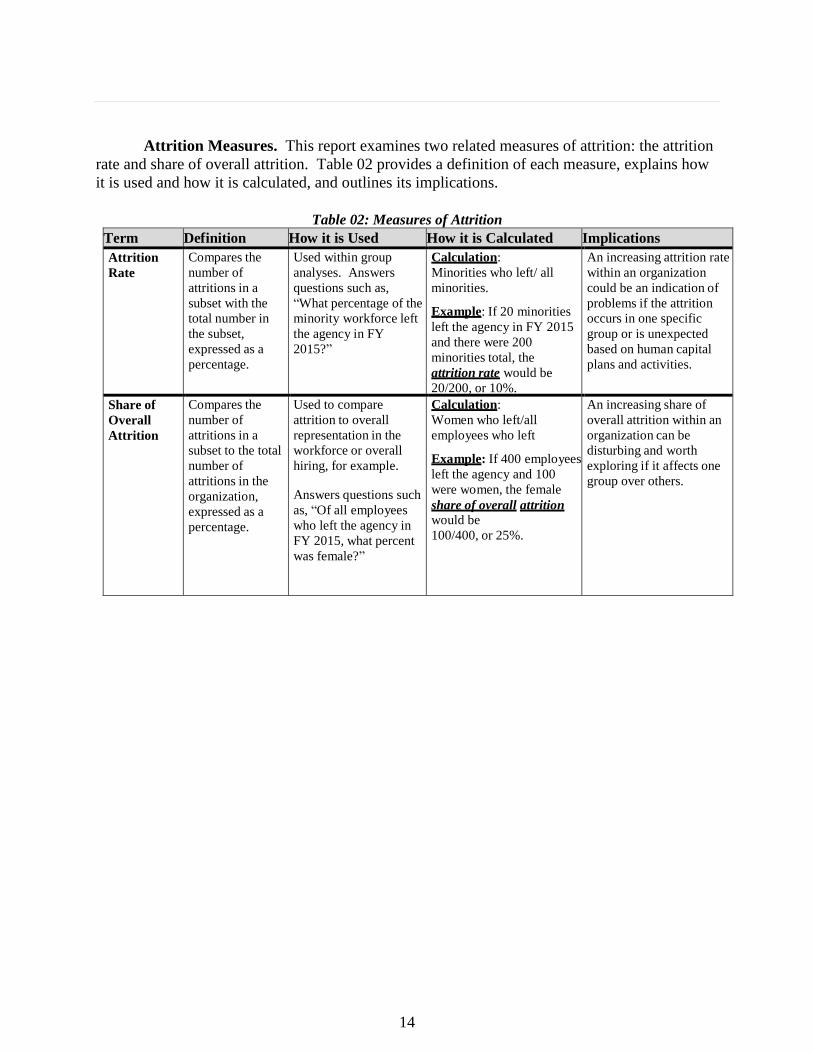
Attrition Measures. This report examines two related measures of attrition: the attrition
rate and share of overall attrition. Table 02 provides a definition of each measure, explains how
it is used and how it is calculated, and outlines its implications.
Table 02: Measures of Attrition
Term Definition How it is Used How it is Calculated Implications
Attrition
Rate Compares the
number of
attritions in a
subset with the
total number in
the subset,
expressed as a
percentage.
Used within group
analyses. Answers
questions such as,
“What percentage of the
minority workforce left
the agency in FY
2015?”
Calculation:
Minorities who left/ all
minorities.
Example: If 20 minorities
left the agency in FY 2015
and there were 200
minorities total, the
attrition rate would be
20/200, or 10%.
An increasing attrition rate
within an organization
could be an indication of
problems if the attrition
occurs in one specific
group or is unexpected
based on human capital
plans and activities.
Share of
Overall
Attrition
Compares the
number of
attritions in a
subset to the total
number of
attritions in the
organization,
expressed as a
percentage.
Used to compare
attrition to overall
representation in the
workforce or overall
hiring, for example.
Answers questions such
as, “Of all employees
who left the agency in
FY 2015, what percent
was female?”
Calculation:
Women who left/all
employees who left
Example: If 400 employees
left the agency and 100
were women, the female
share of overall attrition
would be
100/400, or 25%.
An increasing share of
overall attrition within an
organization can be
disturbing and worth
exploring if it affects one
group over others.

15
Executive Summary
The Annual Demographic Report on Hiring and Retention of Minorities, Women, and
Persons with Disabilities in the United States Intelligence Community examines workforce
demographics relating to civilian employees in all 17 elements of the IC (see Table 01). This
report also highlights diversity and inclusion initiatives and activities across the IC.
To be successful against increasingly complex global threats, the IC must employ and
develop a dynamic, agile workforce that reflects diversity in its broadest context and includes all
aspects that make individuals unique and America strong. This includes, but is not limited to,
race, culture, heritage, gender, age, religion, language skills, differing abilities, sexual orientation
and gender identity, ideas, and perspectives. Diversity is necessary to build a solid foundation
of key capabilities and capacity within the IC, and diversity is recognized as essential to
advancing the core mission objectives set forth in the National Intelligence Strategy of the
United States of America, 2014 (NIS). As stated in NIS Enterprise Objective 5: Our People, the
IC is collaboratively moving forward to “build a more agile, diverse, inclusive, and expert
workforce.”
Across the IC, initiatives and activities are strategically aligned through senior advisory
bodies such as the IC EEOD Council1 (comprising the EEO and Diversity senior principals of
each IC element). The IC EEOD Council collectively identified diversity, inclusion, and equal
employment opportunity goals and adopted a joint roadmap for action, the IC EEO and Diversity
Enterprise Strategy (2015-2020)2. The Enterprise Strategy establishes a framework to ensure
that the IC is best positioned to meet its mission-critical EEO, diversity, and inclusion
imperatives. Through the implementation of the Enterprise Strategy, the IC is positioned to fully
leverage capabilities, resources, and authorities to drive innovation and sustainability in five goal
areas:
1. Leadership and Accountability;
2. Workforce Planning;
3. Recruitment, Hiring, and Retention;
4. Career Development and Advancement; and
5. Equal Employment Opportunity and Inclusion
Diversity is also embedded within the Principles of Professional Ethics (Appendix B) for
the IC, and IC officers at all levels, from entry-level to senior executive, are expected to embrace
and promote diversity as essential to achieving the IC’s mission.
1 The IC EEOD Council was established under IC Directive 110, “as a forum for coordination,
evaluation, and improving EEOD in the IC.” The Council coordinates policy and programs throughout the IC,
establishes community-wide goals, monitors progress, and develops strategic approaches to eliminate barriers to
equal employment opportunity and diversity. 2 The IC EEO and Diversity Enterprise Strategy aligns with the NIS, the IC Chief Human Capital
Office’s Vision 2020, and Executive Order 13583, establishing a Coordinated Government-wide Initiative to
Promote Diversity and Inclusion in the Federal Workforce.

16
“The IC will foster diversity in its workforce through the recruitment, development, and
retention of minorities, women, persons with disabilities, and individuals of various
backgrounds, cultures, generations, perspectives, and ideas, among other aspects.”
—Intelligence Community Directive 110
The Partnership for Public Service recognized the IC as one of the “Best Places to Work
in the Federal Government” for the seventh year in a row, and the IC ranked second out of the 19
largest agencies surveyed. While embracing this recognition, the IC understands that it must
make more progress in its efforts to increase the representation of minorities, women, and PWD
in key positions across all mission areas.
Minorities in the IC
Five-year trends (FY 2011–2015) in hiring and attrition dynamics indicate a gradual
increase in minority representation over time. Figure 01 illustrates the gradual increase in the
minority workforce and reflects hiring and attrition trends; Unknown RNO has been included in
the figure because this group may include minorities who choose not to disclose their race or
ethnic origin. In FY 2015, overall IC minority representation in hiring increased from 23.6%
(FY 2014) to 24.9%, largely due to a 1.4% increase in Hispanic hiring.
Figure 01: Five-Year Minority Trends (FY 2011 to FY 2015)
17
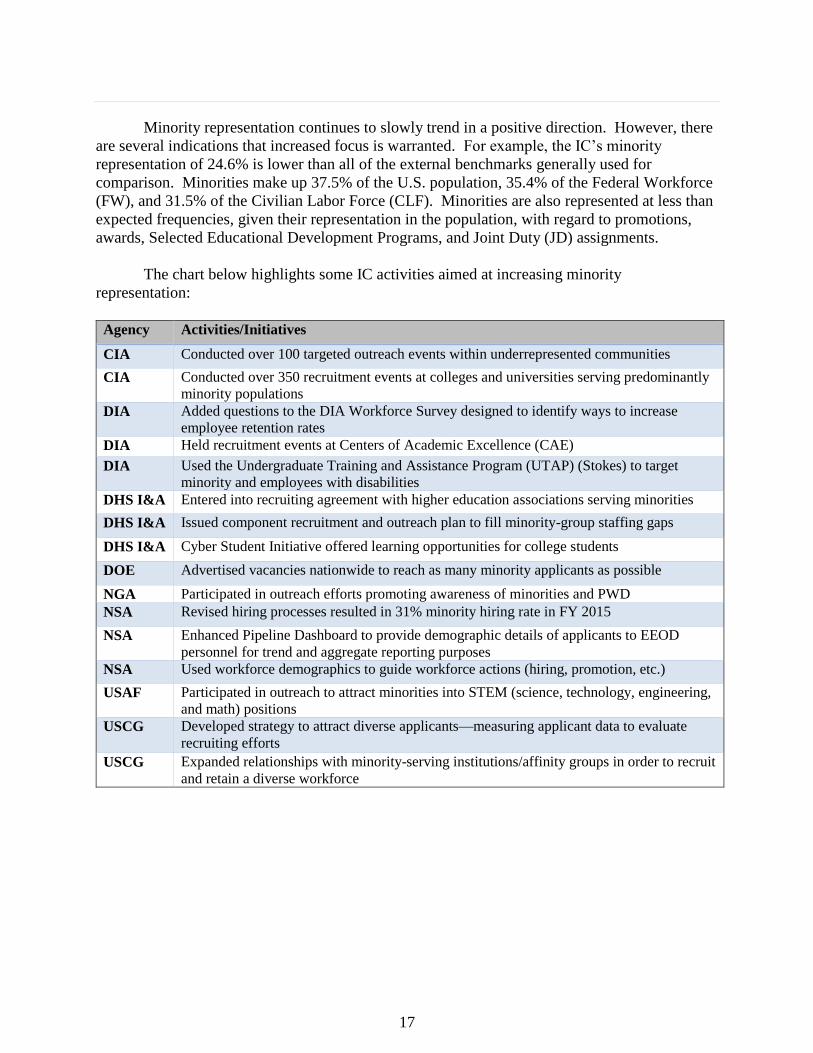
Minority representation continues to slowly trend in a positive direction. However, there
are several indications that increased focus is warranted. For example, the IC’s minority
representation of 24.6% is lower than all of the external benchmarks generally used for
comparison. Minorities make up 37.5% of the U.S. population, 35.4% of the Federal Workforce
(FW), and 31.5% of the Civilian Labor Force (CLF). Minorities are also represented at less than
expected frequencies, given their representation in the population, with regard to promotions,
awards, Selected Educational Development Programs, and Joint Duty (JD) assignments.
The chart below highlights some IC activities aimed at increasing minority
representation:
Agency Activities/Initiatives
CIA Conducted over 100 targeted outreach events within underrepresented communities
CIA Conducted over 350 recruitment events at colleges and universities serving predominantly
minority populations
DIA Added questions to the DIA Workforce Survey designed to identify ways to increase
employee retention rates
DIA Held recruitment events at Centers of Academic Excellence (CAE)
DIA Used the Undergraduate Training and Assistance Program (UTAP) (Stokes) to target
minority and employees with disabilities
DHS I&A Entered into recruiting agreement with higher education associations serving minorities
DHS I&A Issued component recruitment and outreach plan to fill minority-group staffing gaps
DHS I&A Cyber Student Initiative offered learning opportunities for college students
DOE Advertised vacancies nationwide to reach as many minority applicants as possible
NGA Participated in outreach efforts promoting awareness of minorities and PWD
NSA Revised hiring processes resulted in 31% minority hiring rate in FY 2015
NSA Enhanced Pipeline Dashboard to provide demographic details of applicants to EEOD
personnel for trend and aggregate reporting purposes
NSA Used workforce demographics to guide workforce actions (hiring, promotion, etc.)
USAF Participated in outreach to attract minorities into STEM (science, technology, engineering,
and math) positions
USCG Developed strategy to attract diverse applicants—measuring applicant data to evaluate
recruiting efforts
USCG Expanded relationships with minority-serving institutions/affinity groups in order to recruit
and retain a diverse workforce

18
Women in the IC
As shown in Figure 02, the proportion of women in the IC population remained just
below 40% over the last five years. The share of attrition for women in the IC decreased by 1.7
percentage points between FY 2014 and FY 2015, to approximately the FY 2013 level, but is
still higher than the female share of attrition in fiscal years 2011 and 2012.
Figure 02: Five-Year Gender Trends (FY 2011 to FY 2015)
While the representation of women in the IC has remained steady, hiring decreased from
42.6% to 38.2% in FY 2015. Women are well represented through GS/GG-12 but taper off in
the higher grades. If attrition can be reduced further to below the female workforce
representation rate, there is a potential pool of women in the mid-grades who can increase the
population of women in grades GS/GG-13 and above. In FY 2015, women earned 43.9% of
promotions, which is a rate above their representation in the workforce (38.5%). The same is
true of honorary awards recognizing outstanding service to the IC. Women received 46.8% of
these awards, also at a rate above their representation in the workforce.
19
The IC’s female workforce, at 38.5%, is lower than external population benchmarks such
as the U.S. population at 49.7%, FW at 43.2%, and the CLF at 46.3%. This profile is consistent
with prior years. Select IC activities pertaining to women are identified below:
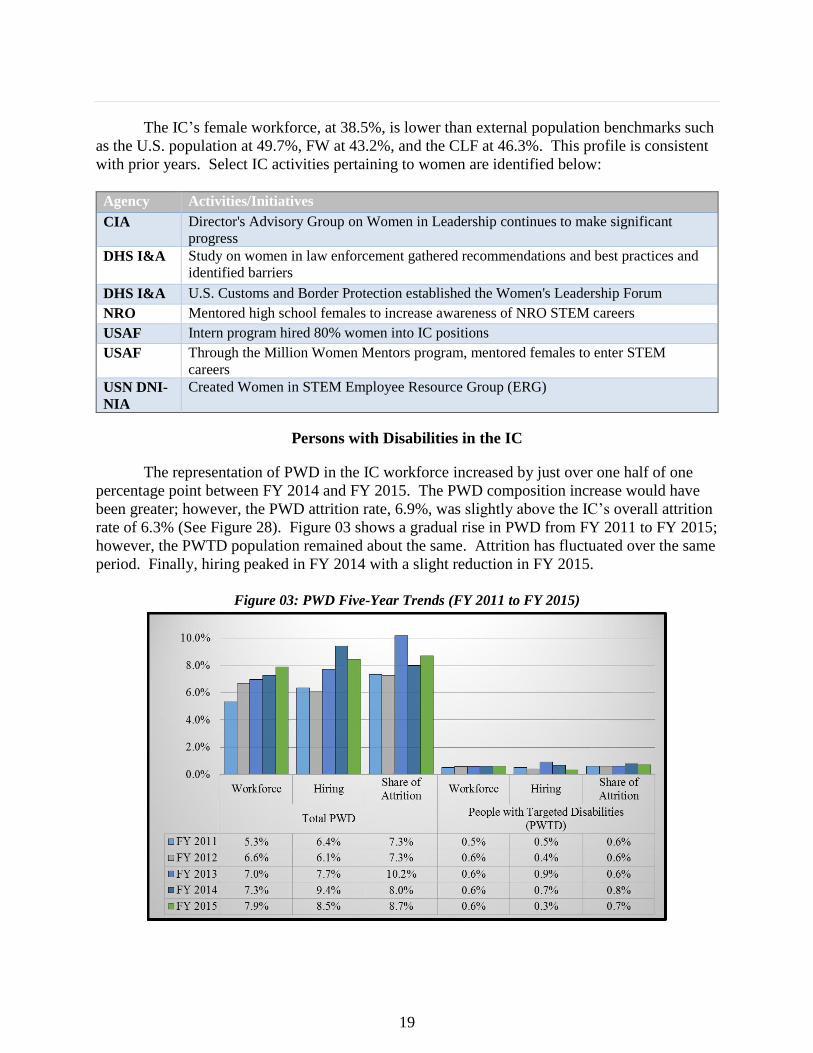
Persons with Disabilities in the IC
The representation of PWD in the IC workforce increased by just over one half of one
percentage point between FY 2014 and FY 2015. The PWD composition increase would have
been greater; however, the PWD attrition rate, 6.9%, was slightly above the IC’s overall attrition
rate of 6.3% (See Figure 28). Figure 03 shows a gradual rise in PWD from FY 2011 to FY 2015;
however, the PWTD population remained about the same. Attrition has fluctuated over the same
period. Finally, hiring peaked in FY 2014 with a slight reduction in FY 2015.
Figure 03: PWD Five-Year Trends (FY 2011 to FY 2015)
Agency Activities/Initiatives
CIA Director's Advisory Group on Women in Leadership continues to make significant
progress
DHS I&A Study on women in law enforcement gathered recommendations and best practices and
identified barriers
DHS I&A U.S. Customs and Border Protection established the Women's Leadership Forum
NRO Mentored high school females to increase awareness of NRO STEM careers
USAF Intern program hired 80% women into IC positions
USAF Through the Million Women Mentors program, mentored females to enter STEM
careers
USN DNI-
NIA
Created Women in STEM Employee Resource Group (ERG)
20
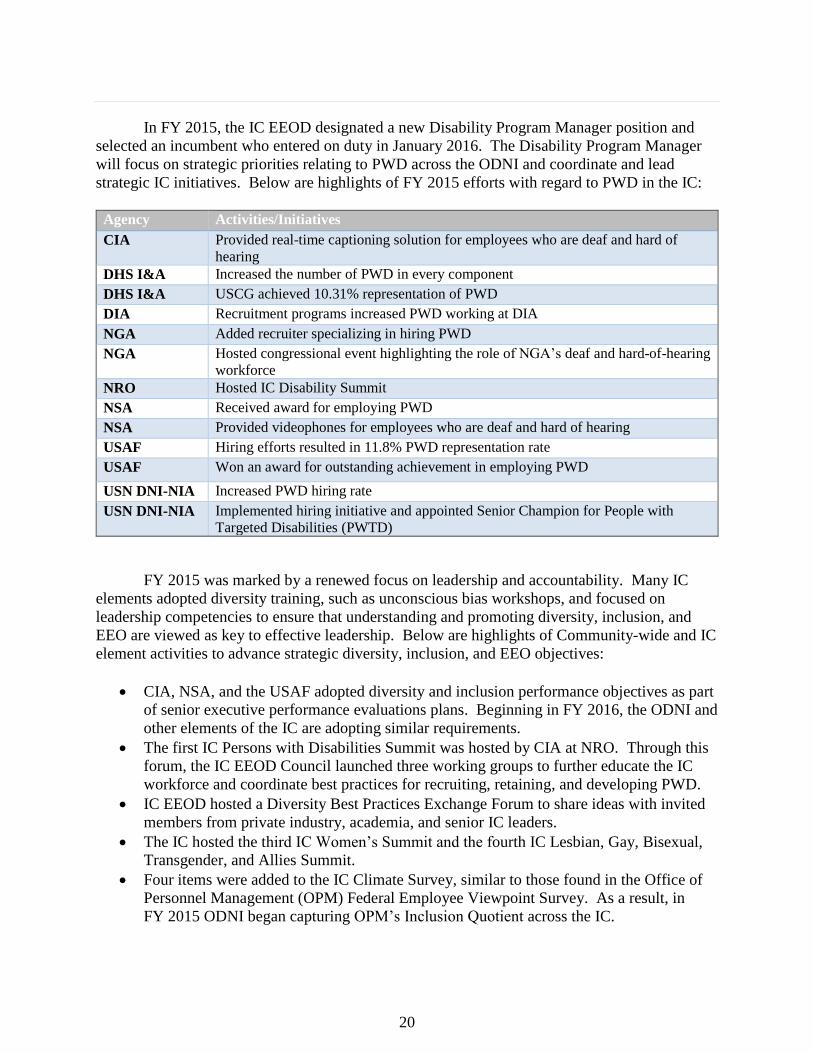
In FY 2015, the IC EEOD designated a new Disability Program Manager position and
selected an incumbent who entered on duty in January 2016. The Disability Program Manager
will focus on strategic priorities relating to PWD across the ODNI and coordinate and lead
strategic IC initiatives. Below are highlights of FY 2015 efforts with regard to PWD in the IC:
Agency Activities/Initiatives
CIA Provided real-time captioning solution for employees who are deaf and hard of
hearing
DHS I&A Increased the number of PWD in every component
DHS I&A USCG achieved 10.31% representation of PWD
DIA Recruitment programs increased PWD working at DIA
NGA Added recruiter specializing in hiring PWD
NGA Hosted congressional event highlighting the role of NGA’s deaf and hard-of-hearing
workforce
NRO Hosted IC Disability Summit
NSA Received award for employing PWD
NSA Provided videophones for employees who are deaf and hard of hearing
USAF Hiring efforts resulted in 11.8% PWD representation rate
USAF Won an award for outstanding achievement in employing PWD
USN DNI-NIA Increased PWD hiring rate
USN DNI-NIA Implemented hiring initiative and appointed Senior Champion for People with
Targeted Disabilities (PWTD)
FY 2015 was marked by a renewed focus on leadership and accountability. Many IC
elements adopted diversity training, such as unconscious bias workshops, and focused on
leadership competencies to ensure that understanding and promoting diversity, inclusion, and
EEO are viewed as key to effective leadership. Below are highlights of Community-wide and IC
element activities to advance strategic diversity, inclusion, and EEO objectives:
CIA, NSA, and the USAF adopted diversity and inclusion performance objectives as part
of senior executive performance evaluations plans. Beginning in FY 2016, the ODNI and
other elements of the IC are adopting similar requirements.
The first IC Persons with Disabilities Summit was hosted by CIA at NRO. Through this
forum, the IC EEOD Council launched three working groups to further educate the IC
workforce and coordinate best practices for recruiting, retaining, and developing PWD.
IC EEOD hosted a Diversity Best Practices Exchange Forum to share ideas with invited
members from private industry, academia, and senior IC leaders.
The IC hosted the third IC Women’s Summit and the fourth IC Lesbian, Gay, Bisexual,
Transgender, and Allies Summit.
Four items were added to the IC Climate Survey, similar to those found in the Office of
Personnel Management (OPM) Federal Employee Viewpoint Survey. As a result, in
FY 2015 ODNI began capturing OPM’s Inclusion Quotient across the IC.
21
The CIA and ODNI codeveloped No FEAR Act online training to enable IC officers to
understand their rights and remedies under the antidiscrimination and whistleblower
protection laws. The PDDNI established reciprocity across the IC to enable all officers to
gain credit if they completed this course.
IC CHCO worked to improve data collection to capture RNO, gender, FY 2015
promotion data, and disability information on participants in the IC Joint Duty program.
Future Plans: FY 2016 and Beyond
In FY 2016, IC EEOD is leading an IC-wide assessment to identify quantitative and
qualitative factors that may serve as potential barriers to the hiring, retention, and promotion of
women, minorities, and PWD in the IC. This Barrier Analysis Study follows a multidimensional
approach including research, literature and file reviews, analysis of data collected from the IC,
and input from focus groups. The findings and recommendations from this study will inform
strategic initiatives under the IC EEO and Diversity Enterprise Strategy.

22
[THIS PAGE LEFT BLANK]

23
Chapter 1. IC Best Practices in EEO, Diversity, and Inclusion
We must attract and retain a workforce that has imagination, cultural and social competence,
and the intellect to advance U.S. national intelligence. We must develop and promote a diverse
workforce whose dedication to the mission is evidenced by an inclusive culture that embraces
differences in race, color, ethnicity, national origin, gender, age, religion, language, disability,
sexual orientation, gender identity and heritage. Simultaneously, we must create an environment
in which all the aspects that make us individuals are welcome and celebrated.
--IC EEOD Enterprise Strategy (2015–2020), Foreword
The IC continues to identify and promote employment practices designed to attract,
retain, and develop a diverse workforce. While individual IC elements require unique skills to
advance their missions, collectively, the IC understands that enterprise solutions employed
across intelligence disciplines are more likely to yield the competitive advantage that diversity
brings. Within the IC, creating a culture that promotes equal employment opportunity, diversity
and inclusion is the responsibility of every intelligence officer. By employing a multiagency
approach across all 17 elements of the IC, the IC is best positioned to build and maintain the
talent and capabilities necessary to accomplish the IC’s mission. Below are highlights of
significant outreach, recruitment, and diversity activities involving multiple IC elements.
Using Technology to Increase Outreach: IC Virtual Fairs and Applicant Website
Since 2010, the IC has used technology to broaden its geographic reach and bring IC
employment opportunities to individuals in areas where in-person visits are difficult due to
limited budgets or manpower (or both). The IC’s virtual recruitment events are accessible on
PCs, laptops, tablets, and mobile phones, making IC careers accessible to a broader population.
Over 6,100 potential applicants attended the sixth annual iteration of the multiagency IC
Virtual Career Fair, held on 19 February 2015. Over 400 recruiters, hiring managers, and subject
matter experts from nine IC elements and organizations participated in the Fair: CIA, DHS, DIA,
DoE, NGA, NSA, the FBI’s National Virtual Translation Center, ODNI and the National
Counterterrorism Center (NCTC). IC EEOD professionals and volunteers from IC ERGs staffed
a virtual “Diversity and Inclusion in the IC” booth to respond to questions from nearly 800
attendees on reasonable accommodation, the IC’s hiring practices for individuals with
disabilities, and inclusion issues. New this year was an audio presentation panel discussion with
DIA and NGA employees on Cultivating an Inclusive Work Environment that was attended by
over 500 individuals.
The IC Chief Human Capital Office (CHCO) coordinated the third annual IC Student
Opportunities Virtual Info Session on 24 September 2015. More than 2,700 individuals, from 44
different states (including Hawaii), attended the fair—the highest attendance at any IC-sponsored
student event to date. Recruiters, hiring managers, and diversity representatives from CIA, DIA,
24
DHS, DoE, FBI, NASIC, NGA, and NSA staffed virtual booths to provide information on
internships, scholarships, and cooperative education programs. The Department of State was
unable to staff a booth; however, it provided an online audio presentation about its internship
programs. In addition, for the first time, the IC offered a special accommodation to facilitate
communication with people using screen readers.
IC CHCO supported development of an integrated IC Applicant Gateway website
designed using feedback from student focus groups regarding their expectations for a career site.
Www.IntelligenceCareers.gov is an IC marketplace that facilitates job exploration across the IC
and provides a common application process. This feature-rich site hosts information on the IC,
its mission, and student programs and career opportunities at participating agencies. For
example, to attract millennial applicants, the website includes videos, interactive brochures, and
a careers blog. The website also features a Job Exploration Tool that applicants can use to
search for positions matching their education, experience, and interests.
Bringing Diversity to the Mission: Employee Resource Groups
IC EEOD concentrates on developing and strengthening internal employee resource
groups across the IC. For example, in FY 2015, the IC’s Lesbian, Gay, Bisexual, Transgender,
and Ally (LGBTA) Affinity Network Group, IC Pride, has advanced diversity and inclusion
across all major IC elements. IC Pride’s unique and inclusive approach has been cited as a
federal best practice by the U.S. EEOC, was featured in the national press outlet The Daily
Beast, and was presented as a model to emulate at the 2015 Out and Equal Conference. The
contributions of IC Pride’s five Working Groups—Ally Engagement, Recruitment and
Retention, Communication and Technology, Transgender, and IC LGBTA Summit—have made
significant contributions that have led to the IC becoming an LGBTA employer of choice. A
sample of ERGs in the IC are listed in Table 03.

25
Table 03: Employee Resource Groups
Agency Network of Gay, Lesbian, Bisexual and
Transgender Officers and Allies (ANGLE)
Lesbian, Gay, Bisexual, and Transgender
Officers and Straight Allies (IMPACT)
Life Inclusion for Everyone ERG American Veteran ERG
Asian Pacific American Organization Deaf Advisory Council
Deaf Disability and Diversity (3D) Employees with Disabilities
disAbility Advisory Panel Hispanic Advisory Council
Hispanic/Latino ERG People With Disabilities ERG
New Employees ERG Next Gen ERG
Mid-Career Hires Council Near Eastern/South Asian Americans
Islamic Culture ERG African-American ERG
American Indian/Alaska Native ERG Federal Women’s Program
Women’s ERG
Reaching Minorities through Collaborative IC Recruitment Events
The IC Recruitment Committee (ICRC) meets monthly to oversee collaborative
recruitment activities, share best practices, and implement strategies that enable the IC to hire
exceptional individuals into the workforce. Chaired by the Chief of Outreach and Policy in the
IC CHCO, the Committee coordinates and promotes a number of outreach and recruiting events
aimed at increasing diversity among minorities, women, first-generation Americans, and PWD.
Each IC element also conducts recruitment and hiring initiatives focused on diversity.
The ICRC continues to design and implement a corporate recruiting strategy that aligns
with the NIS, the IC Human Capital Vision 2020, and the IC EEOD Enterprise Strategy.
Embedded in each plan is the requirement to employ a diverse workforce possessing the skills
required to assess complex global threats in an increasingly complex intelligence environment.
IC CHCO coordinates collaborative recruitment events to enhance IC elements’ abilities
to reach diverse audiences while maximizing outreach resources. Listed below are FY 2015
community recruitment events:
• American Indian Science and Engineering Society Career Fair
• Conference for Asian Pacific American Leadership Career Fair
• Federal Asian and Pacific American Council National Conference
• National Association of Asian American Professionals Career Fair
• Northern Virginia Community College Featured Employer Day
• Public Policy and International Affairs Program Career Expo
• Science, Technology, Engineering and Math Career Fair
• Society of Hispanic Professional Engineers National Conference and Career Fair
• Society of Hispanic Professional Engineers Region 4 Leadership Conference and
Career Fair
• USPAK Foundation Career and Internship Day
26
Providing Foreign Language Training: STARTALK Program
The STARTALK Program provides summer training for students and teachers of critical
foreign languages. Announced by the President in 2006, the program is the ODNI-sponsored
component of the National Security Language Initiative (NSLI). Since holding the first student
summer programs in 2007, the program has grown, steadily reaching more students and teachers.
The STARTALK program seeks to expand and improve the teaching and learning of
strategically important world languages not widely taught in the United States. Other programs
under the NSLI umbrella include the Title VI/Fulbright Hays programs of the U.S. Department
of Education, the National Security Education Program (NSEP) of the DoD, and study abroad
and exchange programs of the U.S. Department of State, including the popular NSLI for Youth
program. Since its inception, the program has reached approximately 55,000 participants with
program offerings in all 50 states.
The Foreign Language Program Office of IC CHCO office oversees the STARTALK
program, of which NSA is the service provider, and the University of Maryland’s National
Foreign Language Center (NFLC) is the primary contractor. Their shared vision is to boost
national capacity in languages critical to national security by instructing students in critical
languages at all levels, as well as certifying teachers of these languages. STARTALK also
ensures that students and teachers from diverse backgrounds have access to educational
opportunities.
In July 2015, the principal stakeholders of the STARTALK Program agreed to form a
new STARTALK Steering Committee as a key mechanism for developing the program. Held in
September 2015, the initial meeting of this NSA-led committee discussed proposals to improve
the marketing of STARTALK; ways to collaborate more closely with academic institutions at the
federal, state, and local levels; and ways to strengthen institutional support for STARTALK’s
sub-programs and initiatives.
In 2015, 138 STARTALK programs were delivered in 41 states and Washington, DC—
74 student programs, 31 teacher programs, and 23 combination student-teacher programs.
Among the nearly 6,000 program participants, about 975 were foreign language teachers
engaged in education and training covering 11 foreign languages: Arabic, Chinese, Hindi,
Korean, Persian-Dari, Persian-Farsi, Portuguese, Russian, Swahili, Turkish, and Urdu. For the
first time during summer of 2015, STARTALK offered classes on the Korean language through
4 student programs and 10 teacher programs.
Celebrating its 10th anniversary in 2016, STARTALK has received favorable reviews
from the U.S. language learning community as a high-quality program with the potential to
significantly increase learning and instruction in critical languages. In addition, the course
offerings have led to increased collaboration and working relationships between the IC and
heritage communities around the country. These relationships should enhance the pool of
language-qualified and culturally proficient personnel for recruitment into IC and other national
security positions in the future.
27
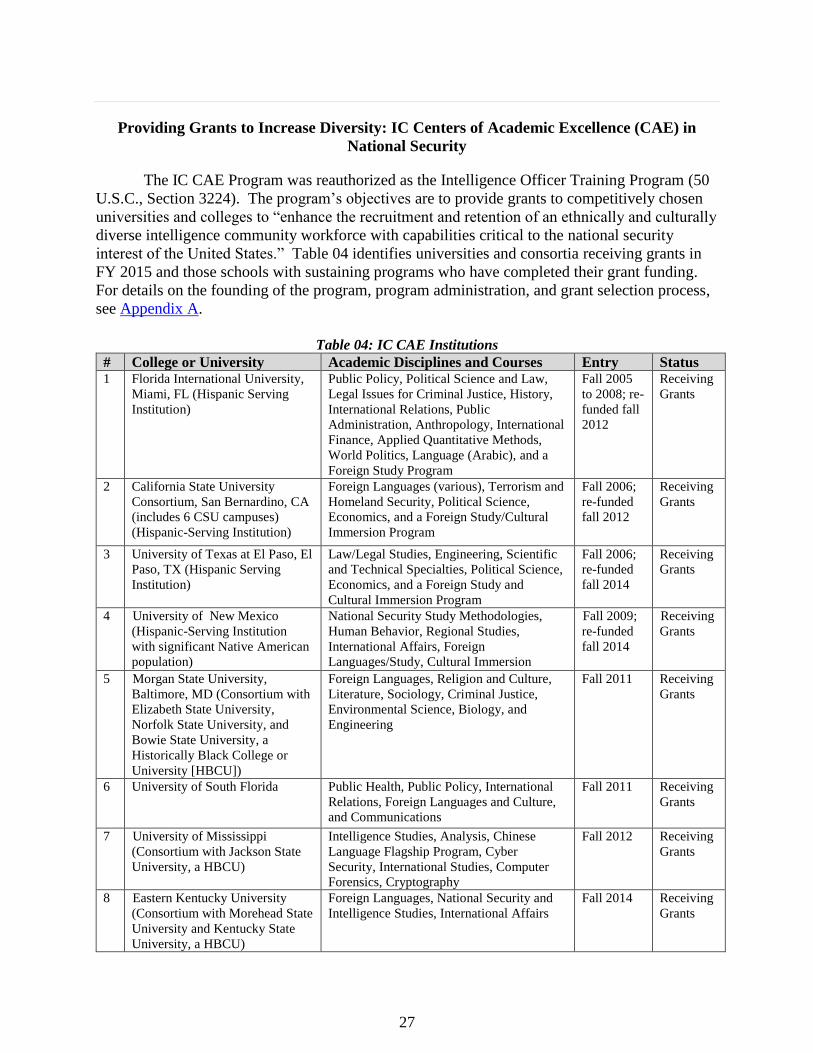
Providing Grants to Increase Diversity: IC Centers of Academic Excellence (CAE) in
National Security
The IC CAE Program was reauthorized as the Intelligence Officer Training Program (50
U.S.C., Section 3224). The program’s objectives are to provide grants to competitively chosen
universities and colleges to “enhance the recruitment and retention of an ethnically and culturally
diverse intelligence community workforce with capabilities critical to the national security
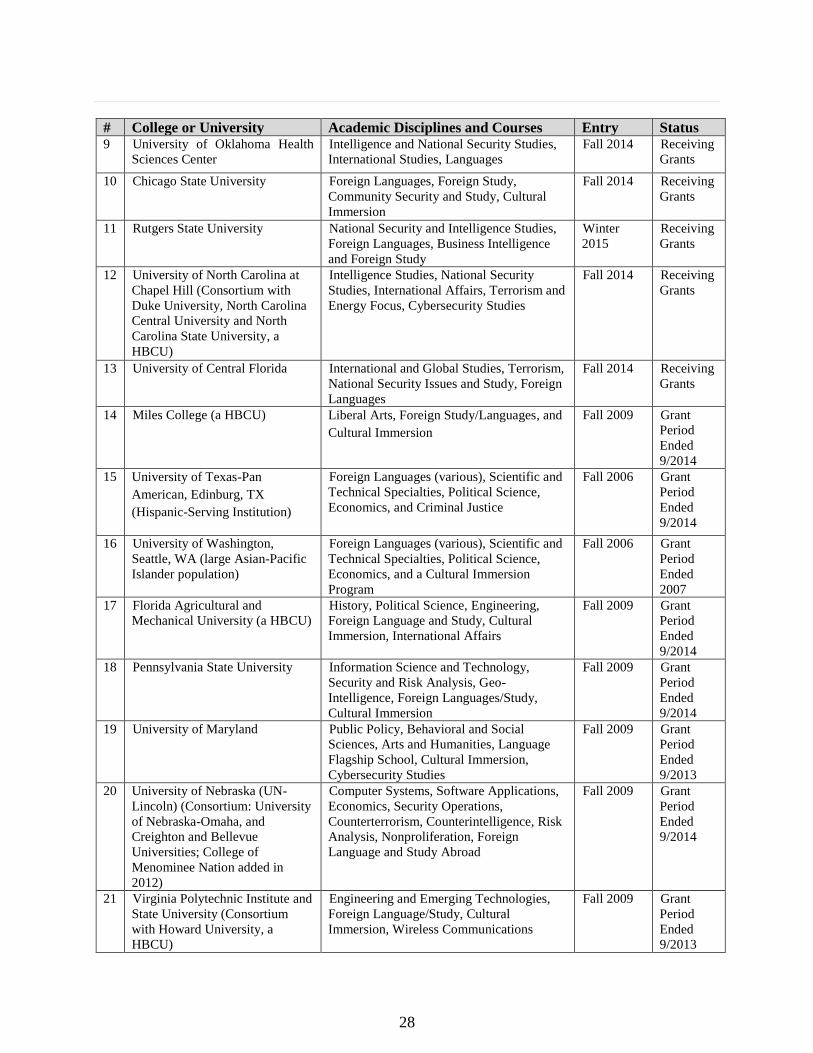
interest of the United States.” Table 04 identifies universities and consortia receiving grants in
FY 2015 and those schools with sustaining programs who have completed their grant funding.
For details on the founding of the program, program administration, and grant selection process,
see Appendix A.
Table 04: IC CAE Institutions
# College or University Academic Disciplines and Courses Entry Status 1 Florida International University,
Miami, FL (Hispanic Serving
Institution)
Public Policy, Political Science and Law,
Legal Issues for Criminal Justice, History,
International Relations, Public
Administration, Anthropology, International
Finance, Applied Quantitative Methods,
World Politics, Language (Arabic), and a
Foreign Study Program
Fall 2005
to 2008; re-
funded fall
2012
Receiving
Grants
2 California State University
Consortium, San Bernardino, CA
(includes 6 CSU campuses)
(Hispanic-Serving Institution)
Foreign Languages (various), Terrorism and
Homeland Security, Political Science,
Economics, and a Foreign Study/Cultural
Immersion Program
Fall 2006;
re-funded
fall 2012
Receiving
Grants
3 University of Texas at El Paso, El
Paso, TX (Hispanic Serving
Institution)
Law/Legal Studies, Engineering, Scientific
and Technical Specialties, Political Science,
Economics, and a Foreign Study and
Cultural Immersion Program
Fall 2006;
re-funded
fall 2014
Receiving
Grants
4 University of New Mexico
(Hispanic-Serving Institution
with significant Native American
population)
National Security Study Methodologies,
Human Behavior, Regional Studies,
International Affairs, Foreign
Languages/Study, Cultural Immersion
Fall 2009;
re-funded
fall 2014
Receiving
Grants
5 Morgan State University,
Baltimore, MD (Consortium with
Elizabeth State University,
Norfolk State University, and
Bowie State University, a
Historically Black College or
University [HBCU])
Foreign Languages, Religion and Culture,
Literature, Sociology, Criminal Justice,
Environmental Science, Biology, and
Engineering
Fall 2011 Receiving
Grants
6 University of South Florida Public Health, Public Policy, International
Relations, Foreign Languages and Culture,
and Communications
Fall 2011 Receiving
Grants
7 University of Mississippi
(Consortium with Jackson State
University, a HBCU)
Intelligence Studies, Analysis, Chinese
Language Flagship Program, Cyber
Security, International Studies, Computer
Forensics, Cryptography
Fall 2012 Receiving
Grants
8 Eastern Kentucky University
(Consortium with Morehead State
University and Kentucky State
University, a HBCU)
Foreign Languages, National Security and
Intelligence Studies, International Affairs
Fall 2014 Receiving
Grants
28
# College or University Academic Disciplines and Courses Entry Status 9 University of Oklahoma Health
Sciences Center
Intelligence and National Security Studies,
International Studies, Languages
Fall 2014 Receiving
Grants
10 Chicago State University Foreign Languages, Foreign Study,
Community Security and Study, Cultural
Immersion
Fall 2014 Receiving
Grants
11 Rutgers State University National Security and Intelligence Studies,
Foreign Languages, Business Intelligence
and Foreign Study
Winter
2015
Receiving
Grants
12 University of North Carolina at
Chapel Hill (Consortium with
Duke University, North Carolina
Central University and North
Carolina State University, a
HBCU)
Intelligence Studies, National Security
Studies, International Affairs, Terrorism and
Energy Focus, Cybersecurity Studies
Fall 2014 Receiving
Grants
13 University of Central Florida International and Global Studies, Terrorism,
National Security Issues and Study, Foreign
Languages
Fall 2014 Receiving
Grants
14 Miles College (a HBCU) Liberal Arts, Foreign Study/Languages, and
Cultural Immersion
Fall 2009 Grant
Period
Ended
9/2014
15 University of Texas-Pan
American, Edinburg, TX
(Hispanic-Serving Institution)
Foreign Languages (various), Scientific and
Technical Specialties, Political Science,
Economics, and Criminal Justice
Fall 2006 Grant
Period
Ended
9/2014
16 University of Washington,
Seattle, WA (large Asian-Pacific
Islander population)
Foreign Languages (various), Scientific and
Technical Specialties, Political Science,
Economics, and a Cultural Immersion
Program
Fall 2006 Grant
Period
Ended
2007
17 Florida Agricultural and
Mechanical University (a HBCU)
History, Political Science, Engineering,
Foreign Language and Study, Cultural
Immersion, International Affairs
Fall 2009 Grant
Period
Ended
9/2014
18 Pennsylvania State University Information Science and Technology,
Security and Risk Analysis, Geo-
Intelligence, Foreign Languages/Study,
Cultural Immersion
Fall 2009 Grant
Period
Ended
9/2014
19 University of Maryland Public Policy, Behavioral and Social
Sciences, Arts and Humanities, Language
Flagship School, Cultural Immersion,
Cybersecurity Studies
Fall 2009 Grant
Period
Ended
9/2013
20 University of Nebraska (UN-
Lincoln) (Consortium: University
of Nebraska-Omaha, and
Creighton and Bellevue
Universities; College of
Menominee Nation added in
2012)
Computer Systems, Software Applications,
Economics, Security Operations,
Counterterrorism, Counterintelligence, Risk
Analysis, Nonproliferation, Foreign
Language and Study Abroad
Fall 2009 Grant
Period
Ended
9/2014
21 Virginia Polytechnic Institute and
State University (Consortium
with Howard University, a
HBCU)
Engineering and Emerging Technologies,
Foreign Language/Study, Cultural
Immersion, Wireless Communications
Fall 2009 Grant
Period
Ended
9/2013

29
A key component of the IC CAE Program is critical language development and cultural
immersion through study abroad initiatives and foreign language immersion. Equally important
is the growth of intelligence-related curricula in support of the STEM disciplines. Collaboration
with scientific research centers and laboratories in the IC, the DoD, and corporations supporting
the defense community provides real intelligence challenges for participating students and access
to academic resources for IC employees.
Providing Opportunities for Service Members: IC Wounded Warrior Program
IC elements recruit and provide internship opportunities for wounded, ill, and injured
service members. Opportunities are provided through internship fairs in the Washington, DC,
metropolitan area, relationships with military medical treatment facilities, and DoD- and IC-
hosted events via the IC Wounded Warrior Program (ICWWP). The ICWWP helps wounded
warriors rehabilitate by providing special internship opportunities in collaboration with the DoD
Operation Warfighter Program. The IC sponsors internship fairs at which wounded warriors are
offered internship opportunities, career counseling, and when possible, employment within the
IC. The DIA administers the ICWWP as a service of common concern with oversight and
guidance from the ODNI. In FY 2015, the ICWWP onboarded over 100 interns, 17% of whom
successfully transitioned into full-time employees. During this period, Wounded Warrior interns
participated in opportunities with 12 IC elements.
Undergraduate Scholar Program: Stokes
The Undergraduate Scholar program (Stokes) employs high-performing high school
seniors as full-time employees who receive all the benefits of a federal government employee,
including salary, insurance, leave accrual, and retirement plans. The Stokes program, named for
Congressman Carl Stokes (Democrat-Ohio), was authorized under 50 U.S.C. 3614. Once the
students begin attending an undergraduate college or university, their responsibility is to focus on
a field of study critical to an agency’s mission and become full contributors to the mission upon
graduation.
Stokes candidates must demonstrate financial need and be high school seniors or college
freshmen at the time of application. The students selected begin working as they are cleared
during the summer before their freshman or sophomore year in college. The students' permanent
duty stations are their school locations, and nonlocal students travel to the Washington, DC, area
during their summer breaks from school to work for an IC element.
Four IC elements participate in the Stokes program: NSA, CIA, DIA, and NGA. NSA,
participating since 1987, calls their Stokes program the Undergraduate Training Program (UTP).
Similar programs known by other names are authorized for the CIA and the DIA. CIA’s
program is called the Undergraduate Scholarship Program and was authorized in 1987 under 50
U.S.C. 3510 (formerly 50 U.S.C. 403j; as amended by the 1987 Intelligence Authorization Act).
DIA has participated in the Stokes program since 2006, calling it the Undergraduate Training
and Assistance Program (UTAP) which was authorized under 10 U.S.C.1623 (formerly 10
U.S.C. 1608). Although not legislatively mandated, the NGA developed its own version of the
30
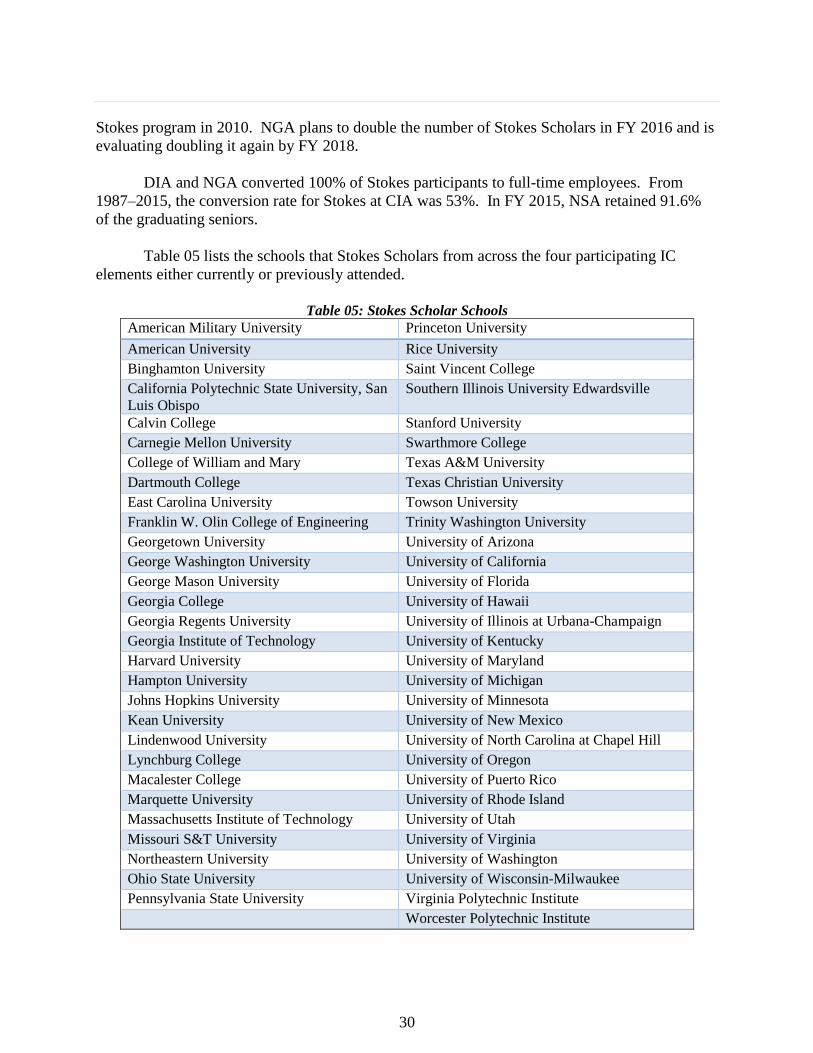
Stokes program in 2010. NGA plans to double the number of Stokes Scholars in FY 2016 and is
evaluating doubling it again by FY 2018.
DIA and NGA converted 100% of Stokes participants to full-time employees. From
1987–2015, the conversion rate for Stokes at CIA was 53%. In FY 2015, NSA retained 91.6%
of the graduating seniors.
Table 05 lists the schools that Stokes Scholars from across the four participating IC
elements either currently or previously attended.
Table 05: Stokes Scholar Schools
American Military University Princeton University
American University Rice University
Binghamton University Saint Vincent College
California Polytechnic State University, San
Luis Obispo
Southern Illinois University Edwardsville
Calvin College Stanford University
Carnegie Mellon University Swarthmore College
College of William and Mary Texas A&M University
Dartmouth College Texas Christian University
East Carolina University Towson University
Franklin W. Olin College of Engineering Trinity Washington University
Georgetown University University of Arizona
George Washington University University of California
George Mason University University of Florida
Georgia College University of Hawaii
Georgia Regents University University of Illinois at Urbana-Champaign
Georgia Institute of Technology University of Kentucky
Harvard University University of Maryland
Hampton University University of Michigan
Johns Hopkins University University of Minnesota
Kean University University of New Mexico
Lindenwood University University of North Carolina at Chapel Hill
Lynchburg College University of Oregon
Macalester College University of Puerto Rico
Marquette University University of Rhode Island
Massachusetts Institute of Technology University of Utah
Missouri S&T University University of Virginia
Northeastern University University of Washington
Ohio State University University of Wisconsin-Milwaukee
Pennsylvania State University Virginia Polytechnic Institute
Worcester Polytechnic Institute
31
Each of the four agencies market the Stokes program differently. For example, the CIA
has developed a High School Ambassador Program, consisting of 32 high schools across the
United States, and promotes the scholarship to various professional organizations, for example,
the National Society of High School Scholars, First Bytes Computer Camp for Girls, and Women
in Computer Science. These organizations advertise CIA and CIA’s student programs in their
event programs. CIA’s regional recruiters promote the Stokes program when visiting various
colleges and universities.
DIA markets its Stokes program at numerous colleges and universities, including HBCUs
and Hispanic-Serving Institutions, such as Miles College and California State University at
Fullerton. Recruiters conduct information sessions and distribute informational brochures to
educate and recruit potential candidates for the Stokes program. In addition, DIA promotes the
Stokes program to several professional organizations that focus on diversity, such as the
American Islamic Congress, Society of Hispanic Professional Engineers, Blacks in Government,
and the Atlanta University Center Consortium.
NSA markets the Stokes program through direct mailings to 3,027 high schools
throughout the United States and by posting information on the nsa.gov website. NSA also
focuses its efforts primarily on minority students with SAT scores of 1600 or better and an
intended major in Computer Science, Chemical Engineering, or Electrical Engineering. Through
these efforts, 83% of the students in the FY 2015 NSA Stokes program were minorities.
Finally, NGA markets the Stokes program at all colleges and universities attended by
NGA recruiters. NGA’s Student Program brochure has a section devoted to the Stokes program.
Stokes is also marketed on the NGA website and the IntelligenceCareers.gov website. All
students who apply for an NGA internship are directed to read the qualifying and benefit
information regarding the Stokes program since they have the option to be considered for the
Stokes program, in addition to their application for an internship. NGA also markets Stokes
annually at the IC Student Intern Career Fair.
The Stokes Program has maintained excellent minority representation for the IC since
FY 2005. In FY 2015, 70% of the IC Stokes participants were minorities. For more information
on Stokes participants by RNO see Table 10.
Awards to Recruit and Train to Develop Intelligence Skills: PRISP
The Pat Roberts Intelligence Scholars Program (PRISP) was established by Congress in
2004 as a pilot program to recruit and train analysts and linguists. The goal of the programs is to
increase the capacity and capability of the IC workforce in intelligence skills that may be in short
supply now or in the near future.
PRISP was made permanent in October 2010 with the passage of the FY 2010
Intelligence Authorization Act, which expanded the eligible population to include all mission-
critical occupations, most notably those intelligence officers working in science, technology,
engineering, and mathematics.
32
PRISP funds may be used to provide hiring bonuses and reimbursement of prior
educational expenses, and to pay for future education and training. The PRISP service obligation
is to the IC, not the initial employing agency. Completion of the service obligation is tracked by
the IC PRISP program manager even for awardees who transfer to other IC elements. The
program has a very low attrition rate. Through a competitive process conducted by each of the
participating IC elements, minorities in the IC received 27.8% of the awards in FY 2015.
Measuring the Diversity Pipeline: IC Civilian Joint Duty Program
The IC Civilian Joint Duty Program Office was established pursuant to the Intelligence
Reform and Terrorism Prevention Act’s requirement that the DNI shall “prescribe mechanisms
to facilitate the rotation of personnel of the intelligence community through various elements of
the intelligence community…” Joint duty rotations offer civilian employees professional
opportunities to broaden and enrich their careers by experiencing the scope of the IC beyond
their home elements. Upon successful completion of these rotations, home IC elements benefit
from the expanded professional experiences and networking contacts that returning employees
bring with them—helping our community evolve into a true “integrated intelligence enterprise.”
Participation in the program is encouraged for those eligible. Moreover, receiving credit for a
joint duty qualifying experience is required for promotion to senior levels within the IC.
The JD experience helps develop IC officers who value and foster collaboration, along
with leaders who embody the definition of teamwork throughout their careers. The program was
expanded in 2013 to include civilians in grades 11 and 12, giving mid-level professionals an
opportunity to obtain a joint duty qualifying experience. In FY 2015, there were increased
efforts to promote joint duty opportunities through several joint duty fairs at IC elements, and
metrics were also put in place to effectively measure program effectiveness. Metrics with
respect to diversity for those with joint duty credit are now included with this year’s annual
report. In addition, the DNI issued a new Intelligence Community Policy Guidance (ICPG
660.1) on 24 July 2015 to improve program management, streamline supporting processes,
ensure equal opportunity, and remove barriers to participation.
Bridging Language and Cultural Gaps: IC Heritage Community Liaison Council
The IC Heritage Recruitment and Retention Strategy, an IC CHCO and IC EEOD joint
initiative, focuses on recruiting, hiring, and retaining first and second generation Americans to
bridge critical foreign language and cultural understanding gaps. The strategy also addresses
mission-critical requirements for immediate and long-term national security needs.
To build and maintain relationships with key external groups, the IC CHCO established
the IC Heritage Community Liaison Council in 2008. This council strengthens relationships
between the IC and heritage community organizations, gathers input on the recruitment and
retention of heritage Americans, and addresses heritage community concerns. Council members
met in October 2014 and May 2015 representing a number of heritage organizations, which are
listed in Table 06.
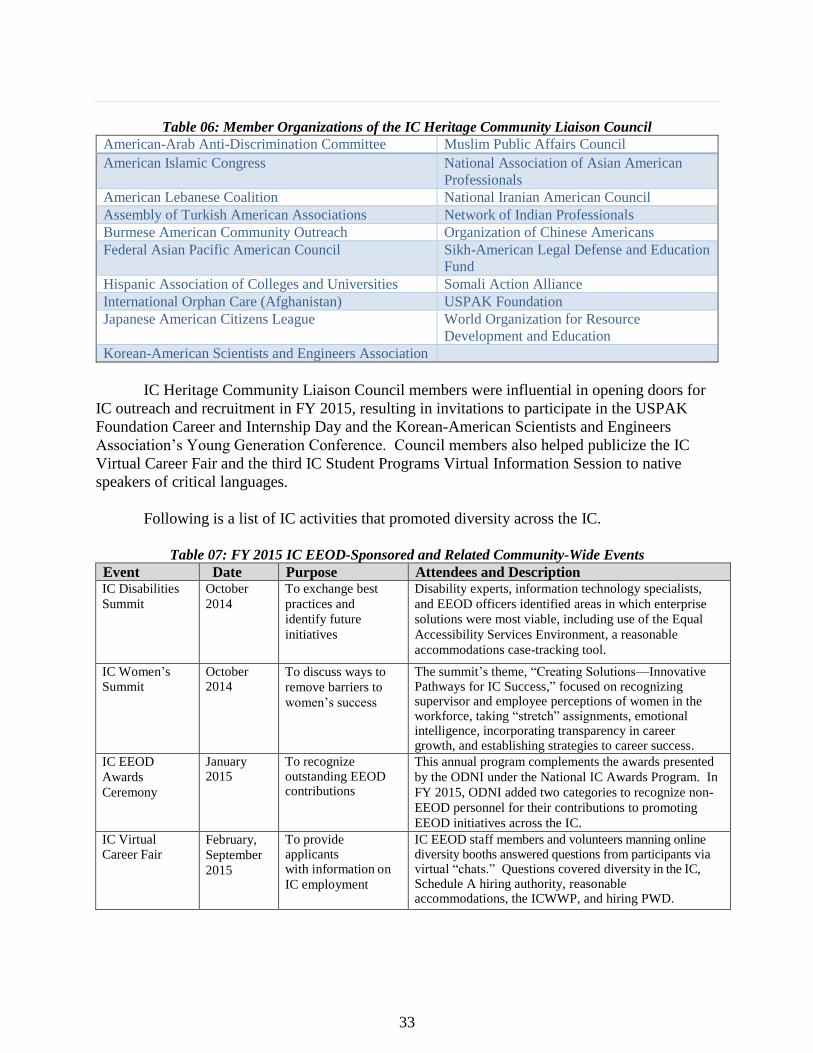
33
Table 06: Member Organizations of the IC Heritage Community Liaison Council
American-Arab Anti-Discrimination Committee Muslim Public Affairs Council
American Islamic Congress National Association of Asian American
Professionals
American Lebanese Coalition National Iranian American Council
Assembly of Turkish American Associations Network of Indian Professionals
Burmese American Community Outreach Organization of Chinese Americans
Federal Asian Pacific American Council Sikh-American Legal Defense and Education
Fund
Hispanic Association of Colleges and Universities Somali Action Alliance
International Orphan Care (Afghanistan) USPAK Foundation
Japanese American Citizens League World Organization for Resource
Development and Education
Korean-American Scientists and Engineers Association
IC Heritage Community Liaison Council members were influential in opening doors for
IC outreach and recruitment in FY 2015, resulting in invitations to participate in the USPAK
Foundation Career and Internship Day and the Korean-American Scientists and Engineers
Association’s Young Generation Conference. Council members also helped publicize the IC
Virtual Career Fair and the third IC Student Programs Virtual Information Session to native
speakers of critical languages.
Following is a list of IC activities that promoted diversity across the IC.
Table 07: FY 2015 IC EEOD-Sponsored and Related Community-Wide Events
Event Date Purpose Attendees and Description IC Disabilities
Summit
October
2014
To exchange best
practices and
identify future
initiatives
Disability experts, information technology specialists,
and EEOD officers identified areas in which enterprise
solutions were most viable, including use of the Equal
Accessibility Services Environment, a reasonable
accommodations case-tracking tool.
IC Women’s Summit
October 2014
To discuss ways to
remove barriers to
women’s success
The summit’s theme, “Creating Solutions—Innovative Pathways for IC Success,” focused on recognizing supervisor and employee perceptions of women in the workforce, taking “stretch” assignments, emotional intelligence, incorporating transparency in career growth, and establishing strategies to career success.
IC EEOD
Awards
Ceremony
January 2015
To recognize outstanding EEOD contributions
This annual program complements the awards presented
by the ODNI under the National IC Awards Program. In
FY 2015, ODNI added two categories to recognize non-
EEOD personnel for their contributions to promoting
EEOD initiatives across the IC.
IC Virtual Career Fair
February,
September
2015
To provide applicants with information on
IC employment
IC EEOD staff members and volunteers manning online diversity booths answered questions from participants via virtual “chats.” Questions covered diversity in the IC, Schedule A hiring authority, reasonable accommodations, the ICWWP, and hiring PWD.
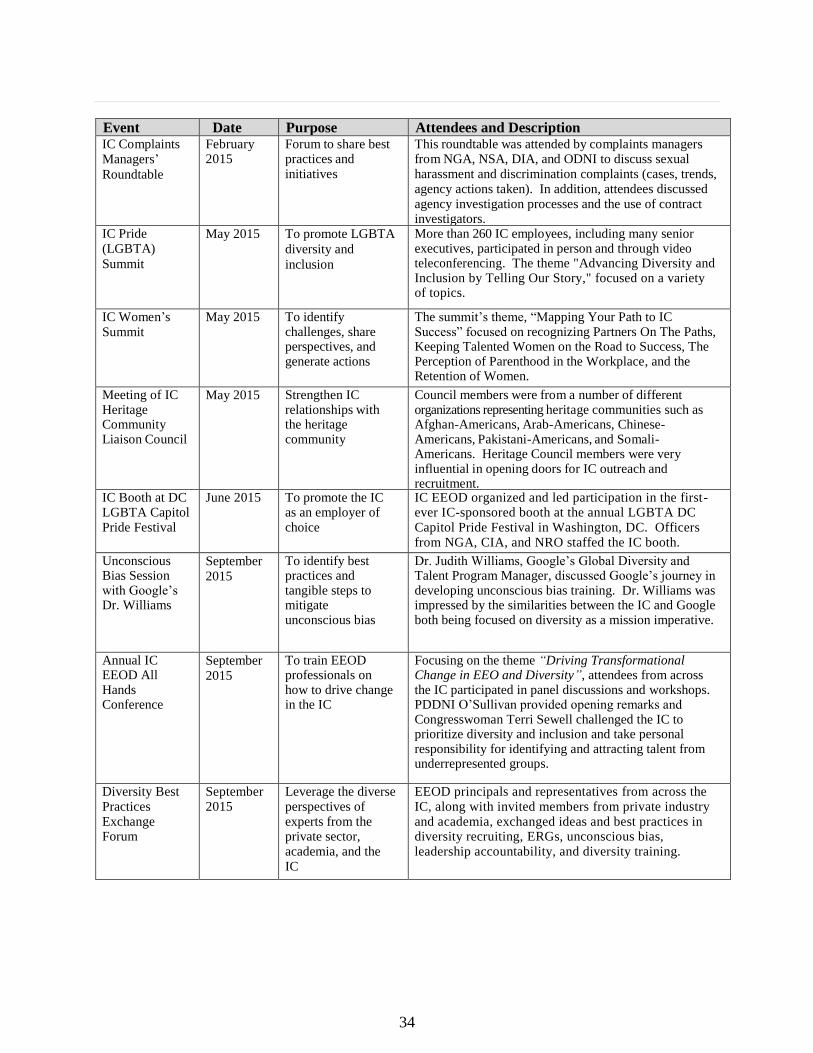
34
Event Date Purpose Attendees and Description IC Complaints Managers’
Roundtable
February 2015
Forum to share best practices and initiatives
This roundtable was attended by complaints managers from NGA, NSA, DIA, and ODNI to discuss sexual harassment and discrimination complaints (cases, trends, agency actions taken). In addition, attendees discussed agency investigation processes and the use of contract investigators.
IC Pride (LGBTA)
Summit
May 2015 To promote LGBTA
diversity and
inclusion
More than 260 IC employees, including many senior executives, participated in person and through video teleconferencing. The theme "Advancing Diversity and Inclusion by Telling Our Story," focused on a variety of topics.
IC Women’s Summit
May 2015 To identify challenges, share perspectives, and generate actions
The summit’s theme, “Mapping Your Path to IC Success” focused on recognizing Partners On The Paths, Keeping Talented Women on the Road to Success, The Perception of Parenthood in the Workplace, and the Retention of Women.
Meeting of IC Heritage Community Liaison Council
May 2015
Strengthen IC relationships with the heritage community
Council members were from a number of different organizations representing heritage communities such as Afghan-Americans, Arab-Americans, Chinese-Americans, Pakistani-Americans, and Somali-Americans. Heritage Council members were very influential in opening doors for IC outreach and recruitment. IC Booth at DC
LGBTA Capitol Pride Festival
June 2015 To promote the IC as an employer of choice
IC EEOD organized and led participation in the first-ever IC-sponsored booth at the annual LGBTA DC Capitol Pride Festival in Washington, DC. Officers from NGA, CIA, and NRO staffed the IC booth.
Unconscious Bias Session with Google’s Dr. Williams
September
2015
To identify best practices and tangible steps to mitigate unconscious bias
Dr. Judith Williams, Google’s Global Diversity and Talent Program Manager, discussed Google’s journey in developing unconscious bias training. Dr. Williams was impressed by the similarities between the IC and Google both being focused on diversity as a mission imperative.
Annual IC EEOD All Hands Conference
September
2015
To train EEOD professionals on how to drive change in the IC
Focusing on the theme “Driving Transformational Change in EEO and Diversity”, attendees from across the IC participated in panel discussions and workshops. PDDNI O’Sullivan provided opening remarks and Congresswoman Terri Sewell challenged the IC to prioritize diversity and inclusion and take personal responsibility for identifying and attracting talent from underrepresented groups.
Diversity Best Practices Exchange Forum
September 2015
Leverage the diverse perspectives of experts from the private sector, academia, and the IC
EEOD principals and representatives from across the IC, along with invited members from private industry and academia, exchanged ideas and best practices in diversity recruiting, ERGs, unconscious bias, leadership accountability, and diversity training.
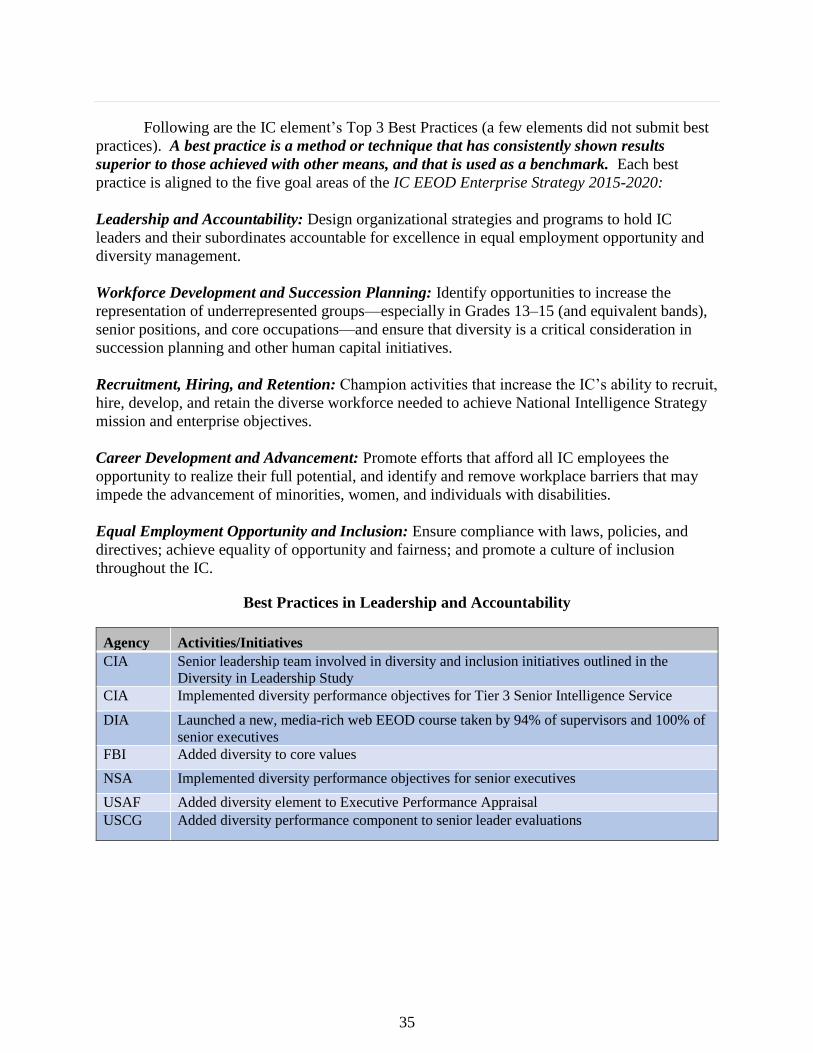
35
Following are the IC element’s Top 3 Best Practices (a few elements did not submit best
practices). A best practice is a method or technique that has consistently shown results
superior to those achieved with other means, and that is used as a benchmark. Each best
practice is aligned to the five goal areas of the IC EEOD Enterprise Strategy 2015-2020:
Leadership and Accountability: Design organizational strategies and programs to hold IC
leaders and their subordinates accountable for excellence in equal employment opportunity and
diversity management.
Workforce Development and Succession Planning: Identify opportunities to increase the
representation of underrepresented groups—especially in Grades 13–15 (and equivalent bands),
senior positions, and core occupations—and ensure that diversity is a critical consideration in
succession planning and other human capital initiatives.
Recruitment, Hiring, and Retention: Champion activities that increase the IC’s ability to recruit,
hire, develop, and retain the diverse workforce needed to achieve National Intelligence Strategy
mission and enterprise objectives.
Career Development and Advancement: Promote efforts that afford all IC employees the
opportunity to realize their full potential, and identify and remove workplace barriers that may
impede the advancement of minorities, women, and individuals with disabilities.
Equal Employment Opportunity and Inclusion: Ensure compliance with laws, policies, and
directives; achieve equality of opportunity and fairness; and promote a culture of inclusion
throughout the IC.
Best Practices in Leadership and Accountability
Agency Activities/Initiatives
CIA Senior leadership team involved in diversity and inclusion initiatives outlined in the
Diversity in Leadership Study
CIA Implemented diversity performance objectives for Tier 3 Senior Intelligence Service
DIA Launched a new, media-rich web EEOD course taken by 94% of supervisors and 100% of
senior executives
FBI Added diversity to core values
NSA Implemented diversity performance objectives for senior executives
USAF Added diversity element to Executive Performance Appraisal
USCG Added diversity performance component to senior leader evaluations
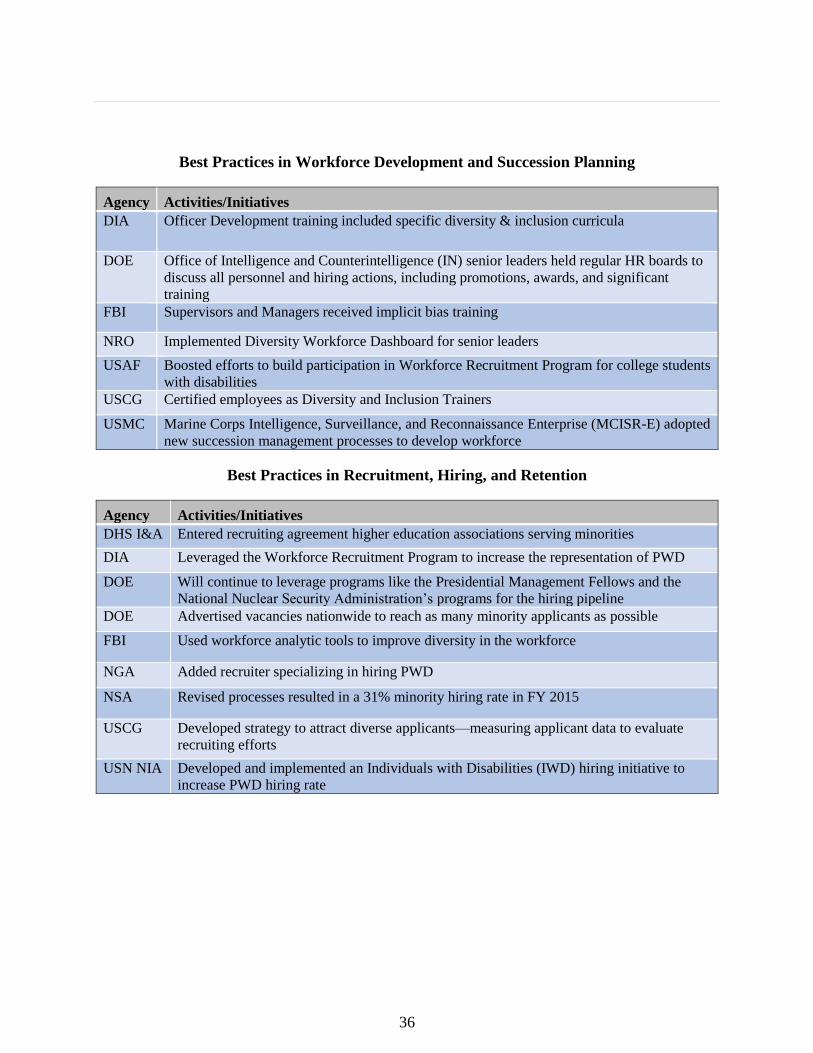
36
Best Practices in Workforce Development and Succession Planning
Agency Activities/Initiatives
DIA Officer Development training included specific diversity & inclusion curricula
DOE Office of Intelligence and Counterintelligence (IN) senior leaders held regular HR boards to
discuss all personnel and hiring actions, including promotions, awards, and significant
training
FBI Supervisors and Managers received implicit bias training
NRO Implemented Diversity Workforce Dashboard for senior leaders
USAF Boosted efforts to build participation in Workforce Recruitment Program for college students
with disabilities
USCG Certified employees as Diversity and Inclusion Trainers
USMC Marine Corps Intelligence, Surveillance, and Reconnaissance Enterprise (MCISR-E) adopted
new succession management processes to develop workforce
Best Practices in Recruitment, Hiring, and Retention
Agency Activities/Initiatives
DHS I&A Entered recruiting agreement higher education associations serving minorities
DIA Leveraged the Workforce Recruitment Program to increase the representation of PWD
DOE Will continue to leverage programs like the Presidential Management Fellows and the
National Nuclear Security Administration’s programs for the hiring pipeline
DOE Advertised vacancies nationwide to reach as many minority applicants as possible
FBI Used workforce analytic tools to improve diversity in the workforce
NGA Added recruiter specializing in hiring PWD
NSA Revised processes resulted in a 31% minority hiring rate in FY 2015
USCG Developed strategy to attract diverse applicants—measuring applicant data to evaluate
recruiting efforts
USN NIA Developed and implemented an Individuals with Disabilities (IWD) hiring initiative to
increase PWD hiring rate
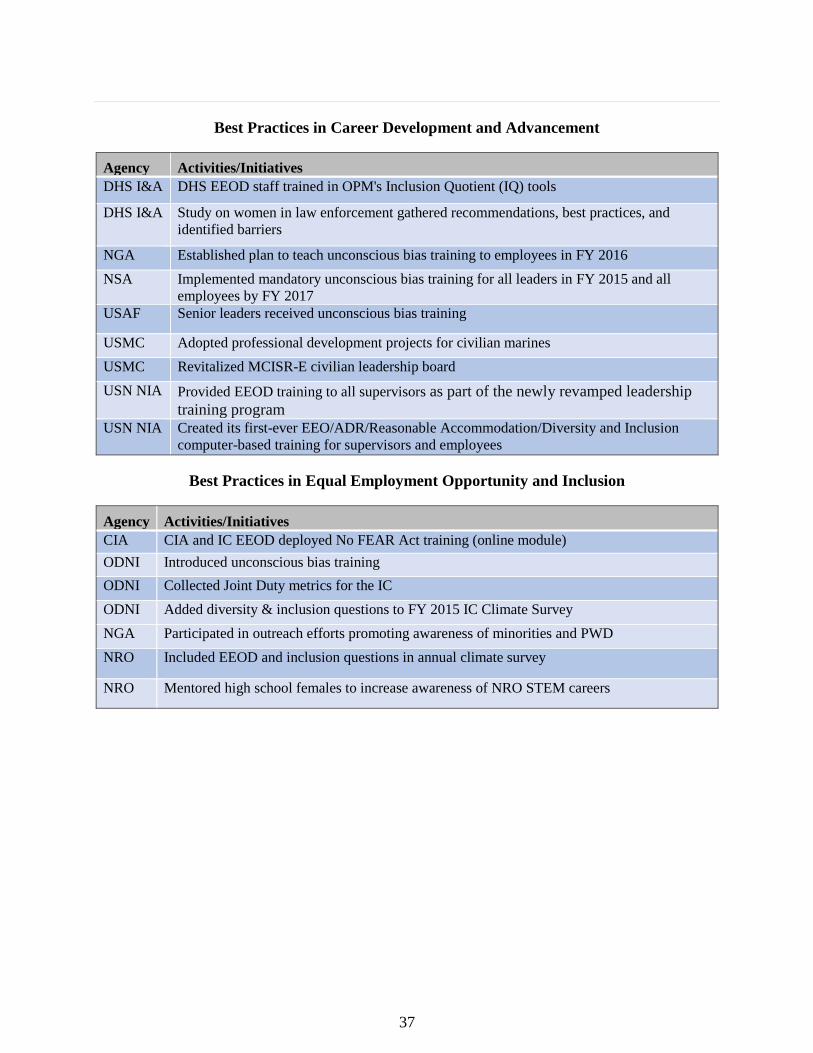
37
Best Practices in Career Development and Advancement
Agency Activities/Initiatives
DHS I&A DHS EEOD staff trained in OPM's Inclusion Quotient (IQ) tools
DHS I&A Study on women in law enforcement gathered recommendations, best practices, and
identified barriers
NGA Established plan to teach unconscious bias training to employees in FY 2016
NSA Implemented mandatory unconscious bias training for all leaders in FY 2015 and all
employees by FY 2017
USAF Senior leaders received unconscious bias training
USMC Adopted professional development projects for civilian marines
USMC Revitalized MCISR-E civilian leadership board
USN NIA Provided EEOD training to all supervisors as part of the newly revamped leadership
training program
USN NIA Created its first-ever EEO/ADR/Reasonable Accommodation/Diversity and Inclusion
computer-based training for supervisors and employees
Best Practices in Equal Employment Opportunity and Inclusion
Agency Activities/Initiatives
CIA CIA and IC EEOD deployed No FEAR Act training (online module)
ODNI Introduced unconscious bias training
ODNI Collected Joint Duty metrics for the IC
ODNI Added diversity & inclusion questions to FY 2015 IC Climate Survey
NGA Participated in outreach efforts promoting awareness of minorities and PWD
NRO Included EEOD and inclusion questions in annual climate survey
NRO Mentored high school females to increase awareness of NRO STEM careers

38
[THIS PAGE LEFT BLANK]

39
Chapter 2. Minorities in the IC
Highlights of the Minority Workforce
The minority population within the IC continues to grow. The percentage of minorities
hired increased from 20.8% in FY 2011 to 24.9% in FY 2015. The minority share of attrition
decreased over the same time period, as noted in Table 09. While the trend in minority
representation is moving in a positive direction, there are still areas requiring additional focus.
For example, as shown in Figure 05, the IC’s overall minority representation is lower than
comparative external benchmarks. Also, minorities are represented at lower than expected rates
in promotions, awards, selected educational development programs, and joint duty assignments.
In FY 2015, the IC began a barrier analysis research project to understand the potential causes of
this demographic trend and make recommendations for future action.
As shown in Table 08, minority hiring is greater than the minority share of attrition in the
All Grades row (highlighted below for specific grade levels), two lower grades, GS/GG-12-14,
and Senior Positions.
Table 08: Hiring, Attrition and Workforce by RNO Group and Pay Grade (FY 2015)
IC Workforce
Pay Grade Non-Min Minorities
Unknown
RNO Non-Min Minorities
Unknown
RNO Non-Min Minorities
Unknown
RNO
Wage Grade 53.8% 7.7% 38.5% 71.4% 28.6% 0.0% 65.1% 32.4% 2.5%
GS/GG-01 0.0% 100.0% 0.0% 56.6% 35.8% 7.5% 0.0% 100.0% 0.0%
GS/GG-02 58.3% 41.7% 0.0% 67.6% 29.7% 2.7% 73.1% 22.6% 4.3%
GS/GG-03 80.0% 20.0% 0.0% 66.7% 33.3% 0.0% 83.8% 15.0% 1.3%
GS/GG-04 90.9% 9.1% 0.0% 52.0% 48.0% 0.0% 80.8% 19.2% 0.0%
GS/GG-05 70.9% 27.3% 1.8% 65.7% 31.4% 2.9% 75.8% 22.2% 2.1%
GS/GG-06 53.1% 24.0% 22.9% 70.0% 27.6% 2.4% 49.0% 44.2% 6.8%
GS/GG-07 69.8% 26.9% 3.3% 67.4% 29.8% 2.8% 65.6% 31.4% 3.0%
GS/GG-08 67.8% 24.6% 7.7% 68.4% 29.1% 2.5% 62.5% 33.6% 3.9%
GS/GG-09 70.5% 24.4% 5.1% 69.0% 28.9% 2.1% 67.9% 30.3% 1.7%
GS/GG-10 65.5% 21.4% 13.2% 68.0% 28.0% 4.0% 66.0% 27.6% 6.3%
GS/GG-11 64.0% 25.2% 10.8% 71.6% 27.6% 0.8% 66.1% 31.9% 2.0%
GS/GG-12 64.9% 28.6% 6.5% 73.8% 25.8% 0.4% 70.3% 28.5% 1.2%
GS/GG-13 71.3% 23.2% 5.5% 78.0% 21.6% 0.4% 74.4% 25.0% 0.6%
GS/GG-14 63.5% 28.9% 7.6% 82.7% 16.6% 0.8% 78.5% 21.0% 0.6%
GS/GG-15 74.1% 11.1% 14.8% 84.1% 15.3% 0.6% 83.5% 15.7% 0.7%
Senior Pay Levels 65.9% 18.2% 15.9% 89.6% 9.0% 1.4% 86.8% 12.3% 0.9%
All Grades 67.6% 24.9% 7.5% 77.2% 21.8% 0.9% 74.3% 24.6% 1.1%
WorkforceHires Share of Attrition
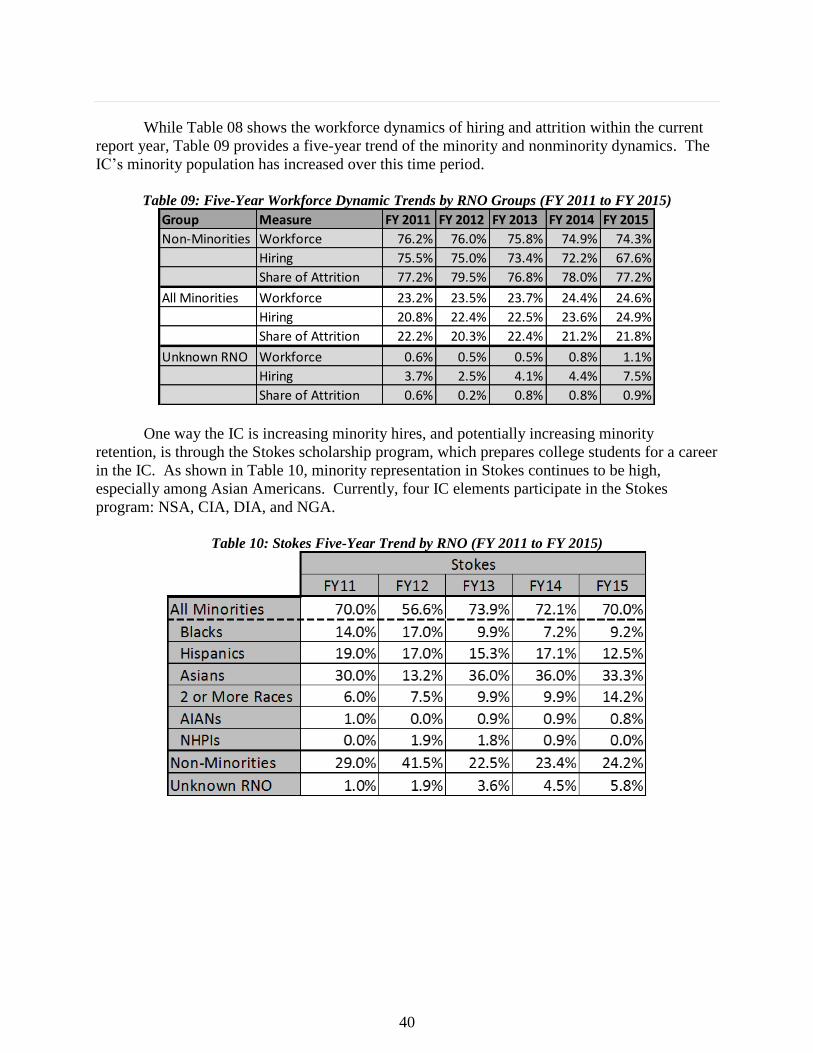
40
While Table 08 shows the workforce dynamics of hiring and attrition within the current
report year, Table 09 provides a five-year trend of the minority and nonminority dynamics. The
IC’s minority population has increased over this time period.
Table 09: Five-Year Workforce Dynamic Trends by RNO Groups (FY 2011 to FY 2015)
One way the IC is increasing minority hires, and potentially increasing minority
retention, is through the Stokes scholarship program, which prepares college students for a career
in the IC. As shown in Table 10, minority representation in Stokes continues to be high,
especially among Asian Americans. Currently, four IC elements participate in the Stokes
program: NSA, CIA, DIA, and NGA.
Table 10: Stokes Five-Year Trend by RNO (FY 2011 to FY 2015)
Group Measure FY 2011 FY 2012 FY 2013 FY 2014 FY 2015
Non-Minorities Workforce 76.2% 76.0% 75.8% 74.9% 74.3%
Hiring 75.5% 75.0% 73.4% 72.2% 67.6%
Share of Attrition 77.2% 79.5% 76.8% 78.0% 77.2%
All Minorities Workforce 23.2% 23.5% 23.7% 24.4% 24.6%
Hiring 20.8% 22.4% 22.5% 23.6% 24.9%
Share of Attrition 22.2% 20.3% 22.4% 21.2% 21.8%
Unknown RNO Workforce 0.6% 0.5% 0.5% 0.8% 1.1%
Hiring 3.7% 2.5% 4.1% 4.4% 7.5%
Share of Attrition 0.6% 0.2% 0.8% 0.8% 0.9%
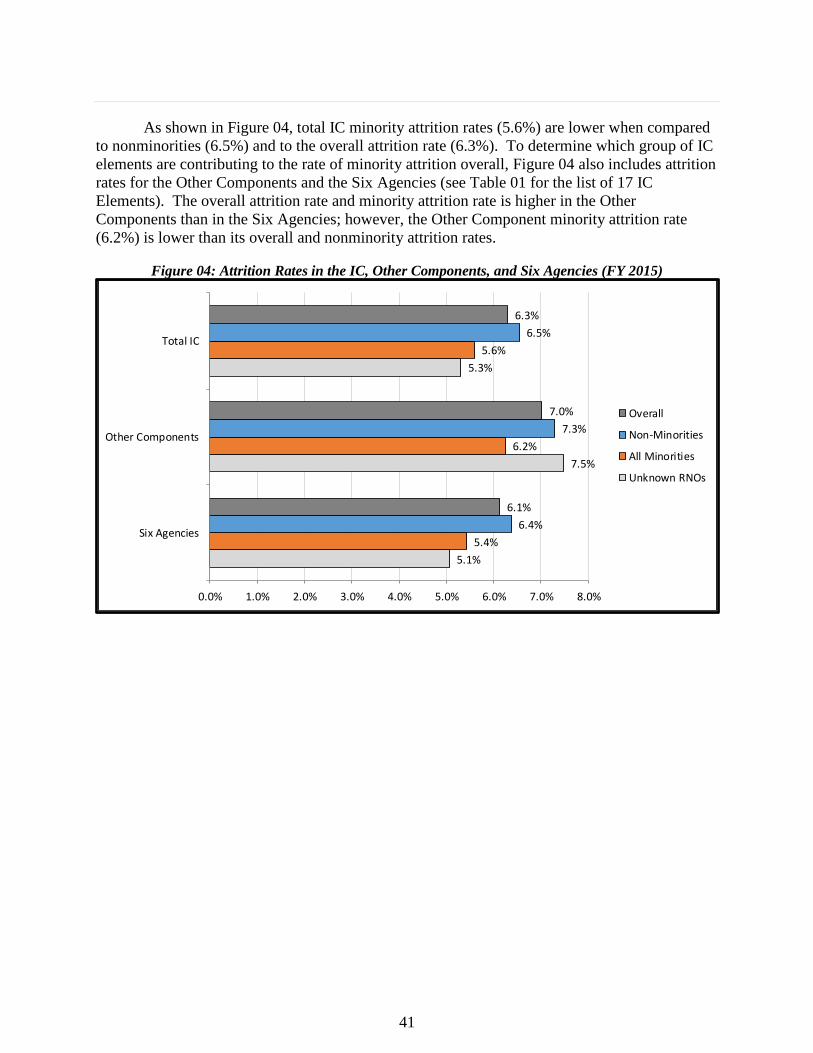
41
As shown in Figure 04, total IC minority attrition rates (5.6%) are lower when compared
to nonminorities (6.5%) and to the overall attrition rate (6.3%). To determine which group of IC
elements are contributing to the rate of minority attrition overall, Figure 04 also includes attrition
rates for the Other Components and the Six Agencies (see Table 01 for the list of 17 IC
Elements). The overall attrition rate and minority attrition rate is higher in the Other
Components than in the Six Agencies; however, the Other Component minority attrition rate
(6.2%) is lower than its overall and nonminority attrition rates.
Figure 04: Attrition Rates in the IC, Other Components, and Six Agencies (FY 2015)
5.1%
7.5%
5.3%
5.4%
6.2%
5.6%
6.4%
7.3%
6.5%
6.1%
7.0%
6.3%
0.0% 1.0% 2.0% 3.0% 4.0% 5.0% 6.0% 7.0% 8.0%
Six Agencies
Other Components
Total IC
Overall
Non-Minorities
All Minorities
Unknown RNOs
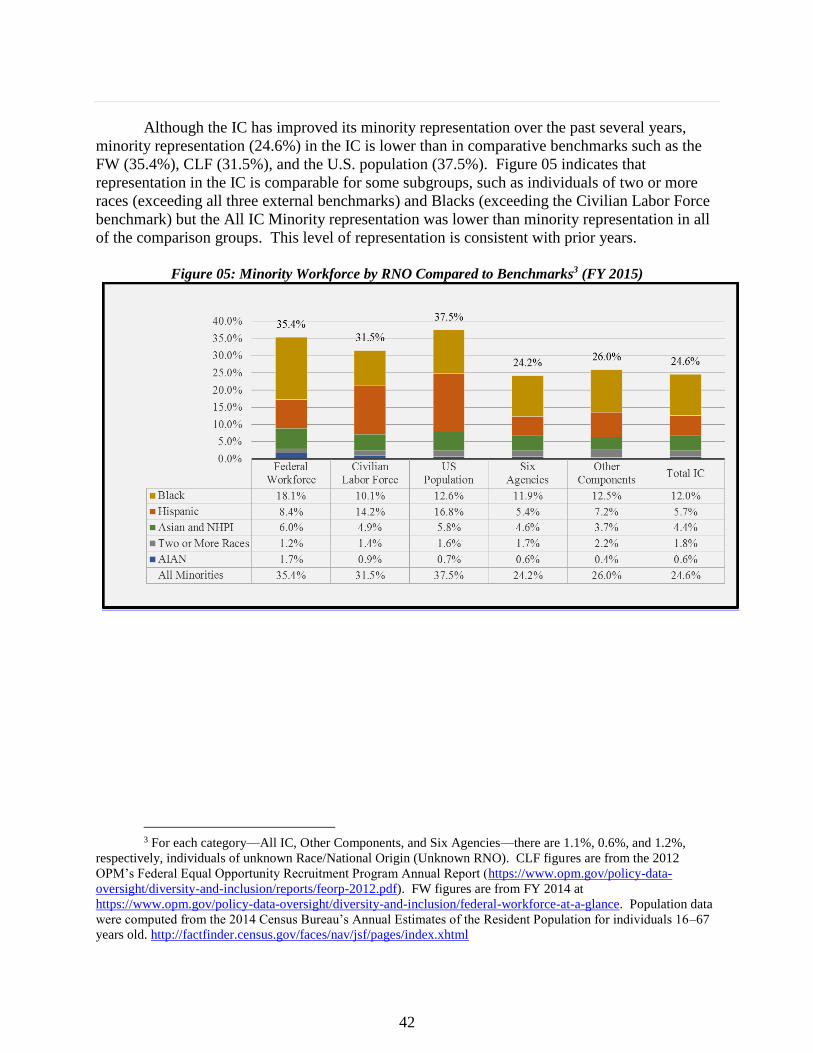
42
Although the IC has improved its minority representation over the past several years,
minority representation (24.6%) in the IC is lower than in comparative benchmarks such as the
FW (35.4%), CLF (31.5%), and the U.S. population (37.5%). Figure 05 indicates that
representation in the IC is comparable for some subgroups, such as individuals of two or more
races (exceeding all three external benchmarks) and Blacks (exceeding the Civilian Labor Force
benchmark) but the All IC Minority representation was lower than minority representation in all
of the comparison groups. This level of representation is consistent with prior years.
Figure 05: Minority Workforce by RNO Compared to Benchmarks3 (FY 2015)
3 For each category—All IC, Other Components, and Six Agencies—there are 1.1%, 0.6%, and 1.2%,
respectively, individuals of unknown Race/National Origin (Unknown RNO). CLF figures are from the 2012
OPM’s Federal Equal Opportunity Recruitment Program Annual Report (https://www.opm.gov/policy-data-
oversight/diversity-and-inclusion/reports/feorp-2012.pdf). FW figures are from FY 2014 at
https://www.opm.gov/policy-data-oversight/diversity-and-inclusion/federal-workforce-at-a-glance. Population data
were computed from the 2014 Census Bureau’s Annual Estimates of the Resident Population for individuals 16–67
years old. http://factfinder.census.gov/faces/nav/jsf/pages/index.xhtml
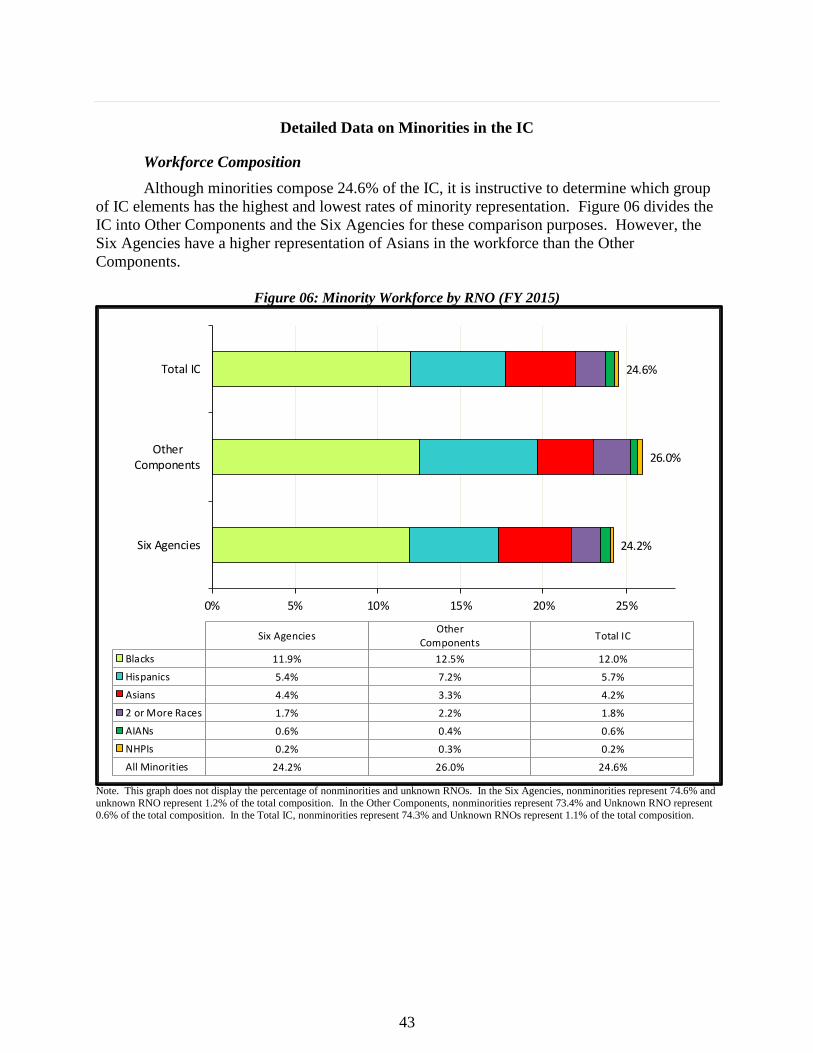
43
Detailed Data on Minorities in the IC
Workforce Composition
Although minorities compose 24.6% of the IC, it is instructive to determine which group
of IC elements has the highest and lowest rates of minority representation. Figure 06 divides the
IC into Other Components and the Six Agencies for these comparison purposes. However, the
Six Agencies have a higher representation of Asians in the workforce than the Other
Components.
Figure 06: Minority Workforce by RNO (FY 2015)
Note. This graph does not display the percentage of nonminorities and unknown RNOs. In the Six Agencies, nonminorities represent 74.6% and
unknown RNO represent 1.2% of the total composition. In the Other Components, nonminorities represent 73.4% and Unknown RNO represent 0.6% of the total composition. In the Total IC, nonminorities represent 74.3% and Unknown RNOs represent 1.1% of the total composition.
24.2%
26.0%
24.6%
0% 5% 10% 15% 20% 25%
Six Agencies
OtherComponents
Total IC
Six AgenciesOther
ComponentsTotal IC
Blacks 11.9% 12.5% 12.0%
Hispanics 5.4% 7.2% 5.7%
Asians 4.4% 3.3% 4.2%
2 or More Races 1.7% 2.2% 1.8%
AIANs 0.6% 0.4% 0.6%
NHPIs 0.2% 0.3% 0.2%
All Minorities 24.2% 26.0% 24.6%

44
Table 11’s highlighted cells illustrate that minorities make up a large proportion of the
mid-grade population from which promotions to the higher grades generally occur, providing a
pool from which the IC may promote minorities. Currently, minority representation at GS/GG-
14 and above are below the overall representation of 24.6%, with minorities at Senior Pay Levels
at half of this percentage.
Table 11: The IC’s Workforce by RNO and Pay Grade (FY 2015)
IC Workforce
Pay Grade
Non-
Minorities
All
Minorities No RNO Black Hispanic Asian AIAN NHPI
2 or More
Races
Wage Grade 65.1% 32.4% 2.5% 25.3% 5.4% 0.8% 0.8% 0.0% 0.0%
GS/GG-01 0.0% 100.0% 0.0% 100.0% 0.0% 0.0% 0.0% 0.0% 0.0%
GS/GG-02 73.1% 22.6% 4.3% 14.0% 3.2% 1.1% 1.1% 0.0% 3.2%
GS/GG-03 83.8% 15.0% 1.3% 6.3% 2.5% 2.5% 0.0% 1.3% 2.5%
GS/GG-04 80.8% 19.2% 0.0% 10.3% 5.1% 2.6% 0.0% 1.3% 0.0%
GS/GG-05 75.8% 22.2% 2.1% 8.2% 6.7% 4.1% 0.0% 0.0% 3.1%
GS/GG-06 49.0% 44.2% 6.8% 18.9% 16.5% 4.0% 0.4% 1.2% 3.2%
GS/GG-07 65.6% 31.4% 3.0% 14.7% 8.3% 4.3% 0.3% 0.6% 3.1%
GS/GG-08 62.5% 33.6% 3.9% 19.5% 8.2% 4.0% 0.3% 0.4% 1.3%
GS/GG-09 67.9% 30.3% 1.7% 16.6% 6.8% 4.4% 0.6% 0.1% 1.7%
GS/GG-10 66.0% 27.7% 6.3% 14.0% 6.0% 4.4% 1.1% 0.3% 1.9%
GS/GG-11 66.1% 31.9% 2.0% 17.3% 7.1% 4.4% 0.7% 0.3% 2.1%
GS/GG-12 70.3% 28.5% 1.2% 14.1% 6.6% 5.1% 0.6% 0.2% 1.8%
GS/GG-13 74.4% 25.0% 0.6% 11.7% 6.0% 4.7% 0.5% 0.2% 2.0%
GS/GG-14 78.5% 21.0% 0.6% 9.9% 4.9% 3.7% 0.7% 0.1% 1.7%
GS/GG-15 83.5% 15.7% 0.7% 7.2% 3.5% 2.9% 0.6% 0.1% 1.5%
Senior Pay Levels 86.8% 12.3% 0.9% 5.2% 2.7% 2.5% 0.4% 0.2% 1.3%
Total IC 74.3% 24.6% 1.1% 12.0% 5.7% 4.2% 0.6% 0.2% 1.8%
Summary By Minority
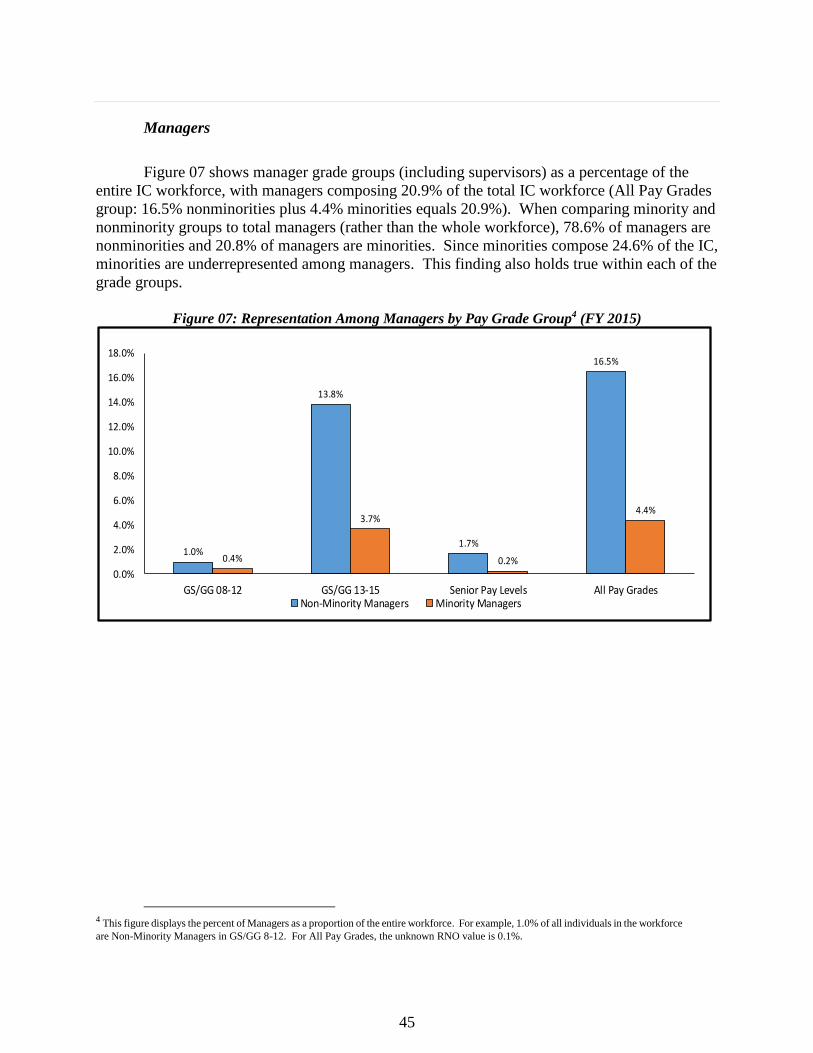
45
Managers
Figure 07 shows manager grade groups (including supervisors) as a percentage of the
entire IC workforce, with managers composing 20.9% of the total IC workforce (All Pay Grades
group: 16.5% nonminorities plus 4.4% minorities equals 20.9%). When comparing minority and
nonminority groups to total managers (rather than the whole workforce), 78.6% of managers are
nonminorities and 20.8% of managers are minorities. Since minorities compose 24.6% of the IC,
minorities are underrepresented among managers. This finding also holds true within each of the
grade groups.
Figure 07: Representation Among Managers by Pay Grade Group4 (FY 2015)
4 This figure displays the percent of Managers as a proportion of the entire workforce. For example, 1.0% of all individuals in the workforce
are Non-Minority Managers in GS/GG 8-12. For All Pay Grades, the unknown RNO value is 0.1%.
1.0%
13.8%
1.7%
16.5%
0.4%
3.7%
0.2%
4.4%
0.0%
2.0%
4.0%
6.0%
8.0%
10.0%
12.0%
14.0%
16.0%
18.0%
GS/GG 08-12 GS/GG 13-15 Senior Pay Levels All Pay GradesNon-Minority Managers Minority Managers
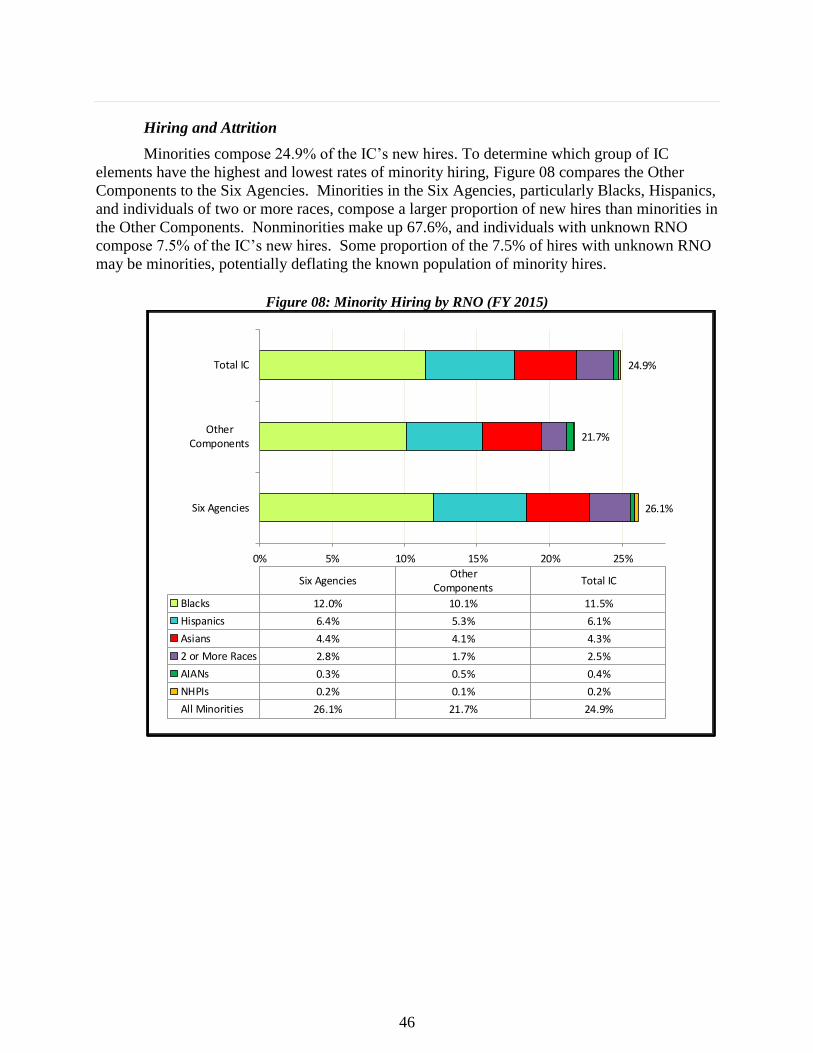
46
Hiring and Attrition
Minorities compose 24.9% of the IC’s new hires. To determine which group of IC
elements have the highest and lowest rates of minority hiring, Figure 08 compares the Other
Components to the Six Agencies. Minorities in the Six Agencies, particularly Blacks, Hispanics,
and individuals of two or more races, compose a larger proportion of new hires than minorities in
the Other Components. Nonminorities make up 67.6%, and individuals with unknown RNO
compose 7.5% of the IC’s new hires. Some proportion of the 7.5% of hires with unknown RNO
may be minorities, potentially deflating the known population of minority hires.
Figure 08: Minority Hiring by RNO (FY 2015)
26.1%
21.7%
24.9%
0% 5% 10% 15% 20% 25%
Six Agencies
OtherComponents
Total IC
Six AgenciesOther
ComponentsTotal IC
Blacks 12.0% 10.1% 11.5%
Hispanics 6.4% 5.3% 6.1%
Asians 4.4% 4.1% 4.3%
2 or More Races 2.8% 1.7% 2.5%
AIANs 0.3% 0.5% 0.4%
NHPIs 0.2% 0.1% 0.2%
All Minorities 26.1% 21.7% 24.9%

47
Table 12 provides hiring information by RNO and Pay Grade. As highlighted in the
table, the rate of minority hiring at certain grades is higher than the 24.9% overall minority hiring
rate. The RNO groups driving those higher numbers tend to be Blacks and Hispanics. For
example, at GS/GG-14, Blacks and Hispanics made up 22.4% of new hires, yet Blacks and
Hispanics represented 17.6% of all hires and 17.7% of the workforce, indicating that the IC hired
members of both groups into upper grades as well as lower grades.
Table 12: Hiring by RNO and Pay Grade (FY 2015)

48
This report examines two related measures of attrition—the attrition rate and share of
overall attrition described in Table 02 under the section on Understanding and Using This
Report. Minorities represented 21.8% of attrition in FY 2015. Table 13 highlights the grades in
which the IC was more successful at retaining minorities (lowest percentages when compared to
the 21.8% Overall Share of Minority Attrition).
Table 13: Overall Share of Attrition by RNO and Grade (FY 2015)
IC Share of Attrition
Pay Grade
Non-
Minorities
All
Minorities
Unknown
RNO Black Hispanic Asian AIAN NHPI
2 or More
Races
Wage Grade 71.4% 28.6% 0.0% 28.6% 0.0% 0.0% 0.0% 0.0% 0.0%
GS/GG-01 56.6% 35.8% 7.5% 18.9% 7.5% 1.9% 0.0% 0.0% 7.5%
GS/GG-02 67.6% 29.7% 2.7% 10.8% 5.4% 8.1% 0.0% 0.0% 5.4%
GS/GG-03 66.7% 33.3% 0.0% 16.7% 0.0% 16.7% 0.0% 0.0% 0.0%
GS/GG-04 52.0% 48.0% 0.0% 12.0% 16.0% 12.0% 0.0% 0.0% 8.0%
GS/GG-05 65.7% 31.4% 2.9% 7.1% 14.3% 5.7% 0.0% 0.0% 4.3%
GS/GG-06 70.0% 27.6% 2.4% 9.4% 11.2% 5.3% 0.0% 0.0% 1.8%
GS/GG-07 67.4% 29.8% 2.8% 13.5% 6.7% 5.6% 0.6% 0.6% 2.8%
GS/GG-08 68.4% 29.1% 2.5% 19.0% 3.8% 3.8% 1.3% 0.0% 1.3%
GS/GG-09 69.0% 28.9% 2.1% 14.2% 7.9% 3.8% 0.4% 0.8% 1.7%
GS/GG-10 68.0% 28.0% 4.0% 12.0% 5.3% 6.7% 2.7% 0.0% 1.3%
GS/GG-11 71.6% 27.6% 0.8% 13.7% 7.7% 4.1% 0.2% 0.0% 1.9%
GS/GG-12 73.8% 25.8% 0.4% 13.6% 4.7% 3.5% 1.1% 0.5% 2.4%
GS/GG-13 78.0% 21.6% 0.4% 10.4% 4.7% 4.0% 0.3% 0.1% 2.0%
GS/GG-14 82.7% 16.6% 0.8% 7.3% 3.6% 2.9% 0.7% 0.2% 2.0%
GS/GG-15 84.1% 15.3% 0.6% 6.5% 3.0% 2.5% 1.1% 0.0% 2.2%
Senior Pay Levels 89.6% 9.0% 1.4% 2.7% 2.3% 2.7% 0.0% 0.5% 0.9%
Total IC Attrition 77.2% 21.8% 0.9% 10.2% 5.0% 3.6% 0.6% 0.2% 2.1%
Summary By Minority
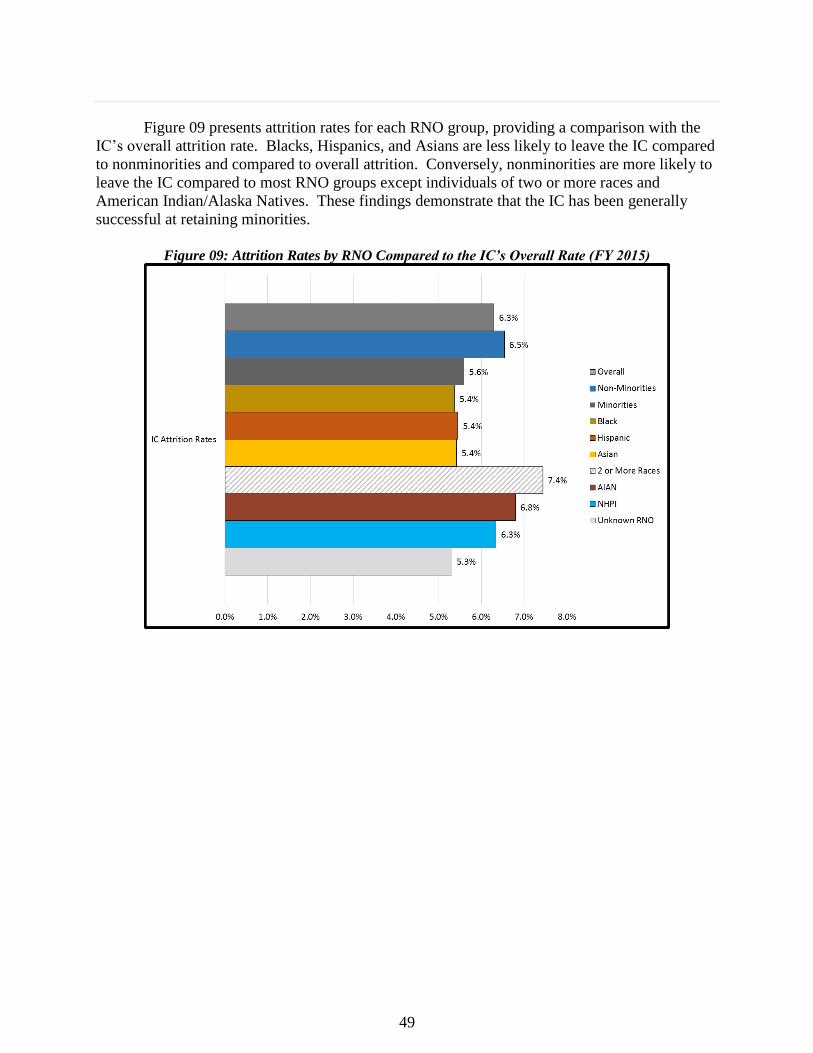
49
Figure 09 presents attrition rates for each RNO group, providing a comparison with the
IC’s overall attrition rate. Blacks, Hispanics, and Asians are less likely to leave the IC compared
to nonminorities and compared to overall attrition. Conversely, nonminorities are more likely to
leave the IC compared to most RNO groups except individuals of two or more races and
American Indian/Alaska Natives. These findings demonstrate that the IC has been generally
successful at retaining minorities.
Figure 09: Attrition Rates by RNO Compared to the IC’s Overall Rate (FY 2015)

50
Figure 10 provides the breakdown of overall share of the attrition by type of attrition,
comparing minorities with nonminorities. Minorities represent 24.6% of the IC workforce and
similarly represent 21.8% of the IC’s overall share of attrition in FY 2015 but 29.3% of the
terminations. While resignations, at 23.6%, is below minority representation, it is the second
highest attrition type for minorities.
Figure 10: Minority Share of Attrition by Type5 (FY 2015)
5 The Minority overall share of attrition is 21.8% but some agencies are unable to report attrition by type
(reason). This causes the share of attrition in this figure to be slightly smaller (21.6%).
70.7%
75.2%
81.6%
77.9%
77.8%
29.3%
23.6%
18.3%
22.1%
21.6%
0% 20% 40% 60% 80% 100%
Termination
Resignation
Retirement
Other
All Types
Non-Minorities All Minorities Unknown RNO
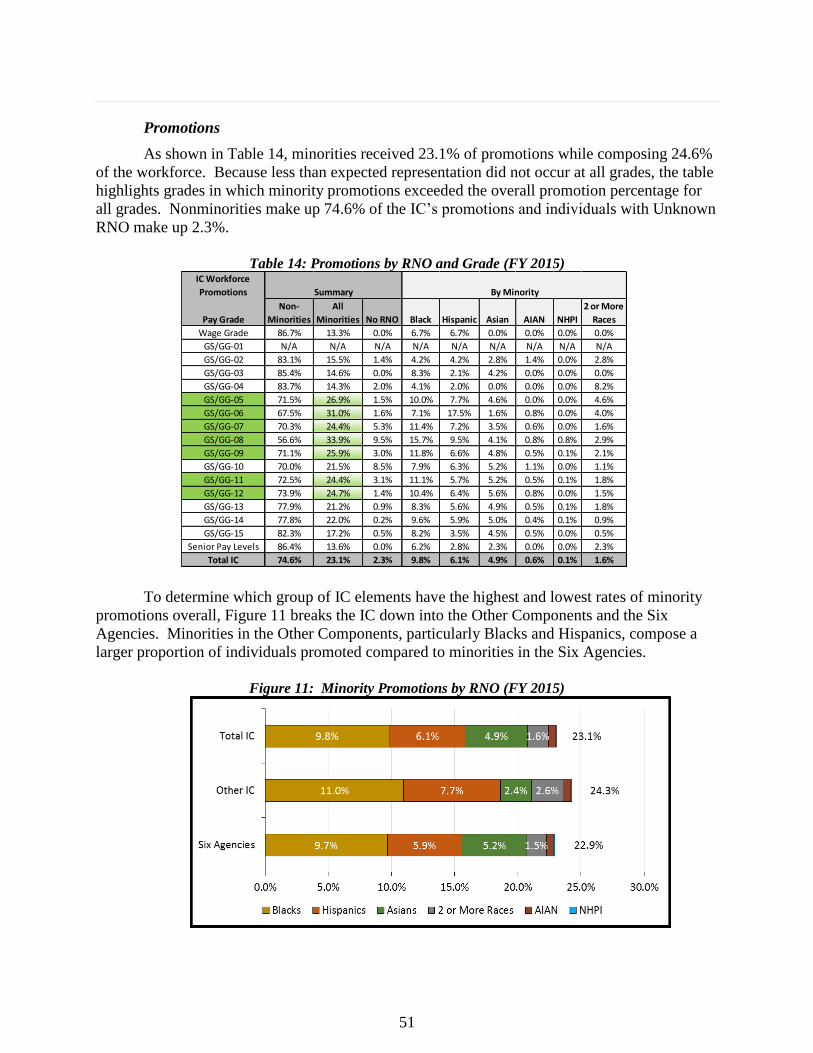
51
Promotions
As shown in Table 14, minorities received 23.1% of promotions while composing 24.6%
of the workforce. Because less than expected representation did not occur at all grades, the table
highlights grades in which minority promotions exceeded the overall promotion percentage for
all grades. Nonminorities make up 74.6% of the IC’s promotions and individuals with Unknown
RNO make up 2.3%.
Table 14: Promotions by RNO and Grade (FY 2015)
To determine which group of IC elements have the highest and lowest rates of minority
promotions overall, Figure 11 breaks the IC down into the Other Components and the Six
Agencies. Minorities in the Other Components, particularly Blacks and Hispanics, compose a
larger proportion of individuals promoted compared to minorities in the Six Agencies.
Figure 11: Minority Promotions by RNO (FY 2015)
IC Workforce
Promotions
Pay Grade
Non-
Minorities
All
Minorities No RNO Black Hispanic Asian AIAN NHPI
2 or More
Races
Wage Grade 86.7% 13.3% 0.0% 6.7% 6.7% 0.0% 0.0% 0.0% 0.0%
GS/GG-01 N/A N/A N/A N/A N/A N/A N/A N/A N/A
GS/GG-02 83.1% 15.5% 1.4% 4.2% 4.2% 2.8% 1.4% 0.0% 2.8%
GS/GG-03 85.4% 14.6% 0.0% 8.3% 2.1% 4.2% 0.0% 0.0% 0.0%
GS/GG-04 83.7% 14.3% 2.0% 4.1% 2.0% 0.0% 0.0% 0.0% 8.2%
GS/GG-05 71.5% 26.9% 1.5% 10.0% 7.7% 4.6% 0.0% 0.0% 4.6%
GS/GG-06 67.5% 31.0% 1.6% 7.1% 17.5% 1.6% 0.8% 0.0% 4.0%
GS/GG-07 70.3% 24.4% 5.3% 11.4% 7.2% 3.5% 0.6% 0.0% 1.6%
GS/GG-08 56.6% 33.9% 9.5% 15.7% 9.5% 4.1% 0.8% 0.8% 2.9%
GS/GG-09 71.1% 25.9% 3.0% 11.8% 6.6% 4.8% 0.5% 0.1% 2.1%
GS/GG-10 70.0% 21.5% 8.5% 7.9% 6.3% 5.2% 1.1% 0.0% 1.1%
GS/GG-11 72.5% 24.4% 3.1% 11.1% 5.7% 5.2% 0.5% 0.1% 1.8%
GS/GG-12 73.9% 24.7% 1.4% 10.4% 6.4% 5.6% 0.8% 0.0% 1.5%
GS/GG-13 77.9% 21.2% 0.9% 8.3% 5.6% 4.9% 0.5% 0.1% 1.8%
GS/GG-14 77.8% 22.0% 0.2% 9.6% 5.9% 5.0% 0.4% 0.1% 0.9%
GS/GG-15 82.3% 17.2% 0.5% 8.2% 3.5% 4.5% 0.5% 0.0% 0.5%
Senior Pay Levels 86.4% 13.6% 0.0% 6.2% 2.8% 2.3% 0.0% 0.0% 2.3%
Total IC 74.6% 23.1% 2.3% 9.8% 6.1% 4.9% 0.6% 0.1% 1.6%
Summary By Minority
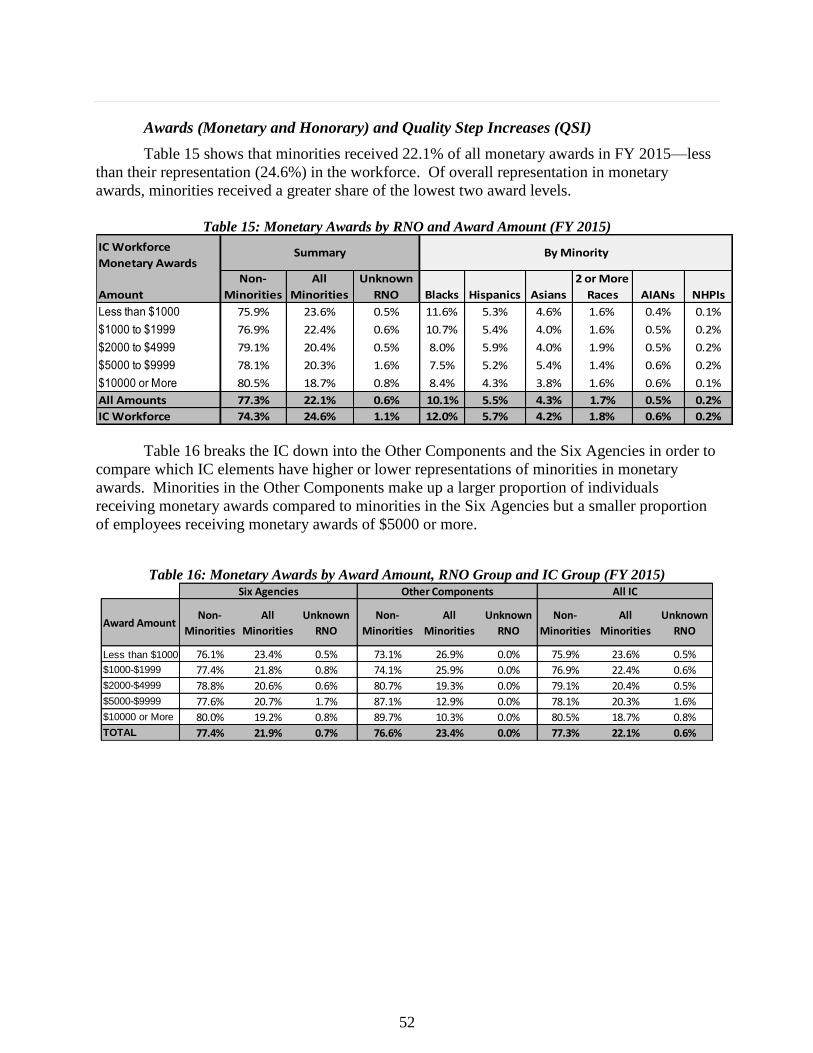
52
Awards (Monetary and Honorary) and Quality Step Increases (QSI)
Table 15 shows that minorities received 22.1% of all monetary awards in FY 2015—less
than their representation (24.6%) in the workforce. Of overall representation in monetary
awards, minorities received a greater share of the lowest two award levels.
Table 15: Monetary Awards by RNO and Award Amount (FY 2015)
Table 16 breaks the IC down into the Other Components and the Six Agencies in order to
compare which IC elements have higher or lower representations of minorities in monetary
awards. Minorities in the Other Components make up a larger proportion of individuals
receiving monetary awards compared to minorities in the Six Agencies but a smaller proportion
of employees receiving monetary awards of $5000 or more.
Table 16: Monetary Awards by Award Amount, RNO Group and IC Group (FY 2015)
IC Workforce
Monetary Awards
Amount
Non-
Minorities
All
Minorities
Unknown
RNO Blacks Hispanics Asians
2 or More
Races AIANs NHPIs
Less than $1000 75.9% 23.6% 0.5% 11.6% 5.3% 4.6% 1.6% 0.4% 0.1%
$1000 to $1999 76.9% 22.4% 0.6% 10.7% 5.4% 4.0% 1.6% 0.5% 0.2%
$2000 to $4999 79.1% 20.4% 0.5% 8.0% 5.9% 4.0% 1.9% 0.5% 0.2%
$5000 to $9999 78.1% 20.3% 1.6% 7.5% 5.2% 5.4% 1.4% 0.6% 0.2%
$10000 or More 80.5% 18.7% 0.8% 8.4% 4.3% 3.8% 1.6% 0.6% 0.1%
All Amounts 77.3% 22.1% 0.6% 10.1% 5.5% 4.3% 1.7% 0.5% 0.2%
IC Workforce 74.3% 24.6% 1.1% 12.0% 5.7% 4.2% 1.8% 0.6% 0.2%
Summary By Minority
Award AmountNon-
Minorities
All
Minorities
Unknown
RNO
Non-
Minorities
All
Minorities
Unknown
RNO
Non-
Minorities
All
Minorities
Unknown
RNO
Less than $1000 76.1% 23.4% 0.5% 73.1% 26.9% 0.0% 75.9% 23.6% 0.5%
$1000-$1999 77.4% 21.8% 0.8% 74.1% 25.9% 0.0% 76.9% 22.4% 0.6%
$2000-$4999 78.8% 20.6% 0.6% 80.7% 19.3% 0.0% 79.1% 20.4% 0.5%
$5000-$9999 77.6% 20.7% 1.7% 87.1% 12.9% 0.0% 78.1% 20.3% 1.6%
$10000 or More 80.0% 19.2% 0.8% 89.7% 10.3% 0.0% 80.5% 18.7% 0.8%
TOTAL 77.4% 21.9% 0.7% 76.6% 23.4% 0.0% 77.3% 22.1% 0.6%
Six Agencies Other Components All IC
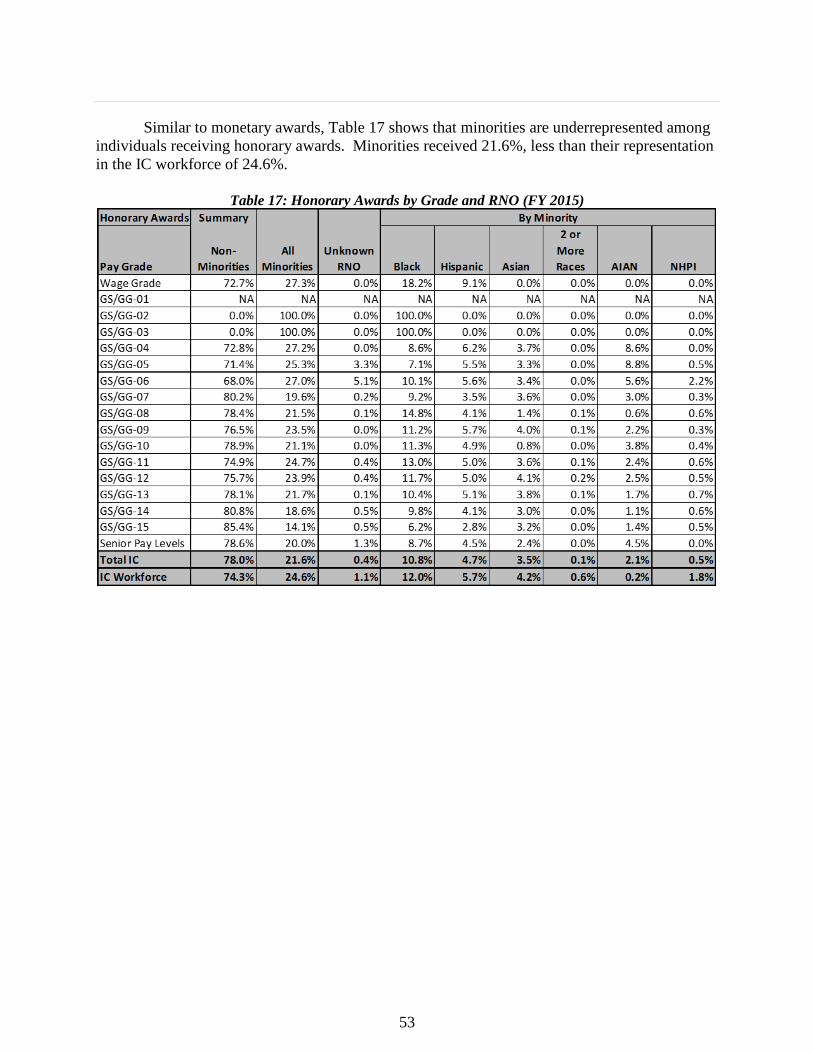
53
Similar to monetary awards, Table 17 shows that minorities are underrepresented among
individuals receiving honorary awards. Minorities received 21.6%, less than their representation
in the IC workforce of 24.6%.
Table 17: Honorary Awards by Grade and RNO (FY 2015)
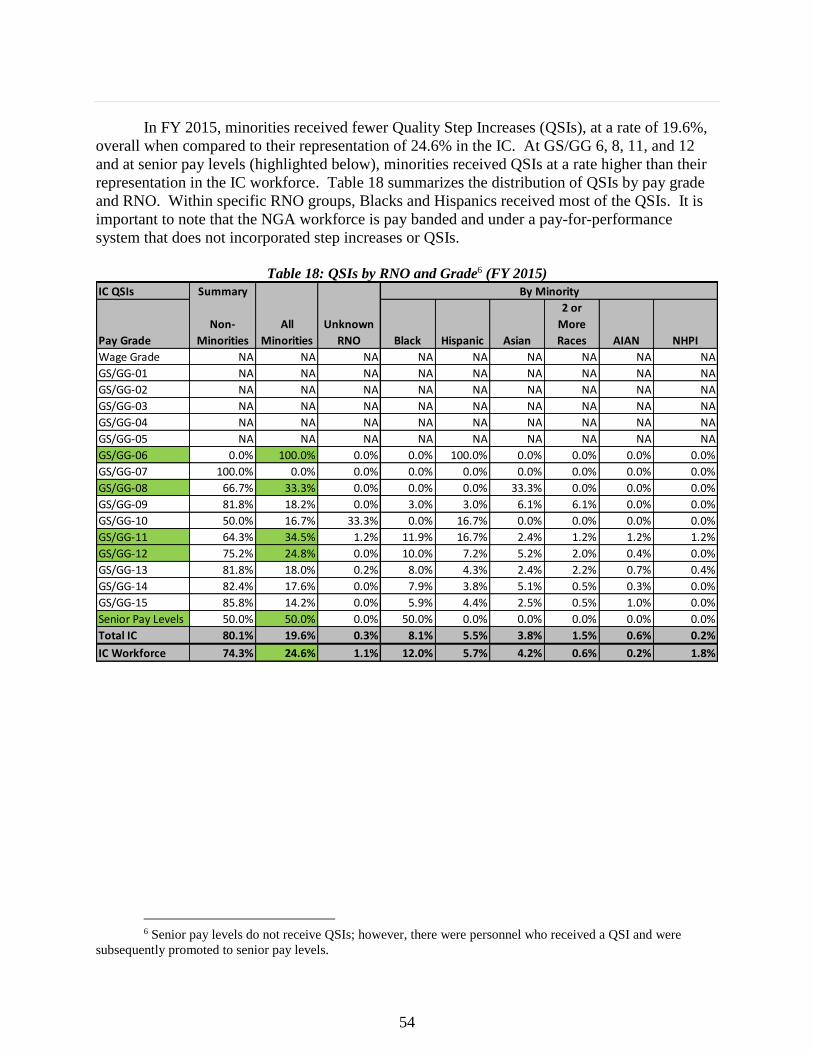
54
In FY 2015, minorities received fewer Quality Step Increases (QSIs), at a rate of 19.6%,
overall when compared to their representation of 24.6% in the IC. At GS/GG 6, 8, 11, and 12
and at senior pay levels (highlighted below), minorities received QSIs at a rate higher than their
representation in the IC workforce. Table 18 summarizes the distribution of QSIs by pay grade
and RNO. Within specific RNO groups, Blacks and Hispanics received most of the QSIs. It is
important to note that the NGA workforce is pay banded and under a pay-for-performance
system that does not incorporated step increases or QSIs.
Table 18: QSIs by RNO and Grade6 (FY 2015)
6 Senior pay levels do not receive QSIs; however, there were personnel who received a QSI and were
subsequently promoted to senior pay levels.
IC QSIs Summary
Pay Grade
Non-
Minorities
All
Minorities
Unknown
RNO Black Hispanic Asian
2 or
More
Races AIAN NHPI
Wage Grade NA NA NA NA NA NA NA NA NA
GS/GG-01 NA NA NA NA NA NA NA NA NA
GS/GG-02 NA NA NA NA NA NA NA NA NA
GS/GG-03 NA NA NA NA NA NA NA NA NA
GS/GG-04 NA NA NA NA NA NA NA NA NA
GS/GG-05 NA NA NA NA NA NA NA NA NA
GS/GG-06 0.0% 100.0% 0.0% 0.0% 100.0% 0.0% 0.0% 0.0% 0.0%
GS/GG-07 100.0% 0.0% 0.0% 0.0% 0.0% 0.0% 0.0% 0.0% 0.0%
GS/GG-08 66.7% 33.3% 0.0% 0.0% 0.0% 33.3% 0.0% 0.0% 0.0%
GS/GG-09 81.8% 18.2% 0.0% 3.0% 3.0% 6.1% 6.1% 0.0% 0.0%
GS/GG-10 50.0% 16.7% 33.3% 0.0% 16.7% 0.0% 0.0% 0.0% 0.0%
GS/GG-11 64.3% 34.5% 1.2% 11.9% 16.7% 2.4% 1.2% 1.2% 1.2%
GS/GG-12 75.2% 24.8% 0.0% 10.0% 7.2% 5.2% 2.0% 0.4% 0.0%
GS/GG-13 81.8% 18.0% 0.2% 8.0% 4.3% 2.4% 2.2% 0.7% 0.4%
GS/GG-14 82.4% 17.6% 0.0% 7.9% 3.8% 5.1% 0.5% 0.3% 0.0%
GS/GG-15 85.8% 14.2% 0.0% 5.9% 4.4% 2.5% 0.5% 1.0% 0.0%
Senior Pay Levels 50.0% 50.0% 0.0% 50.0% 0.0% 0.0% 0.0% 0.0% 0.0%
Total IC 80.1% 19.6% 0.3% 8.1% 5.5% 3.8% 1.5% 0.6% 0.2%
IC Workforce 74.3% 24.6% 1.1% 12.0% 5.7% 4.2% 0.6% 0.2% 1.8%
By Minority
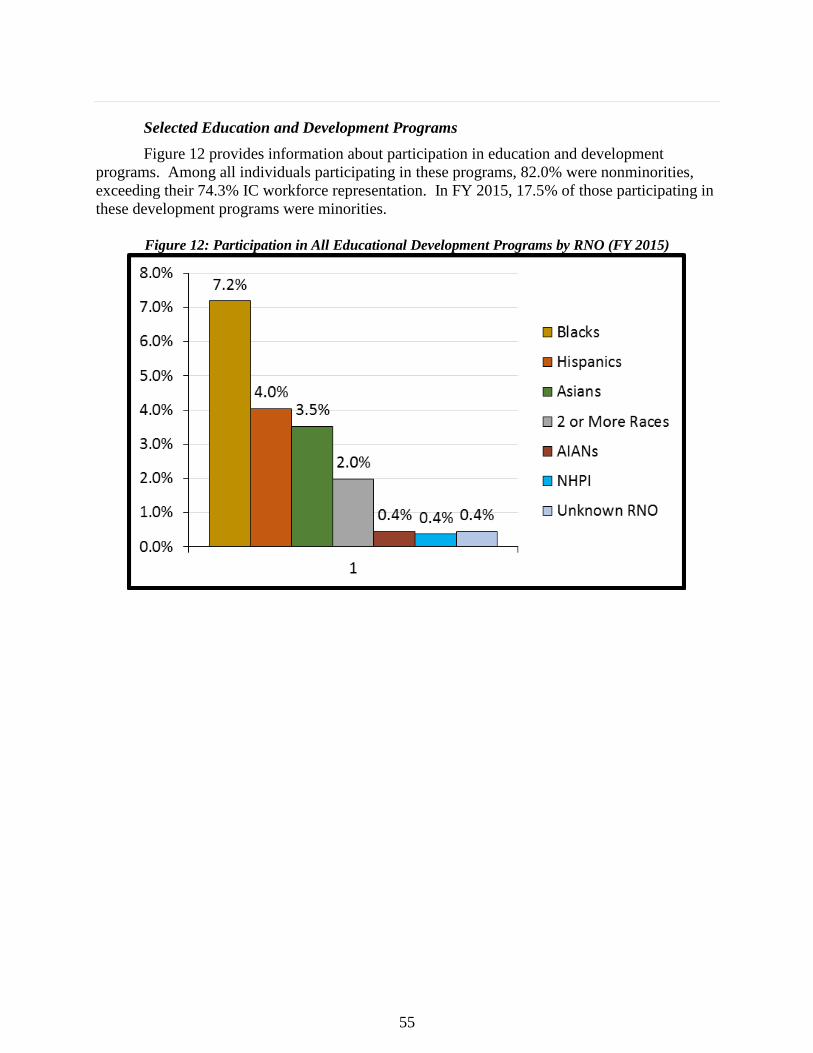
55
Selected Education and Development Programs
Figure 12 provides information about participation in education and development
programs. Among all individuals participating in these programs, 82.0% were nonminorities,
exceeding their 74.3% IC workforce representation. In FY 2015, 17.5% of those participating in
these development programs were minorities.
Figure 12: Participation in All Educational Development Programs by RNO (FY 2015)
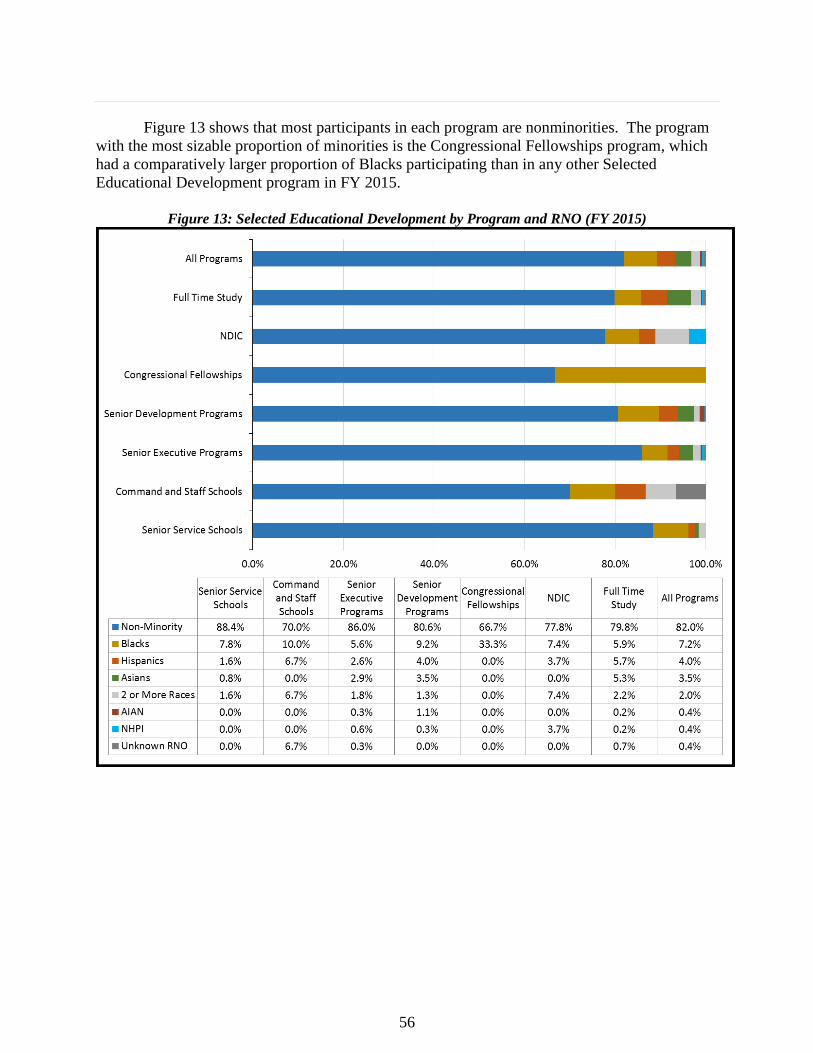
56
Figure 13 shows that most participants in each program are nonminorities. The program
with the most sizable proportion of minorities is the Congressional Fellowships program, which
had a comparatively larger proportion of Blacks participating than in any other Selected
Educational Development program in FY 2015.
Figure 13: Selected Educational Development by Program and RNO (FY 2015)
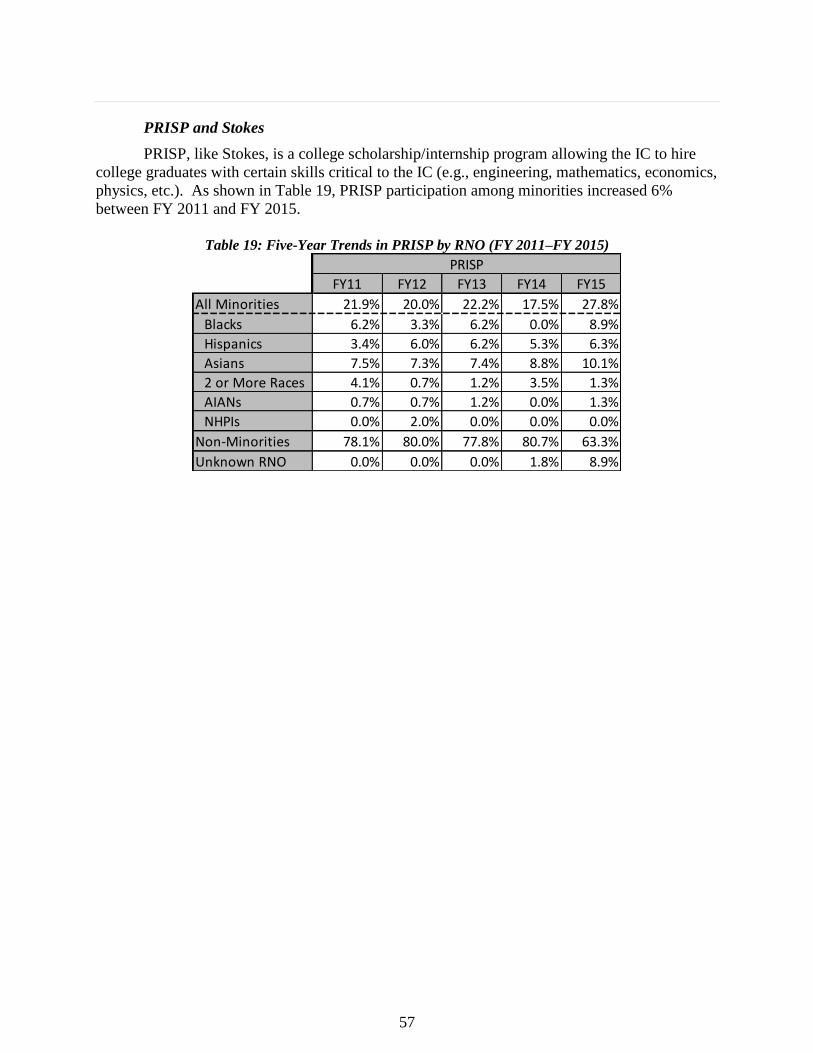
57
PRISP and Stokes
PRISP, like Stokes, is a college scholarship/internship program allowing the IC to hire
college graduates with certain skills critical to the IC (e.g., engineering, mathematics, economics,
physics, etc.). As shown in Table 19, PRISP participation among minorities increased 6%
between FY 2011 and FY 2015.
Table 19: Five-Year Trends in PRISP by RNO (FY 2011–FY 2015)
FY11 FY12 FY13 FY14 FY15
All Minorities 21.9% 20.0% 22.2% 17.5% 27.8%
Blacks 6.2% 3.3% 6.2% 0.0% 8.9%
Hispanics 3.4% 6.0% 6.2% 5.3% 6.3%
Asians 7.5% 7.3% 7.4% 8.8% 10.1%
2 or More Races 4.1% 0.7% 1.2% 3.5% 1.3%
AIANs 0.7% 0.7% 1.2% 0.0% 1.3%
NHPIs 0.0% 2.0% 0.0% 0.0% 0.0%
Non-Minorities 78.1% 80.0% 77.8% 80.7% 63.3%
Unknown RNO 0.0% 0.0% 0.0% 1.8% 8.9%
PRISP
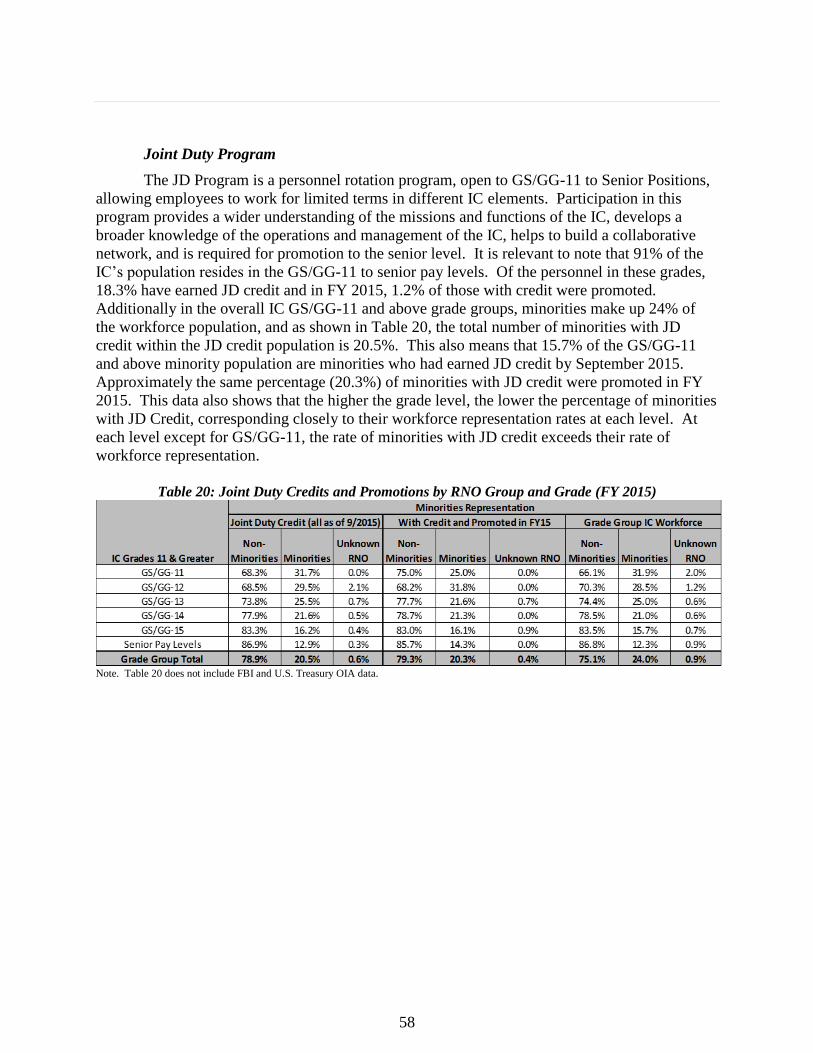
58
Joint Duty Program
The JD Program is a personnel rotation program, open to GS/GG-11 to Senior Positions,
allowing employees to work for limited terms in different IC elements. Participation in this
program provides a wider understanding of the missions and functions of the IC, develops a
broader knowledge of the operations and management of the IC, helps to build a collaborative
network, and is required for promotion to the senior level. It is relevant to note that 91% of the
IC’s population resides in the GS/GG-11 to senior pay levels. Of the personnel in these grades,
18.3% have earned JD credit and in FY 2015, 1.2% of those with credit were promoted.
Additionally in the overall IC GS/GG-11 and above grade groups, minorities make up 24% of
the workforce population, and as shown in Table 20, the total number of minorities with JD
credit within the JD credit population is 20.5%. This also means that 15.7% of the GS/GG-11
and above minority population are minorities who had earned JD credit by September 2015.
Approximately the same percentage (20.3%) of minorities with JD credit were promoted in FY
2015. This data also shows that the higher the grade level, the lower the percentage of minorities
with JD Credit, corresponding closely to their workforce representation rates at each level. At
each level except for GS/GG-11, the rate of minorities with JD credit exceeds their rate of
workforce representation.
Table 20: Joint Duty Credits and Promotions by RNO Group and Grade (FY 2015)
Note. Table 20 does not include FBI and U.S. Treasury OIA data.
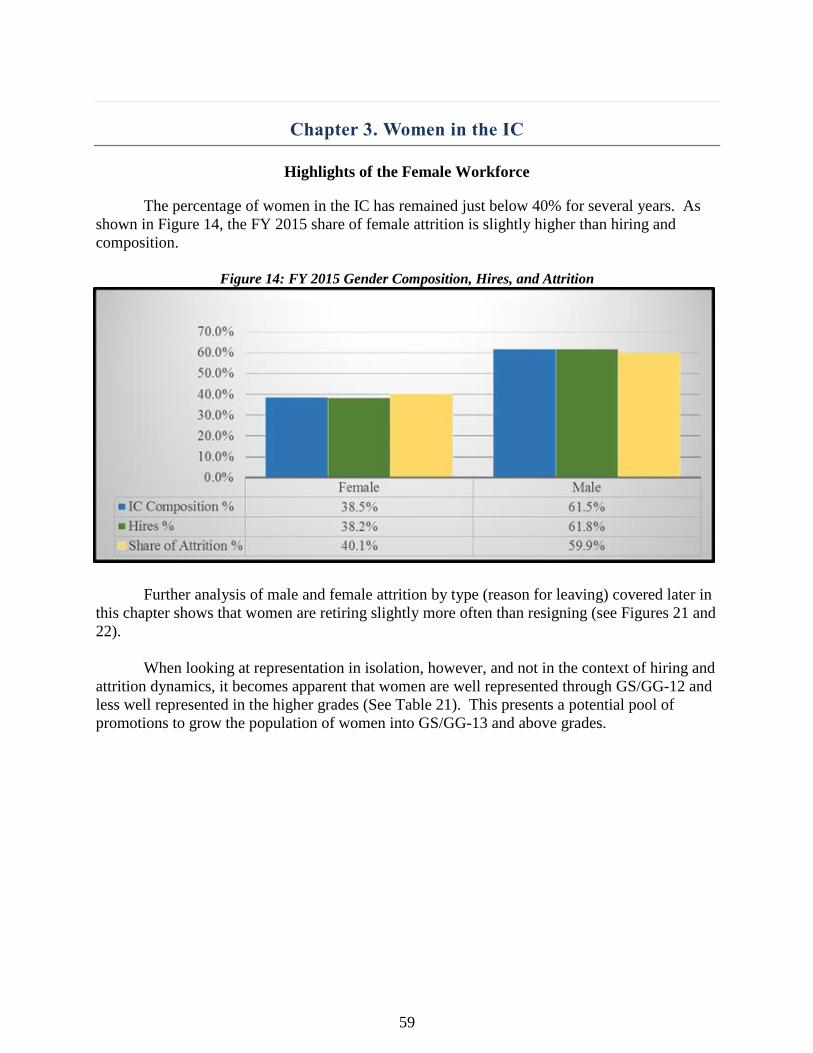
59
Chapter 3. Women in the IC
Highlights of the Female Workforce
The percentage of women in the IC has remained just below 40% for several years. As
shown in Figure 14, the FY 2015 share of female attrition is slightly higher than hiring and
composition.
Figure 14: FY 2015 Gender Composition, Hires, and Attrition
Further analysis of male and female attrition by type (reason for leaving) covered later in
this chapter shows that women are retiring slightly more often than resigning (see Figures 21 and
22).
When looking at representation in isolation, however, and not in the context of hiring and
attrition dynamics, it becomes apparent that women are well represented through GS/GG-12 and
less well represented in the higher grades (See Table 21). This presents a potential pool of
promotions to grow the population of women into GS/GG-13 and above grades.
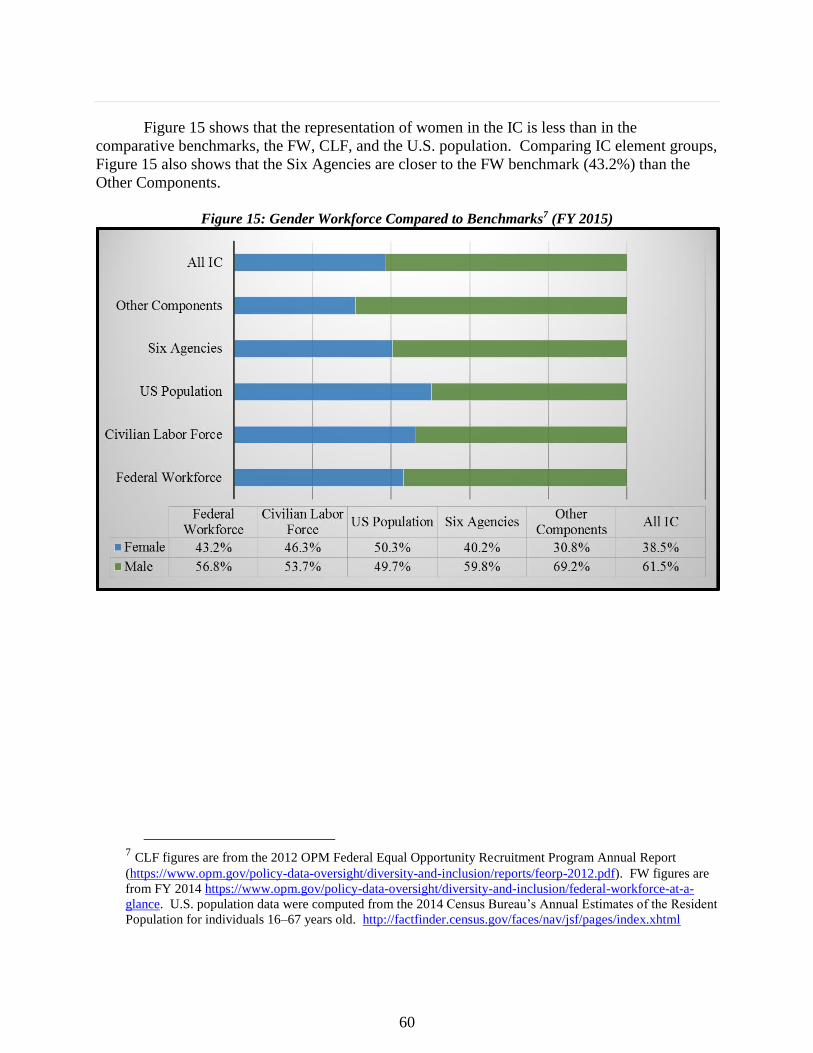
60
Figure 15 shows that the representation of women in the IC is less than in the
comparative benchmarks, the FW, CLF, and the U.S. population. Comparing IC element groups,
Figure 15 also shows that the Six Agencies are closer to the FW benchmark (43.2%) than the
Other Components.
Figure 15: Gender Workforce Compared to Benchmarks7 (FY 2015)
7 CLF figures are from the 2012 OPM Federal Equal Opportunity Recruitment Program Annual Report
(https://www.opm.gov/policy-data-oversight/diversity-and-inclusion/reports/feorp-2012.pdf). FW figures are
from FY 2014 https://www.opm.gov/policy-data-oversight/diversity-and-inclusion/federal-workforce-at-a-
glance. U.S. population data were computed from the 2014 Census Bureau’s Annual Estimates of the Resident
Population for individuals 16–67 years old. http://factfinder.census.gov/faces/nav/jsf/pages/index.xhtml
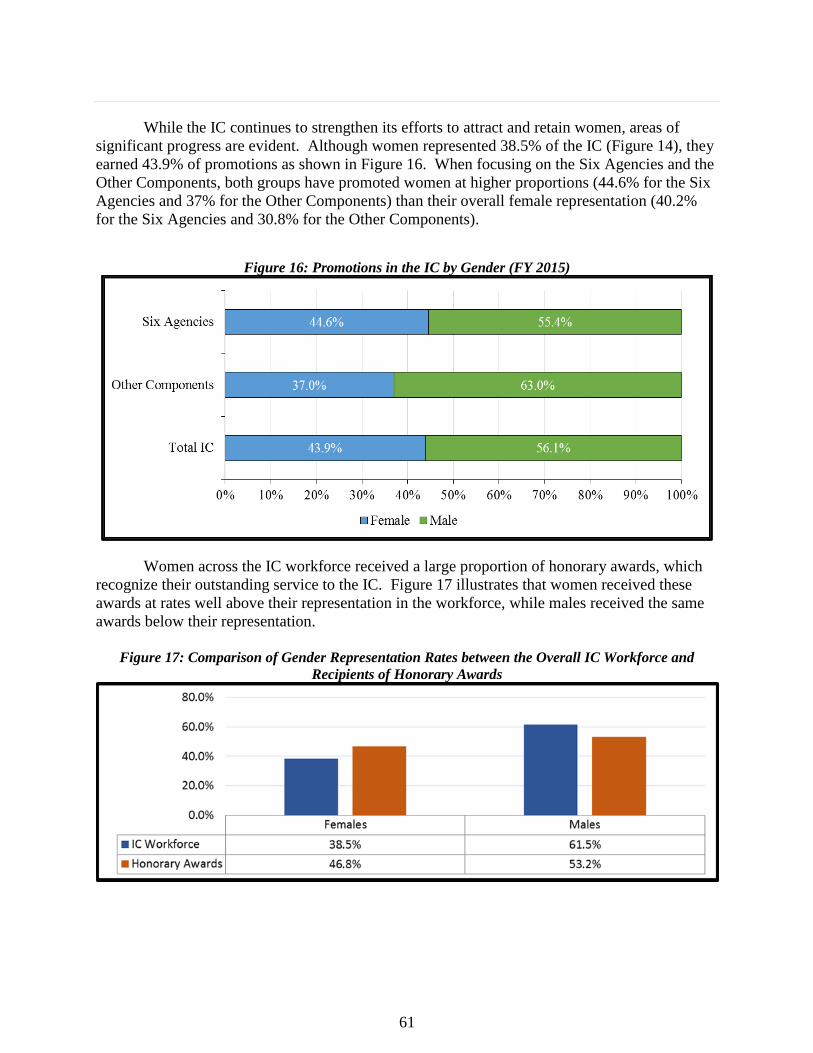
61
While the IC continues to strengthen its efforts to attract and retain women, areas of
significant progress are evident. Although women represented 38.5% of the IC (Figure 14), they
earned 43.9% of promotions as shown in Figure 16. When focusing on the Six Agencies and the
Other Components, both groups have promoted women at higher proportions (44.6% for the Six
Agencies and 37% for the Other Components) than their overall female representation (40.2%
for the Six Agencies and 30.8% for the Other Components).
Figure 16: Promotions in the IC by Gender (FY 2015)
Women across the IC workforce received a large proportion of honorary awards, which
recognize their outstanding service to the IC. Figure 17 illustrates that women received these
awards at rates well above their representation in the workforce, while males received the same
awards below their representation.
Figure 17: Comparison of Gender Representation Rates between the Overall IC Workforce and
Recipients of Honorary Awards
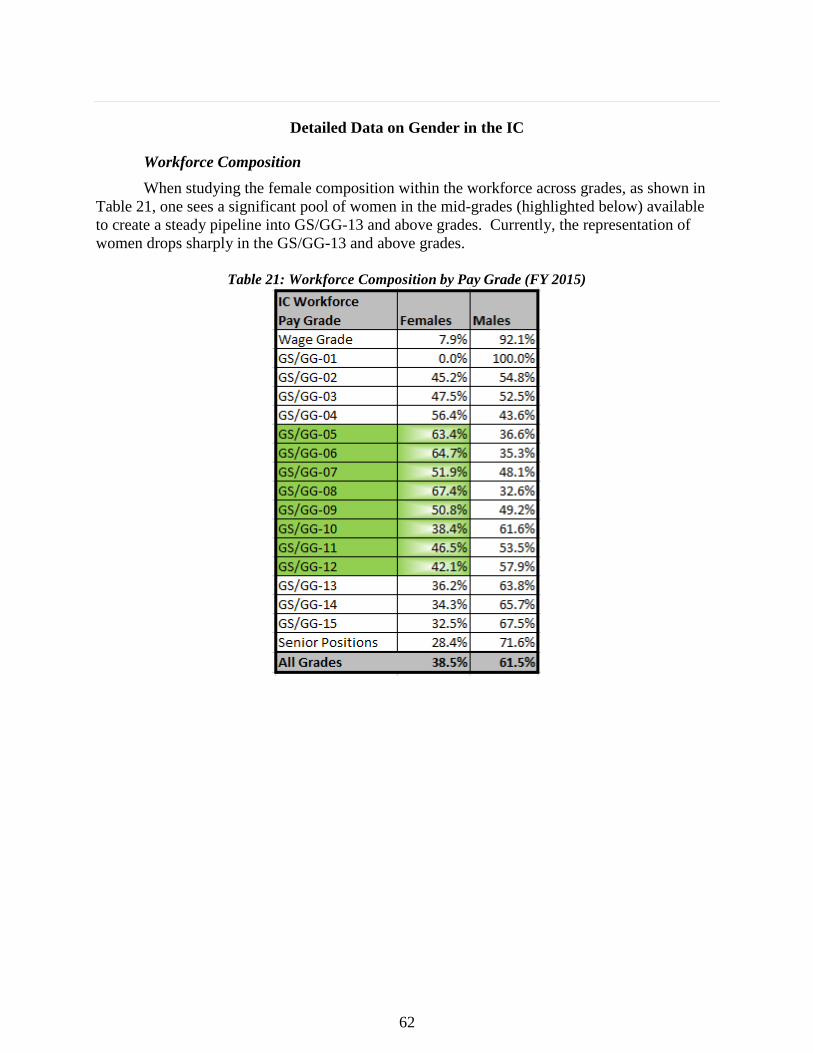
62
Detailed Data on Gender in the IC
Workforce Composition
When studying the female composition within the workforce across grades, as shown in
Table 21, one sees a significant pool of women in the mid-grades (highlighted below) available
to create a steady pipeline into GS/GG-13 and above grades. Currently, the representation of
women drops sharply in the GS/GG-13 and above grades.
Table 21: Workforce Composition by Pay Grade (FY 2015)
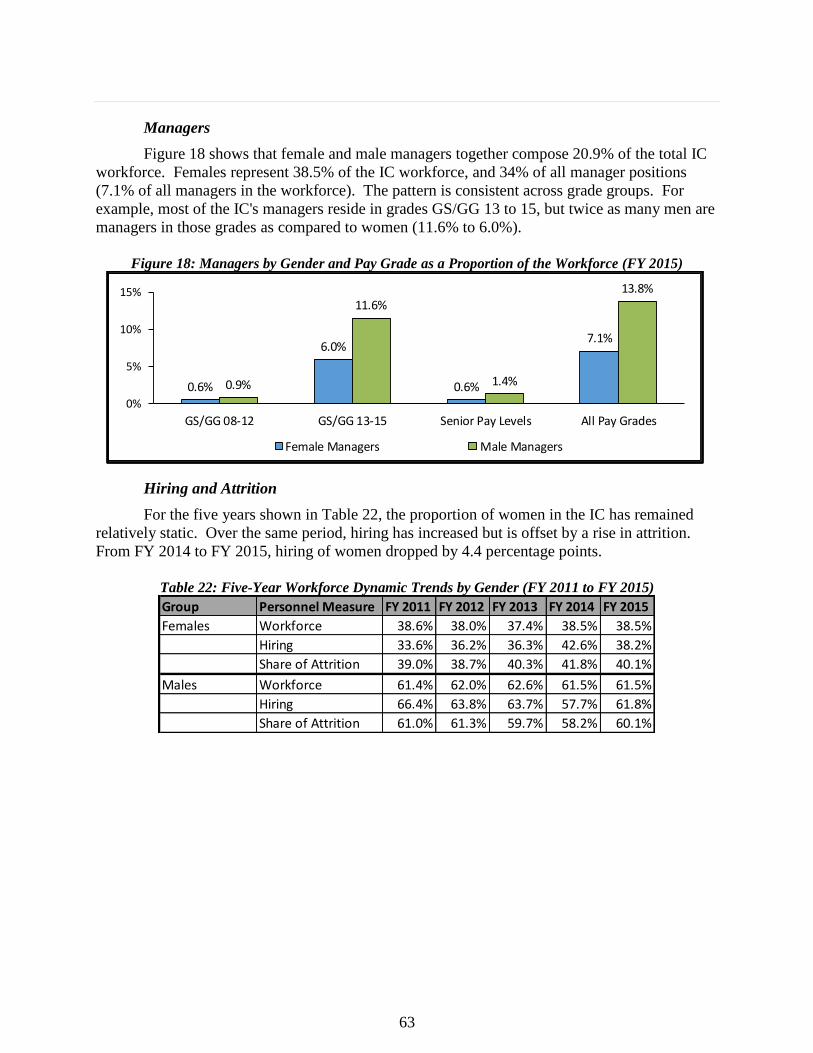
63
Managers
Figure 18 shows that female and male managers together compose 20.9% of the total IC
workforce. Females represent 38.5% of the IC workforce, and 34% of all manager positions
(7.1% of all managers in the workforce). The pattern is consistent across grade groups. For
example, most of the IC's managers reside in grades GS/GG 13 to 15, but twice as many men are
managers in those grades as compared to women (11.6% to 6.0%).
Figure 18: Managers by Gender and Pay Grade as a Proportion of the Workforce (FY 2015)
Hiring and Attrition
For the five years shown in Table 22, the proportion of women in the IC has remained
relatively static. Over the same period, hiring has increased but is offset by a rise in attrition.
From FY 2014 to FY 2015, hiring of women dropped by 4.4 percentage points.
Table 22: Five-Year Workforce Dynamic Trends by Gender (FY 2011 to FY 2015)
0.6%
6.0%
0.6%
7.1%
0.9%
11.6%
1.4%
13.8%
0%
5%
10%
15%
GS/GG 08-12 GS/GG 13-15 Senior Pay Levels All Pay Grades
Female Managers Male Managers
Group Personnel Measure FY 2011 FY 2012 FY 2013 FY 2014 FY 2015
Females Workforce 38.6% 38.0% 37.4% 38.5% 38.5%
Hiring 33.6% 36.2% 36.3% 42.6% 38.2%
Share of Attrition 39.0% 38.7% 40.3% 41.8% 40.1%
Males Workforce 61.4% 62.0% 62.6% 61.5% 61.5%
Hiring 66.4% 63.8% 63.7% 57.7% 61.8%
Share of Attrition 61.0% 61.3% 59.7% 58.2% 60.1%
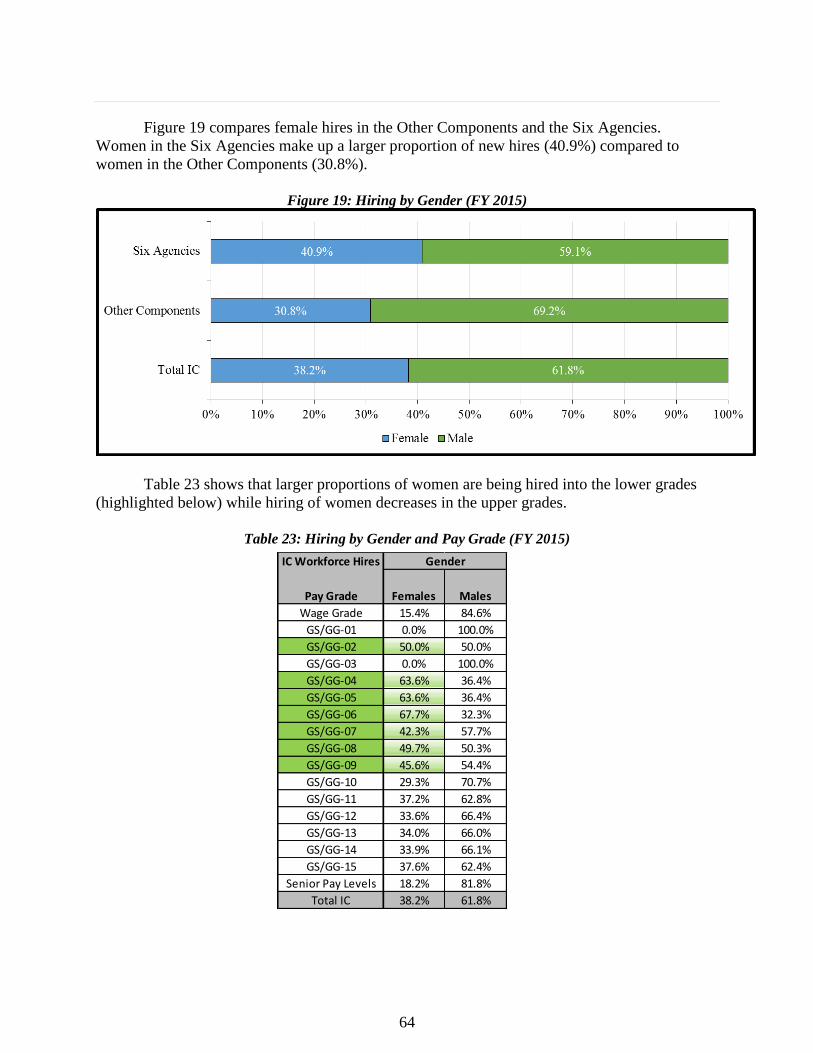
64
Figure 19 compares female hires in the Other Components and the Six Agencies.
Women in the Six Agencies make up a larger proportion of new hires (40.9%) compared to
women in the Other Components (30.8%).
Figure 19: Hiring by Gender (FY 2015)
Table 23 shows that larger proportions of women are being hired into the lower grades
(highlighted below) while hiring of women decreases in the upper grades.
Table 23: Hiring by Gender and Pay Grade (FY 2015)
IC Workforce Hires
Pay Grade Females Males
Wage Grade 15.4% 84.6%
GS/GG-01 0.0% 100.0%
GS/GG-02 50.0% 50.0%
GS/GG-03 0.0% 100.0%
GS/GG-04 63.6% 36.4%
GS/GG-05 63.6% 36.4%
GS/GG-06 67.7% 32.3%
GS/GG-07 42.3% 57.7%
GS/GG-08 49.7% 50.3%
GS/GG-09 45.6% 54.4%
GS/GG-10 29.3% 70.7%
GS/GG-11 37.2% 62.8%
GS/GG-12 33.6% 66.4%
GS/GG-13 34.0% 66.0%
GS/GG-14 33.9% 66.1%
GS/GG-15 37.6% 62.4%
Senior Pay Levels 18.2% 81.8%
Total IC 38.2% 61.8%
Gender
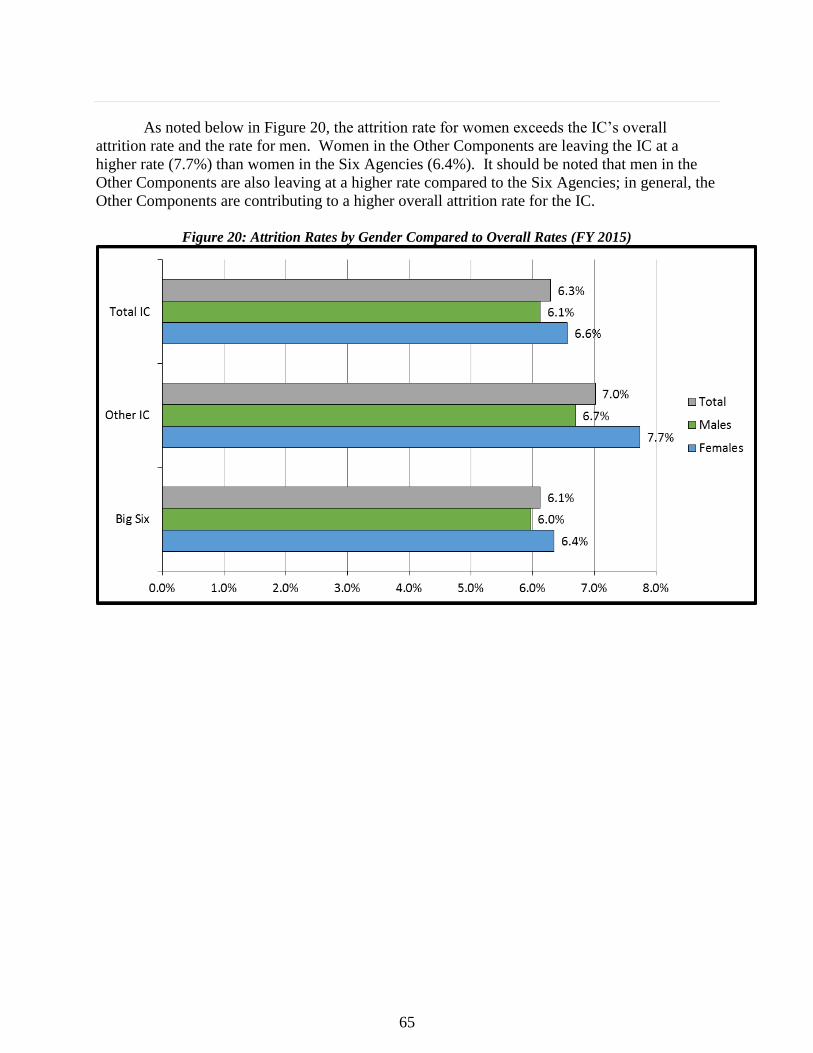
65
As noted below in Figure 20, the attrition rate for women exceeds the IC’s overall
attrition rate and the rate for men. Women in the Other Components are leaving the IC at a
higher rate (7.7%) than women in the Six Agencies (6.4%). It should be noted that men in the
Other Components are also leaving at a higher rate compared to the Six Agencies; in general, the
Other Components are contributing to a higher overall attrition rate for the IC.
Figure 20: Attrition Rates by Gender Compared to Overall Rates (FY 2015)
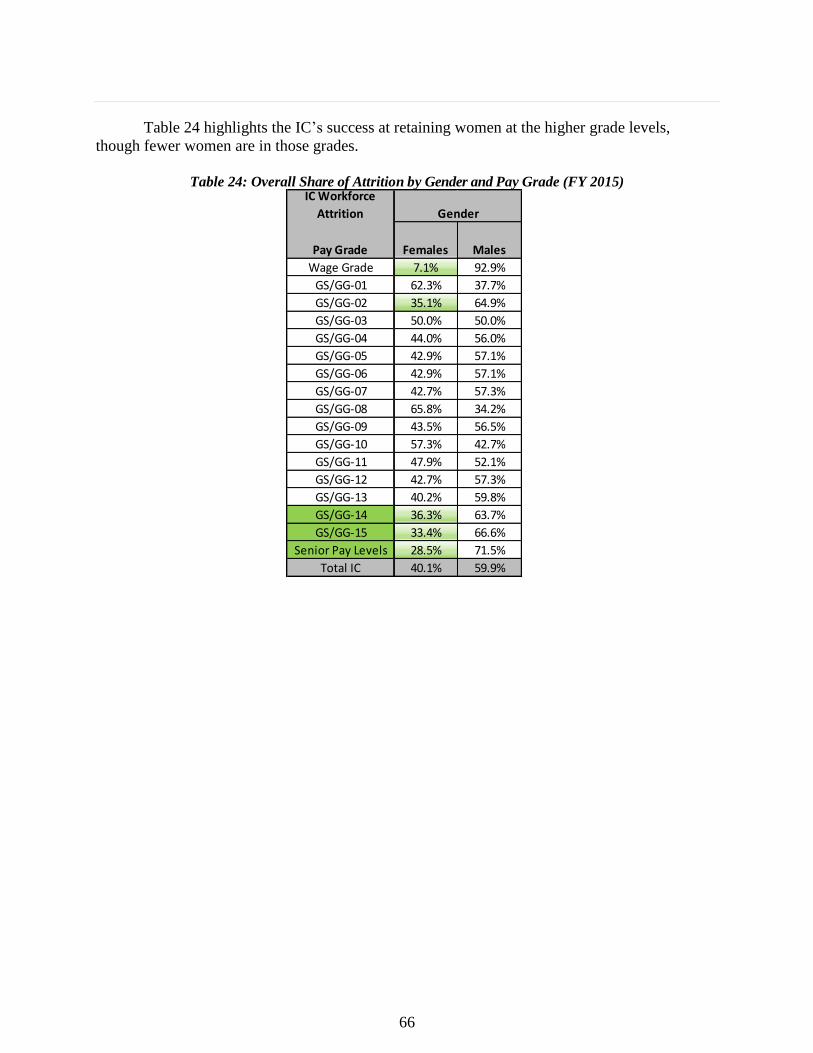
66
Table 24 highlights the IC’s success at retaining women at the higher grade levels,
though fewer women are in those grades.
Table 24: Overall Share of Attrition by Gender and Pay Grade (FY 2015)
IC Workforce
Attrition
Pay Grade Females Males
Wage Grade 7.1% 92.9%
GS/GG-01 62.3% 37.7%
GS/GG-02 35.1% 64.9%
GS/GG-03 50.0% 50.0%
GS/GG-04 44.0% 56.0%
GS/GG-05 42.9% 57.1%
GS/GG-06 42.9% 57.1%
GS/GG-07 42.7% 57.3%
GS/GG-08 65.8% 34.2%
GS/GG-09 43.5% 56.5%
GS/GG-10 57.3% 42.7%
GS/GG-11 47.9% 52.1%
GS/GG-12 42.7% 57.3%
GS/GG-13 40.2% 59.8%
GS/GG-14 36.3% 63.7%
GS/GG-15 33.4% 66.6%
Senior Pay Levels 28.5% 71.5%
Total IC 40.1% 59.9%
Gender
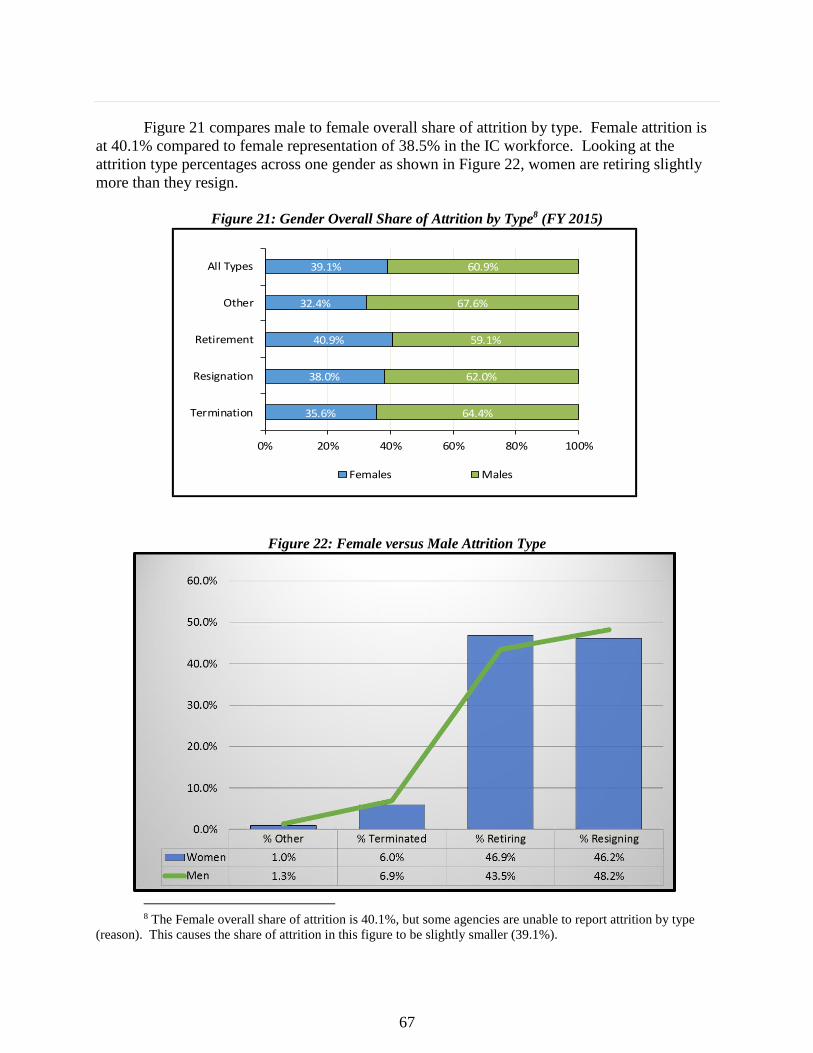
67
Figure 21 compares male to female overall share of attrition by type. Female attrition is
at 40.1% compared to female representation of 38.5% in the IC workforce. Looking at the
attrition type percentages across one gender as shown in Figure 22, women are retiring slightly
more than they resign.
Figure 21: Gender Overall Share of Attrition by Type8 (FY 2015)
Figure 22: Female versus Male Attrition Type
8 The Female overall share of attrition is 40.1%, but some agencies are unable to report attrition by type
(reason). This causes the share of attrition in this figure to be slightly smaller (39.1%).
35.6%
38.0%
40.9%
32.4%
39.1%
64.4%
62.0%
59.1%
67.6%
60.9%
0% 20% 40% 60% 80% 100%
Termination
Resignation
Retirement
Other
All Types
Females Males
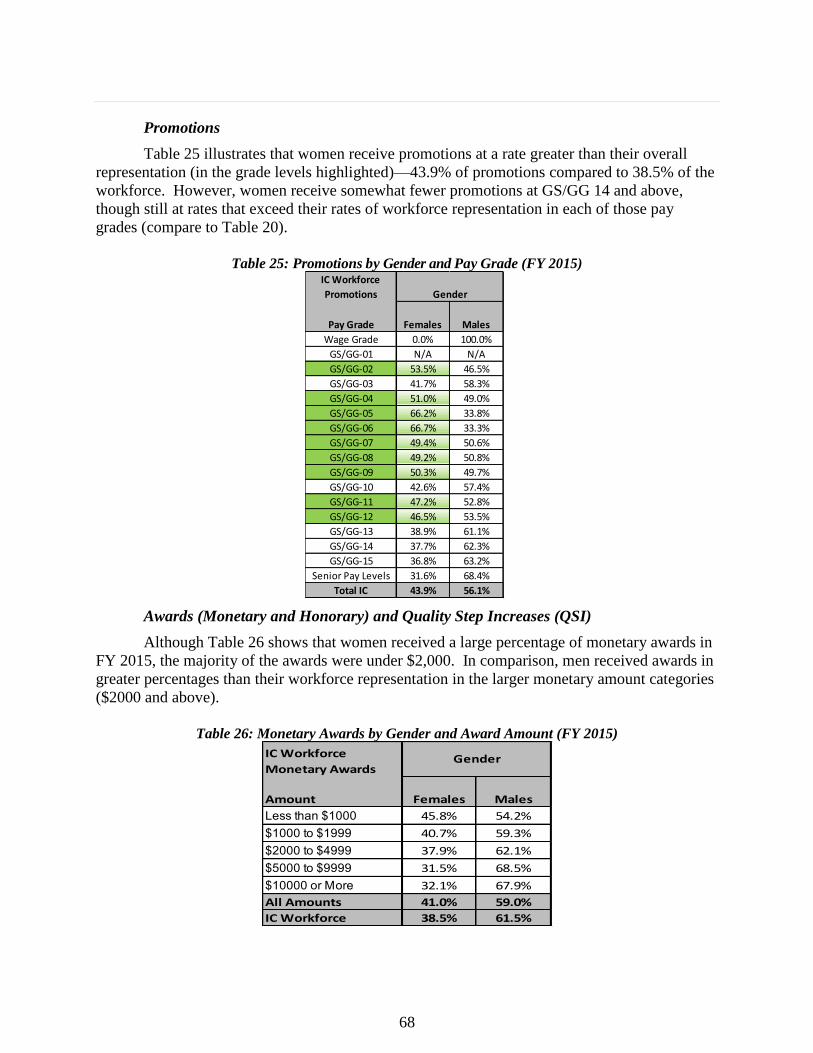
68
Promotions
Table 25 illustrates that women receive promotions at a rate greater than their overall
representation (in the grade levels highlighted)—43.9% of promotions compared to 38.5% of the
workforce. However, women receive somewhat fewer promotions at GS/GG 14 and above,
though still at rates that exceed their rates of workforce representation in each of those pay
grades (compare to Table 20).
Table 25: Promotions by Gender and Pay Grade (FY 2015)
Awards (Monetary and Honorary) and Quality Step Increases (QSI)
Although Table 26 shows that women received a large percentage of monetary awards in
FY 2015, the majority of the awards were under $2,000. In comparison, men received awards in
greater percentages than their workforce representation in the larger monetary amount categories
($2000 and above).
Table 26: Monetary Awards by Gender and Award Amount (FY 2015)
IC Workforce
Promotions
Pay Grade Females Males
Wage Grade 0.0% 100.0%
GS/GG-01 N/A N/A
GS/GG-02 53.5% 46.5%
GS/GG-03 41.7% 58.3%
GS/GG-04 51.0% 49.0%
GS/GG-05 66.2% 33.8%
GS/GG-06 66.7% 33.3%
GS/GG-07 49.4% 50.6%
GS/GG-08 49.2% 50.8%
GS/GG-09 50.3% 49.7%
GS/GG-10 42.6% 57.4%
GS/GG-11 47.2% 52.8%
GS/GG-12 46.5% 53.5%
GS/GG-13 38.9% 61.1%
GS/GG-14 37.7% 62.3%
GS/GG-15 36.8% 63.2%
Senior Pay Levels 31.6% 68.4%
Total IC 43.9% 56.1%
Gender
IC Workforce
Monetary Awards
Amount Females Males
Less than $1000 45.8% 54.2%
$1000 to $1999 40.7% 59.3%
$2000 to $4999 37.9% 62.1%
$5000 to $9999 31.5% 68.5%
$10000 or More 32.1% 67.9%
All Amounts 41.0% 59.0%
IC Workforce 38.5% 61.5%
Gender
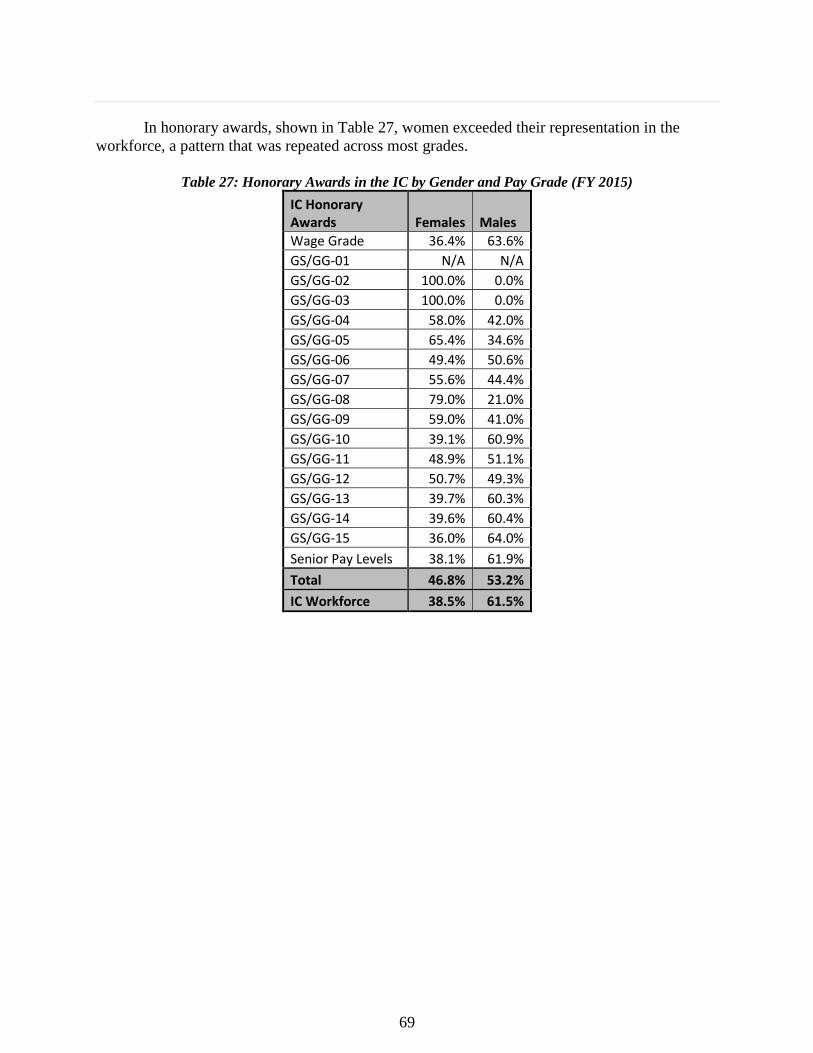
69
In honorary awards, shown in Table 27, women exceeded their representation in the
workforce, a pattern that was repeated across most grades.
Table 27: Honorary Awards in the IC by Gender and Pay Grade (FY 2015)
IC Honorary Awards Females Males
Wage Grade 36.4% 63.6%
GS/GG-01 N/A N/A
GS/GG-02 100.0% 0.0%
GS/GG-03 100.0% 0.0%
GS/GG-04 58.0% 42.0%
GS/GG-05 65.4% 34.6%
GS/GG-06 49.4% 50.6%
GS/GG-07 55.6% 44.4%
GS/GG-08 79.0% 21.0%
GS/GG-09 59.0% 41.0%
GS/GG-10 39.1% 60.9%
GS/GG-11 48.9% 51.1%
GS/GG-12 50.7% 49.3%
GS/GG-13 39.7% 60.3%
GS/GG-14 39.6% 60.4%
GS/GG-15 36.0% 64.0%
Senior Pay Levels 38.1% 61.9%
Total 46.8% 53.2%
IC Workforce 38.5% 61.5%
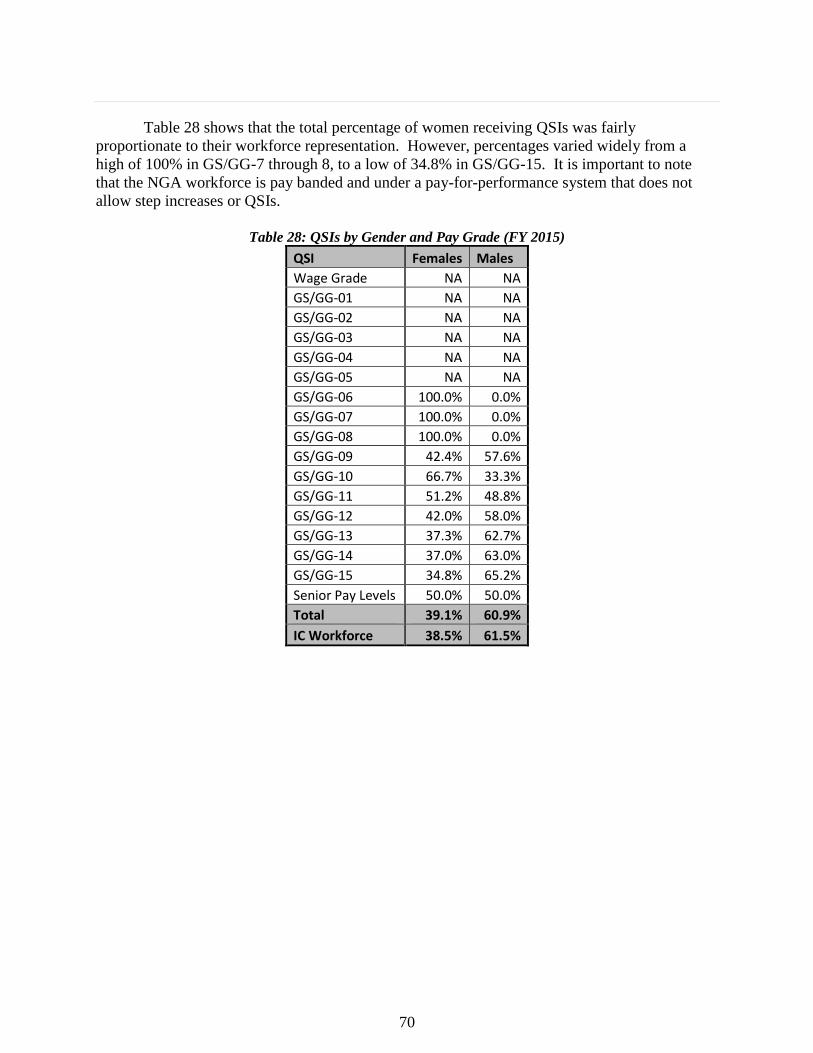
70
Table 28 shows that the total percentage of women receiving QSIs was fairly
proportionate to their workforce representation. However, percentages varied widely from a
high of 100% in GS/GG-7 through 8, to a low of 34.8% in GS/GG-15. It is important to note
that the NGA workforce is pay banded and under a pay-for-performance system that does not
allow step increases or QSIs.
Table 28: QSIs by Gender and Pay Grade (FY 2015)
QSI Females Males
Wage Grade NA NA
GS/GG-01 NA NA
GS/GG-02 NA NA
GS/GG-03 NA NA
GS/GG-04 NA NA
GS/GG-05 NA NA
GS/GG-06 100.0% 0.0%
GS/GG-07 100.0% 0.0%
GS/GG-08 100.0% 0.0%
GS/GG-09 42.4% 57.6%
GS/GG-10 66.7% 33.3%
GS/GG-11 51.2% 48.8%
GS/GG-12 42.0% 58.0%
GS/GG-13 37.3% 62.7%
GS/GG-14 37.0% 63.0%
GS/GG-15 34.8% 65.2%
Senior Pay Levels 50.0% 50.0%
Total 39.1% 60.9%
IC Workforce 38.5% 61.5%
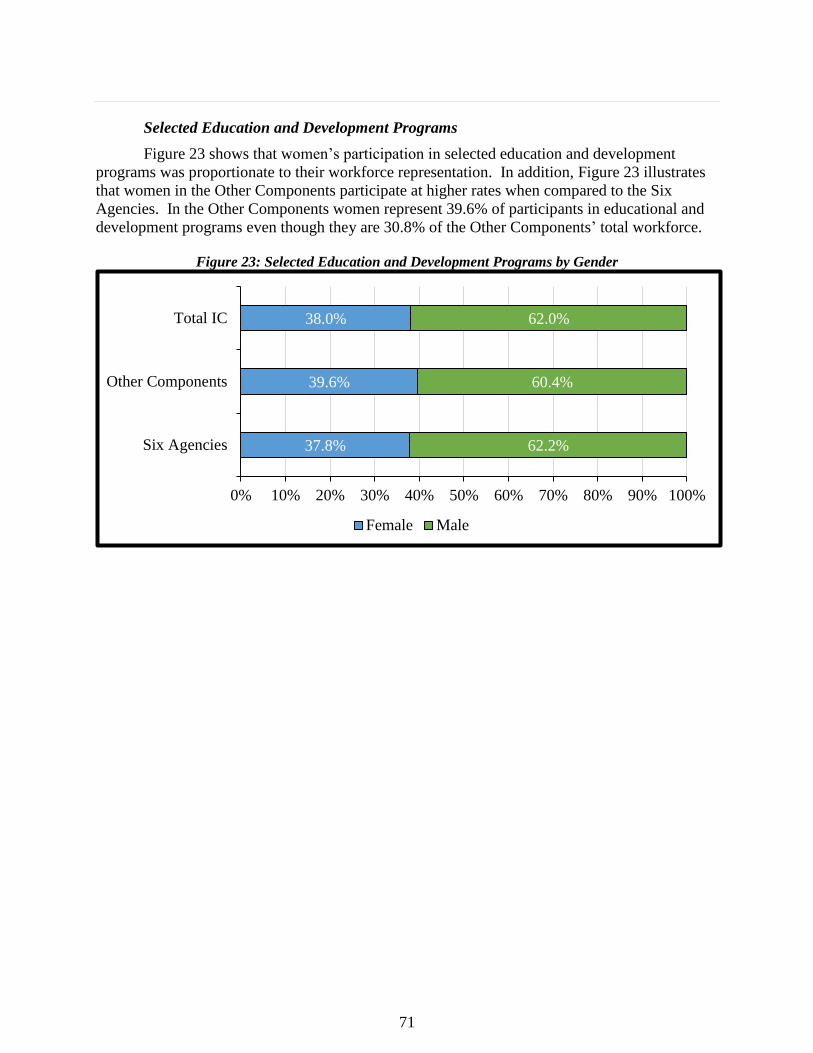
71
Selected Education and Development Programs
Figure 23 shows that women’s participation in selected education and development
programs was proportionate to their workforce representation. In addition, Figure 23 illustrates
that women in the Other Components participate at higher rates when compared to the Six
Agencies. In the Other Components women represent 39.6% of participants in educational and
development programs even though they are 30.8% of the Other Components’ total workforce.
Figure 23: Selected Education and Development Programs by Gender
37.8%
39.6%
38.0%
62.2%
60.4%
62.0%
0% 10% 20% 30% 40% 50% 60% 70% 80% 90% 100%
Six Agencies
Other Components
Total IC
Female Male

72
Figure 24 presents a gender analysis of select programs, showing that most participants
are men. The National Defense Intelligence College (NDIC) was the program with the highest
proportion of women. Conversely, Command and Staff Schools had the lowest female
participation rate in FY 2015.
Figure 24: Selected Educational Development by Program and Gender (FY 2015)
PRISP and Stokes
As noted in the previous chapter, PRISP is a college scholarship and internship program
that allows the IC to hire college graduates with certain skills critical to the IC (e.g., engineering,
mathematics, economics, physics, etc.). As shown in Table 29, women’s participation in PRISP,
has increased gradually from FY 2011 to FY 2013; after a slight drop in FY 2014, it then
increased by 3.9 percentage points in FY 2015.
Table 29: Five-Year Trends in PRISP by Gender (FY 2011-FY 2015)
PRISP
FY11 FY12 FY13 FY14 FY15
Females 30.1% 38.7% 42.0% 40.4% 44.3%
Males 69.9% 61.3% 58.0% 59.6% 55.7%

73
The Stokes scholarship program selects and prepares college students for careers in the
IC. It is important to note that only four of the agencies in the IC participate in the Stokes
program: NSA, CIA, DIA, and NGA. As shown in Table 30, female representation in Stokes for
the past five years has been less than the representation of females within the IC (with the
exception of FY 2012).
Table 30: Five-Year Trends in the Stokes Program by Gender (FY 2011 to FY 2015)
Joint Duty Program
As previously mentioned, JD is a personnel rotation program, open to GS/GG 11 through
Senior Positions, allowing employees to work for limited terms in different IC elements. JD
credit is a prerequisite for promotion to Senior Positions within IC elements. It is relevant to
note that 91% of the IC’s population resides in GS/GG 11 to Senior Positions. Of the personnel
in these grades, 18.3% have earned JD credit and in FY 2015, 1.2% of those with credit were
promoted. In the overall IC GS/GG 11 and higher grade group, females make up 37.3% of the
population, and Table 31 demonstrates that women represent 34.5% of the IC JD credit
population. This means that 16.9% of the GS/GG-11 and higher female poulation had earned JD
credit by September 2015. In comparison to the IC workforce at these grade levels (GS-11 to
Senior Positions), there are slightly more females in the JD credit population for grades GS/GG-
13 and higher than in the IC workforce. Among personnel with JD credit who were promoted in
FY 2015, a smaller share of women (40.7%) were promoted than men (59.3%), but women with
JD credit were promoted at a higher rate than their workforce representation in the GS/GG-11
through Senior Pay Levels.
Table 31: Joint Duty Credits and Promotions by Gender and Grade (FY 2015)
Note. Table 31 does not include FBI and U.S. Treasury OIA data.
FY11 FY12 FY13 FY14 FY15
Females 26.0% 47.2% 28.8% 26.1% 31.7%
Males 74.0% 52.8% 71.2% 73.9% 68.3%
STOKES

74
[THIS PAGE LEFT BLANK]
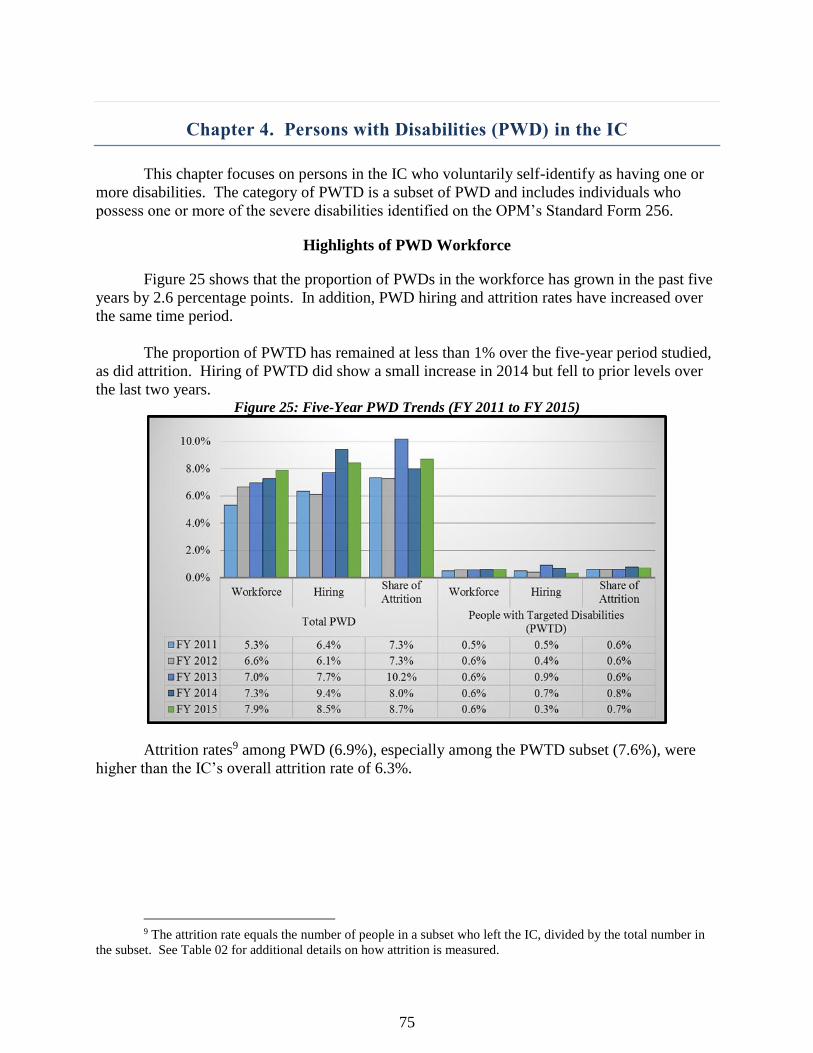
75
Chapter 4. Persons with Disabilities (PWD) in the IC
This chapter focuses on persons in the IC who voluntarily self-identify as having one or
more disabilities. The category of PWTD is a subset of PWD and includes individuals who
possess one or more of the severe disabilities identified on the OPM’s Standard Form 256.
Highlights of PWD Workforce
Figure 25 shows that the proportion of PWDs in the workforce has grown in the past five
years by 2.6 percentage points. In addition, PWD hiring and attrition rates have increased over
the same time period.
The proportion of PWTD has remained at less than 1% over the five-year period studied,
as did attrition. Hiring of PWTD did show a small increase in 2014 but fell to prior levels over
the last two years. Figure 25: Five-Year PWD Trends (FY 2011 to FY 2015)
Attrition rates9 among PWD (6.9%), especially among the PWTD subset (7.6%), were
higher than the IC’s overall attrition rate of 6.3%.
9 The attrition rate equals the number of people in a subset who left the IC, divided by the total number in
the subset. See Table 02 for additional details on how attrition is measured.
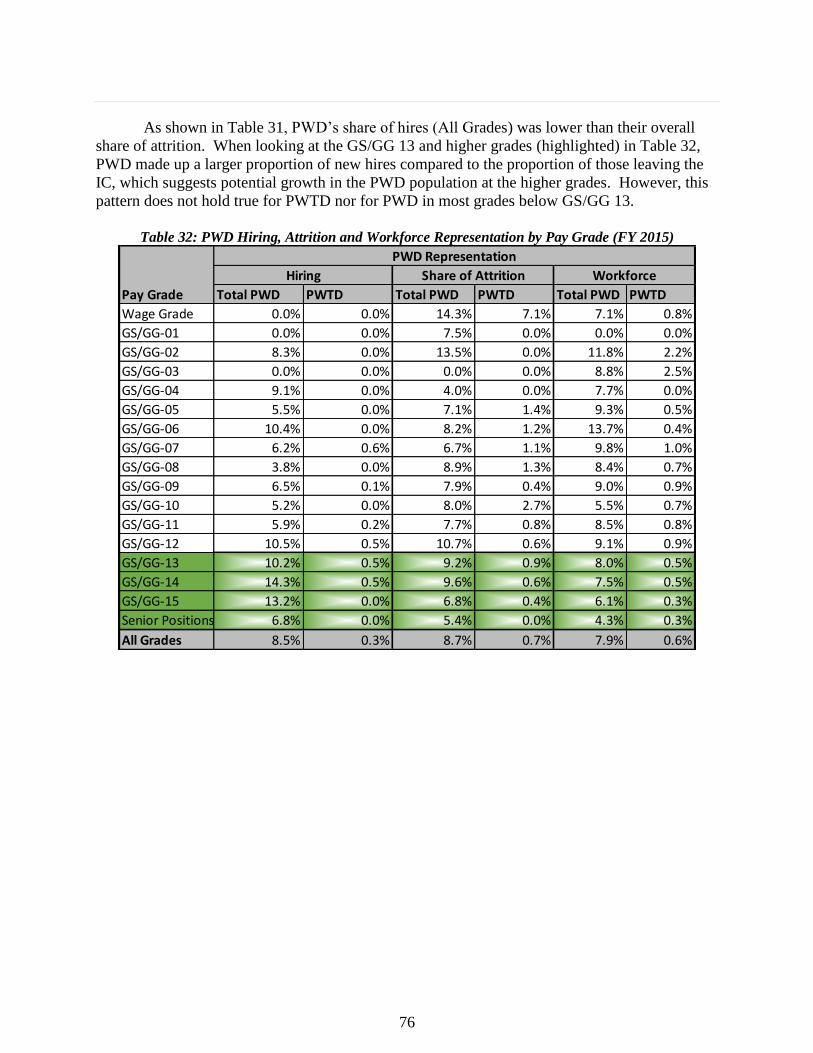
76
As shown in Table 31, PWD’s share of hires (All Grades) was lower than their overall
share of attrition. When looking at the GS/GG 13 and higher grades (highlighted) in Table 32,
PWD made up a larger proportion of new hires compared to the proportion of those leaving the
IC, which suggests potential growth in the PWD population at the higher grades. However, this
pattern does not hold true for PWTD nor for PWD in most grades below GS/GG 13.
Table 32: PWD Hiring, Attrition and Workforce Representation by Pay Grade (FY 2015)
Total PWD PWTD Total PWD PWTD Total PWD PWTD
Wage Grade 0.0% 0.0% 14.3% 7.1% 7.1% 0.8%
GS/GG-01 0.0% 0.0% 7.5% 0.0% 0.0% 0.0%
GS/GG-02 8.3% 0.0% 13.5% 0.0% 11.8% 2.2%
GS/GG-03 0.0% 0.0% 0.0% 0.0% 8.8% 2.5%
GS/GG-04 9.1% 0.0% 4.0% 0.0% 7.7% 0.0%
GS/GG-05 5.5% 0.0% 7.1% 1.4% 9.3% 0.5%
GS/GG-06 10.4% 0.0% 8.2% 1.2% 13.7% 0.4%
GS/GG-07 6.2% 0.6% 6.7% 1.1% 9.8% 1.0%
GS/GG-08 3.8% 0.0% 8.9% 1.3% 8.4% 0.7%
GS/GG-09 6.5% 0.1% 7.9% 0.4% 9.0% 0.9%
GS/GG-10 5.2% 0.0% 8.0% 2.7% 5.5% 0.7%
GS/GG-11 5.9% 0.2% 7.7% 0.8% 8.5% 0.8%
GS/GG-12 10.5% 0.5% 10.7% 0.6% 9.1% 0.9%
GS/GG-13 10.2% 0.5% 9.2% 0.9% 8.0% 0.5%
GS/GG-14 14.3% 0.5% 9.6% 0.6% 7.5% 0.5%
GS/GG-15 13.2% 0.0% 6.8% 0.4% 6.1% 0.3%
Senior Positions 6.8% 0.0% 5.4% 0.0% 4.3% 0.3%
All Grades 8.5% 0.3% 8.7% 0.7% 7.9% 0.6%
Pay Grade
PWD Representation
Hiring Share of Attrition Workforce
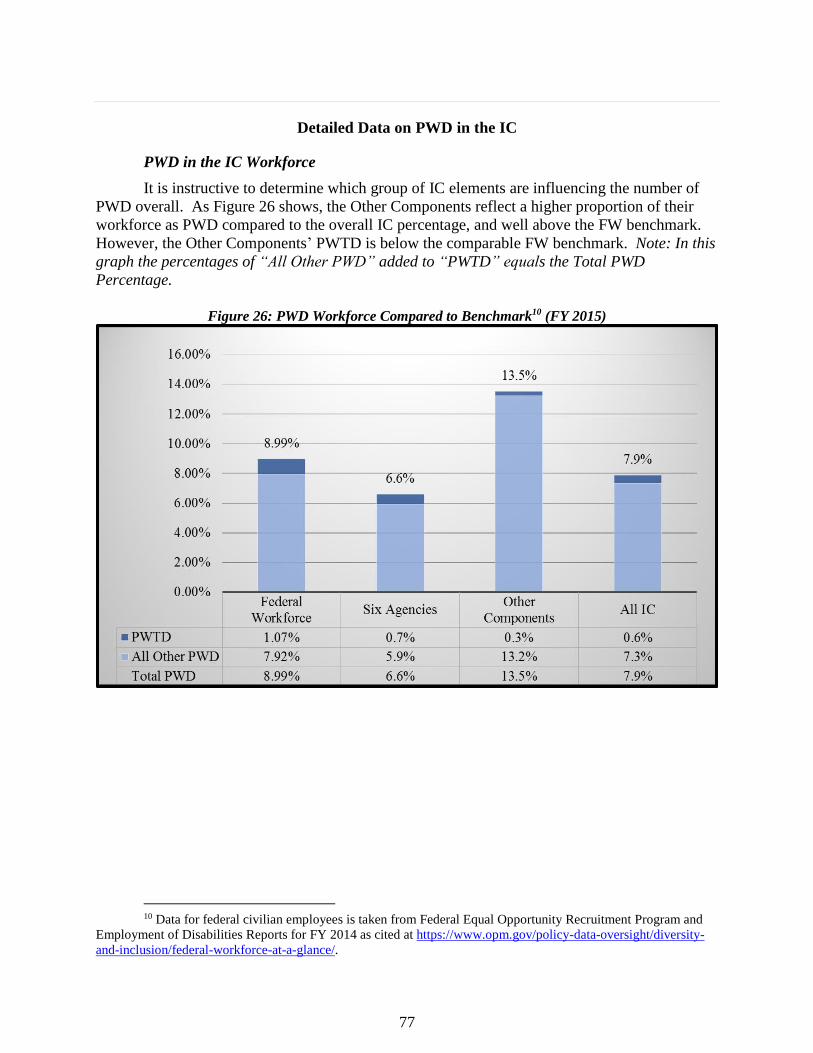
77
Detailed Data on PWD in the IC
PWD in the IC Workforce
It is instructive to determine which group of IC elements are influencing the number of
PWD overall. As Figure 26 shows, the Other Components reflect a higher proportion of their
workforce as PWD compared to the overall IC percentage, and well above the FW benchmark.
However, the Other Components’ PWTD is below the comparable FW benchmark. Note: In this
graph the percentages of “All Other PWD” added to “PWTD” equals the Total PWD
Percentage.
Figure 26: PWD Workforce Compared to Benchmark10 (FY 2015)
10 Data for federal civilian employees is taken from Federal Equal Opportunity Recruitment Program and
Employment of Disabilities Reports for FY 2014 as cited at https://www.opm.gov/policy-data-oversight/diversity-
and-inclusion/federal-workforce-at-a-glance/.

78
Hiring and Attrition
The Other Components reflect a larger proportion of PWD as a percentage of their
workforce (Figure 26) and also contribute to more new hires, as detailed in Figure 27. However,
the Six Agencies hire a greater share of PWTD.
Figure 27: Hiring PWD in the IC (FY 2015)
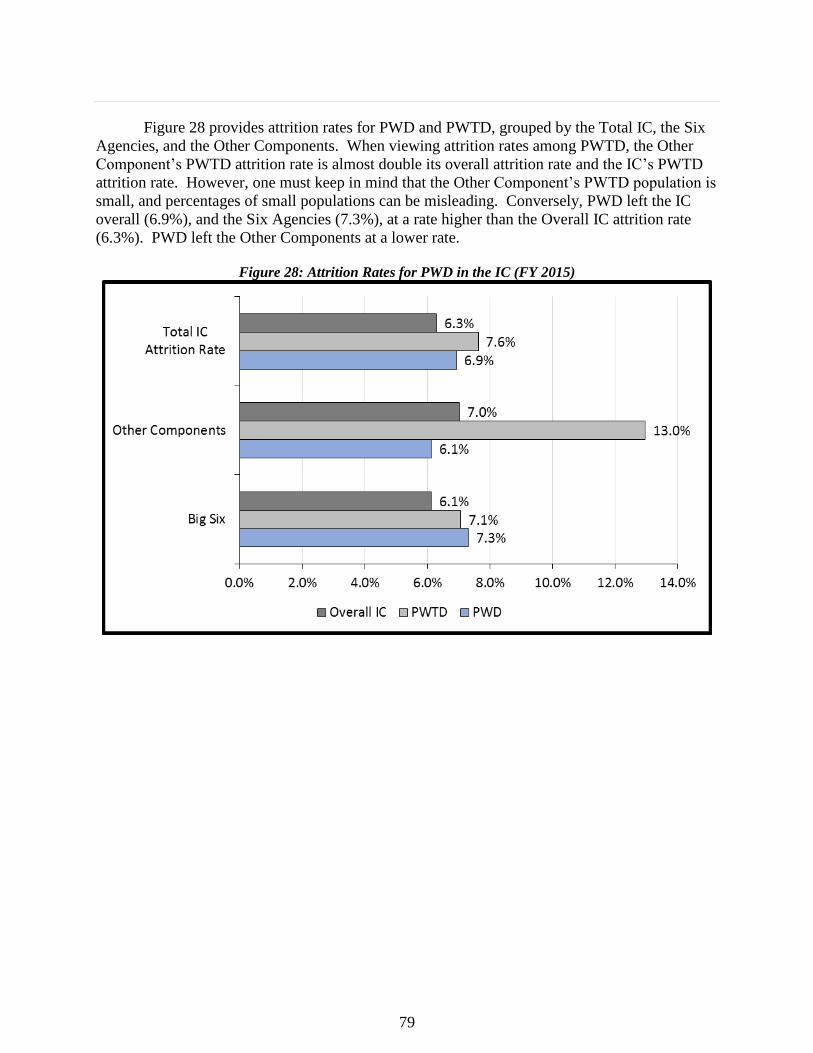
79
Figure 28 provides attrition rates for PWD and PWTD, grouped by the Total IC, the Six
Agencies, and the Other Components. When viewing attrition rates among PWTD, the Other
Component’s PWTD attrition rate is almost double its overall attrition rate and the IC’s PWTD
attrition rate. However, one must keep in mind that the Other Component’s PWTD population is
small, and percentages of small populations can be misleading. Conversely, PWD left the IC
overall (6.9%), and the Six Agencies (7.3%), at a rate higher than the Overall IC attrition rate
(6.3%). PWD left the Other Components at a lower rate.
Figure 28: Attrition Rates for PWD in the IC (FY 2015)
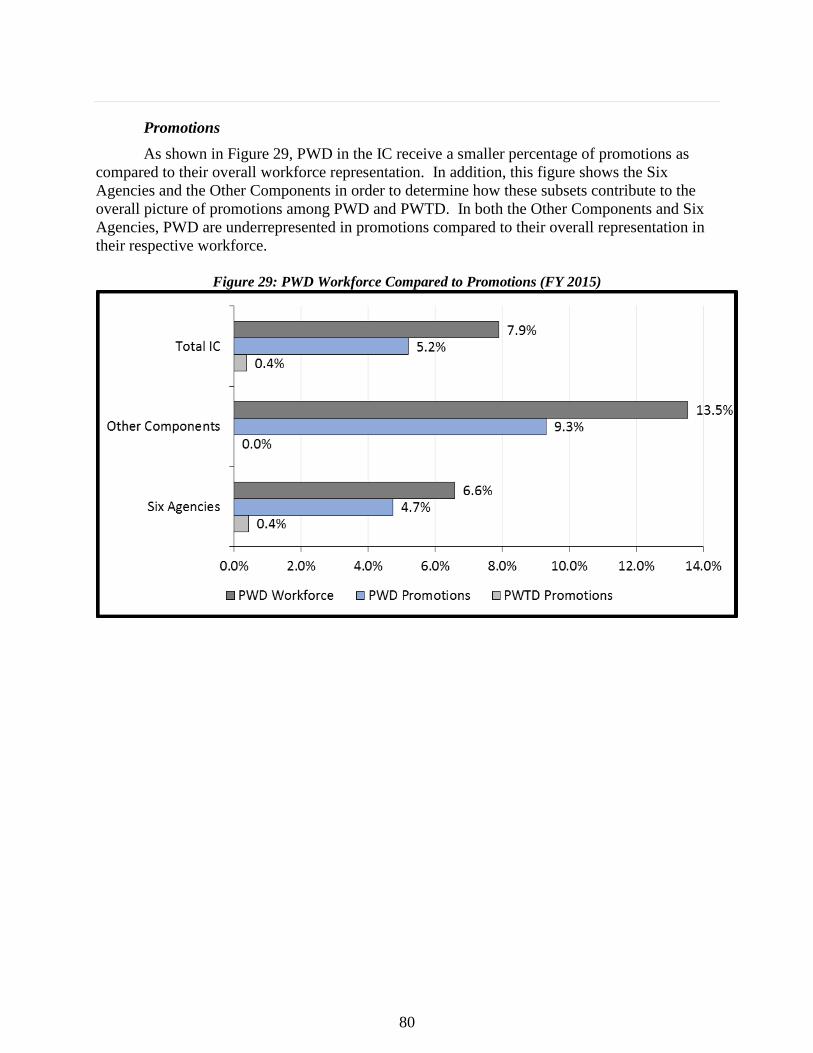
80
Promotions
As shown in Figure 29, PWD in the IC receive a smaller percentage of promotions as
compared to their overall workforce representation. In addition, this figure shows the Six
Agencies and the Other Components in order to determine how these subsets contribute to the
overall picture of promotions among PWD and PWTD. In both the Other Components and Six
Agencies, PWD are underrepresented in promotions compared to their overall representation in
their respective workforce.
Figure 29: PWD Workforce Compared to Promotions (FY 2015)
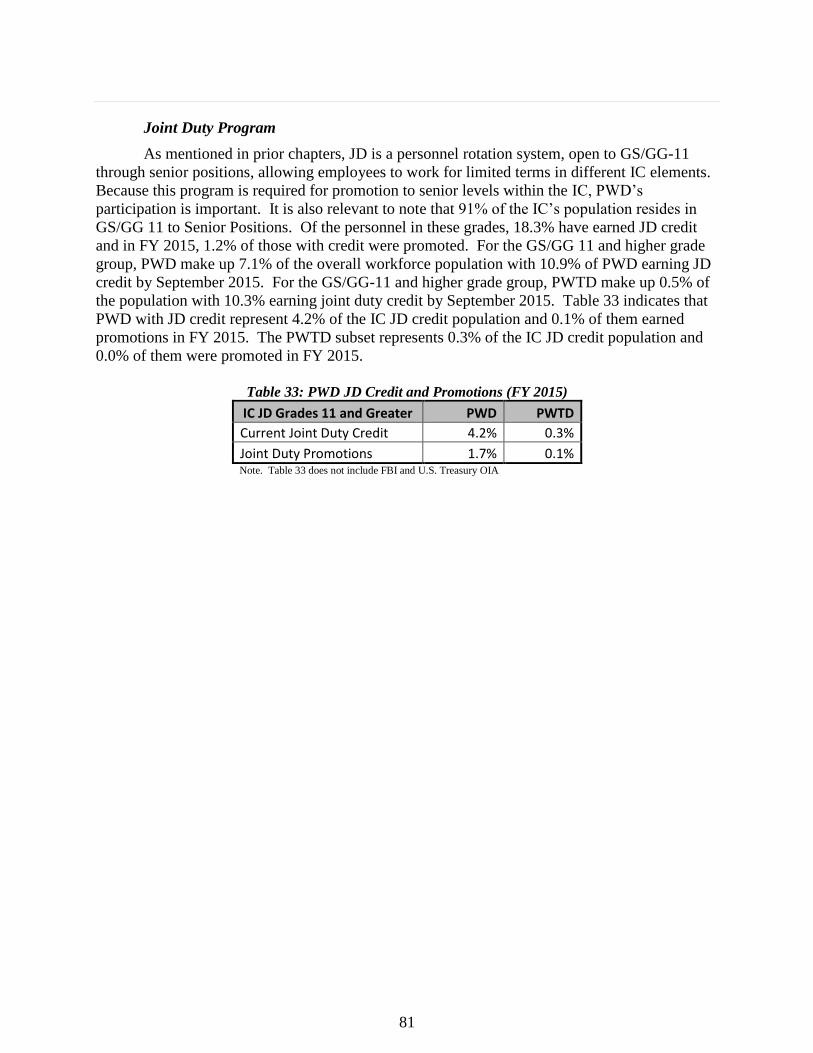
81
Joint Duty Program
As mentioned in prior chapters, JD is a personnel rotation system, open to GS/GG-11
through senior positions, allowing employees to work for limited terms in different IC elements.
Because this program is required for promotion to senior levels within the IC, PWD’s
participation is important. It is also relevant to note that 91% of the IC’s population resides in
GS/GG 11 to Senior Positions. Of the personnel in these grades, 18.3% have earned JD credit
and in FY 2015, 1.2% of those with credit were promoted. For the GS/GG 11 and higher grade
group, PWD make up 7.1% of the overall workforce population with 10.9% of PWD earning JD
credit by September 2015. For the GS/GG-11 and higher grade group, PWTD make up 0.5% of
the population with 10.3% earning joint duty credit by September 2015. Table 33 indicates that
PWD with JD credit represent 4.2% of the IC JD credit population and 0.1% of them earned
promotions in FY 2015. The PWTD subset represents 0.3% of the IC JD credit population and
0.0% of them were promoted in FY 2015.
Table 33: PWD JD Credit and Promotions (FY 2015)
IC JD Grades 11 and Greater PWD PWTD
Current Joint Duty Credit 4.2% 0.3%
Joint Duty Promotions 1.7% 0.1% Note. Table 33 does not include FBI and U.S. Treasury OIA

82
[THIS PAGE LEFT BLANK]
83
Appendix A – IC Centers of Academic Excellence Program
A. BACKGROUND
The Intelligence Authorization Act of 2004 authorized a pilot project for the ODNI to
develop and expand “opportunities in the Intelligence Community (IC) for women, minorities,
and individuals with diverse ethnic and cultural backgrounds, skills, language proficiency, and
expertise through providing grants to competitively chosen U.S. universities” (Public Law 108-
177, Sec. 319). The Intelligence Authorization Act of 2010 amended Section 1024 of the
National Security Act (50 U.S.C. 3224) to establish the successor Intelligence Officer Training
Program as a permanently funded program and the IC maintained the original CAE moniker.
In October 2011, program management responsibility transitioned from the ODNI to the
DIA and continues to be carried out under a Memorandum of Understanding between the ODNI
and DIA. On behalf of the IC, the ODNI designated the Director of DIA to provide grants under
the IC CAE Program to institutions of higher education…for purposes related to curriculum or
program development, faculty development, laboratory equipment or improvements, faculty
research, programs of study in intermediate and advanced foreign languages of immediate
interest to the IC, and relevant study-abroad programs and cultural immersion programs…” The
Memorandum of Understanding is effective until 2018.
The IC CAE Program provides grants to competitively selected, regionally accredited
U.S. four-year colleges and universities to support the design and development of intelligence-
related curricula. The IC CAE Program's emphasis is on building long-term partnerships with
universities across the nation to develop sustainable national security and intelligence education
programs. These programs increase the pool of women, minorities, and individuals with diverse
ethnic and cultural backgrounds who possess highly desired skills and competencies in areas of
critical need to the IC.
B. ADMINISTRATION
The ODNI had administrative responsibility for the IC CAE Program from the 2004 pilot
until its transfer to DIA in 2011. DIA’s stewardship of the IC CAE Program includes
administrative functions as well as the monitoring of grantee compliance to the Assistance
Agreement establishing the grant. The IC CAE Program’s Senior Advisory Board (SAB),
composed of senior representatives from the IC elements and intelligence organizations, provides
policy and decision-making guidance to the IC CAE Program Office. The IC CAE Program
Office follows IC CAE Program Guidance and serves as liaison to the IC for community
resources, such as IC subject matter experts.
C. GRANT SELECTION PROCESS
Grants are awarded for a base year and renewable for an additional three or four option
years, at the conclusion of which funding becomes available for a new grant solicitation. A
Broad Agency Announcement (BAA) through www.grants.gov is used to solicit proposals from
84
higher education institutions to establish or enhance an intelligence-focused curriculum and
complementary academic programming. Universities completing their funding period remain
within the IC CAE program as sustaining universities and continue to participate in collaborative
interaction, such as annual meetings, seminars, and access to the IC CAE newsletter.
A BAA was issued in FY 2014 upon the end of the grant period for seven grants.
Between 2 January and 15 March 2014 the IC CAE Program Office received 61 applications; the
DIA Grants Officer deemed 54 qualified for further consideration. The Source Selection
Evaluation Board, consisting of 12 members of the IC CAE SAB, evaluated the merit of each
proposal as it relates to meeting eligibility, mission, and stated component requirements. As a
result, eight new grants were awarded. The following criteria formed the basis for the
evaluation:
1. Develop, modify, and integrate intelligence courses into academic programs;
2. Facilitate student participation in on-campus academic programs and other professional
development activities;
3. Provide students study abroad, cultural immersion, and regional studies opportunities;
4. Enable faculty research and professional development in support of an intelligence or
national security curriculum;
5. Hold annual colloquium or speaker series with higher education, government, and industry
partners in the region;
6. Establish and maintain a program management plan and a sustainment plan;
7. Make courses in languages of interest available; and
8. Adhere to CAE mission ethnic and cultural diversity which are traditionally underserved
populations. NOTE: Historically Black Colleges and Universities, Hispanic Serving
Institutions or Tribal will be graded Excellent.

85
Appendix B – Principles of Professional Ethics for the IC