Trends and Characteristics of the State and Local … · Trends and Characteristics of the State...
26
Trends and Characteristics of the State and Local Public Health Workforce Research-in-Progress Webinar November 12, 2014 Angela J. Beck, PhD, MPH Research Assistant Professor Associate Director, Center of Excellence in Public Health Workforce Studies University of Michigan School of Public Health
-
Upload
hoangthuan -
Category
Documents
-
view
229 -
download
0
Transcript of Trends and Characteristics of the State and Local … · Trends and Characteristics of the State...

Trends and Characteristics of the State and Local Public Health Workforce
Research-in-Progress Webinar
November 12, 2014
Angela J. Beck, PhD, MPH
Research Assistant Professor
Associate Director,
Center of Excellence in
Public Health Workforce Studies
University of Michigan School of Public Health

Center of Excellence in Public Health Workforce Studies
Established in 2009
Primarily funded by CDC
Interested in studies that assess and characterize public health workforce size, composition, and capacity to deliver services
Findings of Center studies available at www.phworkforce.org

Acknowledgments
This study was funded by the University of Kentucky National Coordinating Center for Public Health Services and Systems Research
Thanks to: Matthew Boulton, Rivka Liss-Levinson, Carolyn Leep
An article detailing this study is currently in press at the American Journal of Public Health
The Public Health Workforce
Highly-trained, competent workforce is essential for effective public health service delivery
Modest investments have been made nationally to systematically monitor workforce size, composition, demographics, and training/education background
Interest in workforce due to: budget cuts, health care reform, impending retirements
Public Health Workforce Assessment
No national system for monitoring the public health workforce
Enumeration estimates are derived from:
Data from professional association studies
Studies conducted by universities/PBRNs, etc.
National data sets

Governmental Public Health Workforce Enumeration, 2014
Beck AJ, Boulton ML, Coronado F. Enumeration of the governmental public health workforce, 2014. Am J Prev Med 2014;47(5S3):S306-S313.
Study Purpose To assess occupational characteristics of the state and
local public health workforce from 2010 to 2013
Determine whether workforce occupations vary by health department: Size of population served Geographic region Governance structure
Analyze whether the workforce “profile” changed over time
Profile: the occupational composition of the public health workforce

Methods
Data sources ASTHO Profile of State Public Health: 2010, 2012
NACCHO Profile of Local Health Departments: 2010, 2013
Sample State level: same 47 states in 2010 and 2012
Local level: 2,005 LHDs in 2010; 1,953 LHDs in 2013
Occupational category designation based on 14 categories recommended in previous enumeration studies1
1UM & UK Centers of Excellence. Strategies for Enumerating the Governmental Public Health Workforce, 2012.

Methods Measures
Governance structure: based on ASTHO designation of centralized/largely centralized; shared or mixed; decentralized/largely decentralized
Geographic region: ASTHO groupings of New England, South, Mid-Atlantic/Great Lakes, Mountain and Midwest, West
Population size: small, medium, large
ASTHO: <2.75M; 2,750,001-6.25M; >6.25M
NACCHO: <50,000; 50,000-499,999; >500,000
Methods Statistical Analysis
State-level data: direct comparison of 2010 data to 2012 (same 47 state health agencies)
Trends analyzed through percentage change
Local-level data: No direct comparison due to varying response rate of LHDs across the two surveys
Trends analyzed through percentage point differences between 2010 respondents and 2013 respondents
Data were adjusted to account for missingness and duplication between state/local respondents2
2Full study methods available in: Beck AJ, Boulton ML. Trends and characteristics of the state and local public health workforce, 2010-2013. Am J Public Health 2015; in press.

STATE-LEVEL RESULTS

State-Level Results From 2010 to 2012, the number of public health
workers declined from 104,522 to 100,064 FTEs (-4%)
Occupations with biggest decreases Public information specialist (-33%)
Public health informatics specialist (-29%)
Behavioral health professional (-20%)
Occupations with biggest increases Public health manager (11%)
Nutritionist (7%)
Environmental health worker (3%)
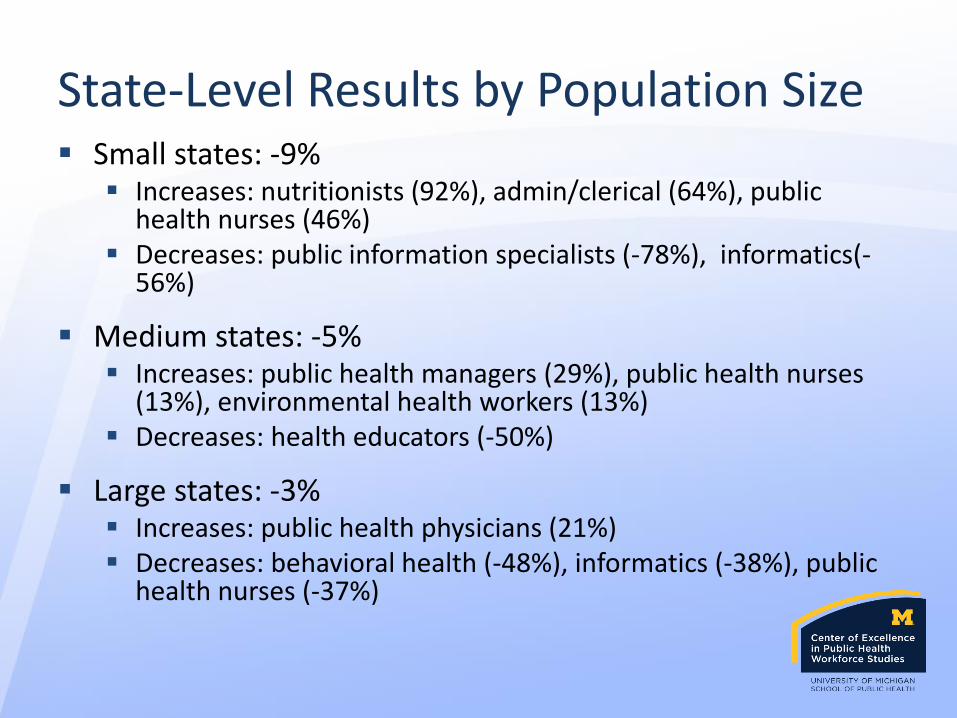
State-Level Results by Population Size Small states: -9%
Increases: nutritionists (92%), admin/clerical (64%), public health nurses (46%)
Decreases: public information specialists (-78%), informatics(-56%)
Medium states: -5% Increases: public health managers (29%), public health nurses
(13%), environmental health workers (13%) Decreases: health educators (-50%)
Large states: -3% Increases: public health physicians (21%) Decreases: behavioral health (-48%), informatics (-38%), public
health nurses (-37%)

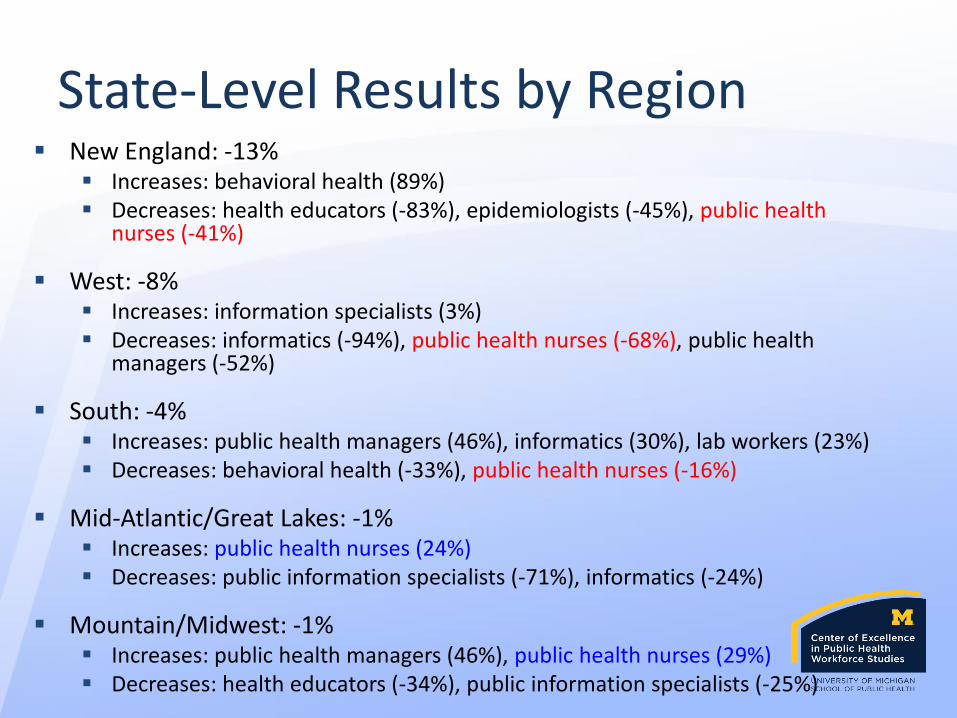
State-Level Results by Region New England: -13%
Increases: behavioral health (89%) Decreases: health educators (-83%), epidemiologists (-45%), public health
nurses (-41%)
West: -8% Increases: information specialists (3%) Decreases: informatics (-94%), public health nurses (-68%), public health
managers (-52%)
South: -4% Increases: public health managers (46%), informatics (30%), lab workers (23%) Decreases: behavioral health (-33%), public health nurses (-16%)
Mid-Atlantic/Great Lakes: -1% Increases: public health nurses (24%) Decreases: public information specialists (-71%), informatics (-24%)
Mountain/Midwest: -1% Increases: public health managers (46%), public health nurses (29%) Decreases: health educators (-34%), public information specialists (-25%)
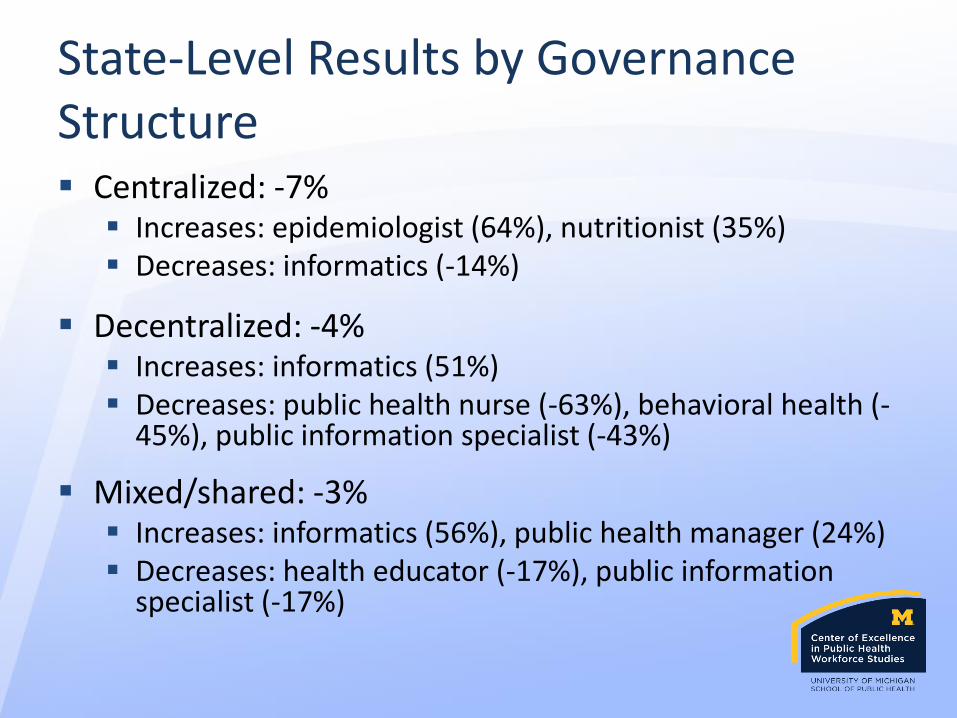
State-Level Results by Governance Structure Centralized: -7%
Increases: epidemiologist (64%), nutritionist (35%) Decreases: informatics (-14%)
Decentralized: -4% Increases: informatics (51%) Decreases: public health nurse (-63%), behavioral health (-
45%), public information specialist (-43%)
Mixed/shared: -3% Increases: informatics (56%), public health manager (24%) Decreases: health educator (-17%), public information
specialist (-17%)

LOCAL-LEVEL RESULTS
Local-Level Results
In 2010, 2,005 LHDs reported 140,822 FTEs
In 2013, 1,953 LHDs reported 125,688 FTEs
Overall proportion of workers was relatively stable for most occupational categories
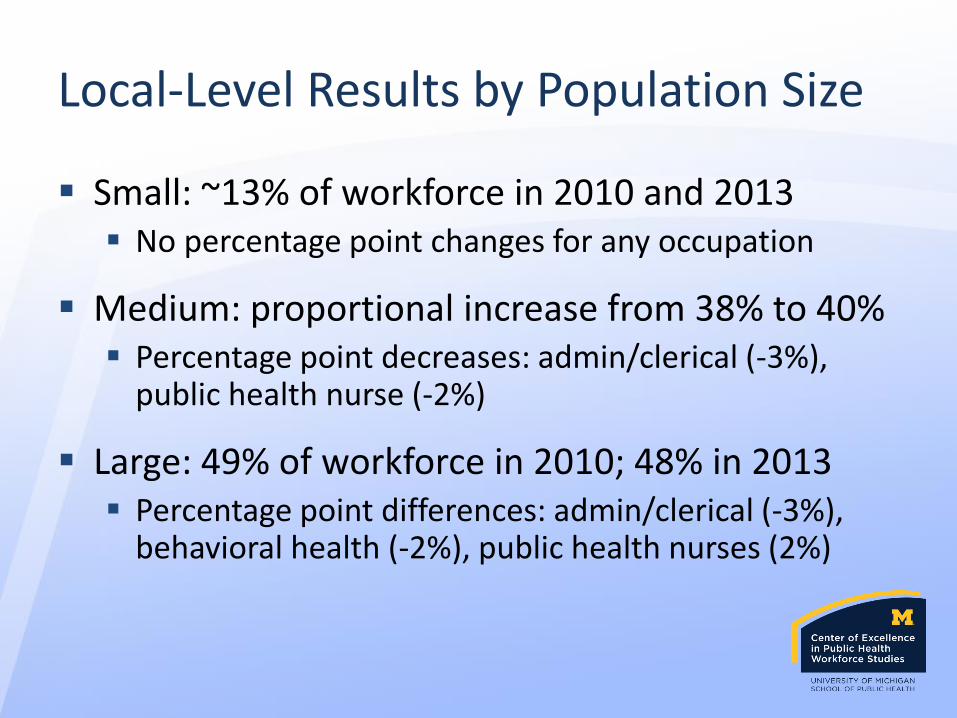
Local-Level Results by Population Size
Small: ~13% of workforce in 2010 and 2013 No percentage point changes for any occupation
Medium: proportional increase from 38% to 40% Percentage point decreases: admin/clerical (-3%),
public health nurse (-2%)
Large: 49% of workforce in 2010; 48% in 2013 Percentage point differences: admin/clerical (-3%),
behavioral health (-2%), public health nurses (2%)

Local-Level Results by Region South: 35% of workforce in 2010; 31% in 2013 (-4%)
Percentage point differences: public health nurse (-4%), admin/clerical (-3%), behavioral health (-2%)
Mid-Atlantic/Great Lakes: 22% to 25% (3%) Percentage point differences: admin/clerical (-3%), behavioral health (-2)
West: 24% to 20% (-4%) Percentage point differences: public health nurses (5%), environmental
health workers (2%)
New England: stable at 12% Percentage point differences: admin/clerical (-4%), informatics (2%)
Mountain/Midwest: 7% to 11% (4%) Percentage point differences: admin/clerical (-2%)

Local-Level Results by Governance Structure
Centralized: 11% of workforce in 2010; 10% in 2013 (-1%)
Percentage point differences: admin/clerical (-4%)
Shared or mixed: 24% to 26% (2%)
Percentage point differences: admin/clerical (-2%), public health nurses (-2%)
Decentralized: 65% to 64% (-1%)
Percentage point differences: admin/clerical (-2%)
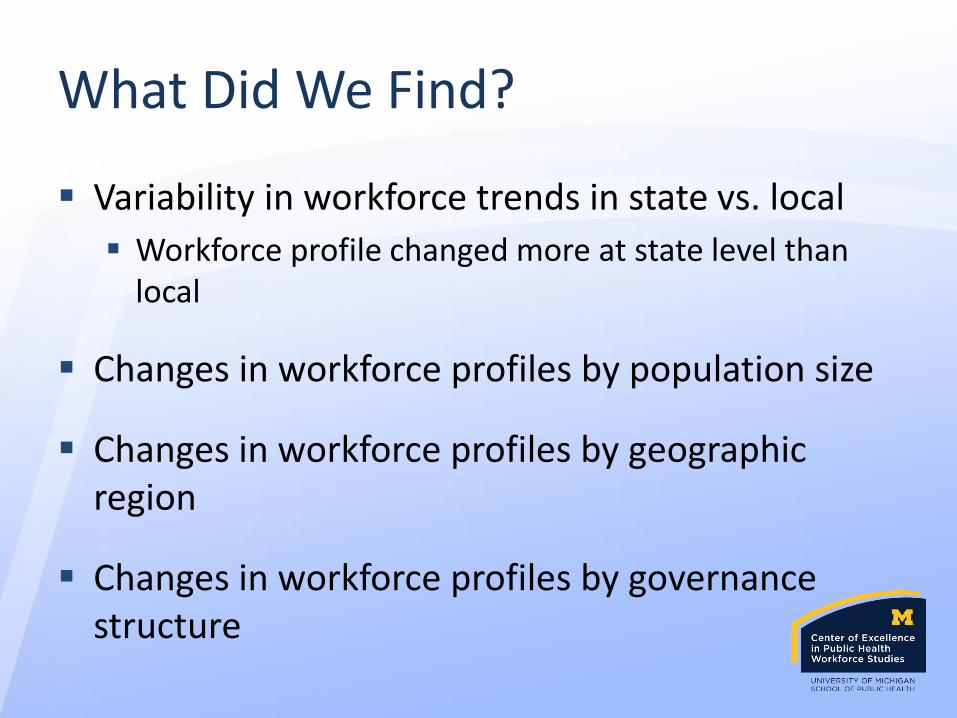
What Did We Find?
Variability in workforce trends in state vs. local
Workforce profile changed more at state level than local
Changes in workforce profiles by population size
Changes in workforce profiles by geographic region
Changes in workforce profiles by governance structure
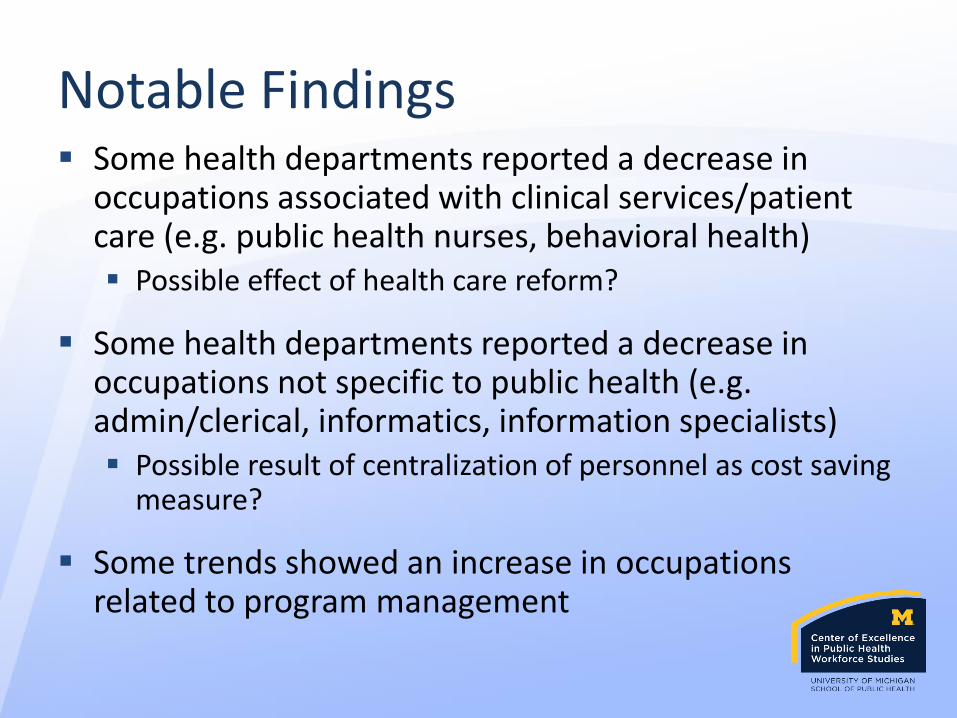
Notable Findings Some health departments reported a decrease in
occupations associated with clinical services/patient care (e.g. public health nurses, behavioral health) Possible effect of health care reform?
Some health departments reported a decrease in occupations not specific to public health (e.g. admin/clerical, informatics, information specialists) Possible result of centralization of personnel as cost saving
measure?
Some trends showed an increase in occupations related to program management

Unanswered Questions for Future Research What explains the variability across population
size, region, and governance structure?
What explains the shifting of the workforce profile? Budget reductions?
Different personnel needs to account for a change in service delivery?
Are workforce changes a result of financial or other restrictions/limitations, retirement, or are they planned changes/adaptations?

Contact Information
Center of Excellence in Public Health Workforce Studies
Department of Health Management and Policy
University of Michigan School of Public Health
www.phworkforce.org