Characteristics and Energy Use Trends for Major Commercial ...
12
Characteristics and Energy Use Trends for Major Commercial Building Types Joelle Davis, Energy Information Administration Alan Swenson, Energy Information Administration ABSTRACT The Commercial Buildings Energy Consumption Survey (CBECS) has collected build- ing characteristics and energy use data from the commercial buildings sector in the United States since 1979. Five building activities—health care, office, retail and service, education, and food service—were selected to examine energy use patterns and trends in this diverse end-use sector. Health care buildings used energy intensively—total energy (primary and site’), site electricity, and natural gas intensities were each about twice the average for all commercial buildings. Electricity intensity in health care buildings increased between 1986 and 1995, and natural gas intensity increased between 1983 and 1995. Office buildings consumed the mostto- tal energy ofall commercial building types. More than 50 percent of site energy in office biild- ings was consumed for lighting, office equipment, and cooling; consequently, electricity intensity was more than 40 percent higher than the average for all commercial buildings. Retail and service buildings consumed the second highest amount of energy, but total, electricity, and natural gas intensities were each less than average. Education buildings were the largest com- mercial buildings on average, but were not intensive consumers of energy. Their electricity in- tensity was less than average, while total and natural gas intensities were about average. Food service buildings, especially small ones, were very intensive users of energy. Electricity and natural gas intensities in food service buildings increased between 1986 and 1995 and were both about three times the average for all commercial buildings. Introduction The Commercial Buildings Energy Consumption Survey (CBECS) is a national-level sample survey of commercial buildings conducted by the Energy Information Administration (EIA) of the U.S. Department of Energy. The target population for the survey consists of all commercial buildings in the United States with more than 1,000 square feet of floorspace. Ex- cluded are residential, industrial, and agricultural buildings. The survey, first conducted in 1979, was conducted triennially from 1983 through 1995 (ETA 1994, EIA 1 995a, ETA 1 995b, ETA 1998, and EIA 2000). The 1999 CBECS (with data collection in 2000) initiated a quadren- nial cycle for the survey. Between 1979 and 1995, total energy consumption remained flat, while total energy in- tensity declined (Figures 1 and 2). CBECS collected energy consumption data for four energy Over 3 Btu ofinput energy is used for every Btu of electricity delivered to customers—the rest is lost in the process of generating and transmitting the electricity. In this paper, primary total energy and primary electric. ity included the electricity losses, site total energy and site electricity excluded the ebctricity losses. Building Industry Trends - 10.49
Transcript of Characteristics and Energy Use Trends for Major Commercial ...

Characteristics and Energy Use Trends forMajor Commercial Building Types
Joelle Davis, Energy InformationAdministrationAlan Swenson, Energy InformationAdministration
ABSTRACT
The Commercial Buildings Energy Consumption Survey (CBECS) has collected build-ing characteristics and energy use data from the commercial buildings sector in the UnitedStates since 1979. Five building activities—health care, office, retail and service, education,and food service—were selected to examine energy use patterns and trends in this diverseend-use sector.
Health care buildings used energy intensively—total energy (primary and site’), siteelectricity, and natural gas intensities were each about twice the average for all commercialbuildings. Electricity intensity in health care buildings increased between 1986 and 1995, andnatural gasintensity increased between 1983 and 1995. Officebuildings consumedthe mostto-tal energy ofall commercialbuilding types. More than 50 percent ofsite energy in office biild-ings was consumed for lighting, office equipment, and cooling; consequently, electricityintensity was more than40 percent higher thanthe average for all commercial buildings. Retailand service buildings consumed the second highest amount of energy, but total, electricity, andnatural gas intensities were each less than average. Education buildings were the largest com-mercial buildings on average, but were not intensive consumers ofenergy. Their electricity in-tensity was less than average, while total and natural gas intensities were about average. Foodservice buildings, especially small ones, were very intensive users ofenergy. Electricity andnatural gas intensities in foodservice buildings increased between 1986 and 1995 and were bothabout three times the average for all commercial buildings.
Introduction
The Commercial Buildings Energy Consumption Survey (CBECS) is a national-levelsample survey ofcommercial buildings conducted by the Energy Information Administration(EIA) of the U.S. Department of Energy. The target population for the survey consists of allcommercial buildings in the United States with more than 1,000 square feet offloorspace. Ex-cluded are residential, industrial, and agricultural buildings. The survey, first conducted in1979, was conducted triennially from 1983 through 1995 (ETA 1994, EIA 1 995a, ETA 1 995b,ETA 1998, and EIA2000). The 1999 CBECS (with data collection in 2000) initiated a quadren-nial cycle for the survey.
Between 1979 and 1995, total energy consumption remainedflat, while total energy in-tensity declined (Figures 1 and 2). CBECS collected energy consumption data for four energy
Over3 Btu ofinput energy is used for every Btu of electricity delivered tocustomers—the rest is lost in
the process of generating and transmitting the electricity. In this paper, primary totalenergy and primary electric.ity included the electricity losses, site total energy and site electricity excluded the ebctricity losses.
Building Industry Trends - 10.49
12 Quadrillion Btu
10Primary
8—
6
~ S8e~ 50-
* 1992 estimates adjusted to match1995 definition oftarget population
1992 1995 19791983 1986 1989
Year of Survey
Figure 1. Total Site and Primary EnergyConsumption, 1979 to 1995
10 Quadrillion Btu
8
6 — Primary Electricity
4—Natural Gas Site Electricity
~Fuel Oil
- D~stnctHeaL~~
0~
1979 1983 1986 1989 1992 1995Year ofSurve 1992 estimates adjusted
to 1995 definition
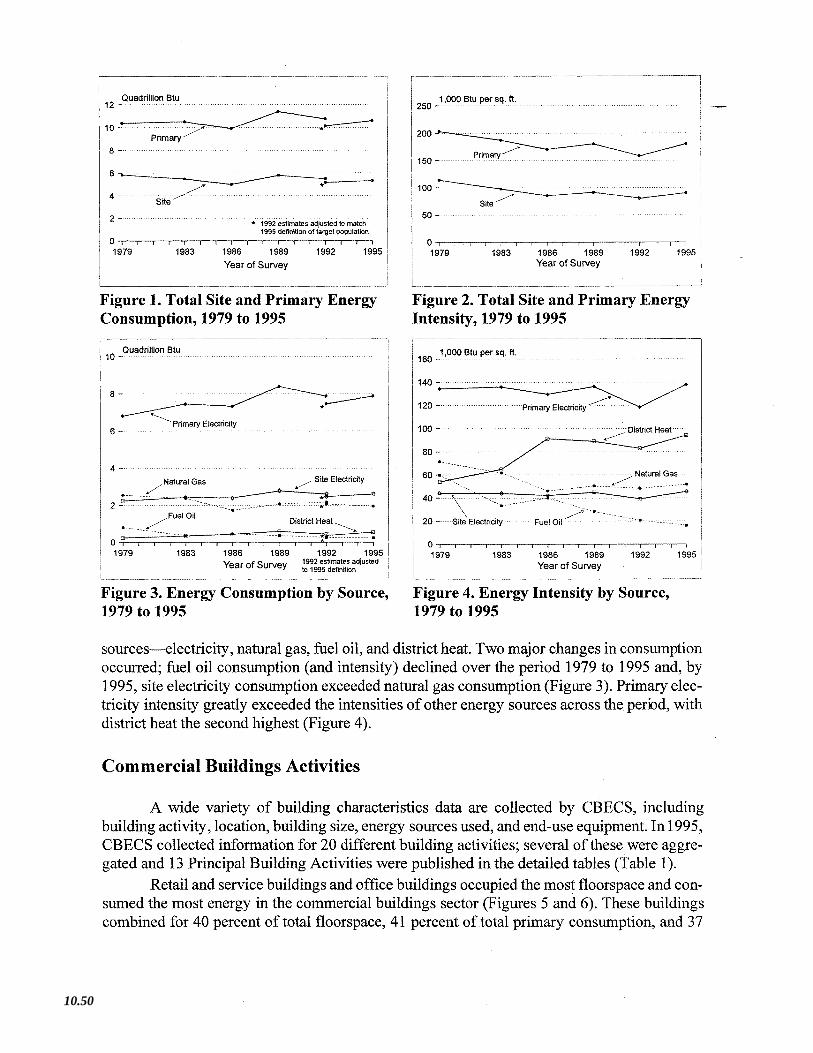
Figure 3. Energy Consumption by Source,1979 to 1995
1983 1986 1989Year of Survey
1000 Btu per sq. ft.250 —
100
Figure 2. Total Site and Primary EnergyIntensity, 1979 to 1995
1,000 Btu per sq. ft.160 —
100 — District Heat
40~
20— Si~Electricity Fuel Oil~ - -
1979 1983 1986 1989Year of Survey
1992 1995
Figure 4. Energy Intensity by Source,1979 to 1995
1992 1995
sources—electricity, natural gas, fuel oil, and district heat. Two major changes in consumptionoccurred; fuel oil consumption (and intensity) declined over the period 1979 to 1995 and, by1995, site electricity consumption exceedednatural gas consumption (Figure 3). Primary elec-tricity intensity greatly exceeded the intensities ofother energy sources across the, period, withdistrict heatthe second highest (Figure 4).
Commercial Buildings Activities
A wide variety of building characteristics data are collected by CBECS, includingbuilding activity, location, building size, energy sources used, and end-use equipment. Tn 1995,CBECS collected information for 20 different building activities; several ofthese were aggre-gated and 13 Principal Building Activities were published in the detailed tables (Table 1).
Retail and service buildings and office buildings occupied the most floorspace and con-sumed the most energy in the commercial buildings sector (Figures 5 and 6). These buildingscombined for 40 percent oftotal floorspace, 41 percent of total primary consumption, and 37
2
o1979
10.50

Table 1. Building Activities Published and Collected by the 1995 CBECS
Building Activity—published - Building Activity—collected —
Education EducationFood Sales Food Sales -____________________
Food Service Food ServiceHealth Care Hospital/Inpatient Health Services
Outpatient Health Services/ClinicLodging Hotel/Motel/Dormitory
Skilled Nursing/Other_Residential_CareOffice OfficePublic Assembly Public AssemblyPublic Order and Safety Public Order and SafetyReligious Worship Religious WorshipRetail and Service Enclosed Shopping Center/Mall
Strip Shopping CenterOther RetailService, Other than Food Service
Warehouse and Storage Refrigerated Warehouse or StorageNon-refrigerated Warehouse or Storage
Other LaboratoryOther Commercial
Vacant j Vacant
Retail and Service I Retail and Service ~‘
Office I E OfficeWarehouse t~~~’’.’ Warehouse ~
Education EducationPublic Assembly jV~&’W~tIIS~ Public Assembly êNtU.I
Lodging ~t48Ill Lodging .tSlSlSlReligious Worship ~ Religious Worship g
Vacant ‘‘ Vacant LIHealth Care Health Care
Food Service Food Service IRWRIPublic Order and Safety ~ Public Orderci rd Safely U ~Site Consumption
Food Sales ~ Food Sales , ~ElectricityLouses
Other ~ Other
0 2 4 6 8 10 12 14 0 0.5 1 1.5 2 2.5
Billion Square Feet Quadrillion Btu
Figure 5. Total Floorspace by Building Figure 6. Total Site and PrimaryActivity, 1995 Consumption by Building Activity, 1995
percent oftotal site consumption. Three building types—food sales, food service, and healthcare—had significantly higher total primary energy intensities than other types (Figure 7).
Tn the following sections, five ofthese building activities will be examined in more de-tail—health care, office, retail and service, education, and food service (they arehighlighted inFigures 5, 6, and 7). These activities were selected because ofrecent energy-related policy mi-
Building Industry Trends - 10.51

All Health CareInpatientHealth CarE
Outpatient Health Care
Office
Retail and ServiceRetail
Service
— —
-j
Retail and ServiceOffice
WarehouseEducation
Public Assembly
LodgingReligious Worship
VacantHealth Care
Food ServicePublic Orderand Safety
Food SalesOther
•Site IntensityS8Electricity Losses
-~
U
0 100 200 300 400 500 600 700
Thousand Btu per Square Foot
Figure 7. Total Site and Primary EnergyIntensity by Building Activity, 1995
Education
~ 12,800 square feet,averagefor allFood Serv~ce commercial buildings
Thousand Square Feet per Building
Figure 8. Average Building Size byBuilding Activity, 1995
Health Care
Retail and Service
Education
Food Service
~~1
— Buildings
~ FloorspaceLJworkers
0 5 10 15 20 25 30 35
Percent
Figure 9. Percent of Buildings,Floorspace, and Workers by BuildingActivity, 1995
tiatives,public interest, orbecausethey were intensive energy users; in addition, they reflectthediversity ofbuilding characteristics and patterns ofenergy use found in the sector.
Health Care Buildings
Health care buildings include buildings used as diagnostic and treatment facilities forboth inpatient and outpatient care. Inpatient health care buildings include structures such ashospitals, psychiatric facilities, and rehabilitation centers; outpatient health care buildings in-clude medical clinics, dental clinics, emergency walk-in centers, and veterinary facilities.
In 1995, there were approximately, 105,000 health care buildings in the United Statesthat comprised2.3 billion feetoffloorspace. Health carebuildings were larger, on average, thancommercial buildings as a whole, with an average of22,200 square feet (Figure 8).
Inpatienthealth carebuildings comprised 21 percentofall health care buildings, but be-cause they were large buildings, they made up 70 percent ofthe health care floorspace. Theiraverage size was approximately 75,000 feet. Outpatient health care buildings had an averagesize of 8,000 square feet (Figure 8). About 4.5 million people were employed in health care
10.52

Figure 10. Percent of Site Consumption in Figure 11. Percent of Site Consumption inHealth Care Buildings by Type ofEnergy Health Care Buildings by End Use, 1995Source, 1995
buildings, about 6 percent ofthe commercial workforce (Figure 9). Inpatient health care build-ings averaged 138 workers (during the main shift), while outpatient health care buildings aver-aged only 17 workers.
The median age ofhealth care buildings was 23.5 years, significantly newer than the30.5 year median forall commercial buildings. Health carebuildings in theNortheast and Mid-west tended to be older, with medians of39.5 and 42.5 years, respectively.
Inpatient health care buildings were more likely to be part ofa multibuilding complex(84 percent were part ofa complex) than were outpatient health care buildings (22 percent oncomplexes). Among those inpatient health care buildings on a complex, 67 percent were on ahospital or otherhealth care complex. Mosthealth care buildings were privately owned; only 18percent were government-owned.
While health care buildings consumed only 11 percent ofthe total commercial site en-ergy, they were the second most intensive users ofsite energy (and third most ofprimary en-ergy) among building types (Figure 7). They consumed more natural gas than electricity andalso consumed a substantial amount ofdistrict heat (Figure 10). They used almost halfoftheir
Figure 12. Total Primary and Site Figure 13. Site Electricity and NaturalIntensity for Health Care Buildings, 1979 Gas Intensity for Health Care Buildings,to 1995 1979to 1995
Sum of Major FuelConsumption forHealth Care Buildings:561 trillIon Btu
Natural Gas46%
Site Electricity38%
-I
District Heat13%
Space Heating23%
*Other includes cooling, ventilation, and refrigeration.
thousand Btu per sq. ft.
400
300
200 ~site~thcore~’ldings
100 ~
site-all buildings0 I~IIIIILIIII
1979 1983 1986 1989 1992 1995
Year of Survey
thousand Btu per sq. ft.160
~hcorebuildings-naturalgas~
100—
80 health care buildings-electricity...~
60 ‘ .~— all buildings-naturalgas
40
20 all builaings-eiectnctty0 lllllIllllllI~
1979 1983 1986 1989 1992 1995
Year ofSurvey
Building Industry Trends - 10.53
energy on water heating and space heating, with lighting and miscellaneous uses (whichincludes ‘equipment for diagnoses and treatment) accounting for another third (Figure 11). —
Tnpatient health care buildings consumed energy more intensively than did outpatienthealth care buildings—inpatient health care buildings used 102,600 Btu of electricity persquare foot, compared with 61,600 Btu ofelectricity per square foot foroutpatient health care.Inpatient natural gas intensity was over twice the intensity for outpatient health care (164,800Btu per square foot and 68,500 Btu per square foot, respectively).
Inpatient and outpatient health care buildings used energy in different ways. Inpatienthealth care buildings consumed a higher proportion ofenergy for water heating, cooking, re-frigeration, and miscellaneous uses (presumably equipment) than did outpatient health carebuildings. Outpatienthealth care buildings used a higher proportion for cooling, lighting, andoffice equipment.
Healthcare buildings were among the most intensive users ofenergy in the commercialbuildings sector across the period from 1979 to 1995. Total (primary and site), site electricity,and natural gas intensities were each approximately two times greater than the average for allbuildings (Figures 12 and 13). The trends in intensities for health care buildings run counter tothe declining trends for all commercial buildings. Total and natural gas intensities increasedbe-tween 1983 and 1995, while electricity intensity increased between 1986 and 1995.
Office Buildings
Office buildings include buildings used for general office space, professional offices,and administrative offices. For example, offices may be computer centers, banks, insuranceoffices, real estate offices, law offices, medical offices, or administrative buildings.
In 1995, approximately 705,000 office buildings comprised 10.5 billion feet offloorspace. They were the second most prevalent type ofcommercial building, both in terms ofbuilding counts and floorspace (Figure 5). Office buildings were slightly larger than commer-cial buildings as a whole, at an average of14,900 square feetper building (Figure 8). Overhalfofall office buildings were smaller than 5,000 square feet and almost 95 percent were smallerthan 25,000 square feet. A little over halfofall office buildings had only one floor while onlyone percent ofthem had more than ten floors.
About 27 million workers were employed in office buildings in 1995, about 35 percentofthe commercial workforce (Figure 9). Theaverage office building employed 38 workers dur-ing its main shift. The median age ofoffice buildings in 1995 was 23.5 years; they were some-what newer than the stock ofcommercial buildings as a whole, for which the median age was30.5 years.
Office buildings consumed the most total energy ofall the building types, although theywere not one ofthe most intensive users of energy (Figures 6 and 7). Large office buildingsconsumed energy more intensively than did smaller office buildings (buildings larger than50,000 square feetconsumed 109,000 Btu per square foot compared with 87,000 Btu per squarefoot forbuildings 1,001 to 5,000 square feetand 82,600 Btu per square foot for buildings 5,001to 50,000 square feet).
Officebuildings are typically large users ofelectrical equipment such as computers, of-fice equipment, and lighting. These pieces ofequipment produce heat which increases the useofairconditioning, anotherpredominantly electricity end use. It is not surprising thatelectricity
10.54

Figure 15. Percent of Site Consumption inOffice Buildings by End Use, 1995
Figure 16. Total Primary and Site Figure 17. Site Electricity and NaturalIntensity for Office Buildings, 1979 to Gas Intensity for Office Buildings, 1979 to1995 1995
wasthe predominant energy source used in office buildings (Figure 14).Energy usewas distrib-uted among a number of different uses in office buildings. Lighting accounted for the mostconsumption, followed by space heating and office equipment (Figure 15).
The large use ofelectrical equipment is evident in the trend in electricity intensity foroffice buildings; they were significantly higher in electricity intensity than the average for allcommercial buildings (Figure 17). Total energy intensity foroffice buildingsalso exceeded theaverage for all buildings (Figure 16). The natural gas intensity trend for office buildings de-clined, and roughly tracked the natural gas trend for all commercial buildings (Figure 17).
Retail and Service Buildings
Retail and service buildings are those used for sales and displays ofgoods and services.They include strip shopping malls, enclosed shopping malls, other retail buildings, and servicebuildings (other thanfood service). Retail buildings other thanmalls can be automobile dealers,department stores, drugstores, and home furnishing stores, for example. Service buildings in-cludebuildings suchas dry cleaners, car washes, laundromats, service stations, and post offices.’
Site Electricity66%
Sum of Major FuelConsumption forOffice Buildings:1.0 quadrillion Btu
District Heat7%
~‘~‘~Fuel Oil3%
Ventilation5%
>1~
Water Heating9%
Lighting
29%
* Other includes cooking, refrigeration, and miscellaneous uses,Natural Gas
23%
Space Heating25%
Office Equipment16%
Figure 14. Percent of Site Consumption inOffice Buildings by Type of EnergySource, 1995
thousand Btu per sq. ft.300
primary-office buildings250
200
150 ‘ ““‘‘“site-office buildings’’”•”’”’’’ ,~-“‘‘““‘‘
1:
site-all buildings
0 I I I I 1111111
1979 1983 1986 1989 1992 1995
Year of Survey
80 thousand Btu per sq. ft. ,,,~-allbuildings-natural gas office buildings-electricity
all buildings-electncity20—
office buildings-natural gas
0 I I I I I I I I I I I I I
1979 1983 1986 1989 1992 1995
Year of Survey
Building Industry Trends - 10.55
Sum of Major Fuel Site ElectricityConsumption forRetail and ServiceBuildings:973 trillion Btu
District Heat~ 2%LFuel Oil
Lighting31%
Other includes ventilation, cooking, refrigeration, office equipment,
__________________________ ________________________________ L_~dmiscellaneous uses.
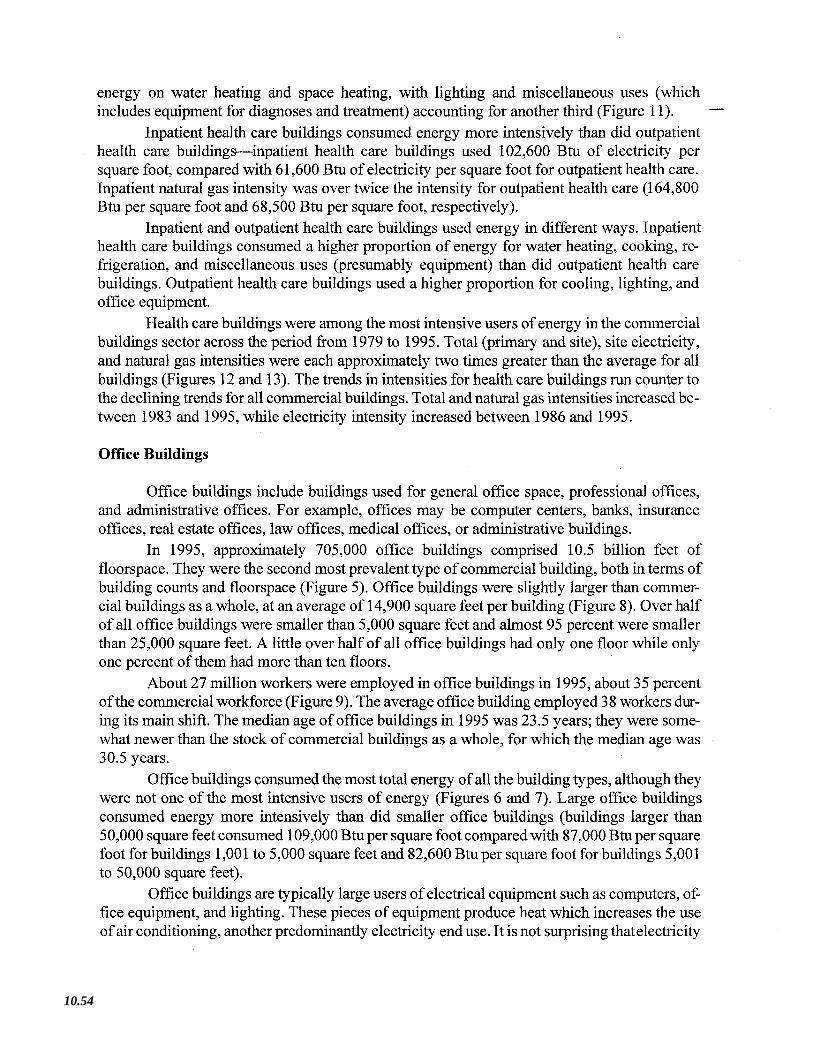
Figure 18. Percent of Site Consumption in Figure 19. Percent of Site Consumption inRetail and Service Buildings by Type of Retail and Service Buildings by End Use,Energy Source, 1995 1995
In CBECS publications, these types are all grouped in a single category that contained1.3 million buildings and 12.7 billion square feet offloorspace. Retail and service buildingswere the most prevalent building type and occupied the most floorspace ofall building types(Figure 5). They averaged 14,900 square feet per building, slightly largerthan the average wm-mercial building (Figure 8).
The retail and service category, disaggregated into its subcategories, included an esti-mated 130,000 strip malls, 12,000 enclosed malls, 562,000 other types ofretail buildings, and585,000 service buildings. Enclosedmalls were the largesttype ofretailbuilding; althoughtheymade up only one percent of buildings in that category, they occupied 14 percent of thefloorspace. About 13.5 million workers were employed in retail and service buildings, 17 per-cent ofall commercial workers (Figure 9) with an average of17 workers per building. The me-dian age of retail and service buildings was 35.5 years. Enclosed malls were newer thanthis—their median age was 20.5 years.
CBECS is based on the entire building, so a CBECS building can contain more thanoneestablishment. Retail and service buildings as a whole averaged 1.8 establishments per build-ing. Retail buildings averaged 2.5 establishments per buildings; 22 percent ofretail buildingshad between 2 and 5 establishments and 7 percent had between 6 and 10. Strip malls averaged6.2 establishments. Servicebuildings averagedjust 1.1 establishments perbuilding. Many retailand service buildings (77 percent) were occupied by the owner.
Retail and service buildings consumed the second highest amount oftotal energy ofallbuilding types, but they consumed it less intensively than did commercial buildings as a whole(Figures 6 and 7). Overhalfoftheir site energy consumption was electricity and most ofthe ivstwas natural gas, with just a small amount ofdistrict heat and fuel oil used (Figure 18). Spaceheating accounted for 40 percent oftheir energy use and lighting for 31 percent. Cooling andwater heating accounted for another 15 percent; no other uses were substantial (Figure 19).
Total and electricity intensities forretail and servicebuildingswere slightly less thantheaverage for all commercial buildings and both trends were flatacross the period(Figures 20 and21). Natural gas intensity was less than the average for all buildings (Figure 21).
Space Heating40%-I
WaterHeatlng~
Natural Gas41%
10.56

thousand Btu per sq. ft.250 -
thousand Btu per sq. ft.80
primary-retail and service buildings~ site-all buildings
100 .~, ~ ,
50 site-retail and service buildings
01979 1983 1986 1989 1992 1995
Year of Survey
Figure 20. Total Primary and Site Figure 21. Site Electricity and NaturalIntensity for Retail and Service Buildings, Gas Intensity for Retail and Service1979 to 1995 Buildings, 1979 to 1995
Education Buildings
Educationbuildings are those that are usedfor academic ortechnical classroom instruc-tion. They include preschools, elementary schools, middle orjuniorhigh schools, high schools,vocational schools, and college or university classrooms.
In 1995, the approximately 309,000 education buildings comprised 7.7 billion squarefeet of floorspace—the fifth most common type of building and the fourth highest amount offloorspace (Figure 5). Education buildings were about twice as large as commercial buildingsas a whole, at an average of25,100 square feet per building (Figure 8).
About 10 million people were employed in all education buildings, 13 percent of allworkers in commercial buildings (Figure 9). The average education building employed 33workers. The median age of educationbuildings was 33.5 years, slightly older than commercialbuildings as a whole.
The 1995 CBECS did not identify the different types ofeducation buildings (for exam-ple, it wasnot asked whether a building waselementary or college education).However, 80 per-cent ofeducationbuildings were partofa multibuilding facility. Ofthese, 74 percent were on aprimary or secondary complex and 8 percent were on a college or university campus. By look-ing at education buildings within these two categories, we can getan ideaofthe differences be-tween primary and secondary education buildings and college and university buildings. Fcreaseofdiscussion, these will be referredto as early educationand higher educationbuildings.
About 183,000 early education buildings and 19,000 higher education buildings wereestimatedby CBECS. Early education buildings were smaller, an average of 16,400 square feetcompared with 52,000 square feetforhigher education buildings. Early education buildings av-eraged 224 seats while higher education buildings averaged 510 seats. Early education build-ings averaged 20 workers while higher education buildings averaged 93 workers. Earlyeducation schools were open an average of48 hours per week while highereducation buildingswere open an average of 93 hours per week. Higher education buildings used energy abouttwice as intensively as did early education schools.
Education buildings consumed 12 percent oftotal commercial energy and were not in-tensiveusers ofenergy (Figure 7). They usedthe different sources more equally than any oftheother types discussedhere; they were thegreatest consumers ofdistrict heat and fuel oil (Figure
40N
retail and service20 buildirigu-elctricity
01979
retail andservicebuildings-natural gas
1983 1986 1989 1992 1995
Year of Survey
Building Industry Trends - 10.57
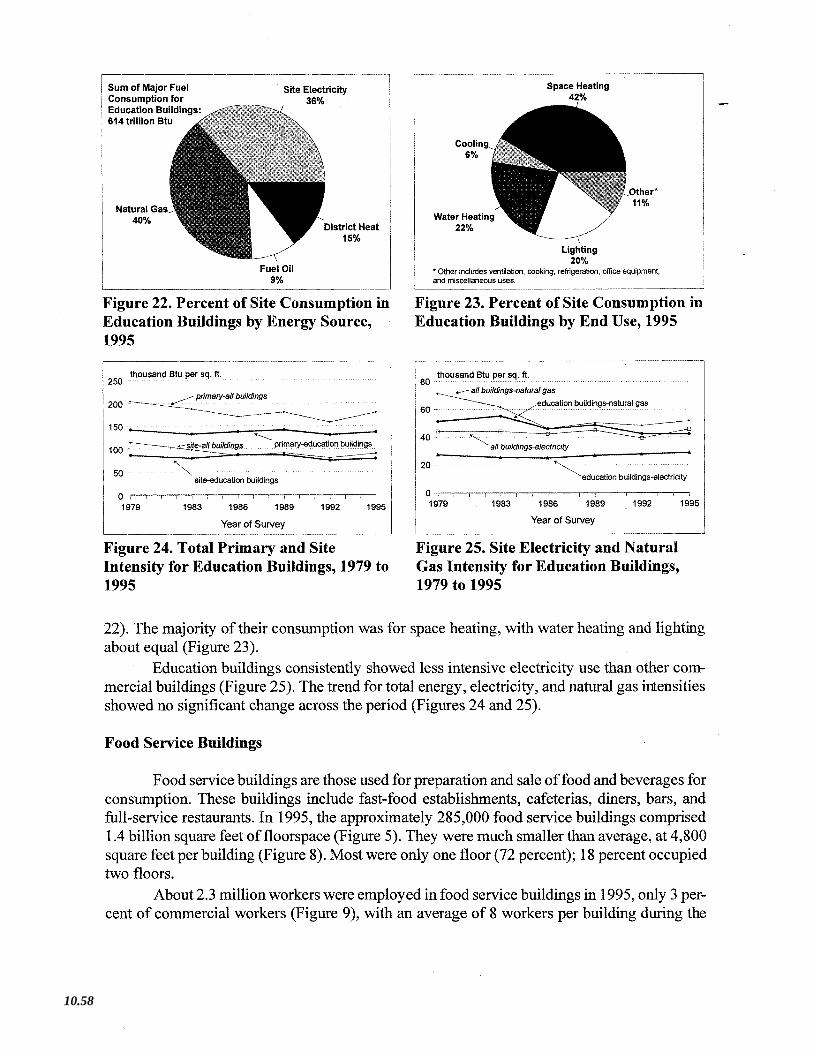
Sum of Major Fuel Site ElectricityConsumption for 36%Education Buildings:614 trillion Btu -~
Natural Gas~40%
Figure 22. Percent of Site Consumption inEducation Buildings by Energy Source,1995
thousand fitu per sq. ft.250
primary-all buildings
1:: ~ ducationbui~ngs
site-education buildings
District Heat15%
Space Heating42%
Figure 23. Percent of Site Consumption inEducation Buildings by End Use, 1995
thousand Stu per sq. ft.80
all buildings-naturalgaseducation buildings natural gas
all bulldings-electricity
20 education buildings-electricity
01 I I I I I 11111 I I I 01 I I I I I I I I I I I I I I I
1979 1983 1986 1989 1992 1995 1979 1983 1986 1989 1992 1995
Year of Survey Yearof Survey
Figure 24. Total Primary and Site Figure 25. Site Electricity and NaturalIntensity for Education Buildings, 1979 to Gas Intensity for Education Buildings,1995 1979 to 1995
22). The majority oftheir consumption was for space heating, with water heating and lightingabout equal (Figure 23).
Education buildings consistently showed less intensive electricity use than other com-mercial buildings (Figure 25). The trend for total energy, electricity, and natural gas intensitiesshowed no significant change across the period (Figures 24 and 25).
Food Service Buildings
Foodservice buildings are those used forpreparation and saleoffoodand beverages forconsumption. These buildings include fast-food establishments, cafeterias, diners, bars, andfull-service restaurants. In 1995, the approximately 285,000 food service buildings comprised1.4 billion square feetoffloorspace (Figure 5). They were muchsmaller than average, at 4,800square feetper building (Figure 8). Most were only one floor (72 percent); 18 percent occupiedtwo floors.
About 2.3 million workers were employed in food service buildings in 1995, only 3 per-cent of commercial workers (Figure 9), with an average of 8 workers per building during the
Fuel Oil9%
Lighting20%
* Other indudes ventilation, cooking, refrigeration, office equipment,and miscellaneoususes.
10.58

Figure 26. Percent of Site Consumption in Figure 27. Percent of Site Consumption inFood Service Buildings by Energy Source, Food Service Buildings by End Use, 19951995
main shift. The median age of food service buildings was 22.5 years, newer than commercialbuildings as a whole.
Eighty-three percent of food service buildings were owner-occupied. The owner-occu-piedbuildings were slightly largerthanthenonowner-occupied (an average of5,000 square feetvs. 3,000 square feet). Food service buildings nearly always had only one establishment perbuilding (92 percent ofbuildings).
Food service buildings consumed only 6 percent of total commercial energy, but werethe most intensive users ofsiteenergy ofall building types (Figure 7). They consumed precbmi-nantly electricity and natural gas, and usedthese about equally (Figure 26). They used both ofthese sources threetimes as intensively as commercial buildings as a whole. Small food servicebuildings usedboth ofthese sources evenmore intensively (buildings 1,001 to 5,000 square feetused 191,900 Btu ofelectricity per square foot and 253,300 Btu of natural gas per square footcompared with 75,400 Btu of electricity per square foot and 109,200 Btu of natural gas persquare foot for buildings larger than 5,000 square feet).
In food service buildings, about one-third of the energy was consumed for cooking.Lighting, refrigeration, and space heating were used about equally and together accounted for
thousand Btu per sq. ft.600”’”’’”’”
primary-food service buildings
::‘(1979 and 1983 data for
300 .ioodservicebuildings,,............,are not available) site-food service buildings—.~
200
100site-all buildings
0 I I I I I I I I I I I 11111
1979 1983 1986 1989 1992 1995
Yearof Survey
Figure 28. Total Primary and SiteIntensity for Food Service Buildings, 1986to 1995
Figure 29. Site Electricity and NaturalGas Intensity for Food Service Buildings,1986 to 1995
Site Electricity Sum of Major Fuel50% Consumption for Food
Service Buildings:332 trillion Btu
Fuel Oil andDistrict Heat
Water Heating11% Cooling
8%
Natural Gas48%
Space Heating13%
Other*‘1~~LMiscellaneous
5%
Refrigeration13%Lighting
15%* Other includes ventilation and office equipment.
180 thousand Btu per sq. ft.
food service buildings-
natural gas
120— food service buildings- ,100 electricity ~
~ll buildings natural gas
20 — “‘‘‘ all buildings-electricity01979 1983 1986 1989 1992 1995
YearofSurvey
Building Industry Trends - 10.59
about anotherthird ofthe energy use (Figure 27). Only food sales buildingshad higher totalpri-mary energy intensities than foodservice buildings (Figures 7 and 28). Both electricity aid nat- —
ural gas intensities forfood service buildings were muchhigher thanaverage (Figure 29). Bothelectricity and natural gas intensities increased across the period 1986 to 1995 (food service andfood sales buildings were collected as a single category in 1979 and 1983).
Summary
Total energy consumption stayed about the same while total energy intensity declinedacross the period from 1979 to 1995. The commercial buildings sector is very diverse, unlikethe residential sector which is dominated by a single building type (the single family home).Building characteristics, energy sources used, and energy end uses vary widely between, andwithin, commercial building types.
Energy intensities increased in health care buildings, the most intensive users ofenergyin the commercial sector. Inpatient health care buildingswere even more intensive users ofen-ergy thanhealth carebuildings as a whole. Office buildings, large usersofelectrical equipment,had a significantly higher electricity intensity than all commercial buildings. Retail and servicebuildings consumed electricity and natural gas almost exclusively; their intensities were lowerthan commercial buildings as a whole and their trends remained flat. Educationbuildings had alower electricity intensity than other commercialbuildings, but consumedmore fuel oil and dis-trict heatenergy. Food service buildings consumed about one-third oftheir energy for cookingand used energy very intensively, a trend that has been increasing.
References
[ETA] Energy Information Administration. 1994. Commercial Buildings Characteristics1992. DOE/ETA-0246(92). Washington, D.C.: U.S. Department ofEnergy.(www.eia.doe.gov/emeulcbecs/cbecsla.html)
[EIA] Energy Information Administration. 1995a. Commercial Buildings Consumption andExpenditures, 1992. DOE/EIA-0318(92). Washington, D.C.: U.S. Department ofEnergy. (www.eia.doe.gov/emeulcbecs/cbecs1 b.html)
[ETA] Energy Information Administration. 1 995b. Buildings and Energy in the 1980 ‘s.DOE/EIA-0555(95)/i. Washington, D.C.: U.S. Department ofEnergy.(www.eia.doe.gov/emeulcbecs/cbecs 1 f.html)
[EIA] Energy Information Administration. 1998. A Look at Commercial Buildings in 1995:Characteristics, Energy Consumption, and Energy Expenditures.DOE/EIA-0625(95). Washington, D.C.: U.S. Department of Energy.(www.eia.doe.gov/emeulcbecs/report1 995 .html)
[EIA} Energy Information Administration. 2000. Trends in the Commercial Buildings Sector.(Web only: www.eia.doe.gov/emeulconsumptionbriefs/cbecs/cbecs_trends/main menu.html)
10.60