1212 Moving Along With SAP Transportation Management Functionality

Pocket Guide to Transportation
2018
Printed on paper containing recycled post consumer waste paper.
INFRASTRUCTURE
MOVING PEOPLE
MOVING GOODS
SAFETY
PERFORMANCE
ECONOMY
ENVIRONMENT
GLOSSARY
MAJOR TRENDS
Download the new and improved mobile app

Statistics published in this Pocket Guide to Transportation come from many different sources. Some statistics are based on samples and are subject to sampling variability. Statistics may also be subject to omissions and errors in reporting, recording, and processing.
Photos provided by BTS Stock Photos
For additional copies of this guide or information about the Bureau of Transportation Statistics and its products and services, contact:
Product OrdersInternet: http://www.bts.gov
Mail: Product Orders Bureau of Transportation Statistics ATTN: Product Orders 1200 New Jersey Avenue, SE, Room E34-457 Washington, DC 20590 Information ServicePhone: 202-366-DATAEmail: [email protected]
January 2018
Text USDOT BTSPG to 468311 to download the
Pocket Guide to Transportation app
or search:BTS Pocket Guide

Bureau of Transportation Statistics
2018
Pocket Guide to Transportation
Download the new and improved mobile app

Acknowledgments
U.S. Department of Transportation
Elaine L. ChaoSecretary
Jeffrey A. RosenDeputy Secretary
Bureau of Transportation StatisticsPatricia HuDirector
Rolf SchmittDeputy Director
Produced under the direction of: Michael J. SprungDirector, Office of Transportation Analysis
Sonya Smith-PickelProject Manager
William MooreEditor
Alpha WingfieldVisual Information Specialist
Major Contributors:Long Nguyen
Contributors:Femi AdebayoSteve BeningoMatthew ChambersBernetta CrutcherChester FordSean JahanmirMindy LiuJordan RiddleDemi Riley (Spatial Front)Jessie Zhou (Spatial Front)

About the Pocket Guide to transPortation
The BTS Pocket Guide to Transportation is a quick reference guide that provides transportation statistics at your fingertips. It provides key information and highlights major trends on the U.S. transportation system.
This year features a new and improved Pocket Guide mobile app that includes improved navigation and dynamic data updates to highlight the most recent up-to-date statistics. Download on the App Store and on Google Play.
BTS welcomes comments and suggestions for improving this product.
contents
Major Trends ............................................................iv
Infrastructure ...........................................................1
Moving People .........................................................7
Moving Goods ....................................................... 19
Safety ....................................................................... 27
Performance .......................................................... 33
Economy ................................................................. 39
Environment .......................................................... 47
Glossary .................................................................. 57
iv
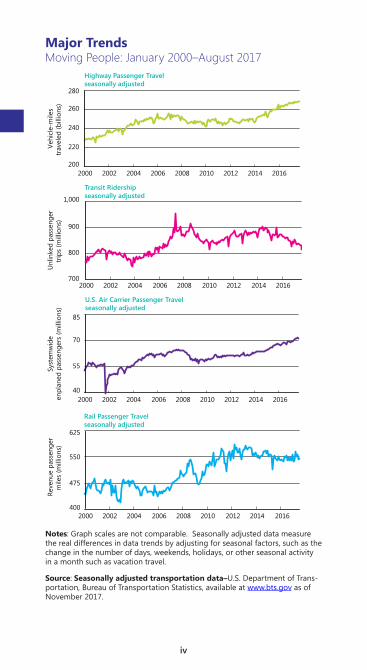
Major TrendsMoving People: January 2000–August 2017
200
220
240
260
280
2000 2002 2004 2006 2008 2010 2012 2014 2016
2000 2002 2004 2006 2008 2010 2012 2014 2016
2000 2002 2004 2006 2008 2010 2012 2014 2016
2000 2002 2004 2006 2008 2010 2012 2014 2016
40
55
70
85
400
475
550
625
Vehi
cle-
mile
str
avel
ed (b
illio
ns)
Highway Passenger Travelseasonally adjusted
Transit Ridershipseasonally adjusted
Unl
inke
d pa
ssen
ger
trip
s (m
illio
ns)
U.S. Air Carrier Passenger Travelseasonally adjusted
Syst
emw
ide
enpl
aned
pas
seng
ers
(mill
ions
)
Rail Passenger Travelseasonally adjusted
Reve
nue
pass
enge
rm
iles
(mill
ions
)
700
800
900
1,000
Notes: Graph scales are not comparable. Seasonally adjusted data measure the real differences in data trends by adjusting for seasonal factors, such as the change in the number of days, weekends, holidays, or other seasonal activity in a month such as vacation travel.
Source: Seasonally adjusted transportation data–U.S. Department of Trans-portation, Bureau of Transportation Statistics, available at www.bts.gov as of November 2017.

v
Major TrendsMoving Freight: January 2000–September 2017
0.5
1.0
1.5
0.5
1.0
1.5
2000 2002 2004 2006 2008 2010 2012 2014 2016
2000 2002 2004 2006 2008 2010 2012 2014 2016
2000 2002 2004 2006 2008 2010 2012 2014 2016
2000 2002 2004 2006 2008 2010 2012 2014 2016
Carlo
ads
(mill
lions
)
Rail Freight Carloadsseasonally adjusted
75
100
125
150
30
40
50
60
Carlo
ads
or in
term
odal
units
(mill
lions
)
Rail Freight Intermodalseasonally adjusted
For-
hire
truc
k to
nnag
e(In
dex
2000
= 1
00)
Truck Tonnageseasonally adjusted index
Shor
t ton
s (m
illio
ns)
U.S. Waterways Freightseasonally adjusted
Notes: Graph scales are not comparable. Rail Freight Intermodal–Rail inter-modal traffic includes shipping containers and truck trailers moved on rail cars. U.S. Waterways Freight–Includes tonnage carried on internal U.S. waterways.
Source: Seasonally adjusted transportation data–U.S. Department of Trans-portation, Bureau of Transportation Statistics, available at www.bts.gov as of November 2017.


1Infrastructure
1 InfrAstructure
The U.S. transportation system consists of a network of roads, bridges, airports, railroads, transit systems,
ports, waterways, and pipelines, connecting the Nation to the rest of the world.
1-1 Transportation Network Length milesMode 2005 2015
Highway
Public roads 3,995,635 4,154,727
Public road lanesa 8,371,718 8,736,587
Pipeline
Gas distribution 1,962,351 2,190,494
Gas transmission and gathering 324,222 318,924
Rail
Class I freight railroad 95,664 93,628
Amtrak 22,007 21,358
Transit
Commuter railb 7,118 7,697
Heavy railb 1,622 1,643
Light railb,c 1,188 1,893
Water
Navigable waterwaysd 25,000 25,000aMeasured in lane-miles. bMeasured in directional route-miles. cLight Rail was revised beginning in 2011 and includes light rail, street car rail, and hybrid rail. dEstimated length of domestic waterways.
Sources: Highway, Pipeline, Rail, Transit, Water–As cited in U.S. Depart-ment of Transportation, Bureau of Transportation Statistics, National Trans-portation Statistics, tables 1-1, 1-6, and 1-10, available at www.bts.gov as of October 2016 as of September 2017.
2 Pocket Guide to Transportation
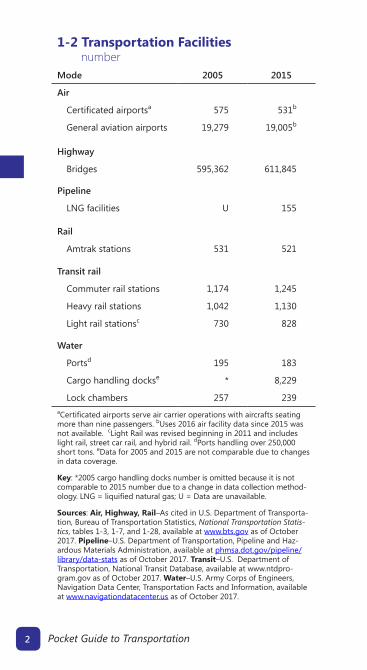
1-2 Transportation Facilities numberMode 2005 2015
Air
Certificated airportsa 575 531b
General aviation airports 19,279 19,005b
Highway
Bridges 595,362 611,845
Pipeline
LNG facilities U 155
Rail
Amtrak stations 531 521
Transit rail
Commuter rail stations 1,174 1,245
Heavy rail stations 1,042 1,130
Light rail stationsc 730 828
Water
Portsd 195 183
Cargo handling dockse * 8,229
Lock chambers 257 239aCertificated airports serve air carrier operations with aircrafts seating more than nine passengers. bUses 2016 air facility data since 2015 was not available. cLight Rail was revised beginning in 2011 and includes light rail, street car rail, and hybrid rail. dPorts handling over 250,000 short tons. eData for 2005 and 2015 are not comparable due to changes in data coverage.
Key: *2005 cargo handling docks number is omitted because it is not comparable to 2015 number due to a change in data collection method-ology. LNG = liquified natural gas; U = Data are unavailable.
Sources: Air, Highway, Rail–As cited in U.S. Department of Transporta-tion, Bureau of Transportation Statistics, National Transportation Statis-tics, tables 1-3, 1-7, and 1-28, available at www.bts.gov as of October 2017. Pipeline–U.S. Department of Transportation, Pipeline and Haz-ardous Materials Administration, available at phmsa.dot.gov/pipeline/library/data-stats as of October 2017. Transit–U.S. Department of Transportation, National Transit Database, available at www.ntdpro-gram.gov as of October 2017. Water–U.S. Army Corps of Engineers, Navigation Data Center, Transportation Facts and Information, available at www.navigationdatacenter.us as of October 2017.

3Infrastructure
1-3 Transportation Vehicles numberMode 2005 2015
Air
Air carrier aircraft 7,686 6,876
General aviation aircraft 224,352 210,030
Highway
Light-duty vehiclea 231,904,922 242,917,192
Truck 8,481,999 11,203,184
Motorcycle 5,767,934 8,600,936
Rail
Class I freight locomotive 22,779 26,574
Class I freight car 474,839 330,996
Amtrak locomotive 258 423
Amtrak car 1,186 1,428
Transit rail
Commuter railb 6,290 7,151
Heavy railb 11,110 10,737
Light railb,c 1,645 2,478
Water
Nonself-propelled vessel 31,296 31,043
Self-propelled vessel 8,976 8,951
Oceangoing vessel 231 170
Recreational boat 12,942,414 11,867,049aIncludes passenger cars, light trucks, vans, and sport utility vehicles. bIncludes revenue vehicles available for maximum service. cLight Rail was revised beginning in 2011.
Source: As cited in U.S. Department of Transportation, Bureau of Transportation Statistics, National Transportation Statistics, table 1-11, available at www.bts.gov as of October 2017.

4 Pocket Guide to Transportation
1-4 Airport Runway Pavement Condition percent of NPIAS runways
Good
Fair
Poor Large open cracks, surface and edge spalling, vegetation growing through cracks and joints; or widespread, severe cracking with raveling and deterioration.
Mild surface cracking, unsealed joints, and slab edge spalling.
No visible deterioration, or all cracks and joints are sealed.
75% 79% 80%
21% 18% 18%
4% 3% 2%
2005 2010 2017
Note: National Plan of Integrated Airport Systems (NPIAS) airports include commercial service airports, reliever airports, and selected general aviation airports.
Source: As cited in U.S. Department of Transportation, Bureau of Transportation Statistics, National Transportation Statistics, table 1-25, available at www.bts.gov as of October 2017.
1-5 National Highway System Pavement Condition percent of NHS facility miles
Good
Fair
Poor IRI > 170
IRI 95 – 170
IRI < 95
60% 60% 61%
34% 33% 28%
6% 7% 11%
2005 2010 2015
Note: Pavement condition is measured by the International Roughness Index (IRI), which takes a longitudinal profile of pavement roughness based on one-way facility centerline miles. A lower IRI indicates smoother highway conditions and a higher IRI indicates rougher highway conditions.
Source: U.S. Department of Transportation, Federal Highway Administration, High-way Statistics, table HM-47, available at https://www.fhwa.dot.gov/policyinforma-tion/statistics.cfm as of November 2017.

5Infrastructure
1-6 Structurally Deficient Bridges: 1990–2016
1990 1992 1994 1996 1998 2000 2002 2004 2006 2008 2010 2012 2014 2016
Thou
sand
s of
brid
ges
Source: As cited in U.S. Department of Transportation, Bureau of Transporta-tion Statistics, National Transportation Statistics, tables 1-28, available at www.bts.gov as of October 2017.
1-7 Structurally Deficient Bridges by State: 2016
DC
0 4 8 12 16
Percent deficient(of all bridges in state)
Source: U.S. Department of Transportation, Federal Highway Administration, National Bridge Inventory, available at http://www.fhwa.dot.gov/bridge/defi-cient.cfm as of October 2017.


7Moving People
2 movIng PeoPle
The U.S. transportation system makes personal mobility possible. Every day people use the
transportation system to get to and from work, school, and shopping and for recreation, social, and personal purposes.
2-1 Vehicle-Miles Traveled millionsMode 2008 2015
Air
U.S. air carrier, domestica 6,446 6,046
Highway
Light-duty vehicleb 2,630,213 2,779,693
Motorcycle 20,811 19,606
Truck 310,680 279,844
Bus 14,823 16,230
Passenger rail
Amtrakc 272 319
Commuter railc 337 374
Heavy railc 674 701
Light rail c,d 88 115aMeasured in revenue aircraft-miles. bIncludes passenger cars, light trucks, vans, and sport utility vehicles. cMeasured in passenger car-miles. dLight rail was revised beginning in 2011 and includes light rail, street car rail, and hybrid rail.
Source: As cited in U.S. Department of Transportation, Bureau of Trans-portation Statistics, National Transportation Statistics, table 1-35, avail-able at www.bts.gov as of October 2017.

8 Pocket Guide to Transportation
2-2 Highway Travel: 1970–2016Tr
illio
ns o
f veh
icle
-mile
s
0
0.5
1.0
1.5
2.0
2.5
3.0
3.5
1970 1980 1990 2000 2010
Note: Data for 2007 and later years may not be comparable to previous years due to changes in methodology.
Source: U.S. Department of Transportation, Federal Highway Administration, Highway Statistics, available at http://www.fhwa.dot.gov/policyinformation/statistics.cfm as of November 2017.

9Moving People
2-3 Passenger-Miles Traveled millionsMode 2007 2015
Air
U.S. air carrier, domestic 607,564 641,905
Highway
Light-duty vehiclea 4,341,984 3,828,301
Motorcycle 27,173 21,118
Truck 304,178 279,844
Bus 307,753 344,073
Passenger rail
Amtrakb 5,784 6,536
Commuter rail 11,137 11,759
Heavy rail 16,138 18,400
Light railc 1,930 2,645aIncludes passenger cars, light trucks, vans, and sport utility vehicles. bMea-sured in revenue passenger-miles. cLight rail was revised beginning in 2011 and includes light rail, street car rail, and hybrid rail.
Source: As cited in U.S. Department of Transportation, Bureau of Transporta-tion Statistics, National Transportation Statistics, table 1-40, available at www.bts.gov as of October 2017.

10 Pocket Guide to Transportation
2-4 Transit Ridership: 1970–2014Bi
llion
s of
unl
inke
d pa
ssen
ger t
rips
(una
djus
ted)
0
2
4
6
8
10
12
1970 1980 1990 2000 2010
Note: Includes bus, commuter rail, demand response, heavy rail, light rail, trolley bus, ferry boat, aerial tramway, automated guideway, cable car, inclined plane, monorail, and other.
Source: American Public Transportation Association, Public Transportation Fact Book, Appendix, available at www.apta.com as of October 2017.
11Moving People
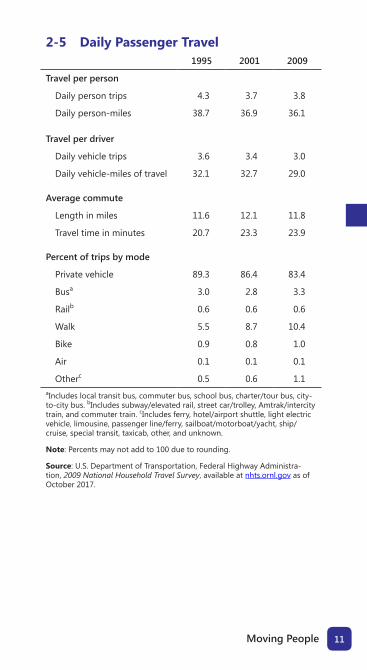
2-5 Daily Passenger Travel1995 2001 2009
Travel per person
Daily person trips 4.3 3.7 3.8
Daily person-miles 38.7 36.9 36.1
Travel per driver
Daily vehicle trips 3.6 3.4 3.0
Daily vehicle-miles of travel 32.1 32.7 29.0
Average commute
Length in miles 11.6 12.1 11.8
Travel time in minutes 20.7 23.3 23.9
Percent of trips by mode
Private vehicle 89.3 86.4 83.4
Busa 3.0 2.8 3.3
Railb 0.6 0.6 0.6
Walk 5.5 8.7 10.4
Bike 0.9 0.8 1.0
Air 0.1 0.1 0.1
Otherc 0.5 0.6 1.1aIncludes local transit bus, commuter bus, school bus, charter/tour bus, city-to-city bus. bIncludes subway/elevated rail, street car/trolley, Amtrak/intercity train, and commuter train. cIncludes ferry, hotel/airport shuttle, light electric vehicle, limousine, passenger line/ferry, sailboat/motorboat/yacht, ship/cruise, special transit, taxicab, other, and unknown.
Note: Percents may not add to 100 due to rounding.
Source: U.S. Department of Transportation, Federal Highway Administra-tion, 2009 National Household Travel Survey, available at nhts.ornl.gov as of October 2017.

12 Pocket Guide to Transportation
2-6 Commute Mode Share: 2016 percent of workers age 16 and older
Drive alone(76.3%)
Carpool(9.0%)
Transit(5.1%)
Work at home(5.0%)
Walk(2.7%)
Othera
(1.2%)Bike(0.6%)
a Includes motorcycle, taxi, and other means.
Notes: Percents may not add to 100 due to rounding. The American Commu-nity Survey asks for the mode usually used by the respondent to get to work. For more than one mode of transportation, respondents select the mode used for most of the distance traveled.
Source: As cited in U.S. Department of Transportation, Bureau of Transporta-tion Statistics, National Transportation Statistics, table 1-41, available at www.bts.gov as of October 2017.

13Moving People
2-7 Amtrak Ridership: FY2000–FY2016M
illio
ns o
f pas
seng
ers
2000 2002 2004 2006 2008 2010 2012 2014 20160
10
20
30
40
Source: U.S. Department of Transportation, Federal Railroad Administration, available at safetydata.fra.dot.gov/OfficeofSafety as of October 2017.
2-8 Top 10 Amtrak Stations: FY2016 by passengers
2.4% 10.4
2.6% 5.1
4.6% 4.3
-1.5% 3.2
2.9% 1.6
2.0% 1.6
2.3% 1.1
1.03.7%
3.6% 0.9
San Diego, CA 0.5% 0.810
9
8
7
6
5
4
3
2
1 New York Penn Station, NY
Washington, DC
Philadelphia 30th St., PA
Chicago, IL
Los Angeles, CA
Boston South Station, MA
Sacramento, CA
Baltimore, MD
Albany-Rensselaer, NY
Rank Station Millions of passengersFY ‘15–FY ‘16
change
Note: Includes passenger boardings and detrainings.
Source: Amtrak, National Fact Sheet and State Fact Sheet, available at www.amtrak.com as of October 2017.

14 Pocket Guide to Transportation
2-9 U.S. Air Carrier Passenger Traffic: 2003–2016
0
200
400
600
2003 2005 2007 2009 2011 2013 2015
800
1,000
Mill
ions
of p
asse
nger
s
Note: Includes passenger enplanements on scheduled services only (domestic and international flights).
Source: U.S. Department of Transportation, Bureau of Transportation Statistics, Office of Airline Information, T-100 Market data, available at www.bts.gov as of October 2017.
2-10 Top 10 U.S. Airports: 2016 by enplaned passengers
10
9
8
7
6
5
4
3
2
1
Rank Station Millions of passengers
Atlanta, GA
Chicago O'Hare, IL
Los Angeles, CA
Dallas/Fort Worth, TX
Denver, CO
New York JFK, NY
San Francisco, CA
Las Vegas, NV
Seattle, WA
Charlotte, NC
'15-'16 change
21.5
50.5
39.6
37.5
31.3
29.1
28.2
25.7
22.6
21.8
2.4%
8.7%
3.4%
-1.0%
4.4%
7.6%
6.1%
4.5%
8.6%
-1.8%
Note: Includes passenger enplanements on U.S. carrier scheduled domestic and international service and foreign carrier scheduled international service to and from the United States.
Source: U.S. Department of Transportation, Bureau of Transportation Statistics, Office of Airline Information, T-100 Market data, available at transtats.bts.gov as of December 2017.

15Moving People
2-11 Top 10 World Airports: 2016 by enplaned, deplaned, and in-transit passengers
2.6% 104.2
5.0% 94.4
7.2% 83.7
8.0% 80.9
5.5% 79.7
1.3% 78.0
1.0% 75.7
3.0% 70.3
9.8% 66.0
0.3% 65.910
9
8
7
6
5
4
3
2
1Rank Airport
Atlanta, USA
Beijing, China
Chicago O’Hare, USA
Tokyo Haneda, Japan
Los Angeles, USA
London, United Kingdom
Dubai, United Arab Emirates
Shanghai, China
Paris, France
Hong Kong, China
'15-'16 change Millions of passengers
Note: Preliminary data for passengers enplaned, deplaned, and passengers in transit.
Source: Airports Council International, available at www.aci.aero as of October 2017.

16 Pocket Guide to Transportation
2-12 Incoming Land Border Person Crossings: 1995–2016
Mill
ions
of p
erso
n cr
ossi
ngs
0
50
100
150
200
250
300
350
1995 1997 1999 2001 2003 2005 2007 2009 2011 2013 2015
Mexico
Canada
Note: Excludes drivers and passengers in commercial trucks.
Source: U.S. Department of Transportation, Bureau of Transportation Statistics, Border Crossing Entry Data, available at https://data.transportation.gov/ as of October 2017.

17Moving People
2-13 Top 5 Land Ports of Entry: 2016 by incoming person crossings
-4.5%
3.4%
8.7%
-0.9%
1.6%5
4
3
2
1
Rank Port '15-'16 change Millions of person crossings
San Ysidro, CA
Laredo, TX
Hidalgo, TX
U.S. - Mexico ports of entry
El Paso, TX
Otay Mesa, CA
11.1
8.0
7.0
3.1
2.6
31.6
28.0
17.1
15.4
12.3
5
4
3
2
1Rank Port
U.S. - Canada ports of entry
Buffalo-Niagara Falls, NY
Blaine, WA
Detroit, MI
Port Huron, MI
'15-'16 change Millions of person crossings
-2.0%
-5.7%
-2.7%
-5.5%
-1.4%Champlain-Rouses Pt., NY
Note: Excludes drivers and passengers in commercial trucks.
Source: U.S. Department of Transportation, Bureau of Transportation Statistics, Border Crossing Entry Data, available at https://data.transportation.gov/ as of October 2017.


19Moving Goods
3 movIng goods
The freight transportation network links natural resources, manufacturing facilities, labor markets,
and customers across the Nation and with international trading partners.
3-1 Freight Shipments Within the U.S. by ModeValue of shipments (billions of chained 2012 dollars)
Mode 2012 2015 2045
Truck 12,222 13,066 24,506Rail 718 793 1,789Water 430 486 947Air and truck-air 650 766 3,126Pipeline 1,301 1,486 1,867Multiple modesa 2,148 2,325 5,192Otherb 264 257 559Total 17,733 19,178 37,985
Weight of shipments (millions of tons)
Mode 2012 2015 2045
Truck 10,759 11,466 17,248Rail 1,838 1,802 2,557Water 654 722 1,068Air and truck-air 7 7 25Pipeline 2,963 3,358 4,646Multiple modesa 424 444 1,013Otherb 398 314 414Total 17,043 18,113 26,971
Ton-miles of shipments (billions of ton-miles)
Mode 2012 2015 2045
Truck 1,919 2,048 3,580Rail 1,491 1,436 1,999Water 323 333 445Air and truck-air 6 7 27Pipeline 821 967 1,346Multiple modesa 339 360 848Otherb 11 11 34Total 4,911 5,161 8,278aIncludes mail. bIncludes other, unknown, and imported crude oil with no domestic mode.Notes: Details may not add to totals due to rounding. Includes domestic trade and the domestic portion of imports and exports.Source: U.S. Department of Transportation, Bureau of Transportation Statistics and Federal Highway Administration, Freight Analysis Framework, Version 4.4, available at www.bts.gov as of October 2017.

20 Pocket Guide to Transportation
3-2 U.S. Trade by Coasts and Borders: 1990–2016
Atlantic coast
Canadian border
Pacific coast
Gulf coast
Mexican border
0
200
400
600
800
1,000
1,200
Billi
ons
of 2
009
dolla
rs
1990 1995 2000 2005 2010 2015
Note: Includes merchandise trade only.
Sources: Value–U.S. Department of Commerce, U.S. Census Bureau, Foreign Trade Division, available at www.census.gov as of June 2017. Implicit GDP Deflator– U.S. Department of Commerce, Bureau of Economic Analysis, avail-able at www.bea.gov as of June 2017.

21Moving Goods
3-3 U.S.-NAFTA Merchandise Freight Trade by Mode: 2016
65
15
5 4 5 5
26
2024
<0.1
26
4
0
10
20
30
40
50
60
70
Perc
ent o
f fre
ight
trad
e
Value Weight
Trucka Raila Water Air Pipelinea Othera, b
aExport weights for land modes are estimated by the Bureau of Transportation Statistics using value-to-weight ratios derived from import data. bIncludes mail, other, unknown, and shipments through Foreign Trade Zones.
Note: North American Free Trade Agreement (NAFTA) refers to U.S. trade with Canada and Mexico.
Source: U.S. Department of Transportation, Bureau of Transportation Statistics, special tabulation and North American Transborder Freight Data, available at www.bts.gov as of May 2017.

22 Pocket Guide to Transportation
3-4 Incoming Truck Border Crossings: 1995–2016
Mill
ions
of t
ruck
cro
ssin
gs
0
1
2
3
4
5
6
7
8
1995 1997 1999 2001 2003 2005 2007 2009 2011 2013 2015
Canada
Mexico
Source: U.S. Department of Transportation, Bureau of Transportation Statistics, Border Crossing Entry Data, available at https://data.transportation.gov/ as of October 2017.

23Moving Goods
3-5 Top 5 Truck Ports of Entry: 2016 by incoming truck crossings
1.6
1.0
0.8
0.4
0.35
4
3
2
1
Rank Port '15-'16 change
U.S. - Canada ports of entry
Detroit, MI
Buffalo-Niagara Falls, NY
Port Huron, MI
Blaine, WA
Champlain-Rouses Pt., NY
Millions of truck crossings
2.1
0.9
0.8
0.6
0.35
4
3
2
1
Rank Port '15-'16 change
Laredo, TX
Otay Mesa, CA
El Paso, TX
Hidalgo, TX
Calexico East, CA
Millions of truck crossings
U.S. - Mexico ports of entry
3.5%
1.0%
4.2%
-3.5%
-3.5%
3.4%
8.4%
2.2%
4.0%
3.6%
Source: U.S. Department of Transportation, Bureau of Transportation Statistics, Border Crossing Entry Data, available at https://data.transportation.gov/ as of October 2017.

24 Pocket Guide to Transportation
3-6 Top 10 U.S. Water Ports: 2016 by short tons
Key: TEU = twenty-foot equivalent unit.
Note: Includes domestic and foreign waterborne trade. Excludes foreign empty TEUs.
Sources: Short tons - As cited in U.S. Department of Transportation, Bureau of Transportation Statistics, National Transportation Statistics, table 1-57, avail-able at www.bts.gov as of October 2017. Containers - U.S. Army Corps of Engineers, Waterborne Commerce Statistics Center, available at www.naviga-tiondatacenter.us as of November 2017.
5
4
3
2
1
10
9
8
7
6
Rank Port
South Louisiana
Houston, TX
New York/New Jersey
Corpus Christi, TX
New Orleans, LA
Beaumont, TX
Long Beach, CA
Los Angeles, CA
Baton Rouge, LA
Mobile, AL
'15-'16 change Millions of short tons
5
4
3
2
1
10
9
8
7
6
Rank Port '15-'16 change Millions of TEUs
Los Angeles, CA
Long Beach, CA
New York/New Jersey
Savannah, GA
Port of Virginia, VA
Oakland, CA
Houston, TX
Seattle, WA
Tacoma, WA
Charleston, SC
4.6
2.9
2.1
1.8
1.8
1.8
1.6
1.3
1.1%
2.9%
5.3%
2.8%
-3.0%
-4.3%
-0.4%
6.1%
4.0%
-1.0%
8.5%
-2.3%
-0.4%
2.3%
6.0%
11.3%
11.4%
3.7%
4.0%
16.7%
261.9
248.0
133.4
90.3
84.5
82.0
77.8
73.0
62.6
58.0
6.0
5.1
by container TEUs, excluding foreign empty TEUs

25Moving Goods
3-7 Top 10 World Container Ports: 2015 by TEUs, including full and empty containers
Shanghai
Singapore
Hong Kong
Shenzhen
Ningbo
Busan
Guangzhou
Dubai Ports
Tianjin
Los Angeles
Long Beach
New York/New Jersey
Quindao
5
4
3
2
1
10
9
8
7
6
Rank Port '14-'15 change Millions of TEUs
24
20
16
3.4%
-9.5%
1.4%
5.7%
-11.5%
5.4%
4.0%
5.5%
5.4%
-1.2%
-2.2%
5.2%
9.4%
36.5
30.9
24.1
20.6
20.1
19.5
17.3
17.1
15.6
13.9
8.2
7.2
6.4
Key: TEU = twenty-foot equivalent unit.
Source: American Association of Port Authorities, World Port Rankings, avail-able at www.aapa-ports.org as of October 2017.

26 Pocket Guide to Transportation
3-8 Top 10 International Trade Gateways: 2015 by value of shipments
Billions of dollars
-1.9%
-7.8%
2.7%
-3.2%
-12.8%
5.6%
-18.4%
-3.1%
8.2%
8.4%
5
4
3
2
1
10
9
8
7
6
Rank Port '14-'15 change
New York/New Jersey, NY
Los Angeles, CA
New York JFK Airport, NY
Long Beach, CA
Laredo, TX
Chicago, IL
Detroit, MI
Houston, TX
Los Angeles Airport, CA
Savannah, GA
202.6
198.4
197.2
185.5
154.2
141.8
134.6
128.9
99.9
87.3
Key: = airport, = land port, = water port
Notes: Air gateways include a low level (generally less than 3% of the total value) of freight shipped through small user-fee airports located in the same area as the gateways listed. Air gateways not identified by airport name (e.g., Chicago, IL) include major airport(s) in the area and small regional airports.
Source: As cited in U.S. Department of Transportation, Bureau of Transportation Statistics, National Transportation Statistics, table 1-51, available at www.bts.gov as of October 2017.

27Safety
4 sAfety
Transportation safety is the top priority of the U.S. Department of Transportation.
4-1 Transportation Fatalities by ModeMode 2005 2015 2016Air 603 404 400 U.S. air carrier 22 0 0 Commuter carrier 0 1 0 On-demand air taxi 18 27 28 General aviation 563 376 372
Highway 43,510 35,485 37,461 Passenger car occupants 18,512 12,761 13,412 Motorcyclists 4,576 5,029 5,286 Light-truck occupants 13,037 9,818 10,302 Heavy-truck occupants 804 665 722 Bus occupants 58 49 43 Pedestrians 4,892 5,495 5,987 Pedalcyclists 786 829 840 Other 845 839 869
Pipeline 17 12 16
Rail 884 751 791 Train Accidents 33 13 8 Highway-rail grade crossinga 359 235 266 Trespassers 458 452 482 Other 34 52 31
Transitb 149 254 256
Water 829 766 737 Freight vessel and Industrial/Other 80 59 29 Passenger vessel and Recreational boating 749 707 708a Individual modes don’t add up to totals due to double counting in highway, rail, and transit grade crossings. b Includes transit employee, contract worker, passenger, revenue facility occupant, and other fatalities for all modes reported to the National Transit Database.
Source: As cited in U.S. Department of Transportation, Bureau of Transportation Statistics, National Transportation Statistics, table 2-1, available at www.bts.gov as of October 2017.

28 Pocket Guide to Transportation
4-2 Transportation Injuries by Mode
Mode 2005 2015 2016
Air 305 284 U
U.S. air carrier 14 23 U
Commuter carrier 0 4 U
On-demand air taxi 20 9 U
General aviation 271 248 U
Highway 2,699,000 2,424,000 U
Passenger car occupants 1,573,396 1,378,000 U
Motorcyclists 87,335 88,000 U
Light-truck occupants 872,137 803,000 U
Heavy-truck occupants 27,284 30,000 U
Bus occupants 11,133 U U
Pedestrians 64,446 70,000 U
Pedalcyclists 45,439 45,000 U
Other 17,806 10,000 U
Pipeline 46 49 86
Rail 9,550 9,130 8,407
Train Accidents 787 563 386
Highway-rail grade crossinga 1,053 1,044 839
Trespassers 420 414 485
Other 7,290 7,109 6,697
Transitb 19,039 24,299 24,377
Water 4,125 3,165 U
Freight vessel and Industrial/Other 473 239 U
Passenger vessel and Recreational boating 3,652 2,926 UaExcludes injuries involving motor vehicles at public highway-rail grade crossings, which are assumed to be counted under Highway categories. bIncludes transit employee, contract worker, passenger, revenue facility occupant, and other injuries for all modes reported to the National Transit Database. Other transit injuries are assumed to be counted under Highway or Rail categories.
Key: U = Data are unavailable.
Source: As cited in U.S. Department of Transportation, Bureau of Transportation Statistics, National Transportation Statistics, table 2-2, available at www.bts.gov as of November 2017.

29Safety
4-3 Fatality Rates by Mode
0.0
0.5
1.0
1.5
2.0
2.5
1990 1995 2000 2005 2010 2015
Fata
litie
s pe
r 100
mill
ion
vehi
cle-
mile
s
Highway: 1990–2016
0.0
0.5
1.0
1.5
2.0
1990 1995 2000 2005 2010 2015
Fata
litie
s pe
r 100
mill
ion
vehi
cle-
mile
s
Passenger car and light-truck occupants: 1990–2016
0.0
1.0
2.0
3.0
4.0
1990 1995 2000 2005 2010 2015
Fata
litie
s pe
r 100
,000
po
pula
tion
Highway nonoccupants: 1990–2016
0.0
0.5
1.0
1.5
2.0
2.5
1990 1995 2000 2005 2010 2015
Fata
litie
s pe
r 100
mill
ion
vehi
cle-
mile
s
Large-truck occupants: 1990–2015
0.0
1.0
2.0
3.0
4.0
1990 1995 2000 2005 2010 2015
Fata
litie
s pe
r 100
,000
fli
ght h
ours
U.S. air carriers: 1990–2016
0.0
1.0
2.0
3.0
4.0
1990 1995 2000 2005 2010 2015
General aviation: 1990–2015
Fata
litie
s pe
r 100
,000
fli
ght h
ours
Notes: Graphs with same color trend lines have identical scales. Highway non-occupants include pedestrian, pedalcyclist, and other.
Sources: As cited in or calculated from U.S. Department of Transportation, Bureau of Transportation Statistics, National Transportation Statistics, tables 2-9, 2-14, 2-17, 2-19, 2-21, 2-23, and 3-10 available at www.bts.gov as of November 2017.

30 Pocket Guide to Transportation
4-4 Alcohol-Impaired Driving Fatalities: 1990–2016
Fata
litie
s
0
4,000
8,000
12,000
16,000
20,000
Percent of all highway fatalities
0
10
20
30
40
50
1990 1995 2000 2005 2010 2015
Note: Includes fatalities occurring in any crash involving a driver with a blood alcohol concentration (BAC) of 0.08 grams per deciliter or higher.
Source: U.S. Department of Transportation (USDOT), National Highway Traffic Safety Administration, Traffic Safety Facts: Alcohol-Impaired Driving (Annual Issues) as of November 2017.
4-5 Pedestrian and Bicyclist Fatalities: 1990–2016
0
10
20
30
40
50
Percent of all highway fatalities
Fata
litie
s
0
2,000
4,000
6,000
8,000
10,000
1990 1995 2000 2006 2010 2015
Note: Includes pedestrians and riders of nonmotorized bicycles and other pedal-powered vehicles.
Source: As cited in U.S. Department of Transportation, Bureau of Transporta-tion Statistics, National Transportation Statistics, table 2-1, available at www.bts.gov as of November 2017.

31Safety
4-6 Distracted Driving Fatalities and Injuries: 2005–2016
0
10
20
30
40
0
2,000
4,000
6,000
8,000
2005 2006 2007 2008 2009 2010 2011 2012 2013 2014 2015 2016
Percent of all highway fatalities
Fatalities
Fata
litie
s
0 0
200,000
400,000
600,000
800,000
2005 2006 2007 2008 2009 2010 2011 2012 2013 2014 2015
Percent of all highway injuries
Injuries
Inju
ries
10
20
30
40
Note: Distracted driving involves any activity that could divert a person’s attention away from the primary task of driving, such as texting, using a cell phone, eating and drinking, grooming, using a navigation system, adjusting a radio, etc.
Source: U.S. Department of Transportation, National Highway Traffic Safety Administration, available at www.nhtsa.gov as of November 2017.
Note: Distracted driving fatality data for 2010–2016 and on are not comparable with previous years due to changes in methodology.


33Performance
5 PerformAnce
The physical capacity of the U.S. transportation system has not kept pace with growth in travel and
commerce. The resulting congestion and delays have significant impacts on passengers and freight shippers.
5-1 Road Congestion: 1985–2014
Annu
al h
ours
of d
elay
per
car
com
mut
er
1985 1990 1995 2000 2005 2010
0
10
20
30
40
50
Notes: The methodology to calculate congestion performance measures was updated to reflect more comprehensive data collection, including congestion estimates for each of the 471 U.S. urban areas. The congestion estimates for all study years are recalculated every time the methodology is altered to provide a consistent data trend. For a detailed explanation of the updated methodology, see the 2015 Urban Mobility Scorecard Methodology, available at http://mobility.tamu.edu/ums/report/.Source: As cited in U.S. Department of Transportation, Bureau of Transporta-tion Statistics, National Transportation Statistics, table 1-69, available at www.bts.gov as of November 2017.

34 Pocket Guide to Transportation
5-2 Top 10 Urban Congested Area Rankings: 2014 by hours of delay per car commuter
5
4
3
2
1
10
9
7
7
6
Rank Urban area Annual hours of delay per car commuterWashington, DC-VA-MD
Los Angeles, CA
San Francisco, CA
New York, NY-NJ
Boston, MA-NH-RI
Houston, TX
Atlanta, GA
Chicago, IL-IN
Dallas-Fort Worth-Arlington, TX
Seattle, WA
Average of 471 urban areas
82
80
78
74
64
63
61
61
53
52
42
Notes: Ranks include very large geographic areas only. The methodology was updated to reflect more comprehensive data collection efforts for each of the 471 U.S. urban areas.
Source: As cited in U.S. Department of Transportation, Bureau of Transportation Statistics, National Transportation Statistics, table 1-69, available at www.bts.gov as of October 2017.

35Performance
5-3 U.S. Airport On-time Performance: 1995–2016Pe
rcen
t of f
light
ope
ratio
ns
0
20
40
60
80
100
1995 2000 2005 2010 2015
On-time arrivals
Note: Flights arriving at the gate within 15 minutes of scheduled arrival time are on time.Source: U.S. Department of Transportation, Bureau of Transportation Statistics, Airline On-Time Performance, available at www.bts.gov as of November 2017.
5-4 U.S. Airport Delays by Cause: 2016 percent of delayed time
Security delay(<0.5%)
Extreme weathera
(4%)
Aircraft arriving lateb
(39%)
Air carrier delay(33%)
NAS delay(24%)
aIncludes weather events that prevent flying. Other weather delays that slow operations are included under other categories. bDelay resulting from a previous flight with the same aircraft arriving late.Key: NAS = Delays attributable to the national aviation system (NAS) that refer to a broad set of conditions, such as non-extreme weather, airport operations, heavy traffic volume, and air traffic control.Note: Percents may not add to 100 due to rounding.Source: U.S. Department of Transportation, Bureau of Transportation Statistics, Airline On-Time Performance, available at www.bts.gov as of November 2017.

36 Pocket Guide to Transportation
5-5 U.S. Major Airport Performance Rankings: 2016 by percent of on-time arrivals
Salt Lake City, UT
Atlanta, GA
Detroit, MI
Charlotte, NC
Minneapolis/St. Paul, MN
All major U.S. airports
New York, NY (JFK)
Los Angeles, CA
Newark, NJ
San Francisco, CA
New York, NY (LGA)
Top
5Bo
ttom
5
87.1
86.3
85.4
84.4
84.1
81.1
76.8
75.9
74.5
73.6
71.9
Note: Flights arriving at the gate within 15 minutes of scheduled arrival time are on time.
Source: U.S. Department of Transportation, Bureau of Transportation Statistics, Airline On-Time Performance, available at www.bts.gov as of November 2017.

37Performance
5-6 Amtrak On-time Performance: FY1990–FY2016
Perc
ent o
f tra
in a
rriv
als
0
20
40
60
80
100
1990 1995 2000 2005 2010 2015
On-time arrivals
Note: On-time performance is a percentage measure of train performance. A train is considered on-time if it arrives at the final destination, or end-point, within an allowed number of minutes, or tolerance, of its scheduled arrival time. Trains are allowed a certain tolerance at the end-point based on the number of miles traveled:
Source: As cited in U.S. Department of Transportation, Bureau of Transportation Statistics, National Transportation Statistics, table 1-73, available at www.bts.gov as of October 2017.
Trip lengthTrain arrives at
endpoint within
0-250 miles 10 minutes
251-350 miles 15 minutes
351-450 miles 20 minutes
451-550 miles 25 minutes
>551 miles 30 minutes

38 Pocket Guide to Transportation
5-7 Amtrak Delays by Cause: FY2016 percent of delayed time
Host railroad(54.0%)
Othera
(17.0%)
Amtrak(29.0%)
aDelays not attributable to Amtrak or other host railroads, such as customs and immigration, law enforcement action, weather, or waiting for scheduled departure time.
Source: As cited in U.S. Department of Transportation, Bureau of Transportation Statistics, National Transportation Statistics, table 1-73, available at www.bts.gov as of October 2017.

39Economy
6 economy
Transportation is a major sector of the U.S. economy. The transportation system moves people and goods,
employs millions of workers, generates revenue, and consumes resources and services provided by other sectors.
6-1 U.S. GDP by Spending Category: 2016 percent of GDP
Othera
(39%) Education(7%)
Transportation(9%)
Food(10%)
Healthcare(17%)
Housing(19%)
aIncludes all other categories (e.g. entertainment, personal care products and services, and payments to pension plans).
Key: GDP = gross domestic product.
Note: Percents may not add to 100 due to rounding.
Source: As cited in U.S. Department of Transportation, Bureau of Transportation Statistics, National Transportation Statistics, table 3-9, available at www.bts.gov as of November 2017.
40 Pocket Guide to Transportation
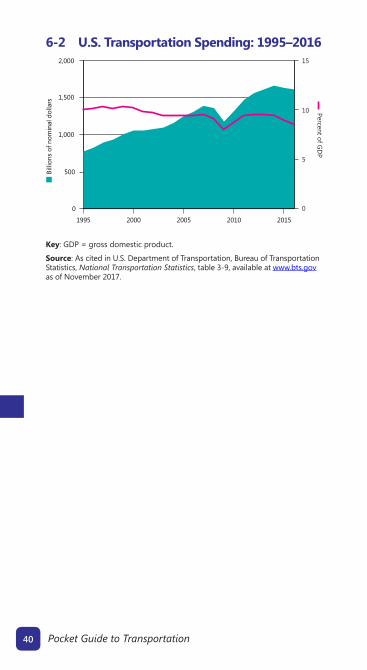
6-2 U.S. Transportation Spending: 1995–2016
0
5
10
15
Percent of GD
P
0
500
1,000
1,500
2,000
Billi
ons
of n
omin
al d
olla
rs
1995 2000 2005 2010 2015
Key: GDP = gross domestic product.
Source: As cited in U.S. Department of Transportation, Bureau of Transportation Statistics, National Transportation Statistics, table 3-9, available at www.bts.gov as of November 2017.

41Economy
6-3 Transportation-Related Final Demand billions of chained 2009 dollars
Category 2006 2016
Personal consumption of transportation 995 1,060
Motor vehicles and parts 385 439
Motor vehicle fuels, lubricants, and fluids 274 268
Transportation services 336 353
Gross private domestic investment 222 289
Transportation structures 9 11
Transportation equipment 213 278
Government transportation-related purchases 291 282
Federal purchases 34 36
State and local purchases 242 234
Defense-related purchases 16 12
Exports ( + ) 245 320
Imports ( - ) 380 470
Total transportation-related final demand 1,372 1,490
U.S. GDP 14,614 16,716
Notes: Numbers may not add to totals due to rounding. Transportation-related final demand measures the size of transportation functions in relation to the gross domestic product (GDP). It includes the transportation portion of the four components of the GDP: personal consumption, gross private domestic investment, government purchases, and net exports of goods and services.
Source: As cited in U.S. Department of Transportation, Bureau of Transporta-tion Statistics, National Transportation Statistics, table 3-4, available at www.bts.gov as of November 2017.

42 Pocket Guide to Transportation
6-4 Household Expenses by Category: 2016 percent of average annual household expenses
Housing(33%)
Othera
(16%)
Food(13%)
Personal insurance and pensions
(12%) Health care(8%) Apparel and services
(3%)
Transportation(16%)
Vehicle purchases$3,634
Gasoline and motor oil$1,909
Other vehicle expenses$2,884
Public and other transportation$623
a Includes alcoholic beverages, cash contributions, education, entertainment, personal care products and services, reading, tobacco products and smoking supplies, and other miscellaneous items.
Note: Percents may not add to 100 due to rounding.
Source: U.S. Department of Labor, Bureau of Labor Statistics, Consumer Expen-diture Survey, available at www.bls.gov/cex as of November 2017.
6-5 Household Transportation Expenses: 1985–2016
1985 1990 1995 2000 2005 2010 2015
Nom
inal
dol
lars
0
5
10
15
20
25
Percent of pre-tax income
0
2,000
4,000
6,000
8,000
10,000
Source: U.S. Department of Labor, Bureau of Labor Statistics, Consumer Expen-diture Survey, available at www.bls.gov/cex as of November 2017.

43Economy
6-6 Transportation Services Index: Jan. 2000–Sept. 2017 chain-type index: 2000 = 100, seasonally adjusted
Chai
n-ty
pe in
dex:
200
0 =
100
, sea
sona
lly a
djus
ted
Chai
n-ty
pe in
dex:
200
0 =
100
, sea
sona
lly a
djus
ted
TSI freightTSI combined
(passenger and freight)
TSI passenger
TSI combined(passenger and freight)
80
90
100
110
120
130
80
90
100
110
120
130
Notes: TSI Combined - The TSI, created by the U.S. Department of Transpor-tation, Bureau of Transportation Statistics, is a measure of the month-to month changes in the output of services provided by the for-hire transportation industries. TSI data change monthly due to the use of concurrent seasonal analysis, which results in seasonal analysis factors changing as each month’s data are added. TSI Freight - Includes freight railroad services (including rail-based intermodal shipments such as containers on flat cars); inland waterway traffic; pipeline movements (including principally petroleum and petroleum products and natural gas); and air freight. TSI Passenger - The passenger transportation services index consists of: local mass transit; intercity passenger rail; and passenger air transportation.
Source: U.S. Department of Transportation, Bureau of Transportation Statistics, available at www.bts.gov as of November 2017.

44 Pocket Guide to Transportation
6-7 Employment in Transportation- Related Industries thousands
Category 2006 2016
For-hire transportation and warehousing 4,470 4,989
Air 487 459
Rail 227 215
Water 63 66
Truck 1,436 1,454
Transit and ground passenger 399 478
Pipeline 39 49
Scenic and sightseeing 28 35
Support activities 571 660
Couriers and messengers 582 642
Warehousing and storage 638 915
Transportation-related manufacturinga 2,128 1,914
Other transportation-related industries 5,239 5,454
Postal service 770 609
Government employmentb 885 U
Total transportation-related labor force 13,491 13,004
U.S. labor force 136,453 144,306aIncludes transportation equipment; petroleum products; tires; rubber; plastics; search, detection, navigation, guidance, aeronautical, and nautical systems; and instrument manufacturing. bFiscal year data for federal, state, and local personnel.
Key: U = data are not available.
Notes: Annual averages based on NAICS data. Details may not add to totals due to rounding.
Source: As cited in U.S. Department of Transportation, Bureau of Transporta-tion Statistics, National Transportation Statistics, table 3-23, available at www.bts.gov as of November 2017.

45Economy
6-8 Motor Vehicle Fuel Prices: Sept. 1990–Oct. 2017
0
1
2
3
4
5
Dol
lars
per
gal
lon
Retail gasoline prices
Retail diesel prices
1990 1995 2000 2005 2010 2015
Notes: Retail Gasoline Prices include average nominal monthly prices of U.S. Regular All Formations retail gasoline. Diesel Retail Prices include average nominal monthly prices of U.S. No. 2 Diesel Retail Prices.
Source: U.S. Department of Energy, Energy Information Administration, avail-able at www.eia.doe.gov as of November 2017.


47Environment
7 envIronment
The U.S. transportation system is a major consumer of energy and generates environmental impacts.
7-1 Energy Consumption by Sector: 1960–2016
Qua
drill
ion
Btu
0
10
20
30
40
1960 1970 1980 1990 2000 2010
Transportation
Industrial
Residential
Commercial
Key: Btu = British thermal unit.
Note: Includes primary energy consumption, electricity retail sales, and electri-cal system energy losses.
Source: U.S. Department of Energy, U.S. Energy Information Administration, Monthly Energy Review, available at www.eia.gov/totalenergy/data/monthly as of November 2017.

48 Pocket Guide to Transportation
7-2 Transportation Energy Consumption by Source: 2016 percent of Btu consumed
Petroleum(92%)
Renewable energy(5%)
Natural gas(3%)
Key: Btu = British thermal unit.
Notes: Includes primary energy consumed. Excludes electricity retail sales and electrical system energy losses.
Source: U.S. Department of Energy, U.S. Energy Information Administration, Monthly Energy Review, available at www.eia.gov/totalenergy/data/monthly as of November 2017.

49Environment
7-3 Petroleum Consumption by Sector: 1960–2016
1960 1965 1970 1975 1980 1985 1990 1995 2000 2005 2010 2015
Mill
ion
barr
els
per d
ay
0
3
6
9
12
15Transportation
Industrial
Residential and commercialElectric power
Source: U.S. Department of Energy, U.S. Energy Information Administration, Monthly Energy Review, available at www.eia.gov/totalenergy/data/monthly as of November 2017.

50 Pocket Guide to Transportation
7-4 Greenhouse Gas Emissions by Sector: 1990–2015
Transportation
Industry
Residential
Commercial
Agriculture
Tg C
O2 E
q.
0
500
1,000
1,500
2,000
2,500
3,000
1990 1995 2000 2005 2010 2015
Key: Tg CO2 Eq. = teragrams of carbon dioxide equivalent. A teragram = 1 million metric tons.
Notes: Electric power sector emissions are distributed across sectors. Emissions include CO2, CH4, N2O, HFCs, PFCs, and SF6.
Source: U.S. Environmental Protection Agency, Inventory of U.S. Greenhouse Gas Emissions and Sinks: 1990-2015 Report Tables, https://www.epa.gov/ghgemissions/inventory-us-greenhouse-gas-emissions-and-sinks-1990-2015 as of November 2017.
51Environment
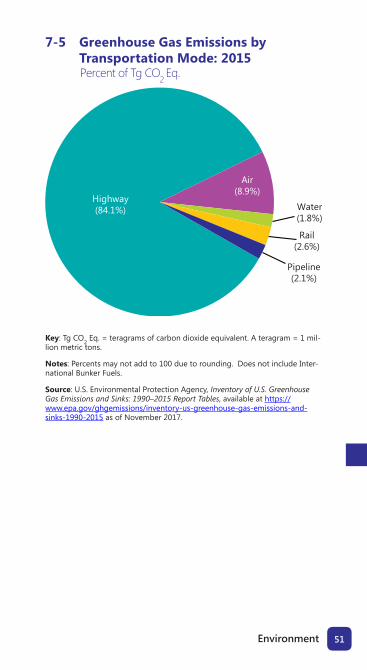
7-5 Greenhouse Gas Emissions by Transportation Mode: 2015 Percent of Tg CO2 Eq.
Highway(84.1%)
Air(8.9%)
Water(1.8%)
Rail(2.6%)
Pipeline(2.1%)
Key: Tg CO2 Eq. = teragrams of carbon dioxide equivalent. A teragram = 1 mil-lion metric tons.
Notes: Percents may not add to 100 due to rounding. Does not include Inter-national Bunker Fuels.
Source: U.S. Environmental Protection Agency, Inventory of U.S. Greenhouse Gas Emissions and Sinks: 1990–2015 Report Tables, available at https://www.epa.gov/ghgemissions/inventory-us-greenhouse-gas-emissions-and-sinks-1990-2015 as of November 2017.

52 Pocket Guide to Transportation
7-6 Highway Vehicle Air Pollutant Emissions: 2002–2016
0
0.5
1.0
1.5
2.0
Inde
x: 2
002
= 1
.0
Carbon monoxide
0
0.5
1.0
1.5
2.0
Inde
x: 2
002
= 1
.02002 2006 2010 2014
2002 2006 2010 2014
2002 2006 2010 2014 2002 2006 2010 2014
2002 2006 2010 2014
2002 2006 2010 2014
Nitrogen oxide
0
0.5
1.0
1.5
2.0
Volatile organic compounds
Inde
x: 2
002
= 1
.0
0
0.5
1.0
1.5
2.0
Particulate matter
Inde
x: 2
002
= 1
.0
PM-10
PM-2.5
0
0.5
1.0
1.5
2.0
Sulfur dioxide
Inde
x: 2
002
= 1
.0
0
0.5
1.0
1.5
2.0
Ammonia
Inde
x: 2
002
= 1
.0
Key: PM-10 = airborne particulates of less than 10 microns; PM-2.5 = airborne particulates of less than 2.5 microns.
Notes: Indices are calculated using data on highway vehicle emissions only. Par-ticulate matters include PM without condensibles.
Sources: As cited in U.S. Department of Transportation, Bureau of Transportation Statistics, National Transportation Statistics, tables 4-45 through 4-50, available at www.bts.gov as of November 2017.

53Environment
7-7 Fuel Economy of Light-Duty Vehicles: 1990–2015
1990 1995 2000 2005 2010 2015
Mile
s pe
r gal
lon
0
5
10
15
20
25
30
35
40
Light-duty on-road fleet
Light-truck EPA unadj., lab
Light-truck CAFE standard
Passenger car CAFE standard
Passenger car EPA unadj., lab
Key: CAFE = Corporate Average Fuel Economy; EPA = Environmental Protection
Agency.
Notes: New fleet data and CAFE standards are for vehicle model years. On-road fleet data include passenger cars and light trucks and are estimated using average miles traveled per gallon of fuel consumed for each calendar year.
Source: As cited in U.S. Department of Transportation, Bureau of Transportation Statistics, National Transportation Statistics, table 4-23, available at www.bts.gov as of November 2017.
54 Pocket Guide to Transportation
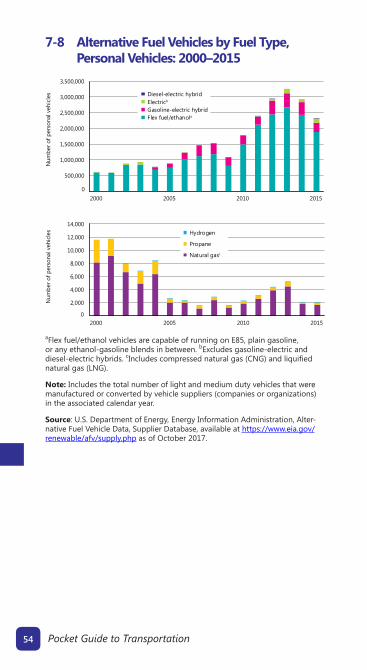
7-8 Alternative Fuel Vehicles by Fuel Type, Personal Vehicles: 2000–2015
Num
ber o
f per
sona
l veh
icle
s
0
500,000
1,000,000
1,500,000
2,000,000
2,500,000
3,000,000
3,500,000
2000 2005 2010 2015
Diesel-electric hybridElectricb
Gasoline-electric hybridFlex fuel/ethanola
Num
ber o
f per
sona
l veh
icle
s
0
2,000
4,000
6,000
8,000
10,000
12,000
14,000
2000 2005 2010 2015
Hydrogen
Propane
Natural gasc
aFlex fuel/ethanol vehicles are capable of running on E85, plain gasoline, or any ethanol-gasoline blends in between. bExcludes gasoline-electric and diesel-electric hybrids. cIncludes compressed natural gas (CNG) and liquified natural gas (LNG).
Note: Includes the total number of light and medium duty vehicles that were manufactured or converted by vehicle suppliers (companies or organizations) in the associated calendar year.
Source: U.S. Department of Energy, Energy Information Administration, Alter-native Fuel Vehicle Data, Supplier Database, available at https://www.eia.gov/renewable/afv/supply.php as of October 2017.
55Environment
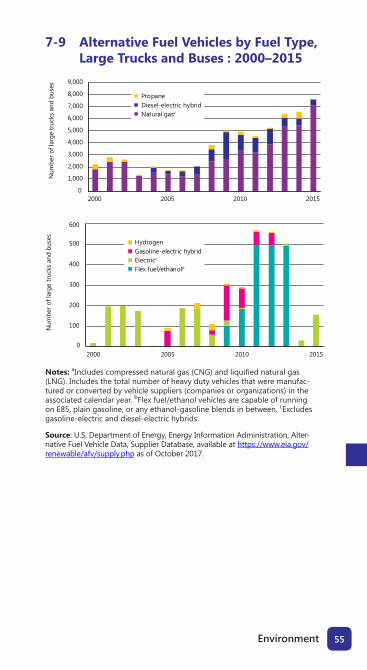
7-9 Alternative Fuel Vehicles by Fuel Type, Large Trucks and Buses : 2000–2015
Num
ber o
f lar
ge tr
ucks
and
bus
es
0
1,000
2,000
3,000
4,000
5,000
6,000
7,000
8,000
9,000
2000 2005 2010 2015
Natural gasa
Diesel-electric hybridPropane
Num
ber o
f lar
ge tr
ucks
and
bus
es
0
100
200
300
400
500
600
2000 2005 2010 2015
Hydrogen
Electricc
Gasoline-electric hybrid
Flex fuel/ethanolb
Notes: aIncludes compressed natural gas (CNG) and liquified natural gas (LNG). Includes the total number of heavy duty vehicles that were manufac-tured or converted by vehicle suppliers (companies or organizations) in the associated calendar year. bFlex fuel/ethanol vehicles are capable of running on E85, plain gasoline, or any ethanol-gasoline blends in between. cExcludes gasoline-electric and diesel-electric hybrids.
Source: U.S. Department of Energy, Energy Information Administration, Alter-native Fuel Vehicle Data, Supplier Database, available at https://www.eia.gov/renewable/afv/supply.php as of October 2017.

57Glossary
glossAry
Air carrier: Certificated provider of scheduled and nonscheduled services.
Alternative fueled vehicle: A vehicle designed to operate on an alternative fuel (e.g., compressed natural gas, propane, electricity). The vehicle can be either a dedicated vehicle designed to operate exclusively on alternative fuel or a non-dedicated vehicle designed to operate on alternative fuel and/or traditional fuel.
Chained dollars: A method of adjusting to real dollar amounts to account for both changes in price-levels and the composition of output over time. This is completed by using a chain-weighted type index, or average weights in successive time periods, to get a comparable time series of data.
Class I railroad: Railroads earning adjusted annual operating revenues for three consecutive years of $250,000,000 or more, based on 1991 dollars with an adjustment factor applied to subsequent years.
Commuter rail: Urban/suburban passenger train service for short-distance travel between a central city and adjacent suburbs run on tracks of a traditional railroad system. Does not include heavy or light rail transit service.
Demand response transit: A nonfixed-route, nonfixed-schedule form of transportation that operates in response to calls from passengers or their agents to the transit operator or dispatcher.
Directional route-miles: The sum of the mileage in each direction over which transit vehicles travel while in revenue service.
Enplanements: Total number of revenue passengers boarding aircraft.
For-hire: Refers to a vehicle operated on behalf of or by a company that provides services to external customers for a fee. It is distinguished from private transportation services, in which a firm transports its own freight and does not offer its transportation services to other shippers.
General aviation: Civil aviation operations other than those air carriers holding a Certificate of Public Convenience and Necessity. Types of aircraft used in general aviation range from corporate, multi–engine jets piloted by a professional crew to amateur-built, single-engine, piston-driven, acrobatic planes.
Gross domestic product: The total value of goods and services produced by labor and property located in the United States. As long as the labor and property are located in the United States, the suppliers may be either U.S. residents or residents of foreign countries.

58 Pocket Guide to Transportation
Heavy-rail transit: High-speed transit rail operated on rights-of-way that exclude all other vehicles and pedestrians.
Hybrid electric vehicle: Hybrid electric vehicles combine features of internal combustion engines and electric motors. Unlike 100% electric vehicles, hybrid vehicles do not need to be plugged into an external source of electricity to be recharged. Most hybrid vehicles operate on gasoline.
International Roughness Index (IRI): A scale for pavement roughness based on the simulated response of a generic motor vehicle to the roughness in a single wheel path of the road surface.
Lane-miles: One mile of one lane of road.
Light-duty vehicle: Includes passenger cars, light trucks, vans, pickup trucks, and sport/utility vehicles regardless of wheelbase.
Light-rail transit: Urban transit rail operated on a reserved right-of-way that may be crossed by roads used by motor vehicles and pedestrians.
Nominal dollars: A market value that does not take inflation into account and reflects prices and quantities that is current during the period being measured.
Nonself-propelled vessels: Includes dry cargo, tank barges, and railroad car floats that operate in U.S. ports and waterways.
Oceangoing vessels: Includes U.S. flag, privately-owned merchant fleet of oceangoing, self-propelled, cargo-carrying vessels of 1,000 gross tons or greater.
Particulates: Carbon particles formed by partial oxidation and reduction of hydrocarbon fuel. Also included are trace quantities of metal oxides and nitrides originating from engine wear, component degradation, and inorganic fuel additives.
Passenger-mile: One passenger transported one mile. For example, one vehicle traveling 3 miles carrying 5 passengers generates 15 passenger miles.
Personal communication: Involves contacting the source for data if not publicly available.
Plug-in hybrid electric vehicles: Plug-in hybrids use the electric battery as the primary energy source by relying on battery power for propulsion for a limited range (15-40 miles) before switching to internal combustion propulsion (thus reducing gasoline consumption).
Reliever airports: Airports designated by the Federal Aviation Administration to relieve congestion at commercial service airports and to provide improved general aviation access to the overall community.
59Glossary
Seasonally adjusted: Measures the real differences in data trends by adjusting for seasonal factors such as the change in the number of days, weekends, holidays, or other seasonal activity in a month such as vacation travel.
Self-propelled vessels: Includes dry cargo vessels, tankers, and offshore supply vessels, tugboats, pushboats, and passenger vessels, such as excursion/sightseeing boats, combination passenger and dry cargo vessels, and ferries.
Short ton: A unit of weight equal to 2,000 pounds.
Structurally deficient: Structural deficiencies are characterized by deteriorated conditions of significant bridge elements and reduced load-carrying capacity.
Real dollars: A method of adjusting nominal dollars to account for price level changes over time. It reflects purchasing power in a given period.
Tg CO2 Eq.: Teragrams of carbon dioxide equivalent, a metric measure used to compare the emissions from various greenhouse gases based on their global warming potential.
Ton-mile: A unit of measure equal to movement of one ton over one mile.
Transportation Services Index: BTS’ monthly measure indicating the relative change in the volume of services over time performed by the for-hire transportation sector. Change is shown relative to a base year, which is given a value of 100. The TSI covers the activities of for-hire freight carriers, for-hire passenger carriers, and a combination of the two. See www.bts.gov for a detailed explanation.
Transportation Services Index Combined: The combined Transportation Services Index (TSI) includes available data on freight traffic, as well as passenger travel, that have been weighted to yield a monthly measure of transportation services output.
Transportation Services Index Freight: The freight TSI measures the output of the for-hire freight transportation industry and consists of data from for-hire trucking, rail, inland waterways, pipelines and air freight.
Transportation Services Index Passenger: The passenger TSI includes local transit, intercity passenger rail, and passenger air transportation, that have been weighted to yield a monthly measure of transportation services output.
Unlinked passenger trip: The number of passengers who board public transportation vehicles. Passengers are counted each time they board vehicles no matter how many vehicles they use to travel from their origin to their destination.
Vehicle-mile: One vehicle traveling one mile.

Statistics published in this Pocket Guide to Transportation come from many different sources. Some statistics are based on samples and are subject to sampling variability. Statistics may also be subject to omissions and errors in reporting, recording, and processing.
Photos provided by BTS Stock Photos
For additional copies of this guide or information about the Bureau of Transportation Statistics and its products and services, contact:
Product OrdersInternet: http://www.bts.gov
Mail: Product Orders Bureau of Transportation Statistics ATTN: Product Orders 1200 New Jersey Avenue, SE, Room E34-457 Washington, DC 20590 Information ServicePhone: 202-366-DATAEmail: [email protected]
January 2018
Text USDOT BTSPG to 468311 to download the
Pocket Guide to Transportation app
or search:BTS Pocket Guide

Pocket Guide to Transportation
2018
Printed on paper containing recycled post consumer waste paper.
INFRASTRUCTURE
MOVING PEOPLE
MOVING GOODS
SAFETY
PERFORMANCE
ECONOMY
ENVIRONMENT
GLOSSARY
MAJOR TRENDS
Download the new and improved mobile app