Draft Comprehensive Transportation Plan - Moving Forward …
197
DRAFT July 2021 MOVING FORWARD 2050 Sonoma County’s Transportation Plan
Transcript of Draft Comprehensive Transportation Plan - Moving Forward …

DRAFT July 2021
MOVING FORWARD 2050 Sonoma County’s Transportation Plan


i
DRAFT COMPREHENSIVE TRANSPORTATION PLAN — JULY 2021 | Table of Contents
1. INTRODUCTION.. . . . . . . . . . . . . . . . . . . . . . . . . . . . . . . . . . . . . . . . . . . . . . . . . . . . . . . . . . . . . . . . . . . . . 1 Moving Forward — a Transportation Plan for the Future.. . . . . . . . . . . . . . . . . . . . . . . . . . . . . . . . . . . . . . 3
Equity in transportation — the Community Based Transportation Planning process.. . . . . . . . . . . . . . . . . . . . . . . . . . . . . . . . . . . . . . . . . . . . . . . . . . . . . . . . . . . . . . . . . . . . . . . . . . . . . . . . . . . . . . . . . . . . . . . . 3
Community Voices.. . . . . . . . . . . . . . . . . . . . . . . . . . . . . . . . . . . . . . . . . . . . . . . . . . . . . . . . . . . . . . . . . . . . . . . . . . . . . . . . . . . . . . . . . . . . . . 6
Identifying Plan Goals and Objectives.. . . . . . . . . . . . . . . . . . . . . . . . . . . . . . . . . . . . . . . . . . . . . . . . . . . . . . . . . . . . . . . . . 7
2. OUR COMMUNITY.. . . . . . . . . . . . . . . . . . . . . . . . . . . . . . . . . . . . . . . . . . . . . . . . . . . . . . . . . . . . 9 Sonoma County Today.. . . . . . . . . . . . . . . . . . . . . . . . . . . . . . . . . . . . . . . . . . . . . . . . . . . . . . . . . . . . . . . . . . . . . . . . . . . . . . . . . . . . . . . . 9
Existing Travel Characteristics.. . . . . . . . . . . . . . . . . . . . . . . . . . . . . . . . . . . . . . . . . . . . . . . . . . . . . . . . . . . . . . . . . . . . . . . . . . . 12
Sonoma County in the Future, Forecasts.. . . . . . . . . . . . . . . . . . . . . . . . . . . . . . . . . . . . . . . . . . . . . . . . . . . . . . . . . . . . 18

ii
Table of Contents | DRAFT COMPREHENSIVE TRANSPORTATION PLAN — JULY 2021
3. OUR TRANSPORTATION SYSTEM.. . . . . . . . . . . . 25 Roads and Highways.. . . . . . . . . . . . . . . . . . . . . . . . . . . . . . . . . . . . . . . . . . . . . . . . . . . . . . . . . . . . . . . . . . . . . . . . . . . . . . . . . . . . . . . . . 26
Bicycle and Pedestrian Infrastructure.. . . . . . . . . . . . . . . . . . . . . . . . . . . . . . . . . . . . . . . . . . . . . . . . . . . . . . . . . . . . . . . . 36
Public Transit Services.. . . . . . . . . . . . . . . . . . . . . . . . . . . . . . . . . . . . . . . . . . . . . . . . . . . . . . . . . . . . . . . . . . . . . . . . . . . . . . . . . . . . . . 42
Mode Shift Programs.. . . . . . . . . . . . . . . . . . . . . . . . . . . . . . . . . . . . . . . . . . . . . . . . . . . . . . . . . . . . . . . . . . . . . . . . . . . . . . . . . . . . . . . . 58
4. MOVING FORWARD, MEETING OUR GOALS.. . . . . . . . . . . . . . . . . . . . . . . . . . . . . . . . . . . . . . . . . . . . . . . . . . .65 Assessing Performance of the Project list.. . . . . . . . . . . . . . . . . . . . . . . . . . . . . . . . . . . . . . . . . . . . . . . . . . . . . . . . . 66
Performance Results — CTP 2050.. . . . . . . . . . . . . . . . . . . . . . . . . . . . . . . . . . . . . . . . . . . . . . . . . . . . . . . . . . . . . . . . . . . . . 69
Reaching Further — Testing a future “Vision”.. . . . . . . . . . . . . . . . . . . . . . . . . . . . . . . . . . . . . . . . . . . . . . . . . . . . . 71
APPENDICES A-1.1 Community Voices.. . . . . . . . . . . . . . . . . . . . . . . . . . . . . . . . . . . . . . . . . . . . . . . . . . . . . . . . . . . . . . . . . . . . . . . . . . . . . . . . . . . A-3
A-1.2 Community Based Organizations (CBOs).. . . . . . . . . . . . . . . . . . . . . . . . . . . . . . . . . . . . . . . . . . . . . . . . A-11
A-1.3 CBTP Projects Inventory Sonoma.. . . . . . . . . . . . . . . . . . . . . . . . . . . . . . . . . . . . . . . . . . . . . . . . . . . . . . . . . . A-34
A-2 Sonoma County Travel Model 2020 — CTP Modeling Technical Summary.. . . . A-45
A-3 Project List.. . . . . . . . . . . . . . . . . . . . . . . . . . . . . . . . . . . . . . . . . . . . . . . . . . . . . . . . . . . . . . . . . . . . . . . . . . . . . . . . . . . . . . . . . . . . . .A-50
A-4.1 Performance Results.. . . . . . . . . . . . . . . . . . . . . . . . . . . . . . . . . . . . . . . . . . . . . . . . . . . . . . . . . . . . . . . . . . . . . . . . . . . A-105
A-4.2 Zero Emissions by 2050.. . . . . . . . . . . . . . . . . . . . . . . . . . . . . . . . . . . . . . . . . . . . . . . . . . . . . . . . . . . . . . . . . . . . . A-108
A-4.3 Transportation Fund Sources.. . . . . . . . . . . . . . . . . . . . . . . . . . . . . . . . . . . . . . . . . . . . . . . . . . . . . . . . . . . . . . . A-114

iii
DRAFT COMPREHENSIVE TRANSPORTATION PLAN — JULY 2021 | Table of Contents
FIGURES
Figure.1:.Sonoma.County.Equity.Priority.Communities........................................................................................ 5
Figure.2-1..Average.Weekday.Travel.Flows.—.Sonoma.County.2017............................................................. 13
Figure.2-2..Inter-County.Trips,.Average.Weekday.—.Sonoma.County.2017..............................................14
Figure.2-3..Average.Weekday.Trip.Length.Distribution.—.Sonoma.County.2017...................................14
Figure.2-4..Average.Trip.Length.by.Time.Period.—.Sonoma.County.2017.................................................14
Figure.2-5..Commute.destination.for.Sonoma.County.residents....................................................................16
Figure.2-6..Home.Locations.of.Visitors.to.Sonoma.County,.Spring.2017....................................................18
Figure.2-7..Sonoma.County.Growth.Forecasts:.2019.—..
General.Plan.Buildout:.Population,.Housing.Units,.Employment.....................................................................19
Figure.2-8..Sonoma.County.Aging.Population.2010–2050.............................................................................. 20
Figure.2-9..Sonoma.County.Ethnicities.2020–2050............................................................................................ 20
Figure.2-10..Sonoma.County.Development.Pipeline.in.2021.—.Housing.Units.by.Unit.Type.............21
Figure.2-11..Sonoma.County.Daily.VMT.Existing.Conditions.—.Future.Baseline.(GPBO)...................22
Figure.2-12..Sonoma.County.Daily.VMT/capita.Existing.Conditions.—.GPBO.........................................23
Figure.3.1..Highway.37..........................................................................................................................................................29
Figure.3-2..Marin.Sonoma.Narrows.(MSN)............................................................................................................... 30
Figure.3-3..Sonoma-Marin.Area.Rail.Transit.District.(SMART).System.Map............................................ 44
Figure.3-4..Public.Transit.Routes.and.Hubs............................................................................................................. 49
Figure.3-5..Average.Weekday.Boardings.for.Petaluma.Transit,..
Santa.Rosa.CityBus,.Sonoma.County.Transit,.and.SMART.............................................................................. 50
Figure.3-6..Annual.Transit.Ridership.2013-2019..................................................................................................... 50
Figure.3-7..Queue.Jump.Lane..........................................................................................................................................56
Figure.4-1..Achieving.our.goals........................................................................................................................................72

iv
Table of Contents | DRAFT COMPREHENSIVE TRANSPORTATION PLAN — JULY 2021
TABLES
Table.2-1..Trip.Purpose.Chart............................................................................................................................................. 12
Table.2-2..Travel.to.Work.Mode.Share.in.Sonoma.County.................................................................................. 15
Table.2-3..Total.Travel.Mode.Share.in.Sonoma.County......................................................................................... 15
Table.2-4..Fee.paid.Registered.Vehicles.in.Sonoma.County.............................................................................. 15
Table.2-5..2015.Sonoma.County.School.Trips.—.Mode.of.Travel..................................................................... 17
Table.2-6..Metro.Areas.with.Visitors.to.Sonoma.County..................................................................................... 17
Table.2-7..Sonoma.County.Mode.Shares.by.Trip.Purpose.—.2050................................................................23
Table.3-1..Sonoma.County.Centerline.Mileage.of.Public.Roads,.2018..........................................................27
Table.3-2..Weekday.all-day.origin.of.trips.to.largest.trip.generators...........................................................28
Table.3-3..Total.Miles.of.Planned.Bicycle.and.Pedestrian.Facilities.by.Class...........................................40
Table.3-4..Transit.Operations............................................................................................................................................42
Table.3-5..CTP.Project.Summary....................................................................................................................................62
Table.3-6..CTP.Project.Summary.Pie.Chart...............................................................................................................63

1
DRAFT COMPREHENSIVE TRANSPORTATION PLAN — JULY 2021 | Introduction
1.
INTRODUCTION
SONOMA COUNTY TRANSPORTATION AUTHORITY
The Sonoma County Transportation Authority
(SCTA) serves as the coordinating and
advocacy agency for transportation funding
for Sonoma County. Proposition 111, approved
in California in 1990, resulted in changes to
the way transportation projects are planned
and funded and authorized the creation of
Congestion Management Agencies.
2
Introduction | DRAFT COMPREHENSIVE TRANSPORTATION PLAN — JULY 2021
In November 1990, the SCTA was formed
under the Local Transportation Authority and
Improvement Act (Public Utilities Code Section
180000) and designated as the Congestion
Management Agency (CMA) for Sonoma County.
In 1997, the SCTA relinquished its position as the
CMA under new state legislation that made the
congestion management planning portion of this
function optional but still carries out the general
functions of a CMA.
The SCTA Mission Statement
The Sonoma County Transportation
Authority’s mission, as a collaborative
agency of the cities and County of Sonoma,
is to work together to maintain and improve
our transportation network. We do so by
prioritizing, coordinating, and maximizing
the funding available to us and by providing
comprehensive, countywide planning. Our
deliberations and decisions recognize the
diverse needs within our county and the
environmental and economic aspects of
transportation planning.
The SCTA is governed by a twelve-member
Board of Directors. Nine of these members are
chosen from the Councils of the nine incor-
porated cities or towns. The remaining three
members are chosen from the County Board of
Supervisors. Offcers are elected annually. The
SCTA holds monthly public meetings of the
Board of Directors.
The SCTA is the countywide planning and
programming agency for transportation related
issues. The SCTA plays a leading role in trans-
portation by securing funds, providing project
oversight, and initiating long term planning.
The SCTA has legal and administrative require-
ments to fulfll in the capacity of a countywide
SCTA/RCPA BOARD OF DIRECTORS
Cloverdale Melanie Bagby — 2019, 2020, 2021
Cotati Mark Landman — 2019 Chair, 2020, 2021
Healdsburg Ariel Kelley — 2021 Joe Naujokas — 2019, 2020
Petaluma D’Lynda Fischer — 2021 Kathy Miller — 2019, 2020
Rohnert Park Gerard Guidice — 2021 Jake Mackenzie — 2020 Joseph Callinan — 2019
Santa Rosa Chris Rogers — 2019, 2020, V. Chair 2021
Sebastopol Sarah Gurney — 2019, 2020, 2021
Sonoma Logan Harvey — 2019, Chair 2020, 2021
Sonoma County Susan Gorin — 2019, Chair 2020 & 2021 Lynda Hopkins — 2021 Shirlee Zane — 2019, 2020 David Rabbitt — 2019, 2020, 2021
Windsor Esther Lemus — 2021 Sam Salmon — 2019, 2020
transportation agency — some of these
requirements are derived from regional agen-
cies such as the Metropolitan Transportation
Commission (MTC)/Association of Bay Area
Governments (ABAG) and the Bay Area Air
Quality Management District (BAAQMD), while
others, come directly from the State, or federal
government.

3
DRAFT COMPREHENSIVE TRANSPORTATION PLAN — JULY 2021 | Introduction
A History of Long-Range Planning
Over twenty years ago, residents and trans-
portation offcials convened in a series of town
hall meetings to imagine how Sonoma County’s
transportation system should look in 2020.
Among their fndings: the transit system needed
to expand; the highways required expansion
and more effcient design; and a commuter rail
system was needed. Local roads were charged
to be safe and free of potholes; and to accom-
modate bicycle and pedestrian facilities. Sonoma
County residents understood in 2000 the need
for a convenient, cost-effective, environmentally
friendly, and functioning transportation system.
This sentiment has not changed. In addition,
the community envisioned a coordinated public
transit system with frequent service on core
routes and a rail-ferry connection for travelers to
reach areas throughout the North Bay and the
San Francisco Bay Area.
Sonoma County’s transportation system today
includes a diverse mixture of highways, local
streets and roads, bus service in and between
every community, a commuter rail system,
airports, and bicycle and pedestrian multiuse
pathways. Despite these accomplishments there
remain many infrastructure needs.
MOVING FORWARD — A TRANSPORTATION PLAN FOR THE FUTURE
Moving Forward 2050 — the Comprehensive
Transportation Plan (CTP) tells the story of
Sonoma County’s transportation system. The
plan examines the current state of transporta-
tion in the county and looks at future needs and
goals and provides information on how these
needs and goals can be met. The CTP is updated
frequently enough to ensure that the plan is still
relevant, useful, and represents the current trans-
portation needs and goals of SCTA and Sonoma
County jurisdictions. The previous CTP was
completed in 2016.
The importance of maintaining an updated plan-
ning document is two-fold. First, MTC requires
local Transportation Authorities such as the
SCTA to establish transportation plans that can
feed into the larger Regional Transportation
Plan (RTP). The RTP is a federally required, long
range planning document that is now called Plan
Bay Area. Second, the SCTA is responsible for
programming, or allocating, numerous state and
federal funding sources to transportation proj-
ects. In order to meet these requirements, the
SCTA needs a policy and planning document to
help guide the programming process. If the SCTA
does not meet these two requirements, it is at
risk of losing critical transportation dollars.
EQUITY IN TRANSPORTATION — THE COMMUNITY BASED TRANSPORTATION PLANNING PROCESS
SCTA is committed to equitable transportation
planning. To avert underinvestment in disadvan-
taged communities, SCTA identifed targeted
areas for prioritizing funding to provide safe,
accessible, and affordable mobility. This plan
serves also as an update to the Community
Based Transportation Plans.
Using census data, it is possible to identify
concentrations of people with demographic
traits such as income, race, or level of education
completed, that help determine approximately
where people who have been systematically
disadvantaged may live and where to focus
needed resources.

4
Introduction | DRAFT COMPREHENSIVE TRANSPORTATION PLAN — JULY 2021
Between 2006 and 2009 SCTA studied four Equity
Priority Communities (formerly called Communities
of Concern) that had been identifed by MTC1.
They include Roseland, in Santa Rosa, the Springs
area in Sonoma Valley near Sonoma, the River
Area, along the Russian River and Healdsburg
along Highway 101. Each of these areas is unique,
with differing characteristics and challenges.
SCTA staff went to these areas to meet people in
libraries and community centers, on street corners
and in front of grocery stores to fnd out how
they used the transportation system and to talk
to people about what still needed to be done.
The resulting documents are the SCTA
Community Based Transportation Plans (CBTP).2
Many funding programs prioritize communities
of concern and these neighborhoods have bene-
ftted from their COC designation. Four plans
were completed in Sonoma County:
• Roseland (southwestern Santa Rosa), 20073
• Lower Russian River (Guerneville and Monte
Rio), 20094
• Healdsburg, 20095
• The Springs (Central Sonoma Valley), 20106
Each CBTP brought local residents, community
organizations and transportation agencies closer
together to identify low-income neighborhoods’
most important transportation challenges and
develop strategies to overcome them. Each plan
contains the following elements:
• Demographic analysis of the area
• List of community-prioritized transportation
gaps and barriers
• Strategies or solutions to address these
gaps
• Identifcation of possible funding sources
• List of stakeholders to implement the plan
• Documented results of community outreach
strategies
There are programs developed by the State
and others which use different terminology to
identify communities who have been histori-
cally underserved. Understanding where people
in need are clustered, geographically, makes it
easier to concentrate resources and address
infrastructure defciencies, such as poor access
to transit, dangerous or non-existent sidewalks.
However, people in need may not be clustered
together geographically. For example, affordable
housing is dispersed throughout Sonoma County
and disadvantaged households may be located
next to affuent areas making them diffcult to
identify geographically.
This has led us to a more fexible approach that
includes:
1) Fine-tune the technical analysis to get a
better understanding of geographic spaces
that serve disadvantaged communities.
2) Develop an approach to address the whole
population of disadvantaged people
through policies and programs. Target
outreach to those communities.
1 For reference these geographic areas were designated as Communities of Concern by MTC. The term Equity Priority Communities is now used. 2 SCTA Community-Based Transportation Plan, https://scta.ca.gov/library-archive/ 3 Roseland CBTP: https://scta.ca.gov/reports/Roseland_Community_Based_Trasnportation_Plan_-_Roseland_Report_Summary.pdf
Lower Russian River CBTP: https://scta.ca.gov/reports/Lower_Russian_River_Community_Based_Transportation_Plan.pdf 5 Healdsburg CBTP: https://scta.ca.gov/reports/Healdsburg_Community_Based_Transportation_Plan.pdf 6 The Springs CBTP: https://scta.ca.gov/reports/The_Springs_Community_Based_Transportation_Plan_06-03-2010.pdf
4

DRAFT COMPREHENSIVE TRANSPORTATION PLAN — JULY 2021 | Introduction
FIGURE 1: SONOMA COUNTY EQUITY PRIORITY COMMUNITIES7
CLOVERDALE
HEALDSBURG
WINDSOR
SANTA ROSA
Legend
Equity Priority Communities identified using MTC Plan Bay Area criteria. Publication date - 6/18/2020 by the Metropolitan Transportation Commission.
2020 Caltrans Active Transportation Program Disadvantaged Communities: The ATP program defines disadvantaged communitiesusing income, tribal land, and proximity to disadvantaged schools.
SEBASTOPOL
ROHNERT PARK
COTATI
PETALUMA
SONOMA
Source: SCTA
https://scta.ca.gov/planning/comprehensive-transportation-plan/sonoma-disadvantaged-communities/ 7
5

6
Introduction | DRAFT COMPREHENSIVE TRANSPORTATION PLAN — JULY 2021
In recent years MTC has adjusted their analysis to
address more dispersed populations that aligns
better with local understanding. SCTA has also
made it a priority to reach out to people who
have been systematically disadvantaged.
The MTC Plan Bay Area 2050 project provides
a more detailed account of the methodology
currently used by MTC to identify Equity Priority
Communities.8
COMMUNITY VOICES
While interaction with the public is robust at
regular SCTA meetings and events, the Outreach
Plan developed for Moving Forward 2050
includes a variety of strategies to improve and
expand outreach. In addition to community
meetings at SCTA, and in libraries throughout
the County, SCTA sought the input and ideas
of people not inclined or able to go to a public
meeting. Community Based Organizations
were engaged to facilitate conversations about
transportation needs within the groups they
represent, who are systemically disadvantaged.
These meetings were conducted at the CBO
sites, as part of regular meetings, and in Spanish
when appropriate.
These sessions highlighted the following:
• These communities were over three times as
likely to say that costs to use the transporta-
tion system were too high.
• They were more likely to say that the system
needs better maintenance.
• They were more likely to show uncertainty
about other options to get around.
• They were less likely to say that harming the
environment was a top issue with the trans-
portation system.
There were also differences in survey responses
by geography:
• Southwest Santa Rosa and East Petaluma
respondents prioritized maintaining roads to
a much higher degree than other areas.
• Sebastopol and West County respondents
prioritized improving roads to a much higher
degree than other areas.
• Sonoma Valley respondents prioritized
expanding bus service to a much higher
degree than other areas.
• West Petaluma respondents prioritized
expanding bicycle facilities to a much higher
degree than other areas.
As the pandemic changed the way we work and
interact with each other the outreach process
did a quick pivot. Online connections that had
already been part of the strategy, now became
integral. When all meetings became accessible
from home SCTA saw a sharp increase in partic-
ipation. Since it is impossible to identify the
socio-economic status of online participants
SCTA will continue partnering with CBOs and
other groups as needed.
For more details see Appendix A-1.1 Community
Voices and Appendix A-1.2 Identifed
Transportation Needs.
MTC Plan Bay Area 2050 Equity Priority Communities, https://bayareametro.github.io/Spatial-Analysis-Mapping-Projects/ Project-Documentation/Communities-of-Concern/ 8

7
DRAFT COMPREHENSIVE TRANSPORTATION PLAN — JULY 2021 | Introduction
IDENTIFYING PLAN GOALS AND OBJECTIVES
The CTP builds on the efforts of local elected offcials and staff from the cities, town, and county government in Sonoma County. This update has been developed with the under-standing that existing transportation funding is inadequate, that there is increasing pressure on the existing transportation system, and that transportation impacts on the environment, public health, and safety are growing.
Overall, the CTP is meant to refne the vision, goals, and objectives for improving mobility on Sonoma County’s streets, highways, transit system, and bicycle/pedestrian facilities, as well as to reduce transportation related impacts. To that end, it provides policy guidance and identifes transportation improvements for development over the next 25 years. SCTA staff has worked with our partners to determine if our efforts are successful in helping us reach our goals, by including an enhanced performance evaluation outlined in Chapter 4. Measuring prog-ress in achieving goals will help identify actions that are helping improve the Sonoma County transportation system and improve mobility for county residents.
Moving Forward 2050 Goals
Vision 2050
Connecting people and places as we transition
our transportation network to zero-emissions by
2050.
Our guiding principles are to improve safety,
equity, and quality of life.
Our transportation system should be:
Goal 1 — Connected and Reliable
Deliver a seamless network that allows people
to use a variety of transportation types easily,
affordably and dependably.
• Provide a robust and well-coordinated local
and regional transit system.
• Create a high quality bike and pedestrian
network.
• Optimize roadway operations to allow eff-
cient movement of people.
• Ensure effective transportation options for
youth and older adults.
• Guide innovation to the transportation
system.
Goal 2 — Safe and Well-Maintained
Provide safe and well maintained transportation
infrastructure.
• Employ Vision Zero policies and strategies.
• Use maintenance dollars effciently and
effectively.
• Design infrastructure for all ages and
abilities.
• Deploy innovative technologies and best
practices.
Goal 3 — Community Oriented and Place-Based
Implement place-based transportation projects,
tailored to urban, suburban, and rural communi-
ties that will improve local mobility.
• Target high-traffc areas with right sized
solutions to improve access.

8
Introduction | DRAFT COMPREHENSIVE TRANSPORTATION PLAN — JULY 2021
• Focus on strategies that support high
density, walkable and transit oriented
communities.
• Prioritize resilient infrastructure in areas
at risk for fooding, fre and other environ-
mental challenges.
• Employ Complete Street policies and strate-
gies that support a diversity of uses.
Goal 4 — Zero-Emissions
Provide zero-emission transportation opportuni-
ties that meet diverse community needs, improve
health and enhance quality of life.
• Prioritize transportation funding for
zero-emissions strategies.
• Emphasize strategies that incentivize transit
and shared mobility.
• Take bold steps to achieve a zero-emission
transportation network.
• Support climate-friendly land use prac-
tices through ongoing coordination and
alignment.
• Implement the Shift Sonoma County Low
Carbon Transportation Plan.
Measuring Success
Decisions and actions that are made today will
impact future generations. The future is never
certain, but SCTA is able to leverage tools and
data to provide insights on how our county may
look in the next 5, 10, 20, or even 25 years. Land
use and transportation models use historical
growth and travel data to predict future growth,
travel demand, and traffc.
SCTA can use these tools to anticipate the future,
and to gain insights into how SCTA can focus
its efforts to make progress on plan goals and
objectives. These tools are updated regularly and
supplemented by emerging data and information
on current conditions and trends. This ensures
that data and analysis continue to be useful and
relevant for supporting SCTA’s planning and
project delivery activities. In Chapter 4 there are
more details on the performance of this CTP.

9
DRAFT COMPREHENSIVE TRANSPORTATION PLAN — JULY 2021 | Our Community
2.
OUR COMMUNITY
SONOMA COUNTY TODAY
Sonoma County spans an area from the
San Pablo Bay to the Pacifc Ocean, with
mountain ranges along the northern and
the eastern areas. The Coastal Range is
to the west parallels the Sonoma and
Mayacama Mountains on the eastern side
of the County.

10
Our Community | DRAFT COMPREHENSIVE TRANSPORTATION PLAN — JULY 2021
Between the mountains is the Santa Rosa Plain that extends west of Santa Rosa, north of Cotati,
south of Windsor and is bordered by the Laguna de Santa Rosa and Sebastopol on its western side. It
is 20 miles long and six miles wide and is home to half of the County’s population. It is also home to a
number of protected species of wildlife.
Population settlement patterns and the transportation system were developed around these
geographic constraints. There are nine incorporated cities and town in the county of which seven are
located along the main north-south Highway 101/SMART corridor. Populated areas outside this corridor
are in the Cities of Sebastopol and Sonoma, the Russian River area, the Sonoma Valley, and along the
Pacifc Coast. There are also other, smaller unincorporated communities throughout the county.
Being the largest county geographically in the San Francisco Bay Area, Sonoma County has a diverse
cross section of landscapes and development types and encompasses over one million acres of
land. Approximately 14 percent of the land is devoted to residential uses, three percent are used for
11
DRAFT COMPREHENSIVE TRANSPORTATION PLAN — JULY 2021 | Our Community
commercial, industrial, and similar uses, with the
remainder of over 80% of the landmass consisting
mostly of agricultural land and open space.
There are half a million people living in Sonoma
County. More than half of the population reside
in cities along the Highway 101 corridor. Most of
the government facilities, major health services,
and shopping centers are located in the incorpo-
rated jurisdictions along the Highway 101 corridor.
Development in the unincorporated areas is far
more dispersed and is spread throughout a very
large geographic area.
The multiple years of destructive wildfres
coupled with the unprecedented impacts of
the pandemic show signs of disrupting trends
including population growth.
Economy and Cost of Living
Sonoma County is known globally for its
wines, and the County’s economy refects that.
Agriculture and wine production have domi-
nated the economy, along with other agricultural
products for many years. In addition to agricul-
ture there are local jobs in manufacturing, retail,
tourism and healthcare. Sonoma County also has
a high concentration of small businesses with just
over half of the established business employing
four of fewer people. Expand the category to
nine or fewer employees and nearly three-quar-
ters of all businesses in Sonoma County are
regarded as small businesses.
In 2018, 10% of Sonoma County residents
lived below the poverty line according to the
Economic Development Board. While poverty is
evident in the cities, there are many people living
in poverty in the rural and semi-rural unincorpo-
rated areas, such as along the Russian River or in
the Springs area of the Sonoma Valley.
Housing
Growth in Sonoma County has been historically
concentrated in the Highway 101 corridor. Rapid
growth in the 1970s and 1980s led to devel-
opment in unincorporated area outside of the
urban service areas, which continue today not
be well served by transit or have an adequate
road network. In an effort to limit sprawl, and to
protect the rural character of the county, voters
in each jurisdiction have approved setting Urban
Growth Boundaries (UGBs). to promote city infll
growth. Local General Plans have also prioritized
city centered and focused growth.
Fires and other natural disasters
In October 2017, the Tubbs and Nuns fres ignited
and were, at the time, the most destructive wild-
fres on record in the State of California, killing
22 people and destroying over 5,600 structures,
many of them homes in urban neighborhoods in
Santa Rosa and surrounding built up areas. This
housing loss was devastating considering that
the county was already struggling to meet the
demand for housing. There were more fres in the
County in the years since that have destroyed
homes and caused unhealthy smoke conditions.
In order to prevent fres, PG&E institutes Public
Safety Power Shutoffs (PSPS) that leave homes
and businesses in the dark and without elec-
tricity, sometimes for days.
In addition to the fres, Sonoma County has also
been affected by the COVID pandemic. As of
June 18, 2001 Sonoma County lost 316 people to
the coronavirus. Many businesses have closed or
will close before the pandemic is over and local
governments are challenged as to how best plan
for a post-pandemic world.

12
Our Community | DRAFT COMPREHENSIVE TRANSPORTATION PLAN — JULY 2021
TABLE 2-1. TRIP PURPOSE CHART
Trip Purpose Average Travel Time: Minutes
Average Trip Length: Miles
Average Vehicle Occupancy: Persons/ Vehicle
Home — Work (15.1%) 22.13 13.83 1.19
Home — School (10.9%) 10.82 5.67 2.68*
Home — Other (42%) 13.29 7.13 1.74
Non-Home Based (32%)
11.03 5.87 1.47
*Includes auto and school bus passengers. Estimates for 2015 extracted from the Sonoma County Travel Model
In 2020, SCTA released the Sonoma County Travel Behavior Study https://scta.ca.gov/wp-content/ uploads/2020/02/Sonoma_TBS_2-7-2020_web.pdf, a comprehensive analysis and presentation of travel in Sonoma County. The study utilized trafc counts and mobile device data to quantify vehicle trips associated with residents, employees, and visitors, where trips start and end, the purpose and length of those trips, the times of travel, and the demographics of the travelers. The study summarizes seasonal and post-wildfre event travel conditions in addition to analyzing weekday and weekend travel. This study was conducted using 2017 data primarily and represents pre-pandemic conditions.
EXISTING TRAVEL CHARACTERISTICS
The U.S. Census Bureau and local and regional
transportation planning agencies collect survey
data and run travel demand models in order to
determine where people are going, how they
get there, and how they travel. This information
is used to assess and prioritize future transpor-
tation improvements in order to maximize the
utility of the transportation system.
In the Sonoma County Travel Model, travel is often
summarized by trip which represents an individ-
ual’s travel from one location to another. Trips are
normally categorized by trip purpose, or reason
the trip was taken. Trips are frst calculated as
person-trips (i.e. two people driving together to
work would be one vehicle trip, but counted as two
person-trips) and are then converted to vehicle trips
using vehicle occupancy rates. Vehicle occupan-
cies are important, because they demonstrate how
many vehicles are needed to move a given number
of people from location to location. Segmenting
trips by trip purpose and vehicle/person trip helps
provide information on what types of transportation
improvements could provide the largest benefts
to Sonoma County travelers. See Appendix XX for
information on the Sonoma County Travel Model.
Where Are People Going?
Sonoma County travel is largely self-contained,
with 89% percent of trips starting and ending
in the county. Roughly 5% of daily trips enter or
exit the county and 1.5% of trips pass through
the county entirely. The majority of pass-through
trips occur in the Highway 37 corridor in the
southeastern corner of the county with trips
travelling to and from Marin, Napa, and Solano
counties making up most of this pass-through
travel. External travel largely stays in the region,
with 34% of intercountry trips going to or
coming from Marin County. Other signifcant out
of county travel fows include travel to and from
Napa, San Francisco, Solano, and Mendocino
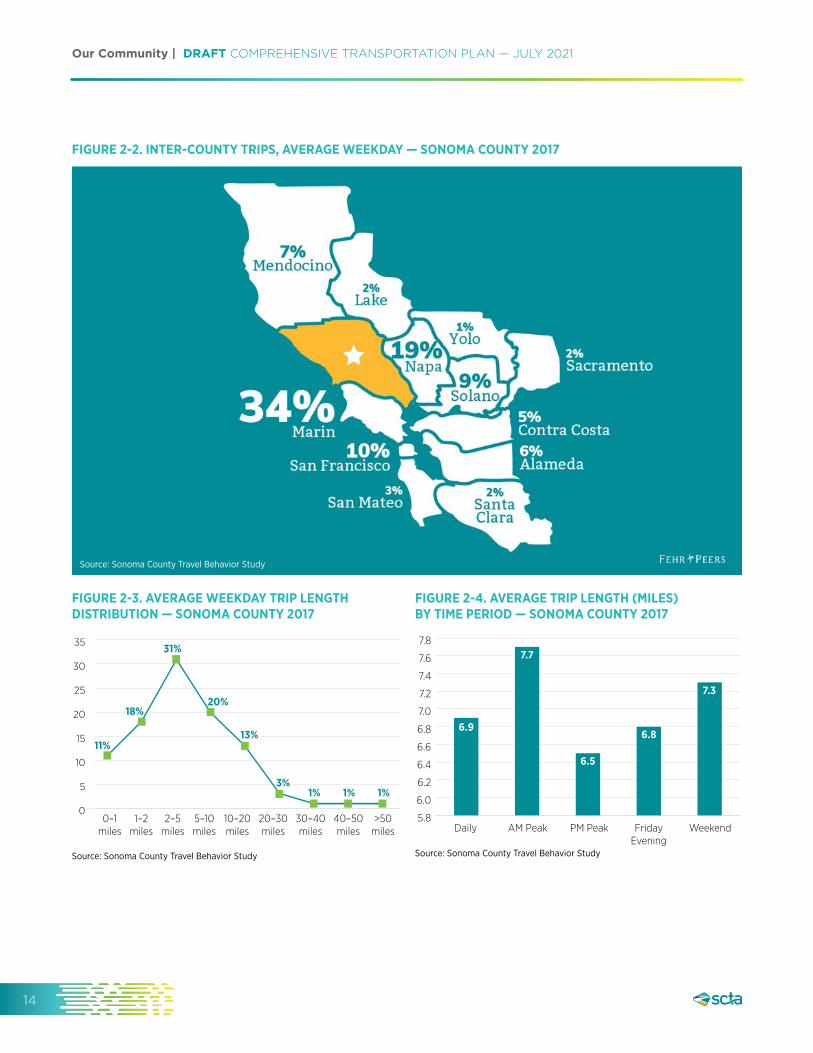
counties (See Figure 2-2).
Roughly 44% of total Sonoma County vehicle
trips start and end within the City of Santa
Rosa on an average weekday with other incor-
porated areas such as Petaluma, Rohnert Park,
and Windsor generating or attracting signifcant
portions of total daily travel. Major commercial
and employment concentrations such as the
Santa Rosa Market Place commercial district,
Downtown Petaluma, commercial areas off of

13
DRAFT COMPREHENSIVE TRANSPORTATION PLAN — JULY 2021 | Our Community
FIGURE 2-1. AVERAGE WEEKDAY TRAVEL FLOWS — SONOMA COUNTY 2017
Source: Sonoma County Travel Behavior Study
Rohnert Park Expressway in the City of Rohnert
Park, and Santa Rosa Junior College are focal
points for travel in the county and attract or
generate signifcant numbers of trips each day.1
Most trips in the county are local and are rela-
tively short. Roughly 29% of average weekday
Sonoma County vehicle trips are less than 2 miles
in length, 60% are less than 5 miles in length,
and only 6 percent are more than 20 miles in
length (see Figure 2-3). When averaged across
all trip types and lengths, the average weekday
trip length in Sonoma County is 6.9 miles long.
Trips are generally longer on the weekend and in
the morning commute period with average trip
length increasing to 7.3 miles on the weekend,
and 7.7 miles in the morning commute period as
shown in Figure 2-4.2
Trip lengths also vary based on trip purpose and
travel mode. Work trips are longer (13.83 miles)
on average with school and shopping and other
trips generally shorter (5-7 miles on average).
Visitor based trips are generally long with trip
lengths varying between 20-30 miles on average.
Auto based trips are generally the longest (8
miles per trip), with Transit (5 miles per trip), bike
trips (5 miles per trip), and walk trips (1-2 miles)
generally being shorter. 3
1 Sonoma County Travel Behavior Study 2 Sonoma County Travel Behavior Study 3 Sonoma County Travel Model
14
Our Community | DRAFT COMPREHENSIVE TRANSPORTATION PLAN — JULY 2021
FIGURE 2-3. AVERAGE WEEKDAY TRIP LENGTH DISTRIBUTION — SONOMA COUNTY 2017
35
0–1 1–2 2–5 5–10 10–20 20–30 30–40 40–50 >50 miles miles miles miles miles miles miles miles miles
Source: Sonoma County Travel Behavior Study
0
5
10
15
20
25
30
6.9
7.7
11%
18%
31%
20%
13%
3% 1% 1% 1%
6.8
FIGURE 2-4. AVERAGE TRIP LENGTH (MILES) BY TIME PERIOD — SONOMA COUNTY 2017
7.8
Daily AM Peak PM Peak Friday Weekend Evening
Source: Sonoma County Travel Behavior Study
5.8
6.0
6.2
6.4
6.6
6.8
7.0
7.2
7.4
7.6
6.9
7.7
6.5
6.8
7.3
FIGURE 2-2. INTER-COUNTY TRIPS, AVERAGE WEEKDAY — SONOMA COUNTY 2017
Source: Sonoma County Travel Behavior Study

15
DRAFT COMPREHENSIVE TRANSPORTATION PLAN — JULY 2021 | Our Community
How Are People Getting Around?
Travel in Sonoma County, like the rest of the
Bay Area and United States, is heavily oriented
towards private passenger vehicles. In 2020 there
were 361,821 licensed drivers and 541,806 regis-
tered vehicles in the county according to DMV
records. Commute trips are concentrated during
peak, or rush hour, travel periods and are major
contributors to traffc congestion. In 2018 nearly
seventy-seven percent of workers drove alone
during their commute; 9.7 percent carpooled;
2.1 percent used public transit; 3.9 percent bicy-
cled or walked; and 7.2 percent worked at home.
These mode shares have been fairly stable since
1980, although the transit and carpool mode
shares have dropped slightly, and more people
are working from home.
TABLE 2-2. TRAVEL TO WORK MODE SHARE IN SONOMA COUNTY
Travel to work 1980 1990 2000 2010 2018
Drive Alone 69.4 74.6 74.7 74.4 77.1
Carpool 16.3 13 12.6 11.3 9.7
Transit 3.2 2.3 2.4 2.0 2.1
Bike/Walk/Other 7.7 5.2 4.9 4.9 4.1
Worked at home 3.4 4.9 5.4 7.1 7.2
Source: US Census Bureau
Non-work travel in Sonoma County, like work travel,
is auto oriented, but travelers are more likely to
travel together, or share rides for school, recreation,
shopping, and other trips. Almost half of trips in
the county are made with two or more people
(47% of all daily trips), roughly 8% of all trips are
walk or bike trips, 44% are drive alone automobile
trips, and under 1% are made using transit. A higher
proportion of school trips are shared ride or walk/
bike trips (70% shared ride, 14% walk/bike)4.
TABLE 2-3. TOTAL TRAVEL MODE SHARE IN SONOMA COUNTY
Total travel 2015
Drive Alone 44.31
Shared Ride 47.13
Transit 0.39
Walk/Bike 8.15
Source: Sonoma County Travel Model
Motor vehicle ownership in Sonoma County
Motor vehicle ownership in the County tends to
be somewhat higher than the Bay Area average.
There are also fewer households without access
to a private vehicle in Sonoma County compared to
the State of California (4.9 percent vs. 7.2 percent);
and more households with two or more vehicles
(65 percent vs. 62 percent).5 The higher auto
ownership rates refect the County’s dependency
on personal vehicles for transportation as a result
of dispersed land uses, an extensive road network,
and the rural nature of much of the county.
TABLE 2-4. FEE PAID REGISTERED VEHICLES IN SONOMA COUNTY
Year Registered Population Vehicles
Vehicles per person
1950 51,582 103,405 .5
1980 240,204 299,681 .8
2007 428,000 484,470 .9
2014 456,249 500,292 .9
2020 537,434 496,947 1.1
Source: Department of Motor Vehicles, US Census
4 Sonoma County Travel Model 5 U.S. Census Bureau: 2018 American Community Survey 5-Year Estimates.

16
Our Community | DRAFT COMPREHENSIVE TRANSPORTATION PLAN — JULY 2021
FIGURE 2-5. COMMUTE DESTINATION FOR SONOMA COUNTY RESIDENTS.
Source: Sonoma County Travel Behavior Study
Roughly 21 percent of all Sonoma County
weekday trips are for commute purposes6.
Although modest in number, commute trips have
a disproportionate impact on the transporta-
tion system’s performance for several reasons.
Commute trips are usually longer than other trips.
They tend to be concentrated in a few hours of
the day (7-9 AM and 4-6 PM); and vehicle occu-
pancies are generally much lower for trips to work.
There were approximately 320,000 vehicle
trips in Sonoma County in the AM Peak period,
accounting for roughly 19 percent of total daily
vehicle trips. The PM peak is slightly larger than
the AM peak accounting for roughly 29 percent of
daily vehicle trips, or 484,000 daily vehicle trips.
Trips to School
Though the number of homes with school aged
children has declined, the morning traffc caused
by the school commute is signifcant. Historically,
children walked or biked to school, or rode a
school bus. This is no longer true, with a large
proportion of students being driven to and from
school. Though there are movements to make
walking and biking to school more attractive to
children and parents, including the Safe Routes
to School program overseen by SCTA and run by
the Sonoma County Bicycle Coalition.
Sonoma County Travel Behavior Study. 6
17
DRAFT COMPREHENSIVE TRANSPORTATION PLAN — JULY 2021 | Our Community
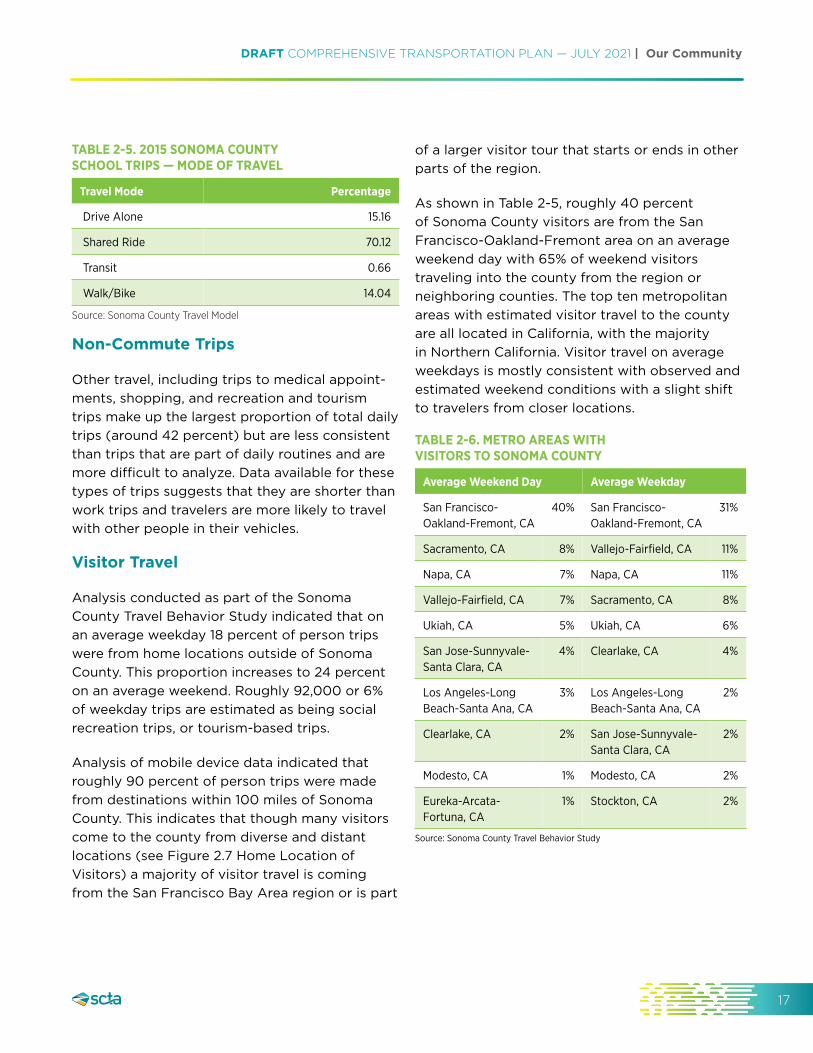
TABLE 2-5. 2015 SONOMA COUNTY SCHOOL TRIPS — MODE OF TRAVEL
Travel Mode Percentage
Drive Alone 15.16
Shared Ride 70.12
Transit 0.66
Walk/Bike 14.04
Source: Sonoma County Travel Model
Non-Commute Trips
Other travel, including trips to medical appoint-
ments, shopping, and recreation and tourism
trips make up the largest proportion of total daily
trips (around 42 percent) but are less consistent
than trips that are part of daily routines and are
more diffcult to analyze. Data available for these
types of trips suggests that they are shorter than
work trips and travelers are more likely to travel
with other people in their vehicles.
Visitor Travel
Analysis conducted as part of the Sonoma
County Travel Behavior Study indicated that on
an average weekday 18 percent of person trips
were from home locations outside of Sonoma
County. This proportion increases to 24 percent
on an average weekend. Roughly 92,000 or 6%
of weekday trips are estimated as being social
recreation trips, or tourism-based trips.
Analysis of mobile device data indicated that
roughly 90 percent of person trips were made
from destinations within 100 miles of Sonoma
County. This indicates that though many visitors
come to the county from diverse and distant
locations (see Figure 2.7 Home Location of
Visitors) a majority of visitor travel is coming
from the San Francisco Bay Area region or is part
of a larger visitor tour that starts or ends in other
parts of the region.
As shown in Table 2-5, roughly 40 percent
of Sonoma County visitors are from the San
Francisco-Oakland-Fremont area on an average
weekend day with 65% of weekend visitors
traveling into the county from the region or
neighboring counties. The top ten metropolitan
areas with estimated visitor travel to the county
are all located in California, with the majority
in Northern California. Visitor travel on average
weekdays is mostly consistent with observed and
estimated weekend conditions with a slight shift
to travelers from closer locations.
TABLE 2-6. METRO AREAS WITH VISITORS TO SONOMA COUNTY
Average Weekend Day Average Weekday
San Francisco- 40% San Francisco-Oakland-Fremont, CA Oakland-Fremont, CA
31%
Sacramento, CA 8% Vallejo-Fairfeld, CA 11%
Napa, CA 7% Napa, CA 11%
Vallejo-Fairfeld, CA 7% Sacramento, CA 8%
Ukiah, CA 5% Ukiah, CA 6%
San Jose-Sunnyvale-Santa Clara, CA
4% Clearlake, CA 4%
Los Angeles-Long Beach-Santa Ana, CA
3% Los Angeles-Long Beach-Santa Ana, CA
2%
Clearlake, CA 2% San Jose-Sunnyvale-Santa Clara, CA
2%
Modesto, CA 1% Modesto, CA 2%
Eureka-Arcata-Fortuna, CA
1% Stockton, CA 2%
Source: Sonoma County Travel Behavior Study

18
Our Community | DRAFT COMPREHENSIVE TRANSPORTATION PLAN — JULY 2021
FIGURE 2-6. HOME LOCATIONS OF VISITORS TO SONOMA COUNTY, SPRING 2017
Source: Sonoma County Travel Behavior Study
SONOMA COUNTY IN THE FUTURE, FORECASTS
A number of different resources are available to
help determine how Sonoma County will grow
over time. The Metropolitan Transportation
Commission and Association of Bay Area
Governments (MTC/ABAG) provide forecasts
of population, housing, and employment which
they develop as part of the regional planning
process. The California Department of Finance
and Economic Development Department provide
additional estimates of future population,
housing, and employment growth. Local agencies
guide growth and development in their jurisdic-
tions through general plans and area specifc
plans. Local planners also track pending and
permitted projects and development. Information
on pending development and what is envisioned
in general and other plans can be used to esti-
mate build-out conditions or growth potential for
our communities.
Forecasts are estimates of how Sonoma County
will grow and develop into the future. This can
help guide decisions about how the transpor-
tation system can be maintained and improved,
and how these decisions can help meet county-
wide transportation goals. Forecasts are
developed using recent planning, economic, and
transportation data, including local general plans,
more detailed area specifc plans, economic
trend analysis, and transportation system usage
data such as traffc counts, transit ridership, and
traveler surveys.

19
DRAFT COMPREHENSIVE TRANSPORTATION PLAN — JULY 2021 | Our Community
FIGURE 2-7. SONOMA COUNTY GROWTH FORECASTS: 2019 — GENERAL PLAN BUILDOUT: POPULATION, HOUSING UNITS, EMPLOYMENT
700000 2019
600000 GPBO
500000
400000
300000
200000
100000
0 Population Occupied Employment
Housing Units
Source: US Census, Sonoma County Travel Model
The most recent forecasts produced at the
regional level have been developed for the San
Francisco Bay Area Regional Transportation
Plan, “Plan Bay Area” and are forecasted
through 20507. Sonoma County households are
predicted to grow from 189,000 households in
2019 to 220,000 in 2050. Employment growth
is predicted to increase from 177,000 in 2019 to
251,000 in 20508.
Growth Potential in Sonoma County
Future housing and other development potential
is guided by local general plans. SCTA works with
local planners to develop and maintain estimates
of future general plan buildout (GPBO). These
estimates consider how much growth is allowed
under local general plans, zoning codes, area
specifc plans, and other planning policies and
considers available land and policies that govern
growth and development in each jurisdiction.
SCTA staff maintain a database of countywide
pending development and permitted projects.
This database is used to ensure that these short-
term and pending projects are represented
in future growth forecasts. GPBO summaries
or estimates of future growth potential are
discussed by topic below.
Projected Population Growth in Sonoma County
Sonoma County population is predicted to grow
by 20-25 percent, from just under 500,000
residents in 2019 to over 600,000 people in
2050.9 The population continues to age with the
median age rising from 37.5 in 2000, to 39.9 in
2010, and to 41.7 in 2018.10 The senior population
(ages 65 and over) is projected to increase from
almost 22 percent (2020) to over 31 percent
of the total population by 2050.11 Aging of the
population could have signifcant impacts on
housing needs, local employment trends, travel
patterns, and demand for goods and services -
especially those oriented toward the care and
service of the senior population. Retirees will
make up a larger proportion of the population,
which will reduce the size of the local workforce,
which could trigger a need to import more labor
from surrounding counties to fll Sonoma County
jobs. Senior travel patterns can also be quite
different from the rest of the population. With
no need to commute to work or drop children
off at school, some travel could shift to off-peak
7 While this CTP and the forecasting work cited here indicates growth in the long term it is interesting to note that the population of California declined by 182,084 (a negative growth rate of -0.46%) in 2020. For more information see https://www.dof.ca.gov/Forecasting/Demographics/ Estimates/E-1/documents/E-1_2021PressRelease.pdf 8 2019 estimates from the US Census American Community Survey. 2050 forecasts generated by MTC/ABAG for Plan Bay Area 2050 as outlined in the December 2020 Final Blueprint Compendium. 9 US Census, Sonoma County Travel Model 10 US Census American Community Survey (2018, 5-year estimates) 11 California Department of Finance

20
Our Community | DRAFT COMPREHENSIVE TRANSPORTATION PLAN — JULY 2021
FIGURE 2-8. SONOMA COUNTY AGING POPULATION 2010–2050
17 & under Working Age (25–64)
College Age (18–24) Seniors (65+)
22% 19% 15% 14% 14% 9% 8% 10% 10% 8%
54% 50% 48% 48% 48%
14% 21% 28% 30% 31%
2010 2020 2030 2040 2050
Source: California Department of Finance
12 California Department of Finance 13 Plan Bay Area 2050 — Final Blueprint Compendium, December 2020. 14 Sonoma County Travel Model
periods, taking some pressure off of the busy and
congested peak period travel times.
The Sonoma County population is projected to
become more racially and ethnically diverse by
2050. Minority population share will increase
by 2050 and are predicted to make up 49
percent of the total Sonoma County popula-
tion.12 Population growth of these ethnic groups
is expected to impact housing preferences and
household formations rates.
FIGURE 2-9. SONOMA COUNTY ETHNICITIES 2020–2050
Source: California Department of Finance
Projected Housing Growth in Sonoma County
MTC/ABAG develops housing production fore-
casts based on household income and demand,
historic housing production rates, state housing
requirements and mandates, and local planning
(general plans and zoning). Housing growth
assumptions also account for changes in housing
type preferences due to aging populations,
changes in the ethnic makeup of populations,
and housing markets and demand. Regional fore-
casts estimate a 17% increase in households and
housing through 2050, or an increase of 32,000
households during this time period.13 General plan
housing estimates may differ from market and
trend based projections and represent potential
housing as allowed by general plans and other
local planning documents. Estimated general
plan housing potential for all Sonoma County
jurisdictions is roughly 52,000 housing units.14
The majority of housing potential in the county
is located in the larger jurisdictions (Santa Rosa,
Petaluma, and Rohnert Park) and unincorporated
areas. Housing potential in unincorporated areas
is located in urban service areas or within areas
that are slated for future annexation.
Short term housing potential, or housing that
could be constructed in the near future, can be
estimated by looking at projects in the devel-
opment pipeline, or that are somewhere in the
current permitting and development process.
As of the fall of 2020, there were over 21,000
housing units in the development pipeline. There
has been a recent shift towards multi-family and
higher density housing construction in recent
years, and pending housing development is split
about equally between single family detached

21
DRAFT COMPREHENSIVE TRANSPORTATION PLAN — JULY 2021 | Our Community
FORECASTING AND MODELING UNCERTAINTY
Forecasting and modeling techniques provide valuable information about how populations may grow and change, how the economy will develop, and how popu-lation and employment growth may impact travel in the future. Modeling tools used by SCTA to analyze future conditions in the CTP have been validated using real world data such as roadway trafc counts, transit rider-ship data, bicycle and pedestrian counts, and population, housing, and employment growth data collected by the US Census Bureau and other government agencies. This validation process ensures that model results are reason-able and are consistent with actual travel conditions and observed growth trends. Though care is taken to ensure that forecasts and model results are accurate, they are not perfect and may not provide a complete or perfect picture of the future. Forecasts and model results are useful for long range planning and to support decision making, but should always be compared to historic trends, existing conditions, and other empirical research and the results should be used and applied with care.
and multi-family housing units. About 10% of
pending housing development is focused on
senior/group housing and accessory dwelling
units. The highest proportion of pending housing
is located in the cities of Santa Rosa, Rohnert
Park, and Petaluma, and the Town of Windsor,
with a smaller proportion of pending units
located in smaller jurisdictions and unincorpo-
rated areas. Almost half of these pending units
have been approved or were under construction
in 2019.15
FIGURE 2-10. SONOMA COUNTY DEVELOPMENT PIPELINE IN 2021 — HOUSING UNITS BY UNIT TYPE
Source: Sonoma County Permitted and Pending Development Database
Projected Employment Growth
in Sonoma County
MTC/ABAG forecast future employment growth
for the San Francisco Bay Area region. This
analysis considers employment and job growth
trends, national population and economic fore-
casts, housing supply, and characteristics of the
work force (education, training, etc.). This fore-
cast projects that 30,000 additional jobs may
be added to the Sonoma County economy by
2050. Historically, the majority of job growth is
projected to occur in the cities, urbanized areas,
and business parks in the unincorporated areas.
Job growth is expected to be heavily biased
towards health, education, recreation, fnancial,
and professional services sectors.
Sonoma County jurisdictions actively plan for
employment and job growth through general
plans and other local policy decisions. Potential
Sonoma County Permitted and Pending Development Database 15

22
Our Community | DRAFT COMPREHENSIVE TRANSPORTATION PLAN — JULY 2021
FIGURE 2-11. SONOMA COUNTY DAILY VMT EXISTING CONDITIONS — FUTURE BASELINE (GPBO)
Mill
ions 20
18
16
14
12
10
8
6
4
2
0 Future
Baseline (GPBO)
Source: Sonoma County Travel Model
Existing
employment growth envisioned by local general
plans is generally higher than trend-based
projections such as those produced by MTC/
ABAG. Based on current general plans, there is
potential for almost 100,000 additional jobs in
Sonoma County.
Pending projects in the current development
pipeline provide an indication of short-term
potential for job growth and economic develop-
ment. In 2020, there were over 300 job related
projects in the development pipeline, repre-
senting over 7 million square feet of potential
employment development across the county.
Project types are diverse, ranging from visitor
related uses and hotels, commercial projects, and
industrial or offce projects.
Travel
Vehicle miles traveled (VMT) is a commonly
used measure of travel activity. VMT is a func-
tion of population, vehicle ownership, how often
people travel, and where they are going. The
Sonoma County Travel Model (SCTM) estimates
a 20 percent increase in VMT from today into
the future based on population and employ-
ment growth. This represents an increase from
between 14-15 million VMT per day to 17 million
VMT per day under general plan buildout condi-
tions. VMT per capita is expected to go down
(from 28.7 VMT/day per capita to 27.7 VMT/day
per capita) as general plans are built out and
jobs-housing balance improves over time. This is
consistent with local jurisdiction’s commitment to
city centered growth and focusing growth within
urban growth boundaries and priority develop-
ment areas.
Travel Modes
Travel in Sonoma County is dominated by the
private automobile and is expected to remain so
into the future if transportation policy, funding,
and attitudes do not change. Currently approxi-
mately 8 percent of trips were made using active
transportation modes. The Sonoma County Travel
Model estimates that the rate of using active
travel modes will stay in the 8 percent range in
2050, and estimates that major transportation
projects and growth will have a very small impact
on shifting travel to active transportation modes
at the countywide level. Total transit ridership
and walking/biking is expected to increase in the
future but increased travel using these modes
will most likely be offset by increased auto travel.

23
DRAFT COMPREHENSIVE TRANSPORTATION PLAN — JULY 2021 | Our Community
FIGURE 2-12. SONOMA COUNTY DAILY VMT/ CAPITA EXISTING CONDITIONS — GPBO
35
30
25
20
15
10
5
0
28.69 27.71
Existing Future Baseline (GPBO)
Source: Sonoma County Travel Model
TABLE 2-7. SONOMA COUNTY MODE SHARES BY TRIP PURPOSE — 2050
Auto Non-Auto
Drive Shared Alone Ride
Transit Walk/ Bike
All Trips 44.48% 47.13% 0.3% 8.6%
Commute 76.95% 16.8% 1.01% 5.2%
School 15.0% 70.9% 0.55% 13.6%
Source: Sonoma County Travel Model
Emissions and Air Quality
Transportation accounts for around 60 percent
of all countywide GHG emissions in Sonoma
County. The SCTA and Sonoma County jurisdic-
tions have committed to reducing GHG emissions
in the future. Transportation GHG emissions are
calculated using estimates of total vehicle travel
(VMT), travel speeds, and vehicle feet charac-
teristics. The State has mandated improved fuel
economies for vehicles which will help reduce
GHG emissions.
Congestion and Travel Delay
Traffc volumes and congestion continue to
increase in Sonoma County. Increased traffc
congestion can lead to lost productivity due to
increased delay, increased fuel consumption and
pollution, reduced accessibility, longer emer-
gency response times, higher traffc collision
rates, and impacts to quality of life.
A commonly used measure of congestion is
Person Hours of Delay (PHD). PHD is calculated
by determining the difference between estimated
travel time under congested conditions and
under free-fow or uncongested conditions for a
roadway segment or trip. The travel model esti-
mates that roughly 23,500 hours were lost each
day because of traffc congestion in Sonoma
County. Sonoma County congestion is predicted
to increase to 36,000 hours lost each day due
to congestion in the future. Most of this increase
can be attributed to increased travel because
of population and employment growth. About
one-quarter of this delay is expected to occur
during the morning and evening peak travel
periods. Highways and major local arterials would
be impacted the most by increased congestion.

Our Community | DRAFT COMPREHENSIVE TRANSPORTATION PLAN — JULY 2021
24

25
DRAFT COMPREHENSIVE TRANSPORTATION PLAN — JULY 2021 | Our Transportation System
3.
OUR TRANSPORTATION SYSTEM
The transportation system is made
up of roads and bridges and bicycle
lanes and sidewalks. It also includes
the public transit systems, buses and
SMART and, increasingly a variety of
programs and new technology to make
travel easier and more efcient.

26
Our Transportation System | DRAFT COMPREHENSIVE TRANSPORTATION PLAN — JULY 2021
Planning a transportation system that will meet
the needs of Sonoma County residents in 2050
requires a careful look at the system today. This
chapter is organized into sections about Roads &
Highways, Bicycle & Pedestrian facilities, Public
Transit, and Mode Shift strategies.
ROADS AND HIGHWAYS
The transportation system in Sonoma County is
centered around a network of roads and high-
ways on which people travel in cars, trucks,
buses, on bikes, and on foot. They provide
access to jobs, education, shopping and medical
services and allow for the delivery of goods. The
city streets, country roads, highways and freeway
account for a massive investment made by each
city, the County, and the State. Those jurisdic-
tions are also responsible for maintenance, an
ever growing and on-going cost.
There are over 2,600 miles of public roadway
countywide, which is far greater than other coun-
ties in the region including those with a much
higher population. Over half of the roadway
mileage is in the unincorporated county.
The California State Department of
Transportation (Caltrans) owns and maintains
more than 230 centerline miles of highway,
with more than three-quarters of it in the rural

27
DRAFT COMPREHENSIVE TRANSPORTATION PLAN — JULY 2021 | Our Transportation System
portions of the county. The State highways are
among the most heavily traveled routes (e.g.,
Highway 101), and because of this, carry over
half of the daily traffc, measured in vehicle miles
traveled (VMT), in Sonoma County.
TABLE 3-1. SONOMA COUNTY CENTERLINE MILEAGE OF PUBLIC ROADS, 2018
Jurisdiction Miles Percent Daily Vehicle Miles Traveled
Percent
County of 1,393 52% 2,937,220 23% Sonoma
Cities
Cloverdale
Cotati
Healdsburg
Petaluma
Rohnert
1,034
34
23
47
190
86
39%
1%
1%
2%
7%
3%
3,093,410
54,650
83,800
101,410
547,680
305,260
25%
0%
1%
1%
4%
2% Park
Santa Rosa
Sebastopol
Sonoma
Windsor
State
505
25
38
87
236
19%
1%
1%
3%
9%
1,627,400
47,380
110,570
215,260
6,512,940
13%
0%
1%
2%
52% Highways
State Parks 4 0% 2,690 0% Department
Federal 2 0% 970 0% Agencies
Total 2,670 100% 12,547,230 100% Maintained Mileage
California Department of Transportation, Highway Performance Monitoring Program, https://dot.ca.gov/ programs/research-innovation-system-information/ highway-performance-monitoring-system
Note: Miles and percentages are rounded
On an average weekday, roughly 1,648,000 trips
are taken in or through Sonoma County. Of these
trips, 89 percent are intra-county, 11 percent are
inter-county, and 1.5 percent pass through the
County without stopping. The largest trip gener-
ators in Sonoma County are Rohnert Park West
Side Commercial, Downtown Santa Rosa and
Plaza Mall, City of Sonoma, Santa Rosa Airway
Industrial Area, and Rohnert Park Expressway
Commercial. (Sonoma County Travel Behavior
Study, 2020).
The roadway and highway systems in Sonoma
County are generally built out; however, projects
that improve highway interchanges, roadway and
highway safety, and that maintain the system
are imperative to preserve existing investments
and accommodate population growth. Sixty-fve
roadway improvement projects totaling nearly
$2,914M and 16 highway improvement projects
totaling $785M are identifed in this plan for
implementation through 2050.
Since Moving Forward 2040 (2016)
Highway 101
Highway 101 is the primary north-south connector
between seven of Sonoma County’s nine cities,
Marin County and San Francisco to the south,
and Mendocino County to the north. The SCTA
has been working for more than two decades
toward converting the partially rural freeway to
a six-lane freeway with High Occupancy Vehicle
(HOV) lanes. The frst of seventeen project
segments was completed in 2003. Construction
of the fnal segment of HOV lanes in Sonoma
County through central Petaluma is fully funded
and underway with scheduled completion by the
end of 2022. This project will complete contin-
uous HOV lanes from the southern Sonoma
County line to Windsor River Road.

28
Our Transportation System | DRAFT COMPREHENSIVE TRANSPORTATION PLAN — JULY 2021
TABLE 3-2. WEEKDAY ALL-DAY ORIGIN OF TRIPS TO LARGEST TRIP GENERATORS
Rohnert Downtown Sonoma Park Santa Rosa Central
West Side & Plaza Commercial Mall
Santa Rosa Airway
Industrial Area
Rohnert Park EX
Commercial
Sonoma 0% 0% 57% 0% 0%
Petaluma 9% 2% 1% 2% 7%
Cotati 4% 1% 0% 0% 8%
Rohnert Park 49% 6% 1% 4% 56%
Santa Rosa 24% 78% 3% 72% 17%
Windsor 1% 3% 0% 6% 1%
Healdsburg 0% 0% 0% 2% 0%
Cloverdale 0% 0% 0% 0% 0%
Sebastopol 1% 1% 0% 1% 1%
Other Areas 7% 6% 24% 10% 5%
Outside County 5% 2% 14% 4% 5%
Total Trips 41,000 35,000 22,000 21,000 21,000
KEY TAKEAWAYS
• Roughly 49 percent of Rohnert Park West Side Commercial trips originate in Rohnert Park and 24 percent originate in Santa Rosa
• Roughly 78 percent of Downtown Santa Rosa & Plaza Mall trips originate in Santa Rosa and 6 percent originate in Rohnert Park
• Roughly 57 percent of Sonoma Central trips originate in the City of Sonoma and 24 percent originate in unincorporated areas of Sonoma County
• Roughly 72 percent of Santa Rosa Airway Industrial Area trips originate in Santa Rosa and 10 percent originate in unincorpo-rated areas of Sonoma County
• Roughly 56 percent of Rohnert Park EXPY Commercial trips originate in Rohnert Park and 17 percent originate in Santa Rosa
One segment of the four-lane highway remains in • U.S. 101 at Hearn interchange in Santa Rosa
Marin County between Novato and just south of • U.S. 101 at Hearn Mendocino Ave/Hopper in the Sonoma County line (See map: MSN B7). The
Santa Rosa major funding source to complete this segment is
from Regional Measure 3, which is pending legal • U.S. 101 at Shiloh challenges. The Transportation Authority of Marin
is actively seeking alternative funding sources to Ramp Metering
close the gap. Funding will continue to be sought In 2014, Caltrans completed activation of ramp to furnish landscaping along the entire corridor. metering along the Highway 101 corridor with 43
Many interchanges along the route are in need of onramp locations in Sonoma County from Pepper
updating and are identifed in the plan: Road in Petaluma to Arata Lane in Windsor.
Ramp metering lights manage the rate at which • U.S. 101 and Railroad Avenue interchange in vehicles enter the freeway to optimize the oper-
Cotati ations and function of the system, resulting in
reduced travel times. • U.S. 101 and Todd Rodd interchange in Santa
Rosa

29
DRAFT COMPREHENSIVE TRANSPORTATION PLAN — JULY 2021 | Our Transportation System
FIGURE 3.1: HIGHWAY 37
Highway 37
State Route 37 is a 21-mile corridor linking US
101 in Novato and Interstate 80 in Vallejo along
the northern shore of the San Pablo Bay. As the
primary regional east-west connection in the
North Bay, SR 37 carried an annual average of
37,000 vehicles daily in 2018 (Sonoma County
Travel Behavior Study, 2020) and is projected to
increase to over 40,000 vehicles daily by 20501.
Due to the imbalance of affordable housing in
the North Bay, the heavy commute from Solano
County to Marin and Sonoma creates heavy
congestion on SR 37 causing up to an 80-minute
delay during peak commute times. Alternative
routes are more than double the length in
miles and have signifcant safety and capacity
challenges.
This corridor is also under threat from sea level
rise as it is one of the lowest-lying highways
in California, in terms of elevation relative to
mean high water. State Route 37 is currently
being studied to understand how adaptive
transportation planning could address issues
related to climate change and sea level rise.
The projected rising seas poses a threat to the
Highway with partial inundation by 2050 and
complete inundation by 2100. The berm upon
which SR 37 sits passes through existing marshes
and marshes under restoration, which poses a
threat to adaptation of the surrounding coast-
al-marsh systems.
In 2015, the transportation agencies of Marin,
Napa, Solano and Sonoma Counties formed
a partnership through a Memorandum of
Understanding (MOU) to develop an expedited
funding, fnancing and project implementa-
tion strategy for the reconstruction of SR 37 to
withstand rising seas and storm surges while
improving mobility and safety along the route.
This partnership led to formation of a Policy
Committee of 12 elected offcials that has guided
numerous studies and plans on strategies
including bus and rail transit feasibility, water
transit, public access, transportation demand
management, highway confguration to address
Sonoma County Travel Study 2018 volumes adjusted using growth factors from the Sonoma County Travel Model. 1

30
Our Transportation System | DRAFT COMPREHENSIVE TRANSPORTATION PLAN — JULY 2021
FIGURE 3-2. MARIN SONOMA NARROWS (MSN)
STO
NY
PO
INT
RD
PINER RD
OCCIDENTAL RD
LEVERONI
RD
TODD RD
PETA
LUM
A
HILL
RD
RIVER RD
3RD ST
FU
LT
ON
R
D
ELY RD
SAN
TA
ROSA
AV
VERANO
AV
3R.
ST
ADOBE RD
SN.
LN
WR
IGH
T R
D
FU
LT
ON
RD
LL.RD
BR
USH
CR
EE
KR
D
PTL.BLV.
FU
LTO
N
RD
MN
.ST
BELLEVUE AV
RIVER
RD
PL
EA
S A NT
HILL RD
GUERNEVILLE RD
PLEASANT AV
LUDWIG AV
COTATI AV
ROHNERTPARK EXPR
NAPA RD
CASA
GRN
. AV
WA
RM
SP
RIN
GSR
D
HWY116
WES
TSID
ER
D
LLA
NO
RD
PETALUM
A
AV PTLM. VLYFORD RD
HWY12
CASA
GRA
ND
ERD
ELYRD
HW
Y116
NAPAST
SIERRAAV
PETALUMA
AV
GUERNEVILLE RD
SNY
DE
R L
N
TOD
D
RD
RIVERRD
CH
ILENO
VA
LL EYR
D
HWY12
WA
SHIN
GTO
NST
CRANECANYON RD
BODEGA A V
HWY116
GRAVENSTN.
H WY
STON
Y
PO
INT RD
BENNETTVALLEY RD
OLD
REDWOOD
HWY
5TH
ST
ROHNERTPARK EXPR
GRAVENSTEIN
HWY
AIRPORT BLVD
SHILOH RD
AV
OCCIDENTAL RD
BLO
OM
FIE
L D
RD
CORO
NA
RD
WIL
LOW
SID
ER
D
EA
STSI
DE
RD
GUERNEV ILLE RD
WESTERN
AV
5TH
ST
WINDSORRIVER RD
BR
OA
DW
AY
TODD RD
STEELE
LN
TRE
NTO
N
HEA
LDSB
UR
G R
D
FAUG
HT
RD
WARMSPRINGS RD
LLAN
ORD
HW
Y12
D ST
HWY 121
HIG
H
SCH
OO
L RD
BURBANK
MEMORIAL HWY
BODEGA AV
PE
TAL
UM
AH
ILL
RD
AR
NO
LDD
R
AR
NO
LDD
R O
LDRED
WO
OD
HW
Y
F REIR
D
ARN
OLD
DR
WIN
DSO
RR
D
GRAVENSTEIN
HWY
MOUNTAIN VIEW AV
OCCIDENTAL RD
WIN
DSO
RR
D
LONEPINE RD
ADOBE RD
H
WY
116
CH
AL
KH
ILL
RD
TOMALES RD
WA
TER
TR
OU
GHRD
PETALUMA
HILL RD
HWY 12
RIVER RD
PIN
ER
RD
MARK WEST
SPRINGS RD
MARK W EST
SPRI NGS RD
MEA
CH
AM
RD
H
ALL RD
SLU
SSE
R R
D
HALL RD
PINER RD
ADOBE RD
MCDOWELL BLVD
GR
AVEN
STEINHWY
MARK WEST
STATION RD
SON
OM
AM
TN R
D
STAGE
GUL
CHRD
PE
TA
LU
MA
HIL
L R
D
STO
NY
PO
INT
RD
PEPPER RD
HW
Y 1
01
LA
GU
NA
RD
BENNETTVALLEY RD
GRANG ER
D
STONYPOINT RD
STAGE
GULCH RD
PEPPER RD
EAST
SID
ER
D
H
WY
12
ADOBE RD
RI EBLI RD
PRESSL
EYR
D
BENNETT VALLEY RD
PETALUMAVLY FORD RD
SONOMA
MTN RD
ROBLAR RD
LAKEVILLE RD
Ê
£¤101
·|}þ116
·|}þ116
·|}þ12
·|}þ12
SANTA ROSA
WINDSOR
SEBASTOPOL
ROHNERT PARK
COTATI
PETALUMA
SONOMA
Marin County
Lake County
NOVATO
NORTH-B
WILFRED
CENTRAL-A
CENTRAL-B
MSN-C
MSN-B
CENTRAL-C
HOV lanes completed
HOV to be completed ·|}þ116
HOV lanes completed
HOV to be completed

31
DRAFT COMPREHENSIVE TRANSPORTATION PLAN — JULY 2021 | Our Transportation System
both congestion and sea level rise, funding
sources, tolling legislation, environmental docu-
ments, and near- to long-term restoration and
enhancement projects in the San Pablo Bay
Lands.
Complete reconstruction of the corridor to alle-
viate sea level rise threats, environmental issues,
and congestion is a long-term project that could
take several years if not decades. Short-term
projects have been identifed, including food
protection solutions at Lakeville Highway and
other targeted areas, a reversable carpool lane
using a movable concrete barrier, and dynamic
ridesharing marketing and incentive programs.
Highway 12
State Route 12 connects Sebastopol, Santa
Rosa, the Sonoma Valley, and Napa County. It
also provides a connection to the Interstate 80
corridor. Most of this corridor is two lanes, with
the exception of a portion through Santa Rosa
that has four lanes and is developed to freeway
standards. The two-lane sections in Sebastopol
and in the Sonoma Valley become severely
congested during peak travel times throughout
the year but is particularly impacted when
tourism is at its height during summer months.
Issues and Opportunities
Vision for the Future
The vision for the future of highways and road-
ways in Sonoma County incorporates safe and
well-maintained roadways, effcient use of infra-
structure, and complete streets with safe access
for multiple modes. This includes projects that
improve pavement conditions, complete the
HOV corridor on Highway 101, enhance intelligent
transportation systems, construct safety and
effciency improvements at freeway interchanges
and roadway intersections, and engineer multi-
modal corridor improvements such as transit
pullouts, protected bike lanes and sidewalks.
Condition of Roads
As a county with a large ratio of road miles per
capita, maintaining the existing infrastructure
is a challenge. Extreme weather, fres, fooding,
landslides all have pronounced negative effects
on the infrastructure. Pavements deteriorate 40
percent in quality in the frst 75 percent of their
life; however, this deterioration subsequently
accelerates rapidly, resulting in another 40
percent drop in quality in the next 12 percent of
life.
A single dollar spent on renovation when the
pavement is still in ‘fair’ condition can save fve
dollars in maintenance cost over spending main-
tenance funds when the pavement has already
deteriorated to ‘very poor’ quality.
Road rehabilitation is a signifcant unmet need,
that has been highlighted in every CTP and in
annual road condition reports. Unlike other more

32
Our Transportation System | DRAFT COMPREHENSIVE TRANSPORTATION PLAN — JULY 2021
nuanced goals, maintaining the infrastructure
“only” needs funding, but costs are estimated at
over $1.5 billion over the next 30 years in order to
maintain the existing conditions of roads. In order
to reach and maintain a state of good repair on
every street and road in Sonoma County MTC
estimates a cost of over $3 billion over the next 3
years.
Local Roads Projects
CTP local roads projects represent a diverse set
of projects including:
• Southern Crossing at Caulfeld Lane
• Northpoint Parkway Improvements —
Bellevue Avenue to S. Wright Road
• Sebastopol Rd Corridor Plan — Dutton Ave
to Stony Point Rd
• Petaluma Hill Rd — widen from Aston Ave to
Santa Rosa City limit
• Bodega Corridor Project
• Old Redwood Highway: Windsor Road to
Arata Lane
• Adobe Road Reconstruction
Bridges
There is a need to upgrade or replace bridges
in Sonoma County that remains unfunded.
Specifc unfunded projects are the Rohnert
Park Redwood Drive Bridge Replacement at
Hinebaugh Creek ($10M) and the SMART Rail
Russian River Bridge costing ($30M).
Trends
Intelligent Transportation Systems (ITS)
Intelligent Transportation Systems (ITS) uses
systems of information and communications
technologies in the transportation system to
improve operations. ITS has been around for
some time in the form of traffc signals acti-
vated by traffc, transit, and emergency vehicles.
Arterial management is another form of ITS that
includes all signals in a corridor and adapts to
traffc conditions to optimize fow. Signal timing
technology can also be used to detect vehicles in
left turn lanes to trigger a left turn signal to avoid
running the signal when no vehicles are traveling
in that direction. Real-time signs displaying travel
time estimates to popular designations from
highways is another form of ITS.
Emerging ITS expands these technologies to
automated driving systems and data exchanges
to improve safety and effciency. Sensors and
transmitters can be deployed to manage smart
roads, cars, streetlights, and parking systems.
These systems can enable communication
between vehicles and the transportation system.
Autonomous Vehicles
Automated vehicles have the potential to shift
many aspects of transportation thanks to
improvements in vehicle sensors, mapping and
onboard processing. While these changes may
gradually reduce the need for a driver, the intro-
duction and adoption of autonomous vehicles is
expected to be gradual due to the complexity of
cost of these new systems.
The convenience of autonomous vehicles is
expected to initially beneft more affuent users,
while the wide availability of affordable mobility

33
DRAFT COMPREHENSIVE TRANSPORTATION PLAN — JULY 2021 | Our Transportation System
through autonomous vehicles will require signif-
icant levels of adoption and reductions in costs.
Any congestion reduction from autonomous
vehicles may also require dedicated lanes that
allow for platooning or the early retirement of
non-autonomous vehicles.2
Autonomous vehicles also have the potential
to increase VMT signifcantly due to shifts in
mode choices and the additional trips without a
passenger — which are already observed in ride-
hailing services.
Because of these potential impacts, the 3
Revolutions Future Mobility Program at the UC
Davis Institute of Transportation Studies suggests
that policies such as occupancy require-
ments, performance standards and fee-based
approaches could be required to ensure that the
shift to autonomous vehicles also supports our
future transportation goals.3 MTC recommends
the following strategies that could help mitigate
negative impacts of automation4:
• Control greenfeld development — AVs could
induce more dispersed development and
increase VMT by making longer travel times
more tolerable. Policies should be in place to
ensure that future growth is effcient.
• Repurpose off-street parking for infll devel-
opment — AVs are very likely to reduce car
2 Victoria Transportation Policy Institute, Autonomous Vehicle Implementation Predictions, https://www.vtpi.org/avip.pdf 3 Capturing the Climate Benefts of Autonomous Vehicles, UC Davis https://3rev.sf.ucdavis.edu/sites/g/fles/dgvnsk6431/fles/fles/page/av.pdf 4 Autonomous Vehicles Perspective Paper, MTC/ABAG, June 2018

34
Our Transportation System | DRAFT COMPREHENSIVE TRANSPORTATION PLAN — JULY 2021
ownership and parking demand, especially
in more dense areas. Off-street parking
should be reclaimed and converted to more
effcient uses.
• Continue to invest in high capacity transit
and introduce demand-responsive transit in
less dense areas — AVs could make taking
transit less attractive, but high capacity
transit will still be more effcient in high
traffc corridors. Transit could evolve in less
dense areas to compete with AVs.
• Implement dynamic road and curb space/
parking pricing — AVs could put new
demands on the road network and curb
areas. Programs could be implemented to
mitigate any negative impacts.
• Equitable access should be required and
protected — Without regulation, AV service
providers could cluster service near busy,
higher-income areas. Programs should be in
place to provide equitable access.
• Cap speed limits in downtowns and neigh-
borhoods — Reducing average vehicle
speeds could increase safety for all road
users, particularly non-motorized travelers.
• Mandate that all AVs are EVs — AVs could
potentially increase total travel and VMT.
Requiring that all AVs are EVs would reduce
travel related emissions signifcantly.
Some changes in our transportation infrastruc-
ture may also be required. For example, future
city streets may be able to support smaller roads
or lanes along with lower parking demand due
to autonomous vehicles. Highway and freeways
could operate more effciently due to vehicle
platooning and reduced lane requirements.
Vehicle automation could help reduce speeds
and improve safety since speed limits could be
“coded” into the AV. AVs could reduce heavy
vehicles traffc by automating some delivery
services and shifting it to smaller vehicles
As automakers make plans to invest huge
amounts of money on autonomous vehicles over
the coming decades, cities and road operators
also have a role to play. At the city level, this
may be in the form of curb pricing to help nudge
autonomous vehicle use towards the desired
outcomes. While autonomous vehicles are still
at an early stage, a dialogue between trans-
portation policy makers and the transportation
industry could help avert the potential negative
impacts of autonomous vehicles.
THE LATEST ON AUTONOMOUS VEHICLES
See also Fehr and Peers https://www.fehrandpeers. com/autonomous-vehicle-research/#:~:text=VMT%20 increases%20by%20an%20average,required%20to%20 be%20shared%20rides.
https://www.nhtsa.gov/technology-innovation/ automated-vehicles-safety
Victoria Transportation Policy Institute, Autonomous Vehicle Implementation Predictions, https://www.vtpi. org/avip.pdf
Goods Movement
Goods Movement refers to the transportation of
products from the location of their manufacture
or harvest to their fnal retail destination and
is a vital component of the regional economy
and transportation system. Industries depen-
dent on goods movement provided just under
one-third of all jobs in the Bay Area in 2011, and
the nation’s ffth largest container port is located

35
DRAFT COMPREHENSIVE TRANSPORTATION PLAN — JULY 2021 | Our Transportation System
in the Bay Area (the Port of Oakland). In Sonoma
County, roughly 16,000 people are employed in
the goods movement industry.5
Highway 101, Highway 37, and the SMART rail on
the Northwestern Pacifc Railroad (NWP) line
are the main arteries for freight distribution in
Sonoma County. The Marin-Sonoma Narrows
project on Highway 101 is called out as one of
the highest priority freight route projects in
MTC’s 2016 Goods Movement Plan.6 In addi-
tion, Highway 101 from 580 to Santa Rosa is
part of the National Highway Freight Network
established by the FAST Act for freight project
investment.7
SMART took over freight rail in 2020 when it
bought track rights and equipment from the
North Coast Railroad Authority (NCRA). Freight
trains share the rail line with passenger service
outside of SMART’s primary operating hours
(6–10 am and 4–7 pm) in order to avoid conficts
with faster passenger trains on the single-track
line. More recently, the California Transportation
Commission approved funding for SMART to
construct modern freight rail spurs, with Positive
Train Control systems, and repair the Black Point
Rail Bridge over the Petaluma River.
Highway 101 is the primary route that would
beneft from diversion of freight from truck to
rail. The Draft Environmental Impact Report
for resuming operations on the Russian River
Division of the Northwestern Pacifc Railroad
estimates that up to 400 truck trips would be
removed in the loaded direction between Novato
and Santa Rosa. This is a benefcial impact for
the North Bay’s transportation system for both
congestion relief, pavement wear and emissions.
The major east-west corridor is State Route 37
that follows 21 miles along the northern shore
of San Pablo Bay linking US 101 in Novato, Marin
County with Interstate 80 (I‐80) in Vallejo,
Solano County. Near-term plans to reduce
congestion and longer-term plans to increase
resiliency on the highway could ensure that this
corridor remains viable for goods movement in
the face of sea level rise.
Trends and Emission Reductions
Goods movement has increased globally for
many years, and the COVID-19 pandemic only
increased the number of last-mile connector trips
as US ecommerce grew over 32% in 2020.8 By
2050, freight movement is forecasted to triple
across the globe, with accompanying increases in
congestion and GHG emissions.9
Improving vehicle technology could help prevent
a rise in emissions. Currently, freight and delivery
vehicles cause a relatively high amount of
congestion and pollution from a small number
of vehicles. While cleaner alternatives to heavy
duty trucks are just starting to come onto the
market, the California Air Resource Board has
adopted the Advanced Clean Trucks (ACT)
Regulation that will create a larger market for
Metropolitan Transportation Commission, San Francisco Bay Area Goods Movement Plan, February 2016 <http://mtc.ca.gov/our-work/ plans-projects/eco- nomic-vitality/san-francisco-bay-area-goods-movement-plan, accessed May 12, 2016>. 6 Ibid. 7 U.S. Department of Transportation, Federal Highway Administration, Freight Management and Operations, <http://ops.fhwa.dot.gov/freight/ infrastructure/nfn/index.htm, accessed June 15, 2016>. 8 U.S. Census Bureau, Quarterly Retail E-Commerce Sales 4th Quarter 2020, https://www.census.gov/retail/mrts/www/data/pdf/ec_current.pdf 9 Organization for Economic Cooperation and Development (OECD), ITF Transport Outlook 2019, https://www.oecd-ilibrary.org/sites/transp_ outlook-en-2019-en/index.html?itemId=/content/publication/transp_outlook-en-2019-en
5

36
Our Transportation System | DRAFT COMPREHENSIVE TRANSPORTATION PLAN — JULY 2021
these vehicles by requiring roughly 60% of new
trucks sold in the state to be zero-emission by
2035.10 Additional charging infrastructure and
grid upgrades will be needed to support these
vehicles.
The transition to cleaner vehicles will take many
years, but improvements in freight logistics could
improve congestion and GHG emissions in the
near term. Improvements such as route optimi-
zation, delivering during off-hours and choosing
lighter-weight electric vehicles for last-mile
connections could reduce the impact of goods
movement.11
Distribution centers are increasingly moving
closer to their destinations in urban areas.
Changes in zoning could even allow distribution
centers to operate in retail spaces that are in less
demand because of growing e-commerce. This
could allow for smaller last-mile delivery vehi-
cles, such as cargo bikes, light electric vehicles
and remotely operated or autonomous delivery
vehicles.
BICYCLE AND PEDESTRIAN INFRASTRUCTURE
Bicycling and walking are healthy, low-cost, and
zero-emissions forms of transportation. When
coupled with public transit, bicycling and walking
can provide the “frst and last mile” of a trip to
extend mobility. In addition to reducing emis-
sions produced by gasoline-powered motorized
vehicles, replacing vehicle trips with bicycle or
walking trips has numerous co-benefts including
reduced air and noise pollution, reduced traffc
congestion, and improved physical and mental
health.
Sonoma County’s moderate climate and the
relatively fat terrain in the population centers
make for an excellent place to bike and walk.
The diverse scenic vistas from the mountains
to the coast attract cyclists from around the
world and bring numerous cycling races and
events. Transportation and land use policies
such as Complete Streets policies and Priority
Development Areas (PDAs) have contributed
to an increase in dedicated space for bicyclists
and pedestrians in the recent decades. All juris-
dictions within Sonoma County have adopted
Complete Streets policies, which require consid-
eration to accommodate pedestrians, bicyclists,
public transit users, and drivers when developing
transportation projects. Infll and PDA devel-
opment are beginning to shift the layout of our
cities toward more walkable, bikeable, and tran-
sit-oriented communities. Focused development
and complete networks of sidewalks and bicycle
facilities lead to convenient distances for walking
and biking that are safe and accessible.
Complete Streets are designed for all users of the street. They are planned, designed, operated, and maintained for safe and convenient access by all users (bicyclists, pedestrians, drivers, transit riders, etc.), with an emphasis on users who’s needs have traditionally experienced underinvestment.
Only about eight percent of all trips in Sonoma
County are taken bicycle or walking. (Sonoma
County Travel Model) For commute to work trips,
10 California Air Resources Board, https://ww2.arb.ca.gov/our-work/programs/advanced-clean-trucks 11 Zero Emission Urban Freight, Transportation Decarbonization Alliance, http://tda-mobility.org/wp-content/uploads/2019/05/TDA-Zero-Emission-Urban-Freight.pdf

37
DRAFT COMPREHENSIVE TRANSPORTATION PLAN — JULY 2021 | Our Transportation System
4.1 percent were by bicycle or walking in 2018.
The percentage of people commuting by bicycle
or walking has been declining over the last
forty years. (U.S. Census Bureau: 2018 American
Community Survey 5-Year Estimates) Although
nearly all trips begin and end as pedestrian trips,
the mode used for the majority of a trip is used
to calculate mode share.
Despite the low share of trips by bicycle and
walking, the Sonoma County Travel Behavior
Study (2020) demonstrated that there is poten-
tial for a substantial shift from vehicle to bicycle
and pedestrian trips. Roughly 60 percent of
trips in Sonoma County are fve-miles or shorter,
and nearly 30 percent are less than two-miles.
(Sonoma County Travel Behavior Study, 2020)
For average riders, a two-mile bicycle ride takes
about 12 minutes and can be completed without
breaking a sweat. A fve-mile bicycle trip is also
considered a comfortable distance for an average
rider.
Concern about safety is the most frequently cited
barrier to bicycling in general and is consistent
with the feedback received in Sonoma County
related to this plan. Safety improvements for
bicyclists and pedestrians were identifed as high
priorities as was the need to dedicate space for
bicycles. Maintaining sidewalks and streets for
walking and biking were also cited as important
transportation needs.
SCTA endeavors to increase the share of trips
being taken by bicycle, walking, and transit
through engineering, encouragement, and educa-
tion. This vision requires a broad network of safe
routes that connect all desired destinations.
Since Moving Forward 2040 (2016)
Since the last update of this plan in 2016, dozens
of miles of new bicycle facilities were constructed
in Sonoma County. These facilities include over
10 miles of the SMART Pathway, Class II bike
lanes along the Highway 101 frontage road from
Petaluma South Boulevard at Kastania Road to
San Antonio Road, a large portion of the planned
improvements on local streets in Sebastopol,
several miles of Class II lanes on Stony Point
Road, Leveroni Road / Napa Road, Petaluma
Hill Road, Guerneville Road, Arnold Drive,
Adobe Road, and numerous other important
improvements.
Many pedestrian specifc improvements have
been made, including sidewalk completions, ADA
compliant curb ramps, new and enhanced cross-
walks, and pedestrian signal timing. Several other
bicycle and pedestrian projects have advanced
through planning, design, securing funding, and
environmental clearance.
Three cities in Sonoma County have been recog-
nized as Bicycle Friendly Communities by the
League of American Cyclists. The program
requires applicants to meet set criteria and
provides a roadmap for those awarded to
advance to the next level. Sonoma (since 2018)
and Healdsburg (since 2014) are recognized as
bronze level Bicycle Friendly Communities. In
2019, Santa Rosa was upgraded from a bronze to
a silver level Bicycle Friendly Community.

38
Our Transportation System | DRAFT COMPREHENSIVE TRANSPORTATION PLAN — JULY 2021
Current system
Bicycle
Sonoma County has approximately 208 miles
of built bicycle infrastructure and another 1,013
miles of infrastructure planned. The vast majority
of the existing and planned bicycle infrastruc-
ture is in the form of Class II bike lanes on street
networks.
The bicycle system includes, but is not limited to,
the following facility types: Class I, Class II, Class
III, Class IV, bicycle boulevards, multi-use trails,
traffc calming, signage, bicycle-activated signal
detection, and bicycle parking.
• Class I Bikeway (Multiuse Pathway) is a
completely separated right of way for the
exclusive use of bicycles and pedestrians
with crossfow by motorists minimized (such
as the SMART Pathway)
• Class II Bikeway (Bike Lane) is a striped
lane for one-way bicycle travel on a street
or highway, with the lane designated with
striping and signage and/or pavement
markings
» Class IIB (Buffered Bike Lane) is a Class
II bicycle lane with a striped buffer space
separating the bicycle lane from the
adjacent motor vehicle travel lane and/or
parking lane
• Class III Bikeway (Bike Route) is for shared
use with pedestrian or motor vehicle traffc
with the route indicated just with signage
» Class IIIB (Bicycle Boulevard) a Class
III on streets designated for bicycle
priority with additional treatments such
as signs, pavement markings, and speed
and volume management measures
to discourage through trips by motor
vehicles
• Class IV Bikeway (Cycle Track or Protected
Bikeway) provides an on-street bike lane
that is buffered from traffc using a physical
barrier, such as curbs, planters, or parked
cars
• Bike Trails are unpaved recreational trails
Detailed descriptions of bicycle facility types and
design guidelines can be found in in the National
Association of City Transportation Offcials
(NACTO), Urban Bikeway Design Guide (https://
nacto.org/publication/urban-bikeway-design-
guide/) and the American Association of State
Highway and Transportation Offcials (AASHTO),
Guide for the Development of Bicycle Facilities
(https://nacto.org/wp-content/uploads/2015/04/
AASHTO_Bicycle-Facilities-Guide_2012-toc.pdf).

39
DRAFT COMPREHENSIVE TRANSPORTATION PLAN — JULY 2021 | Our Transportation System
Class 1 Facilities
In Sonoma County, a large portion of the existing
and planned Class I facilities are along creek
alignments owned by cities or the County (e.g.,
Sonoma County Water Agency) and along prior
or existing railroad rights-of-way (e.g., SMART
Pathway).
The SMART Pathway, with over 15 miles complete
within Sonoma County as of 2020 and several
more miles under development, is expanding
the network and connectivity of Class I facilities
in the North Bay. Other major Class I facilities
connecting to the SMART Pathway include the
Joe Rodota Trail (7 miles) leading east to west
from Santa Rosa to Sebastopol, the Copeland
Creek Trail (3 miles) through Rohnert Park, and
the Petaluma River Trail and Lynch Creek Trail
(2.5 miles) in Petaluma. The Joe Rodota Trail
links to the West County Trail, a Class I facility,
which currently extends to Forestville. Several
other Class I facilities connect with the SMART
Pathway or are planned to eventually connect
with the existing Class I network. The SMART
Pathway would also become the Sonoma and
Marin portions of the Great Redwood Trail envi-
sioned to provide a bicycle and pedestrian
connection from San Francisco Bay to Humboldt
Bay.
On-Road Facilities
On-road bicycle facilities include bike lanes (Class
II), shared lane facilities or bike routes (Class III),
and cycle tracks or protected bikeways (Class
IV). Class II and III facilities currently make up
the majority of the bicycle network throughout
the County. Class IV bikeways, or cycle tracks,
are a newer classifcation adopted by Caltrans in
2015 and have not been implemented in Sonoma
County as of 2021. Many of the planned on-road
facilities close gaps in the current network or
improve intersections and freeway crossings.
Barriers such as narrow roads without right-
of-way to accommodate bicyclists, freeways, and
high-speed and multiple-lane arterials present
challenges for the on-the-road bicyclist. Gaps
and barriers along the state highway system
are well documented in the Caltrans District 4
Bicycle Plan (2018).
Pedestrian
The pedestrian system is comprised of side-
walks, trails, crosswalks, and amenities such
as landscaping, tree plantings, lighting and
street furniture that create safe and comfort-
able environments. Design standards are used
to create pedestrian areas that are welcoming
and feel safe. Land-use is critical to the viability
of a pedestrian system, with pedestrian facil-
ities designed to provide access to attractors
like schools, offces, restaurants, entertainment,
retail, and transit. Gaps in the pedestrian system
are often found in locations between the older
and newer development, in formerly rural and
industrial areas, and in some of the County’s
unincorporated towns. Barriers imposed by the
state highway system are well documented in
the Caltrans District 4 Pedestrian Plan (2021).
Several pedestrian accommodations have been
installed around Highway 101 as part of its recent
re-construction.
Pedestrians include people who use wheelchairs
and rely on curb ramps and other infrastruc-
ture such as accessible pedestrian call buttons
to get around. As new pedestrian facilities are
built and older ones are upgraded, they must be
constructed to be accessible per the regulations
of the Americans with Disabilities Act of 1990.

40
Our Transportation System | DRAFT COMPREHENSIVE TRANSPORTATION PLAN — JULY 2021
Vision for the Future and Petaluma on-street projects round out
the project. Total project costs are estimated
Bicycle and Pedestrian Projects at over $40 million.
Bicycle and pedestrian projects make up the • North Santa Rosa Station Area Bike/Ped
largest number of projects in this plan. The list of Connector over Hwy 101 ($24M)
bicycle and pedestrian CTP projects is derived • Southeast Greenway Multi-Use Path and
from the Countywide Bicycle and Pedestrian Crossings ($20M)
Master Plan and represents a high priority subset
of that list of projects. A few of the largest proj- • Hwy 1 — Many project phases that make up ects found in the list include: the 34 miles of class 2 bike lanes along the
Sonoma coastline ($18M) • SMART Pathway — Includes all projects
within SMART’s right of way in all Sonoma • Hwy 128 — 24 miles of class 2 bike lanes
County jurisdictions from Petaluma to from Napa County to Mendocino County
Cloverdale. Other SMART Pathway projects ($18M)
such as the Foss Creek Trail in Healdsburg
TABLE 3-3. TOTAL MILES OF PLANNED BICYCLE AND PEDESTRIAN FACILITIES BY CLASS
Class I II/IIB III/IIIB IV Ped TBD Study Total
LARGE JURISDICTIONS
Santa Rosa 39.0 50.4 37.8 2.2 21.2 12.1 162.7
Sonoma County 198.5 332.4 190.4 721.4
Medium Jurisdictions
Petaluma 22.4 29.5 14.5 66.3
Rohnert Park 7.9 4.8 3.5 16.2
Windsor 7.7 5.3 5.5 18.5
SMALL JURISDICTIONS
Cloverdale 3.8 2.9 2.1 8.8
Cotati 0.2 0.5 0.4 1.1 2.2
Healdsburg 2.0 0.9 2.9 5.8
Sebastopol 0.4 0.8 1.1 2.3
Sonoma (City) 0.6 4.8 3.4 8.8
Total Miles by Class 282.4 432.3 261.7 2.2 22.3 12.1 1,013.0
Countywide Bicycle and Pedestrian Master Plan 2014, 2019 project list update

41
DRAFT COMPREHENSIVE TRANSPORTATION PLAN — JULY 2021 | Our Transportation System
The 103 bicycle and pedestrian projects iden-
tifed in the CTP originate from the 2014 SCTA
Countywide Bicycle and Pedestrian Master Plan.
The bicycle and pedestrian project list from the
2014 SCTA Countywide Bicycle and Pedestrian
Master Plan has been updated to remove proj-
ects completed since 2014 and add new projects
submitted for this CTP and include a total of
1,013 individual projects. Bicycle and pedestrian
projects with a cost of $1M or higher are listed
separately. All projects under $1M are combined
into one project for each jurisdiction.
Table 3-2 includes the total miles of the planned
bicycle system by Class for each jurisdiction.
Other Bicycle and Pedestrian Needs
In addition to physical bicycle and pedestrian
infrastructure, supportive measures are important
aspects of bicycling and walking as a means of
transportation and recreation. Bicycle and pedes-
trian supportive programs, including Safe Routes
to School, Eco2School, Vision Zero, and Bike
Share, are discussed in the next section of this
chapter on Mobility Programs.
Supportive elements such as wayfnding, route
mapping, continuity of regional routes, connec-
tivity to transit, secure bicycle parking, and
community education on routes and safety
help support and grow active transportation.
Comprehensive bicycle signage programs
enhance the safety and navigability of existing
facilities, especially where there are connections
to transit and across jurisdictions. Bicycle parking
programs aim to provide adequate bicycle
parking amenities to meet the needs of existing
and future bicyclists and enhance the overall
bicycle system. All of these elements are part of
the bicycle and pedestrian system and contribute
to the comfort and safety of the system.
Trends
The COVID-19 pandemic brought a “bike boom”
with sharp increases in bicycling and bicycle
sales across California and the US in 2020. Early
on in the pandemic, when vehicle traffc was
noticeably lower than usual, bicycling was seen
as a safe and attractive way to get exercise and
fresh air and bicycle sales more than doubled.
These trends continued through the summer and
are likely here to stay. In 2020 bicycling increased
by 20 percent and approximately 10 percent of
Americans either rode for the frst time in over
a year or used a bicycle in a different way than
they had before, such as for transportation or an
indoor bicycle.12 Electric bicycle sales increased
145 percent and pedal bicycle sales increased 65
percent in 2020 over 2019, despite anecdotes of
People for Bikes, Industry and Cities Positioned to Maintain Growth of Bicycling in 2021, https://www.peopleforbikes.org/news/ how-bicycling-changed-during-a-pandemic#utm_source=LINews&utm_medium=email&utm_campaign=1 12

42
Our Transportation System | DRAFT COMPREHENSIVE TRANSPORTATION PLAN — JULY 2021
TABLE 3-4. TRANSIT OPERATIONS
Transit Operator Service Type Geographic Area
Sonoma County Intercity, local All cities/town in Sonoma County, unincorporated Sonoma County Transit including Sonoma Valley and Russian River areas, and between
communities
Santa Rosa CityBus Local City of Santa Rosa
Petaluma Transit Local City of Petaluma
Golden Gate Inter-city — commuter bus Along Highway 101 between Santa Rosa, Marin County, and San Transit Francisco. Connects to Marin to East Bay routes
Sonoma-Marin Inter-city — commuter rail Twelve stations located between the Sonoma County Airport, north Area Rail Transit of Santa Rosa, and the Larkspur Ferry Terminal in Marin County
Mendocino Transit Inter-county Between Santa Rosa and Ukiah in Mendocino County, and to several Authority communities along the Sonoma and Mendocino coast
Marin Transit Dial-a-ride services From Tomales and Dillon Beach in West Marin into Petaluma
13 New York Times, Farther, Faster and No Sweat: Bike-Sharing and the E-Bike Boom, March 2, 2021, https://www.nytimes.com/2021/03/02/ travel/ebikes-bike-sharing-us.html
shortages.13 Many cities saw increased use of bike before installation. Testing out street design with
share and added electric bicycles to their feets. temporary installments is especially attractive
for bicycle and pedestrian infrastructure as new Cities responded to the increased levels of designs can be experienced by the community bicycling and walking, and the need for physical and adjusted relatively quickly when needed. The distancing and open air during the pandemic, by California Bicycle Coalition and Alta Planning + adopting slow streets. These temporary changes Design published a Quick-Build Guide for plan-to streetscapes included a number of traffc ning and implementation (https://www.calbike. calming measures as well as encroachment on org/wp-content/uploads/2020/10/Quick-Build-parking areas and traffc lanes to make additional Guide-White-Paper-2020.pdf). space for outdoor dining and walking. Several
efforts are underway to make some of these
changes permanent. PUBLIC TRANSIT SERVICES
Some of the temporary changes made during the Public transit plays a critical role in the transpor-
pandemic are akin to trends of installing demon- tation system as it provides access to economic
stration projects to test out new infrastructure opportunities as well as social and environmental
and evaluate how it works in the real world. benefts. Using public transit in place of owning
Demonstration projects, also called quick build a vehicle for every driver in a household can
or tactile urbanism, can be low-cost and reduce greatly reduce household expenses for transpor-
the need for extensive studies and outreach tation. The estimated average cost of owning a

43
DRAFT COMPREHENSIVE TRANSPORTATION PLAN — JULY 2021 | Our Transportation System
vehicle in the U.S. was $6,201 annually in 2019.14
Replacing vehicle trips with transit trips also
reduces greenhouse gas emissions, air pollution,
traffc congestion, and demand for parking.
In 2019, there were over 4.4 million rides on
public transit in Sonoma County. Of those rides,
roughly 84 percent were by bus and 16 percent
were by rail. According to on-board transit
surveys conducted in 2018, over 70 percent of
bus transit riders and 26 percent of train riders
in Sonoma County are very low-income and a
large percentage do not have access to a vehicle.
High school and college students also make up
a signifcant portion of bus transit riders. Public
transit provides essential services to people who
cannot drive due to disabilities.
Public transit service in Sonoma County includes
local and regional bus routes, and regional
passenger rail, operated by six independent
agencies.
Since Moving Forward 2040 (2016)
Passenger Rail — Sonoma-Marin
Area Rail Transit District
On August 17, 2017, the Sonoma-Marin Area Rail
Transit District (SMART) launched passenger
rail service along a 43-mile corridor serving 10
stations in Sonoma and Marin Counties: near
the Sonoma County Airport, in Santa Rosa (2),
Rohnert Park, Cotati, Petaluma, Novato (2),
and San Rafael (2). In December 2019, SMART
opened a new station in Larkspur, extending
the tracks to 45-miles and connecting to the
Larkspur Ferry Station with service by Golden
Gate Ferry to San Francisco. SMART also opened
the Downtown Novato station, in Marin County, in
December 2019.
Future expansion of the SMART system
includes extension of service north to Windsor,
Healdsburg, and Cloverdale, and an infll addi-
tion of a second station in Petaluma. SMART has
secured funding to extend service to Windsor
and has commenced construction on this section.
One of the fund sources in the project funding
plan, remains under litigation with the State
Supreme Court, resulting in the stoppage of
work on the Windsor SMART extension. SMART
continues to seek funding to restart the project in
advance of the litigation resolution. Rail service
was anticipated for late 2021 and has been
delayed pending receipt of additional funds.
Bus Route Improvements and
Connections to SMART
In summer 2017, Santa Rosa CityBus imple-
mented the frst phase of their 2016 long-range
plan Reimagining CityBus. With no additional
revenue, CityBus improved their network with
more direct and bi-directional routes that run on
either 15-minute or 30-minute headways. Two
high-frequency 15-minute, bi-directional bus
service corridors were developed; a north-south
route on Santa Rosa Avenue/Mendocino Avenue/
14 American Automobile Association, AAA Exchange, Your Driving Costs: 2019, http://exchange.aaa.com/ <accessed July 1, 2020>.

44
Our Transportation System | DRAFT COMPREHENSIVE TRANSPORTATION PLAN — JULY 2021
FIGURE 3-3. SONOMA-MARIN AREA RAIL TRANSIT DISTRICT (SMART) SYSTEM MAP

45
DRAFT COMPREHENSIVE TRANSPORTATION PLAN — JULY 2021 | Our Transportation System
Bicentennial Way/Range Avenue and an east-
west route on Sebastopol Road/Third Street.
The high-frequency corridors added signifcant
service to connect with the two SMART stations
in Santa Rosa.
To provide connections to SMART service,
Sonoma County Transit adjusted schedules for
several routes and added service to accommo-
date anticipated demand for connections.
Petaluma Transit also adjusted timetables for
the three routes that serve the Petaluma SMART
Station area. Service was expanded to connect
to the Kaiser Hospital. Additionally, several bus
stop relocations and enhancements were made
to support passengers transferring between bus
and rail.
Transit Information
Real-time information signs have been installed
at the transit malls in Santa Rosa and Petaluma,
at major hubs and transfer centers throughout
the County, and at numerous high-volume bus
stops throughout the county. With real-time
arrival signs, passengers can see how much time
they have before their bus arrives or if they just
missed one.
In fall 2017, when Santa Rosa CityBus moved
their offces from City Hall to their transit opera-
tions facility, CityBus opened a staffed customer
service kiosk at the Santa Rosa Transit Mall to
sell transit tickets, passes, and Clipper® cards.
CityBus staffs the customer service kiosk from
8:30 a.m. to 4:30 p.m. Monday through Friday.
Transit Service Representatives (TSRs) who
provide customer information on routes and
schedules for all operators, patrol the Transit
Mall assisting passengers. These services help
riders who need assistance fnding connections
or information on how to get to their ultimate
destinations.
Fare Programs
Over the last four years, transit operators
developed several new fare discount and free
programs. Through partnerships with the Santa
Rosa Junior College currently enrolled students
who attend campuses in the cities of Petaluma or
Santa Rosa can ride for free on Sonoma County
Transit, Santa Rosa CityBus, and Petaluma Transit
buses. In addition, Sonoma County Transit has
an agreement with Sonoma State University that
provides free rides on Sonoma County Transit
by its students. SMART also has arrangements
for discounted rides for SRJC students via the
SMART Eco Pass program.
In 2018, Santa Rosa joined Sonoma County
Transit in offering free rides for veterans on
fxed-route transit. SMART has offered free rides
to veterans and active duty military and their
families on Memorial Day and Veterans’ Day
weekends and continues to work to identify a
veterans’ organization to facilitate implemen-
tation of a veteran discount program through
SMART’s Eco Pass program.
In June 2018, Sonoma County Transit began its
frst “Fare-Free” local route. “Fare-Free” routes
have now been established for local routes in
Cloverdale, Healdsburg, Windsor, Sebastopol,
Guerneville/Monte Rio, and Sonoma/Sonoma
Valley. This program has resulted in a signifcant
increase in ridership on the “Fare-Free” routes,
with some riders citing the ease of boarding
without needing to plan ahead for paying for a
ride or purchasing a pass as an attraction.
In 2020, Golden Gate Transit, SMART, Sonoma
County Transit, Santa Rosa CityBus, and

46
Our Transportation System | DRAFT COMPREHENSIVE TRANSPORTATION PLAN — JULY 2021
Petaluma Transit joined the Clipper START pilot
program to offer a fare discount for low-income
riders. Through the Clipper START program,
qualifying low-income riders receive a 50 percent
discount on SMART and Golden Gate Transit, and
a 20 percent discount on the local bus systems
for single ride tickets.
New options for fare payment through mobile
apps have emerged since 2016. With the start
of service, SMART included a mobile applica-
tion payment option for single and group rides
through Masabi. In December 2019, Sonoma
County Transit introduced a similar mobile appli-
cation payment system for passes and single
rides on both fxed-route and paratransit through
HopThru. Clipper, the Bay Area’s universal fare
payment card, launched a new mobile app option
in spring 2021 and is working on several other
upgrades for transit agencies throughout the Bay
Area.
Fleet Electrifcation
In 2018, Sonoma County Transit put into oper-
ation the frst fully electric transit bus in the
county. Sonoma County Transit in 2021 has three
electric transit buses that regularly operate in
Sebastopol, Rohnert Park, and Cotati. In 2019,
Sonoma Clean Power funded a battery elec-
tric bus planning and engineering study for
Mendocino Transit, Sonoma County Transit,
Petaluma Transit and CityBus. In 2020, the
City of Santa Rosa began participating in the
PG&E EV Fleet Electrifcation program to install
charging infrastructure for the planned nine
CityBus battery electric buses by 2024. Sonoma
County Transit and Santa Rosa CityBus now
have additional electric buses on order. These
efforts mark the beginning of the county’s tran-
sition to a zero-emissions feet. The California Air
Resources Board’s 2018 Innovative Clean Transit
(ICT) Regulation requires that small bus opera-
tors make one quarter of all new purchases be
zero-emissions starting in 2026 and large bus
operators by 2023. The ICT regulation requires
that all new public transit buses purchased after
2029 be zero-emission, with a goal that all buses
in California are zero-emission by 2040.
Current System
Transit routes and operators in Sonoma County
are connected through a network of shared
stops, transfer centers, rail stations, and regional
hubs.
The Santa Rosa Downtown Transit Mall is the
largest hub in Sonoma County and is estimated
to serve over 10,000 passengers daily on Santa
Rosa CityBus, Sonoma County Transit, Golden
Gate Transit, Mendocino Transit, and Greyhound.
The Petaluma Transit Mall, located just west of
the downtown Petaluma SMART station, serves
as a transfer hub for Petaluma Transit, Sonoma
County Transit, Golden Gate Transit, and Amtrak
Thruway Service.
Transit hubs located at the current and the
future SMART stations in Cotati, Windsor, and

47
DRAFT COMPREHENSIVE TRANSPORTATION PLAN — JULY 2021 | Our Transportation System
Healdsburg are served by Sonoma County
Transit. The Cloverdale Depot is also served by
Amtrak Thruway Service. Most of these transfer
hubs also serve as park-and-ride lots.
SMART and Golden Gate Transit routes from
Sonoma County continue to the Bettini Transit
Center in San Rafael and the Golden Gate Ferry
Terminal in Larkspur, which provide connections
to San Francisco and the East Bay.
Paratransit Service
Paratransit is a door-to-door service avail-
able to persons who, due to a disability, are
unable to use the fxed-route transit system. All
bus systems in Sonoma County provide para-
transit service within at least a ‐ mile radius
of an active bus route per requirements of the
Americans with Disabilities Act (ADA) enacted
in 1990. This civil rights legislation mandates
equal opportunity in employment, transporta-
tion, telecommunications, and places of public
accommodation for people with disabilities. The

48
Our Transportation System | DRAFT COMPREHENSIVE TRANSPORTATION PLAN — JULY 2021
ADA paratransit requirement does not apply to
commuter bus, commuter rail, and intercity rail
systems. Paratransit service must be compa-
rable to the public transit operator’s fxed-route
service regarding the following service criteria:
comparable response time, similar fares, same
geographic area of service, no restriction of trip
purpose, equal availability of information, and no
constraints on capacity.
All four bus transit operators contract out
their paratransit services. Santa Rosa and
Petaluma both currently have contracts with
MV Transportation to provide curb-to-curb
paratransit service that will deliver patrons
within their respective city limits. Sonoma
County contracts with the Center for Volunteer
and Nonproft Leadership to provide para-
transit service through Volunteer Wheels in a
service area and during service hours compa-
rable to Sonoma County Transit’s fxed-route
system. Golden Gate Bridge, Highway and
Transportation District (GGBHTD) offers inter-
county demand-response paratransit service
within a 3/4 mile radius of all non-commute
Golden Gate Transit routes through Marin
Transit’s current contracted paratransit provider,
Whistlestop. Paratransit passengers may travel
across multiple transit service areas by arranging
transfers through the agency that administers
the client’s paratransit eligibility. Golden Gate
Transit provides service beyond the hours of
CityBus, Sonoma County Transit, and Petaluma
Transit. During very early morning or very late
evening hours, when those providers are not in
operation, Golden Gate Transit will often take the
client to their fnal destination without a transfer.
Since the pandemic, CityBus, Sonoma County
Transit, and Petaluma Transit have been piloting a
“one-seat ride” model for paratransit, which elim-
inates transfers between these agencies.
FIGURE 3-4. PUBLIC TRANSIT ROUTES AND HUBS
Transit ridership tends to fuctuate with the
economy and fuel prices. In Sonoma County,
ridership grew with population and development
from the 1990s and 2000s. Average weekday
boardings are a good indicator of transit use
for work and school commutes. A noticeable
increase in average weekday commutes was seen
in 2018. Overall transit ridership increased in 2019
through early 2020.

49
DRAFT COMPREHENSIVE TRANSPORTATION PLAN — JULY 2021 | Our Transportation System
FIGURE 3-5. AVERAGE WEEKDAY BOARDINGS FOR PETALUMA TRANSIT, SANTA ROSA CITYBUS, SONOMA COUNTY TRANSIT, AND SMART
Source: Federal Transit Administration, National Transit Database
FIGURE 3-6. ANNUAL TRANSIT RIDERSHIP 2013-2019
Sources: Federal Transit Administration, National Transit Database
Golden Gate Bridge, Highway & Transportation District, Short-Range Transit Plans 2017, 2019
Transit ridership in Sonoma County has grown
with population and development, with a marked
increase in early 2020, prior to the onset of
the COVID-19 pandemic. SMART’s extension
to Larkspur and ferry terminal connection in
December 2019 contributed to increased rail rider-
ship, and bus ridership also increased. Fluctuations
in ridership generally correlated with the economy
and fuel prices; however, the COVID-19 Pandemic
has had signifcant impacts to transit ridership,
which are discussed further below.
Issues and Opportunities
Sonoma County has a high intra-county
commute with 89 percent of weekday trips
occurring within the county (Sonoma County
Travel Behavior Study, February 2020), indicating
a good job-housing balance. The high internal
commute points to the opportunity for robust
transit; however, transit in Sonoma County faces
several obstacles to attracting choice riders.
Operating hours for many transit routes are
focused on the 8am to 5pm commute schedule
and often do not meet the needs of shift workers
and students with evening classes. The rural
nature and low population-density in much of
unincorporated Sonoma County makes it diff-
cult to effciently provide transit service for all
residents. Vehicle ownership in Sonoma County
is fairly high, averaging more than one registered
vehicle per licensed driver (Department of Motor
Vehicles, Registered Vehicles 2019). Parking in
Sonoma County is ample and generally free,
with the exception of downtown Santa Rosa. The
suburban and rural character of Sonoma County,
coupled with high auto ownership and ample free
parking, contribute to a commute that is domi-
nated by driving alone — 77.1 percent of workers
(US Census, American Community Survey, 2018).
With limited resources for operations, bus transit
operators often struggle with the balance of

50
Our Transportation System | DRAFT COMPREHENSIVE TRANSPORTATION PLAN — JULY 2021
providing coverage in low-ridership areas for
those who rely on transit and providing more
frequent headways where there is demand. High-
frequency routes, running every 15 minutes or less,
attract riders because they enable people to take
trips without planning around the transit schedule.
Still there is a need to provide transit service for
those who depend on it in less populated areas
where high-frequency routes are not viable.
Growth in Sonoma County will lead to increased
road congestion if mode split trends continue.
Road congestion can negatively impact bus
schedule reliability. However, planned growth
in city centers and around transit hubs has the
potential to increase transit demand and increase
revenue streams to allow for expansion. Further
integration of the various transit systems will
allow more seamless travel across the county and
throughout the region and attract new riders.
Pandemic Impacts and Recovery
The Covid-19 pandemic has created challenges
for public transit, requiring short-term response
and will require long-term planning for recovery.
Transit experienced steep declines in rider-
ship due to shelter-in-place orders, with local
bus service dropping to roughly 48 percent of
pre-pandemic ridership. Since May 2020, rider-
ship has been increasing but as of spring 2021
remains signifcantly lower than pre-pandemic
as many regular riders continue to work from
home, have lost jobs, or are concerned about
exposure to the virus. Ridership is expected to
increase signifcantly in fall 2021 when students,
who make up a large portion of regular ridership,
return to school and a greater number of adults
return to on-site work.
To promote physical distancing between drivers
and riders, local bus transit operators in Sonoma
County suspended fare collections from March
2020 through February 1, 2021. In addition to
fare revenues, transit in Sonoma County depends
heavily on funding from sales and fuel taxes for
operations that were affected by the pandemic.
Reduced demand coupled with lost revenues
from rider fares, diminished tax revenues, and
increased costs related to enhanced cleaning
methods required operators to reduce service
starting in the spring of 2020. Restoration
of some of the local bus routes began in the
summer of 2020 and continued to be phased
back into 2021. Tax revenues continue to be in
fux and diffcult to predict. The future conse-
quences to transit ridership of the COVID-19
pandemic are unknown at this point due to
seemingly dramatic shifts underway with
continued remote work and changed work loca-
tions, as well as population shifts due to residents
relocating.
Response to the impact of the pandemic on
transit has taken place at each level of govern-
ment. At the regional level, MTC established
a Blue Ribbon Transit Recovery Task Force to
address the distribution of funds through the
CARES Act, uniform health and safety proto-
cols during the pandemic, and a Public Transit
Transformation Action Plan to re-shape the
region’s transit system into a more connected,
effcient, and user-focused network across the
Bay Area and beyond. The Plan will take into
consideration recovery plans submitted by each
transit agency.
Vision for the Future
Transit Plans
Numerous transit plans have been completed
that will help shape transit recovery and devel-
opment moving forward. Several agencies have

51
DRAFT COMPREHENSIVE TRANSPORTATION PLAN — JULY 2021 | Our Transportation System
developed plans for future system expansion and
collaborative plans have outlined how multiple
agencies can effectively coordinate for greater
integration between systems and seamless travel.
• SCTA Future of Transit Ad Hoc Committee
— A subset of the SCTA Board of Directors
formed in 2020 to discuss priorities for
implementation of recommendations from
the 2019 Transit Integration and Effciency
Study in light of changed circumstances
from the pandemic. The Ad Hoc identifed
the primary goal to increase transit ridership
as a mechanism to reduce GHG emissions,
improve access to low-cost transportation,
and reduce congestion.
• Bay Area Public Transit Transformation
Action Plan, anticipated Summer 2021
— Succeeding a growing focus on “seam-
lessness” of the Bay Area’s transit network,
the COVID-19 pandemic prompted MTC to
lead a Blue-Ribbon Transit Recovery Task
Force that is tasked with developing a Bay
Area Public Transit Transformation Action
Plan. The Plan will have a fve-year horizon
to 2025 and should identify actions needed
to re-shape the region’s transit system into a
more connected, effcient, and user-focused
mobility network across the entire Bay Area
and beyond.
• Connected Communities Transportation
Study, Spring 2021 — Sonoma County
Human Services Area Agency on Aging
Department has been working on the
Connected Communities Transportation
Study to examine the needs and gaps in
transportation services for seniors, people
living with disabilities, and isolated indi-
viduals. A report detailing needs and
recommendations for public transit,
volunteer driver and other transportation
programs for the focus demographics was
fnalized spring 2021.
• Short Range Transit Plans — MTC requires
that each transit operator in its region
receiving federal funding, prepare, adopt,
and submit to the MTC a Short-Range
Transit Plan (SRTP) in order to effec-
tively execute planning and programming
responsibilities included in the Regional
Transportation Plan (RTP) and the
Transportation Improvement Program
(TIP). In early 2010, MTC initiated its Transit
Sustainability Project (TSP), which includes
a goal to that public transit is an accessible,
user-friendly, and coordinated network.
Fulfllment of this TSP goal is facilitated
through development of a joint appendix
to the Short-Range Transit Plans that
documents progress and goals on agency
coordination.
• Battery Electric Bus Planning and
Engineering Study, 2020 — A multi-
agency Battery Electric Bus Planning
and Engineering Study was completed in
January 2020 analyzing electric bus feet
and facility needs in the near/mid-term time
frame (next 5 years). The study, sponsored
by Sonoma Clean Power, reviewed facility,
route, and charging needs for Sonoma
County Transit, Petaluma Transit, Santa Rosa
City Bus, and Mendocino Transit.
• Transit Integration and Effciency Study,
2019 — In 2019, SCTA adopted the Transit
Integration and Effciency Study, which
recommends actions that Sonoma County
Transit, Santa Rosa CityBus, and Petaluma
Transit could take to deliver more seamless
transit service that improves passenger

52
Our Transportation System | DRAFT COMPREHENSIVE TRANSPORTATION PLAN — JULY 2021
experience, reduces operating and capital
costs, and better integrates the existing
operating systems.
• SMART Passenger Rail Engineering
Feasibility Study — Novato to Suisun City,
2019 — report on the feasibility of providing
passenger rail connectivity between the
SMART passenger rail system in Novato and
the Capitol Corridor passenger rail system in
Suisun City, providing an east-west connec-
tion to expand transit connectivity in the
Hwy 37 corridor between Marin, Sonoma,
Napa, and Solano counties.
• SMART Strategic Plan, 2019 — SMART
Phase 2 plans include extension of the
system north to Windsor, Healdsburg, and
Cloverdale, a station at North Petaluma,
and the construction of additional pathway
segments. Completion of the extension to
Windsor was expected in late 2021 but is
currently suspended pending the resolution
of funding issues while Regional Measure 3
funds remain under litigation.
• SMART Commuter Rail Integration Plan,
2016 — In preparation for the commence-
ment of SMART, MTC developed the SMART
Commuter Rail Integration Plan in 2016
to address opportunities for integration
of SMART commuter rail, bus service, and
other frst and last mile modes.
• Reimagining CityBus, 2016 — Santa Rosa
CityBus completed a long-range planning
effort as a blueprint for the build-out of
the ideal transit system, called Reimagining
CityBus. The frst phase of the plan was
implemented in 2017 with comprehen-
sive system redesign to improve effciency
and effectiveness of the bus system
through route realignments and increases
in frequency and directness. Phase 2 of
Reimagining CityBus is a roadmap for transit
system improvements such as extended late
night and weekend service, expansion of
15-minute frequency network to be incor-
porated as funding becomes available, and
increased transit speeds with rapid bus facil-
ities, implementation of innovative service
models to complement and feed into fxed
routes.
Transit Vision
In addition to adopted plans, transit agencies
have identifed priorities for the near term and
through Moving Forward 2050 horizon. These
priorities are refected in the 39 transit projects
listed in this plan.
Projects
Bus and Rail Transit projects are divided into two
different categories:
• Transit Capital Projects — representing the
capital cost of maintaining or expanding
service through projects such as bus
replacements, bus stop improvements, and
SMART extensions.
• Transit Improvements — Non-Capital:
representing the cost of maintaining existing
service and the non-capital costs asso-
ciated with expanding service (e.g., fare
free programs, increased hours of service).
Maintenance of transit service is required to
be budgeted using known fund sources, and
maintenance costs are required to be listed
as fully funded.
Key expansion projects included in the updated
plan are:

53
DRAFT COMPREHENSIVE TRANSPORTATION PLAN — JULY 2021 | Our Transportation System
• Transit feet and facility electrifcation
• Service increases for all transit systems
• SMART rail service to Cloverdale, including
purchase of new vehicles and maintenance
facilities
• Additional SMART stations in Petaluma,
Windsor, Healdsburg and Cloverdale
• SMART Pathway construction providing
frst/last mile access to SMART stations
• Rapid bus projects
• Maintenance shops, bus yards, and bus stop
improvements
• Technology — passenger information and
fare technology, transit signal priority
projects
Service Expansion
The quality of transit service is a strong determi-
nant of bus ridership. A system that is reliable,
is safe, and has a schedule that people can plan
their days around helps retain regular riders and
attract choice riders. Such a system has enough
frequency that minimizes long wait times and
transfer times, with travel times that are more
comparable to driving. Hours of operation and
geographic coverage are also important to
ensure that people can travel where they want to
go during the hours they need to travel.
There is currently no transit service on Highway
37 connecting Sonoma County with Napa and
Solano counties to the east. Peak hour conges-
tion on this corridor limits the beneft that transit
could provide, especially where there is only
one travel lane in each direction. Expansion of
transit on this corridor will be considered along
with implementation of the Highway 37 improve-
ment project that is discussed in the Roads and
Highways section above. This project would
expand capacity and allow for transit to move
past traffc during commute times.
Service expansion projects in this plan total
over $333 million, in addition to operations
and maintenance costs through 2050. These
projects directly meet the goal of a Connected
and Reliable transportation system and the
objective to provide a robust and well-coordi-
nated local and regional transit system. Transit
service expansion could also help fulfl the goals
for a transportation system that is Community
Oriented and Place-Based, and Zero-Emissions.
Affordability
Affordability of transit is a key equity consider-
ation and, as discussed above, all transit systems
in Sonoma County are piloting programs to
offer reduced fares or to eliminate fares. These
programs include “Fare-Free” service on local
Sonoma County Transit routes, “Fare-Free” rides
for college students on local bus transit, free
rides for veterans on Sonoma County Transit and
Santa Rosa CityBus, income-based fare discounts
through Clipper START, and discounts for certain
passenger types such as K-12 students, seniors,
and riders with disabilities. CityBus is also
considering programs to provide employers and
developments access to “Fare-Free” for their
employees and residents. Many programs rely on
a subsidy provided by a state or local program,
or contributions. Maintaining and expanding
these programs can enhance access to jobs and
education, while ensuring equity in the transpor-
tation system.
Full implementation of “Fare-Free” programs for
the three local bus operators from 2022 through

54
Our Transportation System | DRAFT COMPREHENSIVE TRANSPORTATION PLAN — JULY 2021
2050 would cost an estimated $117 million.
Work toward a more affordable transit system
aligns with the Moving Forward 2050 goal for a
Connected and Reliable transportation system
and the guiding principle of equity.
Multi-modal Access
Multi-modal access to and on transit is key to
a fully integrated transit network. Safe and
accessible pedestrian facilities connecting to
transit hubs is an important element of transit
access. Bicycle routes leading to transit, and
secure parking and bike share at transit hubs,
and accommodating bicycles onboard transit
vehicles are critical to facilitating transit use and
reducing auto trips. All buses are equipped with
bicycle racks on the front of the vehicles. SMART
has installed bike racks and electronic BikeLink
bicycle lockers at every SMART Station. SMART
also allows bicycles onboard trains and 11 percent
of passengers brought their bicycles onboard
trains prior to the COVID pandemic. That fgure
has grown to greater than 20 percent during the
pandemic. Further multi-modal transit access
integration is occurring with the implementation
of the Marin-Sonoma Bike Share project in 2021,
where bike share hubs are being located at major
destinations, including around rail stations and
major bus hubs.
Improved Facilities and Fleet
Improved facilities for getting to transit and
waiting for transit can make a big difference
to the rider experience. People are more likely
to use transit if they can walk to it and have a
safe and comfortable place to wait. Upgrading
passenger amenities at bus stops is a priority
throughout the county. Transit operators have
plans to upgrade and expand the availability of
bus shelters countywide, with focus on schools,
employment sites, and other major trip gener-
ators. Plans for improvements also include
installing benches at all bus stops, improving
lighting at bus stops, expanding real-time bus
arrival information and other public information
at bus stops countywide, adding additional bike
racks at bus stops and intermodal facilities, and
maintaining and improving key intermodal hubs
throughout the county. Continuing to work with
local jurisdictions to improve walkability, ADA
accessibility, and pedestrian access to transit
stops also supports transit.
Engineering solutions on high-frequency bus
corridors can optimize transit effciency by
speeding up bus service to better compete with
the automobile. Some examples of engineering
solutions are Rapid Bus and Bus Rapid Transit
(BRT) facilities, including the following elements:
• Transit signal priority — modifcation of
traffc signal timing or phasing when transit
vehicles are present
• Queue jump lanes — short, dedicated transit
lanes to allow buses to easily enter traffc
fow ahead of traffc or bypass congested
intersections
• Express Bus service — routes or runs with
fewer stops to speed up travel time
• Bus Rapid Transit (BRT) — dedicated bus
lanes, often including high-quality stations
in the center of the road with platform-level
boarding and off-board fare collection.

55
DRAFT COMPREHENSIVE TRANSPORTATION PLAN — JULY 2021 | Our Transportation System
FIGURE 3-7. QUEUE JUMP LANE
Source: Transit Street Design Guide, NACTO, April 2016
Fleet maintenance, expansion, and electrifcation
Maintenance and improvement of the transit feet
are key components of safe, clean, and effcient
transit operations. Adding transit service often
requires expansion of the transit feet.
The California Air Resources Board’s Innovative
Clean Transit rule requires all public transit
agency feets to transition to 100 percent
zero-emission buses (ZEB) by 2040, with a
portion of purchase requirements for large
operators beginning in 2023. Local transit agen-
cies have taken steps to begin transitioning to
zero-emissions feets earlier than required, by
purchasing electric buses and completing the
Battery Electric Bus Planning and Engineering
Studies to address their infrastructure needs. A
full transition may require a network of en-route
charging and insurance of resilience during
power outages and emergencies.
Transit capital improvements projects
including feet electrifcation, feet expansion,
and rail extension, total over $836 million.
Implementation of the transit capital improve-
ments would advance all four of the Moving
Forward 2050 goals; Connected and Reliable,
Safe and Well-Maintained, Community Oriented
and Place-Based, and Zero-Emissions.
Inter-agency Coordination
In addition to meeting regularly to coordi-
nate and share information, transit operators
serving Sonoma County have developed or
been included in numerous plans for increased
coordination and integration. MTC’s Transit
Sustainability Project (2012) identifed the need
for increased multi-operator coordination in
Sonoma County, which spurred the development
of a joint appendix to the operator Short Range
Transit Plans detailing coordination efforts and
goals.
Subsequently, multiple studies and plans have
focused on more specifc areas of coordination,
including bus and rail coordination (SMART
Commuter Rail Integration Plan, 2016), local
bus operator integration and effciency (Transit
Integration and Effciency Study, 2019), and
transportation needs for seniors and people
living with disabilities (Connected Communities
Transportation Study, 2021). Coordination and
more seamless integration have also been a
focus at the regional level, with a report by SPUR

56
Our Transportation System | DRAFT COMPREHENSIVE TRANSPORTATION PLAN — JULY 2021
on Seamless Transit in 201515 (SPUR, Seamless
Transit, 2015) and new regional strategies led by
MTC to improve transit effciency across the Bay
Area (Bay Area Public Transit Transformation
Action Plan, 2021) provide more seamless
multimodal mobility. Local bus operators have
identifed service planning coordination and
collaboration on information sharing with the
public as high priorities for near-term recovery.
A well-coordinated transit system that is easy to
navigate and use to reach a variety of destina-
tions is more attractive to new riders and more
likely to retain existing riders. Inter-agency coor-
dination supports the Moving Forward 2050 goal
for Connected and Reliable that a well-coordi-
nated local and regional transit system, as well as
ensuring options for youth and older adults.
Trends
Technological innovations have the potential to
optimize transit productivity through improved
trip planning and user experience. As technolog-
ical advances demonstrate effectiveness through
pilot programs around the globe, transit agencies
are adopting new methods to improve effciency.
Micro-transit, or on-demand transit, uses tech-
nology to offer fexible dynamic routing and
scheduling based on riders’ needs. In some
lower ridership areas, micro-transit has shown
to be more effcient than fxed-route transit as
it dynamically routes service to where there is
demand. Replacing certain fxed-routes with
micro-transit may allow agencies to redirect
resources to increase service on fxed-routes with
high ridership.
There has been an increased focus on technolo-
gies to improve the rider experience by making
the trip planning process easier and more seam-
less. Third party trip-planning apps have made
trip planning more convenient, especially where
all operators in a region appear on the same
app. As adoption of these technologies advance,
riders can expect more readily available informa-
tion and tools.
Automation of transit is an intriguing and
transformative prospect as it could drastically
reduce the cost of operations. As autonomation
advances, autonomous shuttle pilot projects have
been taking place in increasing locations around
the world. These demonstration projects have
generally been focused on relatively controlled
environments with simple fxed routes, fxed sets
of stops, and slow speeds. Vehicle automation
has come a long way, but in 2020 there is still
signifcant work to be done on to perfect the
technology, consider the impacts of automation
in policies, and adapt infrastructure to the needs
of automation. UC Davis’ 3 Revolutions Future
Mobility Program emphasizes the need for auton-
omous vehicles to be both shared and electric
to reduce greenhouse gas emissions and avoid
congestion and unintended land use changes that
could degrade quality of life.
Additional Senior Mobility Programs
The Sonoma County Area Agency on Aging
currently manages and coordinates several
mobility programs that support volunteer driver
programs, taxi voucher programs, and shuttle
services. Volunteer driver programs help meet
the transportation needs of disabled and senior
residents in Sonoma County, especially in more
San Francisco Bay Area Planning and Urban Research, Seamless Transit: 2015, https://www.spur.org/sites/default/fles/publications_pdfs/ SPUR_Seamless_Transit.pdf <accessed October 16, 2020>. 15

57
DRAFT COMPREHENSIVE TRANSPORTATION PLAN — JULY 2021 | Our Transportation System
rural areas where transit service is less available.
Volunteers provide rides for medical and social
service appointments for seniors, visually chal-
lenged seniors, and others who are unable to use
local transportation systems.
Volunteer driver programs currently supported
by the Area Agency on Aging include the
Sebastopol Area Senior Center Volunteer
Driver Transportation Program (West County),
Petaluma People Services Center iRIDE (South
County), Catholic Charities’ volunteer driver
program (Santa Rosa), and Vintage House Local
Independent Mobility Options Program (Sonoma
Valley). Through a Caltrans grant, the Area
Agency on Aging initiated a uniform ride sched-
uling software platform called Assisted Rides
for these volunteer services. Friends in Sonoma
Helping (F.I.S.H.), Coastal Seniors, City of
Healdsburg DASH, and West County Community
Services also run volunteer driver programs.
Information about mobility options that address
the needs of disabled and senior residents of
Sonoma County can be found through Sonoma
Access (www.sonomasenioraccess.org), a
one-stop website and referral center. Sonoma
Access was initially established by the City of
Santa Rosa and is now administered through
the Sonoma County Area Agency on Aging
with funding from a federal New Freedom grant
and a federal Enhanced Mobility of Seniors and
Individuals with Disabilities grant. The Area
Agency on Aging also provides information
and assistance to seniors, including information
on transportation options, through a hotline
(707-565-INFO).
MODE SHIFT PROGRAMS
On-road transportation accounts for 60% of
greenhouse gas emissions within Sonoma County
(Sonoma County Green House Gas Inventory,
2018 Update). The RCPA’s passage of the Climate
Emergency resolution in September of 2019,
and the global climate crisis, brings urgency to
expanding transportation choices in our commu-
nity. As the built environment in Sonoma County
favors single occupancy vehicles as an easy and
convenient form of transportation, providing
incentives, education, and marketing for alterna-
tive travel choices is essential.
Mode shift programs, often referred to as trans-
portation demand management (TDM), are a
collection of methods and actions intended to
improve the effciency of the existing trans-
portation system by reducing the demand for
single occupancy vehicle travel, especially during
congested peak commute hours. Programs are
maintained by employers, transit operators,
community-based organizations, and govern-
ment agencies. A variety of approaches can
be used, including providing education and
resources on the importance of mode shift,
providing incentives for participation through
money and time saved, or improving the ease
at which cleaner transportation options are
accessed. The strength and presence of these
programs continue to grow and will be instru-
mental in ushering in a safer, cleaner and more
effcient transportation system in Sonoma
County.
Subsidies and Incentives
Transit discounts are available on all systems in
Sonoma County for youth, seniors, and individ-
uals living with a disability. Local college students
may ride local bus transit for free in Sonoma
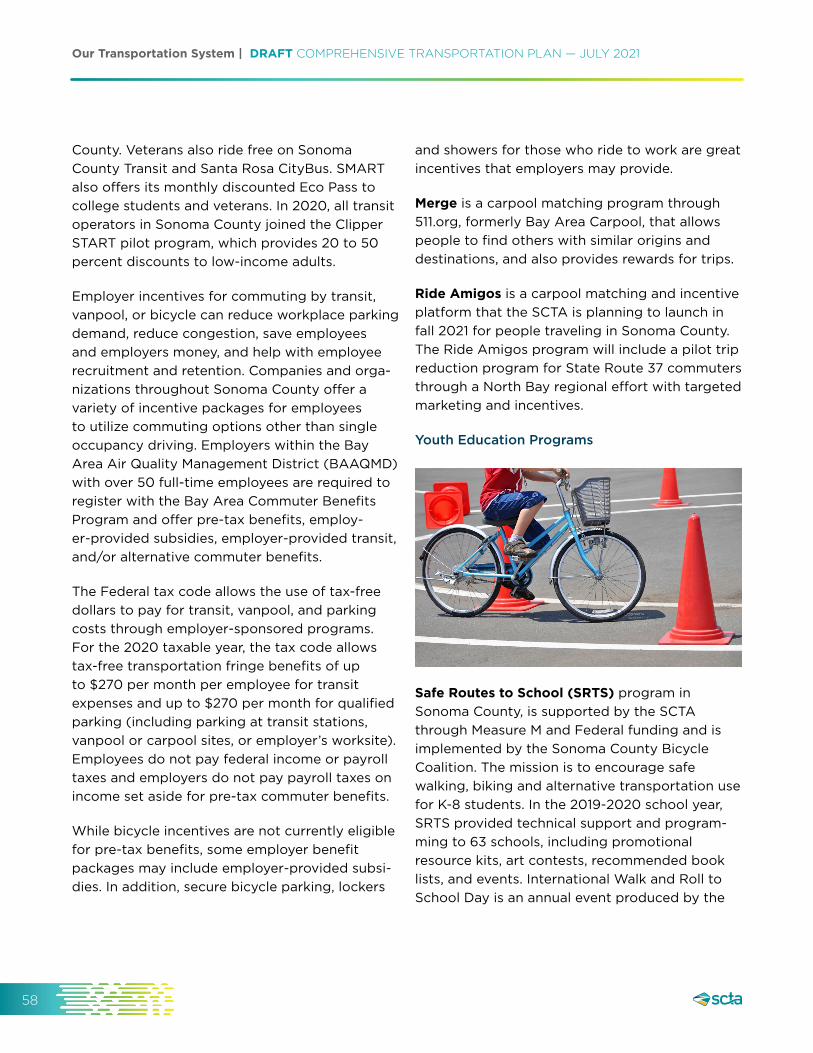
58
Our Transportation System | DRAFT COMPREHENSIVE TRANSPORTATION PLAN — JULY 2021
County. Veterans also ride free on Sonoma
County Transit and Santa Rosa CityBus. SMART
also offers its monthly discounted Eco Pass to
college students and veterans. In 2020, all transit
operators in Sonoma County joined the Clipper
START pilot program, which provides 20 to 50
percent discounts to low-income adults.
Employer incentives for commuting by transit,
vanpool, or bicycle can reduce workplace parking
demand, reduce congestion, save employees
and employers money, and help with employee
recruitment and retention. Companies and orga-
nizations throughout Sonoma County offer a
variety of incentive packages for employees
to utilize commuting options other than single
occupancy driving. Employers within the Bay
Area Air Quality Management District (BAAQMD)
with over 50 full-time employees are required to
register with the Bay Area Commuter Benefts
Program and offer pre-tax benefts, employ-
er-provided subsidies, employer-provided transit,
and/or alternative commuter benefts.
The Federal tax code allows the use of tax-free
dollars to pay for transit, vanpool, and parking
costs through employer-sponsored programs.
For the 2020 taxable year, the tax code allows
tax-free transportation fringe benefts of up
to $270 per month per employee for transit
expenses and up to $270 per month for qualifed
parking (including parking at transit stations,
vanpool or carpool sites, or employer’s worksite).
Employees do not pay federal income or payroll
taxes and employers do not pay payroll taxes on
income set aside for pre-tax commuter benefts.
While bicycle incentives are not currently eligible
for pre-tax benefts, some employer beneft
packages may include employer-provided subsi-
dies. In addition, secure bicycle parking, lockers
and showers for those who ride to work are great
incentives that employers may provide.
Merge is a carpool matching program through
511.org, formerly Bay Area Carpool, that allows
people to fnd others with similar origins and
destinations, and also provides rewards for trips.
Ride Amigos is a carpool matching and incentive
platform that the SCTA is planning to launch in
fall 2021 for people traveling in Sonoma County.
The Ride Amigos program will include a pilot trip
reduction program for State Route 37 commuters
through a North Bay regional effort with targeted
marketing and incentives.
Youth Education Programs
Safe Routes to School (SRTS) program in
Sonoma County, is supported by the SCTA
through Measure M and Federal funding and is
implemented by the Sonoma County Bicycle
Coalition. The mission is to encourage safe
walking, biking and alternative transportation use
for K-8 students. In the 2019-2020 school year,
SRTS provided technical support and program-
ming to 63 schools, including promotional
resource kits, art contests, recommended book
lists, and events. International Walk and Roll to
School Day is an annual event produced by the

59
DRAFT COMPREHENSIVE TRANSPORTATION PLAN — JULY 2021 | Our Transportation System
SRTS Program that takes place in October, which
encourages and educates students to safely
walk and bike to and from school, and educates
parents, school offcials, and staff about the
benefts of walking and biking to school. In 2007,
2129 students participated in the Sonoma County
event, and in 2019, 7689 students participated,
an increase of nearly 260%!
Utilizing the knowledge and skills of the Sonoma
County Bicycle Coalition, the SRTS program
also hosts bicycle and pedestrian safety classes,
including on-bicycle “Rodeos” where kids and
families are taught how to safely ride their bicy-
cles on streets. In a typical school year, close to
20,000 Sonoma County students are reached
with SRTS encouragement and/or education
programming or events. SRTS programs are
designed to combat the dramatic drop, in the
past generation, of the number of children who
walk and bicycle to school. In 1969, nearly 50
percent of all children in the United States (and
nearly 90 percent of those within a mile of
school) walked or bicycled to school. Today, that
number has plummeted to fewer than 15 percent.
During the morning commute, driving to school
represents 10-14 percent of traffc on the road.
Eco2School is a high school program, led by
the Petaluma-based non-proft, Daily Acts, that
provides students the opportunity to learn about
and tackle climate issues through self-led proj-
ects. Cleaner and safer transportation has often
become a focus for students and has led proj-
ects such as walkability audits, pathway creation
and carpool programs. To continue the growth
of students’ innovation regarding transportation
and climate, Eco2School provides scholarships
and partners with Spare the Air Youth (STAY)
to support students with micro-grants and Bay
Area wide conferences like the YES conference,
which engages students throughout the Bay
Area. Currently the program works with students
in 16 of the 19 public high schools in Sonoma
County and eventually plans to work with all
19. Throughout the school year 2018-2019,
Eco2School hosted youth leadership training
with 272 students, supported encouragement
activities for shared transportation that reached
15,062 students in Sonoma County and as a
result 18.2 fewer tons of CO2 were emitted.
College programs include subsidies for bus
transit trips as well as education and encourage-
ment. Both Sonoma State University (SSU) and
Santa Rosa Junior College (SRJC) contribute
to the free rides for college students program
and actively work to engage students on trans-
portation options available within the county.
SRJC offers a carpool parking permit program
which reduces the cost of a parking permit
when purchased as a carpool group. SSU runs a
low-cost bike rental program that allows students
to rent a bicycle for a semester with the goal
of encouraging bicycle usage throughout and
around campus.
Both SSU and SRJC host transportation fairs
where various transportation operators and
community-based organizations share infor-
mation about commuting options for students.
Encouragement to engage in greener transpor-
tation options also occurs at on campus Earth
Day and Bike to Work Day events, and the annual
Climate Action Night at the SRJC.
Complementary Programs
Emergency Ride Home provides a safety net
for anyone who works in Sonoma County and
uses an alternative transportation option, such
as carpooling, vanpooling, public transit, bicy-
cling, or walking to get to work. The program will

60
Our Transportation System | DRAFT COMPREHENSIVE TRANSPORTATION PLAN — JULY 2021
reimburse rides home in a taxi, TNC (e.g., Uber/ piloted in the City of Healdsburg from 2018 to
Lyft), or other transit, in cases of a qualifying
emergency.
Sonoma County Bicycle Coalition is an active
non-proft that advocates and supports safe
bicycle riding through various programs avail-
able for all ages. These programs include the
Safe Routes to School program, Street Skills
classes, bicycle repair classes and bike valeting at
local events. SCBC also engages with the public
through educational rides like the SebastoPedal
and the Pool Noodle Ride and a women cycling
group: Biker Chicks. The Coalition also began
Bike Happy Hours, for people to connect and
engage with one another through cycling,
another friendly way to be exposed to the trans-
portation form.
GoSonoma.org provides a one-stop-shop for all
things mobility within Sonoma County. Resources
for bicycling, walking, carpooling, and using
transit are compiled within this website to make
planning transportation around the county easier.
It also provides links to various resources that will
allow for following through with transportation
forms like signing up for a vanpool.
511.org, SF Bay is a phone and web resource for
transportation information, options, and tools.
511.org includes traffc, transit, carpool, vanpool,
and bicycling information for the entire San
Francisco Bay area.
Shared Micromobility programs provide access
to short-term bicycle, scooter, or other micro-
mobility, rentals in public locations. Bike share
and scooter share are often used for short trips
between key destinations, trips between transit
hubs and work or school, tourism and recreation.
The frst bike share program in the county was
2020 with about 30 pedal bicycles.
Planning and development are underway for a bike share system of 300 shared electric assist bicycles (e-bikes) around and connecting to SMART stations in both Sonoma and Marin counties. This three-year pilot program is funded through a grant from the Metropolitan Transportation Commission (MTC) awarded jointly to SCTA and the Transportation Authority of Marin (TAM). Goals for the bike share pilot program include reducing the need for single-occupancy vehicle travel for short city-centered trips and through providing “frst and last mile” connections to transit. The pilot program will deploy shared e-bikes at hubs around SMART stations, major bus transit hubs, and key central locations in the cities of Santa Rosa, Rohnert Park, Cotati, Petaluma, Novato, San Rafael, and Larkspur.
Supportive Policies
Vision Zero is a countywide safety initiative
that aims to eliminate traffc injuries and deaths.
The project was launched in 2020 through a
partnership between the SCTA and the County
of Sonoma’s Department of Health Services. The
product will be a plan that focuses on action-
oriented strategies to reduce serious injuries
and fatalities caused by traffc collisions, and
improving health, quality of life, and economic
vitality, particularly for low-income and
disadvantaged communities. Traffc injuries and
deaths disproportionately impact bicyclists and
pedestrians; therefore, bicycle and pedestrian
safety improvements are a signifcant part of the
solution.
Parking management programs and policies can
make a huge impact on lowering GHG emissions
from the transportation system through compact
development, and they can help preserve open
space and agricultural land as our cities grow.

61
DRAFT COMPREHENSIVE TRANSPORTATION PLAN — JULY 2021 | Our Transportation System
GreenTRIP is a certifcation program through
TransForm that works with developers and
local jurisdictions to assess parking needs for
new multi-family or mixed-use developments.
The GreenTRIP program will analyze parking
demand based on factors such as building type
and size, geographic location and surrounding
land uses, available transportation options, and
will recommend appropriate parking levels along
with vehicle trip reduction programs for local
approval. With the reduction of required parking,
new multi-family developments can offer more
units which benefts the housing defcit present
within the county.
Transportation Projects
One of the primary purposes of the CTP is to
review the existing system and identify the
transportation projects and programs that are
needed to maintain and enhance the trans-
portation system and make progress towards
the vision and goals of the CTP. The CTP 2050
recommends advancing projects identifed by
local jurisdictions and transit operators, as well as
by voters through the 2004 Measure M and 2020
Go Sonoma sales tax measures and the public
outreach process of identifying transportation
needs.
Local jurisdictions are responsible for most of
the transportation infrastructure and recommend
projects from their capital improvement plans
for inclusion in the CTP. As part of this update,
projects from previous plans have been reviewed,
updated, or removed if they had been completed
and/or no longer being actively pursued. The
SCTA received project submissions for carry-over
and new projects from all Sonoma County cities,
the County, and local transit agencies.
Results of outreach, including that to
Disadvantaged Communities have been shared
with potential project sponsors (including the
SCTA) and are incorporated into the project list.
Summary of Projects
A summary of all projects submitted as part
of the CTP project list review and update is
provided in Table 3-X. For the entire list of trans-
portation projects see Appendix A-3. Included
projects cover a variety of different modes
of travel and are dispersed geographically
throughout the cities and the County. A number
of proposed projects are intended to address
transportation issues such as traffc congestion
or safety by expanding or improving the existing
infrastructure. Other projects focus on main-
taining the system.
TABLE 3-5. CTP PROJECT SUMMARY
25 year Total Project Costs
Project Type $M
Transit Improvements — Non Capital $4,220
Roadway Improvements (including maintenance)
$2,914
Transit Capital Projects $876
Bicycle and Pedestrian Facilities $846
Highway Improvements $785
Multimodal Streetscape Improvements $162
Intersection Improvements $123
ITS & New Technologies $80
Emission Reduction Technologies $6
Travel Demand Management $3
Total ($M) $10,015
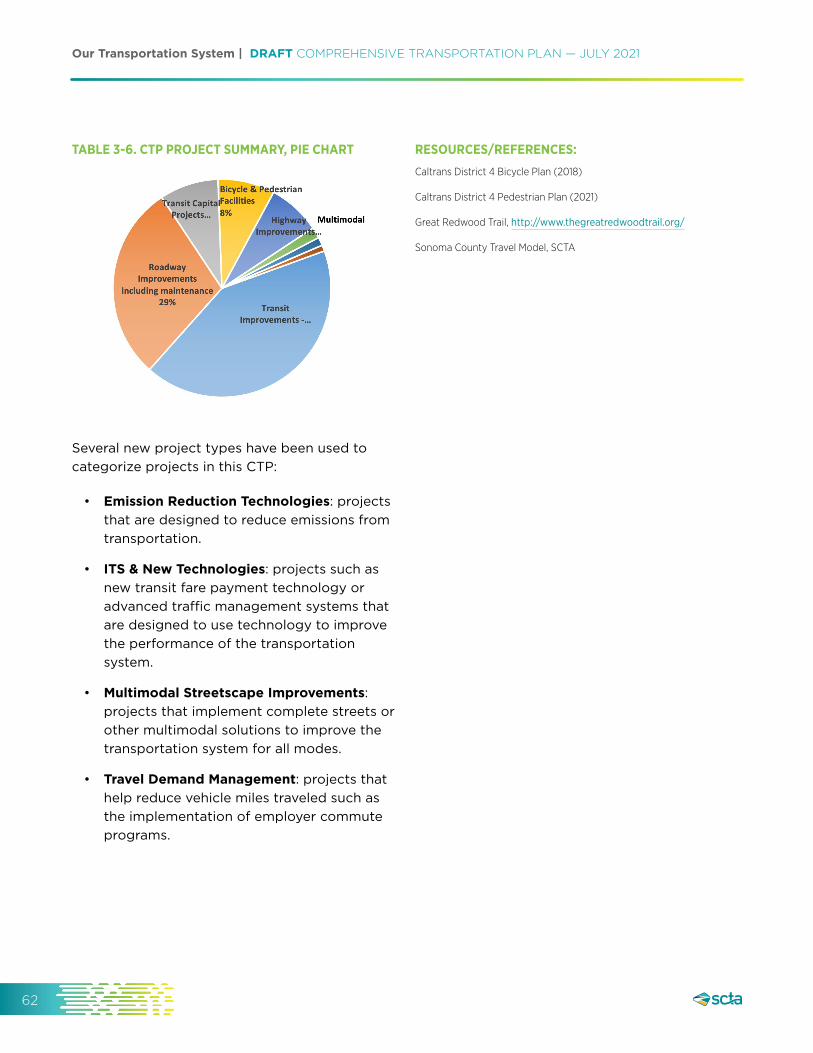
62
Our Transportation System | DRAFT COMPREHENSIVE TRANSPORTATION PLAN — JULY 2021
TABLE 3-6. CTP PROJECT SUMMARY, PIE CHART RESOURCES/REFERENCES:
Caltrans District 4 Bicycle Plan (2018)
Caltrans District 4 Pedestrian Plan (2021)
Great Redwood Trail, http://www.thegreatredwoodtrail.org/
Sonoma County Travel Model, SCTA
Several new project types have been used to
categorize projects in this CTP:
• Emission Reduction Technologies: projects
that are designed to reduce emissions from
transportation.
• ITS & New Technologies: projects such as
new transit fare payment technology or
advanced traffc management systems that
are designed to use technology to improve
the performance of the transportation
system.
• Multimodal Streetscape Improvements:
projects that implement complete streets or
other multimodal solutions to improve the
transportation system for all modes.
• Travel Demand Management: projects that
help reduce vehicle miles traveled such as
the implementation of employer commute
programs.

63
DRAFT COMPREHENSIVE TRANSPORTATION PLAN — JULY 2021 | Moving Forward, Meeting Our Goals
4.
MOVING FORWARD, MEETING OUR GOALS
There was a time the goals of the CTP
were limited to building or preserving
transportation infrastructure and transit
systems. Adequate funding was the
key to success, and the struggle.
Over time the goals of the CTP have been expanded to include issues caused by or solved by transpor-
tation. The goals for this CTP have been structured to consider a broader vision of the transportation
system that includes systemic change in travel behavior, transportation options and the consideration
of people in their environments as they relate to the transportation system. Sonoma County resi-
dents still want the basics of well designed, well maintained roads and buses, they also recognize the
importance of creating connections between people and places, improving safety and public health,
supporting thriving communities and places, and protecting our environment and climate.

64
Moving Forward, Meeting Our Goals | DRAFT COMPREHENSIVE TRANSPORTATION PLAN — JULY 2021
2050 VISION AND GOALS
VISION — CONNECTING PEOPLE AND PLACES AS WE TRANSITION OUR TRANSPORTATION NETWORK TO ZERO-EMISSIONS BY 2050.
Our guiding principles are to improve safety, equity, and quality of life.
Our transportation system should be:
GOAL 1 — CONNECTED AND RELIABLE
Deliver a seamless network that allows people to use a variety of transportation types easily, afordably and dependably.
GOAL 2 — SAFE AND WELL-MAINTAINED
Provide safe and well-maintained transportation infrastructure.
GOAL 3 — COMMUNITY ORIENTED AND PLACE-BASED
Implement place-based transportation projects, tailored to urban, suburban, and rural communities that will improve local mobility.
GOAL 4 — ZERO-EMISSIONS
Provide zero-emission transportation opportunities that meet diverse community needs, improve health and enhance quality of life.
ASSESSING PERFORMANCE OF THE PROJECT LIST
The list of transportation projects in this plan is a combination of existing needs, yet to be funded,
and new projects, programs or strategies, many of which were discussed in Chapter 3 of this plan.
An evaluation was done to determine how well the goals would be met if SCTA were able to fund
the entire list of projects. To do that, a list of performance measures was developed to be used to
evaluate the performance of the CTP in broad terms. Performance was modeled for the system as a
whole, not on a project level basis. Individual projects are analyzed through the CEQA/NEPA process
as part of the project development.
Quantifable Metrics
Performance measures were identifed that relate to each of the CTP goals, and as is shown in Figure
4-1, many of these metrics can be applied to several of the goals.

65
DRAFT COMPREHENSIVE TRANSPORTATION PLAN — JULY 2021 | Moving Forward, Meeting Our Goals
TABLE 4-1. EXAMPLE OF METRICS FOR QUANTITATIVE GOALS
Performance Measure Connected & Safe and Reliable Well-Maintained
Community Oriented and Place-Based
Zero Emissions
System Condition and Safety
Pavement Condition Index x
Transit Vehicle Revenue Hours x x
Collision Rates x
Travel Efciency
Person Hours of Delay x
Peak Period Travel Time x
Travel Time x x
Transit Use and Active Transportation
Mode Share (Non-motorized) x x
Bicycle Facilities - Miles x x x
Transit Revenue Hours x x
Transit Ridership/Capita x x
Equity and the Environment
Average Household Travel Costs x
GHG Emissions x
VMT x x
VMT/capita x x
VMT/job x x
CTP performance measures are based on industry best practices and performance measures used
in previous plans and other plans in the region. More detailed information on the performance eval-
uation, which compares existing conditions to future conditions under the 2050 CTP, is included in
Appendix X — CTP 2050 Performance Results.
Setting the context
All forecasts and future estimates are compared to a baseline year of 2015, which represents the
most recent travel model validation year. Where available, more recent data from the Sonoma

66
Moving Forward, Meeting Our Goals | DRAFT COMPREHENSIVE TRANSPORTATION PLAN — JULY 2021
County Travel Behavior Study and other sources
were used to understand how conditions have
changed since 2015.
Travel model validation is the process used to ensure that the model adequately represents actual travel behavior and conditions. As part of the model validation process, model results are compared to real world travel data such as trafc counts, transit ridership, travel behavior data, and other data sources. The model is revised as necessary until it is able to adequately represent actual travel conditions.
The CTP scenario assumes that by 2050 all CTP
projects are funded and constructed or imple-
mented. Population and employment growth
are assumed to occur as currently directed in
local general plans and more detailed area and
specifc plans and travel behavior stays the same
as it is today for this analysis.
• High level analysis: The CTP has focused on
evaluating system-wide or regional trans-
portation performance. Individual projects
have fractional impacts on the system and
are measured as an entire suite of projects.
Detailed analysis is conducted for proj-
ects as they are developed. Projects will be
required to conduct appropriate environ-
mental and equity analyses before they are
implemented. The level of detail and type of
analysis required is tied to the project type
and size. Specifc funding sources may also
have analysis requirements.
• Local agencies are planning for continued
population and employment growth:
Sonoma County is expected to continue to
grow in the future, and local jurisdictions
are planning for this growth in their general
plans and other local planning documents.
Regional forecasts predict growth of over
30,000 additional households and 30,000
additional jobs in Sonoma County through
2050. Local general plans and other plan-
ning documents which guide future growth
estimate growth capacity for over 40,000
additional housing units and over 100,000
additional jobs at plan buildout. Growth
will signifcantly increase travel demand as
more and more people use roads, trails, and
the transit system. More effcient growth
patterns, improved vehicle and transporta-
tion technologies, and project benefts will
mitigate some future travel related impacts.
• The Sonoma County transportation system
is relatively mature: Proposed changes to
the Sonoma County transportation system
are relatively minor and represent only a
fraction of the total scope and value of
the overall system. Because the county-
wide transportation system is largely built
out and mature, capital projects have a
limited impact on countywide performance.
Many of the proposed capital projects and
programs included in the CTP are focused on
improving local, or corridor, transportation
and circulation, and not on improving the
regional transportation system as a whole.
• Existing development patterns are the
primary factors infuencing countywide
travel patterns and conditions: The county
is expected to continue to grow, but the
countywide development pattern is rela-
tively mature, and growth is constrained
and guided by urban growth and city-cen-
tered growth mechanisms and policies. The
location of existing population centers and
employment locations determines where
and how far people travel. Growth and
changes to the transportation system or

67
DRAFT COMPREHENSIVE TRANSPORTATION PLAN — JULY 2021 | Moving Forward, Meeting Our Goals
policies will have some infuence on this, but
the existing development pattern and travel
patterns are largely determined by existing
development.
• Travel demand model limitations: The
Sonoma County Travel Model, which has
been used to analyze performance, is able
to represent and analyze certain types of
projects and policies well but is limited in
how it is able to capture or represent the
benefts of many programmatic and policy
improvements. Large capital improvements,
signifcant shifts in development patterns,
changing vehicle effciencies and fuel econ-
omies, and pricing policies are represented
relatively well in the travel model and
off-model post processing tools. It is diff-
cult to represent and capture the benefts of
many types of projects and improvements
included in the plan using the tools available.
These include smaller local projects (such as
most bicycle and pedestrian projects), trans-
portation projects (such as the countywide
Vision Zero safety initiative), drastic changes
in travel behavior or technologies, and many
transportation policies.
• Financial constraints: The performance anal-
ysis has focused on all projects included in
the comprehensive transportation plan. Many
of these projects do not currently have iden-
tifed funding sources. Additional funding will
need to be secured to implement many of
the projects included in the CTP.
PERFORMANCE RESULTS — CTP 2050
The performance assessment results indicate that
some progress is trending in the right direction
from 2015 into the future. These positive trends
are:
• Improved transit service coverage and
transit ridership: Both coverage/availability
and use of the transit system increase:
» Transit vehicle revenue hours (transit
availability) increase from 760 hours to
1365 hours.
» Transit ridership increases from 16,000
riders/day to 21,000 riders/day.
» Transit ridership/capita increases from
11.75 rides/year to 12.25 rides/year
• Expanded bicycle and pedestrian system
and connectivity: Local plans prioritize
“city-centered” growth and walkable/bike-
able communities. Average trip lengths
are predicted to be lower. The non-motor-
ized transportation network is planned to
expand.
» Bicycle/pedestrian facility mileage
planned to increase from 208 miles to
1066 miles.
• Shorter travel times and trips, or better
access to employment and destinations:
Travel times and trip lengths are expected to
get shorter in the future due to more eff-
cient planned development in general plans
and other local planning documents.
» Average travel time predicted to
decrease from 14.43 minutes per trip to
14.01 minutes per trip. Average travel time
for work trips predicted to decrease from
22.13 minutes per trip to 21.27 minutes
per trip.
» Average trip length predicted to
decrease from 8.12 miles per trip to 7.84
per trip. Average trip length for work
trips predicted to decrease from 13.83
miles per trip to 13.28 miles per trip.

68
Moving Forward, Meeting Our Goals | DRAFT COMPREHENSIVE TRANSPORTATION PLAN — JULY 2021
• Lower household travel costs: The average
percentage of household budgets spent
on transportation is projected to go down
slightly due mostly to more effcient future
travel patterns and lower average trip
lengths.
» Average percentage of household income
spent on transportation predicted to
decrease from 22.1% to 21.6%
• Vehicle miles traveled and GHG emissions
trend downward on a per capita basis:
Though total VMT is expected to increase,
VMT per person, and total greenhouse gas
emissions and GHG/capita are expected to
decrease due to more effcient development
patterns, CTP projects, and vehicle fuel eff-
ciency improvements:
» VMT/capita predicted to decrease from
28.69 to 27.65
» Total GHG emissions (CO2E) predicted to
decrease from 2,600,000 to 1,750,000.
» GHG/capita predicted to decrease from
5.27 to 2.85
The assessment highlighted a number of other
challenges such as:
• Continued reliance on automobiles: Travel
is expected to continue to be focused on
the automobile. Increased walking, biking,
and transit use is expected to be offset by
increased driving.
» The percentage of trips made using
non-auto modes (8.5% of all trips) is
predicted to stay the same in the future.
• Increased traffc congestion and delay:
Population and employment growth is
expected to cause increased congestion in
the future.
» Daily hours lost due to congestion
expected to increase by roughly 1/3 in
the future.
» Hours lost due to congestion for each
person each month is predicted to
increase from 1.4 hours to 1.7 hours.
• Signifcant maintenance needs and funding
shortfalls: Countywide pavement condi-
tion is in the “at risk” category and transit
providers are facing historic budget short-
falls due to the 2020 pandemic. Much of
the CTP project list is currently unfunded.
Additional funding will be required to
improve pavement condition, maintain and
improve transit service, and implement
important transportation projects and
programs.
• No improvement to countywide traffc
safety or reduction in collision rates: If no
specifc safety measures are taken, daily
crashes are expected to increase in Sonoma
County. CTP analysis tools are not able to
capture the safety benefts of the many
safety projects included in the CTP project
lists and that are being developed as part of
the countywide Vision Zero project.
» Daily crashes expected to increase from
6.4 to 7.6 in the absence of specifc
safety measures and policies. The
countywide Vision Zero project and
many other local projects are specifcally
intended to improve safety in Sonoma
County.
More detail on the CTP evaluation process is
shown in Appendix A-4.1. It is important to
emphasize that this is a system-level evaluation
and that many CTP projects, programs, or poli-
cies are diffcult or impossible to analyze using
the data and tools available.

69
DRAFT COMPREHENSIVE TRANSPORTATION PLAN — JULY 2021 | Moving Forward, Meeting Our Goals
REACHING FURTHER — TESTING A FUTURE “VISION”
The CTP performance evaluation demonstrated
some positive trends towards achieving the plan
goals and objectives but continued to show a
lack of progress in a number of areas. A broad
list of innovative transportation projects and
policies were evaluated in the 2016 CTP which
demonstrated the potential to help make prog-
ress in some of these areas. Transportation
pricing policies including use based and other
fees have been analyzed by SCTA, MTC, and
other organizations. Pricing policies can provide
trip reduction and congestion relief beneft but
can also have signifcant impacts on household
travel costs and equity. Any pricing policies
implemented in the future should be considered
carefully to ensure that any negative impacts are
mitigated. Recommendations included securing
sustainable funding sources, continuing the
focus on improving land use and transportation
connections, increasing effciencies in vehi-
cles and fuels, and implementing technological
improvements. This analysis was re-implemented
in 2020 using current tools and data and the
results are consistent with previous analysis.
The results of this vision policy assessment
indicated that a variety of different policy
approaches, advancements in technology, and
changes in travel behavior will be necessary to
address the goals, objectives, and performance
targets that have been identifed in the CTP.
These are summarized below:
• Make equity a part of every decision-making
process
• Secure additional funding for roads, high-
ways, and transit in order to repair and
maintain the existing road and transit
systems.
• Secure additional transit funding to pay for
transit expansion and to improve transit
service headways and coverage.
• Secure funds to build transportation proj-
ects to reduce congestion, emissions,
improve health and safety, and to improve
the economy.
• Continue to emphasize city-centered
growth.
• Implement trip reduction strategies.
• Fill vacant capacity on the transit system by
making transit more convenient, less expen-
sive, faster, and more attractive.
• Shift trips from single occupant vehicles to
pedestrian or bike travel.
• Implement system effciency improvements.
• Improve the average vehicle feet fuel
economy.
• Implement Vision Zero safety policies.
• Build neighborhood projects to enhance
mobility and provide access.
• Plan for population and employment
city-centered, maintain jobs-housing
balance with neighboring counties.
• Investigate and implement equitable pricing
strategies.

Moving Forward, Meeting Our Goals | DRAFT COMPREHENSIVE TRANSPORTATION PLAN — JULY 2021
FIGURE 4-1. ACHIEVING OUR GOALS
70

A-1.
DRAFT COMPREHENSIVE TRANSPORTATION PLAN — JULY 2021 | Appendices
APPENDICES
Appendix 1.1 Community Voices. . . . . . . . . . . . . . . . . . . . . . . . . . . . . . A-3
Appendix 1.2 CBO Engagement. . . . . . . . . . . . . . . . . . . . . . . . . . . . . . . A-11
Appendix 1.3 CBTPs (2007–2010) Review.. . . . . . . . . . . . . . . . A-34
Appendix 2 Travel Model Overview .. . . . . . . . . . . . . . . . . . . . . . . A-45
Appendix 3 Project List . . . . . . . . . . . . . . . . . . . . . . . . . . . . . . . . . . . . . . . . A-50
Appendix 4.1 Performance Results . . . . . . . . . . . . . . . . . . . . . . . . . . . A-105
Appendix 4.2 Zero Emissions by 2020 .. . . . . . . . . . . . . . . . . . . . . A-108
Appendix 4.3 Funding Overview . . . . . . . . . . . . . . . . . . . . . . . . . . . . . . A-114


A-3.
DRAFT COMPREHENSIVE TRANSPORTATION PLAN — JULY 2021 | Appendices
A-1.1.. Community. Voices
Community input plays a key role in developing a
successful comprehensive transportation plan. In
order to develop the Moving Forward 2050 plan,
the SCTA team developed numerous opportuni-
ties to gather community feedback and discuss
transportation needs with residents and local
interest groups.
In designing outreach, the goals were to:
• Provide multiple channels for a broad
number of communities and stakeholders
to share input on transportation needs and
potential projects to be included in the plan.
• Work towards broad consensus as to what
the problems are related to transportation
and transit in disadvantaged communities and
what the best solutions to these problems are.
• Involve residents and community orga-
nizations in analyzing and shaping the
recommendations in the plan.
The outreach for the Moving Forward 2050
builds off of a history of developing Community-
Based Transportation Plans (CBTPs) in Sonoma
County. As part of the outreach planning, there
were several communities highlighted for addi-
tional outreach:
• Latinos
• Seniors
• Families
• Indigenous communities
• Recent immigrants
• Youth
• Other low income and disadvantaged
communities
ACTIVITIES
Outreach for the plan began with a transporta-
tion needs assessment. This assessment helps
to clarify existing transportation conditions in
communities, including the most important prob-
lems and needs. The frst events were a series of
community listening sessions where feedback
was solicited from a number of the communities
highlighted for additional outreach.
Steering Committee for Under-represented Community Outreach
SCTA staff convened the CBTP Steering
Committee at the end of Outreach Phase 1 on
October 3, 2019 in order to discuss the full
summary and survey analysis. The steering
committee is comprised of representatives from
the local CBOs we contracted to help develop
and implement our outreach to Sonoma County
communities who have been systemically disad-
vantaged. The members are:
• Susan Garcia, Center for Well-Being
• Vince Harper, Community Action Partnership
• Xulio Soriano, North Bay Organizing Partnership
• Renee Tolliver, Council on Aging
The committee reviewed the draft outreach
summary and discussed framing, terminology
and whether any major points were missing. Staff
led the committee in reviewing the summary and
found broad agreement for each of the summa-
rized points, with two additions. The committee
discussed using the term “indigenous communi-
ties” instead of “native american tribes” because
it takes into account indigenous peoples from

A-4
Appendices | DRAFT COMPREHENSIVE TRANSPORTATION PLAN — JULY 2021
central and south America who have relocated to
Sonoma County.
The committee also recommended adding a new
point that summarizes comments about the lack
of regional public transit routes between coun-
ties. The committee members agreed that many
participants complained that there were few
public transit options to travel to neighboring
counties or move between communities off of
the Highway 101 corridor.
Listening Session with under-represented communities
The team held 12 meetings across Sonoma County
with 110 attendees. Staff has worked together
with four CBOs to gather feedback directly from
under-represented communities: the Center for
Wellbeing, Community Action Partnership, the
Council on Aging and the North Bay Organizing
Project. To follow is a summary, for more details
about the CBO engagement see Appendix A-1.2.
Themes
The in-person listening sessions and online
survey responses covered a wide-ranging
number of issues and possible solutions. The
main issues are categorized within the trans-
portation issues explored during the listening
sessions and online survey:
Cost
Transit should be free for everyone or made
available at a reduced cost for youth and elderly
— A number of responses addressed the need for
reducing the cost of transit by either making transit
free for all or providing signifcant discounts for
youth and older adults. Many responses also noted
that the SMART train is too expensive.
“Public transportation is key to environ-
mental protection and to reducing the cost
of living that is endangering our economy.”
“We depend on convenience when we
transport ourselves and others to our
destinations. The facts are that when I
have to wait over an hour for a SMART
train, instead I drive. I have to walk a
mile with luggage or take Uber from the
SMART train airport stop to the Santa
Rosa Airport, thus I drive.”
Time
Round trip transit trips take too much time
— Many respondents said they declined to use
transit because the trip time was not competitive
with driving.
“Buses do not run frequently and are
therefore useless unless one has no other
option. I’d call Uber before I’d wait an
hour for a bus or 1.5 hours for the train.”
Elderly do not have enough stamina to be out
of the house long enough to take transit — Many
older adults responded that taking transit or
paratransit required multiple trips that would
require them to time their medication and
be out of the house for longer than they felt
comfortable.
Most everyone uses a car and gets stuck in traffc
because there are few other options — Many
respondents felt that private automobiles were
the only logical choice for making their trips, while
also complaining that many roads and inter-
sections were unsafe and congested due to the
number of other people driving private vehicles.
Maintenance
Potholes are an issue and damage cars — A
number of respondents complained about
damage to their cars and the diffculty of biking
due to the state of the roads.
Sidewalks and streets need to be better main-
tained for walking and biking — Many responses

A-5.
DRAFT COMPREHENSIVE TRANSPORTATION PLAN — JULY 2021 | Appendices
pointed out specifc roads or sections of a trip projects or programs, such as new scooter share
where a sidewalk was missing. They also pointed
out areas where the road was too narrow to
safely accommodate both cars and cyclists.
Accessibility
Bus drivers don’t speak Spanish — Many
Spanish-speakers expressed having a diffcult
time with bus drivers who did not speak Spanish.
Many of them felt the drivers grew frustrated
when they couldn’t communicate.
“There is a signifcant need for Spanish-
speaking bus drivers. All bus drivers
should be bilingual and the receptionist
at bus station terminals should be bilin-
gual at all times.”
Other transportation information only in English
— A number of Spanish speakers expressed hesi-
tancy about using transit and there was rarely and
information in Spanish on using the transit system.
Safety
Not enough space on streets reserved for bikes
— Many respondents suggested that separated
bicycle lanes or paths be constructed to make
cyclists feel safer.
“Bicycle lanes should be separated from
traffc. The local plan for most bicycle lanes
is horrifc and accidents are unavoidable.”
Lack of lighting around bus stops and frequency
of service at night — Many transit riders
expressed fear of taking transit at night due to
unlit bus stops and long waits that exposed them
to cat-calls and unwanted attention.
Increased Investment
Perceived gap in transportation investments
compared to other communities — Many
participants highlighted a need to increase the
investment in the transportation system with new
or increased highway roadway capacity.
“To encourage more biking, walking,
skateboarding, make a program like they
have in LA, where you can rent a scooter
or bike and return it to any docking loca-
tion.” — Northeast Santa Rosa resident
Lack of regional public transit routes between
counties — Many participants complained that
there were few public transit options to travel to
neighboring counties or move between commu-
nities off of the Highway 101 corridor:
“Why is there no way to get from
Sonoma County to Amtrak, BART,
or Napa? We need better region- al
support and an East/West transit plan.
There is life beyond the 101 corridor.”
— Glen Ellen resident
SURVEY
The SCTA released a transportation needs survey
on July 31, 2019 and collected responses through
May 1, 2020 for this summary. Staff collected
responses online, through a Placespeak engage-
ment page as well as through links to the identical
survey shared through Typeform. The online
survey was available in English and Spanish.
Staff also collected survey results at the 12
listening sessions hosted by community-based
organizations throughout Sonoma County.
Participants completed the paper surveys in
either English or Spanish. Meeting facilitators
aided with completing the surveys as needed.
In total, over 600 responses were received for
the Transportation Needs Survey. The results are
summarized below:

A-6
Appendices | DRAFT COMPREHENSIVE TRANSPORTATION PLAN — JULY 2021

A-7.
DRAFT COMPREHENSIVE TRANSPORTATION PLAN — JULY 2021 | Appendices

A-8
Appendices | DRAFT COMPREHENSIVE TRANSPORTATION PLAN — JULY 2021
PUBLIC MEETINGS
In the Fall and Winter of 2019, SCTA staff hosted
public listening sessions to collect additional
in-person information and engage with the public
on the CTP. Staff held the meetings during the
early evenings at public libraries and coordinated
with community groups to promote the events.
• Santa Rosa, 11/6/19
• Petaluma, 12/4/19
• Sonoma, 12/11/19
• Windsor, 12/16/19
Themes
Concern about ability to bike and walk as a form
of transportation
Many attendees were interested in biking or
walking more, but had concerns about safety and
the usefulness of existing accommodations.
“Bicycling and pedestrian safety
is a major issue as drivers don’t
pay attention to pedestrians.”
— Petaluma Resident
“It’s not safe to bike or walk under
the freeway, especially for kids and
when it’s dark. Particularly where cars
turn left off of southbound offramp.”
— Windsor resident
“Need to connect bike trails to
where you actually want to go.”
— Sonoma resident
Transit is not an accessible solution for most
people
Many attendees were interested in using public
transit more, but believed it would be hard to
replace car trips with transit trips.

A-9.
DRAFT COMPREHENSIVE TRANSPORTATION PLAN — JULY 2021 | Appendices
“Have never taken the bus, but would
consider if it ran more frequently.”
— Sonoma resident
“People are so used to using their
cars that they aren’t aware of transit.”
— Petaluma Resident
Concern about adapting our transportation
system to changing conditions
Many attendees expressed concerns about
impacts to the transportation system due to
climate change.
“It’s only getting warmer, we have
to fgure out how to support active
transportation with greater heat.”
— Windsor resident
“During the evacuation it took
two hours to leave town.”
— Windsor resident
Need to continue improving road conditions
Many attendees expressed the need to continue
improving road condition.
“Petaluma has the worst roads in the
county and this slows people down.”
— Petaluma resident
“The quality of the roads goes
down around harvest season.”
— Windsor resident
Webinars
The team hosted a series of informative webinars
developed for local staff, elected representatives
and engaged members of the public. Staff devel-
oped webinars that unpack the CTP process and
explain the work done at the SCTA. The webinars
also provided a next step in public engagement
from the transportation needs assessment.
• 10/23/19 — Sonoma County’s Travel Model
• 12/10/19 — Potholes and Pavement
• 1/22/20 — Vision Zero, Making Streets Safer
• 2/27/20 — Future of Public Transit in
Sonoma County
• 4/29/20 — A Future With Less Driving
Presentations are available at scta.ca.gov/2050
Other Meeting
Presentations were made to a number of service
clubs and advocacy organizations including the
Cloverdale Rotary (9/7/2019) and the Sonoma
County Land Use Coalition (7/8/2020).
Partner Outreach
A number of partner organizations have
conducted outreach on issues related to trans-
portation over the same time period. The
conclusions of this outreach will be included in
the fnal draft of the Moving Forward 2050 Plan.
Initial summaries of the outreach are presented
below:
Vision Zero
The SCTA is currently collaborating with the
Sonoma County Department of Health Services
on the Vision Zero project that will focus on
action-oriented strategies to reduce serious
injuries and fatalities caused by traffc colli-
sions. The Vision Zero team launched a survey in
August 2020 and published preliminary results in
November 2020 that included information on the
top barriers to walking and biking more:

A-10
Appendices | DRAFT COMPREHENSIVE TRANSPORTATION PLAN — JULY 2021
What are the barriers that prevent you from walking or biking more?
Count
Driving is more practical because I have too many things to carry, multiple stops to make, and/or children who need to travel with me
351
I live too far from the places I need to go 296
I do not feel safe and I worry about getting hit by a vehicle
251
The sidewalks/bike lanes along my route are missing or in poor condition
227
Walking and biking take longer and I do not have the time
98
I do not want to arrive to my destination sweaty, or there are no shower facilities at my work
66
I am concered about harrassment/violence from strangers or the police
43
My bike is not working or I do not have a bike 37
I am physically unable to walk or bike 23
I do not like to walk or bike 10
Go Sonoma polling
The SCTA conducted a statistically valid poll
in October 2019 that measured support for a
number of urgent issues in the following order:
• Repair potholes — 83%
• Reduce traffc congestion on local roads and
highways — 76%
• Make local roads and highways safer — 75%
• Improve evacuation and emergency road
access — 74%
• Enhance transportation for seniors, veterans
and people with disabilities — 73%
• Make walking and biking safer — 71%
• Reduce GHG emissions — 69%

A 11.
DRAFT COMPREHENSIVE TRANSPORTATION PLAN — JULY 2021 | Appendices
-
A-1.2.. Community. Based. Organizations. (CBOs) Listening Sessions — Details
OVERVIEW
SCTA conducted the frst phase of outreach for
the Comprehensive Transportation Plan (CTP) in
July, August and September 2019. The focus was
on working with residents and community based
organizations (CBOs) to determine transporta-
tion needs in Sonoma County. MTC requested
that special effort is taken to reach community
members who are often under-represented — such
as seniors, youth, Latinos, recent immigrants, and
other low income or disadvantaged communities.
Staff has worked together with four CBOs to
gather feedback directly from under-repre-
sented communities: the Center for Wellbeing,
Community Action Partnership, the Council on
Aging and the North Bay Organizing Project. The
team held 12 meetings across Sonoma County
with 110 attendees. In addition, SCTA staff has
released a survey to gauge transportation needs,
with over 235 responses received to date.
Communities highlighted for additional outreach:
• Latinos
• Seniors
• Families
• Native American tribes
• Recent immigrants
• Youth
• Low income and disadvantaged
communities
Activities
SCTA staff and partner organizations held many
in-person meetings in order to solicit feed-
back directly from community members. These
include:
Events Location Date
Community Health Worker Meeting
Santa Rosa 7/18/2019
Roseland Community Building Initiative meeting
Roseland 7/25/2019
Youth Civic Engagement Project leadership team
Santa Rosa 7/25/2019
SCTA Citizen’s Advisory Committee
Santa Rosa 7/29/2019
Southwest Santa Rosa Health Action Chapter
Santa Rosa 8/7/2019
Chatino community — house meeting
Petaluma 8/10/2019
African American Community Leaders
Santa Rosa 8/15/2019
Council on Aging Santa Rosa 8/15/2019
Bayer Farm Potluck Santa Rosa 8/16/2019
Latino Service Providers Windsor 8/17/2019
Graton Day Labor Center Graton 8/20/2019
Petaluma Senior Café Petaluma 8/27/2019

A-12
Appendices | DRAFT COMPREHENSIVE TRANSPORTATION PLAN — JULY 2021
1 — COMMUNITY HEALTH WORKER MEETING
Date and time: 7/18/2019, 6:30pm–7:30pm
Location: 101 Brookwood Ave,
Santa Rosa, CA 95404
Facilitator: Susan Garcia, Center for Wellbeing
Attendees: 6
Typical daily trips for attendees:
• Mostly everyone uses a car as a mean of
transportation to get to work and get chil-
dren to school.
• Some of the participants have to take
alternative roads due to traffc or the roads
being too narrow. (Mooreland Neighborhood
Sited as one of these areas)
• Carpool helps a lot with getting to places
faster, especially during the morning around
7:00 AM.
• During the weekend and during holidays
there’s more traffc than the usual. It seems
as if everyone picks the same time to drive,
which is usually later in the evenings.
Transportation System Issues:
Needs better maintenance
• There’s a lot of maintenance that needs to
be done
• Roads are bad, which cause even more
traffc during the morning rush hour (7 to 9
am) and (3-5pm) when everyone tends to
go to work or get off work. Especially on
the roads around Burbank Avenue.
• There are a lot of traffc lights broken or
none at all where they are needed. One
specifc area would be here on College
Avenue, where there a lot of crosswalks for
pedestrians, but no actual warning lights for
them to cross, which often times causes cars
to brake hard and puts the lives in danger of
the actual pedestrians.
• Sidewalks in the areas of Corby and Barham
Avenue need a lot of maintenance.
Costs too much
• The cost of gas is high and when there is
traffc, the gas is used faster because we’re
driving slowly and making too many stops.
This makes the amount of money spent on
gas go up.
• Some of the participants have to drive more
than usual because they have to take alter-
native roads to avoid traffc. Sometimes
because the roads have no maintenance or
are too narrow.
• Everyone agrees that it costs too much to
use the transportation system.
Is not safe enough
• Safety is big concern especially in areas
where there are no crosswalk warning lights
or no signs signaling what’s ahead. The main
concern is their family’s safety especially on
the highway roads. One participant shared
about her experience with Highway 101 and
how there isn’t enough time to change lanes
because of the traffc or missing signs.
• There needs to be more patrolling or traffc
cameras in the West End Neighborhood.
One time a driver was stopped at a stop
sign and then the other driver pulled in front

A 13.
DRAFT COMPREHENSIVE TRANSPORTATION PLAN — JULY 2021 | Appendices
-
and started to make circles around them, it
made the driver feel very unsafe.
• The 101 Freeway exit Todd Road heading
south, where there is not actual stretch
of lane for cars to merge. Makes it so that
ongoing traffc heading south have to stop
abruptly.
• The Santa Rosa exit heading North where
both the intersection of Hwy 12 and North
101 meet to take the Santa Rosa Exit is
also very complicated as there have been
numerous almost accidents from having
to change lanes just to take the exit or to
merge on Hwy 101 North.
• Not enough lane space if you are using CA12
to get on to US101 North or US 101 South.
• The exit ramp heading to Sonoma Ave HWY
12 from US 101 North is also very terrible.
The person living in that corner house has
had numerous cars crash into her yard and
this person and her family are in fear of
their safety as there is no barrier between
her house and that exit ramp. They feel as
though the next time a car crashes it might
actually crash into their house.
• There needs to be more maintenance in
Roseland (South West Santa Rosa), espe-
cially on Corby Ave and Barham Avenue in
the Moorland Neighborhood.
• There are bus stops with no shade and
sometimes no place to sit while waiting.
• The sidewalks are often narrow or there is
no sidewalk at all.
• Recently, there have been many accidents
with the train so they consider it somewhat
dangerous.
• The bar will go down and then immediately
go up again. There are concerns about
possible accidents that this can cause since
it is unexpected. Drivers are unaware about
when exactly the train will be crossing.
• However, trains are good for feldtrips but
there needs to be more rules implemented
to make it safer.
• The sidewalks are small and the street signs
are old. There is a need for new signs.
• There are no lights to cross, which makes a
dangerous to cross the road.
• There are a lot of cars that will block
the driveway which makes it hard and
dangerous for people to cross the road.
• Perhaps there is a need for more parking
restrictions, so the sidewalks are not blocked
and cause blind spots for cars getting out of
a street or sidewalk. Also, more paint signs
on the roads will be benefcial.
• It’s dangerous to bike most of the time
because some roads are not wide enough.
Also, some bicyclists get really close to your
car which makes it dangerous when there is
traffc because it’s harder to switch lanes.
• Not enough space for bicycles.
• The area of by West Side in Healdsburg,
River Road and Guerneville Road have a lot
of bicyclists, but not enough road for both a
car and a bicyclist to ft. There are so many
curves and when motorists try to avoid the
bicyclists and can lead them into oncoming
traffc, which is very dangerous. We need
more bike signs.
• Rules for bicyclists need to be enforced.
A-14
Appendices | DRAFT COMPREHENSIVE TRANSPORTATION PLAN — JULY 2021
• Motorcycles don’t follow rules. Some motor-
cycles will drive past or next to drivers. It
will help if rules are also enforced.
• There needs to be more signs and wider
space for the bicycles.
• Freight trucks always cause traffc because
they are drive slow due to the weight
carrying.
• Freight trucks are dangerous and all the
participants make sure to be really aware
and paying attention while driving.
Takes too much time
• There is a bad timing on the train schedule
especially during traffc hours because it
causes even more delays.
• The train schedule also infuences the traffc
at both the morning traffc hours (7-9 am)
and the afternoon traffc hours (3 – 5 pm).
Many lanes get backed up when the train
crosses, which causes many people to be
late for work.
• Driving from Sonoma to Santa Rosa, trucks
will cause a lot of traffc because there is
only one road.
2 — ROSELAND COMMUNITY BUILDING INITIATIVE (CBI) RESIDENT LEADERS
Date and time: 7/25/2019, 10am–11:30am
Location: Roseland Village Neighborhood Center
Facilitator: Vince Harper, Community
Action Partnership
Attendees: 15 participants, 14 Female,
1 Male did not stay for discussion, 1
Female did not sign in, 13 Latino, 1 African
American, and 1 White (did not stay)
Description: Resident leadership group
meets weekly to improve conditions
in the Roseland Neighborhood.
Typical daily trips for attendees:
• Drives daily from Sebastopol to Roseland
every day. She drops her daughter to the
Adelante Program at SRJC. Drops off son
to Summer school, and CAMP. Drives to
different places to volunteer.
• Walks everywhere by herself or grandchil-
dren for pleasure/recreation, or to go to
appointments. Everything is very close so
she likes to walk places.
• Walks 5 blocks to take her daughter to the
Adelante Program at the SRJC, then she
walks to Andy’s park to do volunteer work.
She also takes her daughter to a youth
group at their church.
• Walks to Moorland or takes the Bus to do
volunteer work. She takes her daughter to
school either by walking or taking a personal
Uber (another participant gives her rides
when possible)

A 15.
DRAFT COMPREHENSIVE TRANSPORTATION PLAN — JULY 2021 | Appendices
-
• She likes to walk to church or go walk her
dogs, she drives to places she needs to go,
takes the bus, or rides her bike.
• Drives daughter to school and then drives to
the gym.
• Drives her car everywhere. She doesn’t like
to walk because she doesn’t feel safe (Too
many homeless people in the streets).
• Takes her son walking to soccer. (It’s a 30
minute walk)
• Drives everywhere, if her kids need rides,
she will take them.
• Drives mostly everywhere, unless if she
needs something from the store (it’s nearby
her house) she will walk there.
• Drives everywhere but when she lived in
Windsor she used to take the bus and that
would always be an hour wait, just for the
bus to get there.
Transportation System Issues:
Takes too much time (13)
• Buses at Moorland only go by like 3 times
a day (wait between times is long and
inconvenient).
• It takes all day to get around on the bus,
instead of just a couple of hours if you drive
your own car.
• Need more buses during the weekend
(Same times during the weekend like
weekdays)
• Bus schedules are a big issue because they
pass by every hour.
Cost too much (8)
• For big families it cost too much money.
A solution for that would be if they gave
discounts for multiple family members, or
reduced prices.
It’s not too safe (6)
• Buses are always running behind of schedule
so they are always rushing. Sometimes they
don’t allow you to get on with strollers, or
they start going before you even sit down. It
doesn’t feel like it’s suitable for adults with
kids.
• Need more Bicycle paths in Roseland.
It harms the environment (3)
• Need newer buses. Eco-Friendly.
Need to improve Maintenance (11)
• Cleanness of the buses or loitering at the
bus stops are problems.
• Smart Train — Need to allow enough time
for cars to stop because train passes by.
• More safety measures for smart train stops or
where the bus passes by. (Especially in Rohnert
Park) Example: Rails like in Santa Rosa
• Buses need more cushion for comfort.
• Some buses smell bad.
• Potholes on the street are damaging to the
vehicles. Drivers pay maintenance cost.
• Street/road lines need to be more visible,
especially when it rains.
• Seats on buses are worn out.
• Buses need a new paint job
• Be more clean
• Some buses are infested with bugs.
A-16
Appendices | DRAFT COMPREHENSIVE TRANSPORTATION PLAN — JULY 2021
3 — YOUTH CIVIC ENGAGEMENT PROJECT (YCEP)
Date and time: 7/25/2019, 5:15pm
Location: Community Action Partnership
of Sonoma County Offce
Facilitator: Vince Harper, Community
Action Partnership
Attendees: 7 participants (CAP sign-
sheet), 6 Female, 1 Male, 100% Latino, 2–18
year olds, 2–17 year olds, 3–15 year olds
Description: Youth leadership group focused
voter registration and civic education in
Sonoma County. Youth are high school
students between the ages of 15 and 18.
Typical daily trips for attendees:
• Person 1: Takes bus almost everywhere, to
school, clinic etc.
• Person 2: Drives everywhere. Misses people
driving her
• Driving is expensive
• Person 3: Walks
• Person 4: tries to take the bus even though
she has a car.
• Likes the bus but there are sketchy people
and they do sketchy things, walking to the
bus stop is hard on the Santa Rosa Ave
because it doesn’t feel safe due to cat calling.
• Person 5: Mom drives her and she likes
that because she gets to observe her
surroundings.
• Person 6 Drive herself, hates the responsi-
bility flling up car, has to focus on the road
and can’t look at her surroundings as much
• Person 7: Doesn’t drive yet, parents drive
him. Takes the bus to school. Three different
buses that pass
• Bus 12 drives through Roseland and the
roads are too narrow.
» Friendly bus driver
Transportation System Issues:
Cost too much (3)
• Gas is too expensive.
» Prices are going up.
• Cheaper to go walking.
• Insurance rates are expensive for teens.
Not Safe (6)
• Going to the mall on the bus in on safe.
• Transit mall downtown is a dangerous place.
• Too creepy on the bus.
• Mentally ill or drugged people on the bus.
• Some people are crazy driving “how did
they get a license?”
• Bike lanes too narrow on non-existent.
Too much time (7)
• The Bus doesn’t drop you off at exact
place- have to go walk blocks to get to your
destination.
• The bus can’t go as fast as car because they
are big and because they make stops.
» Traffc congestion adds to the wait.
• Waiting for the bus, sometimes it can be a
long wait.
» The bus might be on time, it might early
or late, there’s no way to know.

A 17.
DRAFT COMPREHENSIVE TRANSPORTATION PLAN — JULY 2021 | Appendices
-
• Time constraints- you can’t really plan
because bus routes are unreliable.
Harm environment (6)
• Exhaust/pollution put out by cars and buses.
• Asthma problems due to car exhaust.
• Buses release more gas emission affecting
climate change.
• Eco friendly buses are expensive.
Better maintenance (2)
• Trash on the side of the freeway/streets is a
problem.
• Upkeep on the buses- its dirty, the windows
are scratched.
• Roads are narrow/potholes.
• Paint in the roads is faded.
Solutions
• Promote carpooling.
» Cost-effcient
» Lower the cost of driving.
• Promote more people biking/ walking
• Make it harder for people to get their driver’s
license — in terms of reducing risky drivers.
• Cross guards not only for school.
• Fix sidewalks so people will walk more.
• Rent a scooter/bike to encourage not using
a car.
• “Walk and roll to school” campaign to
encourage students to walk, ride to school.
Students would get a ticket to enter a raffe
for a bike, you get a ticket by having walked
to school.
4 — SOUTHWEST SANTA ROSA HEALTH ACTION CHAPTER
Date and time: 8/7/2019, 10am–11am
Location: Community Action
Partnership of Sonoma County
Facilitator: Vince Harper, Community
Action Partnership
Attendees: 4 participants, 3 Female, 1 Male
Description: Chapter members include
government, nonproft, residents
focused on improving health indicators
for all Southwest area residents.
Typical daily trips for attendees:
• Car trip to work.
• Car trip to work and company vehicle to
meetings
• Biking for most destinations. Carpooling
is an option in case of rain or greater
distances.
Transportation System Issues:
Takes too much time (6)
• Traffc has increased since the fres
• There are some bus routes that are located
on Coddingtown and do not go to down-
town. Thus, it takes longer to get to a
destination
Needs better maintenance (3)
• There is a signifcant amount of road debris
• Some roads in Roseland have never been
swept. Recology holds the contract.

A-18
Appendices | DRAFT COMPREHENSIVE TRANSPORTATION PLAN — JULY 2021
• There are a lot of potholes throughout the
county
Is not safe enough
• There are bike lanes that are not safe due to
potholes or how they are designed
• There are distracted drivers that make the
road unsafe (i.e. using their phone)
• The transition for bicycles are not safe.
There are drivers that just go through the
bike lane
Harms the environment (1)
• Cars cause a lot of emissions
• Sebastopol Road is currently in the plans
to be widened. The purpose of widening
Sebastopol Road is for traffc to move
quickly.
• Roseland and Sebastopol road have the
highest asthma rates due to the pollution
created by diesel.
• There are several cars parked on Sebastopol
Road that are in an unsafe location near the
Roseland Village Shopping Center. The no
parking sign on the edge of the Roseland
Village Neighborhood Center has been
removed.
• There is a lot of traffc, which creates greater
emission and pollution.
Costs too much
• Attendees mentioned that there are certain
modes of transportation that are more
expensive
• Golden Gate Transit tends to be cheaper
than Smart Train
• Smart train stops are not convenient for
people
• Smart trains needs more stops
• Sonoma County monthly pass for an adult is
$62.50
Unsure about other options to get around (2)
• Figuring out the bus routes can be compli-
cated and confusing
Potential Solutions
• Digital display of bus routes with accurate
timing.
• Signing of next route displayed on each
stop.
• Have garbage truck and cleaning car pass
after people go to work.
• The mapping of bicycle lanes needs to be
planned better.
• The bike and pedestrian plan was rushed.
• Implement more walking trails to school
(safe routes).
• More safe routes for biking and walking.
• Look closely at the congestion on
Sebastopol Road.
• Have an app that has the closest bus stop
and estimated arrival time.
• Google maps show map routes
• Carpooling

A 19.
DRAFT COMPREHENSIVE TRANSPORTATION PLAN — JULY 2021 | Appendices
-
5 — CHATINO INDIGENOUS Is not safe enough
COMMUNITY
Date and time: 7/25/2019, 10am–11:30am
Location: Petaluma home
Facilitator: Xulio Soriano, North
Bay Organizing Project
Attendees: 9 adults (7 women,
3 males) 4 children.
Description: Primary language: Chatino
Secondary language: Spanish
Typical daily trips for attendees:
• Community does not walk or feel safe
walking given some of their neighborhoods
don’t have sidewalks, or the roads near their
homed are highways.
• Cars generally drive too fast in Petaluma,
and traffc speed limits in the US are gener-
ally higher than in Oaxaca, Mexico.
• Hosting family of this listening circle lives off
Highway 116 and visitors can only get there
relatively safe via car.
• For recently arrived immigrants, it can be
confusing to fgure out how to request for
the bus to stop if signage and instructions
aren’t big, bold, and clear
Transportation System Issues:
Takes too much time
• More route options (service area) and more
bus commutes per day (higher frequency)
Needs better maintenance
• Improving road safety and maintenance for
highways and streets was a high priority.
• Bus drivers should not be on their phones
while driving
• Bus stops could have more lighting espe-
cially when daylight savings time ends
• Highway 116 in Petaluma does not have a
merge lane to turn left into the host’s home,
or all other homes in this area
• Lack of sidewalks to walk to Kaiser
Permanente via Lakeville Hwy-Hwy 116, or
only some portions have a sidewalk.
• Hwy 116 is dangerous and there are often car
accidents there, as well as many speeding
cars
• More bus stops should have shelter from the
rain. Standing on the rain is uncomfortable
but also a health risk.
• While people feel generally safe from crime,
some believe there is a potential for a white
supremacist terrorist attack or other hate
crime against immigrants when they are in
public
Costs too much
• Busses should be free, or at least, all elderly
people should have free bus access
Unsure about other options to get around
• Signage inside bus could have
bigger text and fully bilingual
instructions(Spanish-English)
Potential Solutions
• Signifcant need for Spanish-speaking bus
drivers, all bus drivers should be bilingual
• Receptionist at bus station terminal should
be bilingual at all times
• More information in Spanish about trains,
carpools, and other public transit options

A-20
Appendices | DRAFT COMPREHENSIVE TRANSPORTATION PLAN — JULY 2021
6 — AFRICAN AMERICAN COMMUNITY LEADERS
Date and time: 8/15/2019, 5pm–6pm
Location: Community Action
Partnership of Sonoma County
Facilitator: Vince Harper, Community
Action Partnership
Attendees: 9 participants (one did not
sign in), 3 Female, 6 Male, 1 Male did
not sign in, 9 African American
Description: African American Community
Leaders (NAACP President & Vice President,
Chair Juneteenth Festival Committee,
Co-Chair Juneteenth Festival Committee,
Former SR Council Member, etc.)
Concerns mentioned:
• African-Americans are always left out of job
opportunities.
» (When the smart train was being built, no
black person got a job/work)
• Petaluma – 101 Highway is always backed up.
It seems like they have been working on the
Highway forever.
• There are no black people helping to build
the Highways.
• Rohnert Park – Back in the day you were
able to ride your bike with no worries.
Now with so much being built, there is not
enough space to be out (bike/ walk).
• Rohnert Park – It’s not safe because of the
bike lanes and crosswalks.
• Everything seems going electric. And
the main concern around that are the
affordability, jobs, and economic issues. Yes,
it helps the environment but how does it
help the people.
• Santa Rosa – I drive around most of the day
doing drop offs and pickups. I do ride my
bike to downtown since I live close. When
the train was being built, I planned to get
use it once it was done but the train is too
expensive.
• College students should be able to use the
bus for free. Most college students will use
Uber or Lyft to get around, this would help
them save money and encourage them to
use public transportation more often.
• Bus only goes by every hour; it takes too
long to get around.
• Train takes too long to get around.
• A lot of people of color don’t know much
about the train “Where does it go?”; “The
train was not built for us.”
Transportation System Issues:
Takes too much time (9)
• Bus takes too much time.
• Solution: Bus routes should be 15 minutes
apart. 45 minutes to 1 hour doesn’t work.
Needs better maintenance (4)
• App to report street maintenance was useful
and easy to use. It’s now gone. Reporting
things is more time consuming now.
» Solution: Bring back the application “My
Santa Rosa”
• More seating are needed while waiting for
bus. (People are tired and want to sit)

A-21.
DRAFT COMPREHENSIVE TRANSPORTATION PLAN — JULY 2021 | Appendices
• Where is the money coming from?
• Thinking about long-term maintenance; if
money doesn’t continue to come in, these
plans will fail on the long run.
• Better Material to fll in the potholes.
• More Bike racks are needed. More busi-
nesses should have them.
• Buses need bike racks, not all buses have
them.
• Bicyclist should have own parking area
different parking away from the cars. *Will
be safer.
• Some streetlights take too long.
Is not safe enough (5)
• Not safe to ride bikes.
» Solution: Bike paths are needed on more
roads and bike paths need to be closer to
the sidewalks.
• Homeless loitering around bus stops
» Solution: More monitoring (Police
presence)
• Train has its own security, buses should have
some too. That would give more jobs.
» Solution: Subcontracts. Patrolling solves
moat issues there is.
Harms the environment (1)
Costs too much (1)
• Lives in Petaluma and uses a lot of bus
transfers (County and City), navigating
times, and cost.
» Solution: Should have some kind
of discount for city and county bus
transfers.
• Train not affordable for people.
» Solution: Employers should pay or help
their employees. Have some of discounts.
If employer doesn’t want to help the
employee then maybe people who use
multiple transportations can get a tax
reduction to use towards their taxes.
*rewarded for going green.
• For people who commute, it adds up when
you use the Bart and have to pay the golden
gate bridge fee.
• Potholes are big issues that add cost for
personal vehicle repair and maintenance.
• Traveling to the City and to the Airport are
costly and inconvenient to use different
modes of transportation.
» Solution: There should be something in
place like a fast track, maybe a clipper
card for people who use multiple trans-
portations. This would help with using
less paper and hopefully a discounted
cost.
• Higher healthcare costs.
» Solution: Health benefts if people could
walk or bike ride more (lower the health
cost).
• Students need affordable options.
» Solution: There should be a shuttle
between SSU and train station.
• Parking lot to get the train; Tickets are
required to be bought online. For many
seniors or people who are not tech savvy
can see it as a diffcult task.
A-22
Appendices | DRAFT COMPREHENSIVE TRANSPORTATION PLAN — JULY 2021
» Solutions: Ticket Kiosk or a person
assisting at train stops.
Unsure about other options to get around (4)
• Don’t know how to use the bus system.
» Solution: Should have a number where
people can call to get help to get around
on the buses or train.
Potential Solutions
• See throughout issues.
7 — COUNCIL ON AGING
Date and time: 8/15/2019, 10am–11:30am
Location: 30 Kawana Springs Road, Santa Rosa
Facilitator: Renee Tolliver, Council on Aging
Attendees: 9 participants (6 women, 3 men)
Description: Stakeholders including service
delivery staff and aging adult advocates.
Typical daily trips for attendees:
• Doctor visits
• Community centers
• Drive my car, bike sometimes
• Get a ride with my husband because I no
longer drive, am concerned about what
happens when he stops driving
• Just launched a volunteer driver program in
Healdsburg for people who have said they
could fnally stop driving.
• With older adults, lots of paratransit, lots
of volunteer organizations, Uber or Lyft
(don’t know anyone who uses SMART as it’s
expensive and inconvenient).
• Mostly transit and paratransit, which is good
if you’re in town. Paratransit must be in ‐
mile of a route.
• We are lacking in terms of other communi-
ties where people don’t even own a car.
• Rural aspects of different parts of the
county are underserved and people are
isolated for getting to community groups or
appointments.
• In the 70s did not have bus service, prog-
ress was made through connections in

A-23.
DRAFT COMPREHENSIVE TRANSPORTATION PLAN — JULY 2021 | Appendices
Sacramento, was commuting from East bay Is not safe enough (4)
then. Have lived up here since 98, but have
been prisoners in our own vehicles and still
don’t know that much. Have been in the
train and have some comments about that.
Transportation System Issues:
Takes too much time (10)
• Senior citizen will get fatigued by transit,
wait, get to destination, wait again, get back
home. Can’t be out for 6-7 hours and will get
fatigued.
• Hard to get to appointments on time with
transit, would have to arrange for a much
earlier ride. Get places early.
• Takes tremendous amount of time and labor
to do a volunteer driver program.
• Live 20 minutes from a bus stop, thank god
for my friends who drive me. Used to be I
had to plan 6-7 hours for a Kaiser appoint-
ment. People who drive vs. take bus live
miles apart.
• Just to fold out and read the schedule in fne
print is beyond their capabilities. In home
support help (for those who qualify IHHS).
Ambulances have to come pick up seniors
who fall from walkers on the way home.
• If you live in Cloverdale and you have to
get to Kaiser, you’re talking about multiple
transfers, leaving in the morning and getting
back in the evening. A taxi ride is astronom-
ical ($50 each way min).
• Need to run buses more frequently to
accommodate this. Increase schedule to
accommodate for seniors.
• Taking transit far away, need to get up early
(dark) and come back late (dark)
• Ride service is with strangers
• Lift on the bus is good, but otherwise diff-
cult to get on and fnd a seat, or get up from
the seat in time.
• Always ask Lyft driver what his name is for
safety.
• There is also Go Go Grandparent.
• Lyft and Uber now also sharing driver name
with relatives.
• There is a program in place to teach older
adults about buses. Have tried this with
older adults before and they don’t want to
do it (spend their time). Transit rep will go
with them on the regular route. In 11 years
have not had anyone take her up. Talk to
Jody Ten at Sonoma County Transit.
• Medication is also an issue if they are travel-
ling all day.
Harms the environment (2)
• If I had another dot I would have put it there.
• Need to expand routes for this as well.
• Have used the SMART train to San Rafael,
would like to use it for Kaiser in San Rafael
and to the airport. I called the bus service to
airport and they don’t stop at Rohnert Park.
Have to walk from station and it’s too far.
• If people could live in Sonoma County
without a car, or only one car, we might not
choke to death on the smog.
» Why not have smaller vehicles and
smaller buses?

A-24
Appendices | DRAFT COMPREHENSIVE TRANSPORTATION PLAN — JULY 2021
Costs too much (8)
• Paratransit is too expensive, $3 one way, but if
you go between zones it’s $6. If you have to go
every week, or three times a week on dialysis.
• Don’t know any older adults who can use
the train at all. For myself, never could afford
$200/month with a pass.
• It’s the cost of getting to/from train station, and
they don’t run often enough. Set up for tourist
industry and for upper income jobs in Marin.
• Tried paratransit and swore would never
ride it again. If we had the money to use
that money and plan our own ride service, it
would be quite different.
Unsure about other options to get around (6)
• People don’t know there is a shuttle bus
in Healdsburg. Would take people on ride-
alongs. There is a map, but doesn’t list all the
stops available (only major stops). Would
have the driver point out every single stop.
• When I fgure out all that’s involved with
owning a car, I use Lyft and it’s not that
cheap, but I think of all that it would have
cost to drive there. Paratransit would cost
about as much, but far more in time.
• Know that a lot of older adults share rides.
Neighbors spread the word. It’s pretty rare –
a few very fortunate people.
• Think about seniors who need a little extra
hand holding, don’t know where to send
people for that personalized service. Navigate
walker, and make sure they actually get to
the offce (not just dropped off at the curb).
Paratransit is curb to curb and not door to door.
• For some, got scared after paratransit forgot
to pick them up.
• Women driving women, catholic charities is
an option.
• Look at non task-oriented during the week,
not a lot available on the weekend (people
going to church or temple, people are not
comfortable using Lyft or Uber because it
is never the same driver and so they rely on
others in the congregation).
• Made fyers for a woman who couldn’t
get a ride to church, these networks are
important.
• Was looking at list of other types of trans-
portation and it included Sonoma County
Paratransit. Getting information out there
is important. Had a recent knee injury and
couldn’t drive.
Potential Solutions
• Smaller vehicles.
• Incentives for using transit (like other things
in your home).
• The HOV lane is way underused.
• Get Kaiser to understand that if they provide
a shuttle from transit that their costs will go
down (people won’t fall, get sick, etc.)
• Both Kaiser and casino would get benefts
from a shuttle.
• Kaiser has partnered with Uber and Lyft for
those reasons in other cities. Book the driver
when you book your appointment because
it saves them money when you make your
appointment.
• Shuttle buses can be better resourced.
• Under AAA transportation, Kaiser needs
to be more involved with transportation of
clients. Get people to appointments and
share what it costs. If Kaiser does it, other
hospitals will follow suit.
• For people who have medical issues. provide
transportation reimbursement.

A-25.
DRAFT COMPREHENSIVE TRANSPORTATION PLAN — JULY 2021 | Appendices
8 — BAYER FARM POTLUCK
Date and time: 8/16/2019, 5pm–6pm
Location: Bayer Farm, 1550 West
Ave. Santa Rosa, CA 95407
Facilitator: Susan Garcia, Center for Wellbeing
Attendees: 6 women, 2 men (Latinos)
Description: Due to the nature of not
knowing how many people would attend
(coordinator at Bayer Farms stated that it
varies from day to day, sometimes 10 or 80
people) used dot method to get participant
feedback as well as small group discussions
to get more information and assistance
with completing the survey. Set up included
people coming up to vote using the sticker
dots and small group discussions at individual
picnic tables. Assistance with completion of
surveys was needed for most individuals.
Typical daily trips for attendees:
• Most participants drive their personal car.
• Not many participants use bikes as a mode
of transportation or work from home.
• One participant expressed that she uses the
bus all the time and is her source of trans-
portation to be able to get to work or to
go to other important places, like doctors’
appointments.
Transportation System Issues:
Takes too much time (5)
• The train is also causing too much traffc
back up during already high traffc times for
vehicles. This being in the morning 7:00 am
– 9:00 am and in the afternoon around 3:00
pm – 6:00 pm. When people are going and
returning to work/school.
• Too many drivers now in Sonoma County.
Too much traffc in the morning and
evenings when people are trying to get
to work or school or are returning home.
Drivers are sometimes forced to take alter-
nate routes that in turn take longer and cost
more in mileage and gas.
Needs better maintenance (8)
• Many streets do not have fnished sidewalks
or even sidewalks at all in certain roads.
Many participants mentioned the sidewalks
and streets in the 95407 neighborhood,
including Roseland and Moorland.
Is not safe enough (8)
• With the recent news of some suicides/
deaths due to the train, the safety of the
train is at question. Belief that the train
should run, but should be safe for ongoing
traffc and pedestrians.
• Many expressed that the freight trucks are
a huge danger and that many of the drivers
do not follow the DMV traffc laws.
• They can be dangerous when they are
driving on the interstate. They have very
big blind spots, so also very hard to know if
driver is aware of you when you are driving
next to them.
• Belief that the freight trucks should only
be allowed to drive on the lane closest to
the interstate exits as to be safer for other
drivers as the freight trucks carry heavy
loads and often cannot drive over a certain
speed limit.

A-26
Appendices | DRAFT COMPREHENSIVE TRANSPORTATION PLAN — JULY 2021
• Traffc safety laws should be enforced for
drivers of freight trucks
• Streets should be labeled with red no
parking lanes as ends of streets. Many cars
park at the end of the streets and end up
causing blind spots that make it diffcult to
enter into an intersection.
• Many people expressed fear while walking,
due to so much sexual harassment due to
catcalling.
• Sidewalks feel too close to oncoming traffc.
Hard to walk on some sidewalks with kids.
Fear for safety.
• Not enough crosswalks for pedestrians.
Many drivers do not respect these laws.
• Many participants felt that it is unsafe for
bicyclists as there is not many bike lanes and
often bicyclists drive too close to ongoing
traffc.
• There have been many accidents with bicy-
clists that it does not feel safe for either the
drivers or the person on the bikes.
• More regulations should be put in place for
the bicyclists.
Harms the environment (5)
• One participant shared that they believe
that using a bike as a method of transpor-
tation is not going to help with any climate
changes as it is very unrealistic.
Costs too much (4)
• The train is very expensive and seems to be
too dangerous.
• Belief that the train was put in place for
working adults and students to commute
to work or school, but it is too expensive.
Even to use this mode of transportation as a
family outing it is not realistic to spend over
$20 on a one-way ticket.
Unsure about other options to get around
• Not all participants expressed use of the bus
as a mode of transportation. Many partici-
pants expressed confusion with the new bus
system. People are uncertain of how the bus
system works or what bus to take to get to
a certain destination. Fear of getting to a
destination they did not intend and getting
lost.
Potential Solutions
• Working from home is more convenient
and better for the working adult, espe-
cially those with a family, but unrealistic in
meeting work goals.
A-27.
DRAFT COMPREHENSIVE TRANSPORTATION PLAN — JULY 2021 | Appendices
9 — LATINO SERVICE PROVIDER YOUTH PROMOTORES AND PROGRAM STAFF
Date and time: 8/17/2019, 10am–11am
Location: Center for Well-Being
Facilitator: Susan Garcia, Center for Wellbeing
Attendees: 7 Females and 1 Male / Latino/White
Description: Mainly youth ages 15-18 and
program staff that is in their 20’s. No translation
services were required, and the room was
set up as an informal discussion circle
around a table. Refreshments were provided
to participants for their participation
Typical daily trips for attendees:
• The bus is not really used, but it is needed.
• A lot of students that attend Piner High use
the bus for their transportation to get to and
from their homes and school.
• Many youth also use the bus not just to get
to school, but also to get their jobs.
• One participant is a high school senior at
Mario Carrillo High School and she states
that from her home it is a 5 to 10 minute
drive or bike to school. She believes that
her neighborhood feels very safe for her to
be able to bike or walk to school, but feels
there is a need for more bicycle safety.
Transportation System Issues:
Takes too much time
• There is a belief that traffc has gotten worse
after the fres here in Sonoma County.
• Bad transition from HWY 101 and HWY 12
going north around the Santa Rosa down-
town exit.
Needs better maintenance
• Unincorporated Sonoma County needs a lot
of attention. Many of the residents believe
that no County funds are not being spent
there to rebuild roads or do any mainte-
nance. One of the roads mentioned was
Chico Ave where there have been numerous
requests and even asks to Lynda Hopkins
to help rebuild the road on that street, but
there has been no responses and no work
done on that road.
• There was a clear consensus that there are
also many streets that have many potholes
and need more maintenance. Many of the
streets that were mentioned were those
surround Piner High School, Todd road and
roads surrounding Comstock Middle School.
• There is also a need for many sidewalks to
be built in the Rincon Valley area, which
in specifc near the middle school (Rincon
Valley Middle School) and the High School
(Mario Carrillo High School).
• One of the program staff mentioned that
in the Moorland Neighborhood there also
needs to be more sidewalks.
• See more walking bridges over highways to
help with getting across neighborhoods.
Is not safe enough
• The remaining students live in the Piner
neighborhood and they expressed that
they feel there is a need for more traffc
safety, like crosswalks surrounding the
schools. Many students walk to school and

A-28
Appendices | DRAFT COMPREHENSIVE TRANSPORTATION PLAN — JULY 2021
sometimes use a back entrance but is also
unsafe and there needs to be more fashing
lights for pedestrians.
• Recommended more traffc checks to make
sure drivers are using blinkers and freight
trucks not using the middle lane.
• Motorcycles should only drive in the fast
lane.
• Bus stops are often not even on sidewalks
and are just on the side of a road, which is
very dangerous. Mentioned the one on Hwy
12 heading to Sebastopol.
• Not safe to ride bike in the evenings.
• The train is unsafe when it comes to pedes-
trians and traffc.
Costs too much
• Belief that there is a really need for more
cost saving options for all students to be
able to afford the bus, programs like the one
for the students that attend the JC and have
free bus rides.
• The train is too expensive, not a real reliable
source of transportation.
• Because the train is so expensive it is
only for the people that have the fnancial
resources.
Unsure about other options to get around
• Bus maps are so confusing, there are
now many numbers and letter for each of
the stops, which are not easy to follow.
Recommended that they keep it simple, like
buses 1-14 (example) or look at other really
good transportation systems, like the one in
Washington or Chicago.
Accessibility
• Clipper card system shuts off on the bus, so
it is not really reliable.
• Fear of riding the bus and getting lost due
to confusing maps system.
Potential Solutions
• Like the traffc lights at the Hwy. entrances.
Helps with traffc fow.
• Concrete paving has been really good to
help stop fooding in many areas in the
County.
• More bus stops need to be placed in more
locations.
• Recommended concrete dividers for bike
lanes.
• Many students also ride their bike to school,
so more bike lanes are needed, especially
near the schools.
• Bike lanes should be on every street.
• Recommended colored bike lanes.
• Need more light posts on Petaluma Hill
Road.
• There needs to be places for people to sit
at each of the bus stops with some sort of
shade being provided.
• There also needs to be a separation from
bus stops and ongoing traffc.
• Would be great if the train went all the way
to San Francisco or Larkspur.

A-29.
DRAFT COMPREHENSIVE TRANSPORTATION PLAN — JULY 2021 | Appendices
10 — GRATON DAY LABOR CENTER
Date and time: 8/20/2019, 8:30am
Location: Graton Day Labor Center
Facilitator: Xulio Soriano, North
Bay Organizing Project
Attendees: 16 signed sheet, 18 total (two did not
sign attendance sheet). 4 females, 14 males.
Description: Majority Oaxacan Immigrants.
Primary language: Spanish. Surveys flled
out: 1 survey completed out of need
because of the $10 card incentive
Typical daily trips for attendees:
• Most people commute from Santa Rosa
to Graton Day Labor Center without using
public transit.
• They have used public transit in the past but
generally stop using it after their economic
conditions improve.
• Recently arrived immigrants tend to move
frst before saving up to buy a car.
• Additionally, community organizing for
immigrant rights has resulted in less cars
being confscated and sold by local police/
car impound businesses now that drivers
can have a licensed driver pick up their car if
they commit a minor traffc violation. CA AB
60 has also allowed certain qualifying immi-
grants to have a special driver’s license.
• Majority of participants did not know
enough about public transit and requested
better outreach in their language and
though multiple channels of information
dissemination.
Transportation System Issues:
Is not safe enough
• There is a general feeling of adequate safety
while using bus, but there is a feeling of
concern for hate crimes or terrorist attacks.
• Parents do not feel safe sending children
to school by themselves due to stories of
sexual predators or kidnappings
• School zones are dangerous for pedestrians
and cyclists during rush hour. More crossing
guards are needed
• Crossing guards could be paid or additional
guards provided by Transportation Agency
in collaboration with school districts
Costs too much
• Public transit should be entirely free
Unsure about other options to get around
• Even if some things are translated, people
assume there is still little to no information
in Spanish.
• Information in Spanish should be mailed to
people’s homes
• Information should be shared in Spanish-
speaking TV channels, such as Univision
• In addition to translating information,
outreach and campaigning in Spanish is
needed so people can trust to expect infor-
mation in Spanish.
Potential Solutions
• More frequent buses from Santa Rosa
to Graton Day Labor center could entice
people to use them.

A-30
Appendices | DRAFT COMPREHENSIVE TRANSPORTATION PLAN — JULY 2021
11 — TRIQUI INDIGENOUS COMMUNITY
Date and time: 8/25/2019, 4pm
Location: KBBF Bilingual Radio
Station Headquarters
Facilitator: Xulio Soriano, North
Bay Organizing Project
Attendees: 8 (5 females, 3 males)
Description: 2 children and 1 childcare provided
were present in an adjacent room. Primary
language was “Triqui” language and the
secondary language was Spanish. This circle had
two translators making sure all information was
translated from Spanish into “Triqui” language.
All attendees were from Santa Rosa, with the
exception of a participant from Healdsburg.
Participants spent the majority of time
expressing concerns and sense of mistreatment.
While other listening circles constituted a back
fourth dialogue with transportation guiding ques-
tions, the majority of people present in this circle
needed a way to report grievances, fears, and
injustices. They also offered some solutions.
Concerns mentioned:
• The group was not sure how to fle
complaints, did not know what number to
call, or did not feel comfortable calling an
institution to make a complaint given they
feel more comfortable speaking their indig-
enous language, and those who are fuent in
Spanish are younger students who don’t feel
comfortable making a complaint.
• There is often a lot of dust on the bus seats
• A participant worked cleaning the buses,
but stated that the payment was low and
the number of buses to clean was high, so
cleaning was not done very thoroughly by
him and his bus cleaning colleagues.
• Some people leave trash and food in the
business
• Another mother participant and her chil-
dren once had a bus driver tell them that he
was tired of having to stop at bus stops on
standby when nobody was there. They felt a
sense of disrespect and rudeness directed at
them on behalf of the bus driver. The moth-
er’s small children translated the bus driver’s
words to her.
• The same mother as above has had to seek
shade next to a tree near the bus stop on
hot days, and has had to run and wave at
the bus and sometimes the bus doesn’t stop.
She feels this could be intentional, or that
the bus drivers lack compassion given past
experiences.
• An elderly indigenous participant has
mentioned a sense of dehumanization when
he has seen other elderly folk or bus users of
any age being told they cannot ride the bus
because they were short 25 cents or less,
so users have had to pay 5 dollars and not
receive any change.
• Additionally, above mentioned elderly man
has seen another elderly person not allowed to
take the bus because he was “short a few cents”
• All participants raised hands in agreement
that they have at some point felt a level of
disrespect and dehumanization from bus
drivers
Transportation System Issues:
Takes too much time
• More than once a participant has ridden on
a bus that broke down and took a signifcant

A 31.
DRAFT COMPREHENSIVE TRANSPORTATION PLAN — JULY 2021 | Appendices
-
amount of time for the issue to be resolved,
making her late to work or to doctor’s
appointments
• A signifcantly late bus leaves a deep feeling
of distrust for a bus user and an unwilling-
ness to rely on public transit
Needs better maintenance
• More sidewalks needed in some
neighborhoods.
• Potholes need to be fxed in low-income
neighborhoods.
Is not safe enough
• Some bus users ingest different types of
drugs while on the bus, or before they get
on bus and begin to yell or scare other bus
riders
• Some bus drivers use their phone while
driving
• Sometimes there is a feces or urine smell on
the bus
• A bus driver once stopped for a cigarette
break for about 10 minutes, or stopped to be
on standby and smoked outside the bus off
the road while on standby. This scared and
confused a student participant.
• During severe heat waves, lack of shading is
a health risk and a concern to participants
health and well-being, especially for elderly
and moms with small children.
• Second hand smoke from bus driver or bus
riders is a concern.
Costs too much
• One participant witnessed a non-English
speaking elderly person pay full price
instead of senior price because they did not
speak English. The bus driver did not offer
the discounted price and the user did not
know how to ask about the discounted price
Accessibility
• Only a few bus drivers speak Spanish, or it is
not clear if they speak Spanish.
» A bus driver once grabbed an apple
from a participant’s hand, yelled at her in
English, threw it in the trash, and embar-
rassed her. She could not understand him
and it scared her.
» A participant mother believes a cultural
change is needed within the public transit
institutions, and receptionists, should
be multilingual. Bus drivers should not
be majority white monolingual English
speakers.
Potential Solutions
• All buses should give change automatically.
Every dollar counts for them. It feels unjust
when users cannot get change back.
• The County and Transportation Agency
should identify other signifcant languages
by immigrant communities spoken other
than Spanish.
• All bus drivers should speak Spanish
• Additional options for indigenous language
translations could be institutionalized with a
hotline phone number for translators
• A Spanish speaker who is familiar with the
bus and other public transit systems could
be a translator in person as accompaniment,
or over phone as a temporary solution until
there are bilingual bus drivers.
• Not everyone can read text, so video or
audio information is also needed.

A-32
Appendices | DRAFT COMPREHENSIVE TRANSPORTATION PLAN — JULY 2021
12 — PETALUMA SENIOR CAFÉ
Date and time: 8/28/2019, 12:20pm– 1:30pm
Location: Petaluma People
Services — Senior Café
Facilitator: Susan Garcia, Center for Wellbeing
Attendees: 17 participants (Seniors
65 and up, White/Latinos)
Description: Room was set up as a cafeteria
with about 7 tables and 4 or 6 people per table.
People were in in groups, but a microphone was
used so that all participants could hear. Not all
seniors wanted to participate in the discussion,
dot voting or to take the survey. About 20-25
people present, although not all participated.
Typical daily trips for attendees:
• It takes me about 2 hours for one participant
to get to the Senior Meals Café
Transportation System Issues:
Takes too much time
• Too much traffc congestion.
Needs better maintenance
• Belief that the county had the worst trans-
portation system.
• The roads are really bad.
Is not safe enough
• Some seniors walk to get to places, like the
grocery store and are walking in the heat
and close to traffc.
• Seniors do not want to use the public trans-
portation system because they are confused
on how to access/use it and also feel
alone. Riding the bus by themselves can be
dangerous.
• Train is too noisy.
• Belief that Petaluma Blvd. is dangerous for
many drivers.
Harms the environment
• Worried about gas emissions.
• Too many cars on the road.
• Some pros/cons to gas engines.
• There should be more Teslas.
• More incentives for electric vehicles.
• Not enough power/electrical sources for all
electric vehicles.
• The train is not practical because it depends
on electricity in case of a power shut off.
• Unfair that the whole state has to pay for
the charging stations for electric vehicles.
Costs too much
• Paratransit is $3.50 door to door and pay
every time for ride.
• Public Transportation modes should be free
to seniors.
• SMART Train is too expensive.
• County transportation money is not spent
appropriately.
• Good on Price!
• Reduction for seniors and no cost for Vets.
• Gas in Petaluma is very expensive.
A 33.
DRAFT COMPREHENSIVE TRANSPORTATION PLAN — JULY 2021 | Appendices
-
• If you don’t use the SMART train, why do all
of us have to pay.
Unsure about other options to get around
• Not all seniors have access to the internet,
which seems like the only way to get
information.
• Unsure of transportation options for seniors.
• The bus system seems to run, but with not a
lot of people on board.
• Are volunteers able to drive the county
buses?
Potential Solutions
• How about a small bus from Guerneville to
Armstrong Wood (Every Hour)?
• 1 Ride by Petaluma People Services offers 3
rides 3 x a week for seniors.
• Utilize new resources, like Uber/Lyft for
more individualized rides for seniors.
• Have more volunteer drivers to help seniors
get around.
• Have a bus provide rides to get to the coast
at least during the summer.
• A coastal bus from Petaluma, Cotati and
Rohnert Park.

A-34
Appendices | DRAFT COMPREHENSIVE TRANSPORTATION PLAN — JULY 2021
A-1.3.. CBTP.Projects. Inventory. Sonoma STATUS OF PROJECTS IDENTIFIED IN COMMUNITY-BASED TRANSPORTATION PLANS ADOPTED FROM 2007–2010
Community-Based Transportation Plans Project Inventory
Between 2006 and 2009, SCTA studied four
Equity Priority Communities (formerly called
Communities of Concern) identifed by MTC. The
four communities include Roseland in south-
west Santa Rosa, the Springs area in Sonoma
Valley near Sonoma, the Lower Russian River
area including Guerneville and Monte Rio, and
in Healdsburg along Highway 101. Each of these
areas is unique, with differing characteristics
and challenges. The resulting documents are the
following SCTA Community Based Transportation
Plans (CBTP):
• Roseland Community-Based Transportation
Plan, 20071
• Lower Russian River Community-Based
Transportation Plan, 20092
• Healdsburg Community-Based
Transportation Plan, 20093
• The Springs Community-Based
Transportation Plan, 20104
Each recommended project or solution iden-
tifed in these four CBTPs is inventoried in the
matrix below with the status as of June 2021.
While many of these projects have been imple-
mented, many others have not begun or have
only been partially implemented. Lack of funding
is the most common reason that projects have
not been implemented; however, some projects
are complex due to right-of-way constraints or
competing needs.
https://scta.ca.gov/wp-content/uploads/2018/01/Roseland_Community_Based_Trasnportation_Plan_-_Final_Roseland_Report.pdf https://scta.ca.gov/reports/Lower_Russian_River_Community_Based_Transportation_Plan.pdf
3 https://scta.ca.gov/reports/Healdsburg_Community_Based_Transportation_Plan.pdf 4 https://scta.ca.gov/reports/The_Springs_Community_Based_Transportation_Plan_06-03-2010.pdf
1 2

A-35.
DRAFT COMPREHENSIVE TRANSPORTATION PLAN — JULY 2021 | Appendices
# Project Name Neighborhood and Jurisdiction
Project Status as of June 2021 Status Reason
1 Expand Healdsburg Transit's fxed route weekend service
Healdsburg Community Based Transportation Plan
No project initiation
2 Marketing/Education program to increase bus ridership
Healdsburg Community Based Transportation Plan
Fare free shuttle marketing
3 Taxi Voucher Program with the local taxi company
Healdsburg Community Based Transportation Plan
DASH Volunteer Driver Program provides free rides for seniors who cannot drive within City limits. DASH does not have wheelchair accessible vehicles.
4 Safe Routes to School Healdsburg Community Based Transportation Plan
Healdsburg Elementary School campuses, Healdsburg Junior High School, and St. John's elementary school, have all participated in Safe Routes to School.
5 Expand Healdsburg Transit's fxed route service into evening hours
Healdsburg Community Based Transportation Plan
No project initiation
6 Add Sonoma County Transit route 60 express service between Healdsburg and Santa Rosa.
Healdsburg Community Based Transportation Plan
Express trips suspended and service temporarily reduced. Additional non-express peak service on Route 60 expected to return.
Express trips suspended and service temporarily reduced due to COVID-19 impacts.
7 Community Transportation Manager/Volunteer Driver Program.
Healdsburg Community Based Transportation Plan
DASH Volunteer Driver Program provides free rides for seniors
8 Maintain Healdsburg Transit's existing fxed route service.
Healdsburg Community Based Transportation Plan
Local transit service that was in place during the development of the CBTP has been maintained.
9 Bicycle Education Campaign and Street Skills Classes.
Healdsburg Community Based Transportation Plan
No project initiation
10 Add sidewalks along the southern end of Healdsburg Avenue
Healdsburg Community Based Transportation Plan
No project initiation
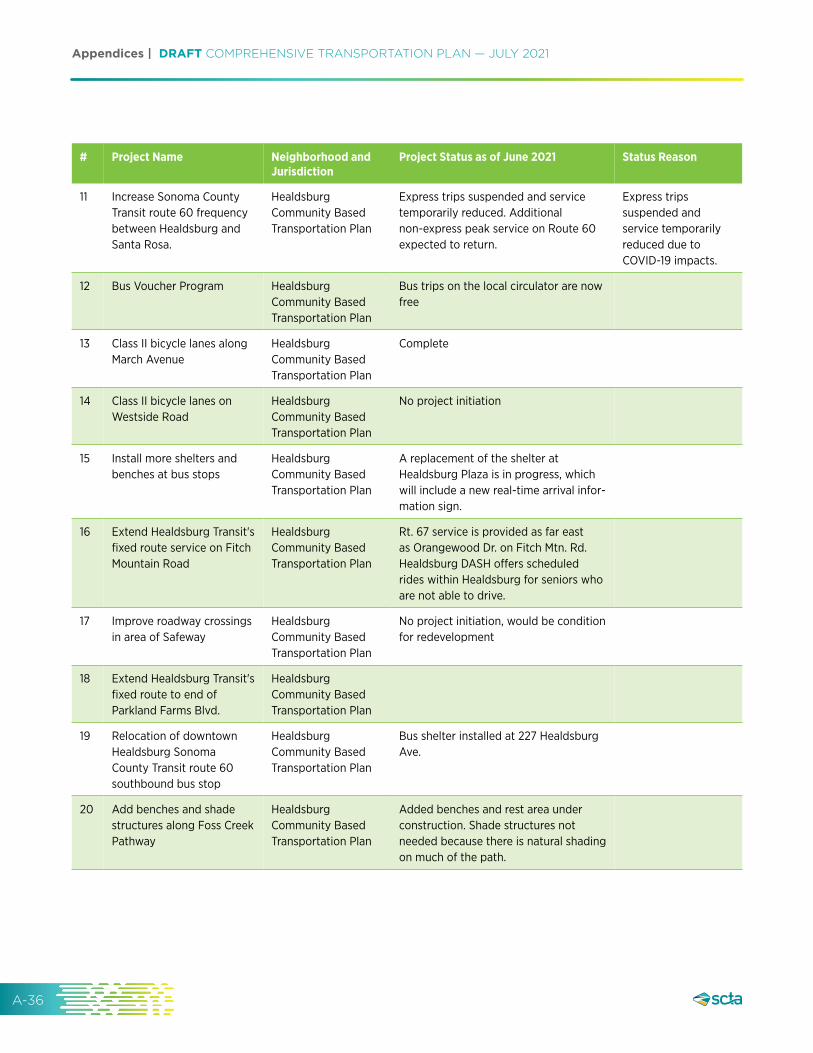
A-36
Appendices | DRAFT COMPREHENSIVE TRANSPORTATION PLAN — JULY 2021
# Project Name Neighborhood and Jurisdiction
Project Status as of June 2021 Status Reason
11 Increase Sonoma County Transit route 60 frequency between Healdsburg and Santa Rosa.
Healdsburg Community Based Transportation Plan
Express trips suspended and service temporarily reduced. Additional non-express peak service on Route 60 expected to return.
Express trips suspended and service temporarily reduced due to COVID-19 impacts.
12 Bus Voucher Program Healdsburg Community Based Transportation Plan
Bus trips on the local circulator are now free
13 Class II bicycle lanes along March Avenue
Healdsburg Community Based Transportation Plan
Complete
14 Class II bicycle lanes on Westside Road
Healdsburg Community Based Transportation Plan
No project initiation
15 Install more shelters and benches at bus stops
Healdsburg Community Based Transportation Plan
A replacement of the shelter at Healdsburg Plaza is in progress, which will include a new real-time arrival infor-mation sign.
16 Extend Healdsburg Transit's fxed route service on Fitch Mountain Road
Healdsburg Community Based Transportation Plan
Rt. 67 service is provided as far east as Orangewood Dr. on Fitch Mtn. Rd. Healdsburg DASH ofers scheduled rides within Healdsburg for seniors who are not able to drive.
17 Improve roadway crossings in area of Safeway
Healdsburg Community Based Transportation Plan
No project initiation, would be condition for redevelopment
18 Extend Healdsburg Transit's fxed route to end of Parkland Farms Blvd.
Healdsburg Community Based Transportation Plan
19 Relocation of downtown Healdsburg Sonoma County Transit route 60 southbound bus stop
Healdsburg Community Based Transportation Plan
Bus shelter installed at 227 Healdsburg Ave.
20 Add benches and shade structures along Foss Creek Pathway
Healdsburg Community Based Transportation Plan
Added benches and rest area under construction. Shade structures not needed because there is natural shading on much of the path.

A-37.
DRAFT COMPREHENSIVE TRANSPORTATION PLAN — JULY 2021 | Appendices
# Project Name Neighborhood and Jurisdiction
Project Status as of June 2021 Status Reason
21 Class II Bicycle Lanes on Highway 116: Foothill Dr. to Duncan Rd.
Lower Russian River Community Based Transportation Plan
No project initiation
22 Class II Bicycle Lanes on River Road: Westside Road to Highway 116
Lower Russian River Community Based Transportation Plan
No project initiation
23 Class I Multi-Use Trails (Of-Road) Trails Feasibility Study
Lower Russian River Community Based Transportation Plan
Lower Russian River Trail Feasibility Study approved February 11, 2020
24 Add Express Bus Service to Santa Rosa
Lower Russian River Community Based Transportation Plan
Express trips suspended and service temporarily reduced. Additional non-express peak service on Route 20 expected to return.
Express trips suspended and service temporarily reduced due to COVID-19 impacts.
25 Transportation Manager Coordination
Lower Russian River Community Based Transportation Plan
Sonoma County Human Services, Area Agency on Aging provides funding and coordination with the Sebastopol Senior Center for their volunteer driver program. Local bus route 28 is free with subsidies from the County.
26 Add Evening Bus service Lower Russian River Community Based Transportation Plan
Route 28 runs from 7:45 to 5:08 week-days and Saturdays, which is expanded from the 9:15 to 3:45 schedule at the time of the plan. Route 20 hours have been reduced to 7:35 to 8:15 from 5:45 to 10:15 at the time of the plan.
Service temporarily reduced due to COVID-19 impacts. Additional peak service on Route 20 expected to return.
27 Safe Routes to School (non-Infrastructure)
Lower Russian River Community Based Transportation Plan
Guerneville school has participated in all SRTS elements. Monte Rio and Forestville have held walk and ride to school events.
28 Install More Shelters and Benches
Lower Russian River Community Based Transportation Plan
A shelter in disrepair was replaced and a new shelter was added since 2016, as well as a new bench by the Russian River Senior Center.
29 Expand Local Bus Service Lower Russian River Community Based Transportation Plan
Route 28 now serves Russian River Senior Center, Guerneville School, and Guerneville Library on Armstrong Woods Road

A-38
Appendices | DRAFT COMPREHENSIVE TRANSPORTATION PLAN — JULY 2021
# Project Name Neighborhood and Jurisdiction
Project Status as of June 2021 Status Reason
30 Bicycle Education in English and Spanish
Lower Russian River Community Based Transportation Plan
31 Repair Guerneville Sidewalks
Lower Russian River Community Based Transportation Plan
Caltrans Hwy 116 ADA sidewalk project between River Road and Fife Creek on schedule for 2022-23
32 Decrease Bus Headways Lower Russian River Community Based Transportation Plan
Frequency increases on Route 28 are not currently planned. Saturday service added in 2020.
Current service frequency is suf-cient for demand.
33 Signalization of Intersection of Highway 116/Drake & Neeley Roads
Lower Russian River Community Based Transportation Plan
No project initiation
34 Permit Larger Items on Buses
Lower Russian River Community Based Transportation Plan
No project initiation Limited space for large items on-board buses
35 Signalization of Intersection Highway 116/Mill Street
Lower Russian River Community Based Transportation Plan
36 Class II Bicycle Lanes on Armstrong Woods Road; Highway 116 to State Park
Lower Russian River Community Based Transportation Plan
Complete - Class II lanes along majority of Armstrong Woods Rd. - road is too narrow approaching park entrance
37 Build Sidewalks in Monte Rio
Lower Russian River Community Based Transportation Plan
repaired & extended along w/ADA ramps on Main St. & Bohemian Hwy (Hwy 116 to the bridge)
The road is too narrow in other areas
38 Build Sidewalks in Guerneville
Lower Russian River Community Based Transportation Plan
No project initiation
39 Class II Bicycle Lanes on Highway 116: Armstrong Woods Rd. to Foothill Drive
Lower Russian River Community Based Transportation Plan
No project initiation limited right-of-way
40 Permit More Bicycles on Bus
Lower Russian River Community Based Transportation Plan
All intercity buses can currently accommodate up to 3 bicycles on front-loading racks.
Further expansion of racks is not feasible due to vehicle length limitations.

A-39.
DRAFT COMPREHENSIVE TRANSPORTATION PLAN — JULY 2021 | Appendices
# Project Name Neighborhood and Jurisdiction
Project Status as of June 2021 Status Reason
41 Casual Car-Pool System Lower Russian River Community Based Transportation Plan
Dynamic carpool matching through Merge may be used by people wishing to carpool
Further study would be needed to deter-mine whether there is critical mass to warrant dedicated pick up areas for casual carpool
42 Volunteer Driver Program for Seniors’ Transportation
Lower Russian River Community Based Transportation Plan
“Sebastopol Senior Center’s volun-teer driver program serves this area; however, sustainable funding, volunteer recruitment, and lack of wheelchair accessible vehicles are ongoing chal-
lenges. West County Community Services operates a West County shuttle with a wheel chair lift through grant funding. Ongiong funding of this program is uncertain.”
43 Reduce Incidences of Speeding and DUIs
Lower Russian River Community Based Transportation Plan
No current specifc eforts County accepts requests for place-ment of a speed feedback trailer on County Roads
44 Class II Bicycle Lanes on Hwy. 116: Mays Canyon Rd. to Armstrong Woods Rd.
Lower Russian River Community Based Transportation Plan
No project initiation
45 Class III Bicycle Route on Cazadero Highway/Austin Creek Road
Lower Russian River Community Based Transportation Plan
No project initiation
46 Auto Loan Program Lower Russian River Community Based Transportation Plan
No project initiation
47 Build Sidewalks in Rio Nido Lower Russian River Community Based Transportation Plan
No project initiation limited right-of-way
48 Class II Bicycle Lanes on Highway 116: Duncan Road to Moscow Road
Lower Russian River Community Based Transportation Plan
No project initiation

A-40
Appendices | DRAFT COMPREHENSIVE TRANSPORTATION PLAN — JULY 2021
# Project Name Neighborhood and Jurisdiction
Project Status as of June 2021 Status Reason
49 CityBus Evening Service Extension
Roseland Community-Based Transportation Plan
Schedule modifcations were imple-mented with Reimagining CityBus; however, hours of operation are rela-tively the same. Sunday service is now provided on all routes
Additional funding needed to expand hours of service
50 CityBus Frequency Improvements
Roseland Community-Based Transportation Plan
Route 2/2B (formerly 9/9W) weekday headways reduced from 30 to 15 minutes from Transit Mall to Stony Point Rd. and weekend headways reduced from 60/75 to 30/45. Hourly Sunday service added on route 15.
Revenue neutral service improve-ments from Reimagining CityBus
51 Restructured Transit Service (Route 20)
Roseland Community-Based Transportation Plan
Transit service restructured through implementation of Reimagining CityBus after extensive outreach. Trunk portions of routes 2/2B, 12, and 15 are now bi-di-rectional with tail loop ends.
Unfunded Phase II of Reimagining CityBus would increase bi-directional service and extend routes 12 and 15.
52 Bus Stop Improvement Roseland Community-Based Transportation Plan
Benches have been installed at an addi-tional four bus stops in Roseland.
53 Roseland Neighborhood Shuttle
Roseland Community-Based Transportation Plan
No project initiation
54 Pedestrian Improvements Roseland Community-Based Transportation Plan
Crosswalks installed near Roseland Elementary School and Roseland University Prep, Stony Point Rd, various sections of sidewalk installed on Burbank Ave. and Stony Point Rd.
As part of the Roseland Annexation agreement, the County will provide $6.2M over a 10-year period to the City to make roadway improvements.
55 Bicycle Lanes Roseland Community-Based Transportation Plan
Class II lanes on Stony Point Rd, Hearn Ave from SMART Pathway to Stony Point, Sebastopol Rd from Dutton to Corporate Center Pkwy. SMART (formerly NWP RR) Class I
Planned Class II on Dutton Ave, Burbank Ave. Planned Class IV on Sebastopol Rd., Class III on Earle St
56 Multi-Use Paths Northwestern Pacifc Railroad (Roseland Segment)
Roseland Community-Based Transportation Plan
SMART Pathway complete from W. 3rd St to Bellevue Ave.

A-41.
DRAFT COMPREHENSIVE TRANSPORTATION PLAN — JULY 2021 | Appendices
# Project Name Neighborhood and Jurisdiction
Project Status as of June 2021 Status Reason
57 Roseland Creek Multi-Use Path
Roseland Community-Based Transportation Plan
No project initiation. Segment in Bike/ Ped Master Plan
58 Safe Routes to School Roseland Community-Based Transportation Plan
Shepphard Accelerated Charter and Roseland Elementary School have participated in Safe Routes to School.
59 Street Smarts Roseland Community-Based Transportation Plan
The County of Sonoma conducted a safety campaign around the three-foot rule for passing bicyclists. Updating StreetSmarts campaign messaging is included in the 2018 Bicycle & Pedestrian Master Plan
60 Transit Orientation and Travel Training
Roseland Community-Based Transportation Plan
CityBus has continued to provide travel training services in Roseland.
Demand for these services paused during the pandemic but is expected to return.
61 Enhanced Transit Information
Roseland Community-Based Transportation Plan
Transit route and scheduling information has signifcantly improved since 2007. CityBus now has real-time departure and arrival information provide via text, desktop, and mobile devise. Real-time departure information is displayed at the Transit Mall for all agencies serving the Transit Mall. The system map and schedule handout were signifcantly revamped in 2017 with information in Spanish and English about important facilities and bike/pedestrian routes, frequency tables, service to SMART and other connecting agencies, and how to get real-time transit. Improvements were made to accessibility of the fxed route scheduling information for people with visual impairments.
62 Reinstitute Golden Gate Transit route 90 bus service from Sonoma Valley to San Rafael & San Francisco
The Springs Community Based Transportation Plan
No project initiation requires additional funding or reduction in other service

A-42
Appendices | DRAFT COMPREHENSIVE TRANSPORTATION PLAN — JULY 2021
#
63
Project Name
Maintain existing levels of transit service
Neighborhood and Jurisdiction
The Springs Community Based Transportation Plan
Project Status as of June 2021
Local transit service that was in place during the development of the CBTP has been maintained.
Status Reason
64 Increase frequency of route 32 buses to/from The Springs and Sonoma
The Springs Community Based Transportation Plan
No project initiation requires additional funding or reduction in other service
65 Increase frequency of route 40 buses to/from The Springs & Petaluma, including Saturday service
The Springs Community Based Transportation Plan
Weekday service increased in 2017, but reverted to historic schedule during COVID-19
Service temporarily reduced due to COVID-19 impacts. Adding back addi-tional peak service on Route 40 to be evaluated.
66 Increase frequency of route 30 buses to/from The Springs & Santa Rosa & Sonoma
The Springs Community Based Transportation Plan
Weekday service has decreased slightly while weekend service has increased to average one hour and forty-fve minutes
Service temporarily reduced due to COVID-19 impacts. Adding back addi-tional peak service on Route 30 to be evaluated.
67 Later Afternoon and/ or evening bus service & expanded ADA paratransit service
The Springs Community Based Transportation Plan
Route 40 hours have expanded and now runs from 6:10am to 6:50pm
Service temporarily reduced due to COVID-19 impacts. Adding back evening service on Route 40 to be evaluated.
68 Implement a new weekday bus route between the cities of Sonoma & Napa
The Springs Community Based Transportation Plan
Napa Vine route 25 is no longer in service
Ridership was very low and there was a need to reallocate service elsewhere
69 Safe Routes to Schools program
The Springs Community Based Transportation Plan
El Verano Elementary School has partic-ipated in Safe Routes to School.
70 Bicycle Education Campaign & Street Skills classes
The Springs Community Based Transportation Plan
The Bicycle Coalition has done commu-nity bike rodeos and tabling in the Springs area.
71 Expand outreach & customer service eforts to potential & existing Latino bus patrons
The Springs Community Based Transportation Plan

A-43.
DRAFT COMPREHENSIVE TRANSPORTATION PLAN — JULY 2021 | Appendices
# Project Name Neighborhood and Jurisdiction
Project Status as of June 2021 Status Reason
72 Provide incentives for busi-nesses to provide safe & convenient bicycle parking
The Springs Community Based Transportation Plan
No project initiation
73 Complete the Central Sonoma Valley Bikeway (Class I, multi-use path)
The Springs Community Based Transportation Plan
Feasibility Study for connecting Sonoma Valley Trail completed in 2016. Trail segments through Larson Park to Vailetti Dr complete.
Limited ROW and funding. ROW acqui-sitions in progress.
74 Enhance pedestrian crossings on Highway 12 at various locations
The Springs Community Based Transportation Plan
Signifcant improvements have been made to the Highway 12 streetscape in The Springs. A stop light and pedestrian crossings were added at Thompson, and crossings were added at Serra (between Arroyo and Calle del Monte) and at Central.
The Springs Specifc Plan Discussion Draft includes a new cross-walk with pedestrian warning lights at the Sonoma Charter School and a new crosswalk, bulbouts, and warning lights at Donal Street after sidwalks are completed in area.
75 Complete Verano Avenue sidewalks from Highway 12 to Sonoma Creek
The Springs Community Based Transportation Plan
A Class 1 multi-iuse path was constructed from Verano and Main, where the sidewalk ends, to the Sonoma Creek bridge.
76 Arnold Drive bicycle lanes from Agua Caliente Road to Country Club Drive
The Springs Community Based Transportation Plan
Planned for implementation, from Country Club Dr. to Madrone Rd. in FY 23/24.
77 Agua Caliente Road bicycle lanes from Highway 12 to Arnold Drive
The Springs Community Based Transportation Plan
No project initiation
78 Boyes Boulevard sidewalks from Highway 12 to Arnold Drive
The Springs Community Based Transportation Plan
Bridge replacement to open in July 2021. No initiation of sidewalk installation.
In some areas, adding sidewalks would require use of residential frontages and/or removal of street parking.
79 Pedestrian lighting on Highway 12 from Donald Street to Verano Avenue
The Springs Community Based Transportation Plan
Complete - Pedestrian lighting added

A-44
Appendices | DRAFT COMPREHENSIVE TRANSPORTATION PLAN — JULY 2021
# Project Name Neighborhood and Jurisdiction
Project Status as of June 2021 Status Reason
80 Agua Caliente Road side-walks from Highway 12 to Vailetti Drive
The Springs Community Based Transportation Plan
No project initiation
81 Add pedestrian crossings on Verano Avenue at Riverside Drive
The Springs Community Based Transportation Plan
No project initiation
82 Pedestrian Lighting Agua Caliente Road & Boyes Boulevard
The Springs Community Based Transportation Plan
No project initiation
83 Install more shelters, benches & bike racks at bus stops
The Springs Community Based Transportation Plan
Stop fxtures continue to be improved and upgraded, including new shelters, benches, and trash bins since 2016.

A-45.
DRAFT COMPREHENSIVE TRANSPORTATION PLAN — JULY 2021 | Appendices
SCTM uses a traditional four-step travel demand
modeling process to estimate: A-2. Travel.Model. Technical. Summary
The Comprehensive Transportation Plan includes a
performance assessment of transportation projects,
programs, policies, and strategies. These projects
and policies were identifed in previous CTPs or
other plans including local general plans, short
range transit plans, the Regional Transportation
Plan, through transportation research, or have been
submitted by local project sponsors. The Sonoma
County Travel Model, SCTM 2020, along with other
off model tools and methods were used to perform
the performance assessment.
I. THE SONOMA COUNTY TRAVEL MODEL (SCTM 2020)
SCTM 2020 is a travel demand model composed
of a combination of digital databases, computer
programs, and scientifc theory. It is used to repli-
cate the real world transportation system (roads,
intersections, traffc control devices, congestion
delays, transit use, road capacity, speed limits) in
Sonoma County. The travel demand model can
be used to forecast future travel patterns and
demand based on changes to the transportation
system (new roads, changes in capacity, etc.),
land use (changes in residential densities, or loca-
tions, new job sites, etc.), or demographics (more
or less people in a certain area).
• How much travel is taking place? (Trip
Generation)
• Where are people going? (Trip Distribution)
• What travel modes are people using to
make their trips? (Mode Choice)
• What routes/facilities are being used? (Trip
Assignment)
1. Data Requirements:
The two basic inputs for applying the travel
demand model are:
• Land use inputs, representing estimates of
current and future development; and
• Transportation inputs or supply, including the
current transportation network and planned
changes (increases or decreases in capacity,
new roads or highways, new transit lines)
These inputs are stored in a countywide GIS
land use database and model networks and are
assembled and updated in consultation with local
jurisdictions.
2. Four-Step Modeling Process:
SCTA uses a traditional, four-step travel demand
modeling process to replicate and forecast
countywide travel behavior. These four steps are:
Trip Generation, Trip Distribution, Mode Choice,
and Trip Assignment steps (See Figure 1).
Dana Turrey�
Looks great

A-46
Appendices | DRAFT COMPREHENSIVE TRANSPORTATION PLAN — JULY 2021
FIGURE 1. THE FOUR-STEP TRAVEL DEMAND MODELING PROCESS.
FourFour--StepStep RegionalRegional TravelTravel DemandDemand ModelModel
Land use data
Trip assignment
Mode choice
Trip distribution
Trip generation
Highway and transit
trips
Traffic Volume
forecasts
Zone-to-zone Travel times,
Costs, etc.
Highway and transit networks
Congested Traffic Speeds
Trip Generation: How much travel?
Sonoma County is divided into over 800 traffc
analysis zones (TAZs). A zone could be as small
as a few city blocks (such as central Santa Rosa)
or as large as 100 square miles in rural areas
(such as northwestern Sonoma County).
The travel demand model estimates the number
of trips going to and from each zone. Trips are
divided by purpose — work trips, school trips,
and other trips. Each of these zones attracts and
produces a certain number of trips based on the
amount of residential, offce, industrial, recre-
ation, and commercial development in the zone.
Zones with high levels of residential develop-
ment produce many trips, zones with high levels
of commercial, offce, or industrial development
attract many trips.
The output of this step is a table summarizing
the number of different types of trips produced
by and attracted to each zone.

A-47.
DRAFT COMPREHENSIVE TRANSPORTATION PLAN — JULY 2021 | Appendices
Trip distribution: who goes where?
Trip distribution allocates produced trips to
zones that they are attracted to. For example,
after the model estimates the number of
commute trips produced by a zone in Windsor,
this step matches these produced trips to other
zones around the region, such as zones in Santa
Rosa or other regional employment centers.
These linkages are called origin/destination pairs.
A mathematical gravity model is used to deter-
mine where trips are distributed. The larger two
zones are in terms of employment and/or popu-
lation, and the closer they are in distance, the
more trips will likely be generated between them.
This step produces an origin/destinations table,
which is a large matrix showing the estimated
number of trips moving between the different
zones.
Mode choice: how do people travel?
In the third step of the four-step modeling
process the model uses observed travel mode
shares to estimate which proportion of total trips
are made using different modes of transportation
such as driving alone, carpooling, taking transit,
walking, or biking.
The output of this step is a breakdown of what
travel modes are being used for different types
of trips within the county.
Trip assignment: what routes do people take?
In this fnal step, the model selects the most likely
path for each trip. The model assumes people
will take the fastest route avoiding traffc and
congestion where possible. Each trip is examined
and a best path is determined while minimizing
the time and distance needed to travel from zone
to zone.
The fnal product of this step is a transportation
network representing generalized countywide
roadway, transit, and other transportation facil-
ities with attached future travel and traffc
estimates for specifc road sections and ridership
for transit routes.
II. PROJECTED CONDITIONS
Staff and consultants have used real world traffc
counts, mobile source data assembled as part
of the Sonoma County Travel Behavior Study,
and travel survey data to validate the SCTM and
ensure accuracy for the model base year of 2015.
Demographic and Transportation System Assumptions
The socio-economic forecasts used in SCTM
2020 are based on projected buildout of local
general and specifc area plans. Staff worked
with local planning agencies to review estimates
of existing growth and to estimate and review
future projected growth at the traffc anal-
ysis zone level. Analysis years are 2015, which
provides an estimate of existing conditions and a
variable future planning horizon which simulates
local plan buildout.
Population and employment are projected to
rise steadily in the future. Sonoma County’s 2015
population of 502,000 is projected to increase
to 622,000 by 2050, an increase of 120,000
persons, a 24% total increase or a roughly .7%
increase per year. Employment is projected to
grow from 217,000 in 2015 to 312,000 through
general plan buildout. This represents a potential
increase of 95,000 jobs, a 44% total increase,
or a roughly 1.26% increase per year. Population
and job growth are projected to be centered
on the Highway 101 corridor and focused on

A-48
Appendices | DRAFT COMPREHENSIVE TRANSPORTATION PLAN — JULY 2021
FIGURE 2. SCTM MODEL NETWORK
existing urbanized areas. Average household size
was 2.6 persons per household in 2015, which is
projected to increase to 2.7 persons per house-
hold in the future.
The SCTM generalizes the countywide trans-
portation facilities as a transportation network
(see fgure 4). The 2015 model networks are
based on networks created as part of the devel-
opment of the original Sonoma County Travel
Model (SCTM), Santa Rosa Travel Model, Rohnert
Park Travel Model, Windsor Travel Model, and
Petaluma Travel Model. Road and bicycle/
pedestrian networks have been updated based
on feedback from local engineering and public
works staff. Transit route networks are based on
GTFS (General Transit Feed Specifcation) data.
GTFS feeds are regularly updated by transit
providers and include information on routes,
stop locations, headways, and fares. Transit
networks were further checked against posted
A-49.
DRAFT COMPREHENSIVE TRANSPORTATION PLAN — JULY 2021 | Appendices
transit route, stop, fare, and headway information
posted by transit providers.
III. PRICING ASSUMPTIONS
The following pricing assumptions are used in
SCTM 2020:
Automobile Operating Costs: Baseline 2015
perceived automobile operating cost is esti-
mated at 18.91 cents per mile. This perceived
operating cost is assumed to stay constant in the
future. Fuel price fuctuations and increases are
expected to be offset by improvements in vehicle
fuel economy. Operating costs may be adjusted
during scenario analysis to test potential pricing
impacts on future travel.
Tolls: Toll costs are projected to keep pace
with infation (no increase or decrease in toll
amounts).
Parking: Parking costs are assumed to keep pace
with infation. Parking costs may be adjusted to
test potential pricing impacts on future travel.
Transit Fares: Transit fares are assumed to keep
pace with infation. Transit fares may be adjusted
to test potential pricing impacts on future travel.

A-50
Appendices | DRAFT COMPREHENSIVE TRANSPORTATION PLAN — JULY 2021
A-3. Project.List
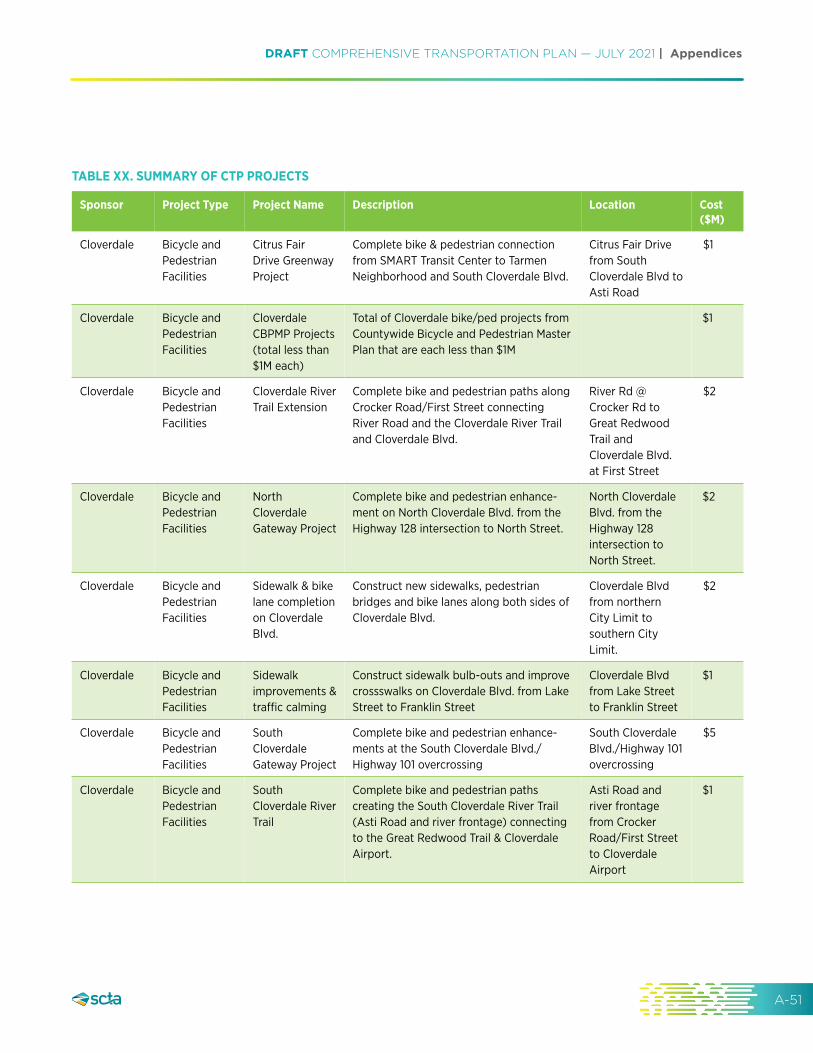
A-51.
DRAFT COMPREHENSIVE TRANSPORTATION PLAN — JULY 2021 | Appendices
TABLE XX. SUMMARY OF CTP PROJECTS
Sponsor Project Type Project Name
Cloverdale Bicycle and Citrus Fair Pedestrian Drive Greenway Facilities Project
Description
Complete bike & pedestrian connection from SMART Transit Center to Tarmen Neighborhood and South Cloverdale Blvd.
Location
Citrus Fair Drive from South Cloverdale Blvd to Asti Road
Cost ($M)
$1
Cloverdale Bicycle and Pedestrian Facilities
Cloverdale CBPMP Projects (total less than $1M each)
Total of Cloverdale bike/ped projects from Countywide Bicycle and Pedestrian Master Plan that are each less than $1M
$1
Cloverdale Bicycle and Pedestrian Facilities
Cloverdale River Trail Extension
Complete bike and pedestrian paths along Crocker Road/First Street connecting River Road and the Cloverdale River Trail and Cloverdale Blvd.
River Rd @ Crocker Rd to Great Redwood Trail and Cloverdale Blvd. at First Street
$2
Cloverdale Bicycle and Pedestrian Facilities
North Cloverdale Gateway Project
Complete bike and pedestrian enhance-ment on North Cloverdale Blvd. from the Highway 128 intersection to North Street.
North Cloverdale Blvd. from the Highway 128 intersection to North Street.
$2
Cloverdale Bicycle and Pedestrian Facilities
Sidewalk & bike lane completion on Cloverdale Blvd.
Construct new sidewalks, pedestrian bridges and bike lanes along both sides of Cloverdale Blvd.
Cloverdale Blvd from northern City Limit to southern City Limit.
$2
Cloverdale Bicycle and Pedestrian Facilities
Sidewalk improvements & trafc calming
Construct sidewalk bulb-outs and improve crossswalks on Cloverdale Blvd. from Lake Street to Franklin Street
Cloverdale Blvd from Lake Street to Franklin Street
$1
Cloverdale Bicycle and Pedestrian Facilities
South Cloverdale Gateway Project
Complete bike and pedestrian enhance-ments at the South Cloverdale Blvd./ Highway 101 overcrossing
South Cloverdale Blvd./Highway 101 overcrossing
$5
Cloverdale Bicycle and Pedestrian Facilities
South Cloverdale River Trail
Complete bike and pedestrian paths creating the South Cloverdale River Trail (Asti Road and river frontage) connecting to the Great Redwood Trail & Cloverdale Airport.
Asti Road and river frontage from Crocker Road/First Street to Cloverdale Airport
$1

A-52
Appendices | DRAFT COMPREHENSIVE TRANSPORTATION PLAN — JULY 2021
Sponsor Project Type Project Name Description Location Cost ($M)
Cloverdale Bicycle and Pedestrian Facilities
South Downtown Multimodal Enhancement Project
Construct “Complete Streets” bike & pedestrian facilities by expanding side-walks, constructing new curb ramps, adding crosswalks and bike lanes
South Cloverdale Blvd between Lake Street and Franklin Street
$3
Cloverdale Roadway Improvements
Cloverdale Downtown Complete Streets Improvement Project
Road surface & improvement project intended to extend the efective service
Multiple: Downtown streets including N. Cloverdale Blvd. from Railroad Ave. to Third Street, Commercial Street and Main Street
$1
Cloverdale Roadway Improvements
Cloverdale Neighborhood Streets Reconstruction & Maintenance Pgm
Cloverdale Annual Rehabilitation Program for Local Streets , including slurry seals, seal cracks, asphalt overlays and reconstruction
Citywide $25
Cotati Bicycle and Pedestrian Facilities
Cotati CBPMP Projects (total less than $1M each)
Total of Cotati bike/ped projects from Countywide Bicycle and Pedestrian Master Plan that are each less than $1M
$1
Cotati Bicycle and Pedestrian Facilities
West Cotati Avenue Sidewalks
Closing key gaps in sidewalk between 116 (site of signifcant pending commercial/ residential development) and a key east/ west pedestrian cooridor under US 101 at Cliford, including a school connection to Thomas Page Academy on West Cotati Avenue.
Hwy 116 to Cliford Avenue, West School Street from Richardson to Cliford Avenue.
$2

A-53.
DRAFT COMPREHENSIVE TRANSPORTATION PLAN — JULY 2021 | Appendices
Sponsor Project Type Project Name Description Location Cost ($M)
Cotati Highway Improvements
Highway 116 Cotati Corridor Improvements
This project is a widening of Highway 116 between US 101 and Stony Point Road,
including phased closure of driveway access to 116, the addition of signalized intersections, new bike lanes, and new side-
walk to improve the vehicle LOS, improve the safety of 116 for all modes of transpor-tation, and create safe new corridors for pedestrian and bicyclists. Improvements to this State facility are identifed in the adopted Bike and Ped Master Plan, as well as the City’s General Plan.
Cotati, from US 101 to Stony Point Road
$15
Cotati Multimodal Streetscape Improvements
La Plaza Reunifcation
Joining of all 4 legs of La Plaza Street around La Plaza Park, and re-routing vehicle and bicycle trafc around La Plaza Park to connections with Old Redwood Highway, West Cotati Avenue, West Sierra Avenue, and East Cotati Avenue. Project would re-create the central town plaza and encourage and activate a pedestrian and bicycle friendly downtown.
Old Redwood Highway @ East Cotati Avenue
$15
Cotati Multimodal Streetscape Improvements
Old Redwood Hwy rehab — Plaza to Gravenstein Hwy
This project consists of widening Old Redwood Highway for safer bike lanes, sidewalks, and center island medians. Also includes various signal improvements to improve congestion.
Cotati, Old Redwood Highway between La Plaza Park and Highway 116.
$8
Cotati Highway Improvements
US 101/Highway 116 North Bound On-Ramp Improvements
This project is the creation of traditional north bound on-ramp for US 101 at the interchange with Highway 116. Highway 116 currently circulates through city streets to reach the US 101 north bound on-ramp at the intersection of Commerce Boulevard and Old Redwood Highway. This project will create a new leg from the existing US 101 south bound of ramp to provide a safer and more efcient path for trafc on Highway 116.
Cotati, at the US 101 and Highway 116 interchange.
$10

A-54
Appendices | DRAFT COMPREHENSIVE TRANSPORTATION PLAN — JULY 2021
Sponsor Project Type Project Name Description Location Cost ($M)
Cotati Highway Improvements
US 101/Railroad Avenue Improvements.
This project is the creation of a new south bound of ramp and north bound on ramp at Railroad Avenue. There continues to be growth outside of Cotati and Pengrove that will exacerbate trafc in both Pengrove and in downtown Cotati, as these are the only options to access US 101. Improvements would include safety improvements on Railroad Avenue from Petaluma Hill to US 101.
Cotati, at the US 101 and West Railroad Avenue interchange. Railroad Ave from Petaluma Hill Road to US 101.
$40
Cotati Highway Improvements
US 101/West Sierra Avenue South Bound Of-Ramp Improvements
This project is the creation of a new south bound of ramp at West Sierra Avenue to improve transportation options for vehi-cles traveling south bound on US 101 by giving vehicles another option to access the Cotati/ southern Rohnert Park area, and relieving congestion at the US 101/116 interchange. Currently, no other south bound option exists between Highway 116 and Old Redwood Highway in Petaluma.
Cotati, at the US 101 and West Sierra Avenue interchange.
$10
Cotati Roadway Improvements
Pavement Maintenance Program
Annual Rehabilitation Program for Local Streets in Cotati — $3.8M/yr is to reduce the backlog from $10.7M to $0.83M in the frst 5 years ($19M total). Years 6-25, the on-going maintenance needs are about $1M/yr ($20M total). Total need for basic pavement maintenance over 25 years is $39M.
various streets in Cotati
$39
Healdsburg Bicycle and Pedestrian Facilities
ADA Upgrades Sidewalk repair, gap closures, and ramp upgrades.
City-wide $8
Healdsburg Bicycle and Pedestrian Facilities
Foss Creek Pathway Class II
Class 2 (Bike Lanes) Healdsburg Ave. Northern City Limits to Grove St./Healdsburg Ave. Intersection
$1

A-55.
DRAFT COMPREHENSIVE TRANSPORTATION PLAN — JULY 2021 | Appendices
Sponsor Project Type Project Name Description Location Cost ($M)
Healdsburg Bicycle and Pedestrian Facilities
Foss Creek Pathway Segment 0 — South City Limit to Bridge
Foss creek path current southerly terminus is Front Street. This project will take the path across R/R tracks and front street (possible mid block crossing) and create a pathway through Railroad Park and connect to the Healdsburg Avenue Bridge over the Russian River.
Southern City Limits on Healdsburg Avenue to Healdsburg Bridge
$2
Healdsburg Bicycle and Pedestrian Facilities
Foss Creek Segments 9 & 10
Construction of Class 1 pathway (ped and bike)
From terminus of Segment 8 at the intersection of Grove and HBG Ave to the City Limit
$4
Healdsburg Bicycle and Pedestrian Facilities
Healdsburg CBPMP Projects (total less than $1M each)
Total of Healdsburg bike/ped projects from Countywide Bicycle and Pedestrian Master Plan that are each less than $1M
$8
Healdsburg Intersection Improvements
Dry Creek Road Improvements
Reconstruct and partially widen Dry Creek to implement street curbs, sidewalks, enhanced safety pedestrian crossing class 1 pathway and lane reconfguration; recon-struct and widen north half of Grove St/ Dry Creek Rd intersection.
Dry Creek Road: from Healdsburg Avenue inter-section to Hwy 101 interchange under-crossing.
$7
Healdsburg Multimodal Streetscape Improvements
Grove Street Neighborhood Plan Implementation — Complete Streets
Road improvements including curb, gutter, sidewalk, and bike facilities. Complete street project.
Grove Street between Grant Street and Dry Creek Road.
$3
Healdsburg Multimodal Streetscape Improvements
Healdsburg Avenue Complete Street Improvement Powell to N CityLim
Road diet, bicycle facilities, pedestrian improvements, enhanced safety, and streetscape. Complete street project.
Within existing public Right-of-Way, from Powell Avenue to the Northern City Limits.
$10

A-56
Appendices | DRAFT COMPREHENSIVE TRANSPORTATION PLAN — JULY 2021
Sponsor Project Type Project Name Description Location Cost ($M)
Healdsburg Multimodal Streetscape Improvements
Healdsburg Avenue-Mill Street Improvements
Reconstruct Healdsburg Avenue to re-align street curbs, reduce number of vehicle lanes, implement parking, landscaped center medians, sidewalks and other pedestrian features. Mill Street reconstruc-tion and partial widening to implement street curbs, sidewalks, and possibly lane reconfguration.
Healdsburg Avenue: from Mill St/Vine St (5-way intersection) to Exchange Ave. Mill Street: from Healdsburg Ave/ Vine St (5-way intersection) to Hwy 101 under-crossing
$2
Healdsburg Multimodal Streetscape Improvements
Healdsburg Plaza Streetscape Rehabilitation
Streetscape project to improve safety and remove ADA barriers on all walkways within the Healdsburg Plaza extending down Center Street up to and include Police Department frontage.
All walkways within the Healdsburg Plaza extending down Center Street upto and include Police Department frontage
$2
Healdsburg Intersection Improvements
US-101 Central Healdsburg Oframp Improvements (Roundabout)
The Northbound 101 oframp crosses Soutbound Healdsburg Avenue (stop sign) creating a unique trafc situation. The Central Healdsburg Area Plan calls for a roundabout at this location.
Northbound US 101 oframp at Central Healdsburg
$10
Healdsburg Highway Improvements
US-101 Mill Street Interchange
Complete full interchange by adding SB on and NB of ramps to create diamond interchange with existing SB of and NB onramps.
Mill Street and US-101
$25
Healdsburg Roadway Improvements
Pavement Maintenance Program
$22
Petaluma Bicycle and Pedestrian Facilities
Class 2 bicycle lane segments citywide
Class 2 bike lanes throughout Petaluma Petaluma $1
Petaluma Bicycle and Pedestrian Facilities
Lynch Creek Trail Rehabilitation
Project includes the reconstruction of Lynch Creek Trail which includes a 10’ wide concrete multi use trail, signing striping and new lighting
Lynch Creek Trail from Prince Park to the Petaluma River
$7

A-57.
DRAFT COMPREHENSIVE TRANSPORTATION PLAN — JULY 2021 | Appendices
Sponsor Project Type Project Name Description Location Cost ($M)
Petaluma Bicycle and Pedestrian Facilities
Petaluma CBPMP Projects (total less than $1M each)
Total of Petaluma bike/ped projects from Countywide Bicycle and Pedestrian Master Plan that are each less than $1M
$37
Petaluma Bicycle and Pedestrian Facilities
Petaluma River Trail
Construct a multi-use bicycle and pedes-trian path from shollenber Park to the NWP trail at the petluma River including path and under the SMART rail line and Highway 101
Shollenberger Park to the NWP trail at the petluma River including path and under the SMART rail line and Highway 101
$15
Petaluma Roadway Improvements
Caulfeld Lane Reconstruction
Project includes the reconstruction of Caulfeld Lane from Highway 101 to Garfeld Drive which will also include the installation of curb ramps, new trafc signal detection cameras and striping.
Caulfeld Lane $4
Petaluma Highway Improvements
D Street Reconstruction
Project includes the reconstruction of D Street from Windsor Drive to Petaluma Boulevard South which will also include the installation of curb ramps, new trafc signal detection cameras and striping.
D Street $4
Petaluma Roadway Improvements
East Washington Street Reconstruction
Project includes the reconstruction of East Washington Street from Hwy 101 of Ramp to Bodega Avenue which will also include the installation of curb ramps, new trafc signal detection cameras and striping.
D Street $8
Petaluma Roadway Improvements
Petaluma Crosstown Connector and Rainier Interchange
Extend Rainier Ave to cross highway 101 and terminate at Petaluma Blvd North. Construct interchange with highway 101 and Rainier Ave extension
from Rainier Ave to Petaluma Blvd North, crossing highway 101
$115
Petaluma Roadway Improvements
Southern Crossing at Caulfeld Lane
Construct extension of Caulfeld Lane to cross the Petaluma River and terminate at Petaluma Boulevard South
the southern end of the City of Petaluma to cross the Petaluma River
$72

A-58
Appendices | DRAFT COMPREHENSIVE TRANSPORTATION PLAN — JULY 2021
Sponsor
Petaluma
Project Type
ITS & New Technologies
Project Name
Trafc Signals ITS Upgrades
Description
Project includes the installation of fber optic interconnect communication, upgrading trafc controllers with adaptive upgrades, advanced detection system for automated trafc signal performance measures and the installation of battery backup systems to create a comprehensive transportation network that is intelligent, scalable, fexible and resilient during a natural disaster.
Location
City of Petaluma
Cost ($M)
$10
Petaluma Roadway Improvements
Washington Street Bridge Seismic Retroft
Seismically retroft the Washington Street bridge
Washington Street over the Petaluma River, between Water Street and Grey Street
$4
Petaluma Roadway Improvements
Various Pavement Maintenance Projects
Overlays, reconstruction, rehabilitation of the existing street system
various locations $125
Petaluma Transit
Transit Capital Projects
Bus Replacements (transitioning toward zero emissions feet by 2029)
Routine replacement of Petaluma Transit and Petaluma Paratransit revenue vehicle feet, following FTA useful life cycles and via MTC’s TCP process
Petaluma $17
Petaluma Transit
Transit Improvements — Non Capital
Fare Free Program
Discounted or fare-free programs system-wide or for specifc groups, such as K-12, seniors, low-income, weekend pilot, summer pilot, or paratransit riders.
Petaluma, CA $14
Petaluma Transit
Transit Capital Projects
Fleet Expansion Fleet expansion for fxed route and paratransit service in order to ofer more service and meet growing demand.
Petaluma $5
Petaluma Transit
Transit Capital Projects
Ongoing Bus Stop Improvements
Addition of shelters, benches, trash cans, real-time information displays, concrete accessibility pads, solar security lighting, maps, infoposts, etc. at various existing bus stops in Petaluma.
Petaluma $10

A-59.
DRAFT COMPREHENSIVE TRANSPORTATION PLAN — JULY 2021 | Appendices
Sponsor
Petaluma Transit
Project Type
Transit Improvements — Non Capital
Project Name
Petaluma Transit — Ongoing Operations
Description
Operating costs for Petaluma Transit and Petaluma Paratransit, based upon September 2019 service levels and costs.
Location
Petaluma
Cost ($M)
$84
Petaluma Transit
Transit Improvements — Non Capital
Service expansion
Service expansion including increased service and span on major routes & arterials, additional weekend and holiday service, additional west side and school tripper service, Phase I BRT implementa-tion on E. Washington.
Petaluma $56
Petaluma Transit
Transit Capital Projects
Transit Fleet & Facility Electrifcation (transitioning toward zero emissions feet by 2029)
Purchase of Battery Electric Fixed Route and Paratransit buses (diferential cost), facility charging infrastructure, purchase of Evergreen power, solar array, and backup generator.
Petaluma, CA $16
Petaluma Transit
ITS & New Technologies
Transit Innovation Projects
Innovative transit projects using new tech-nology to serve new markets, including micro-transit, TNC partnership, automated vehicle pilot program, AVL upgrades, and school tripper technology.
Petaluma, CA $15
Petaluma Transit
Transit Capital Projects
Transit Maintenance, Operations & Admin Facility Rehab, Phase IV
Improves security, safety, and accessibility by rehabilitating the Petaluma Transit MO&A yard and entry points.
555 N. McDowell Blvd. Petaluma, CA 94954
$1
RCPA Bicycle and Pedestrian Facilities
Countywide Bicycle and Pedestrian Signage Program
Develop and implement a countywide bicycle and pedestrian signage program based on recommendations in the SCTA Countywide Bicycle and Pedestrian Master Plan, 2014 Update. Program would facilitate and encourage bike/ped access to/from major centers of activity (SMART, transit hubs, employment centers, shop-ping centers, schools).
Countywide $1
RCPA Travel Demand Management
GreenTRIP Sonoma County
Customize and pilot use of one or more GreenTRIP tools in Sonoma County (certifcation program, parking database, connect). http://www.transformca.org/ landing-page/greentrip
Pilot jurisdic-tion(s) to be determined
$1

A-60
Appendices | DRAFT COMPREHENSIVE TRANSPORTATION PLAN — JULY 2021
Sponsor Project Type Project Name Description Location Cost ($M)
RCPA Emission Rural EV Develop a network of EV charging stations Various — see $6 Reduction Charger on government-owned properties outside description Technologies Network of major city centers at locations that may
not receive traditional grant funding due to being outside of long-standing cell-cov-erage zones required for grant-mandated network chargers and/or would require match funding that is currently a barrier for access to grant funding. A method-ology developed by the County of Santa Clara Ofce of Sustainability indicate that non-residential public EV chargers that are available 7 days/week reduce 6.77 MTCO2e/year. https://www.sccgov. org/sites/dnz/Documents/Task-3D-EV-Charging-Stations-as-GHG-Mitigation-
Mechanism-under-CEQA_White-Paper.pdf Location: Identifed government-owned locations for 280 charging ports include: Cloverdale Park & Ride, Geyserville Park & Ride, Guerneville Park & Ride, Ragle Ranch Regional Park, Healdsburg Veterans Memorial Beach Regional Park, Los Guilicos Juneville Hall Facilities, Penngrove Park & Ride, Boyes Hot Springs Park & Ride, Tom Schopfin Fields Regional Park, Cotati Park & Ride #1, Healdsburg Park & Ride, Occidental Community Center, Shiloh Ranch Regional Park, Spring Lake Regional Park Upper Lot Shady Oaks, Taylor Mountain Regional Park, North Sonoma Mountain Regional Park, Maxwell Farm Regional Park, Cotati Park & Ride #2, Spring Lake Regional Park Lower Parking Lot, Sebastopol Park & Ride, Schellville Park & Ride, Occidental Park & Ride East Upper Lot #2, Monte Rio Recreation And Park District, Monte Rio Creekside Park, Helen Putnam Regional Park, Gualala Point Regional Park, Fulton Park & Ride, River Keeper Stewardship Park, Stillwater Cove Regional Park

A-61.
DRAFT COMPREHENSIVE TRANSPORTATION PLAN — JULY 2021 | Appendices
Sponsor
Rohnert Park
Project Type
Bicycle and Pedestrian Facilities
Project Name
Central Rohnert Park PDA Complete Streets Improvements
Description
Various improvements within the Central Rohnert Park Priority Development Area to improve active and multi-modal transportation, including but not limited to: enhanced pedestrian/bike crossings or infrastructure (over- or under-crossings or bridges) at arterials and/or the SMART rail line; trafc calming devices; trafc signal detection and/or ped/bike actua-tion; median, sidewalk, curb and gutter improvements including bulbouts, pedes-trian safety islands; striping and pavement markings; street furniture and amenities including bike storage; bus stop amenities; wayfnding signage.
Location
Various loca-tions in Central Rohnert Park PDA, bounded by Highway 101 on the west, SMART railroad on the east, and Avram Avenue on the south
Cost ($M)
$6
Rohnert Park
Bicycle and Pedestrian Facilities
Enhanced Bike/ Pedestrian Crossings at NWP Railroad
Enhanced Bike/Pedestrian Crossings at NWP Railroad
Intersection of NWP Railroad (SMART Rail) at Southwest Boulevard, Rohnert Park Expressway, Hinebaugh Creek, and Golf Course Drive
$2
Rohnert Park
Bicycle and Pedestrian Facilities
Highway 101 Bicycle/ Pedestrian Crossing
Bike/pedestrian bridge crossing of Highway 101, location to be determined through Measure M funded feasibility study
TBD $7
Rohnert Park
Bicycle and Pedestrian Facilities
New Bike/ Pedestrian Path Crossing Hwy 101 at Hinebaugh Creek
Bike/pedestrian over- or under- crossing of Highway 101 at Hinebaugh Creek, from approximately Commerce Boulevard (west of Highway 101 ) to approximately Redwood Drive (east of Hwy 101)
Hinebaugh Creek at Hwy 101
$5
Rohnert Park
Bicycle and Pedestrian Facilities
Rohnert Park CBPMP Projects (total less than $1M each)
Total of Rohnert Park bike/ped projects from Countywide Bicycle and Pedestrian Master Plan that are each less than $1M
$12

A-62
Appendices | DRAFT COMPREHENSIVE TRANSPORTATION PLAN — JULY 2021
Sponsor
Rohnert Park
Project Type
Bicycle and Pedestrian Facilities
Project Name
Rohnert Park Class I Bike Paths Reconstruction
Description
Reconstruction of existing Class I bike paths, replacing existing asphalt paths with concrete, at various locations in Rohnert Park.
Location
Bike paths in Rohnert Park along Copeland Creek, Hinebaugh Creek, Five Creek, Crane Creek, Labath Creek, Commerce Boulevard, Camino Colegio
Cost ($M)
$14
Rohnert Park
Bicycle and Pedestrian Facilities
Trail to Crane Creek Regional Park
Construction of a multi-use trail connecting Water Tank No. 8 service road east of Petaluma Hill Road to Crane Creek Regional Park.
Water Tank #8 Service Road to Crane Creek Regional Park
$3
Rohnert Park
Roadway Improvements
Bodway Parkway Extension
Extension of Bodway Parkway between Valley House Drive and East Railroad Avenue. The extension will include two travel lanes, a Class II bikeway on both sides of the street, sidewalks and a land-scape strip.
Bodway Parkway, between Valley House Drive and East Railroad Avenue
$4
Rohnert Park
Intersection Improvements
Bodway Parkway Roundabouts
Construction of new roundabouts Bodway Parkway & Valley House Drive, Bodway Parkway & East Cotati Avenue
$8
Rohnert Park
Intersection Improvements
Camino Colegio Corridor Roundabouts
Construction of new roundabouts Bodway Parkway & Camino Colegio, Mitchell Drive & Camino Colegio
$6
Rohnert Park
Roadway Improvements
Central Rohnert Park PDA — Rohnert Park Expressway Slip Streets
Four slip streets on both sides of Rohnert Park Expressway between Commerce Boulevard and SMART Railway, each consisting of 10’ vehicular travel lane, 18’ diagonal parking lane, and 8’ concrete bike path
Parallel to Rohnert Park Expressway between Commerce Boulevard and State Farm Drive, and State Farm Drive and the SMART Railway.
$4

A-63.
DRAFT COMPREHENSIVE TRANSPORTATION PLAN — JULY 2021 | Appendices
Sponsor
Rohnert Park
Project Type
Roadway Improvements
Project Name
Central Rohnert Park PDA – Commercial Connector Street Completion
Description
Extension of City Center Drive between State Farm Drive and Commerce Boulevard (currently “Padre Center Parkway”); new street connecting Rohnert Park Expressway to City Center Drive; new street connecting Rohnert Park Expressway; three trafc signals; widening of Commerce Boulevard Bridge over Hinebaugh Creek
Location
Driveway of Padre Park Center between Commerce Boulevard and State Farm Drive, and between State Farm Drive and Hunter Drive, south of Rohnert Park Expressway.
Cost ($M)
$6
Rohnert Park
Intersection Improvements
Central Rohnert Park PDA Roundabouts
Construction of two roundabouts in Central Rohnert Park PDA
State Farm Drive & Enterprise Drive, State Farm Drive & Commerce
$7
Rohnert Park
ITS & New Technologies
Citywide Advanced Trafc Management System (ATMS) Implementation
Implementation of Citywide ATMS at 26 of 38 existing intersections (including cabinet and detection replacement/upgrade; ATMS infrastructure/software, programming) and installation of 6.7 miles of fber or copper in new interconnect conduit.
Citywide $6
Rohnert Park
Roadway Improvements
Dowdell Avenue Extension
Extension of Dowdell Avenue between Wilfred Avenue and Business Park Drive. Includes 2 travel lanes, bridge improve-ment at Business Park Drive, trafc light / improvements improvements at intersec-tion of Business Park Drive, Class II bike lanes on both sides, sidewalks and land-scaping. This project will help complete a roadway segment that is the preferred route for SCT’s buses
Dowdell Avenue, from Wilfred Avenue to Business Park Drive
$7
Rohnert Park
Roadway Improvements
Redwood Drive Bridge Replacement at Hinebaugh Creek
Redesign and replacement of vehicular bridge
Redwood Drive at Hinebaugh Creek
$10

A-64
Appendices | DRAFT COMPREHENSIVE TRANSPORTATION PLAN — JULY 2021
Sponsor
Rohnert Park
Project Type
Roadway Improvements
Project Name
Snyder Lane Widening – San Francisco Dr to Golf Course Dr
Description
Retain west side travel lanes, landscaping, sidewalk, curb and gutter; demolish east side travel lane and bikeway and replace with new, expanded road section with two travel lanes, Class II bike lane, landscaping strip and sidewalk. Includes three bridge widenings at Hinebaugh Creek, Five Creek and Crane Creek.
Location
Snyder Lane Widening, from San Francisco Drive to Golf Course Drive
Cost ($M)
$8
Rohnert Park
Intersection Improvements
Southwest Avenue Corridor Roundabouts
Construction of three roundabouts on Southwest Boulevard
Southwest & Commerce, Southwest & No Name Street, Southwest & Adrian Drive
$8
Rohnert Park
Roadway Improvements
Southwest Boulevard Corridor Improvements
Overlay and reconstruction of Southwest Boulevard and complete streets imple-mentation as well as streetscape and urban design improvements to encourage bicycle and pedestrian use while accom-modating vehicular trafc.
Bodway Parkway, between Valley House Drive and East Railroad Avenue
$2
Rohnert Park
Roadway Improvements
State Farm Drive Overcrossing
Overcrossing of Highway 101 between State Farm Drive and Business Park Drive consisting of bridge overpass with two (2) vehicular travel lanes, two (2) unprotected bike lanes, pedestrian access.
Between State Farm Drive/ Commerce Boulevard inter-section on east side of Highway 101 and Business Park Drive/ Redwood Drive intersection west of Highway 101
$17
Rohnert Park
Roadway Improvements
Maintain Pavement System – Road Rehabilitation
Road reconstruction as necessary to main-tain PCI between 66-80 for entire network over 25 years
Rohnert Park — citywide
$93
Rohnert Park
Roadway Improvements
Pavement Maintenance Program
Annual preventive maintenance program to maintain PCI between 66-80 for entire network over 25 years
Rohnert Park — citywide
$19

A-65.
DRAFT COMPREHENSIVE TRANSPORTATION PLAN — JULY 2021 | Appendices
Sponsor Project Type Project Name Description Location Cost ($M)
Santa Rosa Bicycle and Citywide Bicycle Construct bicycle and pedestrian proj- Citywide, such as $6 Pedestrian and Pedestrian ects based on the results of the studies Fourth St/College Facilities Projects 1st conducted in the Climate Adaptation, Ave, Stony Point
Phase — Plan Technology and Innovative Solutions Rd, Northeast Update (Transportation Initiatives) program- connections and
matic project implementing Bicycle and Roseland Creek Pedestrian Master Plan priorities trail.
Santa Rosa ITS & New Climate Programmatic eforts to address Climate Corridors and $7 Technologies Adaptation adaptation — Improve transit corridor intersections
Technology efciency reducing per-trip travel time throughout the Innovation and per-capita CO2 emissions. Continue city, citywide Transport to implement emission reduction tech- programs Initiatives nologies to improve the fow of trafc
and adapt to emerging technology related to mobility options (autonomous vehicles) with the deployment of ITS technology, upgraded signal controllers. Complete First Phase active transportation corridor studies identifed in the Bicycle & Pedestrian Master Plan Update 2018 (BPMPU 2018) Implement Short term Implementation goals identifed in the BPMPU 2018, such as Vision Zero, safe routes to school, frst & last mile connec-tions to transit & rail, regional bike share, bike & pedestrian safety & education activ-ities. Ongoing programs to support these transportation initiatives. This project also includes intersection improvements, transit improvements, bicycle and pedestrians facilities and emission reduction technolo-gies. Total cost estimate — $6.5

A-66
Appendices | DRAFT COMPREHENSIVE TRANSPORTATION PLAN — JULY 2021
Sponsor Project Type Project Name Description Location Cost ($M)
Santa Rosa Bicycle and East West Phase 1 — This project proposes to Bicycle and $24 Pedestrian Bicycle and construct a bicycle and pedestrian over- Pedestrian bridge Facilities Pedestrian crossing of US Highway 101 in northern over Highway
Connections Santa Rosa, connecting the Mendocino 101 connecting Avenue high-frequency transit corridor SMART station and Santa Rosa Junior College Campus and Santa Rosa with the Coddingtown Transit Hub Junior College and North Santa Rosa SMART Station (SRJC), Jennings area. This project has been identifed Avenue crossing as a high-priority project in City public at SMART, bicycle engagement and planning processes lane gap closures for the past 25 years, and since 2010 on Guerneville substantial work has been completed to Road/Steele Lanemove the project forward towards the construction phase, including completion of a Caltrans Project Initiation Document (PID) and funding of the environmental and design phases of the project. With the 2017 initiation of SMART rail service to the North Santa Rosa Station within ½ mile of the proposed overcrossing, and concur-rent improvement of Santa Rosa CityBus bus service to the Mendocino Avenue Corridor and Coddingtown Transit Hub, this overcrossing has grown in importance for connecting bicyclists and pedestrians with important transit facilities to the east and west of US 101 in Santa Rosa. ($14.0
M) — 2022 Phase 2 — Construct a bike and pedestrian at grade crossing at Jennings Avenue @
SMART ($5.0 M) — 2025 Phase 3 — Install bike lanes on Steele Lane/Guerneville Road ($5.0 M) — 2030
Santa Rosa Bicycle and Santa Rosa Total of Santa Rosa bike/ped projects from $108 Pedestrian CBPMP Projects Countywide Bicycle and Pedestrian Master Facilities (total less than Plan that are each less than $1M
$1M each)

A-67.
DRAFT COMPREHENSIVE TRANSPORTATION PLAN — JULY 2021 | Appendices
Sponsor
Santa Rosa
Project Type
Bicycle and Pedestrian Facilities
Project Name
Southeast Greenway Multi Use Path and Crossings
Description
Provide continuous pedestrian, bicycle, and non-motorized transportation connec-tions from Spring Lake Regional Park to Farmers Lane and links to downtown Santa Rosa, surrounding neighborhoods and schools, and the regional trail system. This project could also include multimodal streetscape improvements at crossings.
Location
The proposed project would result in a multi use pathway and crossings within the 57-acre area that spans a 1.9-mile linear path from Farmers Lane/ State Route (SR) 12 to Spring Lake Regional Park.
Cost ($M)
$20
Santa Rosa Multimodal Streetscape Improvements
Southeast Santa Rosa Multi Modal Resiliency Corridor Enhancement — Bike/Ped
Phase 1 — Pedestrian and bicycle enhance-ments and safety enhancements at 4th Street and Hwy 12/Farmers Lane. ($8.0
M) — 2030 Phase 4 — Construct a shared use bike and pedestrian path (Taylor Mountain Regional Park Trail) from Bennett Valley Road/ Farmers Lane to Petaluma Hill Road/ Yolanda Avenue ($10.0 M) — 2045
Farmers Lane between the intersection of Bennett Valley Road and Farmers Lane and the intersection of Petaluma Hill Road and Yolanda Avenue, Yolanda Avenue between Petaluma Hill Road and Santa Rosa Avenue, Fourth Street at Farmers Lane and Taylor Mountain Regional Park Trail parallel to Farmers Lane
$18
Santa Rosa Roadway Improvements
Bellevue Avenue Improvements
This project would construct one travel lane in each direction plus a center turn lane or median from Stony Point Road to Santa Rosa Avenue with overcrossing at Highway 101. Project would add bike lanes and sidewalks. It would also realign the western portion of the corridor to align with Ludwig Avenue.
Bellevue Avenue from Santa Rosa Avenue to Stony Point Road
$40

A-68
Appendices | DRAFT COMPREHENSIVE TRANSPORTATION PLAN — JULY 2021
Sponsor Project Type Project Name Description Location Cost ($M)
Santa Rosa Roadway Improvements
Chanate Road — Resiliency Corridor
The scope of this project includes:Fire evacuation route (Mendocino Avenue to Parker Hill Road) includes roundabout @ Parker Hill Rd and Chanate Rd and modi-fying existing median.
Chanate Road from Mendocino Avenue to Parker Hill Road
$13
Santa Rosa Roadway Improvements
Community Evacuation Routes
This project would modify existing road-ways to enhance evacuation strategies in the event of a disaster primarily on arterials associated with wildland urban interface (WUI) areas. This project could also include intersection improvements
Citywide arte-rials associated with wildland urban interface areas, such as Fountaingrove Parkway, Montgomery Drive, Piner Road
$20
Santa Rosa Multimodal Streetscape Improvements
Downtown Connectivity to Support Housing Density Intensifcation
Projects to be determined pending City Council approval early 2020, possible multi modal transportation projects that address climate adaptation, housing intensifca-tion and fnancial stability could include Fourth Street, Sixth Street, Third Street, B Street, Healdsburg Avenue, Mendocino Avenue streetscape. (In addition to the project type selected below the project could include the following components — Bicycle and pedestrian, ITS and new technologies, TDM, transit, intersection improvements).
Within the Downtown Station Area Specifc Plan boundary
$25
Santa Rosa Roadway Improvements
Dutton Meadows from Hearn Ave to Bellevue Ave
Widen and reconstruct, construct side-walks and bike lanes
Dutton Meadows from Hearn Ave to Bellevue Ave
$7
Santa Rosa Roadway Improvements
Fresno Avenue extension from Northpoint Pkwy to Ludwig Ave
Construct new road between Northpoint Parkway and Ludwig Avenue, sidewalk and bike lanes
Fresno Avenue from Northpoint Pkwy to Ludwig Avenue
$8
Santa Rosa Roadway Improvements
Fresno Avenue from Northpoint Pkwy to Finley Avenue
Construct new road between Northpoint parkway and Finley Avenue.
Fresno Ave from Northpoint Pkwy to Finley
$8

A-69.
DRAFT COMPREHENSIVE TRANSPORTATION PLAN — JULY 2021 | Appendices
Sponsor
Santa Rosa
Project Type
Highway Improvements
Project Name
Fulton Road Interchange @ Hwy 12 — Phase 2
Description
Convert the existing signalized intersection of Fulton Road and Highway 12 into a full interchange (including sidewalks and bike lanes)
Location
Fulton Road Interchange @ Hwy 12
Cost ($M)
$50
Santa Rosa Highway Improvements
Hwy 101 Corridor Interchange Improvements
Phase 1 — Reconstruct the over crossing and interchange at Hearn Avenue and Highway 101, including the addition of turn lanes, bike lanes and sidewalks. ($28.0 M
construction phase) — 2022 Phase 2 — Reconstruct the over crossing and interchange at Mendocino Ave/ Hopper Ave and Highway 101, including the addition of turn lanes, bike lanes and sidewalks as part of the recovery and resil-iency and fnancial stability eforts $40.0
M — 2040 Phase 3 — Expand bike, pedestrian, transit, and vehicle improvements across Hwy 101 in south Santa Rosa at Bellevue Avenue and Highway 101 so that mobility options are available to all south Santa Rosa neighborhoods, an under served area, and encourage a healthy climate for business and growth. $30.0 M — 2040
Hearn Ave, Mendocino Ave/Hopper Ave, Bellevue Ave,interchanges @ Hwy 101
$98
Santa Rosa Roadway Improvements
Kawana Springs Road widen Santa Rosa Avenue to Petaluma Hill Rd
Widen road, construct sidewalks and bike lanes
Kawana Springs Road widen Santa Rosa Avenue to Petaluma Hill Rd
$5
Santa Rosa Roadway Improvements
Maintain Transportation System — Road Rehabilitation
Rehabilitate existing transportation system in a state of good repair Citywide (recon-struction, thin mill overlay, full depth reclamation. Street Saver 25 years uncon-straint PCI 63–73
Citywide $410

A-70
Appendices | DRAFT COMPREHENSIVE TRANSPORTATION PLAN — JULY 2021
Sponsor Project Type Project Name Description Location Cost ($M)
Santa Rosa Roadway Improvements
Northpoint Parkway Improvements Bellevue Avenue to S.Wright Road
This project would construct a new roadway connection from Fresno Avenue to S. Wright Road and construct a new roadway from Stony Point Road to Dutton Avenue. The improvements will include sidewalk and bike lanes. Intersection improvements will also be part of the project.
Northpoint Parkway from S. Wright Road to Bellevue Avenue
$25
Santa Rosa Roadway Improvements
Northpoint Pkwy — Extend from Fresno to S. Wright
Construct new road between Fresno and S. Wright Road
Stony Point Rd from Hearn Ave to Santa Rosa City Limits
$11
Santa Rosa Roadway Improvements
Petaluma Hill Road widen Aston Ave to Santa Rosa City limit
Widen road, construct sidewalks and bike lanes
Petaluma Hill Road from Aston Ave to Santa Rosa City limit
$25
Santa Rosa Roadway Improvements
Piner Road widen Marlow Road to Fulton Road
Widen to four lanes including sidewalks and bike lanes
Piner Road from Marlow Road to Fulton Road
$32
Santa Rosa Roadway Improvements
Roberts Avenue Improvements
This project would extend Roberts Avenue under Highway 12 connecting to the existing roadway on the north and south side of Highway 12.
Roberts Avenue existing roadway segment south of Highway 12 to the existing roadway segment north of Highway 12
$20
Santa Rosa Roadway Improvements
Sebastopol Road Corridor Plan widen Dutton Ave to Stony Point Rd
Construct travel lanes in each direction, widen sidewalks, bike lanes, center turn lane or medians, street furniture. This project also includes multi modal streets-cape improvements
Sebastopol Road Corridor Plan from Dutton Avenue to Stony Point Road
$27
Santa Rosa Roadway Improvements
Sebastopol Road Corridor Plan widen Olive Street to Dutton Avenue
travel lanes, wide sidewalks, bike lanes, center turn lane or medians, street furniture
Sebastopol Road Corridor Plan from Olive Street to Dutton Avenue
$15

A-71.
DRAFT COMPREHENSIVE TRANSPORTATION PLAN — JULY 2021 | Appendices
Sponsor Project Type Project Name Description Location Cost ($M)
Santa Rosa Multimodal Streetscape Improvements
Southeast Santa Rosa Multi Modal Resiliency Corridor Enhancement — Road
Phase 2 — Improve and widen Yolanda Avenue between Petaluma Hill Road and Santa Rosa Avenue including 2 travel lanes in the westbound direction and one travel lane in the eastbound direction with a center two way left turn lane, adding bike
lanes and sidewalks. ($20.0 M) — 2035 Phase 3 — Construct Farmers Lane from Bennett Valley Road and Farmers Lane to Petaluma Hill Road at Yolanda Avenue. The project will include sidewalks, bike lanes, transit route and serve as an evacuation route. ($46.0 M) — 2030
Farmers Lane between the intersection of Bennett Valley Road and Farmers Lane and the intersection of Petaluma Hill Road and Yolanda Avenue, Yolanda Avenue between Petaluma Hill Road and Santa Rosa Avenue, Fourth Street at Farmers Lane and Taylor Mountain Regional Park Trail parallel to Farmers Lane
$66
Santa Rosa Roadway Improvements
Stony Point Road widen from Hearn Ave to Santa Rosa City limit
Widen to four lanes including sidewalks and bike lanes
Stony Point Rd from Hearn Ave to Santa Rosa City Limits
$20
Santa Rosa Roadway Improvements
W. College Avenue widen Fulton Road to Stony Point Road
Widen and reconstruct (includes storm drain), construct sidewalks and bike lanes
W. College Ave Fulton to Stony Point Rd
$9
Santa Rosa Roadway Improvements
West Avenue reconstruct and widen Sebastopol Road to South Avenue
Widen and reconstruct, construct side-walks and bike lanes
West Ave from Sebastopol Rd to South Ave
$6
Santa Rosa Roadway Improvements
Maintain Transportation System Pavement — Maintenance
Maintenance of pavement — slurry, crack seal — surface treatment
Citywide $65

A-72
Appendices | DRAFT COMPREHENSIVE TRANSPORTATION PLAN — JULY 2021
Sponsor
Santa Rosa CityBus
Project Type
Transit Improvements — Non Capital
Project Name
Enhanced Core Network and Rapid Bus (operating)
Description
50% increase in service hours to imple-ment Reimagining CityBus phase II priorities and support City’s downtown development vision. Includes additional 15 minute service on Santa Rosa Avenue and Sonoma Avenue (completing frequency upgrades on corridors identifed for future Rapid Bus service), Saturday-level service until 11:00pm on most routes (Monday-Saturday), improved weekend service, targeted route restructuring/extensions for more direct service, targeted peak frequency improvements.
Location
Santa Rosa Citywide
Cost ($M)
$201
Santa Rosa CityBus
Transit Capital Projects
Enhanced Core Network Part 1 of 3 (capital)— Fleet Expansion (transitioning toward zero emissions feet by 2029)
10 new battery electric fxed-route buses, 2 new paratransit vehicles, and 2 new non-revenue vehicles, phased with oper-ating expansion. Includes replacement of these vehicles in out years.
Santa Rosa Citywide
$20
Santa Rosa CityBus
Transit Capital Projects
Enhanced Core Network Part 2 of 3 (capital) — Facility Expansion
Transit Mall and Coddingtown Transit Hub Expansion; improved links to SMART stations; Park and Rides
Downtown Transit Mall, Coddingtown Transit Hub, SMART Stations, new Park and Ride locations
$15
Santa Rosa CityBus
Transit Capital Projects
Enhanced Core Network Part 3 of 3 (capital)— Rapid Bus planning, engi-neering, and infrastructure
Rapid Bus planning, engineering,tech-nology, and infrastructure
Mendocino Avenue-Santa Rosa Avenue corridor, Sebastopol Road-Sonoma Ave. corridor; down-town Santa Rosa Station Area Plan improvements
$12
Santa Rosa CityBus
Transit Capital Projects
Facility Maintenance and Rehab
Facility maintenance and rehab, including ADA bus stop improvements
Santa Rosa Citywide
$7

A-73.
DRAFT COMPREHENSIVE TRANSPORTATION PLAN — JULY 2021 | Appendices
Sponsor Project Type Project Name Description Location Cost ($M)
Santa Rosa CityBus
Transit Capital Projects
Fleet Replacement (transitioning toward zero emissions feet by 2029)
Regular replacement of existing transit, paratransit, and non-revenue vehicles. Does not include incremental costs of transition to electric vehicles, which is included in new Transit Fleet Electrifcation project.
Santa Rosa Citywide
$89
Santa Rosa CityBus
Transit Improvements — Non Capital
New Mobility Projects
Funds innovative approaches including mobility on demand, shared mobility, or mobility as a service applications, as well as autonomous vehicle technologies.
Santa Rosa Citywide
$5
Santa Rosa CityBus
ITS & New Technologies
Passenger Information and Fare Payment Technology and Marketing
Includes deployment of additional real-time bus arrival signs, trip planning and mobile ticketing apps, new ticketing equipment, and future
fare payment and passenger information technolo-gies, as well as relating marketing
Santa Rosa Citywide
$3
Santa Rosa CityBus
Transit Improvements — Non Capital
Systemwide Fare-free Transit and Paratransit
Funds systemwide fare-free transit and paratransit services to increase transit ridership and mode share; support housing and afordability-related goals; and enable CityBus to reinvest funds currently spent on fare collection into improved service. Costs assume up to a 60% increase in paratransit demand due to free fares. This project is scalable, with several options for targeted fare-free or discount programs for K-12 students, low-income individuals, and seniors, as well as start-up funding for EcoPass unlimited ridership programs for residential or institutional partners.
Santa Rosa Citywide
$75

A-74
Appendices | DRAFT COMPREHENSIVE TRANSPORTATION PLAN — JULY 2021
Sponsor Project Type Project Name Description Location Cost ($M)
Santa Rosa CityBus
Transit Improvements — Non Capital
Transit and Paratransit O&M
Transit O&M & Paratransit at existing LOS, including replacement of equipment
Santa Rosa Citywide
$528
Santa Rosa CityBus
Transit Capital Projects
Transit Fleet Electrifcation (transitioning toward zero emissions feet by 2029)
Accelerates transition to all-electric transit and paratransit feets by supporting purchase of battery-electric vehicles, deployment of charging infrastructure, and provisions for resiliency. With purchase of Sonoma Clean Power Evergreen power, Santa Rosa CityBus could be 100% carbon-free.
Santa Rosa Citywide
$30
SCTA Bicycle and Pedestrian Facilities
Countywide Expansion of Micromobility and frst/last mile
Expand Bikeshare and other shared micro-mobility to all communities in Sonoma County. Includes the development of a comprehensive micro-mobility strategy to increase access to clean, afordable, reliable transportation options for rural communities in Sonoma County. Research best practices and emerging trends in micro-mobility; identify potential solu-tions for diferent place types (small city; large city; etc.); identify implementation resources (funding, expertise, etc.).
Sonoma countywide
$90
SCTA Bicycle and Pedestrian Facilities
Safe Routes to School
Safe Routes to School — 60 school loca-tions in Sonoma County
60 Schools in Sonoma County
$26
SCTA Transit Capital Projects
Countywide Microtransit
Countywide Microtransit (dynamic on-de-mand transit service using software similar to Uber-pool) program connecting to high frequency transit route, rail or major destinations
Sonoma Countywide
$2
SCTA Travel Demand Management
Transportation Management
Development of a transportation management association (2-3 FTE plus volunteers) to provide a variety trans-portation demand management services to individual and groups of employers, institutions including, but not limited to: Sales and Promotion of TDM and transit products; Central Information source for VMT reducing options, and Management of funding and incentives.
Sonoma Countywide
$40

A-75.
DRAFT COMPREHENSIVE TRANSPORTATION PLAN — JULY 2021 | Appendices
Sponsor Project Type Project Name Description Location Cost ($M)
SCTA Highway Improvements
Highway 116 Widening and Rehabilitation
Rehabilitate and widen State Route 116; involves realignment, new shoulders and intersection improvements at various
from Elphick Road East of Sebastopol to
$83
btwn locations. Highay 101 in Sebastopol & CotatiCotati
SCTA Highway Highways Intersection improvements will install At the intersec- $22 Improvements 116 and 121 a roundabout to reduce congestion tion of highways
Intersection and improve facilities for bicycles and 116, 121, and Improvements pedestrians. Bonneau Road in
Sonoma County southwest of the Sonoma.
SCTA Highway Improvements
Landscaping — Highway 101 HOV Corridor
Follow up landscaping for Highway 101 projects as outlined in the 2014 Highway 101 Corridor Landscaping & Tree Planting Plan. The Plan is avail-
Highway 101 from the southern Sonoma County line (PM 0.0) to
$18
able on SCTA’s Web site at: http://www. Windsor (PM sctainfo.org/reports/Highway_101_ 30.0) Corrider_Landscaping_and_Tree%20 Planning_Plan/Highways_101_ Corrider_Landscaping_and_Tree%20 Planning_Plan_January_2014.pdf

A-76
Appendices | DRAFT COMPREHENSIVE TRANSPORTATION PLAN — JULY 2021
Sponsor Project Type Project Name Description Location Cost ($M)
SCTA Highway State Route Build a viaduct between Sears Point and Highway 37 begin $180 Improvements 37 Corridor Vallejo converting a 2 lane conventional PM SON 3.91
Protection & highway to a 4 lane elevated expressway to SOL R6.95 Enhancement with a toll facility to provide trafc relief (Segment B); Capital Project and protected access at certain locations; additional work
include bike and pedestrian pathways that scope may need link to and meet with the requirements of to include MP the San Francisco Bay Trail; and explore MRN 11.2 to SON options for transit – bus and rail. Include 3.91 (Segment A) extensive environmental benefts to tidal marshlands and related plant and animal species by removing the existing route that is currently atop an earthen berm. Protect a critical east-west travel corridor from sea level rise and major storm events while simultaneously helping to reduce impacts from those same events to other resources. Consists of the following
components: 1) Highway 37 Improvements and Sea Level Rise Mitigation Environmental Only
($10 M) 2) Interim Segment B Project at Current
Elevation ($149 M; 2023-2025) 3) Near-Term Operational Improvements: SR 121 intersection reconfguration & eastbound lane drop extension ($21 M; 2023-2024)
SCTA Highway U.S.101 / Construct northbound onramp, south- Highway 101 $50 Improvements Railroad Avenue bound onramp and southboud oframp. (PM 10 — PM 11)
Improvements. Intersection and Safety improvement on and on Railroad Also Project Railroad Ave from Stony Point Road to Avenue from #2001 Petaluma Hill Road. Stony Point Road
to Petaluma Hill Road.

A-77.
DRAFT COMPREHENSIVE TRANSPORTATION PLAN — JULY 2021 | Appendices
Sponsor Project Type Project Name Description Location Cost ($M)
SCTA Highway Improvements
Widen U.S.101 Marin Sonoma Narrows — Phase 2 (Sonoma)
Implement Marin Sonoma Narrows Phase 2 Projects (Sonoma County). Adds 1 HOV lane in each direction making the freeway 6 lanes wide. Realigns ramps at East Washington Street, Lakeville Highway, and Petaluma Blvd South Interchanges. Constructs northbound auxiliary lane between Lakeville Highway and East Washington Street.
Highway 101 from the southern Sonoma County line (PM 0.0) to Old Redwood Highway (PM 8.0)
$163
Sebastopol Bicycle and Pedestrian Facilities
Alternate West Route to Sebastopol
Improve a west side routing to connect SR 116 south of Sebastopol with Bodega Highway west of Sebastopol utilizing a number of alternate routes such as Pleasant Hill Road, Bloomfeld Road, and possibly others
$5
Sebastopol Bicycle and Pedestrian Facilities
Bodega Avenue Curb Gutter and Sidewalk Improvements
Curb Gutter and Sidewalk Gap Closure Bodega Avenue, North side, from Golden Ridge Avenue to Pleasant Hill Ave. North in the City of Sebastopol
$1
Sebastopol Bicycle and Pedestrian Facilities
Class 1 bike lane to City Line
Class 1 bike lane parallel to Bodega Ave Last block, Ragle to City Line at Atascadero Creek
$1
Sebastopol Bicycle and Pedestrian Facilities
Libby Park Bike Lane
Add bike path across Libby Park to connect Washinton St to Pleasant Hill Rd.
Libby Park $0
Sebastopol Bicycle and Pedestrian Facilities
Sebastopol CBPMP Projects (total less than $1M each)
Total of Sebastopol bike/ped projects from Countywide Bicycle and Pedestrian Master Plan that are each less than $1M
$2
Sebastopol Bicycle and Pedestrian Facilities
West Sebastopol Active Transport Plan
Bodega Ave — Ragle Road — Mill Station Road: Bicycle and pedestrian access — west route
Sebastopol and unincorporated county
$8
Sebastopol Intersection Improvements
Bodega Avenue Intersections
Upgrade crosswalk protection systems Ragle Rd, Robinson Rd, Florence Ave
$1
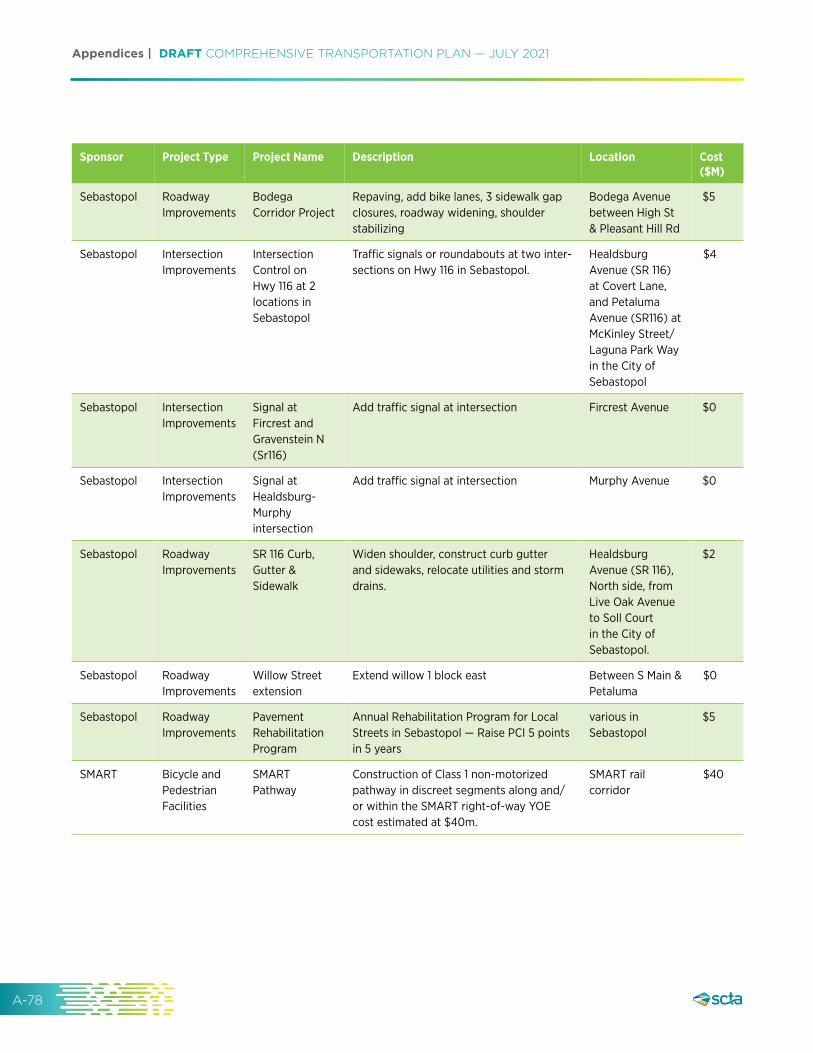
A-78
Appendices | DRAFT COMPREHENSIVE TRANSPORTATION PLAN — JULY 2021
Sponsor Project Type Project Name Description Location Cost ($M)
Sebastopol Roadway Improvements
Bodega Corridor Project
Repaving, add bike lanes, 3 sidewalk gap closures, roadway widening, shoulder stabilizing
Bodega Avenue between High St & Pleasant Hill Rd
$5
Sebastopol Intersection Improvements
Intersection Control on Hwy 116 at 2 locations in Sebastopol
Trafc signals or roundabouts at two inter-sections on Hwy 116 in Sebastopol.
Healdsburg Avenue (SR 116) at Covert Lane, and Petaluma Avenue (SR116) at McKinley Street/ Laguna Park Way in the City of Sebastopol
$4
Sebastopol Intersection Improvements
Signal at Fircrest and Gravenstein N (Sr116)
Add trafc signal at intersection Fircrest Avenue $0
Sebastopol Intersection Improvements
Signal at Healdsburg-Murphy intersection
Add trafc signal at intersection Murphy Avenue $0
Sebastopol Roadway Improvements
SR 116 Curb, Gutter & Sidewalk
Widen shoulder, construct curb gutter and sidewaks, relocate utilities and storm drains.
Healdsburg Avenue (SR 116), North side, from Live Oak Avenue to Soll Court in the City of Sebastopol.
$2
Sebastopol Roadway Improvements
Willow Street extension
Extend willow 1 block east Between S Main & Petaluma
$0
Sebastopol Roadway Improvements
Pavement Rehabilitation Program
Annual Rehabilitation Program for Local Streets in Sebastopol — Raise PCI 5 points in 5 years
various in Sebastopol
$5
SMART Bicycle and Pedestrian Facilities
SMART Pathway
Construction of Class 1 non-motorized pathway in discreet segments along and/ or within the SMART right-of-way YOE cost estimated at $40m.
SMART rail corridor
$40

A-79.
DRAFT COMPREHENSIVE TRANSPORTATION PLAN — JULY 2021 | Appendices
Sponsor Project Type Project Name Description Location Cost ($M)
SMART Transit Capital Projects
First/Last Mile SMART Stations Capital Enhancments
Programmatic project at or around Sonoma County SMART stations. Projects at each station vary, may have multiple project sponsors and include, but are not limited to, station furniture addi-tions, enhanced ADA-related accessibility features, landscaping enhancements, wayfnding, bicycle parking/sharing, real time transit signage, intermodal improve-ments, security enhancements and other capital improvements for programs such as car sharing.
10 SMART Stations within within Sonoma County (Cloverdale, Healdsburg, Windsor, Airport Boulevard, Guerneville Road, Railroad Square, Rohnert Park, Cotati, North Petaluma, Downtown Petaluma).
$88
SMART Transit Improvements — Non Capital
First/Last Mile Transit Operations
Project Programmatic project to enhance local transit access to/from SMART Stations in partnership with bus operators and local jurisdictions. Multiple project sponsors and operators possible. Assumes an average of $1.5m per station per year for operating support to local transit providers. Figure has not been escalated and is shown in 2020 dollars.
10 Sonoma County Stations — Local Jurisdictions/ Transit Operators are project sponsors.
$450
SMART Transit Improvements — Non Capital
Ongoing Operations (as funded by Measure Q and reauthorized)
Rail and Pathway operations Cloverdale to Larkspur
$2,200
SMART Transit Capital Projects
SMART Rail Expansion — Windsor to Cloverdale and Petaluma North
Rail improvements including second Petaluma Station and extensions from Windsor to Cloverdale (civil track, bridges, systems, vehicle and maintaince yard capacity and two rail stations).
SMART rail line from Windsor north to Cloverdale and in North Petaluma.
$375
SMART ITS & New Technologies
SMART Rail Freight Improvements
Addition of rail freight spurs, including Positive Train Control systems, along the corridor, and other freight rail require-ments along the corridor, including additional siding, track & road crossings, and upgrade to systems on the Brazos and Blackpoint bridges
SMART rail line from Napa County to the west and Marin County to the north.
$40

A-80
Appendices | DRAFT COMPREHENSIVE TRANSPORTATION PLAN — JULY 2021
Sponsor Project Type Project Name Description Location Cost ($M)
SMART Transit Capital Projects
SMART Rail Operations Capacity Expansion
Additional capacity at SMART Rail Operations Center and/or other facilities along the corridor to accommodate main-tenance equipment and additional SMART train sets. Includes expansion of non-rev-enue vehicle feet for systemwide services.
Airport Boulevard facility with additional minor systemwide facilities along corridor.
$25
SMART Transit Capital Projects
SMART Rail Operations Capacity Expansion — Rail Vehicles
Expand or enhance rail vehicle feet with addition of cars to support deployed service levels, meet on time performance goals and increase train capacity for carrying riders comfortably.
Systemwide service.
$44
Sonoma Multimodal Streetscape Improvements
Broadway (SR12) Streetscape Enhancements and Trafc Circulation
Enhance the Broadway streetscape to improve the pedestrian experience, provide sustainable landscaping, and increase public safety for pedestrians, bicyclists, and motorists.
Broadway (State Route 12) between Napa Street and MacArthur Street
$6
Sonoma Bicycle and Pedestrian Facilities
Sonoma CBPMP Projects (total less than $1M each)
Total of Sonoma bike/ped projects from Countywide Bicycle and Pedestrian Master Plan that are each less than $1M
$1
Sonoma Intersection Improvements
Intersection Improvements at SR12 Broadway and SR12 West Napa St.
Improve this 4-way Stop intersection currently operating at LOS D. The intersec-tion creates many points of confict and motorist confusion, due to long pedestrian crossings and very busy pedestrian trafc in front of the Historic Sonoma Plaza.
At the inter-section of SR12 Broadway and SR12 West Napa Street.
$6
Sonoma Intersection Improvements
Intersection Improvements at SR12 Sonoma Highway and West Napa St
Improve this misaligned signaled intersec-tion to better allow pedestrian trafc and improve vehicular turning movements.
At the inter-section of SR12 Sonoma Highway and SR12 West Napa St. and Riverside Drive and Staples egress.
$3
Sonoma Intersection Improvements
Intersection Improvements at West Spain St. and Fifth St. West
Improve this 4-way Stop intersection currently operating at LOS E.
At the intersec-tion of West Spain St. and Fifth St. West.
$2

A-81.
DRAFT COMPREHENSIVE TRANSPORTATION PLAN — JULY 2021 | Appendices
Sponsor
Sonoma
Project Type
Roadway Improvements
Project Name
Safety Improvements at Fifth St. West
Description
Resolve Safety problem primarily at the intersection of Fifth St. West and Studley St. and Safeway egress.
Location
On Fifth St. West between West Napa St. and Oregon St.
Cost ($M)
$3
Sonoma Roadway Improvements
Local Streets and Roads Rehabilitation
Rehabilitation of Local Streets and Roads per Pavement Management System.
Various Streets and Roads in the City of Sonoma.
$10
Sonoma County
Bicycle and Pedestrian Facilities
8th St. East Construct 3.09 mile Class II bikeway East Napa St. to State Hwy. 121
$2
Sonoma County
Bicycle and Pedestrian Facilities
8th Street East Corridor Improvements 1: Sonoma/ Schellville Trail
Connects the City of Sonoma bike path to the Sonoma County Bay Trail. Follows the abandoned railroad right of way. Regional Network
Sonoma City Limits to Dale Ave.
$7
Sonoma County
Bicycle and Pedestrian Facilities
Adobe Rd. Construct 2.99 mile Class II bikeway Old Redwood Hwy. to Lynch Rd.
$2
Sonoma County
Bicycle and Pedestrian Facilities
Alexander Valley Rd.
Construct 3.83 mile Class II bikeway Healdsburg Ave. to State Hwy. 128
$3
Sonoma County
Bicycle and Pedestrian Facilities
Arnold Dr. Construct 3.47 mile Class II bikeway Country Club Dr. to Chauvet Rd.
$3
Sonoma County
Bicycle and Pedestrian Facilities
Bellevue Creek Trail and Connector
Provides Highway 101 overcrossing. Connects to Laguna de Santa Rosa Trail and Rohnert Park “F” section.
Petaluma Hill Rd. to Stony Point Rd. and connector to Rohnert Park City Limits
$2
Sonoma County
Bicycle and Pedestrian Facilities
Bennett Valley Rd.
Construct 2.08 mile Class II bikeway Santa Rosa City Limits to Grange Rd.
$2
Sonoma County
Bicycle and Pedestrian Facilities
Bodega Ave. Construct 2.08 mile Class II bikeway King Rd. to Middle Two Rock Rd.
$2

A-82
Appendices | DRAFT COMPREHENSIVE TRANSPORTATION PLAN — JULY 2021
Sponsor
Sonoma County
Project Type
Bicycle and Pedestrian Facilities
Project Name
Bodega Bay Trail
Description
Provides a 3 mile long Class I bike path alternative to Highway 1. 1.1 miles have been completed from Keefe Avenue to the Bodega Bay Community Center. The County will complete the remaining 1.9 miles.
Location
Parallels the Highway 1 corridor starting at Keefe Avenue and ending the County’s Birdwalk Coastal Access Trail
Cost ($M)
$8
Sonoma County
Bicycle and Pedestrian Facilities
Bodega Hwy. Class II bikelanes
Construct 4.76 mile Class II bike lanes on Bodega Hwy.
Sebastopol City Limits to Jonive Rd. and Bohemian Hwy. to Valley Ford — Freestone Rd.
$4
Sonoma County
Bicycle and Pedestrian Facilities
Cloverdale / Lake Sonoma Trail
Class I connection between Cloverdale adjacent to Dutcher Creek Road
Cloverdale City Limits to Lake Sonoma
$2
Sonoma County
Bicycle and Pedestrian Facilities
Cloverdale River Trail
Class I adjacent to Russian River. Connects to SMART Trail
Cloverdale City Limits to Theresa Dr.
$1
Sonoma County
Bicycle and Pedestrian Facilities
Colgan Creek Trail Extension East and West
Connection between Santa Rosa and Taylor Mountain Regional Park, and SMART Trail to Laguna de Santa Rosa Trail along SCWA food control channel.
Connections between Santa Rosa and Taylor Mountain Regional Park., and Todd Rd. to Laguna de S.R. Trail
$1
Sonoma County
Bicycle and Pedestrian Facilities
Copeland Creek Trail
Connects Sonoma State University to Crane Creek Regional Park
Rohnert Park City Limits to Crane Creek Reg. Park
$1
Sonoma County
Bicycle and Pedestrian Facilities
Crocker Road Bicycle/ Pedestrian Bridge
Bike/Pedestrian Bridge across Russian River
West end of Bridge to East end of Bridge
$2
Sonoma County
Bicycle and Pedestrian Facilities
Doran Beach Rd.
Construct 2.22 mile Class II bikeway State Hwy. 1 to Jetty Campground
$2

A-83.
DRAFT COMPREHENSIVE TRANSPORTATION PLAN — JULY 2021 | Appendices
Sponsor
Sonoma County
Project Type
Bicycle and Pedestrian Facilities
Project Name
Dry Creek Rd. Class II bikelanes
Description
Construct 10.07 mile Class II bikeway
Location
Healdsburg City Limits to Skaggs Springs Rd.
Cost ($M)
$8
Sonoma County
Bicycle and Pedestrian Facilities
Dutch Bill Creek Trail
Class I along portions of North Pacifc Coast Railroad right-of-way. Connects Occidental to Russian River Trail at Monte Rio
State Hwy. 116 to Graton Rd.
$2
Sonoma County
Bicycle and Pedestrian Facilities
Eastside Rd. Class II bikelanes
Construct 5.18 mile Class II bikeway Old Redwood Hwy. to Trenton-Healdsburg Rd.
$4
Sonoma County
Bicycle and Pedestrian Facilities
Faught Rd. Class II bikelanes
Construct 2.55 mile Class II bikeway Old Redwood Hwy. to Pleasant Ave.
$2
Sonoma County
Bicycle and Pedestrian Facilities
Frei Rd. Class II bikelanes
Construct 1.41 mile Class II bikeway State Hwy. 116 to Guerneville Rd.
$1
Sonoma County
Bicycle and Pedestrian Facilities
Geysers Rd. Class II bikelanes
Construct 2.59 mile Class II bikeway River Rd. to Mendo. Co. Line
$2
Sonoma County
Bicycle and Pedestrian Facilities
Geyserville Ave. / Asti Rd. Class II bikelanes
Construct 7.76 mile Class II bikeway Weidersheim Rd. to Airport Rd. and Lytton Springs Rd. to Canyon Rd.
$6
Sonoma County
Bicycle and Pedestrian Facilities
Laguna de Santa Rosa Trail
Construct segments of Laguna de Santa Rosa Trail (12.21 miles)
Rohnert Park City Limits to Hall Rd.
$5
Sonoma County
Bicycle and Pedestrian Facilities
Laguna de Santa Rosa Trail Extension
Connects end of Santa Rosa Creek Trail to Russian River
Santa Rosa Creek Trail to Riverfront Park (Eastside Rd.)
$2
Sonoma County
Bicycle and Pedestrian Facilities
Laguna Rd. / Old Trenton Rd. Class II bikelanes
Construct 1.39 mile Class II bikeway Vine Hill Rd. to River Rd.
$1
Sonoma County
Bicycle and Pedestrian Facilities
Larkfeld / Wikiup Trail
Provides Class I alternative to Old Redwood Highway between Windsor, Larkfeld/Wikiup, and Santa Rosa. Regional Network
Windsor Town Limit to Santa Rosa City Limits
$2

A-84
Appendices | DRAFT COMPREHENSIVE TRANSPORTATION PLAN — JULY 2021
Sponsor
Sonoma County
Project Type
Bicycle and Pedestrian Facilities
Project Name
Ludwig Ave. Class II bikelanes
Description
Construct 1.45 mile Class II bikeway
Location
Llano Rd. to Stony Point Rd.
Cost ($M)
$1
Sonoma County
Bicycle and Pedestrian Facilities
Mark West Springs / Porter Creek Rd. Class II bikelanes
Construct 9.72 mile Class II bikeway State Hwy. 101 to Petrifed Forest Rd.
$7
Sonoma County
Bicycle and Pedestrian Facilities
Millbrae Ave. Class II bikelanes
Construct 1.31 mile Class II bikeway Rohnert Park City Limits to Stony Point Rd.
$1
Sonoma County
Bicycle and Pedestrian Facilities
Mirabel Road Corridor Improvements 1: West County Trail Extension
Connects downtown Forestville with Forestville Youth Park
Pajaro Lane to Forestville Youth Park
$3
Sonoma County
Bicycle and Pedestrian Facilities
Mirabel Road Corridor Improvements 2: River Rd. to Hwy 116
Widening for pedestrian & bike facilities River Rd. to Hwy 116
$12
Sonoma County
Bicycle and Pedestrian Facilities
Monte Rio / Willow Creek Trail
Provides access to Russian River between Monte Rio and Coast. Portions of trail food, summertime use only.
Monte Rio Bridge to Sonoma Coast State Park
$3
Sonoma County
Bicycle and Pedestrian Facilities
Occidental Rd. Class II bikelanes
Construct 3.06 mile Class II bikeway Sanford Rd. to Santa Rosa City Limits
$2
Sonoma County
Bicycle and Pedestrian Facilities
Pepper Rd. Class II bikel-anes (section 1)
Construct 3.29 mile Class II bikeway Meacham Rd. to Stony Point Rd.
$2
Sonoma County
Bicycle and Pedestrian Facilities
Pepper Rd. Class II bikel-anes (section 2)
Construct 2.59 mile Class II bikeway Bodega Ave. (Petaluma) to Meacham Rd.
$2
Sonoma County
Bicycle and Pedestrian Facilities
Petaluma — Novato Trail
Alternative to SMART Trail south of Petaluma proposed as part of Highway 101 Novato Narrows project
Petaluma City Limits to Marin Co. Line
$1

A-85.
DRAFT COMPREHENSIVE TRANSPORTATION PLAN — JULY 2021 | Appendices
Sponsor
Sonoma County
Project Type
Bicycle and Pedestrian Facilities
Project Name
Petaluma / Sebastopol Trail
Description
Follows abandoned Petaluma and Santa Rosa Railroad right of way south of Highway 116 and west of Highway 101.
Location
Petaluma City Limits to Sebastopol City Limits
Cost ($M)
$4
Sonoma County
Bicycle and Pedestrian Facilities
Petaluma Marsh Trail
Class I alternative route to Lakeville Highway Class II
Petaluma City Limits to Port Sonoma
$4
Sonoma County
Bicycle and Pedestrian Facilities
Petrifed Forest Rd. Class II bikelanes
Construct 2.37 mile Class II bikeway Porter Creek Rd. to Napa Co. Line
$2
Sonoma County
Bicycle and Pedestrian Facilities
Piner Rd. / Olivet Rd. Class II bikelanes
Construct 3.76 mile Class II bikeway Fulton Rd. to River Rd.
$3
Sonoma County
Bicycle and Pedestrian Facilities
Pleasant Hill Rd. Class II bikelanes
Construct 2.16 mile Class II bikeway Bloomfeld Rd. to Elphick Rd.
$2
Sonoma County
Bicycle and Pedestrian Facilities
Roblar Rd. Class II bikelanes
Construct 6.5 mile Class II bikeway Valley Ford Rd. to Stony Point Rd.
$5
Sonoma County
Bicycle and Pedestrian Facilities
Russian River Trail
Regional Class I bike path along the middle and lower reach of the Russian River. The approximate length is 23 miles.
Healdsburg city limits to Highway 1
$27
Sonoma County
Bicycle and Pedestrian Facilities
Salmon Creek Trail
Class I bikeway along portions of North Pacifc Coast Railroad right-of-way. Connects Occidental to Town of Bodega
First St. (Occidental) to Town of Bodega
$2
Sonoma County
Bicycle and Pedestrian Facilities
Santa Rosa Creek Trail Extension
Connects Prince Memorial Greenway to the Laguna de Santa Rosa Trail
Willowside Rd. to Guerneville Rd.
$1

A-86
Appendices | DRAFT COMPREHENSIVE TRANSPORTATION PLAN — JULY 2021
Sponsor Project Type Project Name Description Location Cost ($M)
Sonoma County
Bicycle and Pedestrian Facilities
Sonoma County Bay Trail
Segments of the Bay Trail. Regional Network (23.68 miles)
Segments from Dale Ave. to Napa Co. Line, Ramal Rd. to Skaggs Island Rd., Hudeman Slough to Napa Co. Line, SMART Right-of-Way to Marin Co. Line, Sonoma Creek to State Hwy. 121, andState Hwy. 121 to Port Sonoma
$9
Sonoma County
Bicycle and Pedestrian Facilities
Sonoma County CBPMP Projects (total less than $1M each)
Total of Sonoma County bike/ped projects from Countywide Bicycle and Pedestrian Master Plan that are each less than $1M
$42
Sonoma County
Bicycle and Pedestrian Facilities
Sonoma Valley Trail (aka Central Sonoma Valley Trail)
Provides a 13.80 mile long Class I bike path alternative to Highway 12 between Santa Rosa and Sonoma. 0.42 miles have been completed. The County will complete the remaining 13.38 miles.
Along the Highway 12 corridor from Santa Rosa city limits to Sonoma city limits
$26
Sonoma County
Bicycle and Pedestrian Facilities
South Wright Rd. Class II bikelanes
Construct 2.01 mile Class II bikeway Santa Rosa City Limits to Ludwig Ave.
$1
Sonoma County
Bicycle and Pedestrian Facilities
State Hwy. 1 Construct 34.05 miles of Class II bikelanes Kruse Ranch Rd. to Gualala River Bridge, State Hwy. 116 to Meyer’s Grade Rd., Doran Beach Rd. to State Hwy. 116, andValley Ford Rd. to Slaughter House Rd.
$18

A-87.
DRAFT COMPREHENSIVE TRANSPORTATION PLAN — JULY 2021 | Appendices
Sponsor Project Type Project Name Description Location Cost ($M)
Sonoma County
Bicycle and Pedestrian Facilities
State Hwy. 116 North Class II bikelanes
Construct 19.09 miles of Class II bikelanes Moscow Rd. to State Hwy. 1, Green Valley Rd. to Armstrong Woods Rd., Gilchrist Rd. to Sebastopol City Limits, and Stony Point Rd. to Gilchrist Rd.
$14
Sonoma County
Bicycle and Pedestrian Facilities
State Hwy. 116 South Class II bikelanes
Construct 2.46 mile Class II bikeway Lakeville Hwy. to Adobe Rd.
$2
Sonoma County
Bicycle and Pedestrian Facilities
State Hwy. 12 Class II bikelanes
Construct 6.93 mile Class II bikeway Kunde Winery Rd. to Agua Caliente Rd.
$5
Sonoma County
Bicycle and Pedestrian Facilities
State Hwy. 121 Class II bikelanes
Construct 7.45 mile Class II bikeway Bisso Rd. to Napa Rd.
$6
Sonoma County
Bicycle and Pedestrian Facilities
State Hwy. 128 Construct 23.58 miles of Class II bikelanes Chalk Hill Rd. to Napa Co. Line, Geyserville Ave. to Chalk Hill Rd., N. Cloverdale Blvd. to Mendo. Co. Line
$18
Sonoma County
Bicycle and Pedestrian Facilities
Todd Rd. Class II bikelanes
Construct 5.02 mile Class II bikeway Santa Rosa Ave. to State Hwy. 116
$4
Sonoma County
Bicycle and Pedestrian Facilities
Trenton Rd. / Healdsburg Rd. Class II bikelanes
Construct 1.32 mile Class II bikeway River Rd. to Eastside Rd.
$1
Sonoma County
Bicycle and Pedestrian Facilities
Warm Springs Rd. Class II bikelanes
Construct 5.13 miles of Class II bikelanes Bennett Valley Rd. to Arnold Dr. and State Hwy. 12 to Bennett Valley Rd.
$4
Sonoma County
Bicycle and Pedestrian Facilities
Water Trough Rd. Class II bikelanes
Construct 1.71 mile Class II bikeway Elphick Rd. to Bodega Hwy.
$1

A-88
Appendices | DRAFT COMPREHENSIVE TRANSPORTATION PLAN — JULY 2021
Sponsor
Sonoma County
Project Type
Bicycle and Pedestrian Facilities
Project Name
West Sierra Ave. Class II bikelanes
Description
Construct 1.25 mile Class II bikeway
Location
Cotati City Limits to Stony Point Rd.
Cost ($M)
$1
Sonoma County
Bicycle and Pedestrian Facilities
Willowside Rd. Class II bikelanes
Construct 2.01 mile Class II bikeway Hall Rd. to Piner Rd.
$2
Sonoma County
Roadway Improvements
8th Street East Corridor Improvements 1-3: Summary
Intersection improvements at Hwy 121 and 8th St East including new trafc signal, widening 8th St East between Napa Road and Napa Street, Sonoma Schellville Trail from Napa Road to Napa Street paralleling 8th St E along Railroad Right of Way (Note: this project is a combination of 3 existing projects on the list; 1. 8th Street East/Hwy 121 Signalization 2. 8th Street East widening Napa Rd to Napa St 3. Sonoma/Schellville Trail)
East of Sonoma $-
Sonoma County
Roadway Improvements
8th Street East Corridor Improvements 2: Napa Rd. to Napa St.
8th Street East widening Napa Rd to Napa Street
Napa Rd. to Napa St.
$4
Sonoma County
Intersection Improvements
8th Street East Corridor Improvements 3: Hwy 121 @ 8th St East
Install trafc signal system on Route 121 and improve channelization at 8th Street
Hwy 121 @ 8th Street East
$4
Sonoma County
Roadway Improvements
Adobe Road Reconstruction
Reconstruct or rehabilitate sections of Adobe Road Hwy 116 to Penngrove
South Sonoma County on Adobe Rd.
$20
Sonoma County
Roadway Improvements
Adobe/Corona Intersection Improvements
Signalization & Intersection Improvements Adobe/Corona Intersection
$2
Sonoma County
Roadway Improvements
Airport Boulevard Widening Ordiance Road and Aviation Boulevard
This is Phase 1. 2) widens Brickway to LaughlinRd; 3) widens Airport Blvd between ORH and US 101; 4) Airport Blvd I/C #22191; 5) Widens Laughlin Rd to 2 lanes, controls at River Rd.
Airport Blvd. $50

A-89.
DRAFT COMPREHENSIVE TRANSPORTATION PLAN — JULY 2021 | Appendices
Sponsor
Sonoma County
Project Type
Roadway Improvements
Project Name
Alexander Valley Road Safety and Modal Improvements
Description
Multimodal safety improvements, such as localized widening, signage, safety beacons, and striping
Location
Unicorportated County — North of Healdsbug
Cost ($M)
$4
Sonoma County
Intersection Improvements
Alexander Valley/ Healdsburg Ave Intersection Improvements
Intersection Improvements (Roundabout) Alexander Valley Rd @ Healdsburg Ave
$3
Sonoma County
Intersection Improvements
Arnold/ Madrone Intersection Improvements
Signalization & Intersection Improvements Arnold @ Madrone
$2
Sonoma County
Roadway Improvements
Bodega Highway improve-ments west of Sebastopol
Straightens curves near Occidental and add turn pockets where needed.
$20
Sonoma County
Roadway Improvements
Brickway/ Laughlin Corridor Improvements
Access connection to the Airport Blvd. corridor with a new bridge
River Rd to Airport Blvd.
$8
Sonoma County
Roadway Improvements
Hwy 116 Intersection Improvements (County portion)
Signalization & Intersection Safety Improvements
Multiple locations in the Hwy 116 Corridor
$10
Sonoma County
Roadway Improvements
Llano Road improvements & extension
Llano Road improvements, Hwy 116 to Occidental Road
$10
Sonoma County
Multimodal Streetscape Improvements
Mark West Springs Road/ Porter Creek Road safety improvements
Multimodal safety improvements, such as localized widening, signage, safety beacons, and striping.
Various locations on Markwest Springs Road and Porter Creek Rd.
$5

A-90
Appendices | DRAFT COMPREHENSIVE TRANSPORTATION PLAN — JULY 2021
Sponsor
Sonoma County
Project Type
Intersection Improvements
Project Name
Mirabel Road Corridor Improvements 1-4: Summary
Description
Intersection improvements at Hwy 116, intersection improvements at River Road, shoulder widening on Mirabel Road between Hwy 116 and River Road for Class II bike lanes and West County Trail Extension connecting downtown Forestville to Forestville Youth Park, (Note: this project is a combination of 4 existing projects on the list; 1.Mirabel Road and Route 116 signalization and channelization 2.River/Mirabel intersection improvements 3.Mirabel Road improvements 4. West County Trail Extension)
Location
Forestville
Cost ($M)
$-
Sonoma County
Intersection Improvements
Mirabel Road Corridor Improvements 3: River Rd @ Mirabel
Signalization or Roundabout & intersection improvements
River Rd @ Mirabel
$4
Sonoma County
Intersection Improvements
Mirabel Road Corridor Improvements 4: Hwy 116 at Mirabel Rd
Construct roundabout at current intersec-tion controlled by single stop sign.
Hwy 116 at Mirabel Rd
$24
Sonoma County
Intersection Improvements
Old Redwood Hwy/Fulton Intersection Improvements
Signalization & Intersection Improvements Old Redwood Hwy/Fulton
$2
Sonoma County
Intersection Improvements
Porter Creek Rd/Calistoga Rd/Petriforest Rd. Intersection Improve
Intersection Improvements Porter Creek Rd/ Calistoga Rd/ Petriforest Rd.
$3
Sonoma County
Intersection Improvements
Railroad Ave Improvements
Signalization and intersection improvements
at Old Redwood Hwy & at Petaluma Hill Road
$4
Sonoma County
Roadway Improvements
Realign Route 116 (Stage Gulch Road) along Champlin Creek and wid
$38

A-91.
DRAFT COMPREHENSIVE TRANSPORTATION PLAN — JULY 2021 | Appendices
Sponsor
Sonoma County
Project Type
Roadway Improvements
Project Name
River Road channel-ization and improvements
Description
Widen River Road and construct left turn pockets at Argonne Way and at Trenton Road/Steelhead Beach park
Location
Unicorporated County
Cost ($M)
$10
Sonoma County
Roadway Improvements
River Road Widening — Fulton to Old Redwood Hwy
River Rd/Mark West Springs – construct 2 additional lanes from Fulton to Old Redwood Hwy.
River Rd. — Fulton to Mark West Springs Rd
$7
Sonoma County
Roadway Improvements
Sonoma County Bridge Widening Program
Widen existing one lane bridges throughout Unicorporated Sonoma County to two lanes
Various $19
Sonoma County
Intersection Improvements
Stony Point Rd Intersection Improvements
Signalization & intersection improvements at Roblar Road
Stony Point Rd @ Roblar Rd
$3
Sonoma County
Roadway Improvements
Todd Road Reconstruction
Widen Todd Road to include General Plan requirements — reconstruct from Stony Point Road to Llano Road extend east to Petaluma Hill Road
Unicorporated County
$30
Sonoma County
Multimodal Streetscape Improvements
Verano Ave — center turn lane from Arnold to HWY 12
Corridor improvements — pedestrian, bike, transit
Hwy 12 to Riverside Dr.
$3
Sonoma County
Roadway Improvements
Pavement Maintenance Countywide
Maintenance of pavement — slurry, crack seal — surface treatment
various roads countywide
$1,200
Sonoma County Transit
Transit Improvements — Non Capital
SCT Bus yard, maintenance facility, bus stops, park and ride lots (existing)
Estimated costs to maintain SCT’s existing facilities (operations & maintenance facility, bus stops, park-and-ride lots, inter-modal facilities etc) during the 25-year life of the CTP
Sonoma County $10
Sonoma County Transit
Transit Capital Projects
SCT Countywide Bus Stop Improvements
Expanded NextBus real-time information panels at bus stops and shelters, addi-tional and replacement passenger shelters and benches.
Sonoma County $3
Sonoma County Transit
Transit Improvements — Non Capital
SCT Existing Operations (Current)
Estimated cost to maintain SCT’s current levels of service for fxed- route and para-transit during the 25-year life of the CTP.
Sonoma County $490

A-92
Appendices | DRAFT COMPREHENSIVE TRANSPORTATION PLAN — JULY 2021
Sponsor
Sonoma County Transit
Project Type
Transit Capital Projects
Project Name
SCT Existing Vehicle Replacements (transitioning toward zero emissions feet by 2029)
Description
Estimated costs to replace SCT’s existing fxed route and paratransit vehicles during the 25-year life of the CTP.
Location
Sonoma County
Cost ($M)
$54
Sonoma County Transit
Transit Improvements — Non Capital
SCT Expanded Core Intercity Routes
Expanded weekday and weekend service (including paratransit) on “core” intercity routes 20, 30, 44, 48 and 60.
Cloverdale, Healdsburg, Windsor, Santa Rosa, Sebastopol, Rohnert Park, Cotati, Guerneville/ Monte Rio area, Sonoma/Sonoma Valley area, Petaluma.
$39
Sonoma County Transit
Transit Improvements — Non Capital
SCT Expanded Local Transit Services
Expanded weekday and/or weekend transit services (including paratransit) on routes 10, 12, 28, 32 and 68.
Cloverdale, Guerneville/ Monte Rio area, Rohnert Park, Cotati, Sonoma/ Sonoma Valley area.
$25
Sonoma County Transit
Transit Capital Projects
SCT Facility Expansion, bus yard and maintenance
SCT bus yard and operations/maintenance facility expansion needed to accommo-date proposed reduced headways and expanded weekend service on SCT’s local and intercity bus routes. (Unconstrained Project)
Sonoma County $10
Sonoma County Transit
Transit Capital Projects
SCT Fleet Replacement & Electric Charging Infrastructure (transitioning toward zero emissions feet by 2029)
Scheduled bus replacements (CNG & Electric) and expanded electric charging capabilities at SCT’s transit facility in Santa Rosa and on-route in various cities throughout Sonoma County.
Cloverdale, Healdsburg, Windsor, Santa Rosa, Sebastopol, Rohnert park, Petaluma, Sonoma
$41

A-93.
DRAFT COMPREHENSIVE TRANSPORTATION PLAN — JULY 2021 | Appendices
Sponsor
Sonoma County Transit
Project Type
Transit Improvements — Non Capital
Project Name
SCT Local Route Fare-Free Program
Description
Free fares on all SCT local routes and local paratransit trips (replaces respective local city-based funding for fare-free routes).
Location
Cloverdale, Healdsburg, Windsor, Sebastopol, Rohnert Park, Cotati, Sonoma/ Sonoma Valley area, Guerneville/ Monte Rio area.
Cost ($M)
$13
Sonoma County Transit
Transit Improvements — Non Capital
SCT Systemwide service expan-sion on core intercity and local routes (phase 2)
Increase service on various routes system-wide (Unconstrained Project)
Sonoma County $31
Sonoma County Transit
Transit Capital Projects
SCT Vehicle Expansion (transitioning toward zero emissions feet by 2029)
Estimated 25 additional transit vehi-cles needed to accommodate proposed reduced headways and expanded weekend service on SCT’s local and inter-city bus routes. (Unconstrained Project)
Sonoma County $15
Windsor Bicycle and Pedestrian Facilities
Conde Lane: Oakfeld Lane to Mitchell Lane
Improve Conde Lane from Oakfeld Lane to Mitchell Lane to provide bike lanes and sidewalk on the west side. It is currently estimated that 50 percent of this project will be completed as part of adjacent private developments.
Conde Lane: Oakfeld Lane to Mitchell Lane
$8
Windsor Bicycle and Pedestrian Facilities
Downtown Ped & Bike Crossing of US 101 Phase 1 — Underpass Widen
Improving existing US 101 underpass by widening the space under US 101 using new tie-back walls and adding Class I paths with protected two-way bike lanes and widened pedestrian paths. Improvements also include new lighting, landscaping, color and artwork.
Old Redwood Highway from US 101 NB on-ramp to Conde Lane
$7
Windsor Bicycle and Pedestrian Facilities
Downtown Ped & Bike Crossing of US 101 Phase 2 — Overcrossing
Improving east and west connectivity of central Windsor with a new bicycle and pedestrian bridge over crossing US 101 with touchdown areas at each end of the bridge.
Los Amigos Road to Old Redwood Highway over US 101
$17

A-94
Appendices | DRAFT COMPREHENSIVE TRANSPORTATION PLAN — JULY 2021
Sponsor Project Type Project Name Description Location Cost ($M)
Windsor Bicycle and Pedestrian Facilities
Jensen Lane East Connector
Install a Class I multi-use trail for pedes-trians and bicyclist to connect southeast Windsor to northeast Windsor near Foothill Regional Park.
Old Redwood Hwy to Vinecrest Road adjacent to Emmerson Street and Jensen Lane
$1
Windsor Bicycle and Pedestrian Facilities
Old Redwood Highway Greenway: Hembree Lane to Shiloh Road
Widen Old Redwood Highway, add bicycle lanes and sidewalks where missing and replace two drainage structures. Improve the street to current design standards, including completion of sidewalks. Install Class I Multi-Use Path (Old Redwood Greenway) between Pleasant Avenue and Shiloh Road.
Old Redwood Highway from Hembree Lane to Shiloh Road
$13
Windsor Bicycle and Pedestrian Facilities
Starr Road: Re-Build Railroad Grade Crossing
Widen the street and install sidewalks and bicycle lanes on Starr Road within the limits of the railway right of way.
Starr Road at SMART Train Station
$1
Windsor Bicycle and Pedestrian Facilities
Windsor CBPMP Projects (total less than $1M each)
Total of Windsor bike/ped projects from Countywide Bicycle and Pedestrian Master Plan that are each less than $1M
$8
Windsor Highway Improvements
Arata Lane Interchange Phase 2B NB On-ramp (CIP FY 2016-2017)
Construction of the Northbound on-ramp to US 101 will compelte the Arata Lane interchange with US 101. This proejct also includes the relocation of a portion of Los Amigos Road north of Arata Lane. Rights of way have been obtained in prior phases.
Arata Lane interchange Northbound on-ramp
$4
Windsor Intersection Improvements
Intersection Modifcation at Lakewood Drive/Old Redwood Highway
Widen Old Redwood Hwy and Lakewood Drive to provide additional right turn lanes and provide a signal at the northbound on-ramp.
Lakewood Drive at Old Redwood Hwy
$2

A-95.
DRAFT COMPREHENSIVE TRANSPORTATION PLAN — JULY 2021 | Appendices
Sponsor Project Type Project Name Description Location Cost ($M)
Windsor Roadway Improvements
Jaguar Way Extension (CIP 2015-2016)
Provide a street link between Windsor Road and Starr Road, including access to Windsor High School. The project consists of one-half mile of new roadway improvements, including one travel lane in each direction, bike lanes, street lighting, sidewalks, and a bridge crossing at Starr Creek.
Directly north of Windsor High School and other parcels, from Windsor Road to Starr Road
$9
Windsor Roadway Improvements
Old Redwood Highway: Widen from Arata Lane to North Town Limits
Widen Old Redwood Highway between Arata Lane and the Northerly Town Limits. It is estimated that 50 percent of this project will be completed with private development.
Old Redwood Highway from Arata Lane to Northerly Town Limits
$5
Windsor Roadway Improvements
Old Redwood Highway: Windsor Road to Arata Lane
Widen Old Redwood Highway between Windsor Road and Arata Lane to include a center lane. It is estimated that 50 percent of this project will be completed with private development.
Old Redwood Highway from Windsor Road to Arata Lane
$13
Windsor Highway Improvements
Shiloh Road Interchange Reconstruction
Reconstruct the Shiloh Road/US 101 interchange to provide two lanes in each direction. It is anticipated that the existing overcrossing will be replaced and ramps reconfgured. It is expected that 60 percent of project costs will come from federal, state, or regional funds.
Shiloh Road/US 101 interchange
$45
Windsor Roadway Improvements
Shiloh Road: Hembree Lane to Old Redwood Highway
Widen Shiloh Rd from Hembree Ln to Old Redwood Hwy and bring it up to current design standards. It is currently estimated that 75 percent of the planned improve-ments will be completed as part of private developments within the Shiloh Vision Plan Area.
Shiloh Road from Hembree Lane to Old Redwood Highway
$11
Windsor Highway Improvements
US 101 Overcrossing of Arata Lane
Replace the US 101 overcrossing of Arata Lane to provide lane capacity and enhanced bicycle and pedestrian facilities, including sidewalks. It is expected that 60 percent of project costs will come from federal, state, or regional funds.
US 101 Overcrossing of Arata Lane
$18

A-96
Appendices | DRAFT COMPREHENSIVE TRANSPORTATION PLAN — JULY 2021
Sponsor Project Type Project Name Description Location Cost ($M)
Windsor Intersection Windsor Design/environmental/construction Windsor River $10 Improvements River Rd/ work for intersection improvements. Road/Windsor
Windsor Rd Int Improvements include a complete recon- Road/Northwest Improvements fguration of the signalized intersection to Pacifc Railroad (CIP FY a roundabout. Intersection2015-16)
Windsor Roadway Pavement Resurface streets and roads in Windsor, various streets $72 Improvements Maintenance includes the installation of ADA pedestrian and roads in
Program – Road ramps where non-ADA compliant ramps WindsorRehabilitation exist within the project limits.

A-97.
DRAFT COMPREHENSIVE TRANSPORTATION PLAN — JULY 2021 | Appendices
TABLE A-3.2 TRANSPORTATION NEEDS FROM CBO OUTREACH
# Transportation Needs CTP project match
1 Fix or install trafc lights where they are needed (e.g. on College Avenue, where there are a lot of crosswalks for pedestrians, but no actual warning lights for them to cross).
Citywide Bicycle and Pedestrian Projects 1st Phase — Plan Update (4534)
2 Maintain sidewalks in the areas of Corby and Barham Avenue. Citywide Bicycle and Pedestrian Projects 1st Phase — Plan Update (4534)
3 Make room for both a car and a bicyclist to ft in several areas: by West Side in Healdsburg, River Road and along Guerneville Road. We also need more bike signs where curves push motorists into oncoming trafc when they try to avoid bicyclists.
Mirabel Road Corridor Improvements 1-4: Summary (4563)
4 Improve maintenance of roads in Roseland (South West Santa Rosa), especially on Corby Ave and Barham Avenue in the Moorland Neighborhood.
Maintain Transportation System Pavement — Maintenance (2000); Maintain Transportation System — Road Rehabilitation (4030)
5 Add a stretch of lane for cars to merge on the 101 Freeway exit Todd Road heading south. Makes it so that ongoing trafc heading south doesn’t have to stop abruptly.
6 Address lane changing confusion on Hwy 101 Santa Rosa exit heading North at the intersection with Hwy 12. The Santa Rosa Exit is very complicated when having to change lanes just to take the exit or to merge on Hwy 101 North.
7 Address safety issues with exit ramp heading to Sonoma Ave and Hwy 12 from Hwy 101 North. The corner house has had numerous cars crash into the yard. Add a barrier between the house and that exit ramp.
8 Address trafc caused by trucks between Sonoma and Santa Rosa because there is only one road (Hwy 12).
SCT Expanded Core Intercity Routes (TR0008)
9 Promote carpooling as cost-efcient and a way to lower the cost of driving.
Countywide Microtransit (TR0012)
10 Increase frequency of buses at Moorland as wait between times is long and inconvenient.
Enhanced Core Network and Rapid Bus (4540)
11 Match weekend bus service to weekday service. Enhanced Core Network and Rapid Bus (4540)
12 Provide more bus route options in the service area and increase frequency.
Enhanced Core Network and Rapid Bus (4540); SCT Expanded Core Intercity Routes (TR0008); SCT Expanded Local Transit Services (TR0007)
13 Redesign signage inside buses to have bigger text and fully bilingual instructions (Spanish-English).

A-98
Appendices | DRAFT COMPREHENSIVE TRANSPORTATION PLAN — JULY 2021
# Transportation Needs CTP project match
14 Hire more Spanish-speaking bus drivers. All bus drivers should be bilingual, along with the receptionist at the bus station terminal.
15 Promote more people biking and walking.
16 Increase requirements for people to get their driver’s license in order to reduce risky drivers.
17 Consider hiring crossing guards for more locations than just by schools.
18 Install merge lanes to turn left on Highway 116 in Petaluma in order to better access homes in the area.
19 Add more bicycle paths in Roseland. Citywide Bicycle and Pedestrian Projects 1st Phase — Plan Update (4534)
20 Add and widen bike lanes. Citywide Bicycle and Pedestrian Projects 1st Phase — Plan Update (4524); Petaluma CBPMP Projects (BP983); Class 2 bicycle lane segments citywide (BP77)
21 Improve sidewalks so people will walk more. Citywide Bicycle and Pedestrian Projects 1st Phase — Plan Update (4524); Petaluma CBPMP Projects (BP983); Class 2 bicycle lane segments citywide (BP77)
22 Close sidewalk gaps along Lakeville Hwy-Hwy 116 so people can walk to Kaiser Permanente.
23 Make it easier to rent a scooter or bike in order to encourage not using a car.
Countywide Expansion of Micromobility and frst/last mile (4538)
24 Create a new “Walk and roll to school” campaign to encourage students to walk or ride to school, where students would get a rafe ticket for a bike every time they walked or rode to school.
Safe Routes to School (4505)
25 Add newer and more eco-friendly buses. Transitioning toward zero emissions feet by 2029: Petaluma Fleet Replacement (4505); Santa Rosa Bus Replacements (4510); SCT Existing Vehicle Replacements (4504); Santa Rosa Transit Fleet Electrifcation (TR0002)
26 Add more safety measures for smart train stops or where the bus passes by (especially in Rohnert Park).
27 Install lighting at more bus stops — especially important when daylight savings time ends
SCT Countywide Bus Stop Improvements (TR0009); Ongoing Bus Stop Improvements (4539)

A-99.
DRAFT COMPREHENSIVE TRANSPORTATION PLAN — JULY 2021 | Appendices
# Transportation Needs CTP project match
28 Provide transit discounts for multiple family members, or reduced prices, so that big families can aford to take transit.
SCT Local Route Fare-Free Program (TR0010); Systemwide Fare-free Transit and Paratransit (TR0001); Fare Free Program (TR0006)
29 Ofer free rides on buses to all elderly people and potentially everyone else.
SCT Local Route Fare-Free Program (TR0010); Systemwide Fare-free Transit and Paratransit (TR0001); Fare Free Program (TR0006)
30 Increase carpooling. Countywide Microtransit (TR0012)
31 Make it easier for riders taking routes that are located at Coddingtown to get downtown.
Enhanced Core Network and Rapid Bus (4540)
32 Provide digital display of bus routes with accurate timing and route signage at each stop.
Passenger Information and Fare Payment Technology and Marketing (3041)
33 Provide a smartphone app that shows the closest bus stop and esti-mated arrival time for buses.
34 Work with Google to have Google Maps show bus routes.
35 Address unsafe parked cars and lack of parking signs on Sebastopol Road near the Roseland Village Shopping Center.
36 Schedule garbage trucks and street cleaning outside of regular commute times.
37 Do more to reduce congestion on Sebastopol Road. Sebastopol Road Corridor Plan widen Dutton Ave to Stony Point Rd (2119); Sebastopol Road Corridor Plan widen Olive Street to Dutton Avenue (2078); West Avenue reconstruct and widen Sebastopol Road to South Avenue (2051); Enhanced Core Network Part 3 of 3 (capital)—Rapid Bus planning, engineering , and infrastructure (3007)
38 Do more to coordinate and design systems of bicycle lanes. Climate Adaptation Technology Innovation Transport Initiatives (4526)
39 Implement more walking trails to school, such as through Safe Routes to School.
Safe Routes to School (4505)
40 Ensure all roads are regularly swept in Roseland.
41 Make paratransit service curb to curb instead of door to door.
42 Work with healthcare providers, like Kaiser, to partner with Uber and Lyft to book a driver when you book your appointment. This saves money when fewer people miss their appointment.

A 100
Appendices | DRAFT COMPREHENSIVE TRANSPORTATION PLAN — JULY 2021
-
# Transportation Needs CTP project match
43 Run bus routes with 15 minutes between buses (45 minutes to 1 hour doesn’t work).
Enhanced Core Network and Rapid Bus (4540); SCT Expanded Core Intercity Routes (TR0008); SCT Expanded Local Transit Services (TR0007)
44 Increase frequency of bus schedule to accommodate seniors. Could be even be with smaller buses.
Enhanced Core Network and Rapid Bus (4540); SCT Expanded Core Intercity Routes (TR0008); SCT Expanded Local Transit Services (TR0007)
45 Provide a SMART Train ticket kiosk or a person assisting at train stops for seniors or people who are not tech savvy
46 Provide a phone number where people can call to get help to get around on the buses or train (for people who don’t know how to use the bus system).
47 Ofer an app to report street maintenance (“My Santa Rosa” app was useful and easy to use, but now it’s gone and reporting issues is more time consuming).
48 Ofer something like a fast track, maybe a clipper card, for people who use multiple transportations. This would help with using less paper and hopefully a discounted cost.
49 Making better use of the HOV lane.
50 Provide more bike racks, including working with businesses at their locations.
51 Provide separate parking area for bicyclists, away from the cars.
52 Provide bike paths on more roads and make them closer to the sidewalks.
Citywide Bicycle and Pedestrian Projects 1st Phase — Plan Update (4524); Petaluma CBPMP Projects (BP983); Class 2 bicycle lane segments citywide (BP77)
53 Run a shuttle between SSU and the train station to provide students with more afordable options.
Countywide Expansion of Micromobility and frst/last mile (4538); First/Last Mile SMART Stations Capital Enhancments (4503)
54 Work with healthcare providers, like Kaiser, to provide a shuttle from transit in order to reduce costs when people fall, get sick, etc.
Countywide Microtransit (TR0012)
55 Provide more seating at bus stops. SCT Countywide Bus Stop Improvements (TR0009); Ongoing Bus Stop Improvements (4539)
56 Outft all buses with bike racks.
57 Allow college students to use the bus for free in order to help them save money and encourage them to use public transportation more often.
SCT Local Route Fare-Free Program (TR0010); Systemwide Fare-free Transit and Paratransit (TR0001); Fare Free Program (TR0006)
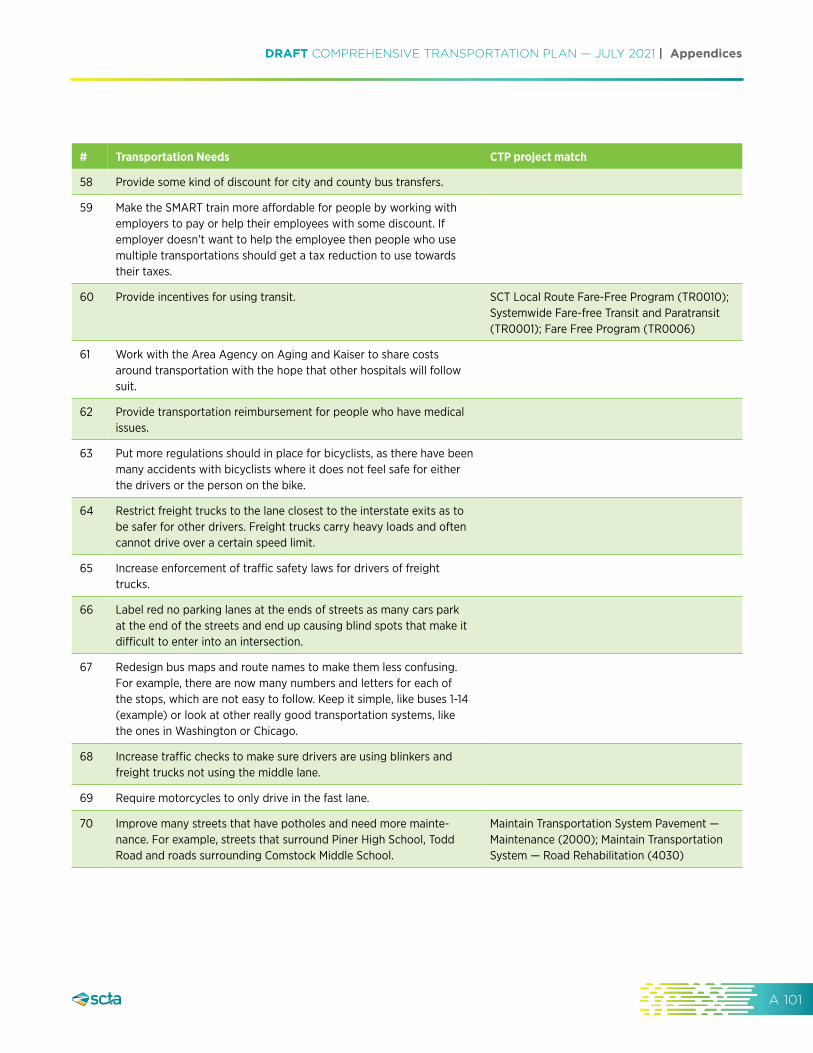
A 101.
DRAFT COMPREHENSIVE TRANSPORTATION PLAN — JULY 2021 | Appendices
-
# Transportation Needs CTP project match
58 Provide some kind of discount for city and county bus transfers.
59 Make the SMART train more afordable for people by working with employers to pay or help their employees with some discount. If employer doesn’t want to help the employee then people who use multiple transportations should get a tax reduction to use towards their taxes.
60 Provide incentives for using transit. SCT Local Route Fare-Free Program (TR0010); Systemwide Fare-free Transit and Paratransit (TR0001); Fare Free Program (TR0006)
61 Work with the Area Agency on Aging and Kaiser to share costs around transportation with the hope that other hospitals will follow suit.
62 Provide transportation reimbursement for people who have medical issues.
63 Put more regulations should in place for bicyclists, as there have been many accidents with bicyclists where it does not feel safe for either the drivers or the person on the bike.
64 Restrict freight trucks to the lane closest to the interstate exits as to be safer for other drivers. Freight trucks carry heavy loads and often cannot drive over a certain speed limit.
65 Increase enforcement of trafc safety laws for drivers of freight trucks.
66 Label red no parking lanes at the ends of streets as many cars park at the end of the streets and end up causing blind spots that make it difcult to enter into an intersection.
67 Redesign bus maps and route names to make them less confusing. For example, there are now many numbers and letters for each of the stops, which are not easy to follow. Keep it simple, like buses 1-14 (example) or look at other really good transportation systems, like the ones in Washington or Chicago.
68 Increase trafc checks to make sure drivers are using blinkers and freight trucks not using the middle lane.
69 Require motorcycles to only drive in the fast lane.
70 Improve many streets that have potholes and need more mainte-nance. For example, streets that surround Piner High School, Todd Road and roads surrounding Comstock Middle School.
Maintain Transportation System Pavement — Maintenance (2000); Maintain Transportation System — Road Rehabilitation (4030)

A-102
Appendices | DRAFT COMPREHENSIVE TRANSPORTATION PLAN — JULY 2021
# Transportation Needs CTP project match
71 Add sidewalks to streets in the Rincon Valley area. For example, near the middle school (Rincon Valley Middle School) and the High School (Mario Carrillo High School).
Citywide Bicycle and Pedestrian Projects 1st Phase — Plan Update (4534)
72 Add sidewalks to streets in the Moorland Neighborhood. Citywide Bicycle and Pedestrian Projects 1st Phase — Plan Update (4534)
73 Add more walking bridges over Hwy 101 to help with getting between neighborhoods.
Highway 101 Bicycle/Pedestrian Crossing (3048); New Bike/Pedestrian Path Crossing Hwy 101 at Hinebaugh Creek (BP171); East West Bicycle and Pedestrian Connections (4529)
74 Address trafc safety in the Piner neighborhood. For example, add crosswalks in the area surrounding the schools. Many students walk to school and sometimes use a back entrance but it is also unsafe and there needs to be more fashing lights for pedestrians.
Citywide Bicycle and Pedestrian Projects 1st Phase — Plan Update (4534)
75 Construct sidewalks around more bus stops as there are often not even sidewalks at bus stops on the side of a road. For example, the bus stop on Hwy 12 heading to Sebastopol.
SCT Countywide Bus Stop Improvements (TR0009)
76 Adopt concrete dividers for bike lanes where feasible.
77 Add more bike lanes near the schools as many students also ride their bikes to school.
Citywide Bicycle and Pedestrian Projects 1st Phase — Plan Update (4524); Petaluma CBPMP Projects (BP983); Class 2 bicycle lane segments citywide (BP77)
78 Add bike lanes to every street and use colors for the lanes when possible.
79 Dedicate more funds in unincorporated Sonoma County to rebuild roads or do maintenance. For example, at Chico Ave there have been numerous requests to help rebuild the road, but there has been no responses and no work done to date.
Pavement Maintenance Countywide (4508)
80 Improve transition from Hwy 101 and Hwy 12 going north around the Santa Rosa downtown exit.
81 Add more light posts on Petaluma Hill Road.
82 Add places for people to sit at each of the bus stops with some sort of shade being provided.
SCT Countywide Bus Stop Improvements (TR0009); Ongoing Bus Stop Improvements (4539)
83 Separate bus stops from ongoing trafc where possible. Enhanced Core Network Part 3 of 3 (capital) — Rapid Bus planning, engineering , and infra-structure (3007); Enhanced Core Network and Rapid Bus, operating (4540)

A-103.
DRAFT COMPREHENSIVE TRANSPORTATION PLAN — JULY 2021 | Appendices
# Transportation Needs CTP project match
84 Ofer more cost saving options for all students to be able to aford the bus. For example, the discount for students who attend SRJC and have free bus rides.
SCT Local Route Fare-Free Program (TR0010); Systemwide Fare-free Transit and Paratransit (TR0001); Fare Free Program (TR0006)
85 Provide more frequent buses from Santa Rosa to Graton Day Labor Center in order to entice people to use them.
SCT Expanded Core Intercity Routes (TR0008)
86 Provide better outreach about public transit in others language and though multiple channels. Examples include mailing information in Spanish to people’s homes, sharing information on Spanish-speaking TV channels (such as Univision), and translating all information in Spanish so people can trust to expect information in Spanish.
87 Identify signifcant languages spoken by immigrant communities other than Spanish.
88 Hire more bus drivers who can speak Spanish. A Spanish speaker who is familiar with the bus and other public transit systems could be a translator in person as accompaniment, or over phone as a temporary solution until there are bilingual bus drivers.
89 Provide a public transit hotline number with translators, including indigenous language translators.
90 Provide video or audio information about the public transit system as not everyone can read text.
91 All buses should give change automatically. Every dollar counts for low-income riders and it feels unjust when users cannot get change back.
92 Provide more sidewalks in some neighborhoods. Citywide Bicycle and Pedestrian Projects 1st Phase — Plan Update (4524); Petaluma CBPMP Projects (BP983)
93 Fix potholes in low-income neighborhoods. Pavement Maintenance Countywide (4508)
94 Provide more shading in the transit system as it is a concern to participants health and well-being (especially for elderly and mothers with small children).
Ongoing Bus Stop Improvements (4539)
95 Utilize new resources, like Uber/Lyft for more individualized rides for seniors.
96 Organize more volunteer drivers to help seniors get around. For example, 1 Ride by Petaluma People Services ofers 3 rides 3 x a week for seniors.
97 Add another bus route to get to the coast during the summer. For example, a coastal bus from Petaluma, Cotati and Rohnert Park.
SCT Expanded Core Intercity Routes (TR0008)

A 104
Appendices | DRAFT COMPREHENSIVE TRANSPORTATION PLAN — JULY 2021
-
# Transportation Needs CTP project match
98 Add a small bus from Guerneville to Armstrong Wood that runs every Countywide Microtransit (TR0012) hour.
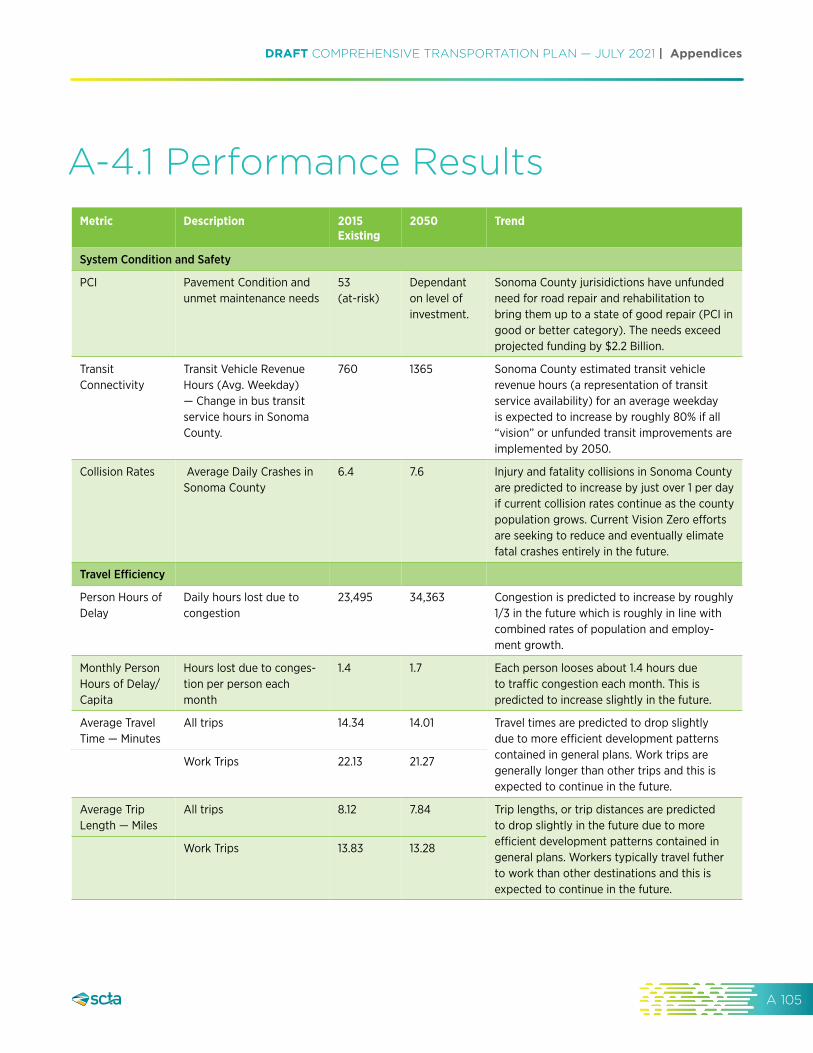
A 105.
DRAFT COMPREHENSIVE TRANSPORTATION PLAN — JULY 2021 | Appendices
Metric Description 2015 Existing
2050 Trend
System Condition and Safety
PCI Pavement Condition and unmet maintenance needs
Transit Transit Vehicle Revenue Connectivity Hours (Avg. Weekday)
— Change in bus transit service hours in Sonoma County.
Collision Rates Average Daily Crashes in Sonoma County
Travel Efciency
Person Hours of Daily hours lost due to Delay congestion
Monthly Person Hours lost due to conges-Hours of Delay/ tion per person each Capita month
Average Travel All trips Time — Minutes
Work Trips
Average Trip All trips Length — Miles
Work Trips
53 (at-risk)
760
6.4
23,495
1.4
14.34
22.13
8.12
13.83
Dependant on level of investment.
1365
7.6
34,363
1.7
14.01
21.27
7.84
13.28
Sonoma County jurisidictions have unfunded need for road repair and rehabilitation to bring them up to a state of good repair (PCI in good or better category). The needs exceed projected funding by $2.2 Billion.
Sonoma County estimated transit vehicle revenue hours (a representation of transit service availability) for an average weekday is expected to increase by roughly 80% if all “vision” or unfunded transit improvements are implemented by 2050.
Injury and fatality collisions in Sonoma County are predicted to increase by just over 1 per day if current collision rates continue as the county population grows. Current Vision Zero eforts are seeking to reduce and eventually elimate fatal crashes entirely in the future.
Congestion is predicted to increase by roughly 1/3 in the future which is roughly in line with combined rates of population and employ-ment growth.
Each person looses about 1.4 hours due to trafc congestion each month. This is predicted to increase slightly in the future.
Travel times are predicted to drop slightly due to more efcient development patterns contained in general plans. Work trips are generally longer than other trips and this is expected to continue in the future.
Trip lengths, or trip distances are predicted to drop slightly in the future due to more efcient development patterns contained in general plans. Workers typically travel futher to work than other destinations and this is expected to continue in the future.
-
A-4.1.Performance.Results

A 106
Appendices | DRAFT COMPREHENSIVE TRANSPORTATION PLAN — JULY 2021
-
Metric Description 2015 Existing
2050 Trend
Transit Use and Active Transportation
Mode Share (Non-motorized)
% of trips by non-auto modes that begin and/or end in Sonoma County.
8.50% 8.50% The share of people using transit and active transportation modes (biking, walking) is projected to stay the same. The number of travellers walking, biking, and taking transit, but so does the number of travellers driving or sharing an automobile trip.
Non-motorized Network Connectivity
Change in the number of bicycle facility miles in Sonoma County
208.23 1,066.47 The mileage of bicycle and pedestrian facili-ties includinig of street multi-use pathways, on street bike lanes, and marked bike routes would increase by over 5 times if the entire CTP and Countywide Bicycle and Pedestrian Plan list of unfunded non-motorized projects were funded.
Transit Ridership Daily public transit ridership (all transit) that begins and/or ends in Sonoma County.
16,170 20,883 Transit ridership is projected to increase in the future. It is anticipated that this is due to population growth and improvements to transit service.
Transit Ridership/Capita
Annual public transit ridership (all transit) that begins and/or ends in Sonoma County per person. Efciency metric controls for population growth.
11.75 12.25 Transit ridership per capita is projected to increase slightly due to transit system improvements.
Equity and the Environment
Average Household Travel Costs
Average percentage of household income spent on transportation
22.1% 21.6% The average percentage of household income spent on transportation is predicted to drop slightly because of more efcient growth patterns in general plans, and more non-auto travel options included in the complete CTP project list.
GHG Emissions GHG emissions (CO2E) for autos and light duty trucks for travel beginning and/or ending in Sonoma County.
2,645,752 1,752,714 GHG emissions are projected to decrease. This is primarily do to improved vehicle fuel economy as projected by the State of California (EMFAC 2017)

A 107.
DRAFT COMPREHENSIVE TRANSPORTATION PLAN — JULY 2021 | Appendices
-
Metric Description 2015 Existing
2050 Trend
GHG/capita GHG emissions per person, controls for population growth.
5.27 2.85 GHG emissions per capita are projected to decrease due to improved vehicle fuel economy standards mandated by the state and more concentrated and efcient predicted future development patterns.
Vehicle Miles Traveled (VMT)
Vehicle miles of travel for all auto/light duty truck travel for travel that begins and/or ends in Sonoma County
14,407,222 17,192,167 Total VMT is projected to increase but at a slower rate than population and employment growth.
VMT/capita VMT per capita, controls for population growth.
28.69 27.65 VMT per capita is projected to decrease
VMT/job VMT per job, controls for employment growth.
66.55 55.16 VMT per job is projected to decrease

A 108
Appendices | DRAFT COMPREHENSIVE TRANSPORTATION PLAN — JULY 2021
-
A-4.2. Zero.Emissions. by.2050
A major goal of past CTP’s has been the reduc-
tion of greenhouse gas (GHG) emissions from
the transportation sector. In recognition of the
urgency of the climate crisis, this CTP establishes
a new goal of transitioning our transportation
system to zero emissions by 2050. This goal is
highly developed because of work done by the
Regional Climate Protection Authority (RCPA) in
its Strategic Plan 2025 and more recently with
the Sonoma Climate Mobilization Strategy.
Sonoma County’s most recent inventory update
for 2018 revealed that transportation continued
to be the largest source of greenhouse gas
emissions at approximately 60 percent of
total emissions. Transportation emissions have
increased from 1.9 million metric tons carbon
dioxide equivalent (MTCO2e) in 1990 to over 2
million MTCO2e in 2018, an increase of 7 percent.
In contrast, Sonoma County achieved reductions
in emissions from all other sources over the same
time period.
Almost 93 percent of the 2018 transportation
sector emissions were from on-road transporta-
tion (cars, motorcycles, trucks, and buses). The
majority of the remaining 7 percent consisted
of emissions from off-road equipment such as
airport ground support equipment. Less than 1
percent of total emissions were from the SMART
commuter rail system which began service in
2017.
Between the greenhouse gas inventory base
year of 1990 and the 2018 inventory, total county
population increased by 29 percent and vehicle
miles traveled per capita increased 18 percent.
During the same time period, per capita green-
house gas emissions from on-road transportation
decreased by approximately 14 percent. The
decrease in emissions is attributed to improve-
ments in vehicle fuel effciency and a shift toward
hybrid, plug-in hybrid, and battery electric
vehicles.
In recognition of the need to accelerate prog-
ress on climate action, all ten of the jurisdictions
in Sonoma County adopted climate emergency
resolutions between 2019 and 2021. These resolu-
tions were a response to the increasing urgency
of taking action to mitigate and adapt to the
effects of climate change.
The RCPA Board adopted a climate emergency
resolution in September 2019 and directed staff
to develop the Sonoma Climate Mobilization
Strategy (SCMS). The SCMS has a goal of
achieving carbon neutrality by 2030 in Sonoma
County. Carbon neutral means that every ton
of human caused CO2 emitted is offset with an
equivalent amount of CO2 removed (e.g. via
carbon sequestration). To achieve this ambitious
goal, Sonoma County will need to decrease emis-
sions from the transportation sector by at least
80 percent by 2030.
The 2021 CTP supports the local climate emer-
gency resolutions through recommended
programs, policies, and projects that, when
implemented, will contribute to the reduction of
GHG emissions from the transportation sector.

A 109.
DRAFT COMPREHENSIVE TRANSPORTATION PLAN — JULY 2021 | Appendices
SHIFT SONOMA COUNTY STRATEGIES
Strategy Goals Solutions
Mode • By 2040, reduce per Transportation Shift capita vehicles miles trav- demand
eled (VMT) by 10% management
• Shift 4% of single Bike share occupant vehicle trips to
biking or walking Car share
• Increase transit ridership by 4 times
• Reduce average house-hold travel costs below 2010 levels.
Fuel Shift
• Reduce countywide petroleum use by 50%
• Increase EVs to 100,000
• Increase number of charging stations to at least 11,000, at work-places and public settings
• Increase access to electric transportation options in low-income households and communities of concern
• Continue municipal lead-ership through integration of EVs into feets and installation of workplace and publicly accessible charging at government facilities
Increased EV adoption
Expanded EV charging infrastructure
-
Adoption of Shift Sonoma County Low Carbon Transportation Plan (SHIFT)
The last CTP highlighted actions necessary to
achieve the GHG reduction goals established in
Climate Action 2020 and Beyond.1 These goals
translated to reducing 2040 GHG emissions from
transportation to 60 percent below 1990 levels
by 2040.
The Shift Sonoma County Low Carbon
Transportation Plan was adopted by the Sonoma
County Transportation Authority Board in 2018.
The primary goals of the plan are to:
• Reduce greenhouse gases from
transportation.
• Reduce vehicles miles traveled.
• Promote safety and health.
• Promote economic vitality.
The plan contains two high level strategies —
Mode Shift and Fuel Shift. Each strategy defned
goals and corresponding transportation solutions
as described in the table below.
Since the adoption of Shift, SCTA and RCPA have
implemented a number of the strategies outlined
in the plan, including:
• Completed a car share pilot
• Launched an online knowledge base for
common EV questions
Climate Action 2020 and Beyond, https://rcpa.ca.gov/wp-content/uploads/2016/07/CA2020_Plan_7-7-16_web.pdf 1

A 110
Appendices | DRAFT COMPREHENSIVE TRANSPORTATION PLAN — JULY 2021
-
• Increased local government and workplace Prioritize transportation funding for zero-emis-
EV awareness sions strategies.
• Updated EV charging station guidelines
• Supported streamlined EV charging station
permitting
• Refned existing EV charging station siting
analysis
• Implemented a clean commute program for
County of Sonoma employees
• Established a county-wide emergency ride
home program
• Completed planning for the launch of a
bikeshare pilot that will be implemented
near SMART stations in Marin and Sonoma
counties in 2021.
In terms of bicycle and pedestrian infrastruc-
ture, multiple sections of the SMART pathway
were completed as were several other important
facilities.
Local transit operators began investing in new
electric buses and the development of the neces-
sary charging infrastructure. Transit operators
rolled out fare free programs and modifed routes
to increase ridership.
Moving forward, what is required to meet the 2050 Goal?
In order to achieve a zero-emission transporta-
tion network by 2050, Sonoma County needs to
reduce emissions at a faster rate than envisioned
in the 2016 CTP.
To achieve the 2050 goal of a zero-emissions
transportation network, the following objectives
and strategies have been defned.
• Work with local and regional policy makers
to integrate zero emissions goals into
criteria for funding new transportation
projects.
• Accelerate the adoption of zero emission
vehicles by providing incentives with a focus
on low-income communities.
• Develop a VMT mitigation bank with
requirements that all projects funded by the
mitigation bank meet established criteria to
reduce emissions with preference given to
zero emission strategies.
Emphasize strategies that incentivize transit and
shared mobility.
• Secure funding to expand and sustain fare
free programs.
• Research policies that support the deploy-
ment of autonomous transit vehicles such
as downtown circulators or shuttles. Policies
could include roadway space dedicated to
autonomous transit, preferential curb space,
and pricing.
Take bold steps to achieve a zero-emission trans-
portation network.
• Implement pricing and parking policies that
have resulted in measurable reductions in
vehicle miles traveled in other jurisdictions
such as:
» Congestion pricing
» Unbundle parking from all developments

A 111.
DRAFT COMPREHENSIVE TRANSPORTATION PLAN — JULY 2021 | Appendices
-
» Eliminate free parking from activity
centers (e.g., shopping, employment)
» Implement programs to offset impact
of pricing policies on low income
households
• Repurpose existing local streets and roads
to allocate more space for bicycles, pedes-
trians, and micro mobility solutions. Reduce
speed limits on all streets shared with bicy-
cles and pedestrians to improve safety.
• Make all new streets complete streets.
• Implement policies that encourage adoption
of smaller, autonomous, shared, all electric
vehicles and discourage single occupant,
privately owned autonomous vehicles.
• Advocate for changes to fuel taxes and
other vehicle-related fees to disincen-
tivize the use of fossil fuel vehicles and
raise funding to support more sustainable
mobility options.
Support climate-friendly land use practices
through ongoing coordination and alignment.
• Work with local jurisdictions to integrate
strategies that support zero-emissions goal
into general plans, specifc plans, and other
planning processes.
Implement Shift Sonoma County Plan
• Complete implementation of mode and fuel
shift strategies outlined in the plan.
• Prioritize needs of low income and marginal-
ized communities.
Transportation Electrifcation
Electric vehicles powered with clean renewable
energy represent a huge opportunity to reduce
greenhouse gas emissions from transportation
while keeping money spent on fuel in the local
economy, reducing pollution, and saving drivers
money.
EV technologies are commercially viable and
the infrastructure needed to use electricity as
transportation fuel is mostly in place in the form
of the existing electricity grid. This is in contrast
with using hydrogen, which holds great promise
as a transportation fuel but requires entirely new
distribution infrastructure. EVs are more effcient
than gas vehicles with over 77% of the energy
from the local grid converted to power on the
road. For comparison, typical gasoline vehicles
can only convert around 12% of the energy and
produce signifcant excess heat.2
• The default power for residents and busi-
nesses in Sonoma County is 97% carbon
free, making it one of the best places in the
U.S. to reduce emissions through electri-
fying transportation.3 With expectations for
continued growth in EVs, electric vehicles
are projected to use 5.4% of California’s
electricity by 2030.4 Continued growth in
clean energy and more resilient power grids
will be key to fueling the shift to electric
transportation.
U.S. Department of Energy, https://www.fueleconomy.gov/feg/evtech.shtml 3 SCP Power Sources, https://sonomacleanpower.org/power-sources 4 The Pew Charitable Trusts, https://www.pewtrusts.org/en/research-and-analysis/blogs/stateline/2020/01/09/ electric-cars-will-challenge-state-power-grids?
2

A 112
Appendices | DRAFT COMPREHENSIVE TRANSPORTATION PLAN — JULY 2021
-
Electric Vehicles
EV sales have continued to grow in Sonoma
County since they were introduced in 2010. There
have been 10,827 cumulative light-duty ZEV sales
in Sonoma County between 2010 and 2020, with
1,609 just in 2020. Statewide, ZEV sales made up
7.78% of new light duty vehicle sales in 2020 and
ZEVs now make up 2.3% of all registered light-
duty vehicles in Sonoma County.
Private EV ownership cannot meet all transporta-
tion needs. Public bus transit is also electrifying
and bringing cleaner air with quiet operation
to many neighborhoods. As of 2020 there are
three electric buses in the Sonoma County feet
and all transit agencies in Sonoma County are
actively working to procure electric buses ahead
of the state requirements. In 2018, the California
Air Resources Board set requirements that all
transit bus feets transition to 100% zero emission
vehicles by 2040, with all bus purchases starting
in 2029 required to be battery electric or fuel
cell electric.5
Charging Infrastructure
While most EVs charge overnight at home, public
charging opportunities are also an important part
of supporting adoption of EVs. In 2020, Sonoma
County had 94 DC Fast Chargers (91 public and
3 shared private), along with 634 of the slower
Level 2 chargers (404 public and 231 shared
private).
Sonoma County has more public level 2 and DC
fast chargers per capita compared to the state
average, but overall has 15% fewer chargers per
capita when compared to the state average. This
is due to a lower density of shared private char-
gers that are typically found at workplaces and
multi-unit dwellings.
The Evolution of EVs
The Bloomberg New Energy Forecast (BNEF)
publishes an annual electric vehicle outlook.6 In
2020, they forecast that car makers are moving
up their plans to launch new EVs launch – partly
to comply with tougher regulations in China
and Europe. BNEF forecasts that by 2022 there
will be more than 500 different EV models sold
across the world and that increased model
choice and more aggressive pricing will bring
new customers into the EV market.
According to the forecast, “the electric share
of total vehicle sales is still small, but it is rising
fast. By 2040, over half of all passenger vehicles
sold will be electric.”7 California sales are likely to
follow a steeper curve in keeping with Governor
Newsom’s Executive Order N-79-20 requiring 100
percent of all new in-state sales of cars and light
trucks to be zero-emissions vehicles by 2035.8
In 2017, the SCTA and RCPA developed a
countywide EV Charging Infrastructure Siting
Framework in order to inform EV charging infra-
structure investment for local governments, EV
service providers, utilities, employers and devel-
opers. The recommended level of public and
workplace charging from the framework refect
a goal of 100,000 electric vehicles operating
in Sonoma County by 2030. The Shift Sonoma
California Air Resources Board, https://ww2.arb.ca.gov/news/california-transitioning-all-electric-public-bus-feet-2040 6 BNEF EV Outlook, https://about.bnef.com/electric-vehicle-outlook/ 7 BNEF EV Outlook, https://about.bnef.com/electric-vehicle-outlook/ 8 Governor Newsom’s Zero-Emission by 2035 Executive Order, https://ww2.arb.ca.gov/resources/fact-sheets/ governor-newsoms-zero-emission-2035-executive-order-n-79-20
5

A 113.
DRAFT COMPREHENSIVE TRANSPORTATION PLAN — JULY 2021 | Appendices
-
County plan estimates that this would cut
Sonoma Country transportation emissions in half.
FIGURE X: HEAT MAP OF FORECASTED EV OPPORTUNITY CHARGING DEMAND
FIGURE X. EV SALES TO MEET SHIFT SONOMA COUNTY GOAL OF 100,000 BY 2030
The Shift Sonoma County plan set a goal for a
50% reduction in transportation emissions by
2030 that could be achieved through vehicle
electrifcation. The plan includes a scenario built
with a model from the Electric Power Research
Institute that shows there would need to be over
7,000 workplace chargers and over 4,000 oppor
tunity chargers to meet the 2030 goal.
The Shift Sonoma County also includes a
charging infrastructure siting tool that shows
the potential for near term EV charging station
locations in Sonoma County based on a set of
criteria such as levels of forecasted EV ownershi
and the SCTA’s Sonoma County Travel Model.
This gives a picture of where likely EV owners wil
travel to and highlights the most likely oppor-
tunity charging needs. The map and forecasted
charging infrastructure needs show that there is
signifcant progress needed to build out new EV
charging locations.
-
p
l
TABLE X: PUBLIC OPPORTUNITY CHARGING PORTS TO SUPPORT 2030 EV GOAL
Jurisdiction 2019 actual 2030 target
Cloverdale 7 179
Cotati 6 45
Healdsburg 67 108
Petaluma 104 718
Rohnert Park 28 481
Santa Rosa 224 1866
Sebastopol 19 247
Sonoma 33 83
Windsor 23 23
Unincorporated 49 562
A complete list of recommended strategies and
actions to achieve a zero-emissions transporta-
tion network is included in Appendix X.

A 114
Appendices | DRAFT COMPREHENSIVE TRANSPORTATION PLAN — JULY 2021
2021–2022 FUNDING OPPORTUNITIES SCTA ADMINISTERED PROGRAMMING — FY23 TO FY27
Funding type Est. Amount ($M)
OBAG3 Federal $25.0
STIP State/Fed $8.0
STIP (CRRSAA) Federal $2.4
LPP(f) State $7.0
TDA3 State $3.7
TFCA State $2.6
Go Sonoma Local $20.0
Reg. Mitigation Fee Local $4.8
Total $73.5
-
A-4.3. Transportation. Fund.Sources
Transportation infrastructure and operations in
Sonoma County are funded by a mix of local,
regional, state, and federal funding. The funds
are generated through various sources including,
but not limited to fuel taxes, fees, and sales tax,
and are administered by multiple agencies under
various programs, each with their own set of
regulations and limitations. Certain revenues can
only be spent at the discretion of local juris-
dictions, and most are limited to very specifc
purposes and time frames. Some of the funds are
allocated to Sonoma County based on complex
formulas that include factors related to popula-
tion, transportation infrastructure (such as road
miles or transit system revenue and performance
factors), and housing. Other funds are compet-
itive and require detailed funding applications
that assess things like cost/beneft and air quality
improvement.
SCTA plays a fundamental role in determining
fund programming among its local jurisdic-
tions and between Sonoma County and the
rest of the Bay Area region. The Metropolitan
Transportation Commission (MTC) serves as the
designated recipient of much of the region’s
federal and State funds. The SCTA also works
with the Air Districts, Caltrans and the California
Transportation Commission (CTC) on funding
programs.
There are three categories of funding
opportunities:
1. Current fund sources in FY22
2. Fund sources to be leveraged
3. Possible future fund sources
CURRENT FUND SOURCES IN FY22
In fscal year 2021-22 (FY22), the SCTA will
manage programming from several different fund
sources that could be aligned to deliver multiple
types of priority projects across the County. The
SCTA will issue calls for projects, score projects
based on criteria and fund requirements, review
programming with advisory committees and
propose projects to be funded to the Board. The
fund sources to be acted on this fscal year are
for programming in FY23 through FY27.

A 115.
DRAFT COMPREHENSIVE TRANSPORTATION PLAN — JULY 2021 | Appendices
-
One Bay Area Grant (OBAG) program
SCTA administers OBAG in Sonoma County. The
upcoming OBAG Cycle 3 (FY23-FY27) will be
determined by MTC October of 2021. The last
OBAG cycle (Cycle 2) yielded approximately $28
million across Sonoma County. Previous cycles
have funded bicycle/pedestrian projects, inter-
section and operational improvements on local
roads, as well road rehabilitation on streets in
dire need of pothole repair.
Distribution Criteria
Historically SCTA has been given a share of these
federal funds based on an MTC formula that
included transportation and housing factors. The
direct formula based approach was since ques-
tions by the Federal Highway Administration and
may be discontinued. The distribution criteria for
OBAG3 has not yet been established, however
instead of SCTA being given a specifc amount of
funds MTC may provide a target to each County.
The SCTA target will likely be between $20-30
million.
Project Types
A portion of these funds can be used for almost
all types of transportation capital improvement
projects, while a portion are limited to new or
expanded transportation projects that support
efforts to meet requirements under the Clean
Air Act in non-attainment or maintenance
areas. Examples of Clean Air eligible projects
include non-recreational bicycle and pedestrian
facilities, transit projects, rideshare and telecom-
muting activities, and signal coordination. It is
expected that at least half of the funds will need
to be programmed in or in service of a Priority
Development Area (PDA).
State Transportation Improvement Program (STIP)
The STIP is a multi-year capital improvement
program of transportation projects on and off
the State Highway System derived from State
and federal gas tax revenues. The amount of
funding to each county is determined by formula
although SCTA was able to borrow ahead to help
fund ready portions of the US 101. Projects must
be approved by MTC and the CTC.
Project Types
Transportation projects for State highway
improvements, intercity rail, and regional
highway and transit improvements. Any capital
project — from a new roadway or new bike path
to a highway expansion or rail line extension
— may be included in the STIP including buses
and rolling stock. Transit operations are not an
eligible expenditure. The Highway 101 project was
funded with STIP and Measure M funding over
the last 20 years.
Next Funding Cycle
An estimated $2.4 million will be available to
program to projects in FY23 and FY24 and $8
million in FY26 and FY27. Clarity on the amount
of funds available will occur in July.
Senate Bill 1 (SB1) — The Road Repair and Accountability Act of 2017 — Local Partnership Program (formulaic) (LPPf)
The Local Partnership Program provides local
and regional transportation agencies that have
passed sales tax measures, developer fees, or
other voter-imposed transportation fees with a
continuous appropriation of $200 million annu-
ally statewide to fund road maintenance and

A 116
Appendices | DRAFT COMPREHENSIVE TRANSPORTATION PLAN — JULY 2021
-
rehabilitation, sound walls, and other transpor-
tation improvement projects. SCTA issues a call
for projects for Sonoma County’s share which
is about $500K a year. SCTA is also eligible
this year for incentive funding reserved in this
program for agencies that pass new transporta-
tion sales tax measures (Go Sonoma).
SCTA’s share of SB1-LPP(f) funding is estimated
at $7 million over the next 5 years.
Distribution Criteria
SCTA Board approved projects based on CTC
Criteria.
Project Types
SCTA has funded pedestrian crossings, sidewalk
improvements and signal timing improvement
projects.
Transportation Fund for Clean Air (TFCA) — county program
TFCA provides grants to the most cost-effec-
tive projects in the Bay Area that will decrease
motor vehicle emissions and improve air
quality. Projects must be consistent with the
1988 California Clean Air Act and the Bay Area
Ozone Strategy. SCTA is the designated agency
to administer the portion of the program that
comes to Sonoma County. SCTA programs TFCA
program manager funds annually, with approx-
imately $500,000 in new funds available each
year. There is also a regional program adminis-
tered by the Bay Area Air Quality Management
District (BAAQMD).
Distribution Criteria
In October 2006, the SCTA Board set the criteria
to be used for the distribution of TFCA funding.
This was later adjusted in December 2013. The
two-part distribution is as follows.
1. Sonoma County, City of Santa Rosa, and
City of Petaluma receive guaranteed
“off-the-top” funding for transit programs.
Combined, the guaranteed funding for
transit accounts for about 78 percent of the
total program and is distributed among the
recipients based on their annually updated
population totals.
2. Jurisdictions within the BAAQMD Air Basin
that do not operate transit — Windsor,
Rohnert Park, Cotati, Sonoma, and
Sebastopol — are eligible to apply for a
competitive portion of the funding. If the
competitive portion is not fully subscribed, it
is opened up to the County, Santa Rosa, and
Petaluma for application.
Project Types
• Trip Reduction — includes transit, shuttle,
feeder bus, vanpool, carpool, rail-bus inte-
gration, telecommuting, congestion pricing,
and other pilot projects.
• Bicycle — includes Class I, II, III, and IV
bicycle facilities, bicycle parking, and bike
share.
• Clean Air Vehicle and Infrastructure
— includes alternative fuel vehicles, scrap-
ping old vehicles, and alternative fuel
infrastructure.

A 117.
DRAFT COMPREHENSIVE TRANSPORTATION PLAN — JULY 2021 | Appendices
-
• Arterial Management — includes signal Eligible Project Types
timing, transit signal preemption, and bus
stop relocation.
• Infrastructure Improvements for Trip
Reduction — physical improvements iden-
tifed in approved plan, resulting in motor
vehicle emission reductions (includes pedes-
trian improvements).
• Engine Replacement (Repower) and Retroft
— replace an old engine with a new, emis-
sion certifed engine or retroft it with an
emission control device.
Last Funding Cycle
FY22 programmed $523,754 for electric bus
purchases, transit marketing, Emergency Ride
Home program and bike paths.
Transportation Development Act — Article 3 (TDA3)
This program, funded by a quarter of a cent
statewide sales tax, makes funds available to
pedestrian and bicycle projects. SCTA programs
TDA3 funding annually, with approximately
$500,000 in new funding available each year.
Distribution Criteria
Every jurisdiction in Sonoma County is allocated
funds annually based on a population formula. If
they cannot spend it on an eligible project they
may carry it over to the next year. They may
also borrow ahead multiple years to advance a
project.
• Construction and/or engineering of a bicycle
or pedestrian capital project or quick build
project
• Maintenance of multipurpose pathways that
are closed to motorized traffc
• Restriping Class II bicycle lanes (no more
than 20% of county total)
• Bicycle safety education program (no more
than 5% of county total)
• Development of a comprehensive bicycle or
pedestrian facilities plans (allocations to a
claimant for this purpose may not be made
more than once every fve years)
• Funds may not be used for Class III projects
on arterials or streets with posted speed
limits above 25 MPH
Last Funding Cycle
In the approved FY22 list of projects Windsor
received $110,000 for their Crosswalk
Enhancement on Starr Road and Stellar Lane,
and Healdsburg request and received $30,000
for the Front Street Sidewalk Gap Closure
Project. There is an estimated $1,133,050
remaining in the program, which will be rolled
over into the FY23 call for projects.
Rohnert Park Mitigation Fee
The City of Rohnert Park entered into an agree-
ment with developers of a large residential
development to pay a fee per unit into a fund to
mitigate traffc impacts outside of the City limits.
SCTA administers those funds, estimated to
reach $7 million when development is completed,

A 118
Appendices | DRAFT COMPREHENSIVE TRANSPORTATION PLAN — JULY 2021
-
and directs them to eligible transportation
projects.
Distribution Criteria
A list of transportation projects was approved
by SCTA that met the requirements of the fund
source, primarily to mitigate traffc impacts
caused by development of the University District.
Projects will be selected from that list on a frst
come frst served basis until the fund is depleted.
Last Funding Cycle
SMART pathway improvements received
$1,000,000 and Penngrove Main Street/Adobe
Road improvements received $750,000 in 2019.
SCTA Sales Tax Measures
Measure M (2005–2025)
In 2004, the voters in Sonoma County approved
Measure M, the Sonoma Countywide Road
Maintenance Act. Measure M is a quarter of a
cent sales tax, which is forecast to generate over
$27 million in FY22.
Distribution Criteria
These funds are explicitly limited to the Measure
M expenditure plan.
Project Types
Only Local Street Projects (20%) and Bike &
Pedestrian Projects (4%) specifcally listed in the
2004 voter approved expenditure plan.
Go Sonoma (2025-2045)
In 2020, the voters in Sonoma County approved
the Go Sonoma Act, another quarter of a cent
sales tax to begin after Measure M ends. The
Go Sonoma Act revenue in FY26 and FY27 will
generate an estimated $14 million to move traffc
and improve safety and an additional $6 million
to build bikeways and pathways.
Distribution Criteria
These funds are limited to the Go Sonoma expen-
diture plan. Go Sonoma is different from Measure
M in that specifc projects are not listed. The
move traffc and improve safety program and
the build bikeways and pathways program are
competitive and eligible for any project in the
county that meets the program requirements.
Project Types
All types of projects that get people moving and
improve safety.
FUND SOURCES TO BE LEVERAGED
In addition to the listed programs above there are
also direct subventions to the local jurisdictions,
competitive programs outside of SCTA Board
action and possible future fund sources.
COMPETITIVE PROGRAMS OUTSIDE OF SCTA BOARD ACTION:
Senate Bill 1 (SB1) — The Road Repair and Accountability Act of 2017
SB1 invests $54 billion over the next decade to fx
roads, freeways and bridges, transit and bicycle/
pedestrian projects and programs. The Local
Streets and Road program generates roughly $15
billion over a 10-year period, which is split equally
between the County and Cities. SB1 doubled
the amount of revenue that cities and counties

A 119.
DRAFT COMPREHENSIVE TRANSPORTATION PLAN — JULY 2021 | Appendices
-
receive from the State for local street mainte-
nance and rehabilitation.
In addition to formula funding, jurisdictions
are eligible to compete for additional funding
for active transportation and complete streets
projects, congested corridor projects, goods
movement improvements, and additional state
matching funds for self-help counties that pass
sales taxes or impose comprehensive develop-
ment fees to fund transportation. A chart of SB1
programs is attached.
Active Transportation Plan, State and Regional programs (ATP).
The Active Transportation Program was created
by Senate Bill 99 to encourage increased use of
active modes of transportation, such as walking
and biking.
The Active Transportation Program consolidated
various transportation programs into a single
program and was originally funded at about
$123 million a year from a combination of State
and federal funds. The goals of the ATP include,
but are not limited to, increasing the proportion
of trips accomplished by walking and biking,
increasing the safety and mobility of non-motor-
ized users, advancing efforts of regional agencies
to achieve greenhouse gas reduction goals,
enhancing public health, and providing a broad
spectrum of projects to beneft many types of
users including disadvantaged communities.
SB 1 directs $100 million annually from the
Road Maintenance and Rehabilitation Account
to the ATP, signifcantly augmenting the avail-
able funding for this popular program. State
Legislators are currently considering further
augmentation to the ATP program as part of the
FY21/22 State Budget.
Solutions for Congested Corridors Program (SCCP)
This statewide, competitive program makes
$250 million available annually for projects that
implement specifc transportation performance
improvements and are part of a comprehensive
corridor plan by providing more transportation
choices while preserving the character of local
communities and creating opportunities for
neighborhood enhancement.
The purpose of program is to provide funding to
achieve a balanced set of transportation, environ-
mental, and community access improvements to
reduce congestion throughout the state. Summer
2022 call for project.
The Local Partnership Program (competitive) (LPPc)
LPPc provides local and regional transportation
agencies that have passed sales tax measures,
developer fees, or other imposed transportation
fees with a continuous appropriation of $200
million annually to fund road maintenance and
rehabilitation, sound walls, and other transpor-
tation improvement projects. SCTA issues a call
for projects but other eligible agencies can apply
independently as well.
The Highway Safety Improvement Program (HSIP)
HSIP codifed as Section 148 of Title 23, United
States Code (23 U.S.C §148), is a core federal-aid
program to States for the purpose of achieving
a signifcant reduction in fatalities and serious
injuries on all public roads. The timing and size of
the call is determined by the program apportion-
ments, HSIP FTIP capacity, and the delivery of
the existing HSIP projects.

A 120
Appendices | DRAFT COMPREHENSIVE TRANSPORTATION PLAN — JULY 2021
-
State Highway Operations and Protection Program (SHOPP)
The 2020 State Highway Operation and
Protection Program (SHOPP) is the State
Highway System’s “fx-it-frst” program that
funds the repair and preservation, emergency
repairs, safety improvements, and some highway
operational improvements on the State Highway
System (SHS). Fund estimate in early 2021 and
Programming Fall 2021.
Regional Measure 3
To help solve the Bay Area’s growing congestion
problems, MTC worked with the State Legislature
to authorize a ballot measure that would fnance
a comprehensive suite of highway and transit
improvements through an increase tolls on the
region’s seven state-owned toll bridges. Senate
Bill 595 (authored by Sen. Jim Beall of San Jose)
was passed by the Legislature and signed into
law by Gov. Brown in fall 2017.
Listed Projects include North Bay Transit Access,
Bay Trail, SMART to Healdsburg and State Route
37.
Infrastructure for Rebuilding America (INFRA)
INFRA is a federal discretionary grant program
to fund transportation projects of national and
regional signifcance that are in line with the
Biden Administration’s principles for national
infrastructure projects that result in good-paying
jobs, improve safety, apply transformative tech-
nology, and explicitly address climate change
and racial equity. The funding available for 2021
grants totals approximately $889 million
Rebuilding American Infrastructure with Sustainability and Equity (RAISE)
RAISE Discretionary Grant program, provides
a unique opportunity for the DOT to invest in
road, rail, transit and port projects that promise
to achieve national objectives. Previously known
as the Better Utilizing Investments to Leverage
Development (BUILD) and Transportation
Investment Generating Economic Recovery
(TIGER) Discretionary Grants, Congress has
dedicated nearly $8.9 billion for twelve rounds
of National Infrastructure Investments to fund
projects that have a signifcant local or regional
impact.
POSSIBLE FUTURE FUND SOURCES
Additional COVID Relief similar to CRRSAA or a
Stimulus from the State and/or Federal govern-
ment may be made available. Proposals in the
State budget are under consideration that would
add one-time funding to various competitive
programs.
A 121.
DRAFT COMPREHENSIVE TRANSPORTATION PLAN — JULY 2021 | Appendices
-
USEFUL LINKS
One Bay Area Grants (OBAG) https://mtc.ca.gov/our-work/fund-invest/invest-ment-strategies-commitments/focused-growth/ one-bay-area-grants
California Transportation Commission Programs https://catc.ca.gov/programs
State and Federal Programs https://dot.ca.gov/programs/local-assistance/ fed-and-state-programs
Regional Measure 3 https://mtc.ca.gov/our-work/fund-invest/ toll-funded-investments/regional-measure-3
Measure M 2019 Strategic Plan https://scta.ca.gov/wp-content/uploads/2018/11/2019-Strate-gicPlan-fnal-ADA.pdf
Go Sonoma https://scta.ca.gov/gosonoma/
State Highway Operations and Protection Program (SHOPP) https://dot.ca.gov/programs/fnancial-programming/ state-highway-operation-protection-program-shopp-mi-nor-program-shopp
Infrastructure for Rebuilding America (INFRA) https://www.transportation.gov/buildamerica/fnancing/ infra-grants/infrastructure-rebuilding-america
Rebuilding American Infrastructure with Sustainability and Equity (RAISE) https://www.transportation.gov/RAISEgrants
To be eligible for most fund sources the project must be in the TIP https://mtc.ca.gov/sites/default/fles/TIP_Guide.pdf
2020 California Transportation Funding Booklet https://dot.ca.gov/-/media/dot-media/programs/transpor-tation-planning/documents/transportation-economics/ transportation-funding-booklet/2020-fnal-transporta-tion-funding-a11y.pdf
https://www.transportation.gov/buildamerica/financing/infra-grants/infrastructure-rebuilding-america