1115 wyatt wheres the science in hi for christchurch nz oct 2015
Upload
jumpingjaqCategory
view
53download
1
Christchurch (NZ) Transport Model Update – A Moving Feast
Julie Ballantyne

Christchurch
Largest city in South Island Third largest city in NZ Population, 425k Transport:
International Airport Large Port (inland ports) Flat terrain – cycle-friendly Bus system (central focus) Car travel dominates (>80%)

4 Stage Model (land use ---> travel) Uses:
Infrastructure/PT system assessments Demands for lower tiered models
Owned by regional/local Govt agencies Calibrated to 2006 4 Stage Models checked every 5 years Validation check planned after 2011 (Census)
Christchurch Transportation Model (CTM)

But then…..
Earthquakes, 2010-2011 Half roads suffered some damage CBD
Closed, businesses forced to relocate Over 1000 buildings (1/3) demolished
Residential Significant damage in east
Census delayed to 2013 Rebuild still ongoing

The Project
Check the CTM predictions for 2013 against observedHow is the model performing?Model inputs:
Land use from 2013 Census Transport network – roads & intersections Transport network – bus system
Normally straight-forward but……

The Challenge
Massive shift in land use distribution
Roadworks still prevalent in 2013
2015 hub-and-spoke buses on 2013 network
Had to work with data available
Lots of traffic counts –> lots of processing
Software update => results change

Change to the Landscape - Residential
Waimakariri
Selwyn

Change to the Landscape - Residential
River corridor
Hill suburbs

Change to the Landscape - Business

Change to the Landscape - Business
CBD

Road Network
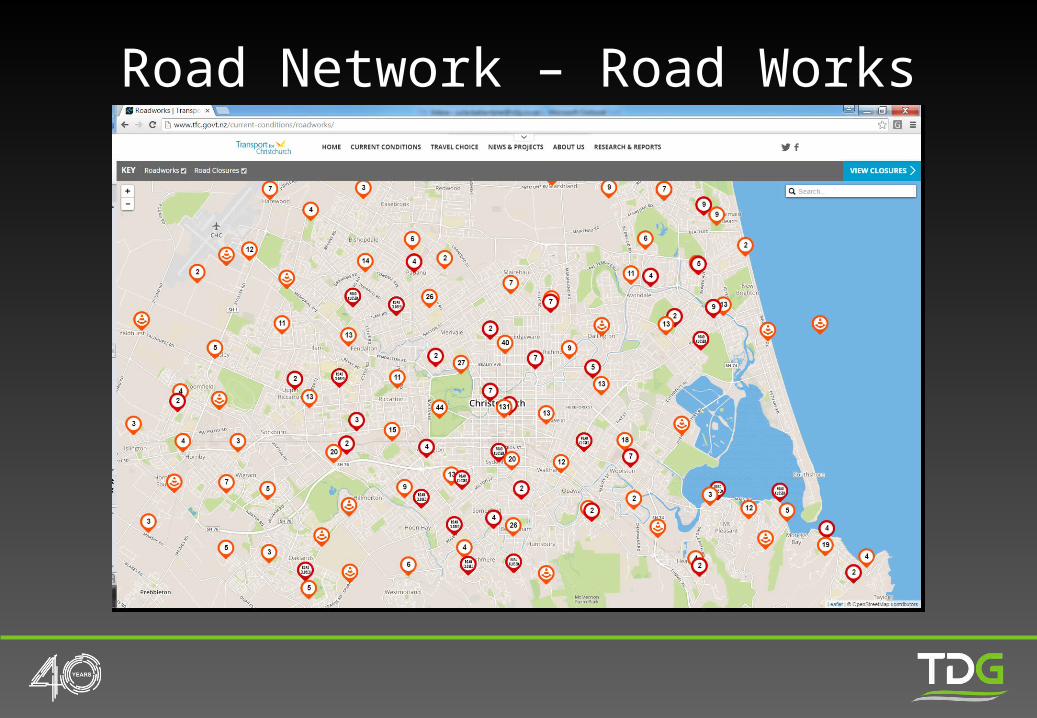
Road Network – Road Works
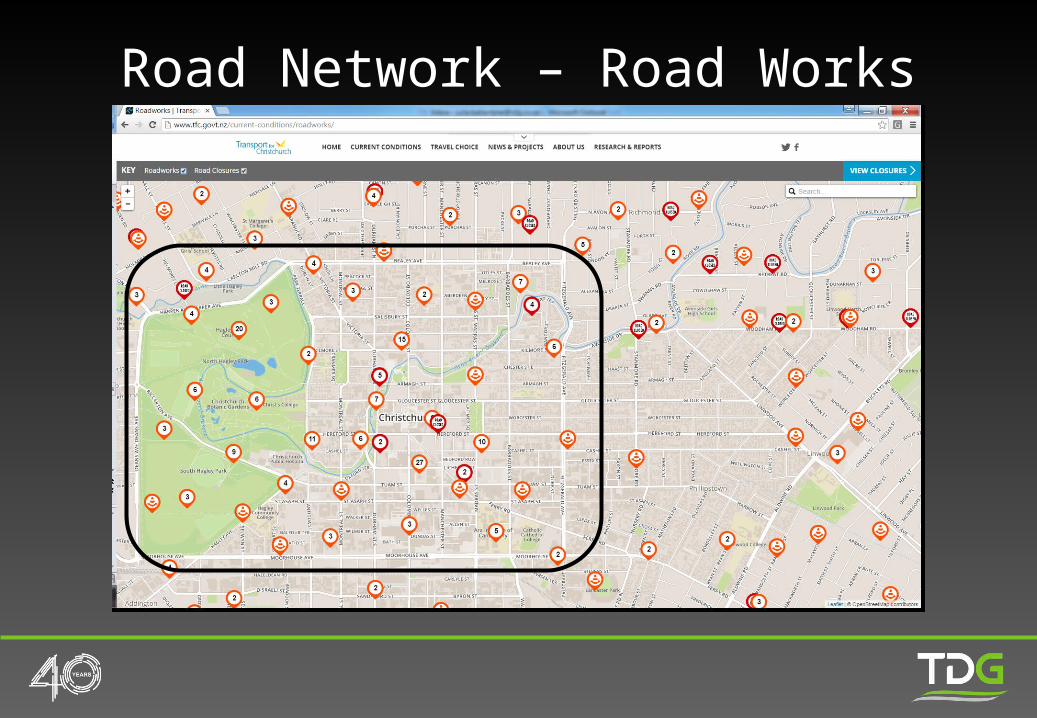
Road Network – Road Works

Road Network - Closures

Bus Network Bus exchange
Temporary 2013 New 2015
Bus routes: Through routes 2013 Hub-and-spoke 2015
Change in road directions

Network - 2006

Network - 2013

Network - 2015

Traffic Counts
Link counts required on screenlines Significant amount of data available But ….
Not processed (raw files, not geo-referenced) Processing/mapping significant (and tedious) task Inconsistent formats – more manual intervention Directional discrepancies

Traffic Counts – Lessons
Never underestimate data processing required
Model useful tool to check counts
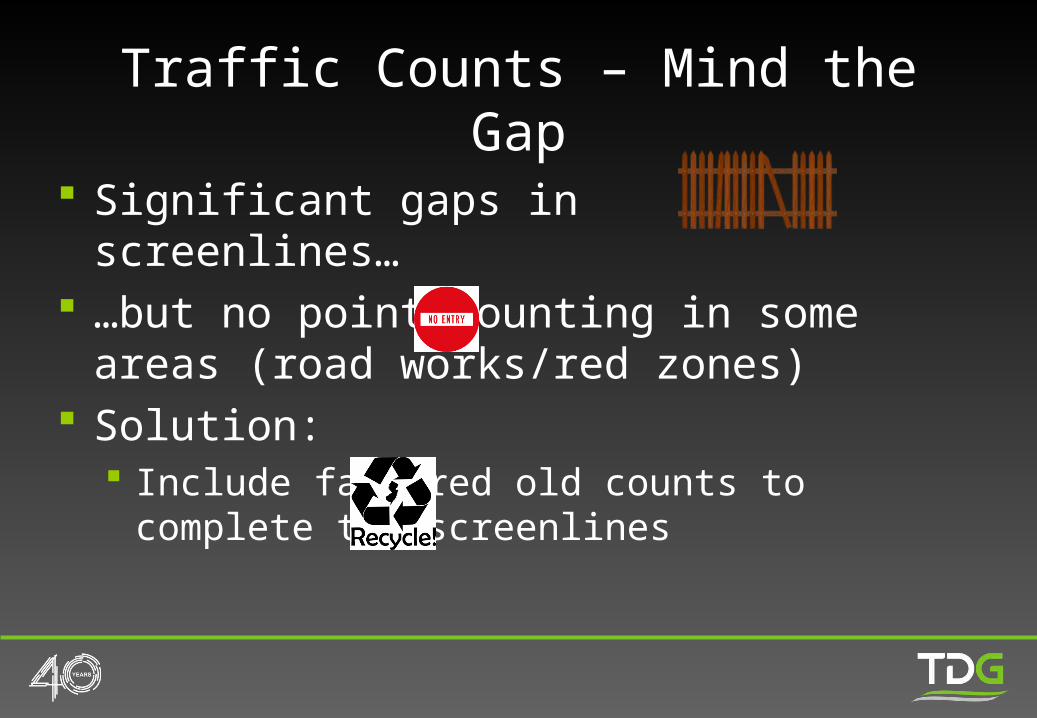
Significant gaps in screenlines… …but no point counting in some areas (road
works/red zones) Solution:
Include factored old counts to complete the screenlines
Traffic Counts – Mind the Gap

Traffic Counts

Validation - Targets

Validation Data
Vehicle travel times
PT Boardings (2015)
Census Journey-to-Work
Traffic counts

Model Performance – Travel Times

Model Performance – Travel Times
AM IP PM

Model Performance – PT BoardingsAM – Corridor by Destination

Model Performance – Counts
Total Vehicles GEH Criteria AM IP PM ON Daily
% Screenlines with GEH<5 > 60% 59% 55% 64% 82% 86%<7.5 > 75% 73% 82% 77% 91% 91%<10 > 90% 73% 91% 77% 100% 95%
% Links with GEH
<5 >= 65% 52% 66% 49% 82% 68%<7.5 >= 75% 72% 80% 66% 96% 87%<10 >= 85% 83% 92% 79% 97% 94%<12 >= 95% 92% 97% 88% 100% 97%
RMSE 30% 32% 30% 40% 47% 29%
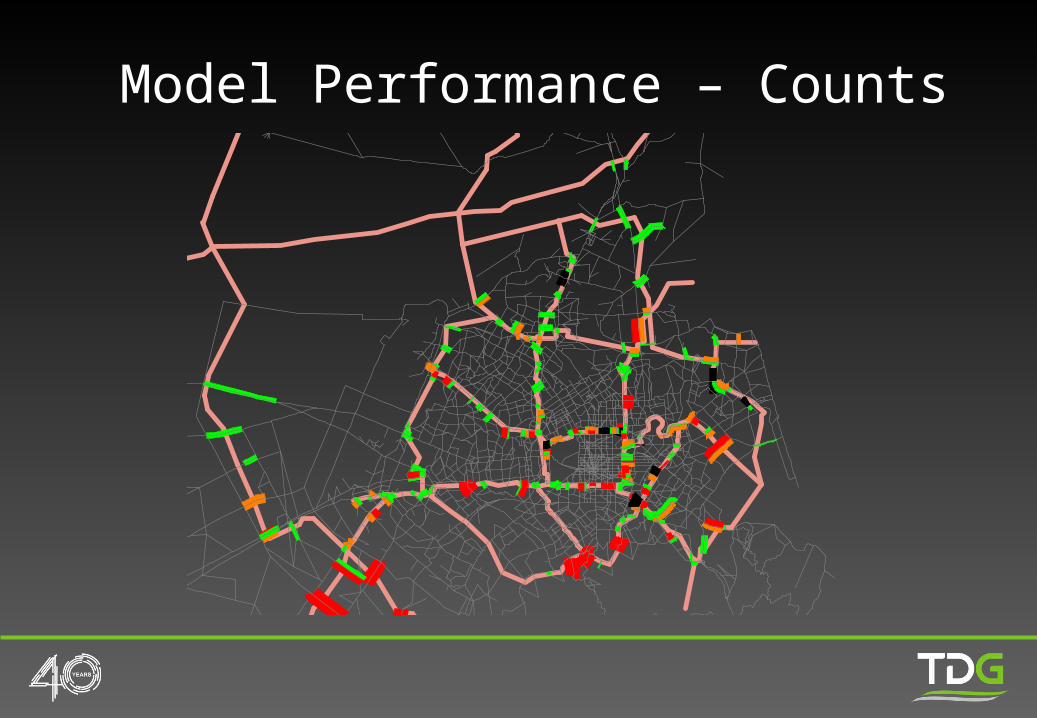
Model Performance – Counts
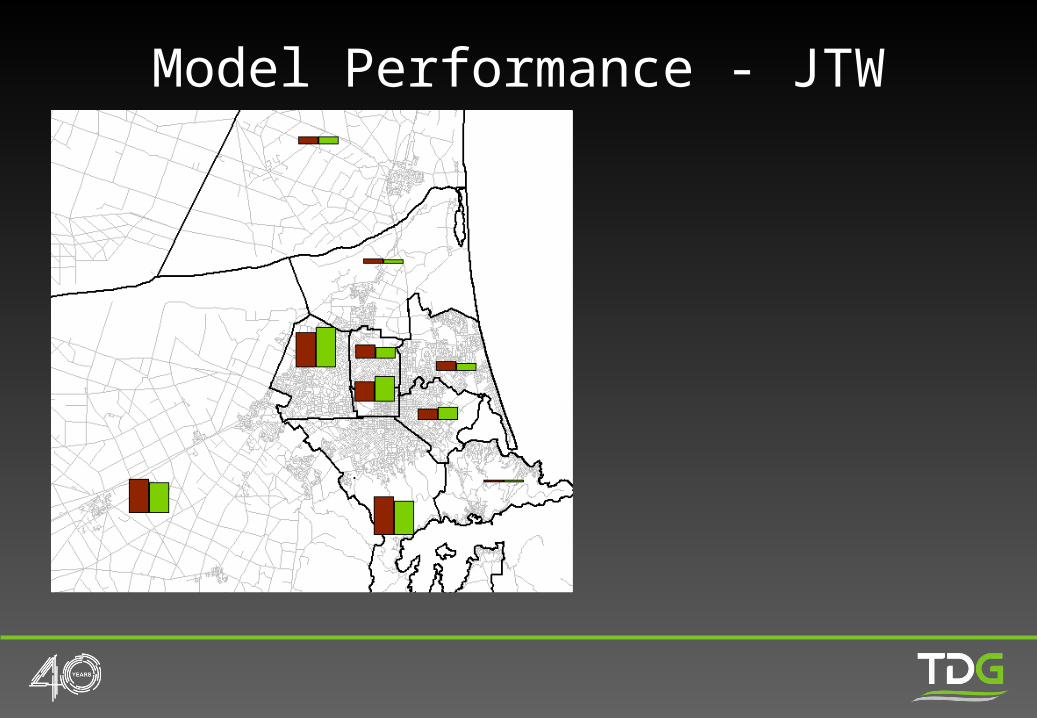
Model Performance - JTW

Model Performance - JTW
Census JTW Model HBW
Summary
Significant changes in Christchurch Variation in counts – model used to identify
outliers The model:
CTM outputs checked using 2013/15 observed CTM performing well
Next challenge: Ongoing monitoring of changing land use patterns


![IN THE EMPLOYMENT COURT CHRISTCHURCH CRC 48/10 · HOOPER V COCA-COLA AMATIL (NZ) LTD NZEmpC CHCH [2012] NZEmpC 11 [2 February 2012] IN THE EMPLOYMENT COURT CHRISTCHURCH [2012] NZEmpC](https://static.fdocuments.net/doc/165x107/5e62a58357459c38fe553655/in-the-employment-court-christchurch-crc-4810-hooper-v-coca-cola-amatil-nz-ltd.jpg)