Trade, skill-biased technical change and wages in … · Trade, skill-biased technical change and...
27
Trade, skill-biased technical change and wages in Mexican manufacturing * Mauro Caselli School of Economics, University of New South Wales, Australia [email protected] August 17, 2012 Abstract This paper analyses the effects of trade liberalisation and skill-biased technical change on the skill premium and the real wages of unskilled and skilled workers in Mexican manufacturing using firm- and industry-level data for 1984-1990. The channel through which technical change occurs is changes in the domestic price of machinery and equipment. The novelty of the paper lies in its strategy for iden- tifying causality, which uses differences across industries over time in the price of machinery and equipment in the US as an instrument for skill-biased technical change. Moreover, by looking at the effects of tariff rates specific to machinery and equipment on the domestic price of machinery and equipment, the paper also finds a causal connection between trade-induced skill-biased technical change and the skill premium. Thus, the paper provides evidence for some recent findings in the literature that link trade liberalisation, skill-biased technical change occurring through technology embodied in machines and increases in the skill premium. Keywords: trade liberalisation, skill-biased technical change, wage inequality, real wages, Mexico, manufacturing. * I thank Adrian Wood for many helpful comments and discussions. I am also grateful to Francis Teal, Beata Javorcik, Tony Venables, Alasdair Smith, Alan Woodland, seminar participants at the Asia- Pacific Trade Seminar and at the University of Melbourne and two anonymous referees. Special thanks go to Abigail Dur´ an and Gerardo Leyva for granting me access to INEGI data at the offices of INEGI in Aguascalientes and to all INEGI employees who provided assistance and answered my questions, in particular to Gabriel Romero, Otoniel Soto and Armando Arallanes. I gratefully acknowledge that part of this research was financially supported by an Australian Research Council grant to Professor Alan Woodland. All errors are mine. 1
Transcript of Trade, skill-biased technical change and wages in … · Trade, skill-biased technical change and...
Trade, skill-biased technical change and wages in
Mexican manufacturing∗
Mauro Caselli
School of Economics, University of New South Wales, Australia
August 17, 2012
Abstract
This paper analyses the effects of trade liberalisation and skill-biased technicalchange on the skill premium and the real wages of unskilled and skilled workersin Mexican manufacturing using firm- and industry-level data for 1984-1990. Thechannel through which technical change occurs is changes in the domestic price ofmachinery and equipment. The novelty of the paper lies in its strategy for iden-tifying causality, which uses differences across industries over time in the price ofmachinery and equipment in the US as an instrument for skill-biased technicalchange. Moreover, by looking at the effects of tariff rates specific to machineryand equipment on the domestic price of machinery and equipment, the paper alsofinds a causal connection between trade-induced skill-biased technical change andthe skill premium. Thus, the paper provides evidence for some recent findings inthe literature that link trade liberalisation, skill-biased technical change occurringthrough technology embodied in machines and increases in the skill premium.Keywords: trade liberalisation, skill-biased technical change, wage inequality, realwages, Mexico, manufacturing.
∗I thank Adrian Wood for many helpful comments and discussions. I am also grateful to FrancisTeal, Beata Javorcik, Tony Venables, Alasdair Smith, Alan Woodland, seminar participants at the Asia-Pacific Trade Seminar and at the University of Melbourne and two anonymous referees. Special thanksgo to Abigail Duran and Gerardo Leyva for granting me access to INEGI data at the offices of INEGIin Aguascalientes and to all INEGI employees who provided assistance and answered my questions, inparticular to Gabriel Romero, Otoniel Soto and Armando Arallanes. I gratefully acknowledge that partof this research was financially supported by an Australian Research Council grant to Professor AlanWoodland. All errors are mine.
1

1 Introduction
The last 30 years have witnessed an increase in wage inequality not only in developedcountries (Katz and Murphy, 1992; Machin and Van Reenen, 1998), but also in somelow-income and many middle-income developing countries (Anderson, 2005; Goldbergand Pavcnik, 2007). This increase in wage inequality – more specifically a rise in themean wage of skilled workers relative to the mean wage of unskilled workers – mainlyreflects a rise in real skilled wages, although in some countries it has been amplified by astagnation or a fall in the real wages of unskilled workers.
There has been much attention around this rise in inequality. While this attentionmay be driven by a general aversion to inequality per se based on ethical grounds, theinterest in inequality is also linked to the possibility that inequality might affect the wayan economy works. The recent debate on whether rising inequality in the US has led tothe 2007–2008 financial crisis clearly falls in this second category (Atkinson and Morelli,2011).
Besides the economic consequences of this increase in inequality, the attention hasalso fallen on the reasons behind such increase. Several theories have been put forward,mainly based on the observation of two recent phenomena. First, developing countrieshave become more integrated with the rest of the world, particularly through reductionsin tariff rates, quotas and other non-tariff barriers. Traditional trade theory, in particularthe Stolper-Samuelson theorem, predicts that the relative wages of skilled workers shoulddecrease in developing countries assuming that they are abundant in unskilled labour.While the widespread rise in the skill premium seems at odds with this traditional tradetheory, Wood (1997) points out that Latin American countries, in many of which therise in the skill premium was marked, were relatively skill abundant when they openedto trade in the 1980s.
Second, since most of the world’s technical progress originates in a few rich countries(Schmidt, 2010), which are relatively skill abundant, machinery and equipment, hereafterM&E, tends to be complementary to skill (?). When new technologies, such as personalcomputers, are adopted by firms in developing countries, they are thus likely to increasethe relative demand for skilled workers, a process that has been referred to in the literatureas exogenous skill-biased technical change, hereafter SBTC (see Acemoglu, 2002a;b).
As the debate continues regarding the relative importance of trade liberalisation andSBTC as causes of the rise in the skill premium, a combined hypothesis has been sug-gested separately by Robbins (2003) and Acemoglu (2002a; 2003) and analysed furtherin several recent papers (Burstein and Vogel, 2009; Bustos, 2009; Riano, 2009; Schmidt,2010; Gallego, 2010). These authors have put forward different models in which, as acountry reduces its barriers to trade, firms are able to import new technology embodiedin M&E at a lower price, thus inducing the adoption of skill-biased technologies. Throughthis channel, trade liberalisation can raise the skill premium even in skill-scarce devel-oping countries, a process which can be referred to as trade-induced SBTC. Acemoglu(2002b) also suggests that SBTC can be induced by other forms of openness, such asforeign direct investment (FDI) inflows, and other characteristics of the economy, suchas labour market institutions.
While consensus is building up on the role played by trade-induced SBTC in theincrease in the skill premium (Van Reenen, 2011), the literature is still designing effec-
2
tive strategies to identify the separate effects of SBTC and trade liberalisation on theskill premium and real wages of unskilled and skilled workers within the same analysis,especially in the context of developing countries.
The purpose of this paper is, therefore, to conduct an econometric analysis of wages inthe Mexican manufacturing sector in a way that allows the influence of SBTC, measuredby the price of M&E relative to the producer price index, and trade liberalisation to beisolated and quantified. It uses firm- and industry-level data for the period 1984-1990from the Encuesta Industrial Anual, Annual Manufacturing Survey, conducted by theMexican national institute of statistics. The novelty of this work lies in the identificationstrategy adopted to ensure that the relationships found in the data are of a causal nature– a constant worry in empirical economics.
The identification strategy uses variation across industries over time in the price ofM&E relative to the producer price index in the United States (US) as an “external”instrument – not based on the lags of the endogenous variable – for SBTC. Starting withthe assumption that most M&E in a developing country, such as Mexico, is importedfrom more advanced developed countries, the price of M&E in Mexico is estimated tobe a function of tariffs specific to M&E and the price of M&E in the US to accountfor trade-induced SBTC and exogenous SBTC separately. This identification strategyrelies on factor immobility across industries, an assumption supported by the descriptiveevidence presented.
Decreases in the price of M&E lead to increases in its demand and, thus, its use,particularly by larger firms that invest more in M&E. Assuming equipment-skill com-plementarity, or at least that M&E is less substitutable with skilled workers than withunskilled workers, an increase in the demand for M&E would lead to an increase in therelative demand for skilled workers, particularly in larger plants and those invest morein M&E. Therefore, relative skilled wages – and real skilled and unskilled wages – areregressed on the price of M&E, interacted with plant size and investments in M&E toaccount for the heterogeneous effects of SBTC, input and output tariff rates as well asother regressors.
This identification strategy analyses only the effects of trade-induced SBTC that occurthrough changes in M&E tariffs. However, trade-induced technical change could alsohappen through output tariff changes. Trade liberalisation could lead to more competitionand, thus, innovation in an effort to stay in the market (Gorodnichenko et al., 2010;Bloom et al., 2011). This alternative mechanism will be accounted for in the econometricanalysis. Additional regressions will also include more standard plant-level measures ofSBTC, i.e., royalties paid on new technologies and M&E imports (see the literature reviewby Chennells and Van Reenen, 1999).
The paper shows that, after controlling for both plant- and industry-level variables,lower prices of M&E lead to an increase in the skill premium. Also, changes in the priceof M&E are affected by changes in the price of M&E in the US and lower tariffs onM&E, thus providing evidence for exogenous and trade-induced SBTC. The results alsoreveal that trade liberalisation in final goods has a positive and robust effect on unskilledwages. Other effects of trade liberalisation on wages are not robust through the differentspecifications.
In terms of the magnitude of the estimated effects, SBTC caused by changes in theprice of M&E can explain one tenth of the overall increase in the skill premium during the
3

period 1984-1990. This is to be considered a lower-bound estimate since this methodologycannot capture the effects of SBTC and trade liberalisation that are homogeneous acrosssectors over time.
Mexico has been frequently chosen as a country in which to study the effects of tradeliberalisation on wages. Not only did the country go through a substantial trade liberal-isation process, with production-weighted average tariffs declining from 28.5 percent in1985 to 12.5 percent in 1990 (Ten Kate, 1989; 1992) and trade as a fraction of GDP risingfrom 25 percent to 39 percent during the same period, but also the skill premium increasedby almost 30 percent between 1985 and 1994, remaining stable afterwards (Riano, 2009).
The popularity of the topic, however, does not imply that the literature has been ableto address all the issues. A limitation of most previous work on the liberalisation processin Mexico is its focus only on wage inequality, neglecting real wages. Examining realwages as well as relative wages will make possible to differentiate between the effects ofalternative measures of SBTC.
Another limitation is the literature’s reliance on the Stolper-Samuelson theorem (Han-son and Harrison, 1999; Feliciano, 2001; Esquivel and Rodrıguez-Lopez, 2003), which hasmet some criticism. Hanson and Harrison (1999) argue that the increase in the skillpremium can be explained using a HOS framework because the pattern of tariffs beforeliberalisation was such that unskilled-labour-intensive industries were more protected (Re-venga, 1997; Feliciano, 2001). Esquivel and Rodrıguez-Lopez (2003) instead use Leamer(1998)’s methodology, which also relies on perfect mobility of all factors across industries,and, in contrast to previous studies, find that trade has tended to reduce relative skilledwages, while SBTC has tended to raise them. However, none of these studies basedon the ‘mandated wage’ approach finds strong evidence for the channel through whichthe Stolper-Samuelson theorem works in theory, since the correlation between changes inoutput prices and relative wages at the industry level is extremely low (Riano, 2009).
Other studies have investigated alternative possible causal connections between greateropenness and the increase in wage inequality. Among them, Feenstra and Hanson (1997)argue that FDI towards maquiladoras, assembly plants for re-exports, has been the causeof the increase in relative skilled wages after the trade liberalisation of 1985-1987 andVerhoogen (2008) shows that new export opportunities following the 1994 Mexican pesodevaluation led to an increase in within-industry wage inequality due to quality upgradingby the most efficient plants.
More recent papers study the links between trade and technology adoption and are,therefore, closely related to this paper. Riano (2009) develops and estimates a structuralmodel of trade and technology adoption with heterogeneous firms. Firms produce usingskilled and unskilled labour and can choose between two technologies: a ‘traditional’technology characterised by high marginal costs but low fixed costs, and a ‘modern’technology that has low marginal costs but high fixed costs. By identifying plants thatpurchase imported M&E as using the modern technology, the author estimates the re-sponse of technology adoption and the skill premium to a unilateral trade liberalisation ofa similar magnitude to the one that took place in Mexico after 1985. Trade liberalisationleads to an increase in the relative demand for skills and an increase in the skill premiumof around 2.4 percent. Allowing for the reduced sunk cost of technology adoption dueto the falling import tariffs, the impact of trade liberalisation on the skill premium isstronger, raising it by 4.2 percent.
4

Riano’s model is similar to Bustos (2009), except that the latter model is static anddoes not allow for the possibility of cheaper technology due to falling import tariffs.Bustos (2009) estimates the main predictions of her model with firm-level data from Ar-gentina using the reduction in Brazil’s import tariff rates as a quasi-natural experiment.The empirical tests reveal that firms, especially large and more productive ones, in indus-tries facing higher reductions in Brazil’s tariffs increase their investment in technologyfaster, as predicted by the model.
The complementarity between imported machines embodying new technologies andskills plays an important role also in a matching model put forward by Csillag and Koren(2011) in which workers with high skills work on imported machines rather than domesticones because the former are of higher quality even though they are more expensive. Themodel is consistent the findings, based on Hungarian linked employer-employee data, thatworkers exposed to imported machines earn higher salaries and the return to schoolingis higher on imported machines.
The remainder of the paper is organised as follows. Sections 2 and 3 describe thedata used and provide some descriptive evidence of an increase in the relative demandfor skilled labour between 1984 and 1990. Section 4 outlines the identification strategyand the econometric specification. This section explains why the price of M&E in theUS interacted with the tariff rates on M&E can be used as an instrument for the priceof M&E in Mexico, a measure of SBTC. Section 5 presents the results of the regressionanalysis. Section 6 concludes.
2 Data
The data used in this paper come mainly from the Encuesta Industrial Anual (AnnualIndustrial Survey, EIA), provided by the Instituto Nacional de Estadistıca y Geografıa,INEGI, the national institute of statistics of Mexico. The database contains informationon 3218 manufacturing plants for the period 1984-1990 (for a total of 22526 plant-yearobservations) and it is by design a balanced panel that covers roughly 80 percent of allmanufacturing value added. The data distinguish 129 industries, classified according tothe CMAE75 (Clasificacion Mexicana de Actividades Economicas, 1975).
The unit of observation in the dataset used is a plant rather than a firm, whichmay pose problems of identification because firms may re-organise production among theplants they own. Also, it is arguable that the period available is too short to be able toobserve any significant relationship between trade, SBTC and wages, but ultimately thisis an empirical question.1
Omitted from the data are plants with missing information on employment and wagebill of production and non-production workers, some odd observations, entrants andexiters because by construction this is supposed to be a balanced panel and incompleteseries (for more information on the EIA and the cleaning procedure see Iacovone, 2008and Riano, 2009). Plants belonging to the oil production sector are also eliminatedbecause this sector is fully controlled by the government. The final sample contains12761 observations, that is, 1823 per year. Table 1 shows the descriptive statistics of
1For instance, Bustos (2009) finds a significant relationship between trade-induced SBTC and wagesin Argentina using only data for 1992 and 1996.
5

Table 1: Descriptive statistics
1986 1990Mean S.D. Mean S.D.
Skill premium 2.06 0.78 2.72 1.55Real skilled wages (1994 pesos per day) 120.91 53.94 146.43 76.94Real unskilled wages (1994 pesos per day) 60.84 23.89 58.41 27.98Price of M&E (Mexico) 1.57 0.45 1.49 0.45Price of M&E (US) 0.80 0.03 0.78 0.02Tariff rate on final goods 0.41 0.25 0.15 0.04Tariff rate on inputs 0.23 0.08 0.11 0.02Tariff rate on M&E 0.10 – 0.10 –
some of the variables included in the analysis for 1986 and 1990.The database provides a wide array of information on each individual plant, including
information on the total number of blue-collar (or production) workers, whose mainactivities include machine operation, production supervision, repair, maintenance andcleaning, and white-collar (or non-production) workers, such as managers, administrators,professionals and salesmen, total number of hours worked for each type of worker, totalremuneration, production, input use, stock of and investment in different capital goods,expenditures on royalties for the use of new technologies, imports of M&E and materials,value of exports and the state where the plant is located. Variables related to imports andexports are only available from 1986 onwards, therefore the regression analysis focuseson the period 1986–1990.
While the EIA includes information on the percentage of firms’ social capital held byforeigners, this variable does not change over time for any of the firms included in thesample. Thus, the direct effects of FDI on the skill premium are identified only throughvariations across plants. However, the survey does not include maquiladora plants, whichexcludes the possibility of a Feenstra and Hanson (1997) type mechanism. During thisperiod, the Mexican economy also went through a process of privatisation, but the EIAdoes not include any information on public or private ownership of the plants surveyed(see La Porta and Lopez-De-Silanes, 1999 for the effects of privatisation on productivityin Mexico).
Throughout the paper, skilled wages are measured as the average daily wages for non-production workers, unskilled wages as the average daily wages for production workersand the skill premium, the measure of wage inequality, as the ratio of skilled to unskilledwages. Therefore, the paper distinguishes between skilled and unskilled workers on thebasis of occupation rather than education, which is not available in the EIA. The classi-fication of workers into production and non-production groups in order to approximateskilled and unskilled labour respectively is not ideal because skills are better describedby classifications based on educational characteristics, as pointed out by Gonzaga et al.(2006) and Bustos (2009), and because changes in the skill premium based on occupationmay be driven by compositional shifts in the education of workers within the occupationcategories. However, this categorisation is very common in the literature because it isoften the only one available in firm-level data (Berman et al., 1994; Feenstra and Hanson,1996; Leamer, 1998; Meschi et al., 2009). Berman et al. (1994) also argue that it yieldsresults similar to those obtained using education categories.
6

The price of M&E in Mexico, alongside the prices of other types of capital, is providedby the INEGI. The following analysis uses the price of M&E relative to the producer priceindex. The price of M&E in the US, which is also divided by the producer price index, istaken directly from the Bureau of Economic Analysis (BEA). While the price of M&E inMexico is available for 46 industries according to the CMAE75, the price of M&E in theUS is available for 19 industries according to the Standard Industrial Classification. Atable of correspondence provided by INEGI is therefore used to match the two industryclassifications.
Tariff rates are taken from Ten Kate (1989; 1992). The data available include theMexican tariff rate specific for M&E, which only varies over time, production-weightedaverage tariff rates on final goods and tariff rates on inputs, calculated by combiningoutput tariff rates with the input-output tables provided by the INEGI. It should benoted that while tariffs decreased on average throughout this period, they increasedslightly after 1988. This is particularly evident for the tariff rate on M&E that decreaseddown to 3% in 1989, but then increased back to 10% in 1990, the same level as in 1986.
The Herfindahl-Hirschman Index, a measure of concentration at the industry level,is calculated using output value data from the EIA.2 The degree of unionisation in anindustry is calculated as the percentage of workers that belong to a recognised tradeunion, taken from the National Survey on Household Income and Spending (ENIGH)provided by the INEGI.
3 Descriptive evidence
3.1 Trends in the labour market
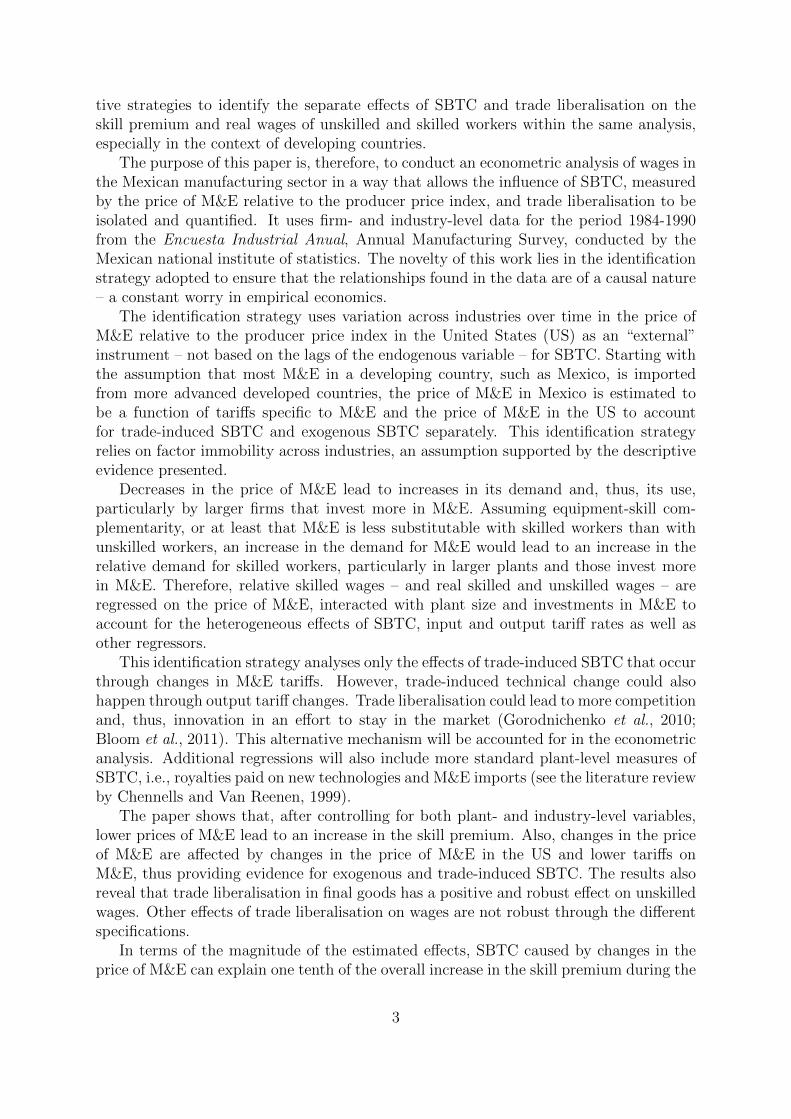
Figure 1 plots the movement of relative skilled wages (left axis) and relative skilledemployment (right axis) between 1984 and 1990. The figure shows that both relativewages and relative employment tended to rise until 1988 – that is, during the rapidtrade liberalisation process. Although the increase in relative employment is much moremodest, this simultaneous increase in relative wages and relative employment necessarilyimplies an increase in the relative demand for skilled labour (Meschi et al., 2009). Inthe period 1988-1990, when tariff rates increased slightly in all sectors, there seems to bean inverse relationship between relative skilled wages and employment. This pattern ofrelative wages and employment is also consistent with an increase in the relative demandfor skilled labour, while it is unlikely that the increase in the relative supply of unskilledlabour (see Atkin, 2010) played an important role since the change in relative skilledemployment is again small.
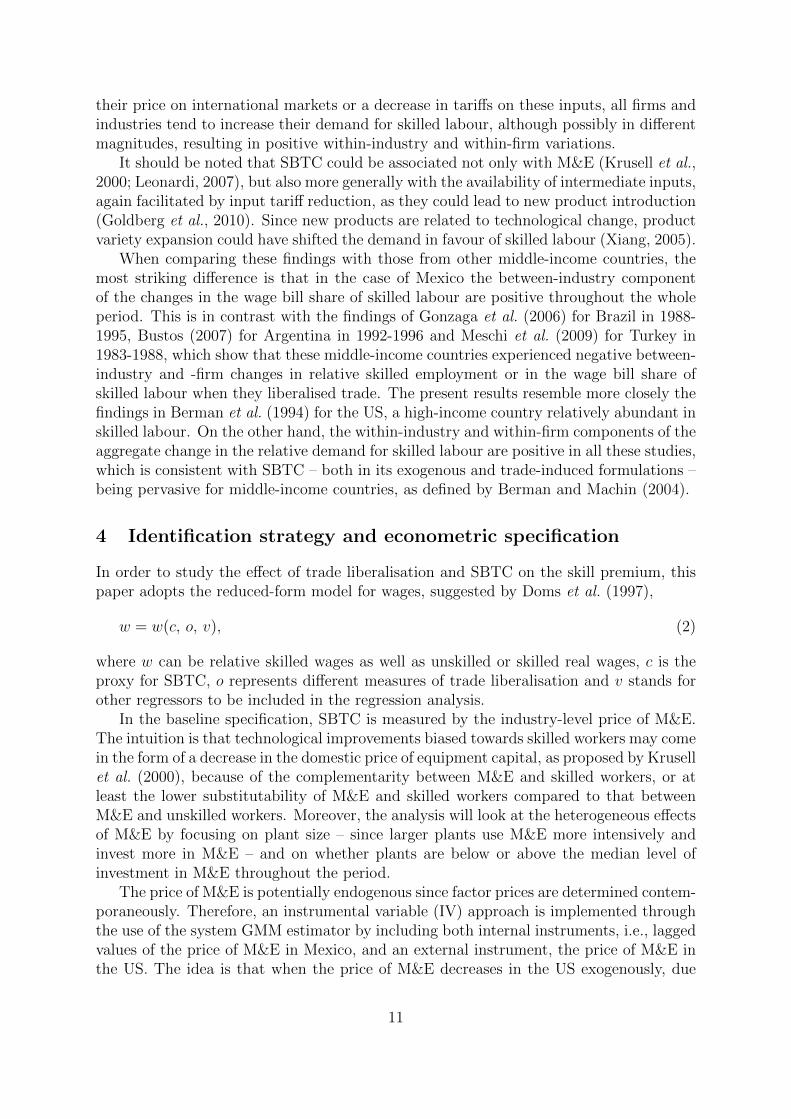
While figure 1 plots average relative skilled wages, figure 2 plots changes in relativeskilled wages at the industry level between 1986 and 1990 against industry-level changesin the price of M&E in the US. The scatter includes 19 industries for which the priceof M&E in the US is available. The figure shows that there was a general tendency forrelative skilled wages to increase and a general tendency for the price of M&E in the US todecrease. The best fit line suggests that the two variables are negatively correlated. The
2The following formula is used to calculated the Herfindahl-Hirschman Index: hhii =∑n
k s2k,i, where
sk,i is the share of firm k in industry i and n is the number of firms in industry i.
7

Figure 1: Relative skilled wages and employment in Mexican manufacturing
.425
.45
.475
.5.5
25R
elat
ive
skill
ed e
mpl
oym
ent
22.
22.
42.
62.
8R
elat
ive
skill
ed w
ages
1984 1986 1988 1990
Relative skilled wages Relative skilled employment
Source: Own calculations based on Encuesta Industrial Anual, 1984-1990, INEGI.
econometric analysis below will relate these variables in a more systematic way throughchanges in the price of M&E in Mexico.
3.2 Decomposition analysis
In order to make a first attempt at understanding the main forces behind the increase inthe skill premium documented in the figures above, the aggregate changes in the wage billshare of skilled workers will be split into their between- and within-industry componentsand, in turn, the within-industry changes can be decomposed into their between- andwithin-firm components.3 The wage bill share of skilled workers can be used to distinguishthe effects of labour demand from those of labour supply under the assumption that theelasticity of substitution between skilled and unskilled labour is equal to one (Bermanand Machin, 2000).
Following Bustos (2007) and Meschi et al. (2009), the aggregate increase in the demandfor skills may be driven by (a) employment reallocation across industries caused by atrade shift, structural change, changing tastes, or changes in economic policy, or by (b)skill upgrading within industries mainly due to changes in technology, but often alsoassociated with changes in trade policy. The following formula is used to decompose the
3The decomposition was also conducted using relative skilled employment, however this provides lessclear results because changes in relative skilled employment over this period are negligible.
8

Figure 2: Changes in relative skilled wages vs. changes in price of M&E in the US
0.5
11.
5C
hang
es in
the
skill
pre
miu
m, 1
986−
1990
−.015 −.01 −.005 0Changes in the price of M&E in the US, 1986−1990
Source: Own calculations based on Encuesta Industrial Anual, 1984-1990, INEGI.
total changes in the wage bill share of skilled workers (WS/W ):
∆
(WS
W
)=∑j
(WS
W
)j
∆
(Wj
W
)+∑j
∆
(WS
W
)j
(Wj
W
)j
, (1)
where the subscript j denotes industries or firms, a ∆ before a term denotes change overtime and a bar over a term denotes average over time.4 In equation (1), the first term isthe between component of skill upgrading, i.e. how much bigger or smaller an industryor firm becomes over time, weighted by time-averaged skill demand. The second termmeasures the contribution of within variations, weighted by the relative size of industryor firm j. The decompositions are done for the whole 1984-1990 period and for the 1984-1988 and 1988-1990 sub-periods in order to relate the increase in the relative demand forskilled labour more closely to the trade liberalisation process.
Table 2 reports the between and within decompositions of the aggregate change inthe wage bill share of skilled labour. The wage bill share of skilled labour increasedby 6 percentage points between 1984 and 1990. This increase happened during bothsub-periods considered, i.e. 1984-1988 and 1988-1990, and with similar magnitudes.
During all the periods, both between- and within-industry changes are positive andthe within-industry changes explain most of the overall change by accounting for about90 percent of the variation. While the positive between-industry variation implies that
4The decomposition analysis is also available at different levels of industrial aggregation, but theadditional tables are not included and discussed because the results are similar in magnitude.
9

Table 2: Decomposition of changes in the wage bill share of skilled labour
Between Within Total1984-1990
Industries (19) 0.0054 0.0544 0.0598Firms (1823) 0.0109 0.0435 0.05441984-1988
Industries (19) 0.0044 0.0282 0.0327Firms (1823) 0.0072 0.0210 0.02821988-1990
Industries (19) 0.0003 0.0269 0.0272Firms (1823) 0.0041 0.0228 0.0269
Source: Own calculations based on Encuesta Industrial Anual, 1984-1990, INEGI.
there was a reallocation of resources towards more skill-intensive industries, holding skillintensity within industries constant, the positive within-industry variation implies thatskill intensity increased within industries, holding industry size constant. When within-industry changes are disaggregated at the firm level, most of the changes are explainedby skill upgrading within firms.
The lack of information on entry and exit implies that the reallocations across indus-tries and firms that have occurred through these channels are missed in these calculations.However, since the panel represents 80 percent of manufacturing output, skill upgradingwithin industries and firms was clearly an important source of the overall increase in therelative demand for skilled labour and the skill premium.
The decomposition analysis shows that not only did skill-intensive industries and firmsexpand relative to less skill-intensive industries and firms, but also that all industries andfirms raised their skill intensity. Traditional trade theory with perfect mobility of workersacross industries applied to a developing country abundant in unskilled labour seems tobe at odds with this finding. Imperfect mobility of workers seems to fit the results bettergiven the small between-industry changes.
Alternatively, positive within-industry resource reallocations could be explained bytrade liberalisation under new trade theory with firm heterogeneity (Melitz, 2003). Inmodels with heterogeneous firms, more productive firms that use skilled workers moreintensively find it profitable to scale up their production aimed at the export market at theexpense of less productive firms, which may drop out of the market (Vannoorenberghe,2011; Harrigan and Reshef, 2011). This also implies an increase in the relative demand forskilled labour and positive within-industry changes, however, associated with between-firm changes because not all firms would increase their relative demand for skilled labour.5
Positive between-firm changes in the wage bill share of skilled workers could also beobserved following the availability of intermediate inputs, facilitated by input tariff reduc-tion, as they could stimulate higher-quality output, particularly in larger firms (Kuglerand Verhoogen, 2012). In turn, quality upgrading could increase the demand for skilledworkers and, thus, the skill premium (Verhoogen, 2008).
Another hypothesis to explain the large within-industry and within-firm changes isSBTC. As new skill-biased technologies (i.e., M&E) are introduced, due to a decrease in
5It should be noted that these models would also predict changes in the relative demand for skilledlabour due to firms’ exit, which cannot be captured with these data.
10
their price on international markets or a decrease in tariffs on these inputs, all firms andindustries tend to increase their demand for skilled labour, although possibly in differentmagnitudes, resulting in positive within-industry and within-firm variations.
It should be noted that SBTC could be associated not only with M&E (Krusell et al.,2000; Leonardi, 2007), but also more generally with the availability of intermediate inputs,again facilitated by input tariff reduction, as they could lead to new product introduction(Goldberg et al., 2010). Since new products are related to technological change, productvariety expansion could have shifted the demand in favour of skilled labour (Xiang, 2005).
When comparing these findings with those from other middle-income countries, themost striking difference is that in the case of Mexico the between-industry componentof the changes in the wage bill share of skilled labour are positive throughout the wholeperiod. This is in contrast with the findings of Gonzaga et al. (2006) for Brazil in 1988-1995, Bustos (2007) for Argentina in 1992-1996 and Meschi et al. (2009) for Turkey in1983-1988, which show that these middle-income countries experienced negative between-industry and -firm changes in relative skilled employment or in the wage bill share ofskilled labour when they liberalised trade. The present results resemble more closely thefindings in Berman et al. (1994) for the US, a high-income country relatively abundant inskilled labour. On the other hand, the within-industry and within-firm components of theaggregate change in the relative demand for skilled labour are positive in all these studies,which is consistent with SBTC – both in its exogenous and trade-induced formulations –being pervasive for middle-income countries, as defined by Berman and Machin (2004).
4 Identification strategy and econometric specification
In order to study the effect of trade liberalisation and SBTC on the skill premium, thispaper adopts the reduced-form model for wages, suggested by Doms et al. (1997),
w = w(c, o, v), (2)
where w can be relative skilled wages as well as unskilled or skilled real wages, c is theproxy for SBTC, o represents different measures of trade liberalisation and v stands forother regressors to be included in the regression analysis.
In the baseline specification, SBTC is measured by the industry-level price of M&E.The intuition is that technological improvements biased towards skilled workers may comein the form of a decrease in the domestic price of equipment capital, as proposed by Krusellet al. (2000), because of the complementarity between M&E and skilled workers, or atleast the lower substitutability of M&E and skilled workers compared to that betweenM&E and unskilled workers. Moreover, the analysis will look at the heterogeneous effectsof M&E by focusing on plant size – since larger plants use M&E more intensively andinvest more in M&E – and on whether plants are below or above the median level ofinvestment in M&E throughout the period.
The price of M&E is potentially endogenous since factor prices are determined contem-poraneously. Therefore, an instrumental variable (IV) approach is implemented throughthe use of the system GMM estimator by including both internal instruments, i.e., laggedvalues of the price of M&E in Mexico, and an external instrument, the price of M&E inthe US. The idea is that when the price of M&E decreases in the US exogenously, due
11

for example to the information technology ‘revolution’, the same is likely to happen tothe price of M&E in Mexico because it relies on imports of M&E from the US. In turn,the decrease in the price of M&E increases the demand for it and, assuming that M&Eis more complementary with skilled than unskilled workers, leads to SBTC, not only inthe US but in Mexico too. Moreover, this paper takes into account trade-induced SBTCby showing in a separate regression that the price of M&E in Mexico is also affected bytrade policy via the tariff rate on M&E. When the price of M&E in Mexico is interactedwith dummies for plant size, the price of M&E in the US is also interacted with thesedummies.
The requirement for any IV approach is that the instrument is both informative andvalid. Regarding the informativeness of the instrument, industry-level regressions willshow that there is a significant positive relationship between the price of M&E in the USand the price of M&E in Mexico after controlling for the tariff rate on M&E. Moreover,the internal instruments help in addressing any concerns of weak instrumentation. Forthe instrument to be valid, it must be uncorrelated with the residual in the main equationdetermining wages. Not only does Leonardi (2007) suggest the validity of the instrumentbut it also seems unlikely that changes in the price of M&E in the US have any impacton wages in Mexico other than through changes in the price of M&E.
An underlying assumption of this identification strategy to work is that workers cannotmove freely across sectors and, if they do so, the movements are random, while they canmove more freely across firms within the same sector. If workers were allowed to moveacross industries, then wages would equal across sectors at all time, which would make itimpossible to detect the effects of trade liberalisation and SBTC on wages using changesat the industry level over time. There are several reasons why workers can move moreeasily across firms within industries than across industries. Labour legislation as wellas housing and family ties can severely limit the possibility of labour mobility acrosssectors in the short and medium run (Goh and Javorcik, 2007). Even in the presence ofthese constraints, workers are still able to move across firms within industries if sectorsare geographically clustered or if workers are required to have industry-specific skills.The descriptive evidence provided in the previous section seems to confirm this short-runlabour immobility as it shows that a high percentage of the changes in the relative demandfor skilled labour are within industries rather than across them over the 1984-1990 period.
In order to measure trade liberalisation, the analysis includes both input and outputtariff rates at the industry level and their interaction, respectively, with the share ofexports in total sales and of imported raw materials in total material costs at the firmlevel. Following the approach by Amiti and Davis (2008) and Amiti and Cameron (2011),the interaction terms are added to analyse whether the effects of trade liberalisation areindustry-wide or heterogeneous and affect more firms that import and export.
Even though the 1985-1987 liberalisation process in Mexico was imposed by the ex-ternal circumstances arising with the debt crisis and its main emphasis was on reducingaverage tariff rates as well as the dispersion in tariff rates, tariff rates may still be en-dogenous. In particular, future tariff rates may be correlated with current productivity(Topalova, 2004) or with industries’ skill intensity (Revenga, 1997; Feliciano, 2001).
The data show that tariff rates are indeed correlated with past values of productivity– measured using the Levinsohn and Petrin (2003) approach – as well as past values ofskilled workers’ share in the total number of workers at the industry level. However,
12

the degree of tariff reduction does not depend on any industry characteristic, includingthe share of skilled workers or productivity, but depends only on the initial tariff level.6
Thus, extending the approach in Goldberg and Pavcnik (2005), the paper can addressthe endogeneity of tariffs by using the system GMM estimator since this estimator usesthe endogenous variables in differences as instruments for the equations in levels and,viceversa, variables in levels as instruments for the equations in differences.
It should be noted that this identification strategy analyses only the impact of trade-induced SBTC that happen through changes in M&E tariffs, which are supposed to lead toa lower price of M&E. However, trade-induced technical change could also happen throughoutput tariff changes, as these may bring about more competition in the goods marketwith potential effects on the innovation strategy of firms (Gorodnichenko et al., 2010;Bloom et al., 2011). The inclusion of the Herfindahl-Hirschman Index and the use of thesystem GMM estimator that allows for this variable to be endogenous and determined byoutput tariffs, among other factors, implies that this alternative mechanism is accountedfor and that the coefficient on the price of M&E only captures trade-induced SBTCoccurring through the M&E price channel.
Based on the identification strategy just described, the following equation is to beestimated for relative wages:
ln(ws/wu)kit = α0 + β1 ln(ws/wu)kit−1 + β2 ln pit ∗ sizeit + β3 ln taroit+
β4 ln(taroit ∗ expshkit) + β5 ln tariit + β6 ln(tariit ∗ impshkit)+β7 ln(tarmet ∗ impmeshkit) + β8Xkit + β9Wit + αt + αk + εkit,
(3)
where ws/wu is the skill premium, p is the price of M&E in Mexico, size indicates aset of dummies for small (no more than 100 employees), medium (between 101 and 250employees) and large plants (more than 251 employees) defined according to the EIAsample stratification, taro is the tariff rate on final goods, expsh is the share of exportsin total sales, tari is the tariff rate on intermediate inputs, impsh is the share of importedmaterials in total material costs, tarme is the tariff rate on M&E, impmesh is the shareof M&E imported, X is a vector of firm-level controls, including the alternative firm-levelproxies for SBTC, W is a vector of industry-level controls, αt represents year fixed effects,αk represents firm fixed effects, ε is the error term, subscript k indexes firms, i industriesand t years.
Regarding the firm-level variables to be included in X, the literature review by Chen-nells and Van Reenen (1999) provides a detailed list. These will be the lagged dependentvariable, dummies for firms’ size based on total employment, the ratio of total capitalto valued added, the share of exports in total sales, the share of materials imported,the share of M&E imported and the share of firms’ social capital owned by foreigners,a measure of FDI. Including the lagged dependent variable means that traditional paneldata estimators are subject to dynamic panel bias (Roodman, 2009). Given that thenumber of observations is large, system GMM is a consistent estimator. Moreover, thisestimator is able to address the endogeneity issues discussed above through the use of anIV approach with both internal and external instruments.
6Results are available upon request.
13
The additional industry-level variables, W , included in this model are the Herfindahl-Hirschman Index, as proposed by Goh and Javorcik (2007), and the degree of unionisation,a proxy for labour market conditions and the possible difficulties in hiring and firing work-ers, both of which can have a direct effect on wages (Fairris and Levine, 2004). Throughthe time dummies, the analysis accounts for economy-wide changes, which include notonly exchange rate movements and minimum wage legislation, but also additional effectsof trade liberalisation and SBTC that cannot be identified using the present strategy dueto some labour mobility. Therefore, the effects of trade liberalisation and SBTC, occur-ring through the M&E price channel, found in the next section are likely to be lowerbound estimates.
An additional reduced-form equation is estimated in order to determine how much ofthe variation in the price of M&E in Mexico, is due to exogenous SBTC, measured by theprice of M&E in the US, and trade-induced SBTC, measured by the tariff rate specificto M&E. This is necessary because system GMM does not report the results of this typeof regression, which is equivalent to the first-stage regression in a simpler two-stage leastsquares estimation. The equation to be estimated is as follows:
ln pit = γ0 + γ1 ln pusit + γ2 ln(tarmet + 1) + γ3Wit + ηi + νit, (4)
where pus is the price of M&E in the US, W represents additional industry-level regressorsalso included in equation (3), ηi are industry fixed effects and ν is the error term. Yearfixed effects are not included because they would not make it possible to identify thecoefficient on the tariff rate specific to M&E. However, in order to show that the coefficienton the M&E-specific tariff rate is not simply picking up a time trend, an alternativespecification that includes year fixed effects is also estimated.
A simple variation of equation (3) can be estimated to look at real skilled and unskilledwages. This yields
lnwskit = α0 + β1 lnwskit−1 + β2 ln pit ∗ sizeit + β3 ln taroit+
β4 ln(taroit ∗ expshkit) + β5 ln tariit + β6 ln(tariit ∗ impshkit)+β7 ln(tarmet ∗ impmeshkit) + β8Xkit + β9Wit + αt + αk + εkit
(5)
lnwukit = α0 + β1 lnwukit−1 + β2 ln pit ∗ sizeit + β3 ln taroit+
β4 ln(taroit ∗ expshkit) + β5 ln tariit + β6 ln(tariit ∗ impshkit)+β7 ln(tarmet ∗ impmeshkit) + β8Xkit + β9Wit + αt + αk + εkit,
(6)
where ws stands for real skilled wages and wu for real unskilled wages.
5 Econometric analysis
5.1 Results for the skill premium
Table 3 presents the baseline results for the skill premium based on the estimation ofequation (3) via system GMM. The Wald tests show that all regressions are significantas a whole, while the AR(1) and AR(2), the Arellano-Bond tests for serial correlationof the residuals, detect only first-order serial correlation and reject the hypothesis ofhigher-order serial correlation. Therefore, the system GMM estimator can use the first
14

Table 3: The effects of trade and SBTC on the skill premium
Dep. var.: ln(ws/wu)(1) (2) (3) (4) (5)
M&E Plant-size Trade Both M&E Additionalprice interactions variables and trade controls
Log skill premium (-1) 0.53 0.53 0.55 0.55 0.54(0.03)??? (0.03)??? (0.03)??? (0.03)??? (0.03)???
Log M&E price -0.08 0.17 0.06 0.05(0.04)? (0.14) (0.08) (0.09)
Log M&E price * -0.23 -0.14 -0.13Size (101-250) (0.11)?? (0.07)?? (0.07)??
Log M&E price * -0.27 -0.16 -0.15Size (>251) (0.13)?? (0.08)?? (0.09)?
Log input tariffs -0.04 -0.04 -0.02(0.02) (0.02)?? (0.01)
Log input tariffs * 0.00 0.02 0.08Share input imports (0.09) (0.09) (0.09)Log output tariffs 0.02 0.02 0.02
(0.01)? (0.01)? (0.01)??
Log output tariffs * -0.19 -0.16 -0.16Share exports (0.11) (0.12) (0.12)Log M&E tariffs * -0.04 -0.02 -0.03Share M&E imports (0.03) (0.03) (0.03)Log FDI 0.17
(0.08)??
Size dummies no yes no yes yesInput/export shares no no yes yes yesOther firm-level controls no no no no yesIndustry-level controls no no no no yesYear fixed effects yes yes yes yes yesNo. obs. 9115 9115 9115 9115 9115Wald test 1291.68??? 1360.46??? 2319.92??? 2048.59??? 2887.80???
AR(1) -18.03??? -17.72??? -15.66??? -15.45??? -15.76???
AR(2) -0.03 -0.01 -1.35 -1.34 -1.29
Notes: The regressions are estimated via system GMM. The dependent variable is the log of the skillpremium in all regressions. Robust standard errors in parentheses are clustered at the industry level.One, two and three asterisks indicate coefficients significantly different from zero at 10%, 5% and 1%level respectively.
and higher-order lags of the dependent variable as instruments. While the Hansen testof overidentifying restrictions does not reject the null of hypothesis of exogeneity of in-struments in all the specifications, the Sargan test of overidentifying restrictions fails.Moreover, the difference-in-Hansen test does not reject the exogeneity of the price ofM&E in the US as an instrument by itself. These tests, which are not reported, shouldnot be relied upon too faithfully because the Hansen-type tests are weakened by manyinstruments and the Sargan test is prone to weakness (Roodman, 2009) and it tends tobecome more significant as the number of observations grows large (Meschi et al., 2009),as in this analysis.
Moving on to the different specifications reported, column 1 includes only the laggeddependent variable, the log of the price of M&E and year fixed effects. The coefficienton the lagged values of the skill premium is always positive and with a coefficient less
15

than one. The coefficient on the log of the price of M&E in Mexico is negative andsignificant at the 10% level. Decreases in the price of M&E lead to increases in the skillpremium, thus confirming the hypothesis that technical change coming through M&Efavours skilled workers.
Column 2 tests whether the effects of SBTC coming through changes in the price ofM&E are heterogeneous depending on the size of the plant. This second specificationalso includes dummy variables for plant size. The coefficient on the price of M&E is nowpositive but not significant, thus implying that the price of M&E has no effect on theskill premium in small plants. However, the price of M&E has a significantly negativeeffect on the skill premium in medium- and large-sized plants. Joint tests of significanceshow that all three coefficients are jointly different from zero. This implies that SBTCmeasured through changes in the price of M&E is more important in larger plants, thusconfirming the important role of firm heterogeneity in recent models of technical changeand trade.
Regarding the magnitude of the coefficients related to the price of M&E, a 10%decrease leads to an increase in the skill premium by approximately 1% in larger plants,but no effect on smaller plants. This implies that SBTC coming through the variationin the price of M&E across industries can account for one tenth of the overall increase inthe skill premium during the 1986-1990 period. The magnitude of the effect is similar inthe following specifications.
Column 3 drops the price of M&E and adds the log of input tariffs, the log of outputtariffs, their interactions with the shares of intermediate input imported and sales ex-ported respectively and the interaction of the tariff rate on M&E with the share of M&Ethat is imported. This specification also adds these shares separately. The only variablethat has an effect on the skill premium is the log of output tariffs, albeit only at the 10%significance level. The joint test of significance for the output tariff and its interactionwith the share of sales exported shows that the effect of output tariffs is heterogeneous.While the positive coefficient on the output tariff variable suggests that trade liberalisa-tion in final goods has a negative effect on the skill premium, this effect dies off quicklyand becomes positive as firms export larger shares of their sales.
The price of M&E and its interaction with plant size dummies and all trade-relatedvariables are added in the same specification in column 4. The results from the previoustwo columns do not change qualitatively, with the exception of the coefficient on inputtariffs that is now significant at the 5% level. The negative coefficient implies thatdecreases in input tariffs tend to increase the skill premium, which contrasts with theresults in Amiti and Cameron (2011) for Indonesia. While this could be due to the factthat Mexico is more skill-abundant than Indonesia, it should be noted that this result isnot robust since it does not carry through all specifications.
Additional firm-level and industry-level controls are added in column 5. In particular,the log of FDI, defined as the share of firms’ social capital held by foreigners, is includedin this specification. The skill premium is larger in plants with at least some foreignownership, which implies that FDI is a significant contributor towards the increase inwage inequality. The inclusion of these additional variables does not, however, affect thestatistical significance of the point estimates on the price of M&E and its interaction andthe trade-related variables, which only tend to decrease slightly.
16

Table 4: The determinants of the price of M&E in Mexico
Dep. var.: Log M&E price(1) (2) (3)
US price Industry Yearand tariff controls fixed effects
Log M&E price in US 0.84 0.69 -0.39(0.32)??? (0.34)?? (1.88)
Log M&E tariffs 0.85 1.17(0.26)??? (0.50)???
Industry fixed effects yes yes yesIndustry-level controls no yes yesYear fixed effects no no yesNo. obs. 276 276 276R-squared 0.80 0.80 0.81F-test 15.11??? 7.68??? 7.93???
Notes: The regressions are estimated via fixed effects. The dependent variable is the log of the price ofM&E in Mexico in all regressions. Robust standard errors in parentheses are clustered at the industrylevel. One, two and three asterisks indicate coefficients significantly different from zero at 10%, 5% and1% level respectively.
5.2 Disentangling trade-induced and exogenous SBTC
Table 4 reports the estimation results for equation (4). This equation is equivalent tothe first-stage regression in a two-stage least squares estimation and it is necessary tosee how the price of M&E in Mexico varies with the price of M&E in the US, to beconsidered a measure of exogenous SBTC, and the tariff rate specific to M&E, a measureof trade-induced SBTC, since system GMM does not report the results of this regression.The caveat is that this equation only captures the effects of exogenous and trade-inducedtechnical change that happen through changes in the price of M&E.
The first column of table 4 shows the results including only the log of the price ofM&E in the US, the log of M&E tariffs and industry fixed effects. Both the price ofM&E in the US and the tariff rate on M&E affect positively the price of M&E in Mexico,with coefficients statistically significant at the 1% level. Both coefficients are statisticallynot different from one, which corresponds to a perfect pass-through of foreign prices andtariffs to the domestic price of M&E.
Column 2 adds other industry-level regressors, in order to match the variables includedin the estimation of equation (3). The coefficients on the main variables of interest changeslightly, yet they both remain statistically different from zero but not different from one.
The specifications in the first two columns do not add year fixed effects because theirinclusion would prevent to identify the coefficient on the tariff rates on M&E since thisvariable does not change across industries but only over time. In order to make sure thatchanges in tariff rates on M&E do not simply capture a time trend, column 3 estimatesequation (4) with year fixed effects instead of tariff rates on M&E. In this specification,the coefficient on the price of M&E in the US becomes negative and insignificant, whichis unlikely given the importance of imports of equipment capital, especially from the US,for the Mexican economy. Therefore, changes in the price of M&E in Mexico are causedby changes in the price of M&E in the US and changes in the tariff rates on M&E, withthe latter having a slightly larger effect than the former on the Mexican M&E price.
17

Table 5: The effects of trade and SBTC on skilled and unskilled wages
Dep. var. lnws lnws lnwu lnwu(1) (2) (3) (4)
Plant-size Additional Plant-size Additionalinteractions controls interactions controls
Log skilled wage (-1) 0.66 0.61(0.02)??? (0.03)???
Log unskilled wage (-1) 0.57 0.57(0.03)??? (0.03)???
Log M&E price -0.31 0.04 -0.28 -0.00(0.19)? (0.08) (0.15)? (0.08)
Log M&E price * 0.17 -0.12 0.19 -0.01Size (101-250) (0.14) (0.08) (0.11)? (0.07)Log M&E price * 0.18 -0.19 0.23 -0.05Size (>251) (0.16) (0.09)?? (0.15) (0.10)Log input tariffs -0.01 0.01
(0.01) (0.01)Log input tariffs * 0.01 -0.10Share input imports (0.09) (0.06)?
Log output tariffs -0.00 -0.03(0.01) (0.01)??
Log output tariffs * -0.26 -0.14Share exports (0.13)?? (0.14)Log M&E tariffs * -0.01 0.01Share M&E imports (0.02) (0.02)Log FDI 0.43 0.30
(0.08)??? (0.08)???
Size dummies yes yes yes yesInput/export shares no yes no yesOther firm-level controls no yes no yesIndustry-level controls no yes no yesYear fixed effects yes yes yes yesNo. obs. 9115 9115 9115 9115Wald test 2492.41??? 4732.51??? 2114.00??? 4885.48???
AR(1) -19.07??? -14.28??? -17.88??? -13.65???
AR(2) 1.27 0.01 0.60 0.59
Notes: The regressions are estimated via system GMM. The dependent variable is the log of real skilledwages in columns 1 and 2 and the log of real unskilled wages in columns 3 and 4. Robust standard errorsin parentheses are clustered at the industry level. One, two and three asterisks indicate coefficientssignificantly different from zero at 10%, 5% and 1% level respectively.
5.3 Results for real skilled and unskilled wages
Table 5 shows four regressions, in which the dependent variable is either real skilled wages(first two columns) or real unskilled wages (last two columns). In all the regressions, theestimator used is system GMM. The first and third columns correspond to the speci-fication in column 2 of table 3, while the second and fourth columns report the samespecification as in column 5 of table 3, but with skilled and unskilled wages as the de-pendent variables. All specifications are significant overall, as shown by the Wald tests,and only first-order serial correlation is detected by the AR(1) and AR(2) tests.
Starting with the regressions for real skilled wages, column 1 shows that the priceof M&E has a negative effect on the real wage of skilled workers in all firms since the
18
interaction terms of the M&E price with the dummies for plant size are not significant.However, when all the other regressors are included, as in column 2, skilled wages turnout to be affected negatively the price of M&E only in larger plants, which is equivalentto the results for the skill premium in table 3. This implies that decreases in the price ofM&E tend to increase real skilled wages in medium- and large-sized plants.
Regarding the other coefficients, the lagged dependent variable, in the specificationsfor both real skilled and real unskilled wages, is always positive and significant, with acoefficient less than one. Plants in which foreigners have a stake tend to pay higher skilledwages and exporting plants in industries that decreased output tariffs also tend to payhigher wages.
The results are different for real unskilled wages. Column 3 shows that decreases inthe price of M&E tend to increase real unskilled wages, but more so in smaller plants.However, the statistical significance of these point estimates does not hold when otherimportant regressors are included, as in column 4. This specification shows that thevariables related to the price of M&E are not significant, while the log of the share offirms’ social capital held by foreigners is positive and highly significant. The coefficientis smaller than that on the same variable in the regression for real skilled wages, whichis consistent with the positive effect of foreign ownership on the skill premium. Someof the coefficients attached to the trade-related variables are also statistically significant.In particular, plants that import intermediate inputs and that belong to industries thatdecreased input tariffs tend to pay higher real unskilled wages. Decreases in output tariffsalso lead to industry-wide increases in real unskilled wages.
5.4 Robustness checks
This section presents some robustness checks for the results presented above, startingwith the regressions for the skill premiium. Table 6 shows that the results presentedin table 3, particularly the specification in column 5 considered to be the baseline, arerobust across specifications.
One of the main concerns is that measure of technical change used, the price of M&E isnot robust to the inclusion of firm-level measures of technical change. Column 1 includesthe amount of money spent on royalties for the use of new technologies to measuretechnical change, as in Bustos (2007; 2009), instead of the price of M&E. The coefficienton technology expenditures through royalties is positive and significant, albeit only atthe 10% level, and the significance of the point estimates on the variables included is notaltered. Column 2 uses imports of M&E, as in Riano (2009), as a measure of technicalchange. The coefficient on M&E imports is not statistically different from zero. All threemeasures of technical change, i.e., the price of M&E, technology expenditures and M&Eimports, are included in the specification in column 3. As before, decreases in the priceof M&E lead to increases in the skill premium, but only in larger plants. Additionally,higher technology expenditures through royalties are also associated with a higher skillpremium. As a further robustness check, the coefficients on the price of M&E and itsinteraction with plant size dummies do not change significantly when expenditures onroyalties and M&E imports are also interacted with plant size dummies. Results areavailable upon request.
The reason why M&E imports do not affect the skill premium is that this variable ex-
19

Table 6: The effects of trade and SBTC on the skill premium – robustness checks
Dep. var.: ln(ws/wu)(1) (2) (3) (4) (5)
Royalties M&E All SBTC No foreign State-yearexpenditures imports measures firms fixed effects
Log skill premium (-1) 0.54 0.54 0.54 0.54 0.54(0.03)??? (0.03)??? (0.03)??? (0.03)??? (0.03)???
Log M&E price 0.05 0.16 0.05(0.03) (0.11) (0.08)
Log M&E price * -0.14 -0.19 -0.13Size (101-250) (0.07)?? (0.10)? (0.07)??
Log M&E price * -0.15 -0.23 -0.14Size (>251) (0.09)? (0.11)?? (0.09)?
Log royalties 0.09 0.10expenditures (0.05)? (0.05)??
Log M&E imports 0.01 0.02(0.03) (0.03)
Log input tariffs -0.02 -0.02 -0.02 -0.01 -0.02(0.01) (0.01) (0.01) (0.01) (0.01)??
Log input tariffs * 0.12 0.12 0.09 0.18 0.08Share input imports (0.08) (0.09) (0.09) (0.14) (0.09)Log output tariffs 0.03 0.03 0.02 0.02 0.03
(0.01)??? (0.01)??? (0.01)?? (0.01)?? (0.01)??
Log output tariffs * -0.14 -0.14 -0.14 -0.05 -0.21Share exports (0.11) (0.11) (0.11) (0.13) (0.11)?
Log M&E tariffs * -0.04 -0.04 -0.03 -0.01 -0.03Share M&E imports (0.03) (0.03) (0.03) (0.04) (0.03)Log FDI 0.32 0.34 0.16 0.14
(0.11)??? (0.12)??? (0.08)?? (0.08)?
Size dummies yes yes yes yes yesInput/export shares yes yes yes yes yesOther firm-level controls yes yes yes yes yesIndustry-level controls yes yes yes yes yesYear fixed effects yes yes yes yes noState-year fixed effects no no no no yesNo. obs. 9115 9115 9115 6380 9115Wald test 2327.70??? 2073.64??? 2831.90??? 1631.17??? 3.88e+09???
AR(1) -15.76??? -15.84??? -15.73??? -14.15??? -15.91???
AR(2) -1.30 -1.31 -1.27 -1.74 -1.52
Notes: The regressions are estimated via system GMM. The dependent variable is the log of the skillpremium in all regressions. Robust standard errors in parentheses are clustered at the industry level.One, two and three asterisks indicate coefficients significantly different from zero at 10%, 5% and 1%level respectively.
cludes purchases of imports via other domestic firms (e.g., specialised importers). More-over, the design even of domestically produced M&E is heavily influenced by that ofimported M&E and of M&E used abroad, which domestic producers copy either under li-cense (for which they pay royalties) or by making something similar. Therefore, importedM&E is important, both in itself and as a model for local producers to copy, but it is notthe whole of the new technology story. Expenditures on royalties for new technologiesare also not able to wholly capture technical change because they exclude the possibilityof technology embodied in M&E, which is particularly important in developing countries.
20

In the specifications reported so far, the share of foreign capital in each firm, a measureof FDI, has been included to account for the differential skill premium in foreign firms.However, the demand for labour in foreign firms may differ from domestic firms becauseof the relationship with the parent firm (Amiti and Cameron, 2011). Column 4 excludesfrom the sample any firm that is partially or wholly owned by foreigners. The coefficientson all variables remain similar in magnitude and their significance does not change.
Works by Hanson (1997) and Chiquiar (2008) suggest that the regional dimensionis important in determining wage and the return to skill in Mexico. Therefore, column5 controls for state-year fixed effects to isolate the impact of STBC from the differen-tial impact of market access. The coefficients on the price of M&E and its interactionwith plant size remain similar in magnitude and their significance does not change ei-ther. Interestingly, the coefficient on input tariffs turns significant at the 5% level. Thenegative sign implies that decreases in input tariffs are associated with increases in theskill premium. The coefficient on output tariffs is still positive and significant, while thecoefficient on its interaction with the share of exports is negative and significant. Thus,trade liberalisation in final goods tends to decrease the skill premium, but this effect mayturn positive in larger plants.
Table 7 presents some robustness checks for the specifications using real skilled wages(first two columns) or real unskilled wages (last two columns) as the dependent variable.
Column 1 includes three different measures of SBTC, i.e., the price of M&E with itsinteraction with plant size dummies, expenditures on royalties and M&E imports. Thecoefficients on the price of M&E and its interactions remain similar in magnitude andtheir significance does not change. The coefficient on expenditures on royalties is positiveand highly significant, while that on M&E is not significant. Column 3 presents the samespecification using real unskilled wages as the dependent variable. As before, the price ofM&E does not affect real unskilled wages, but expenditures on royalties have a positiveand significant effect on real unskilled wages.
These results suggest that larger plants in industries in which the price of M&Edecreased pay higher real skilled wages, but plants that spend more on royalties forthe use of new technologies pay higher skilled and unskilled wages. Thus, the M&Eand royalties for technology licenses represent different types of technical change. Inparticular, M&E seem to be associated with a technology that favours skilled labourin larger plants, while expenditures on royalties seem to be a technology that is eithercomplementary with both, although to different degrees, or more generally that increasesthe productivity of both types of labour.
Columns 2 and 4 include state-year fixed effects to account for time-variant unobserv-ables at the regional level that may have affected wages. The results presented so far arerobust to this specification. The coefficients related to the price of M&E remain similarin magnitude and their significance does not change, with the exception of the negativecoefficient on the interaction between the price of M&E and medium-sized plants thatbecomes significant at the 10% level and the .
The trade-related variables are not affected by these robustness checks, with theexception of the coefficient on the interaction between input tariffs and the share ofinputs imported in the specification using real unskilled wages as the dependent variablesand state-year fixed effects. This coefficients remains negative and of similar magnitude,but it becomes insignificant.
21

Table 7: The effects of trade and SBTC on skilled and unskilled wages – robustnesschecks
Dep. var. lnws lnws lnwu lnwu(1) (2) (3) (4)
All SBTC State-year All SBTC State-yearmeasures fixed effects measures fixed effects
Log skilled wage (-1) 0.60 0.61(0.03)??? (0.03)???
Log unskilled wage (-1) 0.57 0.56(0.03)??? (0.03)???
Log M&E price 0.04 0.03 -0.00 -0.01(0.07) (0.06) (0.08) (0.08)
Log M&E price * -0.13 -0.12 -0.01 -0.01Size (101-250) (0.08) (0.07)? (0.07) (0.06)Log M&E price * -0.20 -0.18 -0.06 -0.05Size (>251) (0.09)?? (0.08)?? (0.09) (0.09)Log royalties 0.18 0.09expenditures (0.05)??? (0.04)??
Log M&E imports 0.04 0.03(0.03) (0.03)
Log input tariffs -0.01 -0.02 0.01 0.01(0.01) (0.01) (0.01) (0.01)
Log input tariffs * 0.01 0.02 -0.10 -0.08Share input imports (0.08) (0.09) (0.06)? (0.05)Log output tariffs -0.00 -0.00 -0.03 -0.03
(0.01) (0.01) (0.01)?? (0.01)???
Log output tariffs * -0.22 -0.33 -0.10 -0.16Share exports (0.12)? (0.13)?? (0.13) (0.14)Log M&E tariffs * -0.02 -0.02 0.01 0.01Share M&E imports (0.02) (0.02) (0.02) (0.02)Log FDI 0.42 0.36 0.30 0.27
(0.08)??? (0.07)??? (0.08)??? (0.08)???
Size dummies yes yes yes yesInput/export shares yes yes yes yesOther firm-level controls yes yes yes yesIndustry-level controls yes yes yes yesYear fixed effects yes no yes noState-year fixed effects no yes no yesNo. obs. 9115 9115 9115 9115Wald test 6992.10??? 9.59e+08??? 5204.53??? 2.86e+08???
AR(1) -14.25??? -14.33??? -13.69??? -14.22???
AR(2) 0.04 -0.05 0.58 0.65
Notes: The regressions are estimated via system GMM. The dependent variable is the log of real skilledwages in columns 1 and 2 and the log of real unskilled wages in columns 3 and 4. Robust standard errorsin parentheses are clustered at the industry level. One, two and three asterisks indicate coefficientssignificantly different from zero at 10%, 5% and 1% level respectively.
6 Conclusion
This paper analyses and quantifies the effects of SBTC, both exogenous and trade-induced, that occur through changes in the price of M&E and trade liberalisation usingdata at the plant level in Mexican manufacturing from 1984 to 1990. The novelty of
22

this work lies in the identification strategy adopted, based on using both internal instru-ments, i.e. lagged values of the endogenous variables, and an external instrument, theprice of M&E in the US, for the price of M&E in Mexico. This strategy ensures that therelationships found in the data are of a causal nature.
The results show that the effects of both exogenous and trade-induced SBTC – causedby changes in the price of M&E – on the skill premium are of statistical and economicsignificance. Changes in the price of equipment in the US and in tariff rates on M&E canexplain about one tenth of the increase in the skill premium during the period considered.Given the identification strategy adopted, this is to be considered a lower bound estimateof the effects of SBTC on the skill premium.
The evidence presented is, therefore, consistent with the idea that, as the price ofequipment decreases, due to exogenous technical progress abroad or a decline in tariffs,the demand for it increases, particularly in large plants that invest more in M&E, aspredicted by recent models with heterogeneous firms. The increase in the demand forM&E in larger plants leads to an increase in the relative demand for skilled workersand, thus higher relative and real skilled wages in larger plants due to complementarity.These results are confirmed when the regressions use different firm-level measures ofSBTC, including expenditures on royalties for new technologies. The evidence also pointstowards a specific-factors model in which workers have both general and sector-specificskills.
23

References
Acemoglu, D. (2002a). ‘Directed Technical Change’, Review of Economic Studies, vol. 69,no. 4, pp. 781–809.
Acemoglu, D. (2002b). ‘Technical Change, Inequality, and the Labor Market’, Journal ofEconomic Literature, vol. 40, no. 1, pp. 7–72.
Acemoglu, D. (2003). ‘Patterns of Skill Premia’, Review of Economic Studies, vol. 70,no. 2, pp. 199–230.
Amiti, M. and Cameron, L. (2011). ‘Trade Liberalization and the Wage Skill Premium:Evidence from Indonesia’, C.E.P.R. Discussion Papers, CEPR Discussion Papers, no.8382.
Amiti, M. and Davis, D. R. (2008). ‘Trade, Firms, and Wages: Theory and Evidence’,C.E.P.R. Discussion Papers, CEPR Discussion Papers, no. 6872.
Anderson, E. (2005). ‘Openness and inequality in developing countries: A review of theoryand recent evidence’, World Development, vol. 33, no. 7, pp. 1045–1063.
Atkin, D. (2010). ‘Endogenous Skill Acquisition and Export Manufacturing in Mexico’,Yale University.
Atkinson, A. B. and Morelli, S. (2011). ‘Economic crises and Inequality’, United NationsDevelopment Programme (UNDP), Human Development Research Papers, no. HDRP-2011-06.
Berman, E., Bound, J. and Griliches, Z. (1994). ‘Changes in the Demand for Skilled Laborwithin U.S. Manufacturing: Evidence from the Annual Survey of Manufactures’, TheQuarterly Journal of Economics, vol. 109, no. 2, pp. 367–397.
Berman, E. and Machin, S. (2000). ‘Skill-Based Technology Transfer around the World’,Oxford Review of Economic Policy, vol. 16, no. 3, pp. 12–22.
Berman, E. and Machin, S. (2004). ‘Globalization, Skill-Biased Technological Changeand Labour Demand’, in E. Lee and M. Vivarelli (eds.), Understanding Globalization,Employment and Poverty Reduction, New York: Palgrave Macmillan, pp. 39–66.
Bloom, N., Draca, M. and Reenen, J. V. (2011). ‘Trade Induced Technical Change? TheImpact of Chinese Imports on Innovation, IT and Productivity’, Centre for EconomicPerformance, LSE, CEP Discussion Papers, no. dp1000.
Burstein, A. and Vogel, J. (2009). ‘Globalization, Technology, and the Skill Premium’,Columbia University.
Bustos, P. (2007). ‘The Impact of Trade on Technology and Skill Upgrading: Evidencefrom Argentina’, CREI, Universitat Pompeu Fabra.
Bustos, P. (2009). ‘Trade Liberalization, Exports and Technology Upgrading: Evidenceon the Impact of MERCOSUR on Argentinean Firms’, CREI, Universitat PompeuFabra, Economics Working Papers, no. 1173.
24
Chennells, L. and Van Reenen, J. (1999). ‘Has technology hurt less skilled workers? Asurvey of the micro-econometric evidence’, Institute for Fiscal Studies, IFS WorkingPapers, no. W99/27.
Chiquiar, D. (2008). ‘Globalization, regional wage differentials and the Stolper-SamuelsonTheorem: Evidence from Mexico’, Journal of International Economics, vol. 74, no. 1,pp. 70–93.
Csillag, M. and Koren, M. (2011). ‘Machines and machinists: Capital-skill complementar-ity from an international trade perspective’, Center for Firms in the Global Economy,CeFiG Working Papers, no. 13.
Doms, M., Dunne, T. and Troske, K. R. (1997). ‘Workers, Wages, and Technology’, TheQuarterly Journal of Economics, vol. 112, no. 1, pp. 253–90.
Esquivel, G. and Rodrıguez-Lopez, J. A. (2003). ‘Technology, trade, and wage inequalityin Mexico before and after NAFTA’, Journal of Development Economics, vol. 72, no. 2,pp. 543–565.
Fairris, D. and Levine, E. (2004). ‘Declining union density in Mexico, 1984-2000’, MonthlyLabor Review, vol. 127, no. 9, pp. 10–17.
Feenstra, R. C. and Hanson, G. H. (1996). ‘Globalization, Outsourcing, and Wage In-equality’, American Economic Review, vol. 86, no. 2, pp. 240–45.
Feenstra, R. C. and Hanson, G. H. (1997). ‘Foreign direct investment and relative wages:Evidence from Mexico’s maquiladoras’, Journal of International Economics, vol. 42,no. 3-4, pp. 371–393.
Feliciano, Z. (2001). ‘Workers and Trade Liberalization: The Impact of Trade Reformsin Mexico on Wages and Employment’, Industrial and Labor Relations Review, vol. 55,no. 1, pp. 95–115.
Gallego, F. (2010). ‘Skill Premium in Chile: Studying Skill Upgrading in the South’, In-stituto de Economia, Pontificia Universidad Catolica de Chile, Documentos de Trabajo,no. 377.
Goh, C.-c. and Javorcik, B. S. (2007). ‘Trade Protection and Industry Wage Structurein Poland’, in A. Harrison (ed.), Globalization and Poverty, Chicago, IL: University ofChicago Press, pp. 337–372.
Goldberg, P. K., Khandelwal, A. K., Pavcnik, N. and Topalova, P. (2010). ‘Imported In-termediate Inputs and Domestic Product Growth: Evidence from India’, The QuarterlyJournal of Economics, vol. 125, no. 4, pp. 1727–1767.
Goldberg, P. K. and Pavcnik, N. (2005). ‘Trade, wages, and the political economy oftrade protection: evidence from the Colombian trade reforms’, Journal of InternationalEconomics, vol. 66, no. 1, pp. 75–105.
Goldberg, P. K. and Pavcnik, N. (2007). ‘Distributional Effects of Globalization in De-veloping Countries’, Journal of Economic Literature, vol. 45, no. 1, pp. 39–82.
25

Gonzaga, G., Menezes Filho, N. and Terra, C. (2006). ‘Trade liberalization and theevolution of skill earnings differentials in Brazil’, Journal of International Economics,vol. 68, pp. 345–367.
Gorodnichenko, Y., Svejnar, J. and Terrell, K. (2010). ‘Globalization and Innovation inEmerging Markets’, American Economic Journal: Macroeconomics, vol. 2, no. 2, pp.194–226.
Hanson, G. H. (1997). ‘Increasing Returns, Trade and the Regional Structure of Wages’,Economic Journal, vol. 107, no. 440, pp. 113–33.
Hanson, G. H. and Harrison, A. (1999). ‘Trade liberalization and wage inequality inMexico’, Industrial and Labor Relations Review, vol. 52, no. 2, pp. 271–288.
Harrigan, J. and Reshef, A. (2011). ‘Skill Biased Heterogeneous Firms, Trade Liberal-ization, and the Skill Premium’, National Bureau of Economic Research, Inc, NBERWorking Papers, no. 17604.
Iacovone, L. (2008). ‘Exploring Mexican Firm-Level Data’, University of Sussex.
Katz, L. F. and Murphy, K. M. (1992). ‘Changes in Relative Wages, 1963-1987: Supplyand Demand Factors’, The Quarterly Journal of Economics, vol. 107, no. 1, pp. 35–78.
Krusell, P., Ohanian, L. E., Rıos-Rull, J.-V. and Violante, G. L. (2000). ‘Capital-SkillComplementarity and Inequality: A Macroeconomic Analysis’, Econometrica, vol. 68,no. 5, pp. 1029–1054.
Kugler, M. and Verhoogen, E. (2012). ‘Prices, Plant Size, and Product Quality’, Reviewof Economic Studies, vol. 79, no. 1, pp. 307–339.
La Porta, R. and Lopez-De-Silanes, F. (1999). ‘The Benefits Of Privatization: EvidenceFrom Mexico’, The Quarterly Journal of Economics, vol. 114, no. 4, pp. 1193–1242.
Leamer, E. (1998). ‘In search of Stolper-Samuelson linkages between international tradeand lower wages’, in S. Collins (ed.), Imports, Exports and the American Worker,Washington, DC: Brookings Institution, pp. 141–202.
Leonardi, M. (2007). ‘Firm heterogeneity in capital-labour ratios and wage inequality’,Economic Journal, vol. 117, no. 518, pp. 375–398.
Levinsohn, J. and Petrin, A. (2003). ‘Estimating Production Functions Using Inputs toControl for Unobservables’, Review of Economic Studies, vol. 70, no. 2, pp. 317–341.
Machin, S. and Van Reenen, J. (1998). ‘Technology And Changes In Skill Structure:Evidence From Seven OECD Countries’, The Quarterly Journal of Economics, vol.113, no. 4, pp. 1215–1244.
Melitz, M. J. (2003). ‘The Impact of Trade on Intra-Industry Reallocations and AggregateIndustry Productivity’, Econometrica, vol. 71, no. 6, pp. 1695–1725.
26

Meschi, E., Taymaz, E. and Vivarelli, M. (2009). ‘Trade, Technology and Skills: Evidencefrom Turkish Microdata’, Friedrich-Schiller-University Jena, Max-Planck-Institute ofEconomics, Jena Economic Research Papers in Economics, no. 2009-097.
Revenga, A. (1997). ‘Employment and Wage Effects of Trade Liberalization: The Caseof Mexican Manufacturing’, Journal of Labor Economics, vol. 15, no. 3, pp. S20–43.
Riano, A. (2009). ‘Trade, Technology Adoption and the Rise of the Skill Premium inMexico’, University of Nottingham.
Robbins, D. (2003). ‘The Impact of Trade Liberalization upon Inequality in DevelopingCountries – A Review of Theory and Evidence’, International Labour Organization,ILO Working Paper, no. 13.
Roodman, D. (2009). ‘How to do xtabond2: An introduction to difference and systemGMM in Stata’, Stata Journal, vol. 9, no. 1, pp. 86–136.
Schmidt, G. (2010). ‘Technology Choice and International Trade’, Kiel Institute for theWorld Economy, Working Papers, no. 1600.
Ten Kate, A. (1989). ‘Notas sobre la apertura comercial de Mexico, experiencias y lec-ciones’, Ensayos Sobre Polıtica Economica, vol. 15, no. 6, pp. 95–111.
Ten Kate, A. (1992). ‘Trade Liberalization and Economic Stabilization in Mexico: Lessonsof Experience’, World Development, vol. 20, no. 5, pp. 659–672.
Topalova, P. (2004). ‘Trade Liberalization and Firm Productivity: The Case of India’,IMF, Working Papers, no. 04/28.
Van Reenen, J. (2011). ‘Wage inequality, technology and trade: 21st century evidence’,Labour Economics, vol. 18, no. 6, pp. 730–741.
Vannoorenberghe, G. (2011). ‘Trade between symmetric countries, heterogeneous firms,and the skill premium’, Canadian Journal of Economics, vol. 44, no. 1, pp. 148–170.
Verhoogen, E. A. (2008). ‘Trade, Quality Upgrading, and Wage Inequality in the MexicanManufacturing Sector’, The Quarterly Journal of Economics, vol. 123, no. 2, pp. 489–530.
Wood, A. (1997). ‘Openness and Wage Inequality in Developing Countries: The LatinAmerican Challenge to East Asian Conventional Wisdom’, World Bank Economic Re-view, vol. 11, no. 1, pp. 33–57.
Xiang, C. (2005). ‘New Goods and the Relative Demand for Skilled Labor’, The Reviewof Economics and Statistics, vol. 87, no. 2, pp. 285–298.
27