TOTAL PETROCHEMICALS USA, INC. BART Screening Modeling Report
35
TOTAL PETROCHEMICALS USA, INC. BART Screening Modeling Report Port Arthur Refinery Port Arthur, Texas April 2007
Transcript of TOTAL PETROCHEMICALS USA, INC. BART Screening Modeling Report
TOTAL PETROCHEMICALS USA, INC.
BART Screening Modeling Report
Port Arthur Refinery Port Arthur, Texas
April 2007

Sage Environmental Consulting, L.P. TOTAL Petrochemicals USA, Inc. - PAR April 2007 M:\modeling\30_Total\01_PAR\52_BART\Information\Report_30-01-52.doc
i
TABLE OF CONTENTS
Executive Summary and Certification................................................................................. iii
1 Introduction...................................................................................................................... 1-1 1.1 Facility Information ............................................................................................ 1-1 1.2 Objectives ........................................................................................................... 1-1 1.3 Source Impact Evaluation Criteria...................................................................... 1-1 1.4 Relevant Air Quality Guidelines and Standards................................................. 1-2 1.5 Qualification and Experience of Sage Environmental........................................ 1-2 1.6 Pre-modeling Protocol ........................................................................................ 1-2
2 Air Quality Modeling Methodology ............................................................................... 2-1 2.1 Model Selection and Features............................................................................. 2-1 2.2 Modeling Domain Configuration ....................................................................... 2-2 2.3 Meteorological Database .................................................................................... 2-3 2.4 Receptor Grid...................................................................................................... 2-3 2.5 CALPUFF Configuration ................................................................................... 2-3 2.6 CALPOST Configuration ................................................................................... 2-5
3 Modeling Results.............................................................................................................. 3-1 3.1 Relevant Class I Areas........................................................................................ 3-1 3.2 Emission Sources Modeled................................................................................. 3-1 3.3 Results................................................................................................................. 3-1
4 References......................................................................................................................... 4-1

Sage Environmental Consulting, L.P. TOTAL Petrochemicals USA, Inc. - PAR April 2007 M:\modeling\30_Total\01_PAR\52_BART\Information\Report_30-01-52.doc
ii
TABLE OF CONTENTS (CONTINUED)
LIST OF FIGURES Figure 2-1 CALPUFF Modeling Domains ............................................................................ 2-2 LIST OF TABLES Table 2-1 Versions of the Modeling Software....................................................................... 2-1 Table 3-1 Class I Areas Modeled........................................................................................... 3-1 Table 3-2 Summary of Modeling Results.............................................................................. 3-2 LIST OF APPENDICES Appendix A CALPUFF Species Definition File Appendix B Sources Modeled Appendix C Parameter Files for CALPUFF, POSTUTIL, and CALPOST Appendix D TCEQ Submittals Appendix E Comments to the Pre-modeling Protocol


Sage Environmental Consulting, L.P. TOTAL Petrochemicals USA, Inc. - PAR April 2007 M:\modeling\30_Total\01_PAR\52_BART\Information\Report_30-01-52.doc
1-1
1 INTRODUCTION
1.1 Facility Information
TOTAL Petrochemicals USA, Inc. (TOTAL) (TCEQ Central Registry Customer Number CN600582399) operates the Port Arthur Refinery (PAR) located in Port Arthur, Jefferson County, Texas. The Texas Commission on Environmental Quality (TCEQ) Central Registry Regulated Entity Number for this facility is RN102457520 and the TCEQ account number is JE-0005-H. The facility includes ten BART-eligible units emitting sulfur dioxide (SO2), oxides of nitrogen (NOx), and particulate matter (PM).
1.2 Objectives
A screening assessment performed by ENVIRON International Corporation on behalf of the TCEQ included twenty Class I areas. The assessment identified 48 accounts whose visibility impacts resulting from NOx and SO2 emissions have the potential to contribute to visibility impairment in at least one of those Class I areas. The Best Available Retrofit Technology (BART) rule codified in 30 TAC 116, Subchapter M, allows the 48 BART-eligible sources to run source-specific BART screening modeling or refined modeling in an attempt to demonstrate that the source is exempt from the rule compliance requirements. The objective of the BART screening modeling was to determine the impact of NOx, SO2, and PM emissions from the PAR BART-eligible units on the Class I areas listed in Table 3-1 in Section 3.1 of this report. Screening modeling determines whether the refinery’s BART-eligible emission units contribute to visibility impairment in these Class I areas.
1.3 Source Impact Evaluation Criteria
Screening modeling was performed for the years 2001-2003, as required by the Central Regional Air Planning Association (CENRAP) guide accepted by the TCEQ. The result of modeling was a measure of visibility conditions at each Class I area created by all PAR BART-eligible units. The maximum visibility impact1 for 2001-2003 was compared to the natural visibility conditions for the areas. The impact depended on the difference between the modeled and natural visibility, measured in delta-deciviews (dv). If the difference was less than 0.5 dv at a particular Class I area, the Port Arthur Refinery did not impact the visibility at that area. If the difference was between 0.5 dv and 1.0 dv, the refinery would be considered to contribute to visibility impairment. If the difference was greater than 1.0 dv, the refinery would be considered to cause visibility impairment.
1 Texas Commission on Environmental Quality (January 2007). Best Available Retrofit Technology (BART) Modeling Protocol to Determine Sources Subject to BART in the State of Texas, p. 13.
SECTION

Sage Environmental Consulting, L.P. TOTAL Petrochemicals USA, Inc. - PAR April 2007 M:\modeling\30_Total\01_PAR\52_BART\Information\Report_30-01-52.doc
1-2
1.4 Relevant Air Quality Guidelines and Standards
Several guidance documents were used to conduct this modeling in compliance with U.S. EPA and TCEQ requirements. The CENRAP BART Modeling Guidelines2 specified the requirements of the modeling protocol and the years to model. The receptors for the Class I areas modeled were obtained from the National Park Service website. Tables 4 and 5 of the BART Modeling Protocol published by the TCEQ in January 2007 list relative humidity correction factors and annual natural levels of aerosol used to compute visibility. Finally, TCEQ’s BART Exemption Screening Analysis Addendum I was consulted for the Class I areas to be modeled for PAR. Additional information on the aforementioned documents and other reference materials is provided in Section 2 of this report.
1.5 Qualification and Experience of Sage Environmental
The modeler for this project was Sage Environmental Consulting, L.P. (Sage Environmental). Sage Environmental has comprehensive experience in various air dispersion modeling applications in the United States of America and world-wide. Sage Environmental provides full-service engineering and management consulting services in the areas of air permitting and compliance program development, atmospheric studies, air quality management, environmental assessment, pollution prevention, and environmental management systems. The Sage Environmental technical staff employs highly qualified scientists and consultants with exceptional depth and breadth of professional experience.
1.6 Pre-modeling Protocol
A pre-modeling protocol was submitted to the TCEQ at the beginning of March 2007. Mr. Daniel Jamieson of the TCEQ Air Banking and Modeling Team (ABMT) submitted the protocol to the EPA Region VI and Federal Land Managers (FLM) and obtained their comments. He consolidated the comments and sent the comments to Sage Environmental on March 21, 2007. A copy of the comments is included in Appendix E. Sage Environmental incorporated all the changes that were required to be used in the modeling and modeling report preparation.
2 Dennis McNally, T. W. Tesche, and George Schewe, Alpine Geophysics, LLC. CENRAP BART Modeling Guidelines. Ft. Wright, Kentucky: December 15, 2005.

Sage Environmental Consulting, L.P. TOTAL Petrochemicals USA, Inc. - PAR April 2007 M:\modeling\30_Total\01_PAR\52_BART\Information\Report_30-01-52.doc
2-1
2 AIR QUALITY MODELING METHODOLOGY
2.1 Model Selection and Features
The California Puff (CALPUFF) air dispersion modeling system selected for this modeling analysis is a multi-layer, multi-species, non-steady state puff dispersion model which can simulate the effects of time- and space-varying meteorological conditions on pollutant transport, transformation, and removal. CALPUFF uses three-dimensional meteorological fields computed by the CALMET meteorological preprocessor. CALPUFF contains algorithms for taking into account near-source effects such as building downwash, transitional plume rise, partial plume penetration, and sub-grid scale terrain interactions as well as longer range effects such as pollutant removal (wet scavenging or dry deposition), chemical transformation, vertical wind shear, and over-water transport. By its puff-based formulation and through the use of three-dimensional meteorological data developed by the CALMET meteorological preprocessor, CALPUFF can simulate the effects of time- and space-varying meteorological conditions on pollutant transport from point, volume, area, and line sources in complex terrain.
Table 2-1 Versions of the Modeling Software
Program Name Version Released CALPUFF 5.711a July 16, 2004 CALPOST 5.51 July 9, 2003 POSTUTIL 1.3 April 2, 2003 Sage Environmental used TCEQ-approved versions of the CALPUFF, CALPOST, and POSTUTIL programs listed in Table 2-1. The programs were obtained from the CALPUFF website3 and were then recompiled as recommended by TCEQ4 to use meteorological data provided by CENRAP. The parameter files for all three programs were modified; the modified file printouts are provided in Appendix C. Sage Environmental used version 2.34.1 of the Professional CalPuff graphical user interface developed by BEE-Line Software to create model input files. Three annual simulations were performed for the years 2001-2003 for each applicable Class I area.
3 Atmospheric Studies Group. “Codes and Related Processors: EPA-Approved Version.” January 16, 2007. http://www.src.com/calpuff/download/p2.htm 4 Texas Commission on Environmental Quality (January 2007). Best Available Retrofit Technology (BART) Modeling Protocol to Determine Sources Subject to BART in the State of Texas, p. 8.
SECTION

Sage Environmental Consulting, L.P. TOTAL Petrochemicals USA, Inc. - PAR April 2007 M:\modeling\30_Total\01_PAR\52_BART\Information\Report_30-01-52.doc
2-2
2.2 Modeling Domain Configuration
CALPUFF modeling requires selection of two modeling domains: the meteorological domain and the computational domain. The meteorological domain is a system of regular-spaced grid points at which meteorological parameters (wind components, mixing heights, etc.) are defined. The meteorological domain is determined by the grid formed in the meteorological preprocessor CALMET. The origin of the meteorological domain is the basic reference frame for all spatial input data to both CALMET and CALPUFF (e.g., coordinates of meteorological stations, sources, and receptors). The computational domain, which is a subset of the meteorological domain, determines the computational area for a CALPUFF run. All sources and receptors must be located within the computational domain.
Figure 2-1 CALPUFF Modeling Domains
The meteorological domain for the BART screening modeling is the complete 6-km CENRAP South region. The computational domain is a subset of the 6-km CENRAP South domain. The computational domain is a rectangle that includes all emission sources, all

Sage Environmental Consulting, L.P. TOTAL Petrochemicals USA, Inc. - PAR April 2007 M:\modeling\30_Total\01_PAR\52_BART\Information\Report_30-01-52.doc
2-3
applicable Class I areas, and a buffer extending at least 50 km in all directions from the boundaries of the refinery and Class I areas. Each grid cell has the size 6 km by 6 km. Figure 2-1 depicts the two domains. The green rectangle in Figure 2-1 is the CENRAP South domain, the blue rectangle is the computational domain, and a red circle with 100 km radius has been drawn around the PAR.
2.3 Meteorological Database
Meteorological files for BART screening analyses were prepared by CENRAP for the years 2001-2003. The files were sent to Sage Environmental from CENRAP on an external hard drive. The files contain data for the whole 6-km CENRAP South domain. Sage Environmental used the CENRAP-provided files for BART screening modeling, and did not run CALMET to develop its own set of meteorological data.
2.4 Receptor Grid
Sage Environmental ran a separate simulation for each Class I area in Table 3-1. The receptors used were the set of Class I area receptors developed by the National Park Service.5 Each simulation included the receptors for a single Class I area.
2.5 CALPUFF Configuration
2.5.1 Sub-grid Scale Complex Terrain
An optional module in CALPUFF, Complex Terrain Sub-grid (CTSG), treats terrain features that are not resolved by the gridded terrain field. This module utilizes calculation routines that are based on the Complex Terrain Dispersion Model (CTDMPlus). Sage Environmental elected to ignore this option by setting the CALPUFF parameter MCTSG to 0 because screening modeling was performed.
2.5.2 Building Downwash
The Huber-Snyder and Schulman-Scire (ISC3) downwash models and the PRIME building downwash algorithm are both incorporated into CALPUFF computation routines. Both algorithms have been implemented in such a way as to allow the use of wind direction-specific building dimensions. The use of downwash algorithms is optional. Since buildings and other solid structures only affect plume dispersion out to approximately 10 building/structure heights downwind of the structure and the nearest Class I area is more than 300 km away from the PAR, Sage Environmental did not include building downwash effects in the modeling analysis.
5 U.S. Department of the Interior. “Class I Receptors.” National Park Service Nature & Science. November 18, 2005. http://www2.nature.nps.gov/air/maps/receptors/index.cfm

Sage Environmental Consulting, L.P. TOTAL Petrochemicals USA, Inc. - PAR April 2007 M:\modeling\30_Total\01_PAR\52_BART\Information\Report_30-01-52.doc
2-4
2.5.3 Dispersion Coefficients
Several options are provided in CALPUFF for the computation of dispersion coefficients, including the use of turbulence measurements (σv and σw), the use of similarity theory to estimate σv and σw from modeled surface heat and momentum fluxes, or the use of Pasquill-Gifford (PG) or McElroy-Pooler (MP) dispersion coefficients, or dispersion equations based on the Complex Terrain Dispersion Model (CTDMPlus). Options are provided to apply an averaging time correction or surface roughness length adjustments to the PG coefficients. Sage Environmental utilized PG dispersion coefficients as the CALPUFF default option for rural type of dispersion by setting the parameter MDISP to 3.
2.5.4 Dry Deposition
A full resistance model is provided in CALPUFF for the computation of dry deposition rates of gases and particulate matter as a function of geophysical parameters, meteorological conditions, and pollutant species. Options are provided to allow user-specified, diurnally varying deposition velocities to be used for one or more pollutants instead of the resistance model (e.g., for sensitivity testing) or to by-pass the dry deposition model completely. For particles, source-specific mass distributions may be provided for use in the resistance model. The modeler included dry deposition effect calculations, as recommended by TCEQ.
2.5.5 Wet Deposition
An empirical scavenging coefficient approach is used in CALPUFF to compute the depletion and wet deposition fluxes due to precipitation scavenging. The scavenging coefficients are specified as a function of the pollutant and precipitation type (i.e., frozen vs. liquid precipitation). Sage Environmental included wet deposition effect calculations, as recommended by TCEQ.
2.5.6 Hourly Ozone Concentration File
Hourly observations of ozone data are used in the calculation of SO2 and NOX transformation rates. The TCEQ developed three OZONE.DAT files, one for each year modeled. Sage Environmental used the TCEQ files for ozone concentration data, and used a constant value of 40 ppb when data were missing in the files. Each of the provided files includes data for three ozone monitoring stations. The stations’ coordinates were Lambert Conformal Conic (LCC) coordinates, but the version of CALPUFF used in the modeling works only with Universal Transverse Mercator (UTM) coordinates. Sage Environmental converted the stations’ coordinates into UTM before running the CALPUFF model. The updated ozone data files are submitted with this report.

Sage Environmental Consulting, L.P. TOTAL Petrochemicals USA, Inc. - PAR April 2007 M:\modeling\30_Total\01_PAR\52_BART\Information\Report_30-01-52.doc
2-5
2.6 CALPOST Configuration
When performing screening modeling for BART, Sage Environmental used the following CALPOST options, consistent with CENRAP recommendations and the TCEQ BART modeling protocol.
• Visibility processing • Method 6 for background light extinction • Sulfate and nitrate species included in computing total light extinction • PM10 and PM2.5 species included in computing total light extinction • Create file of delta-deciview • 24-hour averaging • Maximum visibility impact was compared to the natural visibility conditions
PM10 and PM2.5 were included when computing total light extinction per the comments on the pre-modeling protocol. PM10 and PM2.5 were modeled as coarse and fine particulates, respectively. For the majority of the PAR BART-eligible units, all PM emissions were assumed to be PM2.5.

Sage Environmental Consulting, L.P. TOTAL Petrochemicals USA, Inc. - PAR April 2007 M:\modeling\30_Total\01_PAR\52_BART\Information\Report_30-01-52.doc
3-1
3 MODELING RESULTS
3.1 Relevant Class I Areas
The areas affected by each of the 48 accounts remaining on the BART screening list in December 2006 were identified in the TCEQ BART modeling protocol dated January 22, 2007. Only the Class I areas applicable to the PAR were included when performing site-specific BART screening modeling. The Class I areas for PAR are listed in Table 3-1.6
Table 3-1 Class I Areas Modeled
Abbreviation Area Name State BIBE Big Bend National Park Texas CACR Caney Creek Wilderness Area Arkansas HEGL Hercules-Glades Wilderness Area Missouri MING Mingo Wilderness Area Missouri UPBU Upper Buffalo Wilderness Area Arkansas WIMO Wichita Mountains Wildlife Refuge Oklahoma
3.2 Emission Sources Modeled
Sage Environmental obtained the modeling data ENVIRON International Corporation used for the TCEQ screening study. The data for PAR were extracted from the ENVIRON data and Sage Environmental made a search of sources with non-zero emissions of SO2, NOX, and inhalable particulate matter (PM10). A separate list of sources was obtained from TOTAL, containing sources built between 1962 and 1977. The two lists were compared, and the ten sources listed in Appendix C appeared on both lists. These are the sources that were modeled. TOTAL has verified and corrected the stack parameters that appeared in the ENVIRON data set; the corrected parameters were entered into CALPUFF.
3.3 Results
CALPUFF calculates the specific concentration at each receptor created by each emission source. The CALPOST post-processor was used to obtain visibility effects of specific chemicals for specific averaging periods based on CALPUFF results. For each Class I area, the highest daily change in deciviews (delta-deciview value) was obtained for each year
6 Texas Commission on Environmental Quality (February 2007). BART Exemption Screening Analysis Addendum I.
SECTION

Sage Environmental Consulting, L.P. TOTAL Petrochemicals USA, Inc. - PAR April 2007 M:\modeling\30_Total\01_PAR\52_BART\Information\Report_30-01-52.doc
3-2
modeled. The highest of the three values for each Class I area was then compared to the 0.5 threshold. A summary of the modeling results is presented in Table 3-2.
Table 3-2 Summary of Modeling Results
Maximum Visibility Impact (Delta-Deciviews) Class I Area 2001 2002 2003 Overall Below 0.5? Big Bend National Park 0.001 0.001 0.002 0.002 YES Caney Creek Wilderness Area 0.011 0.017 0.019 0.019 YES Hercules-Glades Wilderness Area 0.006 0.015 0.008 0.015 YES Mingo Wilderness Area 0.004 0.005 0.008 0.008 YES Upper Buffalo Wilderness Area 0.009 0.016 0.009 0.016 YES Wichita Mountains Wildlife Refuge 0.029 0.020 0.009 0.029 YES
PAR did not impact visibility in any of the Class I areas identified by the TCEQ as potentially affected. The highest delta-deciview value is below the 0.5 threshold.

Sage Environmental Consulting, L.P. TOTAL Petrochemicals USA, Inc. - PAR April 2007 M:\modeling\30_Total\01_PAR\52_BART\Information\Report_30-01-52.doc
4-1
4 REFERENCES
Atmospheric Studies Group. “Codes and Related Processors: EPA-Approved Version.” http://www.src.com/calpuff/download/p2.htm. January 16, 2007. Dennis McNally, T. W. Tesche, and George Schewe, Alpine Geophysics, LLC. CENRAP BART Modeling Guidelines. Ft. Wright, Kentucky: December 15, 2005. U.S. Department of the Interior. “Class I Receptors.” National Park Service Nature & Science. http://www2.nature.nps.gov/air/maps/receptors/index.cfm. November 18, 2005. Texas Administrative Code, Title 30, Chapter 116, Subchapter M. January 2006. Texas Commission on Environmental Quality. Best Available Retrofit Technology (BART) Modeling Protocol to Determine Sources Subject to BART in the State of Texas. January 2007. Ralph Morris and Uaporn Nopmongcol. Screening Analysis of Potential BART-Eligible Sources in Texas. September 2006. Texas Commission on Environmental Quality. BART Exemption Screening Analysis Addendum I. December 2006. U.S. EPA. Regional Haze Regulations and Guidelines for Best Available Retrofit Technology (BART) Determinations. Federal Register, 70 (128), Wednesday, July 6, 2005.
SECTION

Sage Environmental Consulting, L.P. TOTAL Petrochemicals USA, Inc. - PAR April 2007 M:\modeling\30_Total\01_PAR\52_BART\Information\Report_30-01-52.doc
APPENDIX A CALPUFF SPECIES DEFINITION FILE

TOTAL Petrochemicals USA, Inc.Port Arthur RefineryPort Arthur, Texas
CALPUFF Species Parameters for Screening BART Modeling
Species Diffusivity Alpha Star Reactivity Meso. Resist. Henry's LawGeo. Mass
Mean DiameterGeometric Standard
DeviationScavenging Coef.
Liquid Precip.Scavenging Coef.
Frozen Precip.(cm2/s) (s/cm) (microns) (microns) (1/s) (1/s)
SO2 0.1509 1000 8 0 0.04 0 0 3.00E-05 0SO4 0 0 0 0 0 0.48 2 1.00E-04 3.00E-05NOX 0.1656 1 8 5 3.5 0 0 0 0HNO3 0.1628 1 18 0 8.00E-08 0 0 6.00E-05 0NO3 0 0 0 0 0 0.48 2 1.00E-04 3.00E-05PM10 0 0 0 0 0 0.48 2 1.00E-04 3.00E-05PM2.5 0 0 0 0 0 0.48 2 1.00E-04 3.00E-05
Note: The PM10 and PM2.5 particle and scavenging parameters are the same per Appendix B of the TCEQ BART Modeling Protocol .
Dry (Gas) Dry (Particle) Wet
Sage Environmental Consulting, L.P.April 2007
TOTAL Petrochemicals USA, Inc. - PAR Species.xls, CALPUFF Species

Sage Environmental Consulting, L.P. TOTAL Petrochemicals USA, Inc. - PAR April 2007 M:\modeling\30_Total\01_PAR\52_BART\Information\Report_30-01-52.doc
APPENDIX B SOURCES MODELED
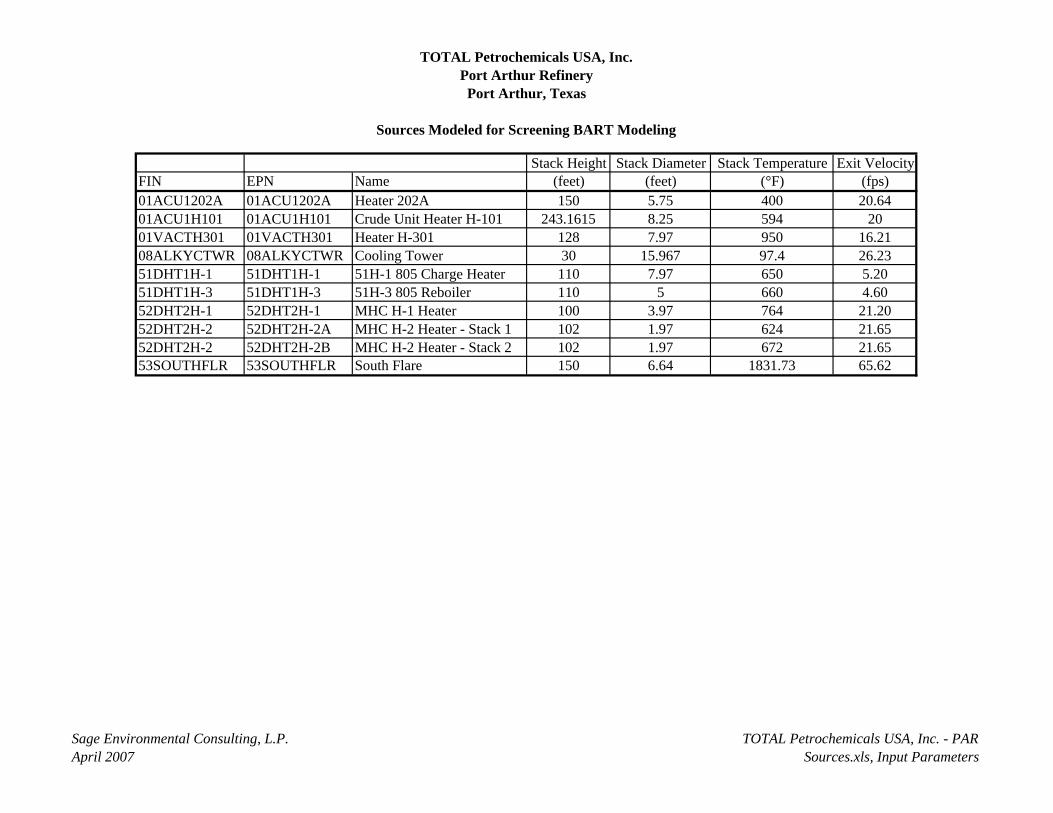
TOTAL Petrochemicals USA, Inc.Port Arthur RefineryPort Arthur, Texas
Sources Modeled for Screening BART Modeling
Stack Height Stack Diameter Stack Temperature Exit VelocityFIN EPN Name (feet) (feet) (°F) (fps)01ACU1202A 01ACU1202A Heater 202A 150 5.75 400 20.6401ACU1H101 01ACU1H101 Crude Unit Heater H-101 243.1615 8.25 594 2001VACTH301 01VACTH301 Heater H-301 128 7.97 950 16.2108ALKYCTWR 08ALKYCTWR Cooling Tower 30 15.967 97.4 26.2351DHT1H-1 51DHT1H-1 51H-1 805 Charge Heater 110 7.97 650 5.2051DHT1H-3 51DHT1H-3 51H-3 805 Reboiler 110 5 660 4.6052DHT2H-1 52DHT2H-1 MHC H-1 Heater 100 3.97 764 21.2052DHT2H-2 52DHT2H-2A MHC H-2 Heater - Stack 1 102 1.97 624 21.6552DHT2H-2 52DHT2H-2B MHC H-2 Heater - Stack 2 102 1.97 672 21.6553SOUTHFLR 53SOUTHFLR South Flare 150 6.64 1831.73 65.62
Sage Environmental Consulting, L.P.April 2007
TOTAL Petrochemicals USA, Inc. - PAR Sources.xls, Input Parameters

TOTAL Petrochemicals USA, Inc.Port Arthur RefineryPort Arthur, Texas
Emission Rates Used for Screening BART Modeling
SO2 Highest Actual Daily Emission Rates (lbs/hr)Source EPN 2001 2002 200301ACU1202A 3.70 2.47 2.3601ACU1H101 2.68 1.83 1.4401VACTH301 2.49 1.43 0.9208ALKYCTWR 0.00 0.00 0.0051DHT1H-1 1.14 0.77 0.5851DHT1H-3 0.86 0.51 0.4752DHT2H-1 0.78 0.56 0.4652DHT2H-2A 0.36 0.29 0.3452DHT2H-2B 0.36 0.29 0.3453SOUTHFLR 0.21 0.21 0.21
H2S CEMS data from Fuel gas DrumH2S CEMS data from Fuel gas DrumH2S CEMS data from Fuel gas Drum
Avg. H2S mole % in fuel gas*flow rate
Emissions Basis
H2S CEMS data from Fuel gas DrumH2S CEMS data from Fuel gas DrumH2S CEMS data from Fuel gas Drum
N/AH2S CEMS data from Fuel gas DrumH2S CEMS data from Fuel gas Drum
Sage Environmental Consulting, L.P.April 2007 Page 1 of 3
TOTAL Petrochemicals USA, Inc. - PAR Sources.xls, Emission Rates

TOTAL Petrochemicals USA, Inc.Port Arthur RefineryPort Arthur, Texas
Emission Rates Used for Screening BART Modeling
NOX Highest actual Daily Emission Rates (lbs/hr)Source EPN 2001 2002 200301ACU1202A 10.32 10.82 11.0401ACU1H101 9.72 10.28 10.7001VACTH301 12.27 12.31 11.4608ALKYCTWR 0.00 0.00 0.0051DHT1H-1 6.07 7.45 7.2851DHT1H-3 2.44 2.39 2.4352DHT2H-1 3.03 3.02 3.2752DHT2H-2A 0.81 0.91 0.9652DHT2H-2B 0.81 0.91 0.9653SOUTHFLR 0.65 0.65 0.65
Permitted NOx Factor lb NOx/MMBtu*Net Heating Value (MMBtu/hr)Permitted NOx Factor lb NOx/MMBtu*Net Heating Value (MMBtu/hr)Permitted NOx Factor lb NOx/MMBtu*Net Heating Value (MMBtu/hr)Permitted NOx Factor lb NOx/MMBtu*Net Heating Value (MMBtu/hr)
Permitted NOx Factor lb NOx/MMBtu*Net Heating Value (MMBtu/hr)N/A
Permitted NOx Factor lb NOx/MMBtu*Net Heating Value (MMBtu/hr)Permitted NOx Factor lb NOx/MMBtu*Net Heating Value (MMBtu/hr)
Permitted NOx Factor lb NOx/MMBtu*Net Heating Value (MMBtu/hr)Permitted NOx Factor lb NOx/MMBtu*Net Heating Value (MMBtu/hr)
Emission Calculation Basis
Sage Environmental Consulting, L.P.April 2007 Page 2 of 3
TOTAL Petrochemicals USA, Inc. - PAR Sources.xls, Emission Rates
TOTAL Petrochemicals USA, Inc.Port Arthur RefineryPort Arthur, Texas
Emission Rates Used for Screening BART Modeling
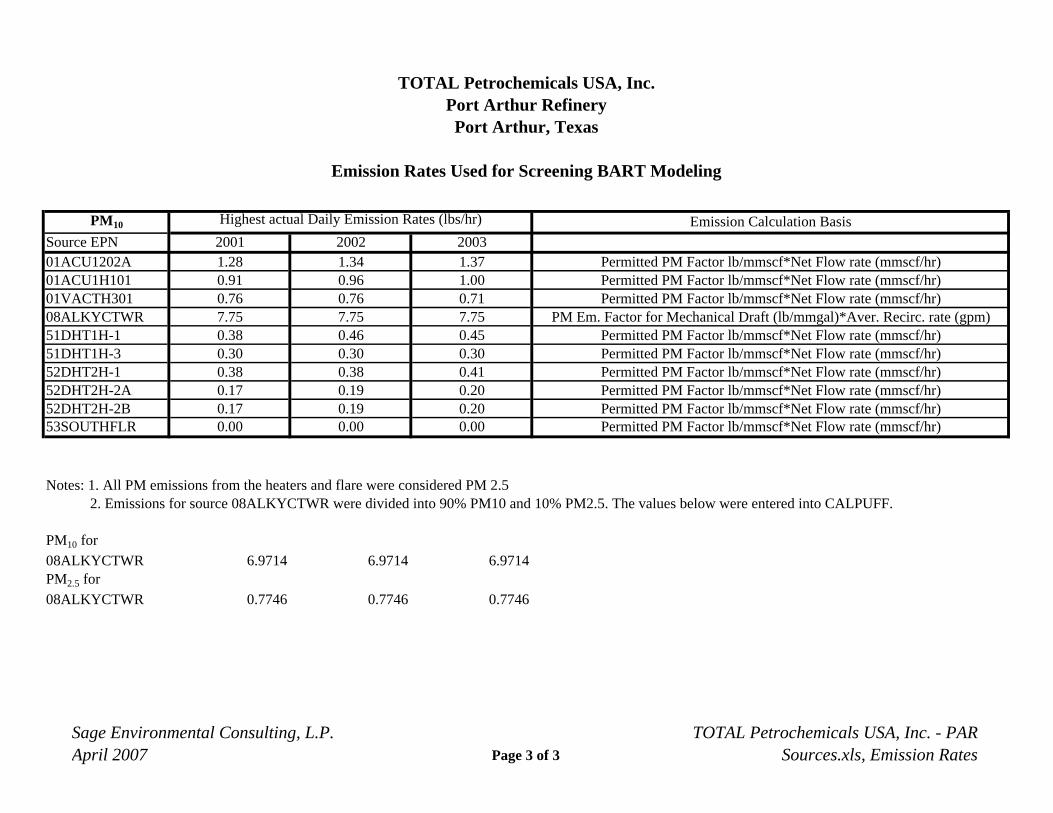
PM10 Highest actual Daily Emission Rates (lbs/hr)Source EPN 2001 2002 200301ACU1202A 1.28 1.34 1.3701ACU1H101 0.91 0.96 1.0001VACTH301 0.76 0.76 0.7108ALKYCTWR 7.75 7.75 7.7551DHT1H-1 0.38 0.46 0.4551DHT1H-3 0.30 0.30 0.3052DHT2H-1 0.38 0.38 0.4152DHT2H-2A 0.17 0.19 0.2052DHT2H-2B 0.17 0.19 0.2053SOUTHFLR 0.00 0.00 0.00
PM10 for08ALKYCTWR 6.9714 6.9714 6.9714PM2.5 for08ALKYCTWR 0.7746 0.7746 0.7746
2. Emissions for source 08ALKYCTWR were divided into 90% PM10 and 10% PM2.5. The values below were entered into CALPUFF.
Permitted PM Factor lb/mmscf*Net Flow rate (mmscf/hr)Permitted PM Factor lb/mmscf*Net Flow rate (mmscf/hr)Permitted PM Factor lb/mmscf*Net Flow rate (mmscf/hr)
Permitted PM Factor lb/mmscf*Net Flow rate (mmscf/hr)Permitted PM Factor lb/mmscf*Net Flow rate (mmscf/hr)Permitted PM Factor lb/mmscf*Net Flow rate (mmscf/hr)
PM Em. Factor for Mechanical Draft (lb/mmgal)*Aver. Recirc. rate (gpm)Permitted PM Factor lb/mmscf*Net Flow rate (mmscf/hr)Permitted PM Factor lb/mmscf*Net Flow rate (mmscf/hr)Permitted PM Factor lb/mmscf*Net Flow rate (mmscf/hr)
Notes: 1. All PM emissions from the heaters and flare were considered PM 2.5
Emission Calculation Basis
Sage Environmental Consulting, L.P.April 2007 Page 3 of 3
TOTAL Petrochemicals USA, Inc. - PAR Sources.xls, Emission Rates

Sage Environmental Consulting, L.P. TOTAL Petrochemicals USA, Inc. - PAR April 2007 M:\modeling\30_Total\01_PAR\52_BART\Information\Report_30-01-52.doc
APPENDIX C PARAMETER FILES FOR CALPUFF, POSTUTIL, AND
CALPOST

Sage Environmental Consulting, L.P. TOTAL Petrochemicals USA, Inc. - PAR April 2007 M:\modeling\30_Total\01_PAR\52_BART\Information\Report_30-01-52.doc
c---------------------------------------------------------------------- c CALPUFF PARAMETERS c---------------------------------------------------------------------- c --- Specify model version character*12 mver, mlevel, mmodel parameter(mver='5.711a',mlevel='040716') parameter(mmodel='CALPUFF') c --- Specify parameters parameter(mxpuff=100000) parameter(mxspec=20) parameter(mxnx=388,mxny=265,mxnz=16) parameter(mxnxg=265,mxnyg=265,mxrec=10000) parameter(mxrfog=40) parameter(mxss=350,mxus=99,mxps=700) parameter(mxpt1=200,mxpt2=200,mxarea=200,mxvert=5) parameter(mxlines=24,mxlngrp=1,mxvol=200) parameter(mxrise=50) parameter(mxpdep=9,mxint=9) parameter(mxoz=725,mxaq=1) parameter(mxhill=20,mxtpts=25,mxrect=1000,mxcntr=21) parameter(mxprfz=50) parameter(mxent=10,mxntr=50,mxnw=5000) parameter(mxvalz=10) parameter(mxcoast=10,mxptcst=5000) parameter(mxbndry=10,mxptbdy=5000) parameter(mxmetdat=366, mxemdat=12) parameter(mxmetsav=2) parameter(mxsg=30) parameter(io3=3,io4=4,io5=1,io6=2,io7=7,io8=8,io9=9) parameter(io10=10,io11=11,io12=12,io15=15,io19=19) parameter(io20=20,io22=22,io23=23,io24=24) parameter(io25=25,io28=28,io29=29,io30=30,io31=31,io32=32) parameter(io35=35,io36=36,io37=37) parameter(iomesg=0) parameter(iox=99) parameter(iopt2=100) parameter(ioar2=iopt2+mxemdat) parameter(iovol=ioar2+mxemdat) c --- Compute derived parameters parameter(mxbc=2*mxnx+2*mxny) parameter(mxnzp1=mxnz+1) parameter(mxvertp1=mxvert+1) parameter(mxnxy=mxnx*mxny) parameter(mxnxyg=mxnxg*mxnyg) parameter(mxgsp=mxnxg*mxnyg*mxspec) parameter(mxrsp=mxrec*mxspec) parameter(mxcsp=mxrect*mxspec) parameter(mx2=2*mxspec,mx5=5*mxspec,mx7=7*mxspec) parameter(mxp2=2+mxspec,mxp3=3+mxspec) parameter(mxp4=4+mxspec,mxp6=6+mxspec) parameter(mxp7=7+mxspec,mxp8=8+mxspec,mxp14=mxspec+14) parameter(mxpuf6=6*mxpuff) parameter(mxlev=mxprfz) parameter(mxprfp1=mxprfz+1) parameter(mxentp1=mxent+1) parameter(mxgrup=mxspec) parameter(mxq12=mxspec*(mxpt1+mxarea)*2) parameter(mxspar=mxspec*mxarea,mxspln=mxspec*mxlines) parameter(mxsppt1=mxspec*mxpt1,mxspvl=mxspec*mxvol) parameter(mxspbc=mxspec*mxbc)

Sage Environmental Consulting, L.P. TOTAL Petrochemicals USA, Inc. - PAR April 2007 M:\modeling\30_Total\01_PAR\52_BART\Information\Report_30-01-52.doc
c --- Specify parameters for sizing GUI parameter(mxavar=1) parameter(mxlvar=1) parameter(mxpvar=1) parameter(mxvvar=1) c --- GENERAL PARAMETER definitions: c MXPUFF - Maximum number of active puffs allowed on the c computational grid at one time c MXSLUG - Maximum number of active slugs allowed on the c computational grid at one time (can be set to c one if the slug option is not used) c MXSPEC - Maximum number of chemical species. N.B.: Changes c to MXSPEC may also require code changes to BLOCK DATA c and READCF. c MXGRUP - Maximum number of Species-Groups. Results for grouped c species are added together and reported using the c name of the group, rather than the name of one of the c species in the group. (MXGRUP = MXSPEC since specie c names are used as group names whenever group names are c not provided) c MXNX - Maximum number of METEOROLOGICAL grid cells in c the X direction c MXNY - Maximum number of METEOROLOGICAL grid cells in c the Y direction c MXNZ - Maximum number of vertical layers in c the METEOROLOGICAL grid c MXNXG - Maximum number of SAMPLING grid cells in c the X direction c MXNYG - Maximum number of SAMPLING grid cells in c the Y direction c MXREC - Maximum number of non-gridded receptors c MXRFOG - Maximum number of distances used when MFOG=1 c NOTE: There are NPT1+NPT2 receptor 'trails', with c MXRFOG receptors on each, so c MXREC >= (NPT1+NPT2)*MXRFOG c MXSS - Maximum number of surface meteorological stations c in the CALMET data c MXUS - Maximum number of upper air stations in the CALMET c data c MXPS - Maximum number of precipitation stations in the c CALMET data c MXBC - Maximum number of sources used to represent boundary c conditions (inlux of background mass); source c segments span the computational domain perimeter c MXPT1 - Maximum number of point sources with constant c emission parameters c MXPT2 - Maximum number of point sources with time-varying c emission parameters c MXAREA - Maximum number of polygon area sources with constant c emission parameters (i.e., non-gridded area sources) c MXVERT - Maximum number of vertices in polygon area source c MXLINES- Maximum number of line sources c MXLNGRP- Maximum number of groups of line sources c MXVOL - Maximum number of volume sources c MXRISE - Maximum number of points in computed plume rise c tabulation for buoyant area and line sources c MXPDEP - Maximum number of particle species dry deposited c MXINT - Maximum number of particle size intervals used c in defining mass-weighted deposition velocities c MXOZ - Maximum number of ozone data stations (for use in the c chemistry module)
Sage Environmental Consulting, L.P. TOTAL Petrochemicals USA, Inc. - PAR April 2007 M:\modeling\30_Total\01_PAR\52_BART\Information\Report_30-01-52.doc
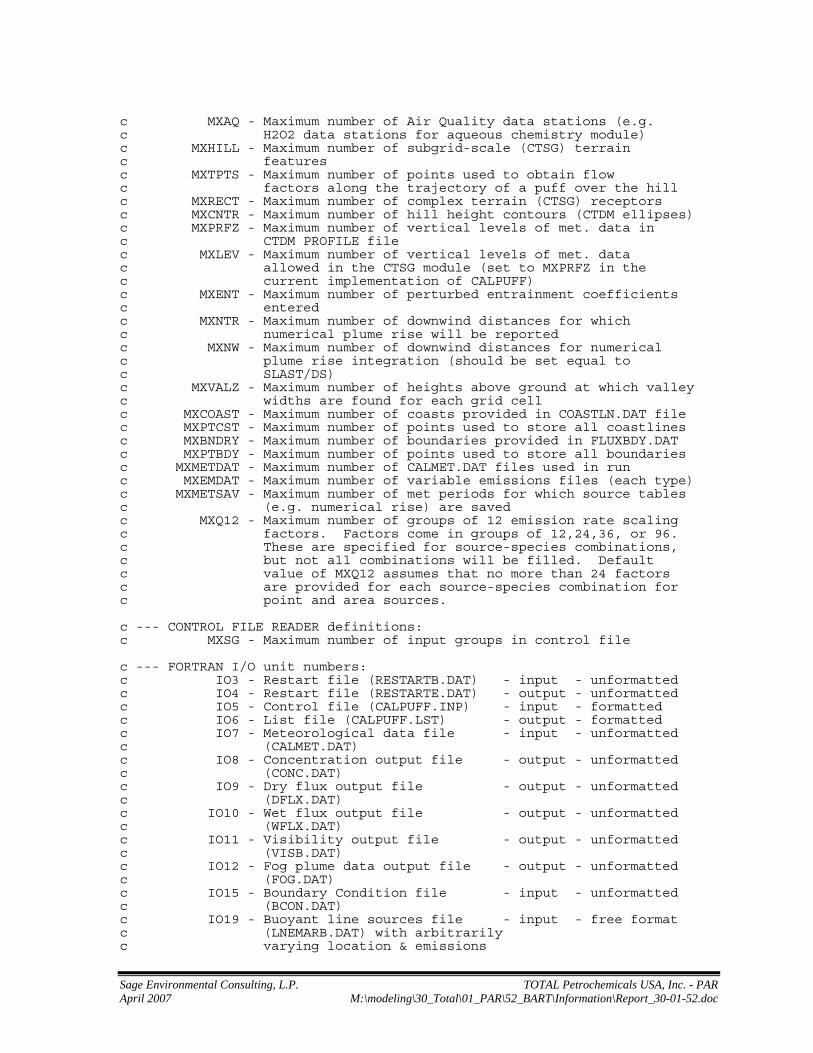
c MXAQ - Maximum number of Air Quality data stations (e.g. c H2O2 data stations for aqueous chemistry module) c MXHILL - Maximum number of subgrid-scale (CTSG) terrain c features c MXTPTS - Maximum number of points used to obtain flow c factors along the trajectory of a puff over the hill c MXRECT - Maximum number of complex terrain (CTSG) receptors c MXCNTR - Maximum number of hill height contours (CTDM ellipses) c MXPRFZ - Maximum number of vertical levels of met. data in c CTDM PROFILE file c MXLEV - Maximum number of vertical levels of met. data c allowed in the CTSG module (set to MXPRFZ in the c current implementation of CALPUFF) c MXENT - Maximum number of perturbed entrainment coefficients c entered c MXNTR - Maximum number of downwind distances for which c numerical plume rise will be reported c MXNW - Maximum number of downwind distances for numerical c plume rise integration (should be set equal to c SLAST/DS) c MXVALZ - Maximum number of heights above ground at which valley c widths are found for each grid cell c MXCOAST - Maximum number of coasts provided in COASTLN.DAT file c MXPTCST - Maximum number of points used to store all coastlines c MXBNDRY - Maximum number of boundaries provided in FLUXBDY.DAT c MXPTBDY - Maximum number of points used to store all boundaries c MXMETDAT - Maximum number of CALMET.DAT files used in run c MXEMDAT - Maximum number of variable emissions files (each type) c MXMETSAV - Maximum number of met periods for which source tables c (e.g. numerical rise) are saved c MXQ12 - Maximum number of groups of 12 emission rate scaling c factors. Factors come in groups of 12,24,36, or 96. c These are specified for source-species combinations, c but not all combinations will be filled. Default c value of MXQ12 assumes that no more than 24 factors c are provided for each source-species combination for c point and area sources. c --- CONTROL FILE READER definitions: c MXSG - Maximum number of input groups in control file c --- FORTRAN I/O unit numbers: c IO3 - Restart file (RESTARTB.DAT) - input - unformatted c IO4 - Restart file (RESTARTE.DAT) - output - unformatted c IO5 - Control file (CALPUFF.INP) - input - formatted c IO6 - List file (CALPUFF.LST) - output - formatted c IO7 - Meteorological data file - input - unformatted c (CALMET.DAT) c IO8 - Concentration output file - output - unformatted c (CONC.DAT) c IO9 - Dry flux output file - output - unformatted c (DFLX.DAT) c IO10 - Wet flux output file - output - unformatted c (WFLX.DAT) c IO11 - Visibility output file - output - unformatted c (VISB.DAT) c IO12 - Fog plume data output file - output - unformatted c (FOG.DAT) c IO15 - Boundary Condition file - input - unformatted c (BCON.DAT) c IO19 - Buoyant line sources file - input - free format c (LNEMARB.DAT) with arbitrarily c varying location & emissions

Sage Environmental Consulting, L.P. TOTAL Petrochemicals USA, Inc. - PAR April 2007 M:\modeling\30_Total\01_PAR\52_BART\Information\Report_30-01-52.doc
c IO20 - User-specified deposition - input - formatted c velocities (VD.DAT) c IO22 - Hourly ozone monitoring data - input - formatted c (OZONE.DAT) c IO23 - Hourly H2O2 monitoring data - input - formatted c (H2O2.DAT) c IO24 - User-specified chemical - input - formatted c transformation rates c (CHEM.DAT) c IO25 - User-specified coast line(s) - input - free format c for sub-grid TIBL module c (COASTLN.DAT) c IO28 - CTSG hill specifications from - input - formatted c CTDM terrain processor c (HILL.DAT) c IO29 - CTSG receptor specifications - input - formatted c from CTDM receptor generator c (RECS.DAT) c IO30 - Tracking puff/slug data - output - formatted c (DEBUG.DAT) c IO31 - CTDM "tower" data - input - formatted c (PROFILE.DAT) c IO32 - CTDM surface layer parameters - input - formatted c (SURFACE.DAT) c IO35 - User-specified boundary lines(s)- input- free format c for mass flux calculations c (FLUXBDY.DAT) c IO36 - Mass flux data - output - formatted c (MASSFLX.DAT) c IO37 - Mass balance data - output - formatted c (MASSBAL.DAT) c IOPT2 - 1st Pt. source emissions file - input - unformatted c (PTEMARB.DAT) with arbitrarily or free fmt c varying point source emissions c IOAR2 - 1st Buoyant area sources file - input - free format c (BAEMARB.DAT) with arbitrarily c varying location & emissions c IOVOL - 1st Volume source file - input - unformatted c (VOLEMARB.DAT) with arbitrarily of free fmt c varying location & emissions c IOMESG - Fortran unit number for screen- output - formatted c output (NOTE: This unit is c NOT opened -- it must be a c preconnected unit to the screen c -- Screen output can be suppressed c by the input "IMESG" in the c control file) c IOX - Fortran unit number for - scratch - formatted c temporary file of "doc" records c written to header of output files c --- GUI memory control parameters: variable emissions scaling factors c for areas, lines, points, and volumes require much memory in GUI. c To reduce GUI memory requirement, set one or more of the c following parameters to ZERO when such scaling is not required. c These parameters have no effect on CALPUFF, but are read by the c GUI at execution time. c MXAVAR - Using scaled area sources? (1:yes, 0:no) c MXLVAR - Using scaled line sources? (1:yes, 0:no) c MXPVAR - Using scaled point sources? (1:yes, 0:no) c MXVVAR - Using scaled volume sources? (1:yes, 0:no)

Sage Environmental Consulting, L.P. TOTAL Petrochemicals USA, Inc. - PAR April 2007 M:\modeling\30_Total\01_PAR\52_BART\Information\Report_30-01-52.doc
c----------------------------------------------------------------------- c POSTUTIL PARAMETERS c----------------------------------------------------------------------- c --- Specify model version character*12 mver, mlevel parameter(mver='1.3',mlevel='030402') c --- Specify application size PARAMETER(mxtpd=24) PARAMETER(mxssg=10) PARAMETER(mxgx=388) PARAMETER(mxgy=265) PARAMETER(mxgrec=mxgx*mxgy) PARAMETER(mxnx=mxgx,mxny=mxgy,mxnxy=mxgrec) PARAMETER(mxdrec=10000) PARAMETER(mxctrec=1000) PARAMETER(mxnz=16,mxspec=20) PARAMETER(mxsplv=mxspec) PARAMETER(mxnzp1=mxnz+1) PARAMETER(mxss=350,mxus=99,mxps=700,mxprfz=50) PARAMETER(mxfile=366) PARAMETER(icols=25) PARAMETER(in1=10,in2=5,in3=9,in4=4) PARAMETER(io7=in4) PARAMETER(io1=7,io2=8,io6=6) PARAMETER(iox=99) parameter(mxsg=3) c----------------------------------------------------------------------- c DEFINITIONS [i]=integer [r]=real [a]=array c----------------------------------------------------------------------- c mxtpd maximum number of time periods (CALPUFF files) [i] c (NOT ACTIVE) c mxssg maximum number of source-species groups [i] c in CALPUFF output files c (NOT ACTIVE) c mxgx maximum number gridded receptors along "x" [i] c mxgy maximum number gridded receptors along "y" [i] c mxgrec product mxgx*mxgy [i] c mxnx maximum number of met grid cells along "x" [i] c mxny maximum number of met grid cells along "y" [i] c mxnxy product mxnx*mxny [i] c mxdrec maximum number of discrete receptors [i] c mxctrec maximum number of complex terrain (CTSG) receptors [i] c mxnz maximum number of levels [i] c mxnzp1 maximum number of levels + 1 [i] c mxspec maximum number of species [i] c mxsplv max number of chemical species * max number levels [i] c mxss maximum number of surface met stations [i] c mxus maximum number of upper air met stations [i] c mxps maximum number of precipitation stations [i] c mxprfz maximum number of levels in vertical profile [i] c mxfile max number of CALPUFF data files processed [i] c icols number of columns in gridded integer output [i] c in1 unit number for input data file (CALPUFF.DAT) [i] c - this is for the first file in the list, the c - subsequent files are incremented from in1 c - MAKE CERTAIN NO OTHER UNIT #s EXCEED in1 c in2 unit number for control file input (POSTUTIL.INP) [i] c in3 unit number for input file of RH data (CALPUFF.VIS) [i] c in4 (io7) unit number for complete met. input file (MET.DAT) [i] c io1 unit number for output list file (POSTUTIL.LST) [i]
Sage Environmental Consulting, L.P. TOTAL Petrochemicals USA, Inc. - PAR April 2007 M:\modeling\30_Total\01_PAR\52_BART\Information\Report_30-01-52.doc
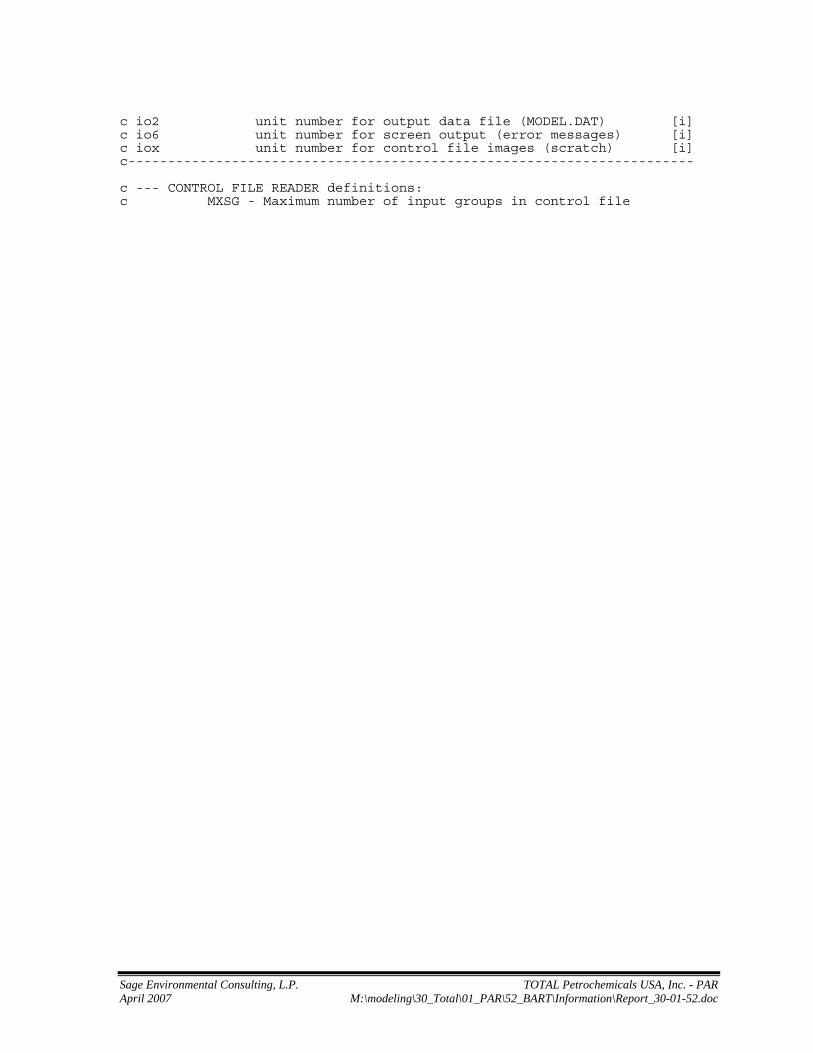
c io2 unit number for output data file (MODEL.DAT) [i] c io6 unit number for screen output (error messages) [i] c iox unit number for control file images (scratch) [i] c----------------------------------------------------------------------- c --- CONTROL FILE READER definitions: c MXSG - Maximum number of input groups in control file

Sage Environmental Consulting, L.P. TOTAL Petrochemicals USA, Inc. - PAR April 2007 M:\modeling\30_Total\01_PAR\52_BART\Information\Report_30-01-52.doc
c----------------------------------------------------------------------- c CALPOST PARAMETERS c----------------------------------------------------------------------- c --- Specify model version character*12 mver, mlevel parameter(mver='5.51',mlevel='030709') c --- Specify application size PARAMETER(mxgx=388) PARAMETER(mxgy=265) PARAMETER(mxgrec=mxgx*mxgy) PARAMETER(mxdrec=10000, mxring=40) PARAMETER(mxctrec=1000) PARAMETER(mxtser=30) PARAMETER(mxnz=1,mxspec=20) PARAMETER(mxsplv=mxnz*mxspec) PARAMETER(mxss=350) PARAMETER(mxwsta=30) PARAMETER(mxday=366) PARAMETER(mxwin=10) PARAMETER(mxrnk=10,mxtop=4) PARAMETER(icols=25) PARAMETER(in1=4,in2=5,in3=9,in4=18,in5=19) PARAMETER(io1=8,io6=6) PARAMETER(iot1=21,iot3=22,iot24=23,iotn=24) PARAMETER(mapu=11) PARAMETER(iox1=12,iox2=13,iox3=14,iox4=15) PARAMETER(iowx1=31,iowx2=32,iohrv=33) parameter(mxsg=4) c----------------------------------------------------------------------- c DEFINITIONS [i]=integer [r]=real [a]=array c----------------------------------------------------------------------- c mxgx maximum number gridded receptors along "x" [i] c mxgy maximum number gridded receptors along "y" [i] c mxgrec product mxgx*mxgy [i] c mxdrec maximum number of discrete receptors [i] c mxring maximum number of discrete receptor "rings" [i] c mxctrec maximum number of complex terrain (CTSG) receptors [i] c mxtser maximum number of receptors in timeseries output [i] c mxnz maximum number of levels [i] c mxspec maximum number of species [i] c mxsplv max number of chemical species * max number levels [i] c mxss max number of surface stations in CALMET/CALPUFF [i] c mxwsta max number of weather stations in VSRN.DAT (DATSAV3)[i] c mxday max number of days in run for violation option [i] c mxwin max number of days in window (for violation search) [i] c mxrnk max rank of top-ranked concentrations [i] c mxtop max number of top-ranked concentrations [i] c icols number of columns in gridded integer output [i] c in1 unit number for "concentration" input file [i] c in2 unit number for control file input [i] c in3 unit number for input file of RH data [i] c in4 unit number for input file of background data [i] c in5 unit number for input file of visual range data [i] c io1 unit number for output list file [i] c io6 unit number for standard output (error messages) [i] c iot1 unit number for timeseries file (1hr avg) [i] c iot3 unit number for timeseries file (3hr avg) [i] c iot24 unit number for timeseries file (24hr avg) [i] c iotn unit number for timeseries file (Nhr avg) [i] c mapu unit number for current plot-file [i]

Sage Environmental Consulting, L.P. TOTAL Petrochemicals USA, Inc. - PAR April 2007 M:\modeling\30_Total\01_PAR\52_BART\Information\Report_30-01-52.doc
c iox1 unit number for scratch file (extinction summary) [i] c iox2 unit number for scratch file (deciview summary) [i] c iox3 unit number for scratch file (run length extinction)[i] c iox4 unit number for scratch file (run length deciview) [i] c iowx1 unit number for scratch file (weather data image 1) [i] c (saved as DEBUG.WX1 when LDEBUG=T) c iowx2 unit number for scratch file (weather data image 2) [i] c (saved as DEBUG.WX2 when LDEBUG=T) c iohrv unit number for hourly visibility calculation [i] c details (saved as DEBUG.HRV when LDEBUG=T) c----------------------------------------------------------------------- c --- CONTROL FILE READER definitions: c MXSG - Maximum number of input groups in control file
Sage Environmental Consulting, L.P. TOTAL Petrochemicals USA, Inc. - PAR April 2007 M:\modeling\30_Total\01_PAR\52_BART\Information\Report_30-01-52.doc
APPENDIX D TCEQ SUBMITTALS
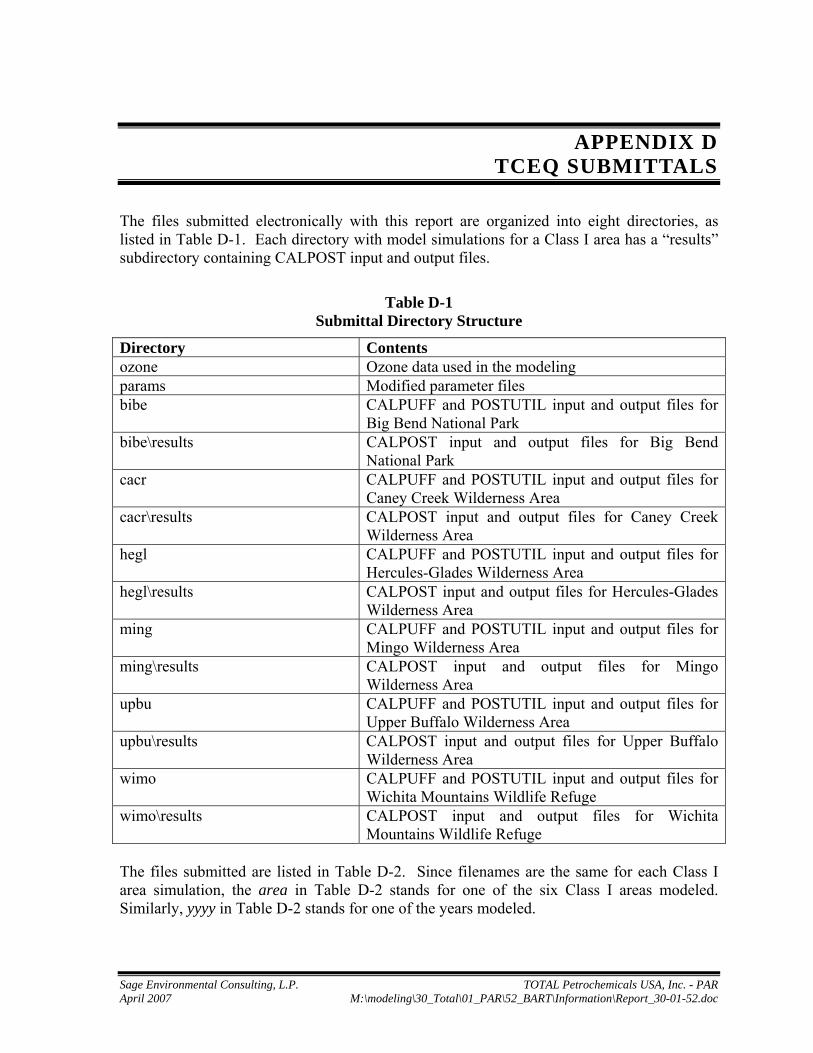
The files submitted electronically with this report are organized into eight directories, as listed in Table D-1. Each directory with model simulations for a Class I area has a “results” subdirectory containing CALPOST input and output files.
Table D-1 Submittal Directory Structure
Directory Contents ozone Ozone data used in the modeling params Modified parameter files bibe CALPUFF and POSTUTIL input and output files for
Big Bend National Park bibe\results CALPOST input and output files for Big Bend
National Park cacr CALPUFF and POSTUTIL input and output files for
Caney Creek Wilderness Area cacr\results CALPOST input and output files for Caney Creek
Wilderness Area hegl CALPUFF and POSTUTIL input and output files for
Hercules-Glades Wilderness Area hegl\results CALPOST input and output files for Hercules-Glades
Wilderness Area ming CALPUFF and POSTUTIL input and output files for
Mingo Wilderness Area ming\results CALPOST input and output files for Mingo
Wilderness Area upbu CALPUFF and POSTUTIL input and output files for
Upper Buffalo Wilderness Area upbu\results CALPOST input and output files for Upper Buffalo
Wilderness Area wimo CALPUFF and POSTUTIL input and output files for
Wichita Mountains Wildlife Refuge wimo\results CALPOST input and output files for Wichita
Mountains Wildlife Refuge The files submitted are listed in Table D-2. Since filenames are the same for each Class I area simulation, the area in Table D-2 stands for one of the six Class I areas modeled. Similarly, yyyy in Table D-2 stands for one of the years modeled.

Sage Environmental Consulting, L.P. TOTAL Petrochemicals USA, Inc. - PAR April 2007 M:\modeling\30_Total\01_PAR\52_BART\Information\Report_30-01-52.doc
Table D-2 Files Submitted With This Report
Filename Directory Contents calpuff_params.txt params CALPUFF parameter file postutil_params.txt params POSTUTIL parameter file calpost_params.txt params CALPOST parameter file ozone_yyyy.dat ozone Ozone data for year yyyy CALPUFFyyyy.INP area CALPUFF input file for year yyyy CALPUFFyyyy.LST area CALPUFF output file for year yyyy CONCyyyy.DAT area CALPUFF concentration data file for year yyyy POSTUTILyyyy.INP area POSTUTIL input file for year yyyy postutilyyyy.lst area POSTUTIL output file for year yyyy postutilconcoutyyyy.dat area POSTUTIL concentration data file for year yyyy CALPOSTyyyy.INP area\results CALPOST input file for year yyyy calpostyyyy.lst area\results CALPOST output file for year yyyy v24vyyyy.DAT area\results CALPOST daily delta-deciview file for year yyyy

Sage Environmental Consulting, L.P. TOTAL Petrochemicals USA, Inc. - PAR April 2007 M:\modeling\30_Total\01_PAR\52_BART\Information\Report_30-01-52.doc
APPENDIX E COMMENTS TO THE PRE-MODELING PROTOCOL

Sage Environmental Consulting, L.P. TOTAL Petrochemicals USA, Inc. - PAR April 2007 M:\modeling\30_Total\01_PAR\52_BART\Information\Report_30-01-52.doc
March 21, 2007 Mr. Igor Shnayder Sage Environmental Consulting, L.P. 1100 Centennial Blvd, Suite 160 Richardson, Texas 75081 Re: BART Screening Modeling Protocol for TOTAL Petrochemicals USA, Inc. Dear Mr. Shnayder: Your modeling protocol document dated March, 2007 has been reviewed by the Texas Commission on Environmental Quality (TCEQ), Air Dispersion Modeling Team. This protocol describes a proposed methodology for a screening CALPUFF BART exemption modeling analysis for the TOTAL Petrochemical USA, Inc. facility located in Port Arthur, Texas. My comments with respect to the submitted modeling protocol document are given below: Project Identification Information Account Number: JE-0005-H Regulated Entity Number: RN102457520 Customer Reference Number: CN600582399 Nearest City, County: Port Arthur, Jefferson County Modeling Protocol Document: Submitted by Sage Environmental Consulting, March 1, 2007. Section 1.5 – Submittals In order to expedite the modeling review, it is preferred that the modeling report be submitted in electronic format as well. Please provide a table listing all the electronic file names and a description of the electronic files. Section 2.1 – Model Selection If the CALPUFF model code is re-complied to use the CENRAP CALMET dataset, please be sure to include the modified parameter files and a description of the re-compilation process followed. Section 2.4 – CALPOST Configuration It is noted in section 3.4 that all particulate emissions will be modeled as PM2.5. Be sure to include PM2.5 with the sulfate and nitrate species when computing total light extinction. Section 3.6 – Air Quality Database The Federal Land Managers (FLMs) and Environmental Protection Agency (EPA) noted their preference for the use of an ozone.dat file. When an ozone.dat file is used, the fixed value (40 ppb in this case) is only used when all data are missing. The TCEQ has created three ozone.dat files (2001,

Sage Environmental Consulting, L.P. TOTAL Petrochemicals USA, Inc. - PAR April 2007 M:\modeling\30_Total\01_PAR\52_BART\Information\Report_30-01-52.doc
2002, and 2003) that may be used in the modeling exercise. These files have been included in a zip file as an attachment to the email that contained these comments. The protocol makes no mention of the source emission rates. Be sure to include a table of modeled emission rates in the modeling report. When documenting the emission rates used in the BART modeling exercise, be sure to explain what the maximum 24-hour actual emissions are based on (e.g., CEM data, permit limits, etc.). Your modeling protocol document is a representation of the methodology that you are proposing for the air dispersion modeling analysis for this project. Any changes or additions to this modeling analysis methodology should be clearly addressed either by a revision to the modeling protocol or in the modeling analysis report. If you have any questions please call me at (512) 239-4342 or write to the Texas Commission on Environmental Quality, Air Permits Division, MC-163, P.O. Box 13087, Austin, Texas 78711-3087. Sincerely, Dan Jamieson Air Permits Division Texas Commission on Environmental Quality