![THERMAL IMAGING GUIDEBOOK - flirmedia.com · THERMAL IMAGING GUIDEBOOK FOR FACILITIES MAINTENANCE. Table of Contents: 1] How thermal imaging cameras work 2 ... and water intrusion](https://static.fdocuments.net/doc/165x107/5b47a1fc7f8b9a252e8b889b/thermal-imaging-guidebook-thermal-imaging-guidebook-for-facilities-maintenance.jpg)
Thermal imaging of slopes and substructures · In this scoping study, the use of thermal imaging...
52
Published Project Report PPR340 Thermal imaging of slopes and substructures D R Carder A Dunford
Transcript of Thermal imaging of slopes and substructures · In this scoping study, the use of thermal imaging...

TRLCrowthorne House, Nine Mile RideWokingham, Berkshire RG40 3GAUnited Kingdom
T: +44 (0) 1344 773131F: +44 (0) 1344 770356E: [email protected]: www.trl.co.uk
ISSN 0968-4093
Price code: 3X
Published by IHSWilloughby Road, BracknellBerkshire RG12 8FBUnited Kingdom
T: +44 (0) 1344 328038F: +44 (0) 1344 328005E: [email protected]: www.uk.ihs.com PP
R3
40
Thermal imaging of slopes and substructures
Infrared thermography is a non destructive testing method that enables large areas to be surveyed quickly, remotely and therefore, in many cases, cost effectively. It is often used to narrow the scope of an investigation by finding potential problems hidden within slopes and structures prior to further investigation using other methods. In this scoping study, the use of thermal imaging was investigated for a range of civil engineering applications to evaluate its potential. Field investigations were undertaken at a highway slope, embankment dams, a masonry arch bridge and a retaining wall. Active thermographic studies, where heat was introduced, were undertaken to detect subsurface defects in concrete, defects in concrete below a waterproofing layer, and to locate under the road heating pipes.
Other recent titles from this subject area
PPR302 Performance of an interseasonal heat transfer facility for collection, storage and re-use of solar heat from the road surface by D R Carder, K J Barker, M G Hewitt, D Ritter, A Kiff, 2008
PPR169 Pollutant removal ability of grassed surface water channels and swales: Literature review and identification of potential monitoring sites by M Escarameia, A J Todd, G R A Watts, 2006
PPR130 Post-incident recovery in highway tunnels - achieving best practice by S Bird, J E Potter,J Gillard, 2006
PPR140 Ventilation during road tunnel emergencies by R C Hall, 2006
PPR082 A study of water movement in road pavements by J M Reid, G I Crabb, J Temporal,M Clark, 2006
Published Project ReportPPR340
Thermal imaging of slopes and substructures
D R CarderA Dunford

Thermal Imaging of Slopes and Substructures
by D R Carder and A Dunford
PPR 340
PUBLISHED PROJECT REPORT


TRL Limited
PUBLISHED PROJECT REPORT PPR 340
THERMAL IMAGING OF SLOPES AND SUBSTRUCTURES Version: Final
by D R Carder and A Dunford (TRL Limited)
Prepared for:Project Record: TRL Reinvestment Programme
Client: N Paulley (TRL Academy)
Copyright TRL Limited March 2008 This report has been prepared for the TRL Academy. The views expressed are those of the authors and not necessarily those of the TRL Academy. Published Project Reports are written primarily for the Client rather than a general audience and are published with the Client’s approval.
Approvals
Project Manager Derek Carder
Quality Reviewed Richard Woodward

This report has been produced by TRL Limited, under a Contract placed by the TRL Academy. Any views expressed are not necessarily those of the Academy. TRL is committed to optimising energy efficiency, reducing waste and promoting recycling and re-use. In support of these environmental goals, this report has been printed on recycled paper, comprising 100% post-consumer waste, manufactured using a TCF (totally chlorine free) process.

TRL Limited PPR 340
CONTENTS
Executive summary i
Abstract 1
1 Introduction 1
2 Background theory 1
3 Previous work 3
3.1 Research at TRL 3 3.2 Research by others 3
3.2.1 Bridge decks and pavements 3 3.2.2 Masonry and concrete structures 4 3.2.3 Tunnels and pipelines 4 3.2.4 Waterways and reservoirs 5
4 Details of infrared camera 6
5 Thermography of slopes and substructures 7
5.1 Clay slope on the M25 7 5.2 Underpass retaining walls on the A331 11 5.3 Masonry arch bridge near Bursledon 14
5.3.1 Western side of arch 15 5.3.2 Eastern side of arch 15 5.3.3 Crown of arch 15 5.3.4 Summary 15
5.4 Embankment reservoirs 19 5.4.1 Reservoir A 19 5.4.2 Reservoir B 24 5.4.3 Reservoir C 26
6 Active thermographic surveys 29
6.1 Identification of subsurface defects in concrete specimens 29 6.2 Identification of surface defects in concrete below a waterproofing layer 32 6.3 Performance of a road heating system 36
7 Summary and recommendations 39
Acknowledgements 40
References 40

TRL Limited i PPR 340
Published Project Report Version: Final
Executive summary Infrared thermography is a non destructive testing method that enables large areas to be surveyed quickly, remotely and therefore, in many cases, cost effectively. It is often used to narrow the scope of an investigation by finding potential problems hidden within slopes and structures prior to further investigation using other methods. In this scoping study, the use of thermal imaging was investigated for a range of civil engineering applications to evaluate its potential.
The study commenced with a review of thermal imaging usage both at TRL and by others. Applications included the identification of defects having different thermal emissivity in bridge decks and pavements, masonry and concrete structures, tunnels and pipelines, waterways and reservoirs. The presence of water, either at surface or near surface, is characterised by temperature differentials which can be detected using thermal imaging techniques. Identification of where these differentials occur is expected to be a valuable tool to engineers in indicating the sources of water ingress so that appropriate remediation can take place.
Investigations using thermography were carried out at a clay slope and a diaphragm retaining wall on the highway network, a masonry arch bridge on the rail network, and various reservoirs. These investigations were generally undertaken on slopes and substructures whose performance was being kept under review by the infrastructure owner for various reasons. Water ingress is the major cause of the deterioration in slope and substructure condition. Currently the condition of slopes and substructures, such as masonry arch bridges and bridge abutments, is monitored by visual inspection. Although hitherto unused, it is suggested that thermal imaging may provide a more systematic method of inspection which is less subjective than that of an engineer.
In addition to these applications, some active thermographic studies were also undertaken where heat was introduced to help accentuate the temperature differentials. In one case, heat was actively introduced to concrete samples to investigate the potential for identifying the locations of subsurface defects. In another case, surface defects in concrete below a waterproofing layer were successfully detected. An investigation was also undertaken of the road surface temperatures above a road heating system. In this particular case the active heating actually comprised normal operation of the system for the winter maintenance of a trial section of road.
In conclusion, the project considered that identification of leakage and seepage of water through embankment dams was worthy of further investigation. In general, it was recommended that thermal imaging was better used in conjunction with other non-destructive techniques or instrumentation to provide a more comprehensive overall picture. Active thermographic studies, where heat is introduced to develop temperature differences, also showed particular merit and could be appropriate for a range of applications where problem-solving was an issue.

TRL Limited 1 PPR 340
Published Project Report Version: Final
Abstract Infrared thermography is a non destructive testing method that enables large areas to be surveyed quickly, remotely and therefore, in many cases, cost effectively. It is often used to narrow the scope of an investigation by finding potential problems hidden within slopes and structures prior to further investigation using other methods. In this scoping study, the use of thermal imaging was investigated for a range of civil engineering applications to evaluate its potential. Field investigations were undertaken at a highway slope, embankment dams, a masonry arch bridge and a retaining wall. Active thermographic studies, where heat was introduced, were undertaken to detect subsurface defects in concrete, defects in concrete below a waterproofing layer, and to locate under the road heating pipes.
1 Introduction Water ingress is the major cause of the deterioration in slope and substructure condition. Currently the condition of slopes and substructures, such as masonry arch bridges and bridge abutments, is monitored by visual inspection. Although hitherto unused, it is suggested that thermal imaging may provide a more systematic method of inspection which is less subjective than that of an engineer.
The presence of water, either at surface or near surface, will be characterised by temperature differentials which can be detected using thermal imaging techniques. Identification of where these differentials occur is expected to be a valuable tool for engineers in indicating the sources of water seepage so that appropriate remediation can take place. For example, this is particularly relevant where drainage pipes have fractured and the fracture remains undetected during normal visual inspections.
Cracking in slopes and voids behind substructures are also important performance indicators in predicting likely behaviour. During the day objects on the surface of the earth absorb infrared radiation from the sun and at night they radiate the heat away. The rates at which objects absorb or dissipate heat tell how conductive they are and also whether cracks/voids are present. A thermal imaging camera is thus able to detect differences in temperature related to cracks and voids.
This research study seeks to determine if the current survey regime for the inspection of slopes and structures can be improved through the use of thermal imaging techniques.
2 Background theory Thermal, or infrared energy, is light that is not visible because its wavelength is too long to be detected by the human eye; it's the part of the electromagnetic spectrum that we perceive as heat. Most materials absorb infrared radiation in a wide range of wave-lengths, which causes an increase in their temperature. In addition, all objects with a temperature greater than absolute zero emit infrared energy, and even glowing objects usually emit far more energy in the infrared than the visible part of the spectrum. The higher the temperature of the surface or object the greater the infrared radiation emitted.
By using infrared imaging cameras which measure the radiated heat from a surface, a visual image can be obtained with different colours representing different radiated temperatures. A difference in temperature may be due to a number of different factors, e.g. structural delamination, build up of water behind the surface, voids or cracks, induced differential heating and many other factors. Different materials have different thermal emissivity values and will therefore emit heat at different rates developing different surface temperatures. Table 1 shows typical emissivity values of some common materials relevant to civil engineering. These values should be used with caution as some may change with temperature. It should be noted that the emissivity is 1 for an ideal black body.

TRL Limited 2 PPR 340
Published Project Report Version: Final
Table 1. Emissivity values of some common materials
Material Emissivity Brick: common .81-.86 Brick: masonry 0.94 Cement: 0.54 Concrete 0.92 Concrete: dry 0.95 Concrete: rough .92-.97 Glass 0.92 Gravel 0.28 Gypsum .085 Iron: heavily rusted .91-.96 Limestone: natural surface 0.96 Mortar 0.87 Mortar: dry 0.94 PVC. .91-.93 Plastic: black 0.95 Plastic: white 0.84 Plywood .83-.98 Sand 0.90 Soil: dry 0.92 Soil: frozen 0.93 Soil: saturated with water 0.95 Styrofoam: insulation 0.60 Water: 0.98 Water: ice, smooth 0.96 Water: frost crystals 0.98 Water: snow 0.85
Infrared thermography is a non destructive testing method that enables large areas to be surveyed quickly, remotely and therefore, in many cases, cost effectively. It is often used to narrow the scope of an investigation by finding potential problems hidden within structures prior to further investigation using other methods. In some cases thermal imaging of near surfaces may be enhanced by the deliberate introduction of either heat to selected members or water to accentuate temperature differences and thus the identification of defects or different emissive zones.
It should be noted that thermography offers a good qualitative determination of the temperature of a surface; however absolute temperature measurement is problematic. This depends on many variables, such as the temperature of the surrounding materials, the atmospheric temperature, the weather, the object properties (i.e. the rate of conductivity, convection and the thermal heat capacity), and the absorption of infrared radiation. Other practical considerations making determination of absolute temperatures difficult include:
• the apparent temperature will depend on the angle of viewing. The calibration of the camera assumes a perpendicular view, and in the colour images this results in an apparent decrease in temperature as the angle of viewing moves further from the perpendicular, i.e. generally more distant from the camera.
• infrared does not transmit through water so the accuracy of the temperature readings will be affected in these instances.

TRL Limited 3 PPR 340
Published Project Report Version: Final
3 Previous work Previous studies using infrared thermography have been undertaken both by TRL and others. These are now briefly reviewed.
3.1 Research at TRL
Clark and Forde (2003) reported on the use of thermal imaging for the assessment of masonry arch bridges. This followed earlier work at the University of Edinburgh by Clark, McCann and Forde (2003) where the non-destructive testing of both concrete and masonry bridges was considered. A survey was undertaken on one span of a nine-span bridge on the M1 motorway in Northamptonshire. This involved using an infrared camera to record the temperature of the underside of the bridge deck, looking along the length of the span. Surface temperature anomalies were sought to show areas of potential delamination. The survey showed up known areas of concrete delamination and also identified two further areas of delamination which were confirmed by “tap” testing.
The authors also reported an infrared survey of Kilbucho bridge in Scotland, which is a masonry arch structure. The local land around the bridge is prone to localised flooding and the bridge can sometimes be submerged by water. The survey was undertaken to identify possible areas of defects, such as the presence of moisture in the fill of the masonry arch bridge. Two possible areas where water might exist in the fill were identified; however the study was not conclusive because of the adverse weather on site which was windy, rainy, cold and overcast. These are not the ideal conditions for an infrared thermographic survey, as the bridge would almost be in thermal equilibrium.
3.2 Research by others
Infrared thermography has been used in many applications ranging from medical science, fire fighting, surveillance, military use, moisture content and energy losses in buildings, to mechanical engineering; in this report the focus has been on civil engineering applications only. Some of the particular topic areas which have received attention in geotechnical and structural applications are as follows.
3.2.1 Bridge decks and pavements
Stimolo (2003) carried out passive thermography as a non-destructive investigation of hidden defects or damage in the road or bridge pavement structure. He found that such defects were detected as zones with an elevated temperature compared to the surrounding surface (i.e. a high temperature signature reveals a subsurface discontinuity). Therefore blisters, cavities and delaminations can often be detected with the infrared thermography. The author appeared to have been particularly successful in detecting blisters under the sealing membranes for concrete bridge decks. A test method for detecting delamination in bridge decks using infrared thermography is given in ASTM D4788 (1997). This test method is intended for use on exposed and overlaid concrete bridge decks.
Active methods of heating or introducing water into structural materials have also been widely used in recent years. Methods of this type help in emphasising defects or voids in materials because emissivity effects then cause more pronounced temperature differences for detection by the thermal imaging. For example Tanaka et al (2006) used active infrared thermography to detect concrete spalling by heating the surface of the concrete using irradiation devices, such as halogen lamps, xenon arc lamps and far-infrared irradiation devices. Specimens with artificial voids were prepared for active infrared thermography using a xenon arc lamp and subjected to a laboratory test. A field test carried out on an actual viaduct to prove the effectiveness of the technique confirmed that active infrared thermography could detect concrete spalling accurately.

TRL Limited 4 PPR 340
Published Project Report Version: Final
Infrared thermographic is also suitable for investigating near surface defects in fibre reinforced polymer (FRP) composites which are increasingly being used for lightweight bridge decks to carry pedestrian and light traffic. Hing et al (2007) presented the results from an experimental study that investigated subsurface defect detection by casting FRP sections with embedded subsurface defects of varying sizes. These decks were tested using active infrared thermography under the influence of several heating sources including a quartz heater, heating blanket and solar radiation. In the solar radiation test, surface temperature differences between defective and intact areas were up to 4 °C during the day, whilst at night the differences were less than 0.5 °C.
In active infrared thermography, where thermal stimulation is being used to generate relevant thermal contrasts, pulse heating is one of the most common stimulation techniques. Ziadi et al (2003) investigated modifications to the pulse heating shape to generate higher thermal contrasts. In fact, it was found that ideally, it is better to use two pulses separated by a short time interval.
Although not directly related to this project on substructures and slopes, it is worth noting that significant work has been carried out in the USA on the thermography of hot-mix asphalt roads. Although designed to last 15 years, many suffered premature failure due to potholes, cracks, ravelling and other problems. Typical of the research on the topic is that of Phillips et al (2003), infrared thermography helped confirm that a major cause of premature failure stems from temperature differentials within the hot-mix during its laying. For example clumps of crusted material that went through the paving machine without substantial remixing were relatively cooler than the bulk of the material and therefore stiffer and more resistant to compaction. As a result these areas were relatively porous and filled with air voids, less dense, and less resistant to wear and degradation by traffic.
It is also currently considered that vehicle mounted, thermal imaging cameras may have potential for surveying both flexible and rigid pavements. Under the right conditions, infrared thermography can yield superior results and allow the identification of tiny cracks about 1 mm in width, which are virtually impossible to detect with conventional cameras.
3.2.2 Masonry and concrete structures
The detection of defects and delamination in concrete bridge decks and pavements has been discussed in Section 3.2.1. Similar techniques have also been employed for a range of structures to attempt to detect cracking and flaws in concrete which are not easily detected by visual inspection.
Goddin (2006) also discusses the use of active infra-red thermographic imaging to detect voids and delamination in concrete. For this purpose, thermal heating units were used to pre-heat specially manufactured concrete specimens with various defects. Their findings were compared with those from passive thermography. Some further details of this study are given in Section 7.1.
Detection of flaws and routes for the ingress of water in masonry arch bridges has also received considerable attention from TRL and the University of Edinburgh (see Section 3.1) and others.
3.2.3 Tunnels and pipelines
Surveying pipelines carrying water and petroleum products with ultra-violet, visible, near and long wave infra-red for leak detection is not a new technique and has been tested with varying degrees of success. Water, for example, that has saturated the surrounding earth around a leaking pipe will in some cases provide a significant temperature difference to surrounding dry earth. On a warm day, the temperature contrast or differential will be greater and under these ideal conditions a high specification thermal imager will record the differences.
Voids in the surrounding soil may also be created by washout due to water or fluid leakage/flow. Weil (1984) carried out an investigation to detect sewer voids by using infrared thermography. The author concluded that (i) voids around sewer systems could be detected due to temperature differentials that existed between various materials and cavities, and (ii) wet and dry voids could be differentiated.

TRL Limited 5 PPR 340
Published Project Report Version: Final
More recently in Sweden, Ljungberg (1994) used a short-wave infrared system to evaluate the inside condition of waste water pipe and water leaking into the pipe.
A thermographic survey of a railway tunnel is reported by Clark, McCann and Forde (2001). The railway tunnel was constructed from pre-cast reinforced concrete segments. Each ring comprised six segments forming a tunnel with an internal diameter of 3.7m. Various warm and cold areas were found within the concrete tunnel lining and the cold spots seemed to be associated with water seepage. Some of the warm spots were associated with metal objects found on the lining such as metal plates, lights and cables. There were limitations on the number of rings that could be investigated because of the physical constraint of the tunnel dimensions which made it impossible to position the camera far enough away from the tunnel lining to view more than one segment at any one time.
The International Tunnelling Association Working Group (Haack et al, 1995) reported on the state-of-the-art of non-destructive testing in tunnels. Infrared thermography was one of the techniques reviewed and it appeared to be advantageous for the detection of cavities and moist patches, cracks, etc. at high speed. For this purpose, the thermal imaging is carried out by a scanner mounted in the front of the moving vehicle (e.g. a railway wagon). Typical resolutions of 1cm2 seemed achievable at speeds of 4km/h. In tunnels that have been investigated using infrared thermography moist patches in the tunnel, as well as water seepage behind the tunnel shell, have been mainly identified. The technology is valuable for rapidly establishing the basis for visual inspections, as well as for a rapid report on the water inflows in tunnels with water-tightness problems. For identifying deep structure anomalies, however, thermal imaging is a less obvious choice than other non-destructive techniques.
Thermography has also be used in manufacturing and installation for checking the welds and casings of pipelines used in the petrochemical industry for cracks that could cause leaks.
3.2.4 Waterways and reservoirs Remote thermal imaging has been used with success for the detection of leaks from canals and waterways. Typical of the findings are those of Nells (1982) and Pickerill and Malthus (1998) who obtained the images during airborne flyovers of canals and rural aqueducts. Huang and Fipps (2002) carried out remote detection of leaks during a canal flyover. Potential canal leakage was identified at 45 sites, 11 of these sites were inspected and 10 had leakage problems. Although these leaks could have been identified by walk-over surveys, their remote detection was considered advantageous in minimising engineering staff time.
The measurement of the distribution of temperature within an embankment dam and the changes that occur seasonally can give information on seepage through or below the dam and the existence of any leakage paths. Charles et al (1996) reported that infrared thermography can be used to obtain a complete picture of the surface temperature of the downstream slope of a dam and may help in identifying wet areas. However surface temperatures are sensitive to a large number of variables such as incident solar radiation, the materials/soils used for dam construction, vegetative cover, cooling/heating effects from wind and rain. Better interpretation of slope behaviour is obtained if the thermographic surveys of slope temperatures are used in conjunction with subsurface temperature measurements from temperature sensors or optical fibres.

TRL Limited 6 PPR 340
Published Project Report Version: Final
4 Details of infrared camera The infrared camera used for these studies was a Jade 3 (Industrielle GEMINI BB F/3 InSb) camera produced by Cedip Infrared Systems. The spectral range of the instrument, which incorporated a broadband detector, was 2.5 to 5.1µm (i.e. middle infrared). The camera incorporates cooling technology and has a maximum sensitivity of 0.025oC. Although longer wavelength cameras, which operate on different principles, may be more capable of detecting very low temperature differences their sensitivity may not be as good and is of the order of 0.1oC.
In normal operation the camera is mounted on its tilting stage on a tripod. Connection to a PC enables selection of parameters, storage of the images obtained and post-processing of the images.

TRL Limited 7 PPR 340
Published Project Report Version: Final
5 Thermography of slopes and substructures Investigations using thermography were carried at a clay slope and a diaphragm retaining wall on the highway network, a masonry arch bridge on the rail network, and various reservoirs. These investigations were generally undertaken on slopes and substructures whose performance was being kept under review by the infrastructure owner for various reasons.
5.1 Clay slope on the M25
In December 2000 during one of the wettest winters recorded in the UK, a 200m long failure of a Gault Clay cutting slope occurred near Junction 6 of the M25. The deep-seated failure extended from a steep backscarp about 80m up the slope to the motorway hard shoulder, which suffered a heave of 150mm. The technique selected for remediation of the slope was that of a single row of reinforced concrete bored piles and TRL was commissioned by the Highways Agency to carry out slope and pile monitoring during and after remediation (Carder and Barker, 2005).
Although the monitoring demonstrated that the part of the slope in the proximity of the row of piles was satisfactorily stabilised, lateral movements of the ground measured about 20m upslope from the line of piles continued to move progressively in response to any persistent and heavy rainfall. These movements measured using an inclinometer system are reported by Carder and Barker (2005) and are reproduced in Figure 5.1.
-40 -30 -20 -10 0
140
145
150
155
160
Lateral movement (mm)
Leve
l (m
AO
D)
01-11-2001
15-11-2001
17-01-2002
10-04-2002
24-07-2002
26-11-2002
08-01-2003
24-12-2003
Datum: 16-10-2001
Movement downslopeis negative
Figure 5.1. Development of subsurface movements 20m upslope of the pile line
Also areas of the slope to both sides of the remediated section were continuing to show movement and were being extensively monitored by others. For these reasons, this slope was considered appropriate for scoping with the thermal imaging camera. With unstable clay slopes such as this, softening of the clay on the failure plane might be anticipated and for this reason where the plane intersects the slope surface may appear as a softened and wetter zone. It is this wetter zone which might be discernible using thermal imagining techniques.

TRL Limited 8 PPR 340
Published Project Report Version: Final
The thermal imaging was carried out on 2nd April 2007 after a dry spell of about a week which followed an earlier prolonged period of wet weather. Figure 5.2 shows digital and thermal images obtained from Flower Lane bridge. The thermal images were taken by mounting the camera on a tripod and taking a video whilst rotating the camera over the required range. The composite picture shown in Figure 5.2 was then obtained by selection of particular frames from the video. The three thermal images are actually the same image processed in colour, black and white, and black and white using a sharpening filter. The manhole rings visible in all the images formed the protection for inclinometers and other instrumentation monitoring the movement of the slope.
The four manholes in the foreground are above four of the bored piles in the single row of piles. It is therefore 20m upslope of the piles at the fenced off manhole that subsurface movement measurements by inclinometer are still showing slope movements at the surface and on various planes up to about 9m depth (Carder and Barker, 2005). It is therefore between the pile line and 20m upslope of it that these planes might be emerging from the slope surface and perhaps discernible by thermal imaging.
Close examination of the images in Figure 5.2 showed the following points:-
• footways and tracks across the field are clearly recognisable as areas of slightly higher temperature;
• higher up the slope and to the left of each thermal image, the temperature of the slope is apparently colder and could be associated with a wet unstable zone, although this may be a distance effect when using the thermal imaging camera rather than being real;
• areas of longer grass generally show up as being slightly colder;
• changes in the contour of the ground are also detectable due to different exposure to the sun.
The initial survey was useful and although not yielding a definitive result served to indicate the complexity of thermal imaging surveys of this type. It was concluded that the site would be worth re-visiting and the best time to do this would be on an overcast day following a period of prolonged heavy rainfall, i.e. probably early next winter.
In addition to the study from Flower Lane bridge, similar information was obtained by moving to Tandridge Hill Lane bridge. These data are shown in Figure 5.3 and once again the digital photography can be compared with the thermal images. In this case the view was then from the eastern side of the same slope. Once again the locations of the monitoring stations are apparent. Similar findings were obtained with changes in contour of the slope being particularly noticeable in the thermal imaging. Generally inclines were characterised by lower temperatures at their base, possibly because of either surface water accumulation, increased grass growth in this region, or emergence of subsurface water.

TRL Limited 9 PPR 340
Published Project Report Version: Final
Figure 5.2. Images of clay slope near Junction 6 M25 taken from Flower Lane bridge

TRL Limited 10 PPR 340
Published Project Report Version: Final
Figure 5.3. Images of clay slope near Junction 6 M25 taken from Tandridge Hill Lane bridge

TRL Limited 11 PPR 340
Published Project Report Version: Final
5.2 Underpass retaining walls on the A331
Field instrumentation and monitoring were carried out by TRL to establish the behaviour of the T-shaped diaphragm walls founded in over-consolidated clay during the construction of Aldershot Road Underpass (A331 Blackwater Valley Route) in 1995/96. Following the end of construction, monitoring was continued up until March 1998 (Carder et al, 1997; Carder and Darley, 1998). Measurements were resumed in 2002 as part of the principal inspection of the structure, which was due six years after its construction (Carder et al, 2004).
One of the concerns of Surrey County Council was the water staining of the acoustic block cladding which was fixed in front of (but not in contact with) the diaphragm walls panels. For this reason the site was selected for an initial scoping using the thermal imaging camera and this was carried out on 2nd April 2007.
Figure 5.4 shows a digital photograph of the cladding and the same area displayed using thermography. In Figure 5.4, it should be noted that the thermal images on the left are the same shot but displayed using different processing settings (including black and white imaging). Likewise the images on the right are also obtained from the same shot.
The vertical strips on all images, which occur over the full wall height at the location of every fourth parapet post, are actually related to a recess constructed to accommodate a movement joint within the cladding arrangement. Although these recesses were not readily apparent at the time of construction, some build-up of grime and hence some moisture has meant that they are now clearly visible by both normal and thermal imaging cameras.
Perhaps of more technical importance is the localised area of low temperature towards the bottom of the cladding associated with dampness where water has infiltrated through the cladding seeping onto the hard shoulder. This wet area of cladding shows up on the digital photograph and is slightly more distinctive on the thermal images.
Concerns that this water was the consequence of seepage through the joint between adjacent diaphragm panels forming the structural wall were allayed by close inspection of the construction

TRL
Lim
ited
12
PPR
340
Publ
ishe
d Pr
ojec
t Rep
ort
V
ersi
on:
Fina
l
Figu
re 5
.4. T
herm
al im
agin
g of
the
clad
ding
at A
lder
shot
R
oad
Und
erpa
ss

TRL Limited 13 PPR 340
Published Project Report Version: Final
Figure 5.5. Section showing construction detail near to crash barrier
detail in the region (see Figure 5.5). This shows that the top of the concrete infill between the diaphragm wall and acoustic blocks was shaped to form a drainage channel at 1.375m above the acoustic barrier. The location of this drainage channel corresponds with that of the water seepage through the acoustic blocks.
It was therefore concluded that the seepage was probably caused by the build-up of fines or debris causing a blockage in the drainage channel restricting the passage of water and resulting in seepage of overflow water through the cladding. Whilst this problem has no structural implication for stability, it is clearly not desirable in terms of visual acceptability. If so desired Surrey CC could consider removing one of the acoustic blocks to remove the obstruction, however as a similar effect is visible at other locations the overall costs of the operations would need to be considered.

TRL Limited 14 PPR 340
Published Project Report Version: Final
5.3 Masonry arch bridge near Bursledon
The last annual visual inspection of the brick arch bridge between Hamble and Bursledon stations was carried out by Atkins for Network Rail on 25th April 2006. The bridge has a span of 3.35m, a width of 9.02m and a height of 3.12m and is used for pedestrian traffic beneath the railway line to Coppice Lane. The annual inspection identified that the bridge condition was fair, although considerable water staining from seepage is evident on the arch and there is a transverse fracture to the western (London end) haunch1 which was 4.4m long and open to 1mm.
A photograph of the bridge is shown in Figure 5.6.
Figure 5.6. General view of the brick arch
TRL visited the site, by courtesy of Network Rail, with the infrared camera on 29th August 2007 and the details of the last annual inspection were confirmed. The TRL investigation was carried out in three main stages:-
• Three vertical profiles of images were taken on the western side of the arch so that each formed a continuous view from springing to crown. These profiles were located at arbitrary separations in order to examine the main features.
• One vertical profile of images was taken on the eastern side of the arch where significant water staining was apparent.
• General shots were taken through the bridge from both ends and also of the north portal. The south portal was in strong sunlight and deemed not suitable for thermal imaging at this time.
In all cases the thermal images were compared with photographs taken by digital camera.
1 The haunch is defined as the part of the arch between the springing, where the end of the arch meets the abutment, and the crown of the arch.

TRL Limited 15 PPR 340
Published Project Report Version: Final
5.3.1 Western side of arch Optical and thermal images taken of the western side of the arch are shown in Figure 5.7. The black and white thermal images are identical to the colour images alongside of them apart from the fact that colour has been introduced in the post-processing. In this particular profile the transverse fracture detected by Network Rail’s visual inspection is highlighted in the upper part of the images. Water seepage through this minor fracture can be seen in the optical image, and its presence is confirmed quite clearly by the lower temperatures measured in the thermal images2. The extent of the colder area around this crack is also larger in the thermal images than can be observed in the optical images, i.e. by visual inspection. More generally in Figure 5.7, it is noticeable that areas of brick show as colder zones where there is no build-up of calciferous deposit due to prolonged water staining.
In addition to the vertical profile of images shown in Figure 5.7, two other profiles were also recorded. These showed no particular features of interest, so are not therefore presented in this report.
5.3.2 Eastern side of arch Figure 5.8 shows the various images obtained in one area on the eastern side of the arch. At this location, a thin concrete screed had been used as a temporary repair to the brick facing and this screed is starting to deteriorate with some cracking and evidence of water seepage. These features show up reasonably clearly in the optical photograph and are of slightly larger extent and perhaps better defined in the thermal images.
In Figure 5.8 two small regions have been indicated where some water staining is visually evident and investigation by thermal imaging suggests that the zones of colder temperatures associated with these areas are more significant than can be detected by eye.
5.3.3 Crown of arch During the course of the thermographic survey, it became evident that there was a localised area towards the crown of the arch which was colder than its surrounds. This area is marked on the optical photographs in Figure 5.9, although by visual inspection it would not have been identifiable. However, the thermal imaging clearly shows that one particular brick is much colder which could be explained if the brick was of different manufacture and porosity than the others. A thin line emerges from the brick associated with a fine crack and related water staining. This is readily discernible by thermal imaging, but not so by visual inspection.
5.3.4 Summary The technique of thermal imaging showed some merit for assessment of this class of structure in so far as (i) the zones of cold temperature around areas of water ingress or cracks were generally slightly greater than evident from a visual inspection (ii) at one location near the crown of the arch fine cracking near one brick was located which was not readily evident from visual inspection.
2 Darker area in the black and white images; dark blue area in the colour images.

TRL
Lim
ited
16
PPR
340
Publ
ishe
d Pr
ojec
t Rep
ort
V
ersi
on:
Fina
l
Figu
re 5
.7. O
ptic
al a
nd th
erm
al im
ages
of t
he w
este
rn si
de o
f the
arc
h
Tem
pera
ture
sc
ale
Tem
pera
ture
sc
ale

TRL
Lim
ited
17
PPR
340
Publ
ishe
d Pr
ojec
t Rep
ort
V
ersi
on:
Fina
l
Figu
re 5
.8. O
ptic
al a
nd th
erm
al im
ages
of t
he e
aste
rn si
de o
f the
arc
h
Tem
pera
ture
sc
ale
Tem
pera
ture
sc
ale

TRL
Lim
ited
18
PPR
340
Publ
ishe
d Pr
ojec
t Rep
ort
V
ersi
on:
Fina
l
Figu
re 5
.9. I
dent
ifica
tion
of c
old
(wet
) spo
t ass
ocia
ted
with
one
bri
ck
Tem
pera
ture
sc
ale
Tem
pera
ture
sc
ale
TRL Limited 19 PPR 340
Published Project Report Version: Final
5.4 Embankment reservoirs
A number of reservoirs, where water seepage or leakage was suspected, were investigated. These are now considered.
5.4.1 Reservoir A
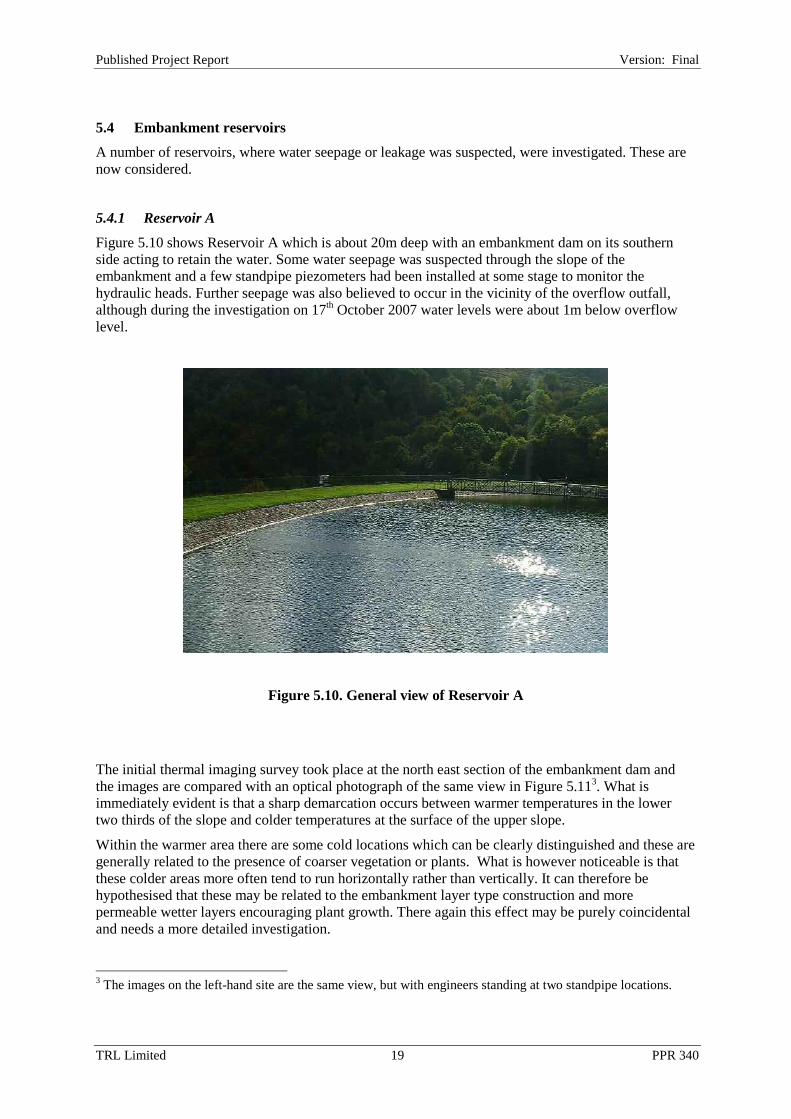
Figure 5.10 shows Reservoir A which is about 20m deep with an embankment dam on its southern side acting to retain the water. Some water seepage was suspected through the slope of the embankment and a few standpipe piezometers had been installed at some stage to monitor the hydraulic heads. Further seepage was also believed to occur in the vicinity of the overflow outfall, although during the investigation on 17th October 2007 water levels were about 1m below overflow level.
Figure 5.10. General view of Reservoir A
The initial thermal imaging survey took place at the north east section of the embankment dam and the images are compared with an optical photograph of the same view in Figure 5.113. What is immediately evident is that a sharp demarcation occurs between warmer temperatures in the lower two thirds of the slope and colder temperatures at the surface of the upper slope.
Within the warmer area there are some cold locations which can be clearly distinguished and these are generally related to the presence of coarser vegetation or plants. What is however noticeable is that these colder areas more often tend to run horizontally rather than vertically. It can therefore be hypothesised that these may be related to the embankment layer type construction and more permeable wetter layers encouraging plant growth. There again this effect may be purely coincidental and needs a more detailed investigation.
3 The images on the left-hand site are the same view, but with engineers standing at two standpipe locations.

TRL
Lim
ited
20
PPR
340
Publ
ishe
d Pr
ojec
t Rep
ort
V
ersi
on:
Fina
l
Sh
owin
g en
gine
ers s
tand
ing
at p
iezo
met
er lo
catio
ns
Figu
re 5
.11.
Opt
ical
and
ther
mal
imag
es o
f the
nor
th e
ast s
ectio
n of
the
emba
nkm
ent d
am
TRL Limited 21 PPR 340
Published Project Report Version: Final
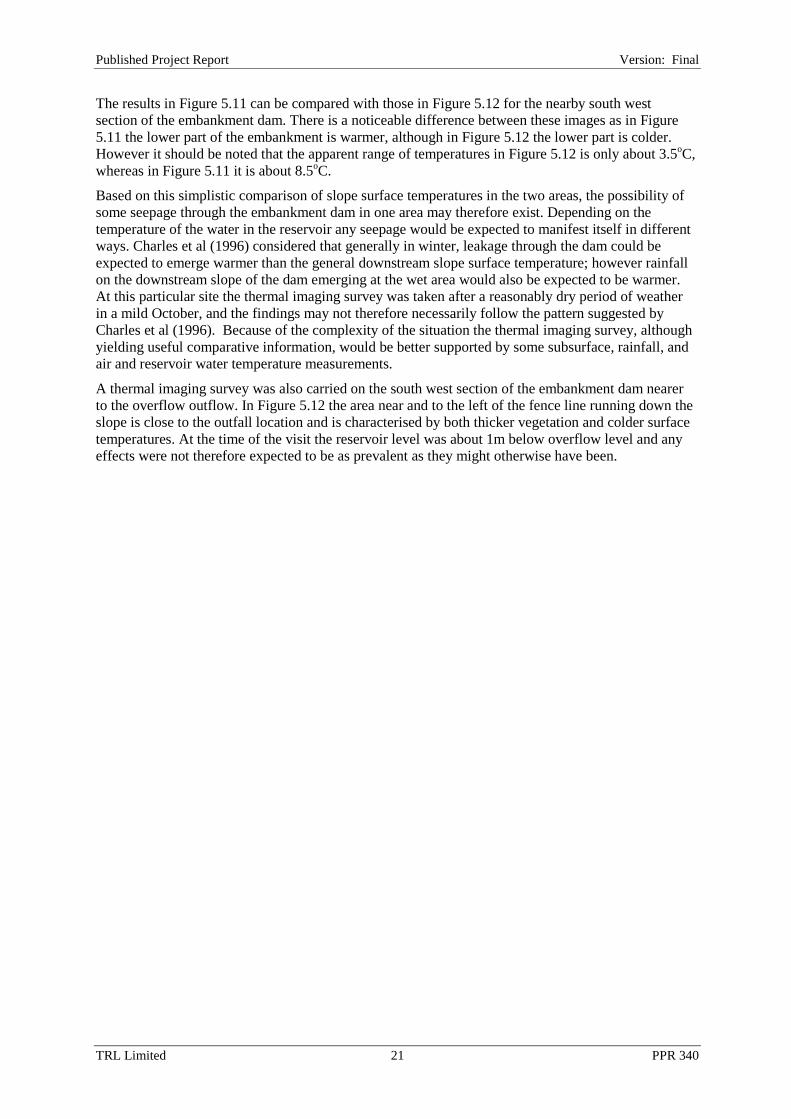
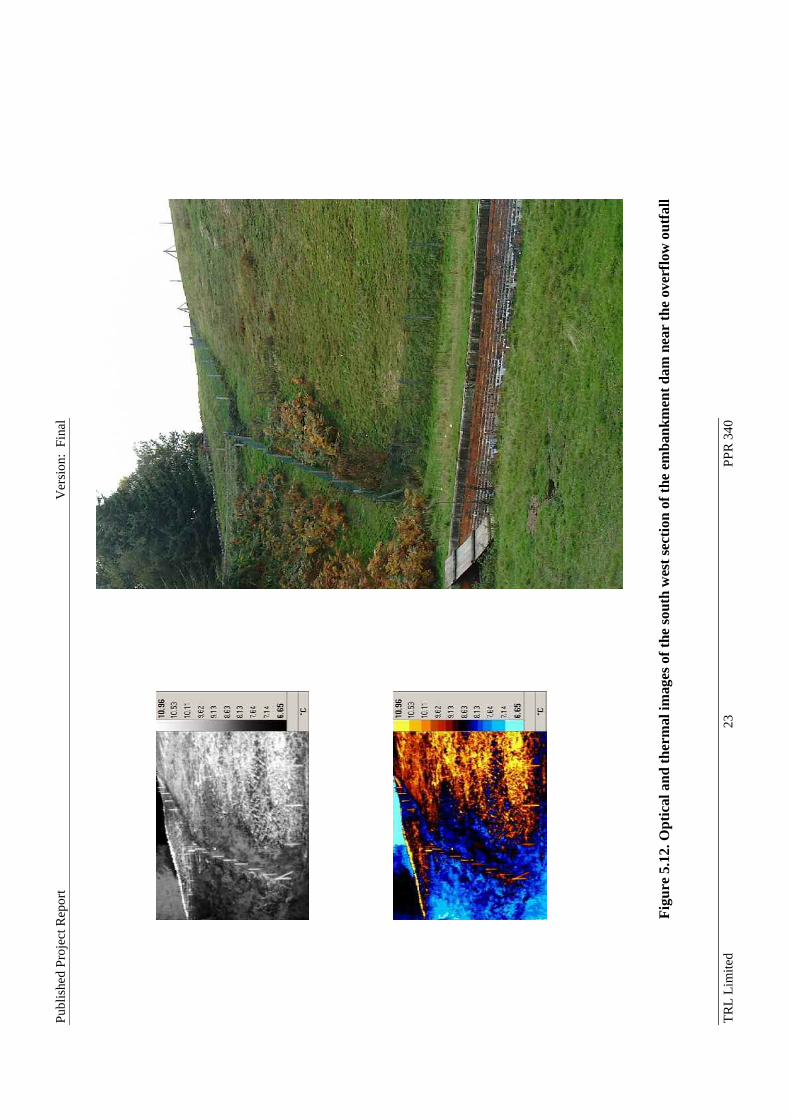
The results in Figure 5.11 can be compared with those in Figure 5.12 for the nearby south west section of the embankment dam. There is a noticeable difference between these images as in Figure 5.11 the lower part of the embankment is warmer, although in Figure 5.12 the lower part is colder. However it should be noted that the apparent range of temperatures in Figure 5.12 is only about 3.5oC, whereas in Figure 5.11 it is about 8.5oC.
Based on this simplistic comparison of slope surface temperatures in the two areas, the possibility of some seepage through the embankment dam in one area may therefore exist. Depending on the temperature of the water in the reservoir any seepage would be expected to manifest itself in different ways. Charles et al (1996) considered that generally in winter, leakage through the dam could be expected to emerge warmer than the general downstream slope surface temperature; however rainfall on the downstream slope of the dam emerging at the wet area would also be expected to be warmer. At this particular site the thermal imaging survey was taken after a reasonably dry period of weather in a mild October, and the findings may not therefore necessarily follow the pattern suggested by Charles et al (1996). Because of the complexity of the situation the thermal imaging survey, although yielding useful comparative information, would be better supported by some subsurface, rainfall, and air and reservoir water temperature measurements.
A thermal imaging survey was also carried on the south west section of the embankment dam nearer to the overflow outflow. In Figure 5.12 the area near and to the left of the fence line running down the slope is close to the outfall location and is characterised by both thicker vegetation and colder surface temperatures. At the time of the visit the reservoir level was about 1m below overflow level and any effects were not therefore expected to be as prevalent as they might otherwise have been.

TRL
Lim
ited
22
PPR
340
Publ
ishe
d Pr
ojec
t Rep
ort
V
ersi
on:
Fina
l
Fi
gure
5.1
1. O
ptic
al a
nd th
erm
al im
ages
of t
he so
uth
wes
t sec
tion
of th
e em
bank
men
t dam
TRL
Lim
ited
23
PPR
340
Publ
ishe
d Pr
ojec
t Rep
ort
V
ersi
on:
Fina
l
Figu
re 5
.12.
Opt
ical
and
ther
mal
imag
es o
f the
sout
h w
est s
ectio
n of
the
emba
nkm
ent d
am n
ear
the
over
flow
out
fall

TRL Limited 24 PPR 340
Published Project Report Version: Final
5.4.2 Reservoir B Reservoir B was constructed between 1925 and 1930. It is situated in a natural valley, the reservoir being formed by a dam across one end of the valley to impound the water. The reservoir is about 1.1km long and has a maximum width of about 0.6km. It is about 18m deep near the dam and only about 1.5m at its inlet.
The reservoir is generally underlain by impervious red marl and to prevent discolouration of the water the upper 4.5m are covered with concrete slabs; below that level the reservoir has gravel beaching.
The significant embankment dam is benched (i.e. terraced) on its downstream side and water is suspected of seeping through the embankment at some locations. The embankment benching means that (i) rainfall and surface water can accumulate on and spill over from the benches, also (ii) some shading can occur so that different solar irradiation is incident on benched and sloped areas. Both of these factors may produce localised surface temperature gradients and make the thermal imaging results harder to interpret. The situation is further complicated by a network of subsurface drains beneath the slope.
A thermal imaging survey of the embankment dam was undertaken on 4th December 2007. Digital photographs are compared with the thermal images in Figure 5.13. Separate thermal images were taken using firstly grey scale and then colour as occasionally some features are more easily discernible in one rather than the other.
The situation at this slope is complex, not only because of its terraced nature, but also because of the various drainage systems from the carriageway at the top of the slope and subsoil drains which are installed beneath the surface of the slope. For this reason, and because of the limited scope of this particular site study, it has only been possible to broadly indicate some areas in Figure 5.13 where the surface temperature is colder than elsewhere. This temperature differential may be related to a wetter area or one where grass growth is slightly different, although the latter may be the consequence of an area being wetter.
Selected areas on the slope were studied in more detail and these are shown in Figure 5.14. Once again colder areas are clearly visible and their locations on the slope can be identified from the manhole locations which also show up as cold spots.

TRL
Lim
ited
25
PPR
340
Publ
ishe
d Pr
ojec
t Rep
ort
V
ersi
on:
Fina
l
Figu
re 5
.13.
Opt
ical
and
ther
mal
imag
es o
f Res
ervo
ir B

TRL Limited 26 PPR 340
Published Project Report Version: Final
Figure 5.14. Enlarged thermal images of selected areas
5.4.3 Reservoir C
This reservoir was built some 200 years ago and in 1998/99 the north embankment was piled with 6.5m long Larrsen LX 8 sheet piles and at the same time the northern headbank was raised to about 1m above weir level. However seepage still occurs on the northwest corner when the reservoir level rises to within 500mm of weir level. The piles were driven through the clay core into the bed rock below and the reservoir owner believes that there are insufficient fines in the surrounding material to seal the clutches4. The level of the tops of the sheet piles are however uncertain5.
The site was visited on 4th December 2007 to undertake a thermal imaging survey of the headbank where seepage was occurring. Figure 5.15shows the reservoir and the relevant area of headbank.
Figure 5.15. Headbank at Reservoir C
4 The reservoir owner has experienced the same problems elsewhere possibly because the clutches on LX8 piles are not as tight as those of other piles they have used. 5 TRL assume engineering judgement would have been for the pile tops to be 0.5m or so below the top of headbank, i.e. above maximum reservoir level.

TRL Limited 27 PPR 340
Published Project Report Version: Final
On the day of the visit water was present on the downside slope and it was evident that seepage was occurring from the reservoir. The reservoir water level was about 1m below the top of the headbank. Figure 5.16 shows the optical and thermal images obtained. Both grey scale and colour contrast images are presented although it should again be noted that these are the same image post-processed differently.
Cold and wet areas show up clearly in the thermal images. Some of these areas are associated with locations on the embankment which are more barren of vegetation. On the right hand side of the images the passages of water down the slope are clearly visible and as might be expected the water tends to migrate around the thicker areas of vegetation. The thermal imaging provides a clear record of this, although the same effects would be apparent from a detailed walk-over inspection.
A second visit to the site was made on 29th January 2008. Although slightly different views were obtained the thermal imaging findings were unchanged and are not therefore included in this report. During this second visit undrained shear strengths were measured using a 19mm shear vane, and the water temperature in the reservoir measured.
The results of the shear vane tests taken by pushing the vane to about 150mm depth below the slope surface are given in Table 5.1.
Table 5.1. Undrained strength 150mm below the slope surface
Undrained shear strength (kPa) Approximate distance up the bank slope (m) Drier location at the west of
the headbank Wetter location about 15m
east of the drier location
0.5 64 54
1.5 91 41
2.5 83 23
3.5 57 22
5.0* 80 23 * About 0.5-1.0m below top of bank
Table 5.1 indicates that according to the BS5930 (1999) strength classification the upper two thirds of the surface layer of the headbank at the wetter location falls within the soft category (20-40kPa). This can be compared with the firm to stiff categorisation (i.e. firm 40-75kPa and stiff 75-150kPa) of the surface layer at the adjoining drier location. It is not clear whether the low strength at the wetter location is a localised effect only at the slope surface or associated with a more general softening of the slope from the suspected seepage from the reservoir. Further information on the soil profile at depth could conveniently be obtained at various locations using a dynamic cone penetrometer (or similar devices) and investigating the number of blows for penetration. This would help clarify this issue.
The temperature of the upper 1m of water in the reservoir was measured as about 6.5oC and, although any water seeping through the headbank will be warmed by the soil, this tends to suggest that it is the colder areas in the thermal images (Figure 5.16) which are the more likely to represent areas where seepage is occurring.

TRL
Lim
ited
28
PPR
340
Publ
ishe
d Pr
ojec
t Rep
ort
V
ersi
on:
Fina
l
Fi
gure
5.1
6. O
ptic
al a
nd th
erm
al im
ages
of t
he h
eadb
ank
at R
eser
voir
C

TRL Limited 29 PPR 340
Published Project Report Version: Final
6 Active thermographic surveys Three active thermographic studies were undertaken. In one case, heat was actively introduced to concrete samples to investigate the success in identifying the locations of known subsurface defects. A further study was then undertaken to see if defects in concrete surfaces below waterproofing materials could be detected.
In the remaining study, road surfaces temperatures were investigated above a road heating system. In the latter case the active heating actually comprised normal operation of the system for the winter maintenance of a trial section of road.
6.1 Identification of subsurface defects in concrete specimens
Concrete specimens approximately 300mm square and about 55mm thick were available with deliberately manufactured defects in their surface from a separate research project for the Highways Agency. In specimen A indents of 20 to 25mm occurred in the surface, whilst specimen B displayed a footprint varying from 10mm deep at its toe to 20mm deep at the heel.
In this thermal imaging study, both specimens were inverted so that their defects were effectively concealed at a depth of about 35mm below the top surface. It was accepted that differences in thermal emissivity due to the defects were unlikely to be sufficient for them to be identifiable using passive thermography. For this reason, active thermography was employed. Specimen A was placed in an oven at 100oC and specimen B was placed in a refrigeration unit. After this pre-treatment both specimens were removed and images taken at 15 minute intervals as they cooled and warmed respectively to reach the laboratory temperature of about 20oC.
The findings are summarised in Figure 6.1. In this figure it should be noted that the optical photographs of the under-side of both specimens have been transposed so that they are comparable with the thermal images. The key for the colours of the different temperature ranges although considered to be realistic should be treated with some caution.
During the cooling of specimen A no significant differences in temperatures associated with the subsurface voids could be discerned. In the warming of specimen B there was also difficulty in detecting any differences, however it could be argued that temperatures were generally slightly cooler towards the area of the deeper recess in the heel area of the footprint.
These results confirmed the findings of Goddin (2006) who carried out active thermographic examination of laboratory small scale specimens in well-controlled experiments. Table 6.1 summarises some of his results and confirms that at a depth of cover of 35mm, only very large defects are likely to be detectable. The suspicion of detection of the heel recess in the TRL study may therefore be real but at the limit of detectability.
Table 6.1. Detection of defects in concrete specimens (after Goddin, 2006)
Defect size sufficient for detection
(contrast difference in brackets)
Specimen
Depth of cover to defects (mm) 25mm 50mm 100mm
SLD 1 5 √ (good) √ (good) √ (good)
SLD 2 10 × √ (adequate) √ (good)
SLD 3 20 × √ (poor) √ (adequate) Note: Camera angle at 90o to specimen

TRL
Lim
ited
30
PPR
340
Publ
ishe
d Pr
ojec
t Rep
ort
V
ersi
on:
Fina
l
Phot
ogra
ph o
f und
er-s
ide
of sp
ecim
en
Ther
mal
imag
es
(a) C
oolin
g of
spec
imen
A
Figu
re 6
.1. I
dent
ifica
tion
of d
efec
ts in
con
cret
e sp
ecim
ens

TRL
Lim
ited
31
PPR
340
Publ
ishe
d Pr
ojec
t Rep
ort
V
ersi
on:
Fina
l
Phot
ogra
ph o
f und
er-s
ide
of sp
ecim
en
Ther
mal
imag
es
(b) W
arm
ing
of sp
ecim
en B
Figu
re 6
.1. I
dent
ifica
tion
of d
efec
ts in
con
cret
e sp
ecim
ens (
cont
inue
d)

TRL Limited 32 PPR 340
Published Project Report Version: Final
In the TRL study, improvements in detectability would clearly have resulted if the depth of cover had been smaller, the size of the defect increased, and the sample edges insulated to prevent heat loss around the sides.
6.2 Identification of surface defects in concrete below a waterproofing layer
Concrete test slabs (300×300×55mm) were cast with the following types of defect:
• three round depressions (65mm diameter and 30mm deep) in the slab,
• ridges with a target height of 10mm in the slab.
Control slabs were also produced with a standard U4 finish6. Photographs of the different slabs are shown in Figure 6.2. Once again these specimens were not manufactured specifically for this study, but were available from a separate study for the Highways Agency.
Depressions Ridges Standard U4 finish
Figure 6.2. Surface characteristics of the various slabs
The slabs were then treated with the Bridgeguard waterproofing system7. This involved application of a rapid curing primer followed by the filling of depressions, holes, and between ridges as applicable with hot bitumen to provide a flat surface. A waterproofing membrane 4.5mm thick was then adhered to the top surface using hot bitumen. As a result of this process it was not possible to visually detect if the finished product contained defect features below the waterproofing membrane or not, see Figure 6.3 which includes a range of samples.
6 A standard U4 finish involves levelling the concrete and screeding to produce a uniform surface. When the concrete has sufficiently hardened and the bleed water evaporated the surface is trowelled to produce a hard dense surface free from screed marks and exposed aggregate. Finally the surface is lightly textured with a wooden float or equivalent. 7 Bridgeguard has been tested and approved for compliance with the Highways Agency BD47/99 (Waterproofing and Surfacing of Concrete Bridge Decks) and has been issued with the British Board of Agrement Roads and Bridges Certificate.

TRL Limited 33 PPR 340
Published Project Report Version: Final
Figure 6.3. A selection of samples after the waterproofing membrane was applied
Thermal imaging was employed to assess whether the presence and nature of the defects could be detected. Figure 6.3 shows images taken soon after application of the waterproofing membrane, i.e. while the system was warm.
Samples with depressions Samples with ridged and a U4 finish
Figure 6.3. Thermal images soon after the hot application of the membrane
Whilst Figure 6.3 clearly demonstrates that the underlying defects could be readily identified whilst warm, the thermal imaging was continued whilst cooling took place to assess if the defects were still distinguishable when the samples were at ambient temperature. The results for the samples with surface depressions are shown in Figure 6.4 at time intervals of about 30mins, 1 hour and 16 hours after the application of the waterproofing.
In Figure 6.4 the same image is shown in both grey and colour scale for comparative purposes. The thermal images demonstrate that all the bitumen-filled defects were sharply defined and visible through the waterproofing membrane when it was hot. The defects also continued to be visible throughout the cooling process and were still just apparent when the concrete slab and membrane had cooled to ambient temperature, although the definition of the features was by no means so sharp. It should be noted that during cooling the bitumen-filled depression retained the heat for longer.

TRL Limited 34 PPR 340
Published Project Report Version: Final
(a) 30 mins after applying the waterproofing
(b) 1 hour after applying the waterproofing
(c) 16 hours after applying the waterproofing
Figure 6.4. Thermal images of “depression” samples during cooling

TRL Limited 35 PPR 340
Published Project Report Version: Final
Figure 6.5 shows the thermal images at ambient temperatures of a ridged sample alongside of a “depression” sample. Once again the ridges are still apparent when cool although ill-defined.
Figure 6.5. Thermal images of “ridged” and “depression” samples when cool
The difference in thermal emissivities of the bitumen-filled defect and the surrounding concrete and the associated small surface temperature differentials which develop when heat is applied was simply demonstrated by placing a hand over one of the defects for about 30 seconds. The results in Figure 6.6 show that the definition of the defect improved compared with the thermal image taken when the whole system was at thermal equilibrium. Once again the bitumen-filled depression retained the heat for longer.
(a) 2 mins after removing hand
(b) 10 mins after removing hand
Figure 6.6. Thermal image of “depression” sample after briefly warming by hand

TRL Limited 36 PPR 340
Published Project Report Version: Final
It must be noted that the technique of filling a concrete defect with bitumen is technically sound provided that good adherence is obtained between the membrane and the concrete of the bridge deck. Thermal imaging can however detect the locations of such defects and it is when they are inadequately filled, so that air voids develop, that their detection becomes more important. The presence of unfilled defects is clearly more problematic in that long term deterioration of the membrane may then permit ingress of de-icing salt to the metallic reinforcing elements and their subsequent corrosion.
6.3 Performance of a road heating system
Carder et al (2008) described the installation and operation of an innovative system to collect and store solar heat from the road surface in the summer, and to re-use it in the winter to prevent ice and snow formation. The part of the system immediately below the road surface is known as the collector and incorporates an array of plastic pipe at a depth of cover of about 120mm (Figure 6.2). The collector pipework is filled with fluid circulated from an adjoining shallow insulated heat store. The temperature of this fluid depends on the temperature of the heat store.
Figure 6.2. Installation of pipework for the heat collector
For the purpose of the thermal imaging study, the camera was fixed to a telescopic mast (4m above road level) which was positioned just inside of the road kerb and about 10m from the near edge of the collector. The angle of the camera on the mast was adjusted to about 30o from the horizontal to enable an area of unheated road and the near area of the collector to be viewed. The study was undertaken on a cold winter evening when air temperatures were predicted to be sub-zero. Photographs were taken at 30 minute intervals after initiating the road heating at 16:30 until 22:30 at which time the air temperature warmed slightly and the investigations were therefore terminated at 22:45.
Figure 6.3 shows a summary of the same four photographs (i.e. at 16:30, 18:30, 20:30 and 22:30) of the collector produced using different picture settings, namely:
• colour – automatic gain control,
• colour – fixed scale,
• grey – automatic scale.

TRL Limited 37 PPR 340
Published Project Report Version: Final
In all cases, with the exception of the control at 16:30 before heating the road, the thermal images of the heated pipes can be seen at the road surface.
Although the apparent temperature scales are included these must not be considered as absolute temperatures for the following reasons:
• the apparent temperature will depend on the angle of viewing. The calibration of the camera assumes a perpendicular view, and in the colour images this accounts for the apparent decrease in temperature as the angle of viewing moves further from the perpendicular, ie. more distant from the camera.
• infrared does not transmit through water so the accuracy of the temperature readings will be affected as the road surface was damp (although not wet). The thermal properties (in terms of reflectivity and emissivity) will therefore change with time as the road surface dries out or becomes wet.
With the above caveats, it is considered that differences in temperature over a small localised area may nevertheless be real.
In Figure 6.3 the colour (fixed scale) image at 22:30 shows a slight warming from 20:30, this relates to a change in air temperature possibly as a cloud briefly passed over. The same effect is not so evident in the images taken using automatic gain control.
The temperature data measured by thermistors are complementary to the thermal imaging and are shown in Figure 6.4 for the same period. At this time the temperature of the heat store was about 10oC and fluid being passed around the collector pipe array was about 7oC. The efficiency of the under-road heating system is separately discussed by Carder et al (2008).
16 17 18 19 20 21 22 230
1
2
3
4
5
6
Time (pm)
Tem
pera
ture
(°C
)
Road surface Pipe depth Air
Figure 6.4. Temperatures measured by thermistors
It was concluded that the thermal imaging successfully detected the presence of the collector pipe array at shallow depth below the surface although the temperature differentials were only of the order of 5oC. This finding demonstrates that thermal imaging techniques would be likely to be effective in the following applications:
• detecting the location of buried heating pipework in roads/buildings to avoid damage by other operations,
• detecting fluid leaks from underground heating systems,
• detecting electrical cables used for the surface heating of roads,
• detecting hot spots in subsurface electrical cables caused by poor electrical jointing.

TRL
Lim
ited
38
PPR
340
Publ
ishe
d Pr
ojec
t Rep
ort
V
ersi
on:
Fina
l
C
olou
r: au
tom
atic
gai
n co
ntro
l
Col
our:
fixed
scal
e
Gre
y: a
utom
atic
gai
n co
ntro
l
Figu
re 6
.3. T
he sa
me
ther
mal
imag
es o
f the
col
lect
or a
t 16:
30, 1
8:30
, 20:
30 a
nd 2
2:30
usi
ng d
iffer
ent p
ictu
re se
tting
s
16:3
0
18:3
0
20:3
0
22:3
0

TRL Limited 39 PPR 340
Published Project Report Version: Final
7 Summary and recommendations 1. A review of thermal imaging usage both at TRL and elsewhere was undertaken. Applications
included the identification of either defects having different thermal emissivity or problems associated with the ingress/egress of water in bridge decks and pavements, masonry and concrete structures, tunnels and pipelines, waterways and reservoirs. Infrared thermography is a non destructive testing method that enables large areas to be surveyed quickly, remotely and therefore, in many cases, cost effectively. It is often used to narrow the scope of an investigation by finding potential problems hidden within slopes and structures prior to further investigation using other methods.
2. In this scoping study, the use of thermal imaging was investigated for a range of civil engineering applications to evaluate its potential.
a. Clay slope on the M25. The original aim of identifying softened and wetter zones which might result in slope instability could not be accomplished in this limited study as thermal imaging of this sidelong clay slope proved complex. Generally changes in incline were characterised by lower temperatures at their base, possibly because of either surface water accumulation, increased grass growth, emergence of subsurface water, or different exposure to the sun.
b. Underpass retaining walls on the A331. Seepage through the wall cladding was probably caused by a build-up of fines or debris in the drainage channel concealed behind the cladding. Water staining was apparent by visual inspection and also showed up clearly on thermal imaging.
c. Masonry arch bridge near Bursledon. Thermal imaging showed some merit for assessment of this class of structures in so far as the zones of cold temperature around areas of water ingress or cracks were generally more evident than from a visual inspection.
d. Embankment reservoirs. Thermal imaging was undertaken of the embankment dams at three different reservoirs.
i. Reservoir A. Some cold locations on the slope were discernible generally related to the presence of coarser vegetation or plants. Because these colder zones tended to run horizontally, it was hypothesised that they could be related to the embankment construction process with seepage through more permeable soil layers resulting in wetter areas which encouraged plant growth.
ii. Reservoir B. The situation at this slope is complex, not only because of its terraced nature, but also because of the various drainage systems from the carriageway at the top of the slope and subsoil drains which are installed beneath the surface of the slope. For this reason, it was only possible to identify some areas where the surface temperature is colder than elsewhere. This temperature differential may be related to a wetter area or one where grass growth is slightly different, although the latter may be the consequence of the former.
iii. Reservoir C. Particularly cold and wet areas show up clearly in the thermal images. The water routes down the slope are readily visible in the more barren areas and as might be expected the water tends to migrate around the thicker areas of vegetation. The thermal imaging provides a well-defined record of this.
3. Active thermographic studies were undertaken where heat was introduced so that temperature differentials were more pronounced and hence more readily detected by thermal imaging. These investigations were as follows.

TRL Limited 40 PPR 340
Published Project Report Version: Final
a. Subsurface defects in concrete. Work by others (Goddin, 2006) indicates that only very large defects are detectable when the depth of cover is 35mm. This finding was confirmed by the TRL study which looked at defects at the same depth of concrete cover.
b. Surface defects in concrete below a waterproofing layer. The technique was very effective in detecting bitumen-filled defects in the concrete surface immediately below a 4.5mm thick waterproofing layer. Even a small amount of heat much enhanced the temperature differences making the defects clearly visible. It is anticipated that unfilled defects would also be detectable.
c. Location of road heating elements. The buried heating pipework operating at a depth of cover of 120mm below the road surface at Toddington was readily detected. This finding demonstrates that thermal imaging would be effective in locating buried heating pipework or cables in roads/buildings to avoid their damage by other operations, and for detecting fluid leaks or electrical hot spots from such systems.
Recommendations
4. The findings indicated that identification of leakage and seepage of water through embankment dams was one of the particular applications worthy of further investigation.
5. In general, it was recommended that there was considerable advantage in using thermal imaging in conjunction with other non-destructive techniques or instrumentation to provide a more comprehensive overall picture.
6. Active thermographic studies, where heat is introduced to develop temperature differences, also showed particular merit and could be appropriate for a range of applications.
Acknowledgements The work described in this report was carried out in the Infrastructure & Environment Division of TRL Limited. The client for this TRL Reinvestment Project was Mr N Paulley, Director of the TRL Academy.
Thanks are due to the various infrastructure owners for permission to access their property for the purpose of the thermographic surveys and for supplying supporting information where applicable. Thanks are due in particular to Network Rail, Surrey County Council, the Highways Agency, Mouchel Parkmann, and the various reservoir owners.
The authors are grateful to Dr R J Woodward who carried out the quality review and auditing of this report.
References ASTM (1997). Detecting delamination in bridge decks using infrared technology. ASTM D4788, Vol.4.03, pp474-475.
British Standards Institution (1999). BS 5930 Code of practice for site investigations. London, British Standards Institution.
Carder D R, Barker K J, Hewitt M G, Ritter D and Kiff A (2008). The performance of a facility at Toddington for the collection and storage of solar heat from the road surface. TRL Published Project Report PPR302. Wokingham, TRL Limited.

TRL Limited 41 PPR 340
Published Project Report Version: Final
Carder D R and Barker K J (2005). The performance of a single row of spaced bored piles to stabilise a Gault Clay slope on the M25. TRL Report TRL627. Wokingham, TRL Limited.
Carder D R, Barker K J, Cole G and Stephen M (2004). The long term performance of the propped diaphragm walls at Aldershot Road underpass. TRL Report TRL608. Wokingham, TRL Limited.
Carder D R, Press D J, Morley C H and Alderman G H (1997). Behaviour during construction of a propped diaphragm wall founded in London Clay at Aldershot Road underpass. TRL Report TRL239. Wokingham, TRL Limited.
Carder D R and Darley P (1998). The long term performance of embedded retaining walls. TRL Report TRL381. Wokingham, TRL Limited.
Charles J A, Tedd P, Hughes A K and Lovenbury H T (1996). Investigating embankment dams. A guide to the identification and repair of defects. BRE Report BR 303. Garston, Building Research Establishment.
Clark M and Forde M C (2003). Infrared thermography assessment of masonry arch bridges laboratory and field case studies. International Symposium Non-Destructive Testing in Civil Engineering 2003. (http://www.ndt.net/article/ndtce03/papers/v084/v084.htm)
Clark M R, McCann D M and Forde M C (2001). Infra-red thermographic survey of a railway tunnel. Proc 9th Int Conf Structural Faults and Repair 2001. London, Engineering Technics Press.
Clark M R, McCann D M and Forde M C (2003). Application of infrared thermography to the non-destructive testing of concrete and masonry bridges. NDT&E International, Vol. 36, pp265-275.
Goddin J R J (2006). The use of infra-red thermographic imaging to assist in the detection of delamination in concrete. BRE Client Report Number 231-007. (available on http://www.ha-research.gov.uk/projects/index.php?id=861).
Haack A, Schreyer J and Jackel G (19950. State-of-the-art of non-destructive testing methods for determining the state of a tunnel lining. Tunnels and Underground Space Technology, Vol.10, No.4, pp413-431.
Hing C L, Halabe U B, Klinkhachorn P and GangaRao H V S (2007). Infrared thermography testing of FRP bridge decks. American Institute of Physics Conf. Proc., Review of progress in quantitative non-destructive evaluation, Vo. 894, pp1600-1607.
Huang Y and Fipps G (2002). Thermal imaging of canals for remote detection of leaks: evaluation in the United Irrigation District. http://gfipps.tamu.edu/documents/Thermal%20Final%20Report.pdf
Ljungberg S A (1994). Infrared techniques in buildings and structures: operation and maintenance. In:Infrared Methodolgy and Technology, X.P.V. Maldague (Ed.), pp211-252.
Nells M D (1982). Application of thermal infrared imagery to canal leakage detection. Remoting sensing of environment, Vol.12, pp229-234.
Phillips L, Willoughby K and Mahoney J (2003). Infrared thermography revolutionizes hot-mix asphalt paving. InfraMation, The Thermographer’s Conference.
Pickerill J M and Malthus T J (1998). Leaks detection from rural aqueducts using airborne sensing techniques. Int. J. Remote Sensing, Vol.19, No. 12, pp2427-2433.
Stimolo M (2003). Passive infrared thermography as inspection and observation tool in bridge and road construction. International Symposium Non-Destructive Testing in Civil Engineering 2003. (http://www.ndt.net/article/ndtce03/papers/v083/v083.htm)
Tanaka H, Tottori S and Nihei T (2006). Detection of concrete spalling using active infrared thermography. Quarterly Report of Railway Technical Research Institute, Vol. 47, No. 3, pp.138-144.
Weil G J (1984). Infrared thermal sensing of sewer voids. Proceedings of SPIE – The International Society of Optical Engineers, Thermosense VI, Vol. 446, pp116-121.

TRL Limited 42 PPR 340
Published Project Report Version: Final
Ziadi A, Galmiche F and Maldague X (2003). Pulse shaping in infrared thermography for nondestructive evaluation. Review of Scientific Instruments, Vol. 74, Issue 1, pp411-413.

Published Project Report Version: Final
TRL Limited 43 PPR 340
Abstract Infrared thermography is a non destructive testing method that enables large areas to be surveyed quickly, remotely and therefore, in many cases, cost effectively. It is often used to narrow the scope of an investigation by finding potential problems hidden within slopes and structures prior to further investigation using other methods. In this scoping study, the use of thermal imaging was investigated for a range of civil engineering applications to evaluate its potential. Field investigations were undertaken at a highway slope, embankment dams, a masonry arch bridge and a retaining wall. Active thermographic studies, where heat was introduced, were undertaken to detect subsurface defects in concrete, defects in concrete below a waterproofing layer, and to locate under the road heating pipes.


TRLCrowthorne House, Nine Mile RideWokingham, Berkshire RG40 3GAUnited Kingdom
T: +44 (0) 1344 773131F: +44 (0) 1344 770356E: [email protected]: www.trl.co.uk
ISSN 0968-4093
Price code: 3X
Published by IHSWilloughby Road, BracknellBerkshire RG12 8FBUnited Kingdom
T: +44 (0) 1344 328038F: +44 (0) 1344 328005E: [email protected]: www.uk.ihs.com PP
R3
40
Thermal imaging of slopes and substructures
Infrared thermography is a non destructive testing method that enables large areas to be surveyed quickly, remotely and therefore, in many cases, cost effectively. It is often used to narrow the scope of an investigation by finding potential problems hidden within slopes and structures prior to further investigation using other methods. In this scoping study, the use of thermal imaging was investigated for a range of civil engineering applications to evaluate its potential. Field investigations were undertaken at a highway slope, embankment dams, a masonry arch bridge and a retaining wall. Active thermographic studies, where heat was introduced, were undertaken to detect subsurface defects in concrete, defects in concrete below a waterproofing layer, and to locate under the road heating pipes.
Other recent titles from this subject area
PPR302 Performance of an interseasonal heat transfer facility for collection, storage and re-use of solar heat from the road surface by D R Carder, K J Barker, M G Hewitt, D Ritter, A Kiff, 2008
PPR169 Pollutant removal ability of grassed surface water channels and swales: Literature review and identification of potential monitoring sites by M Escarameia, A J Todd, G R A Watts, 2006
PPR130 Post-incident recovery in highway tunnels - achieving best practice by S Bird, J E Potter,J Gillard, 2006
PPR140 Ventilation during road tunnel emergencies by R C Hall, 2006
PPR082 A study of water movement in road pavements by J M Reid, G I Crabb, J Temporal,M Clark, 2006
Published Project ReportPPR340
Thermal imaging of slopes and substructures
D R CarderA Dunford