The World Markets and Manufacturers of HV Switchgear, 2015 ... · The World Markets and...
92
The World Markets and Manufacturers of High Voltage Switchgear 2015 - 2025 © GOULDEN REPORTS July 2016 No 1, Priorsfield, Marlborough,WiltshireSN8 4AQ, United Kingdom Tel: +44 1672 513316 Email: [email protected] Web site: www.gouldenreports.org All rights reserved. No part of this publication may be reproduced, stored in a retrieval system, or transmitted in any form, or by any means, electronic, mechanical, photocopying, recording or otherwise without the prior permission of the copyright owner.
Transcript of The World Markets and Manufacturers of HV Switchgear, 2015 ... · The World Markets and...

The World Markets and
Manufacturers of High Voltage Switchgear
2015 - 2025
© GOULDEN REPORTS July 2016
No 1, Priorsfield, Marlborough,WiltshireSN8 4AQ, United Kingdom Tel: +44 1672 513316
Email: [email protected]
Web site: www.gouldenreports.org All rights reserved. No part of this publication may be reproduced, stored in a retrieval system, or transmitted in any form, or by any means, electronic, mechanical, photocopying, recording or
otherwise without the prior permission of the copyright owner.

The World Markets and Manufacturers of HV Switchgear, 2015 - 2025

The World Markets and Manufacturers of HV Switchgear, 2015 - 2025
NOTE
The information given in this report has been compiled from published sources and interpreted from fieldwork based on informed opinions. Whilst every care has been taken in the preparation of the report, there may have been some errors in the information obtained. Although it is impossible to verify every single detail by cross checking, we believe the general picture provided is reasonably accurate and comprehensive.
Many Goulden Reports publications contain an overview of selected company financial information and capabilities based on published sources where available. Although the companies represented are believed to be the major suppliers the profiles are meant to be indicative rather than definitive.
It is fundamental to the philosophy of Goulden Reports to constantly seek to extend and improve our service to clients. In pursuit of these aims, we shall be pleased to consider all requests for regular or periodic updating of all or any part of the information contained in this report, or for extensions in coverage in terms of product areas, market sectors and/or geographic regions.
We are, of course, always happy to discuss with any subscriber the possibility of undertaking further work, whether arising out of this report or in different business areas.
MORE INFORMATION ON GOULDEN REPORTS
At the end of this report you will find a list of our latest published reports. Should you require more information on either our published reports or our private client services, please contact us at the address given.
Full details on all Goulden Reports published studies (including full tables of contents and tables of tables) and ad hoc research services can be found on our e-commerce website:
www.gouldenreports.org

The World Markets and Manufacturers of HV Switchgear, 2015 - 2025

The World Markets and Manufacturers of HV Switchgear, 2015 - 2025
CONTENTS
1. INTRODUCTION ............................................................................................................................................... 1 1.1 OBJECTIVES AND SCOPE ....................................................................................................................... 1 1.2 METHODOLOGY ....................................................................................................................................... 3
2. SUMMARY ......................................................................................................................................................... 5 2.1 SUMMARY TABLES ................................................................................................................................. 9
3. THE WORLD MARKET ................................................................................................................................. 16 3.1 FORECAST WORLD MARKET 2016 - 2025 .......................................................................................... 25
5. MAJOR HIGH VOLTAGE SWITCHGEAR MANUFACTURERS ........................................................... 33 5.1 HV SWITCHGEAR INDUSTRY CONTACT DETAILS ........................................................................ 37 5.2 Argentina .................................................................................................................................................... 37 5.3 Australia ..................................................................................................................................................... 37 5.4 Austria ........................................................................................................................................................ 39 5.5 Belgium ...................................................................................................................................................... 40 5.6 Bosnia-Herzegovina ................................................................................................................................... 41 5.7 Brazil .......................................................................................................................................................... 41 5.8 Bulgaria ...................................................................................................................................................... 43 5.9 Canada ........................................................................................................................................................ 44 5.10 Chile ........................................................................................................................................................... 46 5.11 China .......................................................................................................................................................... 46 5.12 Colombia .................................................................................................................................................... 52 5.13 Croatia ........................................................................................................................................................ 53 5.14 CzechRepublic ........................................................................................................................................... 53 5.15 Denmark ..................................................................................................................................................... 54 5.16 Egypt .......................................................................................................................................................... 55 5.17 Estonia ........................................................................................................................................................ 56 5.18 Finland ....................................................................................................................................................... 56 5.19 France ......................................................................................................................................................... 57 5.20 Germany ..................................................................................................................................................... 59 5.21 Greece ........................................................................................................................................................ 63 5.22 Hungary ...................................................................................................................................................... 64 5.23 India ........................................................................................................................................................... 65 5.24 Indonesia .................................................................................................................................................... 70 5.25 Iran ............................................................................................................................................................. 71 5.26 Ireland ........................................................................................................................................................ 71 5.27 Israel ........................................................................................................................................................... 72 5.28 Italy ............................................................................................................................................................ 72 5.29 Japan .......................................................................................................................................................... 75 5.30 Malaysia ..................................................................................................................................................... 78 5.31 Mexico ....................................................................................................................................................... 79 5.32 Morocco ..................................................................................................................................................... 81 5.33 Netherlands ................................................................................................................................................ 82 5.34 New Zealand .............................................................................................................................................. 83 5.35 Norway ....................................................................................................................................................... 83 5.36 Pakistan ...................................................................................................................................................... 84 5.37 Peru ............................................................................................................................................................ 84 5.38 Philippines .................................................................................................................................................. 84 5.39 Poland ........................................................................................................................................................ 85 5.40 Portugal ...................................................................................................................................................... 86 5.41 Romania ..................................................................................................................................................... 87

The World Markets and Manufacturers of HV Switchgear, 2015 - 2025
5.42 Russia ......................................................................................................................................................... 87 5.43 Saudi Arabia ............................................................................................................................................... 88 5.44 Serbia&Montenegro ................................................................................................................................... 89 5.45 Slovakia ...................................................................................................................................................... 89 5.46 Slovenia ...................................................................................................................................................... 90 5.47 South Africa ............................................................................................................................................... 90 5.48 South Korea................................................................................................................................................ 91 5.49 Spain .......................................................................................................................................................... 92 5.50 Sweden ....................................................................................................................................................... 94 5.51 Switzerland................................................................................................................................................. 95 5.52 Taiwan ........................................................................................................................................................ 99 5.53 Thailand ................................................................................................................................................... 100 5.54 Tunisia ...................................................................................................................................................... 101 5.55 Turkey ...................................................................................................................................................... 102 5.56 UAE ......................................................................................................................................................... 103 5.57 Ukraine ..................................................................................................................................................... 104 5.58 United Kingdom ....................................................................................................................................... 104 5.59 USA.......................................................................................................................................................... 111
6. REGIONAL MARKETS ................................................................................................................................ 119 6.1 WESTERN EUROPE .............................................................................................................................. 119 6.2 EASTERN EUROPE ............................................................................................................................... 133 6.3 FORMER SOVIET UNION .................................................................................................................... 147 6.4 NORTH AFRICA .................................................................................................................................... 161 6.5 WEST AFRICA ....................................................................................................................................... 169 6.6 CENTRAL AFRICA ................................................................................................................................ 183 6.7 EAST AFRICA ........................................................................................................................................ 191 6.8 SOUTHERN AFRICA ............................................................................................................................. 205 6.9 MIDDLE EAST ....................................................................................................................................... 213 6.10 INDIAN SUB CONTINENT ................................................................................................................... 227 6.11 ASIA ........................................................................................................................................................ 235 6.12 SOUTH AMERICA ................................................................................................................................. 249 6.13 CENTRAL AMERICA AND CARIBBEAN .......................................................................................... 263 6.14 NORTH AMERICA................................................................................................................................. 277 6.15 OCEANIA ................................................................................................................................................ 285
7. PRODUCTION ............................................................................................................................................... 293
8. TRADE ANALYSIS ....................................................................................................................................... 295 8.1 TOP 25 EXPORTERS ............................................................................................................................. 295 8.2 TOP 25 IMPORTERS .............................................................................................................................. 303 8.3 EXPORT VALUES ................................................................................................................................. 311 8.4 EXPORT PERCENTAGES ..................................................................................................................... 320 8.5 IMPORT VALUES .................................................................................................................................. 329 8.6 IMPORT VALUES .................................................................................................................................. 338 8.6.1 HV Switchgear Imports by Country Alphabetical 2014 ........................................................................... 338 8.6.2 HV Switchgear Imports by Region, by Country 2010 to 2014 ................................................................. 382
9. APPENDICES ................................................................................................................................................. 397 9.1 EXCHANGE RATES .............................................................................................................................. 397 9.2 ESTIMATED PRODUCTION BY COMPANY BY COUNTRY .......................................................... 399
10. COUNTRY PROFILES BY REGION .......................................................................................................... 407 10.1 Western Europe ........................................................................................................................................ 409 10.2 Eastern Europe ......................................................................................................................................... 411 10.3 Former Soviet Union ................................................................................................................................ 412 10.4 North Africa ............................................................................................................................................. 413 10.5 West Africa .............................................................................................................................................. 414 10.6 Central Africa ........................................................................................................................................... 415 10.7 East Africa................................................................................................................................................ 416

The World Markets and Manufacturers of HV Switchgear, 2015 - 2025
10.8 South Africa ............................................................................................................................................. 417 10.9 Middle East .............................................................................................................................................. 418 10.10 Indian Subcontinent ................................................................................................................................. 419 10.11 Asia .......................................................................................................................................................... 420 10.12 South America .......................................................................................................................................... 422 10.13 Central America &Caribbean ................................................................................................................... 423 10.14 North America .......................................................................................................................................... 425 10.15 Australasia ................................................................................................................................................ 426

The World Markets and Manufacturers of HV Switchgear, 2015 - 2025

The World Markets and Manufacturers of HV Switchgear, 2015 - 2025
TABLE OF TABLES
1. INTRODUCTION ............................................................................................................................................... 1 1.1 OBJECTIVES AND SCOPE ....................................................................................................................... 1 1.2 METHODOLOGY ....................................................................................................................................... 3
2. SUMMARY ......................................................................................................................................................... 5 2.1 SUMMARY TABLES ................................................................................................................................. 9
The Fastest Growing National Markets for HV Switchgear 2010 - 2015 (US$ Million)................................................ 9 The Fastest Growing National Markets for HV Switchgear 2015 - 2020 (US$ Million)............................................. 10 The Fastest Growing National Markets for HV Switchgear 2020 - 2025 (US$ Million)............................................. 11 The Fastest Declining National Markets for HV Switchgear 2010 - 2015 (US$ Million) ............................................ 12 The Fastest Declining National Markets for HV Switchgear 2015 – 2020 (US$ Million) .......................................... 13 The Largest National Markets for HV Switchgear 2015 (US$ Million) ....................................................................... 14 The Largest National Markets for HV Switchgear 2020 (US$ Million) ....................................................................... 15
3. THE WORLD MARKET ................................................................................................................................. 16 The World Market for HV Switchgear, by Region,2010- 2015 (US$ Million) ............................................................ 16 The World Market for HV Switchgear, by Region,2010 - 2015 (% Change) ............................................................... 17 The World Market for HV Switchgear, by Region, by Equipment Type 2015 (US$ Million) ..................................... 18 The World Market for HV Switchgear, by Region, by Voltage Level 2015 (US$ Million) ......................................... 19 The World Market for HV Distribution Switchgear, by Region, by Location 2015 (US$ Million) ............................. 20 The World Market for HV Switchgear, by Region, by Type of Use 2015 (US$ Million) ............................................ 21 The World Market for HV Switchgear, by Region, by End Use Customer 2015 (US$ Million) .................................. 22 The World Market for HV Switchgear, by Region, by Technology 2015 (US$ Million) ............................................. 23
3.1 FORECAST WORLD MARKET 2016 - 2025 .......................................................................................... 25 The Forecast World Market for HV Switchgear, by Region, 2013 to 2022 (US$ Million) .......................................... 25 The Forecast World Market for HV Switchgear, by Region, 2016 to 2025 (% Change) .............................................. 26 The World Market for HV Switchgear, by Region, by Equipment Type 2025 (US$ Million) ..................................... 27 The World Market for HV Switchgear, by Region, by Voltage Level 2025 (US$ Million) ......................................... 28 The World Market for HV Distribution Switchgear, by Region, by Location 2025 (US$ Million) ............................. 29 The World Market for HV Switchgear, by Region, by Type of Use 2025 (US$ Million) ............................................ 30 The World Market for HV Switchgear, by Region, by End Use Customer 2025 (US$ Million) .................................. 31
5. MAJOR HIGH VOLTAGE SWITCHGEAR MANUFACTURERS ........................................................... 33 Leading Manufacturers’ Sales of HV Switchgear 2015 (US$ Million) ........................................................................ 33 Leading Manufacturers’ Sales of HV Switchgear, per Region, 2015 (US$ Million) - continued ................................. 35
5.1 HV SWITCHGEAR INDUSTRY CONTACT DETAILS ........................................................................ 37 5.2 Argentina .................................................................................................................................................... 37 5.3 Australia ..................................................................................................................................................... 37 5.4 Austria ........................................................................................................................................................ 39 5.5 Belgium ...................................................................................................................................................... 40 5.6 Bosnia-Herzegovina ................................................................................................................................... 41 5.7 Brazil .......................................................................................................................................................... 41 5.8 Bulgaria ...................................................................................................................................................... 43 5.9 Canada ........................................................................................................................................................ 44 5.10 Chile ........................................................................................................................................................... 46 5.11 China .......................................................................................................................................................... 46 5.12 Colombia .................................................................................................................................................... 52 5.13 Croatia ........................................................................................................................................................ 53 5.14 CzechRepublic ........................................................................................................................................... 53 5.15 Denmark ..................................................................................................................................................... 54 5.16 Egypt .......................................................................................................................................................... 55 5.17 Estonia ........................................................................................................................................................ 56 5.18 Finland ....................................................................................................................................................... 56 5.19 France ......................................................................................................................................................... 57 5.20 Germany ..................................................................................................................................................... 59 5.21 Greece ........................................................................................................................................................ 63 5.22 Hungary ...................................................................................................................................................... 64 5.23 India ........................................................................................................................................................... 65 5.24 Indonesia .................................................................................................................................................... 70

The World Markets and Manufacturers of HV Switchgear, 2015 - 2025
5.25 Iran ............................................................................................................................................................. 71 5.26 Ireland ........................................................................................................................................................ 71 5.27 Israel ........................................................................................................................................................... 72 5.28 Italy ............................................................................................................................................................ 72 5.29 Japan .......................................................................................................................................................... 75 5.30 Malaysia ..................................................................................................................................................... 78 5.31 Mexico ....................................................................................................................................................... 79 5.32 Morocco ..................................................................................................................................................... 81 5.33 Netherlands ................................................................................................................................................ 82 5.34 New Zealand .............................................................................................................................................. 83 5.35 Norway ....................................................................................................................................................... 83 5.36 Pakistan ...................................................................................................................................................... 84 5.37 Peru ............................................................................................................................................................ 84 5.38 Philippines .................................................................................................................................................. 84 5.39 Poland ........................................................................................................................................................ 85 5.40 Portugal ...................................................................................................................................................... 86 5.41 Romania ..................................................................................................................................................... 87 5.42 Russia ......................................................................................................................................................... 87 5.43 Saudi Arabia ............................................................................................................................................... 88 5.44 Serbia&Montenegro ................................................................................................................................... 89 5.45 Slovakia ...................................................................................................................................................... 89 5.46 Slovenia ...................................................................................................................................................... 90 5.47 South Africa ............................................................................................................................................... 90 5.48 South Korea................................................................................................................................................ 91 5.49 Spain .......................................................................................................................................................... 92 5.50 Sweden ....................................................................................................................................................... 94 5.51 Switzerland................................................................................................................................................. 95 5.52 Taiwan ........................................................................................................................................................ 99 5.53 Thailand ................................................................................................................................................... 100 5.54 Tunisia ...................................................................................................................................................... 101 5.55 Turkey ...................................................................................................................................................... 102 5.56 UAE ......................................................................................................................................................... 103 5.57 Ukraine ..................................................................................................................................................... 104 5.58 United Kingdom ....................................................................................................................................... 104 5.59 USA.......................................................................................................................................................... 111
6. REGIONAL MARKETS ................................................................................................................................ 119 6.1 WESTERN EUROPE .............................................................................................................................. 119
Western Europe The Market for HV Switchgear, by Country, 2010 – 2015 (US$ Million) ....................................... 119 Western Europe: The Market for HV Switchgear, by Country,2010 – 2015 (% Change) .......................................... 120 Western Europe: The Market for HV Switchgear, by Country, by Equipment Type 2015 (US$ Million) ................. 121 Western Europe: The Market for HV Switchgear, by Country, by Voltage 2015 (US$ Million) ............................... 122 Western Europe: The Market for HV Distribution Switchgear, by Country, by Location 2015 (US$ Million) ......... 123 Western Europe: The Market for HV Switchgear, by Country, by Type of Use 2015 (US$ Million) ........................ 124 Western Europe: The Market for HV Switchgear, by Country, by Technology 2015 (US$ Million) ......................... 124 Western Europe: The Market for HV Switchgear, by Country, by End Use Customer 2015 (US$ Million) .............. 125 Western Europe: The Market for HV Switchgear, by Country, 2016 to 2025 (US$ Million) .................................... 126 Western Europe: The Market for HV Switchgear, by Country, 2016 to 2025 (% Change) ........................................ 127 Western Europe: The Market for HV Switchgear, by Country, by Equipment Type 2025 (US$ Million) ................. 128 Western Europe: The Market for HV Switchgear, by Country, by Voltage 2025 (US$ Million) ............................... 129 Western Europe: The Market for HV Distribution Switchgear, by Country, by Location 2025 (US$ Million) ......... 130 Western Europe: The Market for HV Switchgear, by Country, by Type of Use 2025 (US$ Million) ........................ 131 Western Europe: The Market for HV Switchgear, by Country, by Technology 2025 (US$ Million) ......................... 131 Western Europe: The Market for HV Switchgear, by Country, by End Use Customer 2025 (US$ Million) .............. 132
6.2 EASTERN EUROPE ............................................................................................................................... 133 Eastern EuropeThe Market for HV Switchgear, by Country, 2010 - 2015 (US$ Million) .......................................... 133 Eastern Europe: The Market for HV Switchgear, by Country,2010 – 2015(% Change) ............................................ 134 Eastern Europe: The Market for HV Switchgear, by Country, by Equipment Type 2015 (US$ Million) .................. 135 Eastern Europe: The Market for HV Switchgear, by Country, by Voltage 2015 (US$ Million) ................................ 136 Eastern Europe: The Market for HV Switchgear, by Country, by Location 2015 (US$ Million) ............................... 137 Eastern Europe: The Market for HV Switchgear, by Country, by Type of Use 2015(US$ Million) .......................... 138 Eastern Europe: The Market for HV Switchgear, by Country, by Technology 2015(US$ Million) ........................... 138

The World Markets and Manufacturers of HV Switchgear, 2015 - 2025
Eastern Europe: The Market for HV Switchgear, by Country, by End Use Customer 2015 (US$ Million) ............... 139 Eastern Europe: The Market for HV Switchgear, by Country, 2016 to 2025 (US$ Million) ...................................... 140 Eastern Europe: The Market for HV Switchgear, by Country, 2016 to 2025 (% Change) ......................................... 141 Eastern Europe: The Market for HV Switchgear, by Country, by Equipment Type 2025 (US$ Million) .................. 142 Eastern Europe: The Market for HV Switchgear, by Country, by Voltage 2025 (US$ Million) ................................ 143 Eastern Europe: The Market for HV Switchgear, by Country, by Location 2025 (US$ Million) ............................... 144 Eastern Europe: The Market for HV Switchgear, by Country, by Type of Use 2025 (US$ Million) ......................... 145 Eastern Europe: The Market for HV Switchgear, by Country, by Technology 2025 (US$ Million) .......................... 145 Eastern Europe: The Market for HV Switchgear, by Country, by End Use Customer 2025 (US$ Million) ............... 146
6.3 FORMER SOVIET UNION .................................................................................................................... 147 Former Soviet UnionThe Market for HV Switchgear, by Country, 2010 - 2015 (US$ Million) ................................ 147 Former Soviet Union: The Market for HV Switchgear, by Country,2010 - 2015 (% Change) ................................... 148 Former Soviet Union: The Market for HV Switchgear, by Country, by Equipment Type 2015 (US$ Million) ......... 149 Former Soviet Union: The Market for HV Switchgear, by Country, by Voltage 2015 (US$ Million) ....................... 150 Former Soviet Union: The Market for HV Switchgear, by Country, by Location 2015 (US$ Million) ..................... 151 Former Soviet Union: The Market for HV Switchgear, by Country, by Type of Use 2015 (US$ Million) ................ 152 Former Soviet Union: The Market for HV Switchgear, by Country, by Technology 2015 (US$ Million) ................. 152 Former Soviet Union: The Market for HV Switchgear, by Country, by End Use Customer 2015 (US$ Million) ...... 153 Former Soviet Union: The Market for HV Switchgear, by Country, 2016 to 2025 (US$ Million) ............................ 154 Former Soviet Union: The Market for HV Switchgear, by Country, 2016 to 2025 (% Change) ................................ 155 Former Soviet Union: The Market for HV Switchgear, by Country, by Equipment Type 2025 (US$ Million) ......... 156 Former Soviet Union: The Market for HV Switchgear, by Country, by Voltage 2025 (US$ Million) ....................... 157 Former Soviet Union: The Market for HV Switchgear, by Country, by Location 2025 (US$ Million) ..................... 158 Former Soviet Union: The Market for HV Switchgear, by Country, by Type of Use 2025 (US$ Million) ................ 159 Former Soviet Union: The Market for HV Switchgear, by Country, by Technology 2025 (US$ Million) ................. 159 Former Soviet Union: The Market for HV Switchgear, by Country, by End Use Customer 2025 (US$ Million) ...... 160
6.4 NORTH AFRICA .................................................................................................................................... 161 North Africa The Market for HV Switchgear, by Country, 2010 - 2016 (US$ Million) ............................................. 161 North Africa: The Market for HV Switchgear, by Country,2010 - 2015 (% Change) ................................................ 161 North Africa: The Market for HV Switchgear, by Country, by Equipment Type 2015 (US$ Million) ...................... 162 North Africa: The Market for HV Switchgear, by Country, by Voltage 2015 (US$ Million) .................................... 162 North Africa: The Market for HV Switchgear, by Country, by Location 2015 (US$ Million) ................................... 163 North Africa: The Market for HV Switchgear, by Country, by Type of Use 2015 (US$ Million) ............................. 163 North Africa: The Market for HV Switchgear, by Country, by Technology 2015 (US$ Million) .............................. 163 North Africa: The Market for HV Switchgear, by Country, by End Use Customer 2015 (US$ Million) ................... 164 North Africa: The Market for HV Switchgear, by Country, 2016 to 2025 (US$ Million) .......................................... 164 North Africa: The Market for HV Switchgear, by Country, 2016 to 2025 (% Change) ............................................. 165 North Africa: The Market for HV Switchgear, by Country, by Equipment Type 2025 (US$ Million) ...................... 165 North Africa: The Market for HV Switchgear, by Country, by Voltage 2025 (US$ Million) .................................... 166 North Africa: The Market for HV Switchgear, by Country, by Location 2025 (US$ Million) ................................... 166 North Africa: The Market for HV Switchgear, by Country, by Type of Use 2025 (US$ Million) ............................. 167 North Africa: The Market for HV Switchgear, by Country, by Technology 2025 (US$ Million) .............................. 167 North Africa: The Market for HV Switchgear, by Country, by End Use Customer 2025 (US$ Million) ................... 167
6.5 WEST AFRICA ....................................................................................................................................... 169 West AfricaThe Market for HV Switchgear, by Country, 2010 - 2015 (US$ Million) ............................................... 169 West Africa: The Market for HV Switchgear, by Country,2010 - 2015 (% Change) ................................................. 170 West Africa: The Market for HV Switchgear, by Country, by Equipment Type 2015 (US$ Million) ....................... 171 West Africa: The Market for HV Switchgear, by Country, by Voltage 2015 (US$ Million) ..................................... 172 West Africa: The Market for HV Switchgear, by Country, by Location 2015 (US$ Million) .................................... 173 West Africa: The Market for HV Switchgear, by Country, by Type of Use 2015 (US$ Million) .............................. 174 West Africa: The Market for HV Switchgear, by Country, by Technology 2015 (US$ Million) ............................... 174 West Africa: The Market for HV Switchgear, by Country, by End Use Customer 2015 (US$ Million) .................... 175 West Africa: The Market for HV Switchgear, by Country, 2016 to 2025 (US$ Million) ........................................... 176 West Africa: The Market for HV Switchgear, by Country, 2016 to 2025 (% Change) .............................................. 177 West Africa: The Market for HV Switchgear, by Country, by Equipment Type 2025 (US$ Million) ....................... 178 West Africa: The Market for HV Switchgear, by Country, by Voltage 2025 (US$ Million) ..................................... 179 West Africa: The Market for HV Switchgear, by Country, by Location 2025 (US$ Million) .................................... 180 West Africa: The Market for HV Switchgear, by Country, by Type of Use 2025 (US$ Million) .............................. 181 West Africa: The Market for HV Switchgear, by Country, by Technology 2025 (US$ Million) ............................... 181 West Africa: The Market for HV Switchgear, by Country, by End Use Customer 2025 (US$ Million) .................... 182
6.6 CENTRAL AFRICA ................................................................................................................................ 183 Central AfricaThe Market for HV Switchgear, by Country, 2010 - 2015 (US$ Million) ........................................... 183 Central Africa: The Market for HV Switchgear, by Country,2010 – 2015(% Change) .............................................. 183 Central Africa: The Market for HV Switchgear, by Country, by Equipment Type 2015 (US$ Million) .................... 184 Central Africa: The Market for HV Switchgear, by Country, by Voltage 2015 (US$ Million) .................................. 184 Central Africa: The Market for HV Switchgear, by Country, by Location 2015 (US$ Million) ................................ 185

The World Markets and Manufacturers of HV Switchgear, 2015 - 2025
Central Africa: The Market for HV Switchgear, by Country, by Type of Use 2015 (US$ Million) ........................... 185 Central Africa: The Market for HV Switchgear, by Country, by Technology 2015 (US$ Million) ........................... 185 Central Africa: The Market for HV Switchgear, by Country, by End Use Customer 2015 (US$ Million) ................ 186 Central Africa: The Market for HV Switchgear, by Country, 2016 to 2025 (US$ Million) ....................................... 186 Central Africa: The Market for HV Switchgear, by Country, 2016 to 2025 (% Change) ........................................... 187 Central Africa: The Market for HV Switchgear, by Country, by Equipment Type 2025 (US$ Million) .................... 187 Central Africa: The Market for HV Switchgear, by Country, by Voltage 2025 (US$ Million) .................................. 188 Central Africa: The Market for HV Switchgear, by Country, by Location 2025 (US$ Million) ................................ 188 Central Africa: The Market for HV Switchgear, by Country, by Type of Use 2025 (US$ Million) ........................... 189 Central Africa: The Market for HV Switchgear, by Country, by Technology 2025 (US$ Million) ........................... 189 Central Africa: The Market for HV Switchgear, by Country, by End Use Customer 2025 (US$ Million) ................ 189
6.7 EAST AFRICA ........................................................................................................................................ 191 East AfricaThe Market for HV Switchgear, by Country, 2010 - 2015 (US$ Million) ................................................ 191 East Africa: The Market for HV Switchgear, by Country, 2010 - 2015 (% Change) ................................................. 192 East Africa: The Market for HV Switchgear, by Country, by Equipment Type 2015 (US$ Million) ......................... 193 East Africa: The Market for HV Switchgear, by Country, by Voltage 2015 (US$ Million) ....................................... 194 East Africa: The Market for HV Switchgear, by Country, by Location 2015 (US$ Million) ..................................... 195 East Africa: The Market for HV Switchgear, by Country, by Type of Use 2015 (US$ Million) ................................ 196 East Africa: The Market for HV Switchgear, by Country, by Technology 2015 (US$ Million) ................................ 196 East Africa: The Market for HV Switchgear, by Country, by End Use Customer 2015 (US$ Million) ..................... 197 East Africa: The Market for HV Switchgear, by Country, 2015 to 2025 (US$ Million) ............................................ 198 East Africa: The Market for HV Switchgear, by Country, 2015 to 2025 (% Change) ................................................ 199 East Africa: The Market for HV Switchgear, by Country, by Equipment Type 2025 (US$ Million) ......................... 200 East Africa: The Market for HV Switchgear, by Country, by Voltage 2025 (US$ Million) ....................................... 201 East Africa: The Market for HV Switchgear, by Country, by Location 2025 (US$ Million) ..................................... 202 East Africa: The Market for HV Switchgear, by Country, by Type of Use 2025 (US$ Million) ................................ 203 East Africa: The Market for HV Switchgear, by Country, by Technology 2025 (US$ Million) ................................ 203 East Africa: The Market for HV Switchgear, by Country, by End Use Customer 2025 (US$ Million) ..................... 204
6.8 SOUTHERN AFRICA ............................................................................................................................. 205 Southern AfricaThe Market for HV Switchgear, by Country, 2010 - 2015 (US$ Million) ........................................ 205 Southern Africa: The Market for HV Switchgear, by Country, 2010- 2015 (% Change) ........................................... 205 Southern Africa: The Market for HV Switchgear, by Country, by Equipment Type 2015 (US$ Million) ................. 206 Southern Africa: The Market for HV Switchgear, by Country, by Voltage 2015 (US$ Million) ............................... 206 Southern Africa: The Market for HV Switchgear, by Country, by Location 2015 (US$ Million) .............................. 207 Southern Africa: The Market for HV Switchgear, by Country, by Type of Use 2015 (US$ Million) ........................ 207 Southern Africa: The Market for HV Switchgear, by Country, by Technology 2015 (US$ Million) ......................... 207 Southern Africa: The Market for HV Switchgear, by Country, by End Use Customer 2015 (US$ Million) .............. 208 Southern Africa: The Market for HV Switchgear, by Country, 2016 to 2025 (US$ Million) ..................................... 208 Southern Africa: The Market for HV Switchgear, by Country, 2016 to 2025 (% Change) ........................................ 209 Southern Africa: The Market for HV Switchgear, by Country, by Equipment Type 2025 (US$ Million) ................. 209 Southern Africa: The Market for HV Switchgear, by Country, by Voltage 2025 (US$ Million) ............................... 210 Southern Africa: The Market for HV Switchgear, by Country, by Location 2025 (US$ Million) .............................. 210 Southern Africa: The Market for HV Switchgear, by Country, by Type of Use 2025 (US$ Million) ........................ 211 Southern Africa: The Market for HV Switchgear, by Country, by Technology 2025 (US$ Million) ......................... 211 Southern Africa: The Market for HV Switchgear, by Country, by End Use Customer 2025 (US$ Million) .............. 211
6.9 MIDDLE EAST ....................................................................................................................................... 213 Middle EastThe Market for HV Switchgear, by Country, 2010 - 2015 (US$ Million) ............................................... 213 Middle East: The Market for HV Switchgear, by Country,2010 - 2015 (% Change) ................................................. 214 Middle East: The Market for HV Switchgear, by Country, by Equipment Type 2015 (US$ Million) ....................... 215 Middle East: The Market for HV Switchgear, by Country, by Voltage 2015 (US$ Million) ..................................... 216 Middle East: The Market for HV Switchgear, by Country, by Location 2015 (US$ Million) .................................... 217 Middle East: The Market for HV Switchgear, by Country, by Type of Use 2015 (US$ Million) .............................. 218 Middle East: The Market for HV Switchgear, by Country, by Technology 2015 (US$ Million) ............................... 218 Middle East: The Market for HV Switchgear, by Country, by End Use Customer 2015 (US$ Million) .................... 219 Middle East: The Market for HV Switchgear, by Country, 2016 to 2025 (US$ Million) ........................................... 220 Middle East: The Market for HV Switchgear, by Country, 2016 to 2025 (% Change) .............................................. 221 Middle East: The Market for HV Switchgear, by Country, by Equipment Type 2025 (US$ Million) ....................... 222 Middle East: The Market for HV Switchgear, by Country, by Voltage 2025 (US$ Million) ..................................... 223 Middle East: The Market for HV Switchgear, by Country, by Location 2025 (US$ Million) .................................... 224 Middle East: The Market for HV Switchgear, by Country, by Type of Use 2025 (US$ Million) .............................. 225 Middle East: The Market for HV Switchgear, by Country, by Technology 2025 (US$ Million) ............................... 225 Middle East: The Market for HV Switchgear, by Country, by End Use Customer 2025 (US$ Million) .................... 226
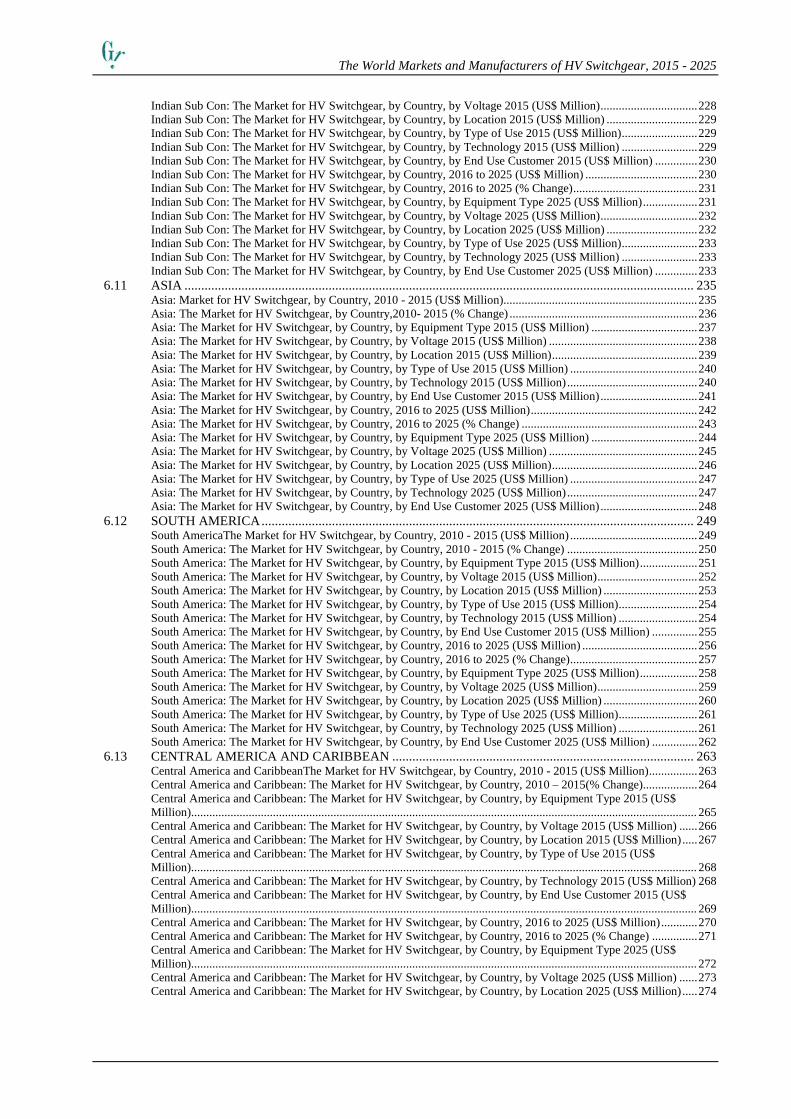
6.10 INDIAN SUB CONTINENT ................................................................................................................... 227 Indian Sub Con: The Market for HV Switchgear, by Country, 2010 - 2015 (US$ Million) ....................................... 227 Indian Sub Con: The Market for HV Switchgear, by Country,2010 - 2015 (% Change) ........................................... 227 Indian Sub Con: The Market for HV Switchgear, by Country, by Equipment Type 2015 (US$ Million) .................. 228
The World Markets and Manufacturers of HV Switchgear, 2015 - 2025
Indian Sub Con: The Market for HV Switchgear, by Country, by Voltage 2015 (US$ Million) ................................ 228 Indian Sub Con: The Market for HV Switchgear, by Country, by Location 2015 (US$ Million) .............................. 229 Indian Sub Con: The Market for HV Switchgear, by Country, by Type of Use 2015 (US$ Million) ......................... 229 Indian Sub Con: The Market for HV Switchgear, by Country, by Technology 2015 (US$ Million) ......................... 229 Indian Sub Con: The Market for HV Switchgear, by Country, by End Use Customer 2015 (US$ Million) .............. 230 Indian Sub Con: The Market for HV Switchgear, by Country, 2016 to 2025 (US$ Million) ..................................... 230 Indian Sub Con: The Market for HV Switchgear, by Country, 2016 to 2025 (% Change) ......................................... 231 Indian Sub Con: The Market for HV Switchgear, by Country, by Equipment Type 2025 (US$ Million) .................. 231 Indian Sub Con: The Market for HV Switchgear, by Country, by Voltage 2025 (US$ Million) ................................ 232 Indian Sub Con: The Market for HV Switchgear, by Country, by Location 2025 (US$ Million) .............................. 232 Indian Sub Con: The Market for HV Switchgear, by Country, by Type of Use 2025 (US$ Million) ......................... 233 Indian Sub Con: The Market for HV Switchgear, by Country, by Technology 2025 (US$ Million) ......................... 233 Indian Sub Con: The Market for HV Switchgear, by Country, by End Use Customer 2025 (US$ Million) .............. 233
6.11 ASIA ........................................................................................................................................................ 235 Asia: Market for HV Switchgear, by Country, 2010 - 2015 (US$ Million) ................................................................ 235 Asia: The Market for HV Switchgear, by Country,2010- 2015 (% Change) .............................................................. 236 Asia: The Market for HV Switchgear, by Country, by Equipment Type 2015 (US$ Million) ................................... 237 Asia: The Market for HV Switchgear, by Country, by Voltage 2015 (US$ Million) ................................................. 238 Asia: The Market for HV Switchgear, by Country, by Location 2015 (US$ Million) ................................................ 239 Asia: The Market for HV Switchgear, by Country, by Type of Use 2015 (US$ Million) .......................................... 240 Asia: The Market for HV Switchgear, by Country, by Technology 2015 (US$ Million) ........................................... 240 Asia: The Market for HV Switchgear, by Country, by End Use Customer 2015 (US$ Million) ................................ 241 Asia: The Market for HV Switchgear, by Country, 2016 to 2025 (US$ Million) ....................................................... 242 Asia: The Market for HV Switchgear, by Country, 2016 to 2025 (% Change) .......................................................... 243 Asia: The Market for HV Switchgear, by Country, by Equipment Type 2025 (US$ Million) ................................... 244 Asia: The Market for HV Switchgear, by Country, by Voltage 2025 (US$ Million) ................................................. 245 Asia: The Market for HV Switchgear, by Country, by Location 2025 (US$ Million) ................................................ 246 Asia: The Market for HV Switchgear, by Country, by Type of Use 2025 (US$ Million) .......................................... 247 Asia: The Market for HV Switchgear, by Country, by Technology 2025 (US$ Million) ........................................... 247 Asia: The Market for HV Switchgear, by Country, by End Use Customer 2025 (US$ Million) ................................ 248
6.12 SOUTH AMERICA ................................................................................................................................. 249 South AmericaThe Market for HV Switchgear, by Country, 2010 - 2015 (US$ Million) .......................................... 249 South America: The Market for HV Switchgear, by Country, 2010 - 2015 (% Change) ........................................... 250 South America: The Market for HV Switchgear, by Country, by Equipment Type 2015 (US$ Million) ................... 251 South America: The Market for HV Switchgear, by Country, by Voltage 2015 (US$ Million) ................................. 252 South America: The Market for HV Switchgear, by Country, by Location 2015 (US$ Million) ............................... 253 South America: The Market for HV Switchgear, by Country, by Type of Use 2015 (US$ Million) .......................... 254 South America: The Market for HV Switchgear, by Country, by Technology 2015 (US$ Million) .......................... 254 South America: The Market for HV Switchgear, by Country, by End Use Customer 2015 (US$ Million) ............... 255 South America: The Market for HV Switchgear, by Country, 2016 to 2025 (US$ Million) ...................................... 256 South America: The Market for HV Switchgear, by Country, 2016 to 2025 (% Change) .......................................... 257 South America: The Market for HV Switchgear, by Country, by Equipment Type 2025 (US$ Million) ................... 258 South America: The Market for HV Switchgear, by Country, by Voltage 2025 (US$ Million) ................................. 259 South America: The Market for HV Switchgear, by Country, by Location 2025 (US$ Million) ............................... 260 South America: The Market for HV Switchgear, by Country, by Type of Use 2025 (US$ Million) .......................... 261 South America: The Market for HV Switchgear, by Country, by Technology 2025 (US$ Million) .......................... 261 South America: The Market for HV Switchgear, by Country, by End Use Customer 2025 (US$ Million) ............... 262
6.13 CENTRAL AMERICA AND CARIBBEAN .......................................................................................... 263 Central America and CaribbeanThe Market for HV Switchgear, by Country, 2010 - 2015 (US$ Million) ................ 263 Central America and Caribbean: The Market for HV Switchgear, by Country, 2010 – 2015(% Change).................. 264 Central America and Caribbean: The Market for HV Switchgear, by Country, by Equipment Type 2015 (US$ Million) ....................................................................................................................................................................... 265 Central America and Caribbean: The Market for HV Switchgear, by Country, by Voltage 2015 (US$ Million) ...... 266 Central America and Caribbean: The Market for HV Switchgear, by Country, by Location 2015 (US$ Million) ..... 267 Central America and Caribbean: The Market for HV Switchgear, by Country, by Type of Use 2015 (US$ Million) ....................................................................................................................................................................... 268 Central America and Caribbean: The Market for HV Switchgear, by Country, by Technology 2015 (US$ Million) 268 Central America and Caribbean: The Market for HV Switchgear, by Country, by End Use Customer 2015 (US$ Million) ....................................................................................................................................................................... 269 Central America and Caribbean: The Market for HV Switchgear, by Country, 2016 to 2025 (US$ Million) ............ 270 Central America and Caribbean: The Market for HV Switchgear, by Country, 2016 to 2025 (% Change) ............... 271 Central America and Caribbean: The Market for HV Switchgear, by Country, by Equipment Type 2025 (US$ Million) ....................................................................................................................................................................... 272 Central America and Caribbean: The Market for HV Switchgear, by Country, by Voltage 2025 (US$ Million) ...... 273 Central America and Caribbean: The Market for HV Switchgear, by Country, by Location 2025 (US$ Million) ..... 274
The World Markets and Manufacturers of HV Switchgear, 2015 - 2025
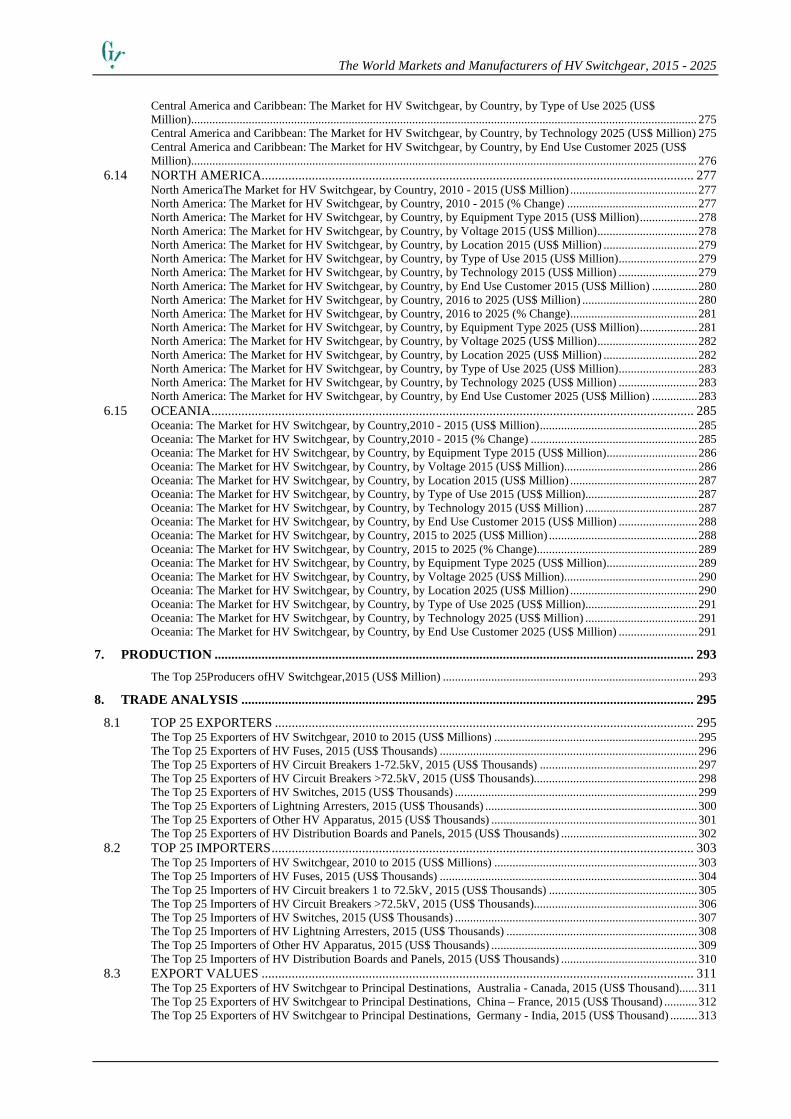
Central America and Caribbean: The Market for HV Switchgear, by Country, by Type of Use 2025 (US$ Million) ....................................................................................................................................................................... 275 Central America and Caribbean: The Market for HV Switchgear, by Country, by Technology 2025 (US$ Million) 275 Central America and Caribbean: The Market for HV Switchgear, by Country, by End Use Customer 2025 (US$ Million) ....................................................................................................................................................................... 276
6.14 NORTH AMERICA................................................................................................................................. 277 North AmericaThe Market for HV Switchgear, by Country, 2010 - 2015 (US$ Million) .......................................... 277 North America: The Market for HV Switchgear, by Country, 2010 - 2015 (% Change) ........................................... 277 North America: The Market for HV Switchgear, by Country, by Equipment Type 2015 (US$ Million) ................... 278 North America: The Market for HV Switchgear, by Country, by Voltage 2015 (US$ Million) ................................. 278 North America: The Market for HV Switchgear, by Country, by Location 2015 (US$ Million) ............................... 279 North America: The Market for HV Switchgear, by Country, by Type of Use 2015 (US$ Million) .......................... 279 North America: The Market for HV Switchgear, by Country, by Technology 2015 (US$ Million) .......................... 279 North America: The Market for HV Switchgear, by Country, by End Use Customer 2015 (US$ Million) ............... 280 North America: The Market for HV Switchgear, by Country, 2016 to 2025 (US$ Million) ...................................... 280 North America: The Market for HV Switchgear, by Country, 2016 to 2025 (% Change) .......................................... 281 North America: The Market for HV Switchgear, by Country, by Equipment Type 2025 (US$ Million) ................... 281 North America: The Market for HV Switchgear, by Country, by Voltage 2025 (US$ Million) ................................. 282 North America: The Market for HV Switchgear, by Country, by Location 2025 (US$ Million) ............................... 282 North America: The Market for HV Switchgear, by Country, by Type of Use 2025 (US$ Million) .......................... 283 North America: The Market for HV Switchgear, by Country, by Technology 2025 (US$ Million) .......................... 283 North America: The Market for HV Switchgear, by Country, by End Use Customer 2025 (US$ Million) ............... 283
6.15 OCEANIA ................................................................................................................................................ 285 Oceania: The Market for HV Switchgear, by Country,2010 - 2015 (US$ Million) .................................................... 285 Oceania: The Market for HV Switchgear, by Country,2010 - 2015 (% Change) ....................................................... 285 Oceania: The Market for HV Switchgear, by Country, by Equipment Type 2015 (US$ Million) .............................. 286 Oceania: The Market for HV Switchgear, by Country, by Voltage 2015 (US$ Million) ............................................ 286 Oceania: The Market for HV Switchgear, by Country, by Location 2015 (US$ Million) .......................................... 287 Oceania: The Market for HV Switchgear, by Country, by Type of Use 2015 (US$ Million) ..................................... 287 Oceania: The Market for HV Switchgear, by Country, by Technology 2015 (US$ Million) ..................................... 287 Oceania: The Market for HV Switchgear, by Country, by End Use Customer 2015 (US$ Million) .......................... 288 Oceania: The Market for HV Switchgear, by Country, 2015 to 2025 (US$ Million) ................................................. 288 Oceania: The Market for HV Switchgear, by Country, 2015 to 2025 (% Change)..................................................... 289 Oceania: The Market for HV Switchgear, by Country, by Equipment Type 2025 (US$ Million) .............................. 289 Oceania: The Market for HV Switchgear, by Country, by Voltage 2025 (US$ Million) ............................................ 290 Oceania: The Market for HV Switchgear, by Country, by Location 2025 (US$ Million) .......................................... 290 Oceania: The Market for HV Switchgear, by Country, by Type of Use 2025 (US$ Million) ..................................... 291 Oceania: The Market for HV Switchgear, by Country, by Technology 2025 (US$ Million) ..................................... 291 Oceania: The Market for HV Switchgear, by Country, by End Use Customer 2025 (US$ Million) .......................... 291
7. PRODUCTION ............................................................................................................................................... 293 The Top 25Producers ofHV Switchgear,2015 (US$ Million) .................................................................................... 293
8. TRADE ANALYSIS ....................................................................................................................................... 295 8.1 TOP 25 EXPORTERS ............................................................................................................................. 295
The Top 25 Exporters of HV Switchgear, 2010 to 2015 (US$ Millions) ................................................................... 295 The Top 25 Exporters of HV Fuses, 2015 (US$ Thousands) ..................................................................................... 296 The Top 25 Exporters of HV Circuit Breakers 1-72.5kV, 2015 (US$ Thousands) .................................................... 297 The Top 25 Exporters of HV Circuit Breakers >72.5kV, 2015 (US$ Thousands)...................................................... 298 The Top 25 Exporters of HV Switches, 2015 (US$ Thousands) ................................................................................ 299 The Top 25 Exporters of Lightning Arresters, 2015 (US$ Thousands) ...................................................................... 300 The Top 25 Exporters of Other HV Apparatus, 2015 (US$ Thousands) .................................................................... 301 The Top 25 Exporters of HV Distribution Boards and Panels, 2015 (US$ Thousands) ............................................. 302
8.2 TOP 25 IMPORTERS .............................................................................................................................. 303 The Top 25 Importers of HV Switchgear, 2010 to 2015 (US$ Millions) ................................................................... 303 The Top 25 Importers of HV Fuses, 2015 (US$ Thousands) ..................................................................................... 304 The Top 25 Importers of HV Circuit breakers 1 to 72.5kV, 2015 (US$ Thousands) ................................................. 305 The Top 25 Importers of HV Circuit Breakers >72.5kV, 2015 (US$ Thousands)...................................................... 306 The Top 25 Importers of HV Switches, 2015 (US$ Thousands) ................................................................................ 307 The Top 25 Importers of HV Lightning Arresters, 2015 (US$ Thousands) ............................................................... 308 The Top 25 Importers of Other HV Apparatus, 2015 (US$ Thousands) .................................................................... 309 The Top 25 Importers of HV Distribution Boards and Panels, 2015 (US$ Thousands) ............................................. 310
8.3 EXPORT VALUES ................................................................................................................................. 311 The Top 25 Exporters of HV Switchgear to Principal Destinations, Australia - Canada, 2015 (US$ Thousand) ...... 311 The Top 25 Exporters of HV Switchgear to Principal Destinations, China – France, 2015 (US$ Thousand) ........... 312 The Top 25 Exporters of HV Switchgear to Principal Destinations, Germany - India, 2015 (US$ Thousand) ......... 313

The World Markets and Manufacturers of HV Switchgear, 2015 - 2025
The Top 25 Exporters of HV Switchgear to Principal Destinations, Italy – Korea South, 2015 (US$ Thousand) .... 314 The Top 25 Exporters of HV Switchgear to Principal Destinations, Malaysia - Netherlands, 2015 (US$ Thousand) ................................................................................................................................................................... 315 The Top 25 Exporters of HV Switchgear to Principal Destinations, Norway – Portugal, 2015 (US$ Thousand) ..... 316 The Top 25 Exporters of HV Switchgear to Principal Destinations, Singapore - Sweden, 2015 (US$ Thousand) ... 317 The Top 25 Exporters of HV Switchgear to Principal Destinations, Switzerland - Turkey, 2015 (US$ Thousand) .. 318 The Top 25 Exporters of HV Switchgear to Principal Destinations, UK - USA, 2015 (US$ Thousand) .................. 319
8.4 EXPORT PERCENTAGES ..................................................................................................................... 320 The Top 25 Exporters of HV Switchgear to Principal Destinations, Australia - Canada, 2015 (% by Value) ........... 320 The Top 25 Exporters of HV Switchgear to Principal Destinations, China – France, 2015 (% by Value) ................ 321 The Top 25 Exporters of HV Switchgear to Principal Destinations, Germany - India, 2015 (% by Value) .............. 322 The Top 25 Exporters of HV Switchgear to Principal Destinations, Italy – Korea South, 2015 (% by Value) ......... 323 The Top 25 Exporters of HV Switchgear to Principal Destinations, Malaysia - Netherlands, 2015 (% by Value) ... 324 The Top 25 Exporters of HV Switchgear to Principal Destinations, Norway – Portugal, 2015 ((% by Value) ......... 325 The Top 25 Exporters of HV Switchgear to Principal Destinations, Singapore - Sweden, 2015 ((% by Value) ....... 326 The Top 25 Exporters of HV Switchgear to Principal Destinations, Switzerland - Turkey, 2015 ((% by Value) ..... 327 The Top 25 Exporters of HV Switchgear to Principal Destinations, UK - USA, 2015 ((% by Value) ...................... 328
8.5 IMPORT VALUES .................................................................................................................................. 329 Importers of HV Switchgear by Type, 2010 to 2015 Averaged (US$Thousands) ..................................................... 329 Importers of HV Switchgear by Type, 2010 to 2015 Averaged (US$ Thousands) .................................................... 330 Importers of HV Switchgear by Type, 2010 to 2015 Averaged (US$ Thousands) .................................................... 331 Importers of HV Switchgear by Type, 2010 to 2015 Averaged (US$ Thousands) .................................................... 332 Importers of HV Switchgear by Type, 2010 to 2015 Averaged (US$ Thousands) .................................................... 333 Importers of HV Switchgear by Type, 2010 to 2015 Averaged (US$ Thousands) .................................................... 334 Importers of HV Switchgear by Type, 2010 to 2015 Averaged (US$ Thousands) .................................................... 335 Importers of HV Switchgear by Type, 2010 to 2015 Averaged (US$ Thousands) .................................................... 336 Importers of HV Switchgear by Type, 2010 to 2015 Averaged (US$ Thousands) ................................................... 337
8.6 IMPORT VALUES .................................................................................................................................. 338 8.6.1 HV Switchgear Imports by Country Alphabetical 2015 ........................................................................... 338
Imports of HV Switchgear, by Country, Albania - Antigua 2015 (US$ Thousand) .................................................. 338 Imports of HV Switchgear, by Country, Argentina - Aruba 2015 (US$ Thousand) ................................................... 339 Imports of HV Switchgear, by Country, Australia - Azerbaijan 2015 (US$ Thousand) ............................................ 340 Imports of HV Switchgear, by Country, Bahamas - Barbados 2015 (US$ Thousand) .............................................. 341 Imports of HV Switchgear, by Country, Belarus - Belize 2015 (US$ Thousand) ...................................................... 342 Imports of HV Switchgear, by Country, Bermuda - Bolivia 2015 (US$ Thousand) .................................................. 343 Imports of HV Switchgear, by Country, Bosnia - Brazil 2015 (US$ Thousand) ........................................................ 344 Imports of HV Switchgear, by Country Bosnia - Brazil 2015 (US$ Thousand) ......................................................... 345 Imports of HV Switchgear, by Country, Cambodia - Canada 2015 (US$ Thousand) ............................................... 346 Imports of HV Switchgear, by Country, Chile–Hong Kong 2015 (US$ Thousand) ................................................... 347 Imports of HV Switchgear, by Country, China Macau – Costa Rica 2015 (US$ Thousand) ..................................... 348 Imports of HV Switchgear, by Country, Cote d’Ivoire - Cyprus 2015 (US$ Thousand) ............................................ 349 Imports of HV Switchgear, by Country, Czech Rep. – Dominican Rep. 2015 (US$ Thousand) ................................ 350 Imports of HV Switchgear, by Country, Ecuador–El Salvador 2015 (US$ Thousand) .............................................. 351 Imports of HV Switchgear, by Country, Estonia – Fiji 2015 (US$ Thousand) .......................................................... 352 Imports of HV Switchgear, by Country, Finland–French Polynesia 2015 (US$ Thousand) ...................................... 353 Imports of HV Switchgear, by Country, Georgia - Ghana 2015 (US$ Thousand)..................................................... 354 Imports of HV Switchgear, by Country, Greece - Guyana 2015(US$ Thousand) ...................................................... 355 Imports of HV Switchgear, by Country, Honduras – Iceland 2015 (US$ Thousand) ................................................ 356 Imports of HV Switchgear, by Country, India - Iran 2015 (US$ Thousand) .............................................................. 357 Imports of HV Switchgear, by Country, Ireland - Italy 2015 (US$ Thousand) .......................................................... 358 Imports of HV Switchgear, by Country, Jamaica - Jordan 2015 (US$ Thousand) .................................................... 359 Imports of HV Switchgear, by Country, Kazakhstan – Kyrgyzstan 2015 (US$ Thousand) ....................................... 360 Imports of HV Switchgear, by Country, Latvia – Lithuania 2015 (US$ Thousand) .................................................. 361 Imports of HV Switchgear, by Country, Luxembourg – Madagascar 2015 (US$ Thousand) ................................... 362 Imports of HV Switchgear, by Country, Malaysia - Mali 2015 (US$ Thousand) ....................................................... 363 Imports of HV Switchgear, by Country, Malta - Mauritius 2015 (US$ Thousand) .................................................... 364 Imports of HV Switchgear, by Country, Mexico - Montenegro 2015 (US$ Thousand) ............................................. 365 Imports of HV Switchgear, by Country, Morocco – Namibia 2015 (US$ Thousand) ................................................ 366 Imports of HV Switchgear, by Country, Netherlands–New Zealand 2015 (US$ Thousand) ...................................... 367 Imports of HV Switchgear, by Country, Nicaragua - Norway 2015 (US$ Thousand) ................................................ 368 Imports of HV Switchgear, by Country, Oman - Panama 2015 (US$ Thousand) ...................................................... 369 Imports of HV Switchgear, by Country, Papua NG–Peru 2015(US$ Thousand) ....................................................... 370 Imports of HV Switchgear, by Country, Philippines - Portugal 2015 (US$ Thousand) ............................................. 371 Imports of HV Switchgear, by Country, Romania - Rwanda 2015 (US$ Thousand) ................................................. 372 Imports of HV Switchgear, by Country, Saudi Arabia - Serbia 2015 (US$ Thousand) .............................................. 373 Imports of HV Switchgear, by Country, Singapore - Slovenia 2015 (US$ Thousand) ............................................... 374

The World Markets and Manufacturers of HV Switchgear, 2015 - 2025
Imports of HV Switchgear, by Country, S. Africa–Sri Lanka 2015 (US$ Thousand) ................................................ 375 Imports of HV Switchgear, by Country, Sudan – Sweden2015(US$ Thousand) ....................................................... 376 Imports of HV Switchgear, by Country, Switzerland - Thailand 2015 (US$ Thousand) .......................................... 377 Imports of HV Switchgear, by Country, Togo - Turkey 2015 (US$ Thousand) ......................................................... 378 Imports of HV Switchgear, by Country, Uganda - Ukraine 2015 (US$ Thousand).................................................... 379 Imports of HV Switchgear, by Country, Uruguay - Venezuela 2015 (US$ Thousand) .............................................. 380 Imports of HV Switchgear, by Country, Vietnam - Zimbabwe 2015 (US$ Thousand) .............................................. 381
8.6.2 HV Switchgear Imports by Region, by Country 2010 to 2015 ................................................................. 382 Imports of HV Switchgear, Western Europe, by Country, 2010 to 2015 Values (US$ Thousand) .......................... 382 Imports of HV Switchgear, Eastern Europe, by Country, 2010 to 2015 Values (US$ Thousand) ............................ 383 Imports of HV Switchgear, Former Soviet Union, by Country, 2010 to 2015 Values (US$ Thousand) .................. 384 Imports of HV Switchgear, North Africa, by Country, 2010 to 2015 Values (US$ Thousand) ................................ 385 Imports of HV Switchgear, Western Africa, by Country, 2010 to 2015 Values (US$ Thousand) ............................ 386 Imports of HV Switchgear, Central Africa, by Country, 2010 to 2015 Values (US$ Thousand) ............................. 387 Imports of HV Switchgear, East Africa, by Country, 2010 to 2015 Values (US$ Thousand) .................................. 387 Imports of HV Switchgear, Southern Africa, by Country, 2010 to 2015 Values (US$ Thousand) ........................... 388 Imports of HV Switchgear, Middle East, by Country, 2010 to 2015 Values (US$ Thousand) ................................. 389 Imports of HV Switchgear, Indian Sub-Continent, by Country, 2010 to 2015 Values (US$ Thousand) .................. 390 Imports of HV Switchgear, Asia, by Country, 2010 to 2015 Values (US$ Thousand) ............................................. 391 Imports of HV Switchgear, South America, by Country, 2010to 2015 Values (US$ Thousand) ............................. 392 Imports of HV Switchgear, C America&Caribbean, by Country, 2010 to 2015 Values (US$ Thousand) ............... 393 Imports of HV Switchgear, North America, by Country, 2010 to 2015 Values (US$ Thousand) ............................ 394 Imports of HV Switchgear, Australasia, by Country, 2010 to 2015 Values (US$ Thousand) .................................. 395
9. APPENDICES ................................................................................................................................................. 397 9.1 EXCHANGE RATES .............................................................................................................................. 397
Exchange Rates for Major Currencies against US Dollar 2010-2013 ......................................................................... 397 9.2 ESTIMATED PRODUCTION BY COMPANY BY COUNTRY .......................................................... 399
Estimated production by Country by Company-2015 (US$ Million) ......................................................................... 399 10. COUNTRY PROFILES BY REGION .......................................................................................................... 407
10.1 Western Europe ........................................................................................................................................ 409 W Europe – Country by Country Profiles ................................................................................................................... 409 W Europe – Country by Country Profiles - continued ................................................................................................ 410
10.2 Eastern Europe ......................................................................................................................................... 411 E Europe – Country by Country Profiles .................................................................................................................... 411
10.3 Former Soviet Union ................................................................................................................................ 412 FSU – Country by Country Profiles............................................................................................................................ 412
10.4 North Africa ............................................................................................................................................. 413 N. Africa – Country by Country Profiles .................................................................................................................... 413
10.5 West Africa .............................................................................................................................................. 414 W. Africa – Country by Country Profiles ................................................................................................................... 414
10.6 Central Africa ........................................................................................................................................... 415 Central Africa – Country by Country Profiles ............................................................................................................ 415
10.7 East Africa................................................................................................................................................ 416 East Africa – Country by Country Profiles ................................................................................................................. 416
10.8 South Africa ............................................................................................................................................. 417 South Africa – Country by Country Profiles .............................................................................................................. 417
10.9 Middle East .............................................................................................................................................. 418 Middle East – Country by Country Profiles................................................................................................................ 418
10.10 Indian Subcontinent ................................................................................................................................. 419 Indian Subcon. – Country by Country Profiles ........................................................................................................... 419
10.11 Asia .......................................................................................................................................................... 420 Asia – Country by Country Profiles............................................................................................................................ 420 Asia – Country by Country Profiles - continued ......................................................................................................... 421
10.12 South America .......................................................................................................................................... 422 South America – Country by Country Profiles ........................................................................................................... 422
10.13 Central America &Caribbean ................................................................................................................... 423 C. America &Caribb. – Country by Country Profiles ................................................................................................. 423 C. America &Caribb. – Country by Country Profiles - continued .............................................................................. 424
10.14 North America .......................................................................................................................................... 425 North America – Country by Country Profiles ........................................................................................................... 425
10.15 Australasia ................................................................................................................................................ 426 Australasia – Country by Country Profiles ................................................................................................................. 426

The World Markets and Manufacturers of HV Switchgear, 2015 - 2025
1
1. INTRODUCTION
1.1 OBJECTIVES AND SCOPE
The objective of this report is to provide a concise overview of the world market for High Voltage Switchgear. The report gives an estimate of the value of High Voltage Switchgear consumption in each national market, broken down by product type. The data given are 2010-2015 actual market values and estimated 2016 market values; forward projections through to 2025 are made on the basis of the infrastructure development in each country over the last 30 years.
For the purposes of this report the High Voltage Switchgear market is defined as comprising fuses/cut-outs; automatic circuit breakers (vac/oil/air/SF6 - including reclosers); vacuum interrupters; isolating (make and break) switches; lightning arresters/limiters/suppressors; discrete panels/bays.
In other words, the report examines transmission and distribution substation components, not including HV Switchgear, capacitors, bus systems or relays. Values will not include application engineering, project management, installation or maintenance costs.
Within this report High Voltage Switchgear has been broken down into seven categories :
• Fuses (for a voltage exceeding 1000 volts)
• Circuit Breakers (Automatic, for a voltage exceeding 1000 volts but less than 72.5 kV)
• Circuit Breakers (Automatic, for a voltage exceeding 72.5 kV)
• Switches (Isolating and Make-and-Break, for a voltage exceeding 1000 volts)
• Distribution and Control Panels (for a voltage exceeding 1000 volts)
• Lightning Arresters (including voltage limiters and surge suppressors, for a voltage exceeding 1000 volts)
• Other (Other electrical apparatus for switching or protecting electrical circuits, or for making connections to or in electrical circuits, including boards, panels [including numerical control panels] consoles, desks, cabinets etc. for electric control or the distribution of electricity) for a voltage exceeding 1000 volts.
The market sizes for High Voltage Switchgear are also broken down by voltage, into the following voltage ranges:
• 1 – 49 kV • 50 – 150 kV • >150 kV

The World Markets and Manufacturers of HV Switchgear, 2015 - 2025
2
The market sizes for High Voltage Switchgear are also broken down by type of use, into the following voltage categories:
• Switchyards and Major Substations • Overhead Line Gear • Primary Distribution Equipment • Secondary Distribution Equipment
Distribution switchgear is further segmented into:
• Distribution Switchgear (Outdoor use) • Distribution Switchgear (Indoor use)
The market sizes for High Voltage Switchgear are also broken down by type of customer, into the following voltage categories:
• Utility Companies • Construction and Industry • Rail and Transport • Mining, Marine and Offshore
The scope for this report is global - that is, every country having a significant customer base for High Voltage Switchgear. The report is designed to be used as a first line planning tool by companies interested in the global market for High Voltage Switchgear, and as a base from which to identify national markets worthy of further investigation.

The World Markets and Manufacturers of HV Switchgear, 2015 - 2025
3
1.2 METHODOLOGY
Data in the markets report is presented in US dollars (conversion tables are included in the appendices). The salient points of the methodology are as follows:-
• The survey was based primarily on desk research, including a review of available published production and trade statistics. Import and export figures are calculated from national and United Nations’ figures for 2010–2014the most comprehensive and up-to-date statistics available. Market values are assumed to be equal to Production + (Imports - Exports). National production estimates are based on statistics provided by national governments and trade associations. Market sizes for 2015 are estimated by analysing a range of economic indicators together with trends in trade flow and the pattern of market size growth over the period 2005-2012.
• Market values for the period 2016 to 2025 have been estimated based on two separate methodologies. Firstly the past growth rate in market values for each country have been extrapolated and have been compared with general macro-economic indicators such as GDP, GDP growth and inputs to the value added for each economy. Secondly, the development of the electrical power system in each country has been studied to provide indications for future system growth, and hence market growth.
• Market values are at factory gate prices - they reflect the prices for the products by the importer and do not include trade mark-ups and installation costs. It should be noted that published classifications of products, especially with respect to trade statistics, are sometimes inaccurate, as products may be shipped under generic titles. It should also be noted that Goulden Reports chronicles shipments rather than contracts. A contract to supply goods over a number of years will not appear as a one-off event in a Goulden Report, but rather will be recorded from the trade statistics. The nature of the market means that demand within countries, especially developing ones, can fluctuate greatly from year to year as purchases are often made on a one-off basis rather than spread evenly over a number of years.
• Within national markets, where published figures were unavailable to us, the breakdown between different product categories is based on intelligence about the pattern of consumption in the country concerned. In these cases the breakdown is made from an estimate of the total market size rather than the value of the entire market being calculated from the individual product categories.

The World Markets and Manufacturers of HV Switchgear, 2015 - 2025
4

The World Markets and Manufacturers of HV Switchgear, 2015 - 2025
5
2. SUMMARY
The global market for HV Switchgear was valued at US$xxxx million in 2015 having grown at a cagr of xxxx%between 2010 and 2014.
We forecast that the global market will increase at a cagr of xxx% to reach US$xxxxx million in 2025 – based on 2016 prices.
The largest national market in 2015 was that of China, which was valued at US$xxxx million and which accounted for xx% of the overall world market.
The second largest national market was that of the USA (US$xxxx million) followed by xxxx (US$xxxx million) and xxxxx (US$xxxx million).
The largest regional market for HV Switchgear in 2015 was Asia (US$xxxxx million) followed by Western Europe (US$xxxxx million) and North America (US$xxxxx million).
These growth have not been uniform across the globe neither has the consumption of switchgear across the voltage range. The figures are shown in the charts below:-
0
1,000
2,000
3,000
4,000
5,000
6,000
7,000
8,000
9,000
Global Market Trends by Major RegionValues in US$ Million
Western Europe N America S America China RO Asia

The World Markets and Manufacturers of HV Switchgear, 2015 - 2025
6
0.0
5,000.0
10,000.0
15,000.0
20,000.0
25,000.0
Global Market trends by Voltagevalues in US$ Million
1 to 50kV
50 to 150kV
Over 150kV
0.0
5,000.0
10,000.0
15,000.0
20,000.0
25,000.0
30,000.0
35,000.0
40,000.0
Global Market trends by Voltagevalues in US$ Million
1 to 50kV 50 to 150kV Over 150kV
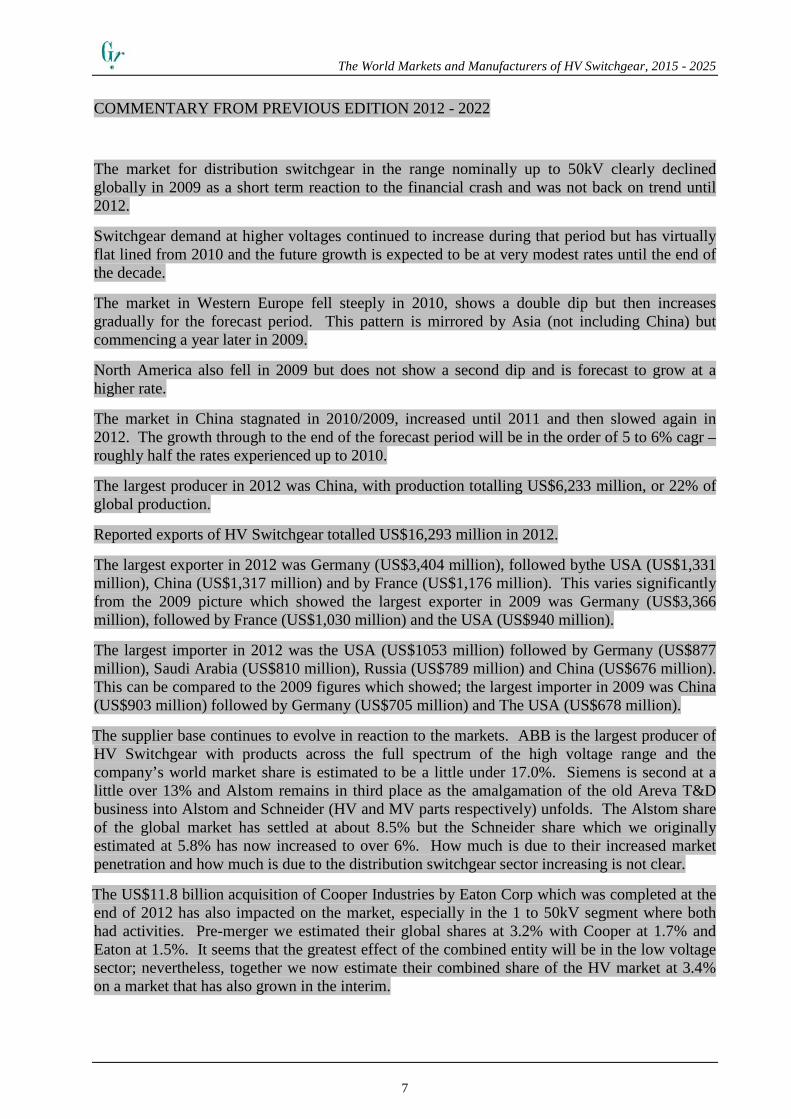
The World Markets and Manufacturers of HV Switchgear, 2015 - 2025
7
COMMENTARY FROM PREVIOUS EDITION 2012 - 2022
The market for distribution switchgear in the range nominally up to 50kV clearly declined globally in 2009 as a short term reaction to the financial crash and was not back on trend until 2012.
Switchgear demand at higher voltages continued to increase during that period but has virtually flat lined from 2010 and the future growth is expected to be at very modest rates until the end of the decade.
The market in Western Europe fell steeply in 2010, shows a double dip but then increases gradually for the forecast period. This pattern is mirrored by Asia (not including China) but commencing a year later in 2009.
North America also fell in 2009 but does not show a second dip and is forecast to grow at a higher rate.
The market in China stagnated in 2010/2009, increased until 2011 and then slowed again in 2012. The growth through to the end of the forecast period will be in the order of 5 to 6% cagr – roughly half the rates experienced up to 2010.
The largest producer in 2012 was China, with production totalling US$6,233 million, or 22% of global production.
Reported exports of HV Switchgear totalled US$16,293 million in 2012.
The largest exporter in 2012 was Germany (US$3,404 million), followed bythe USA (US$1,331 million), China (US$1,317 million) and by France (US$1,176 million). This varies significantly from the 2009 picture which showed the largest exporter in 2009 was Germany (US$3,366 million), followed by France (US$1,030 million) and the USA (US$940 million).
The largest importer in 2012 was the USA (US$1053 million) followed by Germany (US$877 million), Saudi Arabia (US$810 million), Russia (US$789 million) and China (US$676 million). This can be compared to the 2009 figures which showed; the largest importer in 2009 was China (US$903 million) followed by Germany (US$705 million) and The USA (US$678 million).
The supplier base continues to evolve in reaction to the markets. ABB is the largest producer of HV Switchgear with products across the full spectrum of the high voltage range and the company’s world market share is estimated to be a little under 17.0%. Siemens is second at a little over 13% and Alstom remains in third place as the amalgamation of the old Areva T&D business into Alstom and Schneider (HV and MV parts respectively) unfolds. The Alstom share of the global market has settled at about 8.5% but the Schneider share which we originally estimated at 5.8% has now increased to over 6%. How much is due to their increased market penetration and how much is due to the distribution switchgear sector increasing is not clear.
The US$11.8 billion acquisition of Cooper Industries by Eaton Corp which was completed at the end of 2012 has also impacted on the market, especially in the 1 to 50kV segment where both had activities. Pre-merger we estimated their global shares at 3.2% with Cooper at 1.7% and Eaton at 1.5%. It seems that the greatest effect of the combined entity will be in the low voltage sector; nevertheless, together we now estimate their combined share of the HV market at 3.4% on a market that has also grown in the interim.
The World Markets and Manufacturers of HV Switchgear, 2015 - 2025
8
The current (as at the time of going to press) uncertainty as to which suitor will be successful in the acquisition of the Alstom Grid business is still playing out.
With respect to HV Switchgear, a glance at table 21 shows the overall position. ABB are top of the league with 16.6% share, GE + Alstom Grid will result in a combined share in the order of 11%; which places the combined business in third place behind Siemens. A combination of Siemens + Mitsubishi + Alstom Grid; gives a combined share in the order of 25%. In reality this would net down to much less than that because of the large areas (geographically and product) of overlap within the combined group; particularly between Siemens and Alstom Grid in Europe. GE on the other hand appears to be a much better fit both product-wise and from a geographical perspective. No doubt money rather than logic will decide; all of which will be reported in the next edition of this report.
The World Markets and Manufacturers of HV Switchgear, 2015 - 2025
9
2.1 SUMMARY TABLES
Table 1
The Fastest Growing National Markets for HV Switchgear 2010 - 2015 (US$ Million)
Country Market Size 2010
Market Size 2015
% Change 2010 - 2015
Source: Goulden Reports and United Nations
Note: Only countries with market sizes greater than US$50 million are included in this section. Smaller markets may display significantly larger percentage changes.

The World Markets and Manufacturers of HV Switchgear, 2015 - 2025
10
Table 2
The Fastest Growing National Markets for HV Switchgear 2015 - 2020 (US$ Million)
Country Market Size 2015 Market Size 2020 % Change 2015 - 2020
Source: Goulden Reports and United Nations
Note: Only countries with market sizes greater than US$50 million are included in this section. Smaller markets may display significantly larger percentage changes.

The World Markets and Manufacturers of HV Switchgear, 2015 - 2025
11
Table 3
The Fastest Growing National Markets for HV Switchgear 2020 - 2025 (US$ Million)
Country Market Size 2020 Market Size 2025 % Change 2020 - 2025
Source: Goulden Reports and United Nations
Note: Only countries with market sizes greater than US$50 million are included in this section. Smaller markets may display significantly larger percentage changes.
The World Markets and Manufacturers of HV Switchgear, 2015 - 2025
12
Table 4
The Fastest Declining National Markets for HV Switchgear 2010 - 2015 (US$ Million)
Country Market Size 2010 Market Size 2015 % Change 2010 - 2015
Source: Goulden Reports and United Nations
Note: Only countries with market sizes greater than US$25 million are included in this section. Smaller markets may display significantly larger percentage changes.

The World Markets and Manufacturers of HV Switchgear, 2015 - 2025
13
Table 5
The Fastest Declining National Markets for HV Switchgear 2015 – 2020 (US$ Million)
Country Market Size 2015 Market Size 2020 % Change 2015 - 2020
Source: Goulden Reports and United Nations
Note: Only countries with market sizes greater than US$50 million are included in this section. Smaller markets may display significantly larger percentage changes.

The World Markets and Manufacturers of HV Switchgear, 2015 - 2025
14
Table 6
The Largest National Markets for HV Switchgear 2015 (US$ Million)
Country Market Size 2015
% Global Market
Source: Goulden Reports and United Nations

The World Markets and Manufacturers of HV Switchgear, 2015 - 2025
15
Table 7
The Largest National Markets for HV Switchgear 2020 (US$ Million)
Country Market Size 2020
% Global Market
Source: Goulden Reports and United Nations

The World Markets and Manufacturers of HV Switchgear, 2015 - 2025
16
3. THE WORLD MARKET
Table 8
The World Market for HV Switchgear, by Region,2010- 2015 (US$ Million)
Region 2010 2011 2012 2013 2014 2015
Western Europe
Eastern Europe
Former USSR
North Africa
West Africa
Central Africa
East Africa
Southern Africa
Middle East
Indian Sub Continent
Asia
South America
Central America & Carib
North America
Oceania
Total
Source: Goulden Reports and United Nations
The World Markets and Manufacturers of HV Switchgear, 2015 - 2025
17
Table 9
The World Market for HV Switchgear, by Region,2010 - 2015 (% Change)
Region 2011/2010 2012/2011 2013/2012 2014/2013 2015/2014
Western Europe
Eastern Europe
Former USSR
North Africa
West Africa
Central Africa
East Africa
Southern Africa
Middle East
Indian Sub Continent
Asia
South America
Central America &Carib
North America
Oceania
Total
Source: Goulden Reports and United Nations
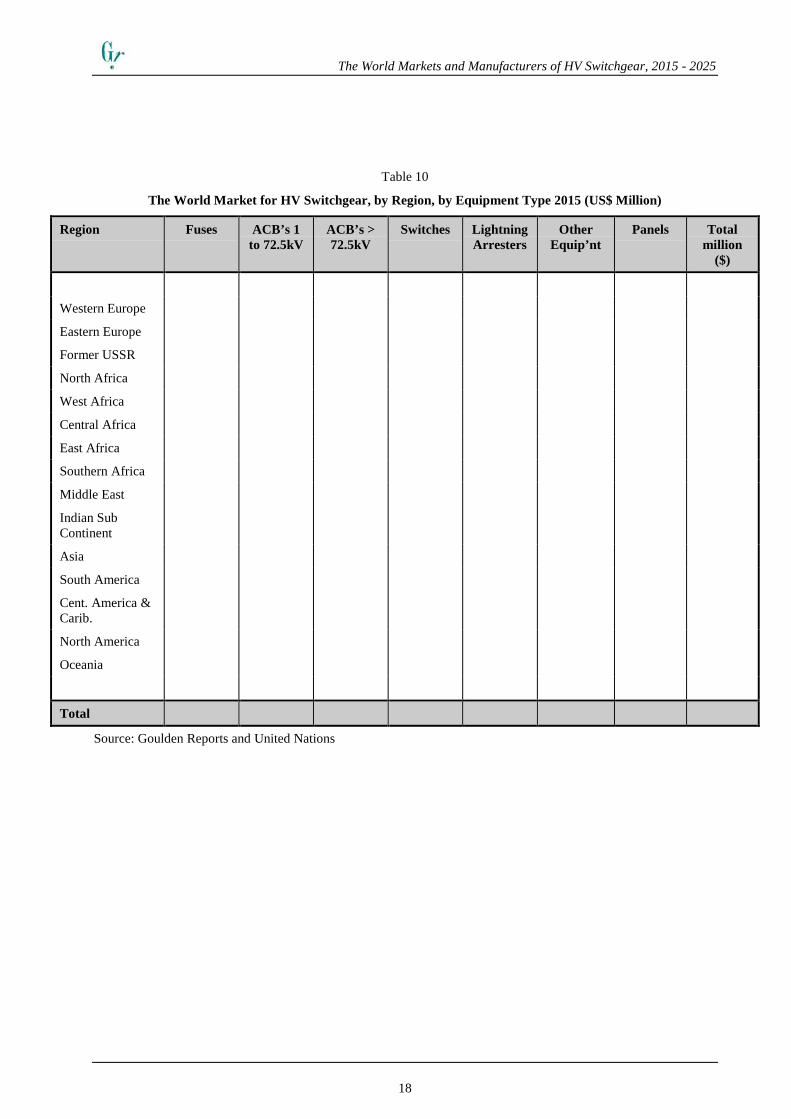
The World Markets and Manufacturers of HV Switchgear, 2015 - 2025
18
Table 10
The World Market for HV Switchgear, by Region, by Equipment Type 2015 (US$ Million)
Region Fuses ACB’s 1 to 72.5kV
ACB’s > 72.5kV
Switches Lightning Arresters
Other Equip’nt
Panels Total million
($)
Western Europe
Eastern Europe
Former USSR
North Africa
West Africa
Central Africa
East Africa
Southern Africa
Middle East
Indian Sub Continent
Asia
South America
Cent. America & Carib.
North America
Oceania
Total
Source: Goulden Reports and United Nations

The World Markets and Manufacturers of HV Switchgear, 2015 - 2025
19
Table 11
The World Market for HV Switchgear, by Region, by Voltage Level 2015 (US$ Million)
Region 1 – 50kV 50 to 150kV Over 150kV Total
Western Europe
Eastern Europe
Former USSR
North Africa
West Africa
Central Africa
East Africa
Southern Africa
Middle East
Indian Sub Continent
Asia
South America
Cent. America & Carib.
North America
Oceania
Total
Source: Goulden Reports and United Nations

The World Markets and Manufacturers of HV Switchgear, 2015 - 2025
20
Table 12
The World Market for HV Distribution Switchgear, by Region, by Location 2015 (US$ Million)
Region Distribution Switchgear
Outdoor
Distribution Switchgear
Indoor
Total
Western Europe
Eastern Europe
Former USSR
North Africa
West Africa
Central Africa
East Africa
Southern Africa
Middle East
Indian Sub Continent
Asia
South America
Cent. America & Carib.
North America
Oceania
Total
Source: Goulden Reports and United Nations

The World Markets and Manufacturers of HV Switchgear, 2015 - 2025
21
Table 13
The World Market for HV Switchgear, by Region, by Type of Use 2015 (US$ Million)
Region S/yards & Major
Subst’ns.
Overhead Line Gear
Primary Dist’ution
Equipment
SecondaryDist’ution
Equipment
Total
Western Europe
Eastern Europe
Former USSR
North Africa
West Africa
Central Africa
East Africa
Southern Africa
Middle East
Indian Sub Continent
Asia
South America
Cent. America & Carib
North America
Oceania
Total
Source: Goulden Reports and United Nations
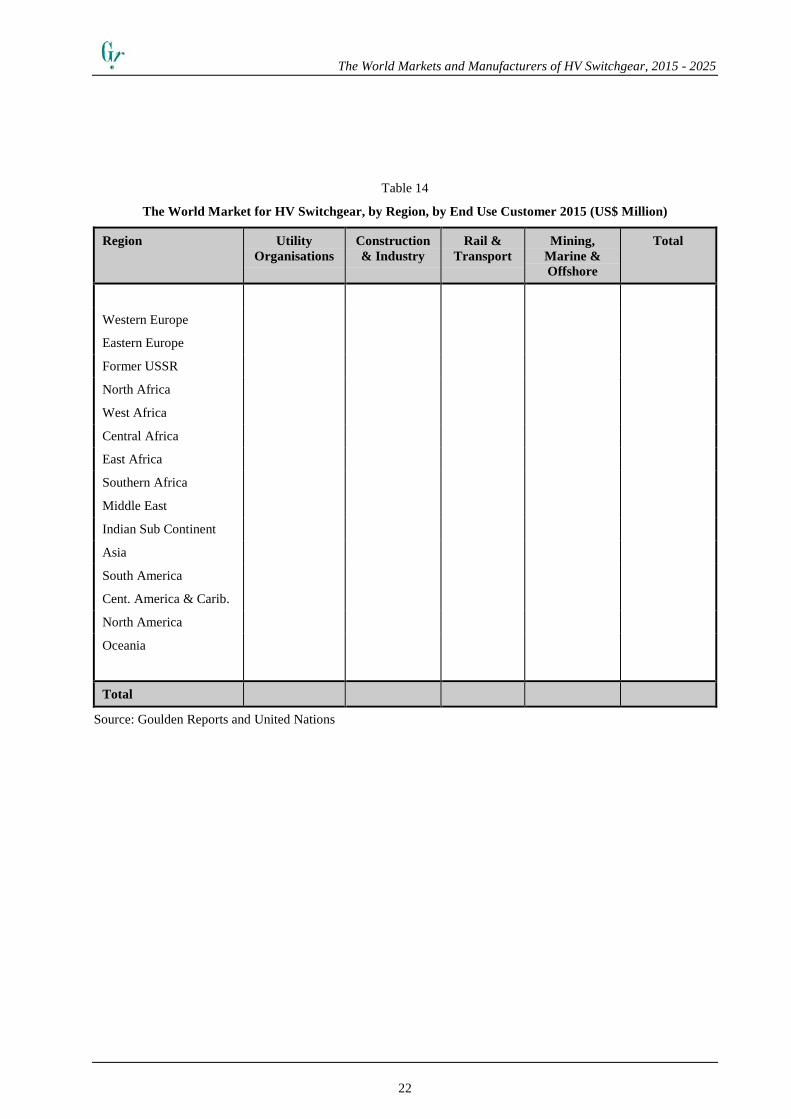
The World Markets and Manufacturers of HV Switchgear, 2015 - 2025
22
Table 14
The World Market for HV Switchgear, by Region, by End Use Customer 2015 (US$ Million)
Region Utility Organisations
Construction & Industry
Rail & Transport
Mining, Marine & Offshore
Total
Western Europe
Eastern Europe
Former USSR
North Africa
West Africa
Central Africa
East Africa
Southern Africa
Middle East
Indian Sub Continent
Asia
South America
Cent. America & Carib.
North America
Oceania
Total
Source: Goulden Reports and United Nations

The World Markets and Manufacturers of HV Switchgear, 2015 - 2025
23
Table 15
The World Market for HV Switchgear, by Region, by Technology 2015 (US$ Million)
Region GIS Switchgear
AIS Switchgear
Hibrid Switchgear
Other Equipment
Total
Western Europe
Eastern Europe
Former USSR
North Africa
West Africa
Central Africa
East Africa
Southern Africa
Middle East
Indian Sub Continent
Asia
South America
Cent. America & Carib
North America
Oceania
Total
Source: Goulden Reports and United Nations

The World Markets and Manufacturers of HV Switchgear, 2015 - 2025
24
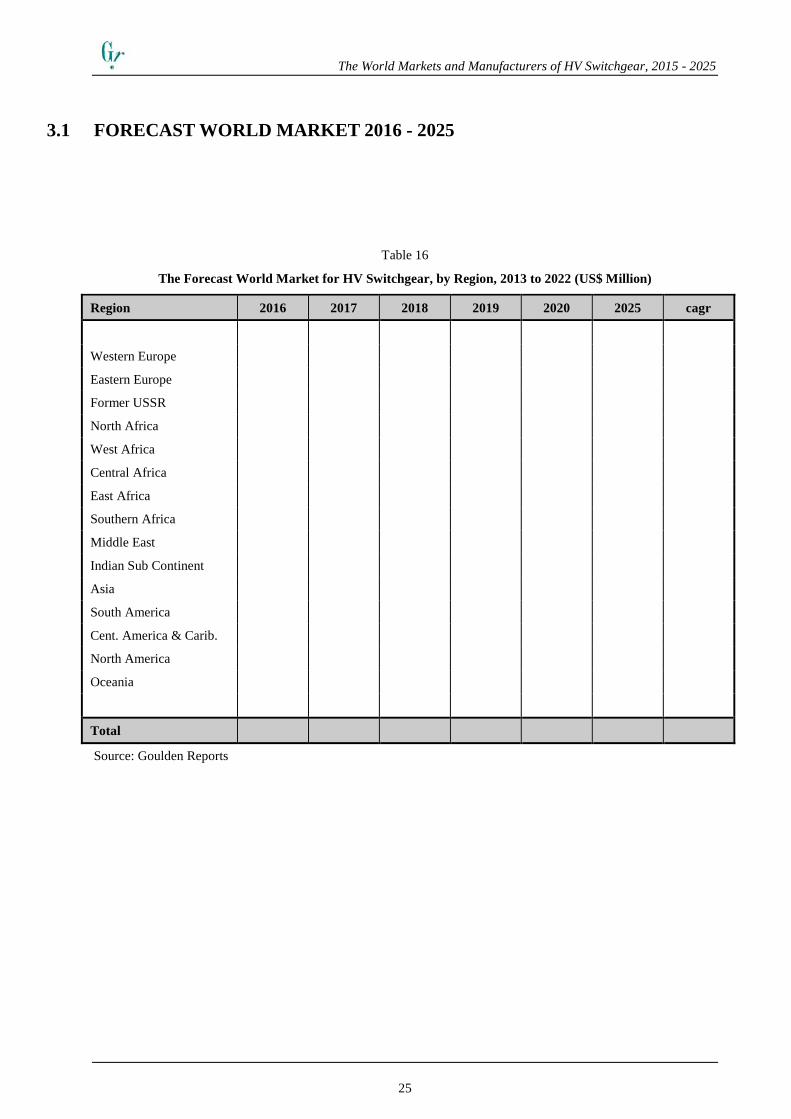
The World Markets and Manufacturers of HV Switchgear, 2015 - 2025
25
3.1 FORECAST WORLD MARKET 2016 - 2025
Table 16
The Forecast World Market for HV Switchgear, by Region, 2013 to 2022 (US$ Million)
Region 2016 2017 2018 2019 2020 2025 cagr
Western Europe
Eastern Europe
Former USSR
North Africa
West Africa
Central Africa
East Africa
Southern Africa
Middle East
Indian Sub Continent
Asia
South America
Cent. America & Carib.
North America
Oceania
Total
Source: Goulden Reports
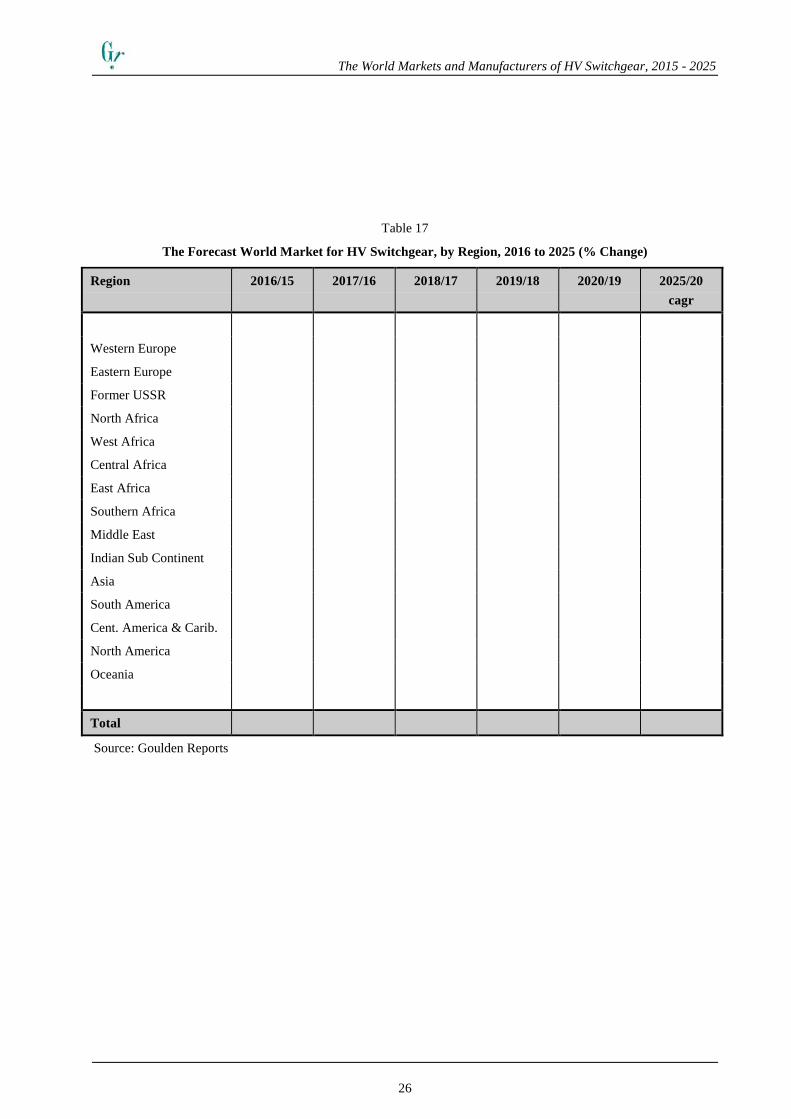
The World Markets and Manufacturers of HV Switchgear, 2015 - 2025
26
Table 17
The Forecast World Market for HV Switchgear, by Region, 2016 to 2025 (% Change)
Region 2016/15 2017/16 2018/17 2019/18 2020/19 2025/20 cagr
Western Europe
Eastern Europe
Former USSR
North Africa
West Africa
Central Africa
East Africa
Southern Africa
Middle East
Indian Sub Continent
Asia
South America
Cent. America & Carib.
North America
Oceania
Total
Source: Goulden Reports

The World Markets and Manufacturers of HV Switchgear, 2015 - 2025
27
Table 18
The World Market for HV Switchgear, by Region, by Equipment Type 2025 (US$ Million)
Region Fuses ACB’s 1 to 72.5kV
ACB’s > 72.5kV
Switches Lightning Arresters
Other Equip’nt
Panels Total million
($)
Western Europe
Eastern Europe
Former USSR
North Africa
West Africa
Central Africa
East Africa
Southern Africa
Middle East
Indian Sub Continent
Asia
South America
Cent. America & Carib.
North America
Oceania
Total
Source: Goulden Reports and United Nations
The World Markets and Manufacturers of HV Switchgear, 2015 - 2025
28
Table 19
The World Market for HV Switchgear, by Region, by Voltage Level 2025 (US$ Million)
Region 1 – 50kV 50 to 150kV Over 150kV Total
Western Europe
Eastern Europe
Former USSR
North Africa
West Africa
Central Africa
East Africa
Southern Africa
Middle East
Indian Sub Continent
Asia
South America
Cent. America & Carib.
North America
Oceania
Total
Source: Goulden Reports and United Nations

The World Markets and Manufacturers of HV Switchgear, 2015 - 2025
29
Table 20
The World Market for HV Distribution Switchgear, by Region, by Location 2025 (US$ Million)
Region Distribution Switchgear
Outdoor
Distribution Switchgear
Indoor
Total
Western Europe
Eastern Europe
Former USSR
North Africa
West Africa
Central Africa
East Africa
Southern Africa
Middle East
Indian Sub Continent
Asia
South America
Cent. America & Carib.
North America
Oceania
Total
Source: Goulden Reports and United Nations

The World Markets and Manufacturers of HV Switchgear, 2015 - 2025
30
Table 21
The World Market for HV Switchgear, by Region, by Type of Use 2025 (US$ Million)
Region S/yards & Major
Subst’ns.
Overhead Line Gear
Primary Dist’ution
Equipment
SecondaryDist’ution
Equipment
Total
Western Europe
Eastern Europe
Former USSR
North Africa
West Africa
Central Africa
East Africa
Southern Africa
Middle East
Indian Sub Continent
Asia
South America
Cent. America & Carib
North America
Oceania
Total
Source: Goulden Reports and United Nations

The World Markets and Manufacturers of HV Switchgear, 2015 - 2025
31
Table 22
The World Market for HV Switchgear, by Region, by End Use Customer 2025 (US$ Million)
Region Utility Organisations
Construction & Industry
Rail & Transport
Mining, Marine & Offshore
Total
Western Europe
Eastern Europe
Former USSR
North Africa
West Africa
Central Africa
East Africa
Southern Africa
Middle East
Indian Sub Continent
Asia
South America
Cent. America & Carib.
North America
Oceania
Total
Source: Goulden Reports and United Nations

The World Markets and Manufacturers of HV Switchgear, 2015 - 2025
32

The World Markets and Manufacturers of HV Switchgear, 2015 - 2025
33
5. MAJOR HIGH VOLTAGE SWITCHGEAR MANUFACTURERS
The figures in this section are from published annual company reports and other official sources. The figures are, however, designed to serve as a general overview – inaccuracies may occur as a result of exchange rate fluctuations or insufficient primary data.
Table 23
Leading Manufacturers’ Sales of HV Switchgear 2012 (US$ Million)
Company Country Total Company Sales 2012
HV Switchgear Sales 2012
HV Switchgear % of Sales 2012
Estimated World Market
Share %
Source: Goulden Reports
The World Markets and Manufacturers of HV Switchgear, 2015 - 2025
34
Table 24
Leading Manufacturers’ Sales of HV Switchgear, per Region, 2012 (US$ Million)
Company Western Europe Eastern Europe & Former USSR
Africa Middle East
continued...

The World Markets and Manufacturers of HV Switchgear, 2015 - 2025
35
Table 25
Leading Manufacturers’ Sales of HV Switchgear, per Region, 2012 (US$ Million) - continued
Company Asia-Pacific North America South & Central America & Caribbean
Total
Source: Goulden Reports

The World Markets and Manufacturers of HV Switchgear, 2015 - 2025
36

The World Markets and Manufacturers of HV Switchgear, 2015 - 2025
37
5.1 HV SWITCHGEAR INDUSTRY CONTACT DETAILS

The World Markets and Manufacturers of HV Switchgear, 2015 - 2025
38
6. REGIONAL MARKETS
6.1 WESTERN EUROPE
6.2 EASTERN EUROPE
6.3 FORMER SOVIET UNION
6.4 NORTH AFRICA
6.5 WEST AFRICA
6.6 CENTRAL AFRICA
6.7 EAST AFRICA
6.8 SOUTHERN AFRICA
6.9 MIDDLE EAST
6.10 INDIAN SUB CONTINENT
6.11 ASIA
6.12 SOUTH AMERICA
6.13 CENTRAL AMERICA AND CARIBBEAN
6.14 NORTH AMERICA
6.15 OCEANIA

The World Markets and Manufacturers of HV Switchgear, 2015 - 2025
39
7. PRODUCTION
Table 26
The Top 25Producers of HV Switchgear,2015 (US$ Million)
Country Production % share
Source: Goulden Reports and United Nations

The World Markets and Manufacturers of HV Switchgear, 2015 - 2025
40
The World Markets and Manufacturers of HV Switchgear, 2015 - 2025
41
8. TRADE ANALYSIS
8.1 TOP 25 EXPORTERS
Table 27
The Top 25 Exporters of HV Switchgear, 2010 to 2014 (US$ Millions)
Country 2010 to 2014 Av. Value 2014 % Total 2014
Source: Goulden Reports and United Nations

The World Markets and Manufacturers of HV Switchgear, 2015 - 2025
42
Table 28
The Top 25 Exporters of HV Fuses, 2014 (US$ Thousands)
Country Value % of World Total
Source: Goulden Reports and United Nations

The World Markets and Manufacturers of HV Switchgear, 2015 - 2025
43
Table 29
The Top 25 Exporters of HV Circuit Breakers 1-72.5kV, 2014 (US$ Thousands)
Country Value % of World Total
Source: Goulden Reports and United Nations

The World Markets and Manufacturers of HV Switchgear, 2015 - 2025
44
Table 30
The Top 25 Exporters of HV Circuit Breakers >72.5kV, 2014 (US$ Thousands)
Country Value % of World Total
Source: Goulden Reports and United Nations

The World Markets and Manufacturers of HV Switchgear, 2015 - 2025
45
Table 31
The Top 25 Exporters of HV Switches, 2014 (US$ Thousands)
Country Value % of World Total
Source: Goulden Reports and United Nations

The World Markets and Manufacturers of HV Switchgear, 2015 - 2025
46
Table 32
The Top 25 Exporters of Lightning Arresters, 2014 (US$ Thousands)
Country Value % of World Total
Source: Goulden Reports and United Nations

The World Markets and Manufacturers of HV Switchgear, 2015 - 2025
47
Table 33
The Top 25 Exporters of Other HV Apparatus, 2014 (US$ Thousands)
Country Value % of World Total
Source: Goulden Reports and United Nations

The World Markets and Manufacturers of HV Switchgear, 2015 - 2025
48
Table 34
The Top 25 Exporters of HV Distribution Boards and Panels, 2014 (US$ Thousands)
Country Value % of World Total
Source: Goulden Reports and United Nations
The World Markets and Manufacturers of HV Switchgear, 2015 - 2025
49
8.2 TOP 25 IMPORTERS
Table 35
The Top 25 Importers of HV Switchgear, 2010 to 2014 (US$ Millions)
Country Av Value 2010 to 2014
Value 2014 % Total 2014
Source: Goulden Reports and United Nations

The World Markets and Manufacturers of HV Switchgear, 2015 - 2025
50
Table 36
The Top 25 Importers of HV Fuses, 2014 (US$ Thousands)
Country Value % of World Total
Source: Goulden Reports and United Nations

The World Markets and Manufacturers of HV Switchgear, 2015 - 2025
51
Table 37
The Top 25 Importers of HV Circuit breakers 1 to 72.5kV, 2014 (US$ Thousands)
Country Value % of World Total
Source: Goulden Reports and United Nations

The World Markets and Manufacturers of HV Switchgear, 2015 - 2025
52
Table 38
The Top 25 Importers of HV Circuit Breakers >72.5kV, 2014 (US$ Thousands)
Country Value % of World Total
Source: Goulden Reports and United Nations

The World Markets and Manufacturers of HV Switchgear, 2015 - 2025
53
Table 39
The Top 25 Importers of HV Switches, 2014 (US$ Thousands)
Country Value % of World Total
Source: Goulden Reports and United Nations

The World Markets and Manufacturers of HV Switchgear, 2015 - 2025
54
Table 40
The Top 25 Importers of HV Lightning Arresters, 2014 (US$ Thousands)
Country Value % of World Total
Source: Goulden Reports and United Nations

The World Markets and Manufacturers of HV Switchgear, 2015 - 2025
55
Table 41
The Top 25 Importers of Other HV Apparatus, 2014 (US$ Thousands)
Country Value % of World Total
Source: Goulden Reports and United Nations
The World Markets and Manufacturers of HV Switchgear, 2015 - 2025
56
Table 42
The Top 25 Importers of HV Distribution Boards and Panels, 2014 (US$ Thousands)
Country Value % of World Total
Source: Goulden Reports and United Nations
The World Markets and Manufacturers of HV Switchgear, 2015 - 2025
57
8.3 EXPORT VALUES
Table 43
The Top 25 Exporters of HV Switchgear to Principal Destinations, Australia - Canada, 2014 (US$ Thousand)
Australia Belgium Canada
Source: Goulden Reports and United Nations

The World Markets and Manufacturers of HV Switchgear, 2015 - 2025
58
Table 44
The Top 25 Exporters of HV Switchgear to Principal Destinations, China – France, 2012 (US$ Thousand)
Source: Goulden Reports and United Nations

The World Markets and Manufacturers of HV Switchgear, 2015 - 2025
59
Table 45
The Top 25 Exporters of HV Switchgear to Principal Destinations, Germany - India, 2012 (US$ Thousand)
Germany Hungary India
Source: Goulden Reports and United Nations

The World Markets and Manufacturers of HV Switchgear, 2015 - 2025
60
Table 46
The Top 25 Exporters of HV Switchgear to Principal Destinations, Italy – Korea South, 2012 (US$ Thousand)
Italy Japan Korea South
Source: Goulden Reports and United Nations

The World Markets and Manufacturers of HV Switchgear, 2015 - 2025
61
Table 47
The Top 25 Exporters of HV Switchgear to Principal Destinations, Malaysia - Netherlands, 2012 (US$ Thousand)
Malaysia Mexico Netherlands
Source: Goulden Reports and United Nations
The World Markets and Manufacturers of HV Switchgear, 2015 - 2025
62
Table 48
The Top 25 Exporters of HV Switchgear to Principal Destinations, Norway – Portugal, 2012 (US$ Thousand)
Norway Poland Portugal
Source: Goulden Reports and United Nations

The World Markets and Manufacturers of HV Switchgear, 2015 - 2025
63
Table 49
The Top 25 Exporters of HV Switchgear to Principal Destinations, Singapore - Sweden, 2012 (US$ Thousand)
Singapore Spain Sweden
Source: Goulden Reports and United Nations
The World Markets and Manufacturers of HV Switchgear, 2015 - 2025
64
Table 50
The Top 25 Exporters of HV Switchgear to Principal Destinations, Switzerland - Turkey, 2012 (US$ Thousand)
Switzerland Turkey
Source: Goulden Reports and United Nations

The World Markets and Manufacturers of HV Switchgear, 2015 - 2025
65
Table 51
The Top 25 Exporters of HV Switchgear to Principal Destinations, UK - USA, 2012 (US$ Thousand)
UK USA
Source: Goulden Reports and United Nations
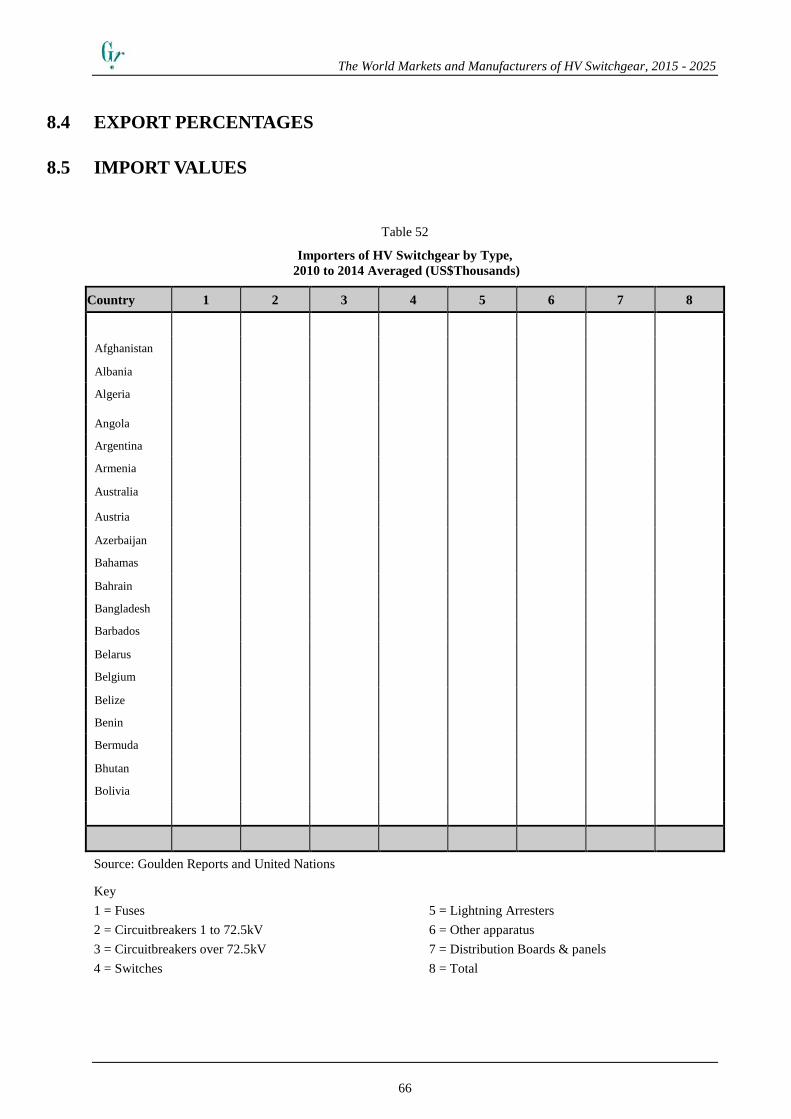
The World Markets and Manufacturers of HV Switchgear, 2015 - 2025
66
8.4 EXPORT PERCENTAGES
8.5 IMPORT VALUES
Table 52
Importers of HV Switchgear by Type, 2010 to 2014 Averaged (US$Thousands)
Country 1 2 3 4 5 6 7 8
Afghanistan
Albania
Algeria
Angola
Argentina
Armenia
Australia
Austria
Azerbaijan
Bahamas
Bahrain
Bangladesh
Barbados
Belarus
Belgium
Belize
Benin
Bermuda
Bhutan
Bolivia
Source: Goulden Reports and United Nations
Key 1 = Fuses 5 = Lightning Arresters 2 = Circuitbreakers 1 to 72.5kV 6 = Other apparatus 3 = Circuitbreakers over 72.5kV 7 = Distribution Boards & panels 4 = Switches 8 = Total

The World Markets and Manufacturers of HV Switchgear, 2015 - 2025
67
8.6 IMPORT VALUES
8.6.1 HV Switchgear Imports by Country Alphabetical 2014
Table 53
Imports of HV Switchgear, by Country, Albania - Antigua 2014 (US$ Thousand)
Albania Algeria Antigua & Barbuda
Source: Goulden Reports and United Nations
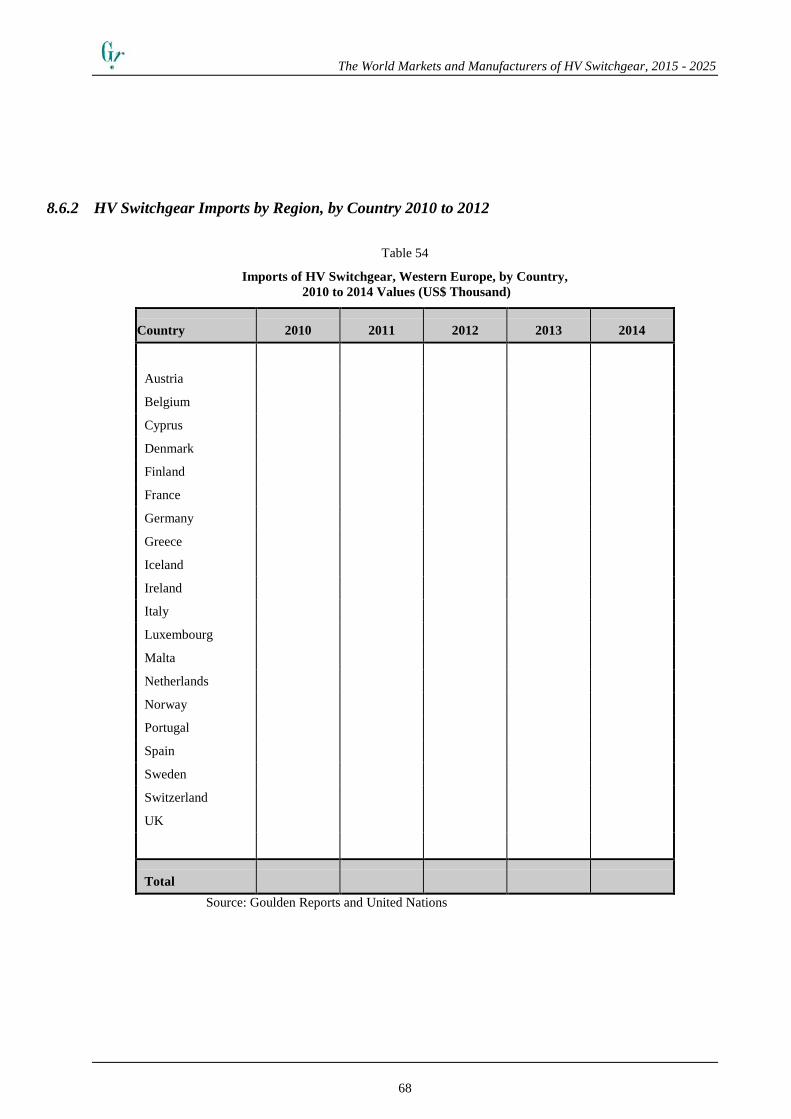
The World Markets and Manufacturers of HV Switchgear, 2015 - 2025
68
8.6.2 HV Switchgear Imports by Region, by Country 2010 to 2012
Table 54
Imports of HV Switchgear, Western Europe, by Country, 2010 to 2014 Values (US$ Thousand)
Country 2010 2011 2012 2013 2014
Austria
Belgium
Cyprus
Denmark
Finland
France
Germany
Greece
Iceland
Ireland
Italy
Luxembourg
Malta
Netherlands
Norway
Portugal
Spain
Sweden
Switzerland
UK
Total Source: Goulden Reports and United Nations
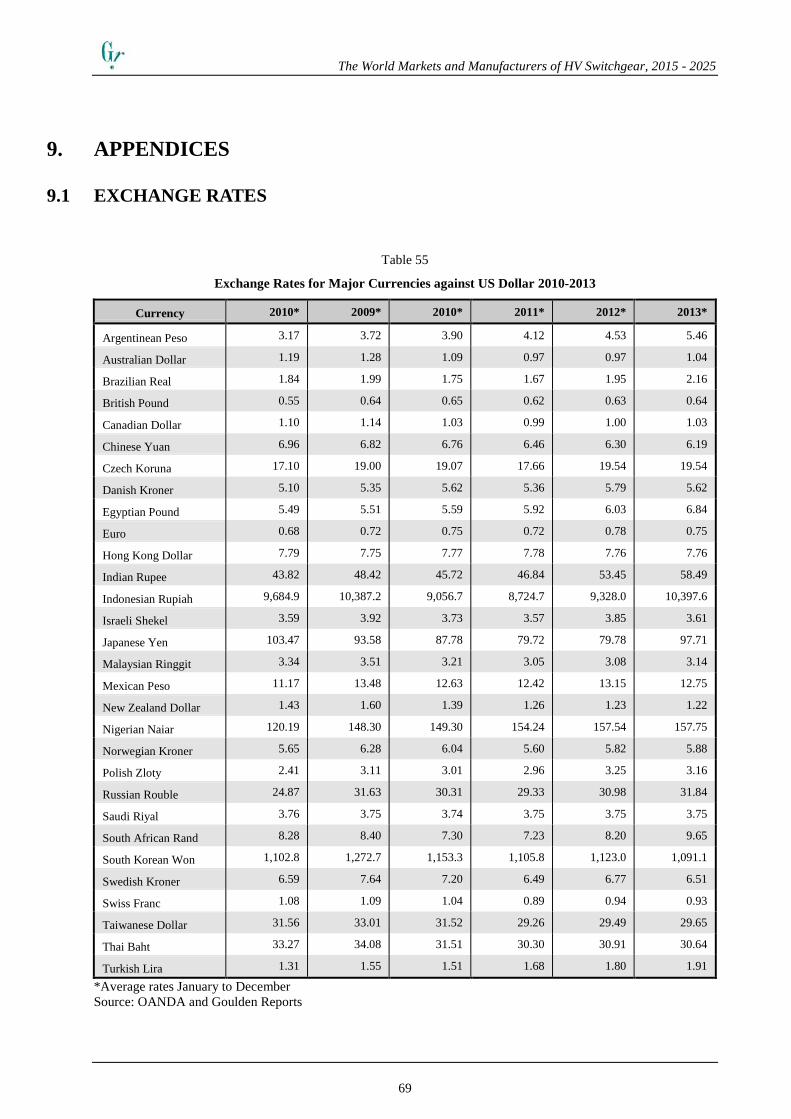
The World Markets and Manufacturers of HV Switchgear, 2015 - 2025
69
9. APPENDICES
9.1 EXCHANGE RATES
Table 55
Exchange Rates for Major Currencies against US Dollar 2010-2013
Currency 2010* 2009* 2010* 2011* 2012* 2013*
Argentinean Peso 3.17 3.72 3.90 4.12 4.53 5.46
Australian Dollar 1.19 1.28 1.09 0.97 0.97 1.04
Brazilian Real 1.84 1.99 1.75 1.67 1.95 2.16
British Pound 0.55 0.64 0.65 0.62 0.63 0.64
Canadian Dollar 1.10 1.14 1.03 0.99 1.00 1.03
Chinese Yuan 6.96 6.82 6.76 6.46 6.30 6.19
Czech Koruna 17.10 19.00 19.07 17.66 19.54 19.54
Danish Kroner 5.10 5.35 5.62 5.36 5.79 5.62
Egyptian Pound 5.49 5.51 5.59 5.92 6.03 6.84
Euro 0.68 0.72 0.75 0.72 0.78 0.75
Hong Kong Dollar 7.79 7.75 7.77 7.78 7.76 7.76
Indian Rupee 43.82 48.42 45.72 46.84 53.45 58.49
Indonesian Rupiah 9,684.9 10,387.2 9,056.7 8,724.7 9,328.0 10,397.6
Israeli Shekel 3.59 3.92 3.73 3.57 3.85 3.61
Japanese Yen 103.47 93.58 87.78 79.72 79.78 97.71
Malaysian Ringgit 3.34 3.51 3.21 3.05 3.08 3.14
Mexican Peso 11.17 13.48 12.63 12.42 13.15 12.75
New Zealand Dollar 1.43 1.60 1.39 1.26 1.23 1.22
Nigerian Naiar 120.19 148.30 149.30 154.24 157.54 157.75
Norwegian Kroner 5.65 6.28 6.04 5.60 5.82 5.88
Polish Zloty 2.41 3.11 3.01 2.96 3.25 3.16
Russian Rouble 24.87 31.63 30.31 29.33 30.98 31.84
Saudi Riyal 3.76 3.75 3.74 3.75 3.75 3.75
South African Rand 8.28 8.40 7.30 7.23 8.20 9.65
South Korean Won 1,102.8 1,272.7 1,153.3 1,105.8 1,123.0 1,091.1
Swedish Kroner 6.59 7.64 7.20 6.49 6.77 6.51
Swiss Franc 1.08 1.09 1.04 0.89 0.94 0.93
Taiwanese Dollar 31.56 33.01 31.52 29.26 29.49 29.65
Thai Baht 33.27 34.08 31.51 30.30 30.91 30.64
Turkish Lira 1.31 1.55 1.51 1.68 1.80 1.91
*Average rates January to December Source: OANDA and Goulden Reports

The World Markets and Manufacturers of HV Switchgear, 2015 - 2025
70

The World Markets and Manufacturers of HV Switchgear, 2015 - 2025
71
9.2 ESTIMATED PRODUCTION BY COMPANY BY COUNTRY
The estimates below are a second attempt to complete such an analysis worldwide. As with the first edition Reports would welcome any feedback, amendments and corrections to this table.
Table 56
Estimated production by Country by Company-2015 (US$ Million)
Country Company 2015 Production US$ Million
WESTERN EUROPE Austria
Belgium
Denmark
Finland
France
Germany
Greece
continued……….
The World Markets and Manufacturers of HV Switchgear, 2015 - 2025
72
NORTH AMERICA Canada
Mexico
USA
AUSTRALASIA Australia
New Zealand
World Source: Goulden Reports Estimates
The World Markets and Manufacturers of HV Switchgear, 2015 - 2025
73
10. COUNTRY PROFILES BY REGION

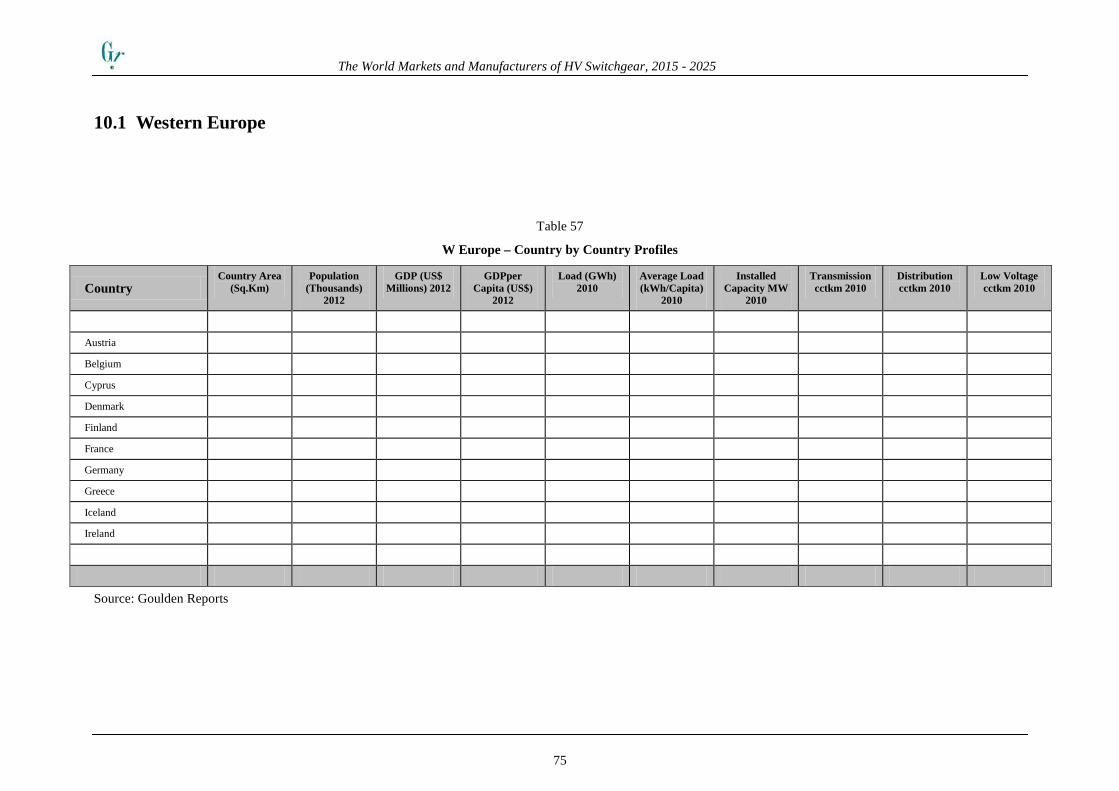
The World Markets and Manufacturers of HV Switchgear, 2015 - 2025
75
10.1 Western Europe
Table 57
W Europe – Country by Country Profiles
Country Country Area
(Sq.Km) Population
(Thousands) 2012
GDP (US$ Millions) 2012
GDPper Capita (US$)
2012
Load (GWh) 2010
Average Load (kWh/Capita)
2010
Installed Capacity MW
2010
Transmission cctkm 2010
Distribution cctkm 2010
Low Voltage cctkm 2010
Austria
Belgium
Cyprus
Denmark
Finland
France
Germany
Greece
Iceland
Ireland
Source: Goulden Reports

The World Markets and Manufacturers of HV Switchgear, 2015 - 2025
76
10.2 Australasia
Table 58
Australasia – Country by Country Profiles
Country Country Area
(Sq.Km) Population
(Thousands) 2012
GDP (US$ Millions) 2012
GDPper Capita (US$)
2012
Load (GWh) 2010
Average Load (kWh/Capita)
2010
Installed Capacity MW
2010
Transmission cctkm 2010
Distribution cctkm 2010
Low Voltage cctkm 2010
Australia
Fiji
New Caledonia
New Zealand
Papua New Guinea
Australasia
Source: Goulden Reports
--ooOOoo--