The world leader in serving science Rhombix Solutions for Automated Crystallization 2007 RAMC.
16
The world leader in serving science Rhombix Solutions for Automated Crystallization 2007 RAMC
-
Upload
cecily-logan -
Category
Documents
-
view
237 -
download
1
Transcript of The world leader in serving science Rhombix Solutions for Automated Crystallization 2007 RAMC.

The world leader in serving science
Rhombix Solutions for Automated Crystallization
2007 RAMC

2
Rhombix Product Line – supporting the crystallization workflow
Semi-automated imaging
Automated imaging and storage
MaX Workcell
RhombixSoftware
Suite

3
Instrument-Centric to Data-Centric Automation
Result: Isolated “islands” of automation and data stores -- No data connection
Imaging and StorageExperiment design and analysis
Liquid handler –Dispense screens into wells
NanodispenserDrop-making
XtallizationDatabase

4
New Product
MaX WorkcellPlate preparation
New

5
MaX Workcell
Features & Benefits• All-inclusive product – pre-configured for quick
installation • Seamless Workflow• Tube-to-plate transfer• Plate-to-plate transfer• Custom screen building (gradients, additives,
etc)• Nano Drop placement• Sealing • Multiple experiment design and submission• Full set of SW tools incorporating experimental
data and automation control• Small footprint

6
Imaging Modes
Brightfield White LED light source Eliminates heating of plates
Darkfield Changes the angle of incidence mitigating shadow regions
associated with Brightfield Assists visualization of crystals
Polarization True polarization Variable angle transmitter and analyzer Exploits birefringent property of crystals

7
Lighting and treatment options
Brightfield Darkfield
Variable Angle Polarization Extinction Extinction + 45° Extinction + 90°
8
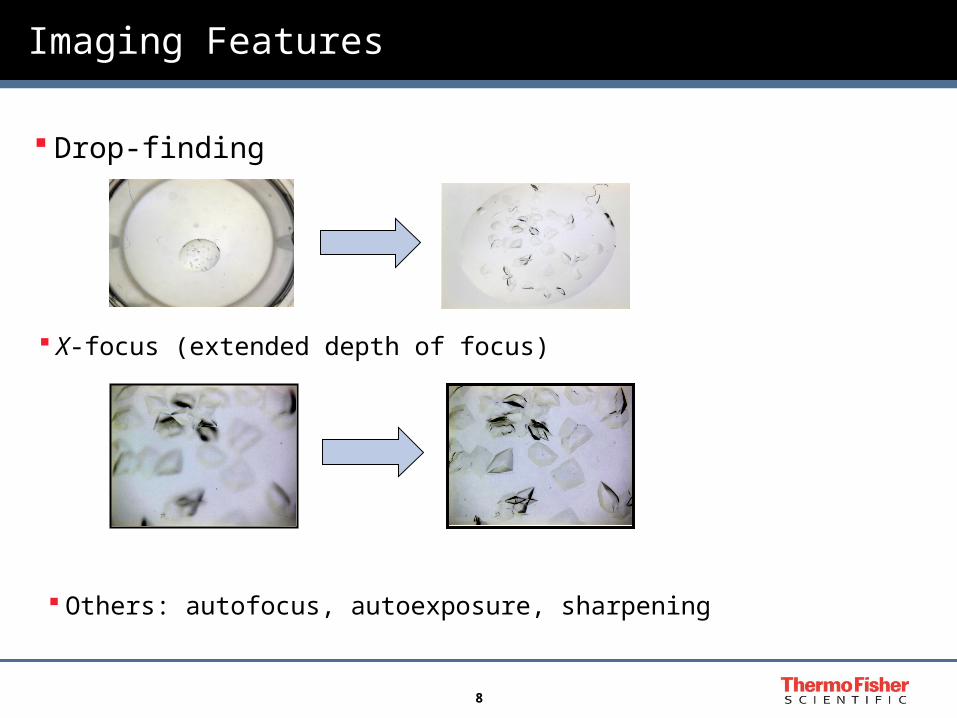
Imaging Features
Drop-finding
X-focus (extended depth of focus)
Others: autofocus, autoexposure, sharpening

9
Rhombix Software Suite – Supporting the Crystallization Workflow
Results Analysisand Scoring
Experiment Execution
Experiment Design
Data MiningOptimization
• Reagent Manager• Screen Designer• Experiment
Manager• Schedule Editor• Barcode Manager
• Deck Manager• Experiment
Launcher• Screen Monitor• Vision Monitor• Equipment Monitor
• Visual Query Tool• Image Viewing
and Annotation (Clarix)
• Report Tool
• Visual Query Tool• Image Viewing
and Annotation (Clarix)
• Screen Designer
Protein Crystallization Software Packages
Knowledge

10
Rhombix Software
Help
CrystalPlate Query
File Tools
Query Summary48 matching records f ound, 8 records selected Annotate...
Search Items
Queries
Target ID
User
Sav e Main
Help
? my Query
Temperature
3D-Bar
View Results...
DB Results
Ethelyne Glycol(10mM)
pH
pH = 5.2 - 6.4
TRIS pH 7.5(20mM)
Precipitant
Additive
Rysosome24(0.1%)
Created5/1/01 - 8/12/02
Rich
Greg
Reagent
Screen
Clarity
Date
4.2 4.3 4.44.6
5.15.3
5.96.1
6.2
2
4
0
1
2
3
4
5
6
7
8
9
pHSc ore
2
3
4
HamptonHampton I
Hampton II
Screen
Occ
urre
nce
lysozome 4.2 Vapor diffusion Hampton II
lysozome 4.2 Vapor diffusion Hampton II
lysozome 4.3 Vapor diffusion Hampton I
lysozome 4.2 Vapor diffusion Hampton I
lysozome 5.1 Vapor diffusion Hampton I
murB-1 6.2 Hanging drop Hampton II
murB-1 6.2 Hanging drop Hampton II
murB-1 5.9 Microbatch Hampton I
murB-1 4.2 Microbatch Hampton I
murB-1 4.4 Hanging drop Hampton
thrombin 4.3 Vapor diffusion Hampton II
thrombin 5.1 Vapor diffusion Hampton II
lysozome 5.1 Hanging drop Hampton II
Target ID pH Method Screen
Fourteen Software Applications Built into an Cohesive Framework
Spanning: Reagent Management to Data-Mining
User-defined values
User-defined values

11
Viewing and Annotation -- Clarix
interface for viewing and annotating images
brings in information from database (e.g. well contents & drop details)
provides feedback to imaging link to Screen Design for optimization
screens link to data-mining link to scheduling

12
Report Tool
Report across users and experiments
Export to .xls, .pdf, HTML, xml formats
One means of data sharing between sites (export at one site, import at another site)

13
Data Mining – Visual Query Tool
Graphical data-mining SW for general queries and experiment optimization planning
Links to Viewing application for display of image results

14
Screen Designer
Graphical interface for designing screens
Allows concentration and pH gradients
Gradients across grids, rows, columns
Patterns of start/step, start/end, center/step

15
Import Utility
Imports chemicals, screening solution formulations, screens, and experiments
Pair with report tool for data sharing

16
More Insight and Less Mystery in Crystallization
Tools for easy data entry
Tools for easy data retrieval and viewing
“Drop to Crystal” Workflow