
The Wine Sectors of New Zealand and Chile Dr Robert N ...
30
The Wine Sectors of New Zealand and Chile Dr Robert N Gwynne University of Birmingham Chile and New Zealand Between competition and cooperation? Victoria University of Wellington Friday April 22 nd , 2005
Transcript of The Wine Sectors of New Zealand and Chile Dr Robert N ...

The Wine Sectors of New Zealand and Chile
Dr Robert N GwynneUniversity of Birmingham
Chile and New ZealandBetween competition and cooperation?
Victoria University of WellingtonFriday April 22nd, 2005

Comparative analysis of the wine sectors of Chile and New Zealand
Political Economy linksLand under Wine GrapesWine ProductionWine ExportsWine Export Destinations

Figure One: Wine Exports from Chile and New Zealand, 1988-2003 (US$mn)
0
100
200
300
400
500
600
700
800
1988 1989 1990 1991 1992 1993 1994 1995 1996 1997 1998 1999 2000 2001 2002 2003
US$
mn
ChileNew Zealand

TABLE 1: PRODUCTION AND EXPORTS IN THE CHILEAN WINE INDUSTRY, 1994-2003 CHILE 1994 1995 1996 1997 1998 1999 2000 2001 2002 2003 Producing Areas (hectares)
54,146 54,393 56,004 63,543 75,388 85,347 103,876 106,971 108,569 n.d.
Total Production mn. litres
359.8 316.7 382.4 431.4 526.6 428.0 641.9 545.2 562.3 668.2
Export Volume mn.litres
109.5 129.0 184.1 216.3 230.9 229.9 266.7 311.0 344.3 391.3
Export Value US$mn
142.2 181.7 292.8 412.2 503.1 514.7 573.4 592.5 600.0 667.1
Export Volume as % of Prod. Volume
30.4 40.7 48.1 50.1 43.9 53.7 41.6 57.0 61.2 58.6
Source: ChileVid, Banco Central de Chile.

TABLE 2: PRODUCTION AND EXPORTS IN THE NEW ZEALAND WINE INDUSTRY, 1994-2004 NEW ZEALAND
1994 1995 1996 1997 1998 1999 2000 2001 2002 2003 2004
Producing Areas (hectares)
6,110 6,110 6,610 7,410 7,580 9,000 10,197 11,648 13,787 15,800 n.d.
Total Production mn litres
41.1 56.4 57.3 45.8 60.6 60.2 60.2 53.3 89.0 55.0 119.2
Export Volume mn litres
7.9 7.8 11.0 13.1 15.2 16.6 19.2 19.2 23.0 27.1 31.1
Export Value NZ$mn
41.5 40.8 80.3 75.9 97.6 125.3 168.6 198.1 246.4 281.9 302.6
Export Volume as % of Prod. Volume
19.2 13.8 19.2 28.6 25.1 27.6 31.9 36.0 25.8 49.3 26.1
Source: New Zealand Winegrowers Annual Report, June 2004

Figure 2: Change in Land Under Six Main Wine Grape Varieties, Chile, 1996-2002
0
5
10
15
20
25
30
35
40
45
1996 1997 1998 1999 2000 2001 2002
Thou
sand
Hec
tare
s
Cabernet SauPaisMerlotChardonnaySauvignon BlCarmenere

Figure 3: Change in Land Under Six Main Wine Grape Varieties, New Zealand, 1996-2002
0
1,000
2,000
3,000
4,000
1996
1997
1998
1999
2000
2001
2002
Hec
tare
s
ChardonnaySauvignon BlancPinot NoirMerlotCabernet SauvRiesling

Enterprise Development and Wine Regions
Structure of New Zealand industryStructure of Chilean industryEnterprise Development and the Wine Regions

New Zealand Wine Industry
Large wine enterprises linked to TNCs – Montana (Allied Domecq) & Nobilo (Constellation Brands). 52% 2004 vintage.Medium-sized wineries – some linked to TNCs (Wither Hills – Lion Nathan) but most not. 30% 2004 vintage.Small-scale family-owned wineries. In areas
near large metropolitan areas, significant sideline of wine tourism. 18% 2004 vintage.
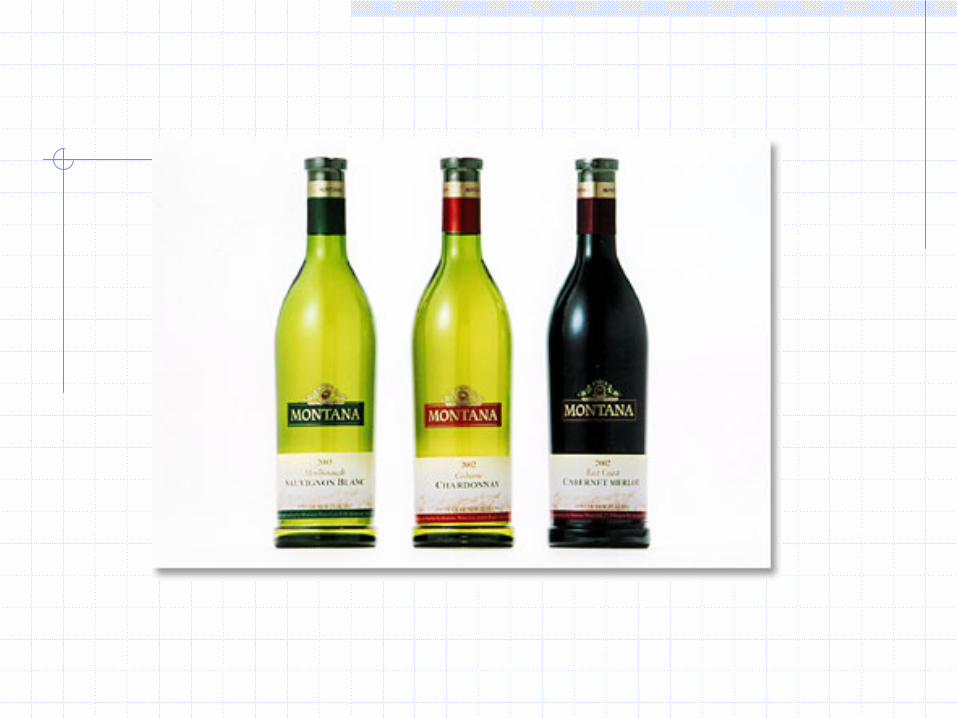

TABLE 3: MAIN NEW ZEALAND WINE REGIONS ACCORDING TO LAND UNDER DIFFERENT GRAPE VARIETIES, 2002 (hectares) Grape Variety
Marl- borough
% Gisborne % Hawkes Bay
% Other Regions
% Total %
Sauvignon Blanc
3,051 53.2 37 2.1 299 8.6 298 12.1 3,685 27.4
Chardonnay 989 17.3 995 56.1 957 27.7 486 19.7 3.427 25.4 Riesling 298 5.2 24 1.4 24 0.7 184 7.4 529 4.0 Pinot Noir 915 16.0 67 3.8 218 6.3 829 33.5 2,029 15.1 Cabernet Sauvignon
96 1.7 6 0.3 512 14.7 132 5.3 745 5.6
Merlot 103 1.8 77 4.3 759 21.9 138 5.6 1,077 8.0 All Other Varieties
279 4.8 568 32.0 694 20.1 406 16.4 1,950 14.5
TOTAL 5,731 100.0 1,774 100.0 3,463 100.0 2,473 100.0 13,442 100.0 Source: New Zealand Grape and Wine Statistical Annual 2003

N a p ie r
G is b o r n e
A u c k la n d
D u n e d in
W e l l i n g t o n
C o o k S t r a i t
H a w k e s B a y
P o v e r t y B a y
B le n h e im
C h r is t c h u r c h
N e ls o n
M t R u a p e h u
Q u e e n s t o w n
A u c k la n d
G is b o r n e
H a w k e s B a y
W a i r a r a p a
N e ls o n
M a r lb o r o u g h
C a n t e r b u r y
C e n t r a l O ta g o
0 5 0 1 0 0 1 5 0 M i l e s
0 5 0 1 0 0 1 5 0 K i lo m e t r e s
F i g u r e 4 . N e w Z e a l a n d ’s M a i n W i n e R e g i o n s


Chilean Wine Industry
Large domestic firms with a long “brand” history – Concha y Toro, ErrazurizSubsidiaries of large foreign-owned wine firms – can be wholly-owned or joint ventures.Medium-sized companies attempting to target niche export markets (UK 1st)Large cooperatives that have managed to upgrade (Cooperativa de Curico).

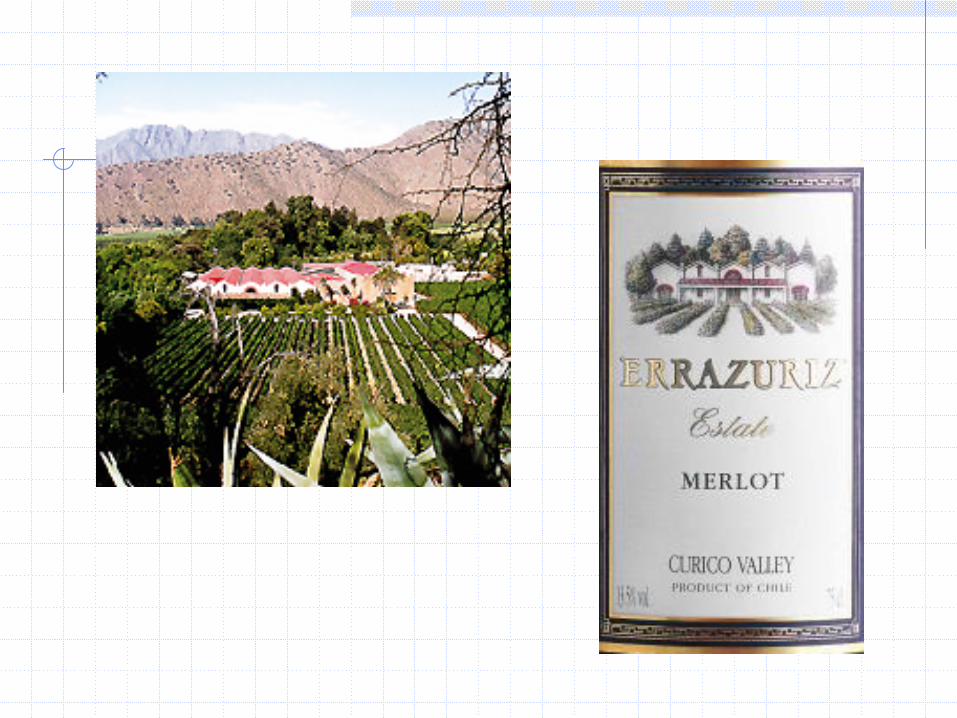


TABLE 4: MAIN CHILEAN WINE REGIONS ACCORDING TO LAND UNDER DIFFERENT GRAPE VARIETIES, 2002 (hectares) Grape Variety Maule
& Curico
% Rapel % Maipo % Acon. & Casablanca
% Others % TOTAL %
Cabernet Sauvignon
15,592 33.3 15,536 51.0 6,202 59.3 593 11.9 1,340 8.5 39,261 36.2
Merlot 5,669 12.1 5,083 16.7 1,155 11.0 551 11.0 310 2.0 12,768 11.8 Carmenère 2,263 4.9 2,621 8.6 527 5.0 164 3.3 229 1.5 5,805 5.3 Pais 8,812 18.7 308 1.0 5 0.1 75 1.5 5,750 36.5 14,949 13.8 Other Reds 3,814 8.1 3,613 11.9 882 8.4 810 16.2 1,043 6.6 10,162 9.4 TOTAL REDS 36,150 77.1 27,161 89.2 8771 83.8 2,193 43.8 8,672 55.1 82,945 76.4 Chardonnay 2,621 5.6 1,602 5.3 953 9.1 1,962 39.2 419 2.7 7,561 7.0 Sauvignon Blanc
4,965 10.6 924 3.0 397 3.8 638 12.7 118 0.7 7,041 6.5
Other Whites 3,141 6.7 773 2.5 340 3.3 213 4.3 6,550 41.5 11,017 10.1 TOTAL WHITES
10,727 22.9 3,299 10.8 1,690 16.2 2,813 56.2 7.087 44.9 25,610 23.6
TOTAL 46,877 100.0 30,460 100.0 10,461 100.0 5,006 100.0 15,759 100.0 108,564 100.0 Source: Chilevid

C a c h a p o a l
M a ta q u ito
L a ja
0 1 0 0 2 0 0 K m
F ig u re 5 . C h ile ’s M a in W in e R e g io n s
R e g io n S u b re g io n
M a ip o
R a p e l
C u ric o
M a u le
Ita ta
B io -B io
R e g io n a l b o rd e r
N a tio n a l fro n tie r
R iv e r
B o rd e rs o f w in ere g io n s
W in e to w n s
A c o n ca g u a
C a sa b la n c a
S a n tia g o
S a n F e lip e
C a s a b la n c a
R a n c a g u a
S a n F e rn a n d o
C u ric oM o lin a
Ta lca
S a n J a v ie r
C a u q u e n e s
S a n ta C ru z


TABLE 5: LAND UNDER THE DIFFERENT WINE GRAPE VARIETIES IN THE RAPEL REGION, CHILE, 2002 (Hectares)
Cabernet Sauvignon 15,536Merlot 5,083Carmenère 2,621Chardonnay 1,602Syrah 1,195Tintoreras 963Sauvignon Blanc 924Semillon 483Cot 447Cabernet Franc 374País 308Pinot Noir 197Alicante Bouschet 154Other Grapes 573TOTAL 30,460 Source: Sauter (2004)

Conclusions
Wine sectors in both New Zealand and Chile represent examples of sectors unable to grow in the inward-oriented paradigm. With the scale of potential markets shifting from the national to the global, the wine sectors in both countries had the opportunity to follow a completely different trajectory. This is partly for geographical reasons linked to the environmental characteristics of certain regions within both countries. With investment in wineries and vineyards it became apparent that these regions could produce quality wines for global markets. After a process of trial (and error) with grape varieties, certain regions were recognised to have the climatic and soil prerequisites to become iconic regions for the production of those varieties at the global scale. The Marlborough region came to specialise in the production of the Sauvignon Blanc variety and the Rapel region in Cabernet Sauvignon and Carmenère.

Sustained growth?
Both New Zealand and Chile could now be entering an era of sustained growth in their wine sectors. Over the past decade production, exports and investment have grown rapidly. A favourable spiral of expanding investment, upgrading of wineries and vineyards, improved products and increasing sales has developed. This has allowed for not only increased export volume but also for higher prices for those exports (per unit of volume).

A Paradox?
There is an apparent paradox in the relationship between the wine industry and the political economy framework in New Zealand and Chile. In New Zealand, a long period of significant and ‘enlightened’ state regulation of and intervention in the industry has resulted in an industry in which foreign-owned TNCs dominate the industry. In Chile, with a much longer history of market-and outward-orientation, a much more differentiated firm structure has developed but one in which foreign- owned TNCs have little significance in terms of direct ownership.

Culture and economy explanation?
Traditionally, New Zealand has been a beer-drinking country and formerly wine production in bulk was dominated by breweries; meanwhile, small-scale wine production was largely in the hands of Croat immigrants with little chance of significant growth in production.

In contrast, Chile has a long history of being a wine- drinking country, and formerly wine production incorporated large numbers of firms that produced for the domestic market.With the shift to higher quality and export-oriented production, the required investments were taken on by a large number of these companies in Chile. These firms both competed against each other in certain business areas (such as in gaining access to export markets) whilst collaborating in others (as in technological acquisition). Thus, the contrasting cultural history of enterprise development in the two countries may provide at least part of the explanation to the paradox


