The Structure of the Healthcare Sector and Healthcare …ncmwib.org/docs/HealthcareTrends.pdf ·...
31
The Structure of the Healthcare Sector and Healthcare Occupations in Massachusetts June 26 th , 2007 Jonathan Latner Research and Evaluation Analyst Commonwealth Corporation 617-727-8158 [email protected]
Transcript of The Structure of the Healthcare Sector and Healthcare …ncmwib.org/docs/HealthcareTrends.pdf ·...

The Structure of the Healthcare Sector and Healthcare Occupations
in Massachusetts
June 26th, 2007
Jonathan LatnerResearch and Evaluation Analyst
Commonwealth Corporation617-727-8158

Page 1
Table of Contents
1. Massachusetts Employment Trends
2. Healthcare Industry
3. Healthcare Occupations
4. Vacancies
5. Connecting Career Centers to Healthcare

Page 2
Massachusetts Employment TrendsEmployment is recovering from recession, but has not equaled its Peak: Feb, 2001MA is 1 of 6 states that has not reached pre-recessionary employment numbers*
Source: Department of Labor and Workforce DevelopmentCES Data, Seasonally Adjusted Data*Massachusetts Budget and Policy Center, State of Working Massachusetts, 9/3/06
January, 2001 – March, 2007
February, 20013,372,900
March, 20073,273,100
December, 20033,167,100
3,000,000
3,100,000
3,200,000
3,300,000
3,400,000
3,500,000
2001 2002 2003 2004 2005 2006 2007

Page 3
Do We Have Enough Workers Now?Many people are still seeking work
In May ’07, 101,300 fewer jobs than at peak Feb ’01From 2000 to 2006, virtually no population growthFrom Q1 ’01 to Q1 ’07:
• 71,790 more “unemployed”
From 2000 to 200621,100 more working part- time
15,200 more marginally attached –stopped looking for jobs recently:3,000 more “discouraged”
12,200 more stopped due to family or transportation reasons
From 2000 to 200447,500 more “non-employer” businesses in 2004 compared to 2000
Note: Based on 12 month averages from Current Population Survey (CPS)
Source: BLS (CPS) & Census (Non-employer)
Source: Census American Community Survey (ACS)
+74,763 (Census-Estimates)

Page 4
27
134547
669393
120131133
151164
177234
246303306
356459
Mining AFF
Utilities Real Estate
Arts, Entert. Mgt. of Cos.
Trans./Warehous.Information
Other ServicesPublic Admin.
WholesaleConstruction
Admin./Waste Svcs.Finance-Insurance Prof./ Tech. Svcs.
Hotels, Food Services Education
ManufacturingRetail
Health Care
Source: Bureau of Labor StatisticsQuarterly Census of Employment & Wages
Number of Massachusetts Workers Employed by Sector, 2005
Employment (‘000)

Page 5
What is included in the “Healthcare” sector?
Source: Bureau of Labor StatisticsQuarterly Census of Employment & Wages
Ambulatory Care(Outpatient Treatment)
•Doctor’s Offices•Dentist’s Offices•Home Care Services•Outpatient Care Centers•Other Health Practitioners•Other Ambulatory Care Services•Medical laboratories
Hospitals(Inpatient Treatment)
•General Hospitals•Other Hospitals•Psychiatric Hospitals
Nursing Care Facilities(Care for the Elderly)
•Nursing Homes•Residential Mental Health Facilities•Community Care Facilities for the Elderly•Other Residential Care Facilities
Social Assistance(Social Services)
•Individual & Family Services•Child Day Care Services•Vocational Rehabilitation Services•Emergency & Other Relief Services

Page 6
Hospitals172
Ambulatory health care
services129
Nursing and residential care
facilities93
Social assistance
63
Source: Bureau of Labor StatisticsQuarterly Census of Employment & Wages
Sector2005 Employment (‘000)Share of Mass. Employment
Proportion of Total Massachusetts Workforce Employed by Healthcare Sub-Sector, 2005
Page 7
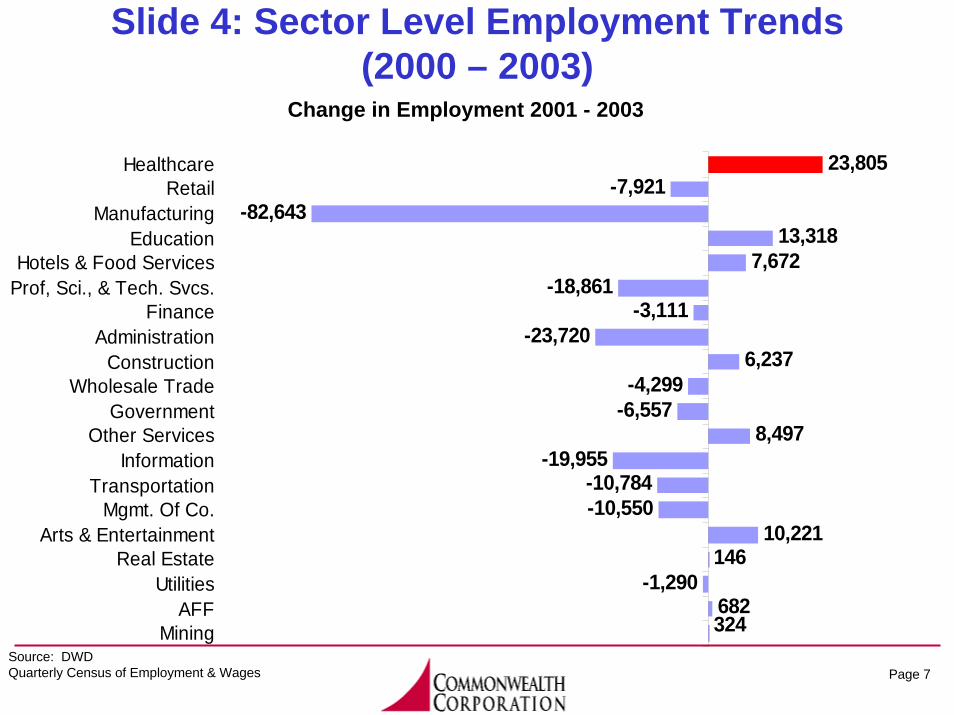
Slide 4: Sector Level Employment Trends (2000 – 2003)
324682
-1,290146
10,221-10,550-10,784
-19,9558,497
-6,557-4,299
6,237-23,720
-3,111-18,861
7,67213,318
-82,643-7,921
23,805
MiningAFF
UtilitiesReal Estate
Arts & EntertainmentMgmt. Of Co.
TransportationInformation
Other ServicesGovernment
Wholesale TradeConstruction
AdministrationFinance
Prof, Sci., & Tech. Svcs.Hotels & Food Services
EducationManufacturing
RetailHealthcare
Source: DWDQuarterly Census of Employment & Wages
Change in Employment 2001 - 2003

Page 8
Slide 5: Sector Level Employment Trends (2003 – 2005)
126104
-802598
-3,877820
-3,887-4,001
2,958-3,829-2,419
2,1597,514
-5713,202
3,9226,664
-20,371937
13,281
MiningAFF
UtilitiesReal Estate
Arts & EntertainmentMgmt. Of Co.
TransportationInformation
Other ServicesGovernment
Wholesale TradeConstruction
AdministrationFinance
Prof, Sci., & Tech. Svcs.Hotels & Food Services
EducationManufacturing
RetailHealthcare
Source: DWDQuarterly Census of Employment & Wages
Change in Employment 2003 - 2005

Page 9
01
00
101
31
3-1
12
023
-216
4666891114151719202022
2748
57151
LaboratoriesRelief Services
Other Res. Care facilitiesOther Ambulatory Health
Psychiatric HospitalsVocational Rehab. Services
Offices of Other Health Practs.Community Care for the
Other HospitalsRes. Mental Health Facilites
Outpatient Care CentersHome Health Care
Dentist's OfficesChild Day Care Services
Individual and Family ServicesDoctor's offices
Nursing Care FacilitiesGeneral Hospitals
HospitalsAmbulatory Care
Nursing Care
Social Assistance
Source: Bureau of Labor StatisticsQuarterly Census of Employment & Wages
Healthcare Industry Group Level Employment (2005) and Trends (2001 – 2005)
2005 Employment (‘000) Change from 2001 (‘000)

Page 10
Regional Employment in the Healthcare Industry
Source: Mass. Department of Workforce DevelopmentQuarterly Census of Employment & Wages
2005 Employment
16.7% 16.4%15.1%
10.2%
14.2%
16.4%14.8% 14.6% 14.5%
Berkshire Boston Central Metro SW North East PioneerValley
South East Cape Cod MA

Page 11
Regional Structure of the Healthcare Industry
Source: Mass. Department of Workforce DevelopmentQuarterly Census of Employment & Wages
38%59%
28%
19%20%
10%14%13%
0%
25%
50%
75%
100%
Berkshire Boston Central Metro SW North East PioneerValley
South East Cape MA
Hospitals Ambulatory Health Care Services Nursing and Residential Care Facilities Social Assistance

Page 12
Healthcare Occupations Comprise 50% of Healthcare & Social Assistance Sector
Source: Mass. Department of Workforce DevelopmentIndustry – Occupation Crosswalk
34%
17% 16%
8%
4% 4% 3%
13%
HealthcareProfessionals
Admin. Support HealthcareSupport Workers
Social Services Education Management Food Prep. Other
Healthcare Related Occupations
Non-Healthcare Related Occupations

Page 13
Industry Sectors and Occupations86% of Healthcare professionals and 81% of Healthcare support
occupations work in the Healthcare sector
Source: Mass. Department of Workforce DevelopmentIndustry-Occupation Crosswalk
Share (%) of Employees from Major Occupational Groups Working in Healthcare
100%
Healthcare
Professionals79%
5%
4%
2%
Industry
All
Occupations
Managem
ent
Business
Fin. Ops .
Life, Phy. Soc. Science
Com
munity
Social Svcs
Education
Healthcare
Support Workers
Building
Grounds
Food Prep.
Office &
A
dmin
Healthcare 14% 9% 4% 9% 60% 9% 81% 11% 6% 14%
Retail
Education 2%
Govt. 8%Admin. Svcs. 4%
Total 100%
1%5%
Prof. Tech.Svcs. 3% 2%
Page 14
2001 2006
% of MA
% of MA
% Increase
MedianSalary
MedianSalary
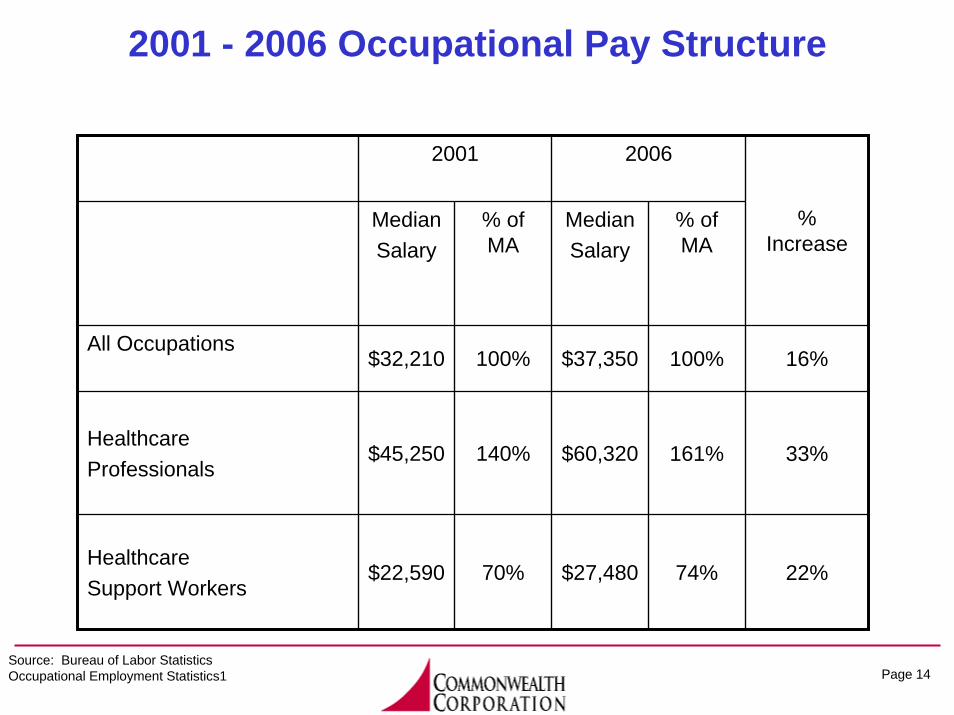
All Occupations$32,210 100% $37,350 100%
140% $60,320
$27,48070%
161%
74%
16%
Healthcare Professionals
$45,250 33%
$22,590 22%Healthcare Support Workers
2001 - 2006 Occupational Pay Structure
Source: Bureau of Labor StatisticsOccupational Employment Statistics1
Page 15
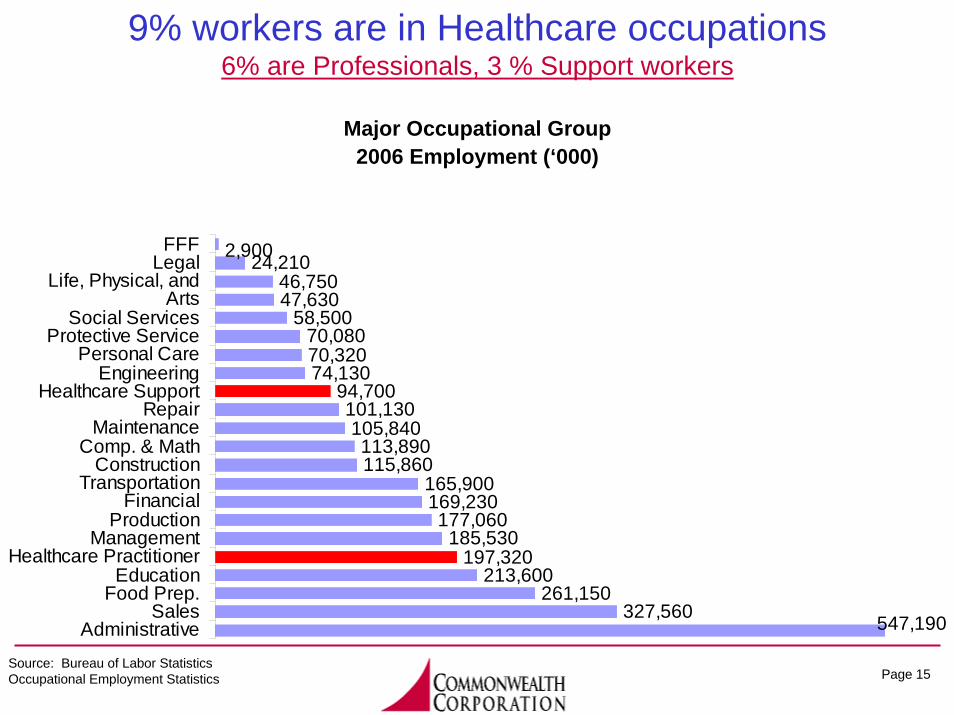
9% workers are in Healthcare occupations 6% are Professionals, 3 % Support workers
Source: Bureau of Labor StatisticsOccupational Employment Statistics
Major Occupational Group2006 Employment (‘000)
547,190327,560261,150
213,600197,320
185,530177,060
169,230165,900
115,860113,890
105,840101,130
94,70074,13070,32070,080
58,50047,63046,750
24,2102,900
AdministrativeSales
Food Prep.Education
Healthcare PractitionerManagement
ProductionFinancial
TransportationConstruction
Comp. & MathMaintenance
RepairHealthcare Support
EngineeringPersonal Care
Protective ServiceSocial Services
ArtsLife, Physical, and
LegalFFF

Page 16
Healthcare occupations are growing
Change in Employment 2001-2006
Source: Bureau of Labor StatisticsOccupational Employment Statistics
860-2,430
7,1307,740
6,090-1,720
2,340-2,500
5,510-7,530
-4,5503,580
-2,150-9,470
40,060-54,750-55,090
14,5006,270
11,010630
-25,210
FFFLegal
SciencesArts
Social ServicesProtective Service
Personal CareEngineering
Healthcare SupportMaintenance
Buildings & GroundsComp. & Math
ConstructionTransportation
FinanceProduction
ManagementHealthcareEducation
Food Prep.Sales
Administrative

Page 17
Social Assistance & Nursing Care exhibit a much more diversified workforce
Source: Mass. Department of Workforce DevelopmentIndustry – Occupation Crosswalk, 2005
HealthcarePractitioners
39%
HealthcarePractitioners
50%
HealthcarePractitioners
19%
HealthcareSupport Workers
17%
HealthcareSupport Workers
12%
HealthcareSupport Workers
34%
Administration8%
Administration - 5%
Administration17%
Administration28%
Social Services24%
Social Services - 7%
Social Services - 6%
Education27%
Management8%
Food Prep11%
Other10% Other
21%Other24% Other
32%
0%
10%
20%
30%
40%
50%
60%
70%
80%
90%
100%
Ambulatory Care Hospitals Nursing Care Social Assistance

Page 18
Half of Healthcare professionals are nurses77,000 RNs, 17,000 LPNs, Large no. of therapists, technologists, and
technicians
Source: Bureau of Labor StatisticsOccupational Employment Statistics
10,4102,0602,390
4,8605,4805,5305,930
8,44011,540
13,85016,09016,91017,330
76,350
Other Healthcare ProfessionalsPhysician Assistants
DentistsEMT's and Paramedics
Dental HygienistsHealth Information Technicians
PharmacistsDiagnostic Related Technicians
Health Diagnosing Support TechniciansClinical Laboratory Technicians
Physicians and SurgeonsLicensed Practical Nurses
TherapistsRegistered Nurses

Page 19
Who are Healthcare Support workers?Almost half are nursing aides- 41,000
Source: Bureau of Labor StatisticsOccupational Employment Statistics
3,3602607609701,1201,1401,3401,7601,8301,980
6,3707,260
9,49016,750
40,330
Healthcare support workers, all otherOccupational therapist aides
Massage therapistsOccupational therapist assistants
Medical equipment preparersPhysical therapist aides
Pharmacy aidesMedical transcriptionists
Veterinary assistantsPhysical therapist assistants
Dental assistantsPsychiatric aides
Medical assistantsHome health aides
Nursing aides
Page 20
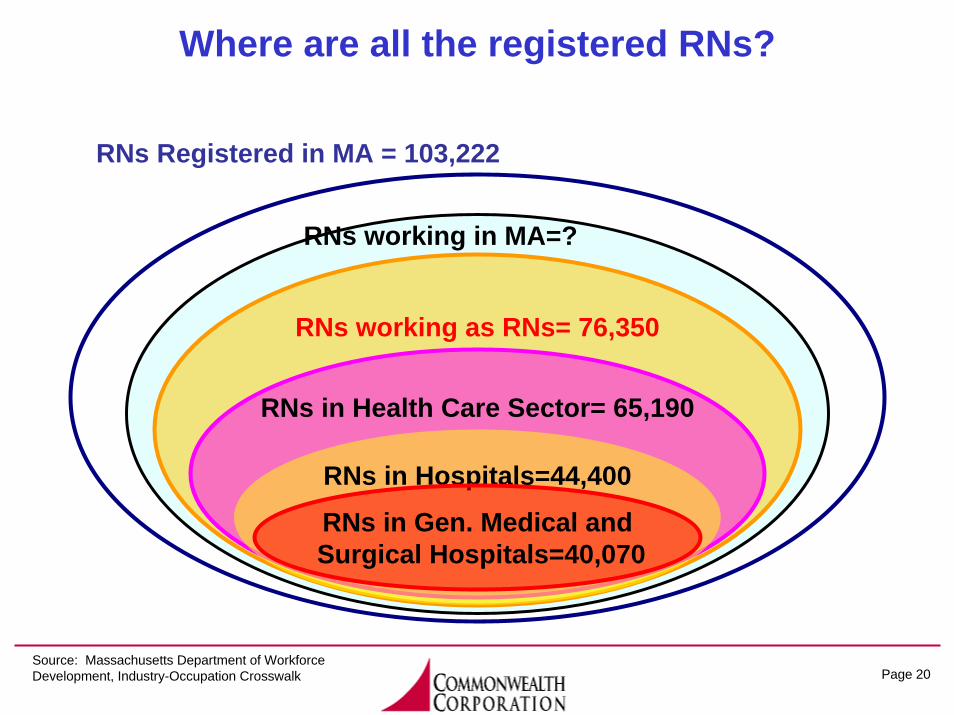
Where are all the registered RNs?
Source: Massachusetts Department of Workforce Development, Industry-Occupation Crosswalk
RNs working as RNs= 76,350
RNs in Health Care Sector= 65,190
RNs in Hospitals=44,400
RNs Registered in MA = 103,222
RNs in Gen. Medical andSurgical Hospitals=40,070
RNs working in MA=?

Page 21
16 - 3950%
16-3951%
16-3936%
16-3935%
40-4925%
40-4925%
40-4933%
40-4937%
50-5917%
50-5917%50-59
25%50-5922%
60+, 7%60+, 8%60 +, 6%60+, 6%
0%
50%
100%
RN LPN Nurses & HomeHealth Aides
All Occupations
Age of Nursing Professionals & Paraprofessionals
Source: 2000 CensusEqual Employment Opportunity Tabulation

Page 22
86%92%
85%
65%
4%
20%
9%4% 2%1%
5%8%
8%4%3% 6%
0%
50%
100%
RN LPN Nurses & HomeHealth Aides
All Occupations
White African-American Hispanic Other
Source: 2000 CensusEqual Employment Opportunity Tabulation
Diversity of Nursing Professionals & Paraprofessionals
Page 23
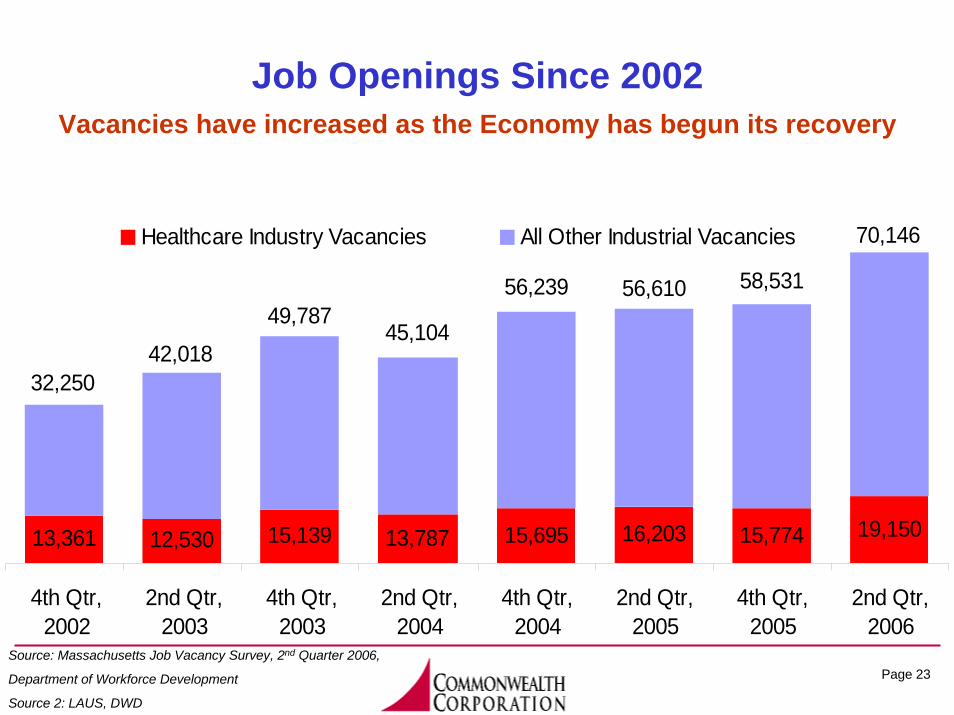
13,361 12,530 15,139 13,787 15,695 16,203 15,774 19,150
70,146
58,53156,61056,239
45,10449,787
42,01832,250
4th Qtr,2002
2nd Qtr,2003
4th Qtr,2003
2nd Qtr,2004
4th Qtr,2004
2nd Qtr,2005
4th Qtr,2005
2nd Qtr,2006
Healthcare Industry Vacancies All Other Industrial Vacancies
Source: Massachusetts Job Vacancy Survey, 2nd Quarter 2006,
Department of Workforce Development
Source 2: LAUS, DWD
Job Openings Since 2002 Vacancies have increased as the Economy has begun its recovery

Page 24
Critical Healthcare Occupations
Source: CommCorp analysis of Massachusetts Job Vacancy Survey dataSource 2: Commonwealth Corporation analysis of Integrated Post-Secondary Educational Data Systems (IPEDS) data from the National Center for Educational Statistics.
Occupations Vacancies 2005 Degree/Certificates Granted2,689
5215879181983
1776642039
Medical Assistants 292 1949Veterinary Assistants 97 78
Registered Nurses 4,581Physical Therapists 381Respiratory Therapists 210Veterinarians 70Medical and Clinical Laboratory Technologists 314Medical and Clinical Laboratory Technicians 301Diagnostic Medical Sonographers 94Radiologic Technologists and Technicians 244Licensed Practical Nurses 470Nursing Aides, Orderlies, and Attendants 1,994Physical Therapist Assistants 107Physical Therapist Aides 60

Page 25
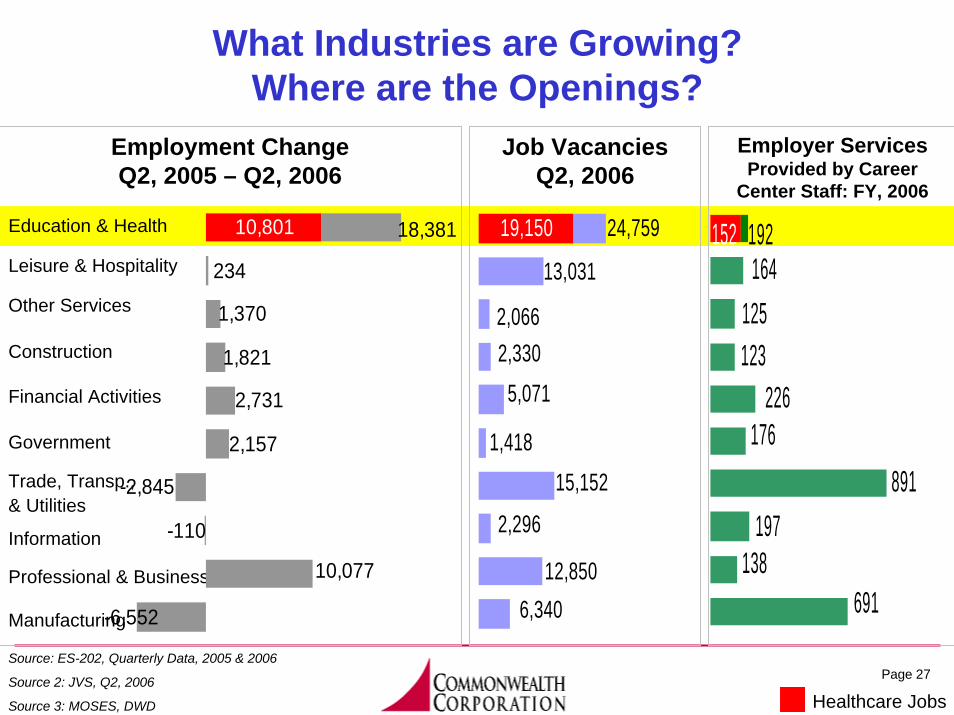
Employment ChangeQ2, 2005 – Q2, 2006
What Industries are Growing?Where are the Openings?
Education & Health
Leisure & Hospitality
Other Services
Construction
Financial Activities
Government
Trade, Transp., & Utilities
Information
Professional & Business
Manufacturing
Source: ES-202, Quarterly Data, 2005 & 2006
Source 2: JVS, Q2, 2006
Source 3: MOSES, DWD Healthcare Jobs
-6,552
10,077
-110
-2,845
2,157
2,731
1,821
1,370
234
10,801 18,381

Page 26
-6,552
10,077
-110
-2,845
2,157
2,731
1,821
1,370
234
10,801 18,381
Employment ChangeQ2, 2005 – Q2, 2006
What Industries are Growing?Where are the Openings?
Source: ES-202, Quarterly Data, 2005 & 2006
Source 2: JVS, Q2, 2006
Source 3: MOSES, DWD
Job VacanciesQ2, 2006
Education & Health
Leisure & Hospitality
Other Services
Construction
Financial Activities
Government
Trade, Transp., & Utilities
Information
Professional & Business
Manufacturing
Healthcare Jobs
6,34012,850
2,296
15,1521,418
5,0712,3302,066
13,031
19,150 24,759
Page 27
Employment ChangeQ2, 2005 – Q2, 2006
What Industries are Growing?Where are the Openings?
Source: ES-202, Quarterly Data, 2005 & 2006
Source 2: JVS, Q2, 2006
Source 3: MOSES, DWD
Job VacanciesQ2, 2006
Education & Health
Leisure & Hospitality
Other Services
Construction
Financial Activities
Government
Trade, Transp., & Utilities
Information
Professional & Business
Manufacturing
152
691138
197891
176226
123125
164192
Employer ServicesProvided by Career
Center Staff: FY, 2006
Healthcare Jobs
6,34012,850
2,296
15,1521,418
5,0712,3302,066
13,031
19,150 24,759
-6,552
10,077
-110
-2,845
2,157
2,731
1,821
1,370
234
10,801 18,381

Page 28
Employment Trends2001 - 2006
What Occupations are Growing?Where are the Openings?
Source: OES, 2001 & 2005
Source 2: JVS, Q2, 2006
Source 3: MOSES, DWD
Job VacanciesQ2, 2006
Transp. & Material Moving
Production
Installation, Maintenance
Construction & Repair
Administrative Support
Sales & Related
Service
Professional
Management
Career Centers Job Postings
FY, 2006
Healthcare Jobs
-9,470
-54,750
-7,530
-2,150
-25,210
630
5,510
14,500
-55,090
7,940
65,940

Page 29
-9,470
-54,750
-7,530
-2,150
-25,210
630
5,510
14,500
-55,090
7,940
65,940
5,848
10,848
9,090
1,592
1,916
3,303
3,826
8,574
4,050 15,886
21,363
Employment Trends2001 - 2006
What Occupations are Growing?Where are the Openings?
Source: OES, 2001 & 2005
Source 2: JVS, Q2, 2006
Source 3: MOSES, DWD
Job VacanciesQ2, 2006
Transp. & Material Moving
Production
Installation, Maintenance
Construction & Repair
Administrative Support
Sales & Related
Service
Professional
Management
Healthcare Jobs

Page 30
5,848
10,848
9,090
1,592
1,916
3,303
3,826
8,574
4,050 15,886
21,363
Employment Trends2001 - 2006
What Occupations are Growing?Where are the Openings?
Source: OES, 2001 & 2005
Source 2: JVS, Q2, 2006
Source 3: MOSES, DWD
Job VacanciesQ2, 2006
Transp. & Material Moving
Production
Installation, Maintenance
Construction & Repair
Administrative Support
Sales & Related
Service
Professional
Management
14,722
32,603
7,791
7,235
34,782
15,895
3,140
5,140
7,464
39,844
28,187
Career Centers Job Postings
FY, 2006
Healthcare Jobs
-9,470
-54,750
-7,530
-2,150
-25,210
630
5,510
14,500
-55,090
7,940
65,940