Region 15 Regional Healthcare Partnership 19 th Public Meeting
Upload
truongngocCategory
view
217download
0
1
Regional HealthCare Workforce Profile
Produced by HealthLandscape, LLC
for
Urban Universities for HEALTH (Health Equity Alignment through Leadership and Transformation of the Health Workforce)
Jené Grandmont
Mark Carrozza
July, 2014
2
Table of Contents
Introduction ..................................................................................................................... 3
Summary of Results and Recommendations .................................................................. 3
Detailed Results by Profession ....................................................................................... 6
Primary Care Physicians ............................................................................................. 6
Advanced Practice Nurses (by specialty), Registered Nurses ..................................... 8
Pharmacists ............................................................................................................... 11
Audiologists ............................................................................................................... 12
Physical Therapists .................................................................................................... 13
Registered Dieticians ................................................................................................. 14
Social Workers........................................................................................................... 14
Speech-Language Pathologists ................................................................................. 16
Community Health Workers ....................................................................................... 17
Community Profile ......................................................................................................... 18
Demographic Profile .................................................................................................. 18
Poverty Status and Income ........................................................................................ 21
Access to Health Care ............................................................................................... 22
Population Health Indicators ...................................................................................... 25
References .................................................................................................................... 36
Data Sources ................................................................................................................ 36
Appendix A. Community Profile Detailed Tables ........................................................... 37
Demographic Profile .................................................................................................. 37
Poverty Status and Income ........................................................................................ 39
Access to Health Care ............................................................................................... 40
Population Health Indicators ...................................................................................... 41
Appendix B. NPI Nursing Data ...................................................................................... 47
Appendix C. Ohio Medical School Graduates ............................................................... 47
Appendix D. Data Points Collected by the Ohio License Center ................................... 47
3
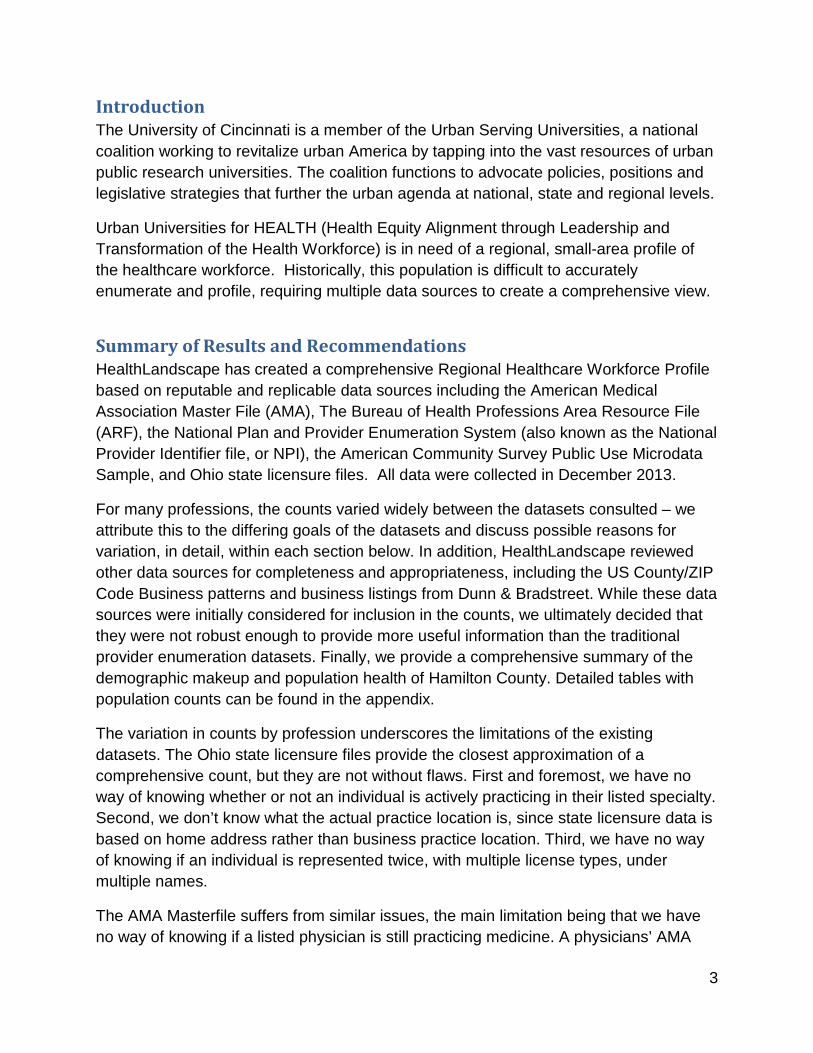
Introduction The University of Cincinnati is a member of the Urban Serving Universities, a national coalition working to revitalize urban America by tapping into the vast resources of urban public research universities. The coalition functions to advocate policies, positions and legislative strategies that further the urban agenda at national, state and regional levels.
Urban Universities for HEALTH (Health Equity Alignment through Leadership and Transformation of the Health Workforce) is in need of a regional, small-area profile of the healthcare workforce. Historically, this population is difficult to accurately enumerate and profile, requiring multiple data sources to create a comprehensive view.
Summary of Results and Recommendations HealthLandscape has created a comprehensive Regional Healthcare Workforce Profile based on reputable and replicable data sources including the American Medical Association Master File (AMA), The Bureau of Health Professions Area Resource File (ARF), the National Plan and Provider Enumeration System (also known as the National Provider Identifier file, or NPI), the American Community Survey Public Use Microdata Sample, and Ohio state licensure files. All data were collected in December 2013.
For many professions, the counts varied widely between the datasets consulted – we attribute this to the differing goals of the datasets and discuss possible reasons for variation, in detail, within each section below. In addition, HealthLandscape reviewed other data sources for completeness and appropriateness, including the US County/ZIP Code Business patterns and business listings from Dunn & Bradstreet. While these data sources were initially considered for inclusion in the counts, we ultimately decided that they were not robust enough to provide more useful information than the traditional provider enumeration datasets. Finally, we provide a comprehensive summary of the demographic makeup and population health of Hamilton County. Detailed tables with population counts can be found in the appendix.
The variation in counts by profession underscores the limitations of the existing datasets. The Ohio state licensure files provide the closest approximation of a comprehensive count, but they are not without flaws. First and foremost, we have no way of knowing whether or not an individual is actively practicing in their listed specialty. Second, we don’t know what the actual practice location is, since state licensure data is based on home address rather than business practice location. Third, we have no way of knowing if an individual is represented twice, with multiple license types, under multiple names.
The AMA Masterfile suffers from similar issues, the main limitation being that we have no way of knowing if a listed physician is still practicing medicine. A physicians’ AMA
4
record is established when they enter an accredited medical school and is, theoretically, continually updated as the individual earns additional certifications and moves to practice around the country. There may be significant omissions and/or lag time between updates. A 2007 analysis conducted by the Rutgers Center for State Health Policy suggests that states would be better served by conducting their own internal physician census than by using the AMA Masterfile. They found that the AMA did not accurately capture information on specialty area and current practice status, among other demographic measurements. Further, they find problems with the AMA protocol of listing only one office location per physician – this can lead to incorrect estimates of the number of physicians practicing in any given state or county. This echoes the findings of a 2000 study which showed that relying solely on the AMA Masterfile for local physician counts can result in as much as a 20% overstatement (Konrad, Slifkin, Stevens, & Miller, 2000). There is also no way of knowing if the address on record is actually a practice address, rather than a home or mailing address.
The NPI database contains information for many healthcare professionals beyond just physicians, but the data is of somewhat limited use because it only includes those individuals who have applied for and received a Medicare billing number. We have limited the dataset used for this report to include only those providers whose record shows a Business Practice Location within Hamilton County.
There have been previous efforts to enumerate the local healthcare workforce. Prior to this report, the Primary Care Capacity Study (PCC) attempted to do so in order to evaluate the potential need for primary care providers, given the influx of covered adults under the Affordable Care Act. In order to get past the previously described data limitations, they created a custom dataset by combining information from multiple data sources. Their findings were based on a dataset initialized by The Health Collaborative, and included information from the AMA, Business Courier, Medical Group Management Association, and State License Boards. Initial data was obtained from the state agencies, and then “cleansed” by cross-checking other data sources (internet, yellow pages, phone calls, health systems) to verify practice status. Physicians were only included in the database if they could be verified. Pediatricians were NOT included in the database, as the mission of the PCC was to account for increased demand by Medicaid and newly insured adults.
It is clear that what we lack when it comes to the enumeration of the healthcare workforce is a single, comprehensive database that collects and tracks information at the individual level across all healthcare professions. A 2013 paper by the Medicare and Medicaid Research Review suggests that a more accurate picture of the healthcare workforce could be generated by linking the NPI data with other, more regularly updated datasets such as the AMA Masterfile, the Provider Enrollment, Chain, and Ownership
5
System, and the Medicare- and Medicaid-Fee-for-Service Claims data (Bindman, 2013). Future research into this type of collaboration is needed.
In addition to a large-scale effort to link existing datasets, we should also explore possible state- and county-level efforts to expand and improve upon the data collected by medical providers. States maintain their own licensure data for a variety of care providers, but there is little standardization across provider types, let alone across state boundaries. One path to explore would be to create a task force to evaluate the data recorded and maintained by the state of Ohio, with the goal of determining whether the data collected is appropriate and sufficient to allow for regular snapshots of the health of the workforce. If the data collection and database maintenance performed by the state is deemed not sufficient, steps could be taken to revise the reporting requirements, collection procedures, and data verification and update schedule to better serve the needs of health workforce researchers. One of the main limitations of the existing datasets is the frequency of updates. With the AMA Masterfile, especially, lags in data updates and lack of detail on current practice status make it difficult to get an accurate view of the current state of the workforce.
While standardization across the state would be ideal, from the standpoint of time and resources it may be impractical. Resources may be better allocated by focusing on a local effort, to include either Hamilton County, alone, or expand to include the larger Cincinnati Metro Area. By focusing efforts on a much smaller geographic area, we may be able to not only develop a solution that works for our region, but take steps to create a model for other regions to follow, as well.

6
Detailed Results by Profession
Primary Care Physicians
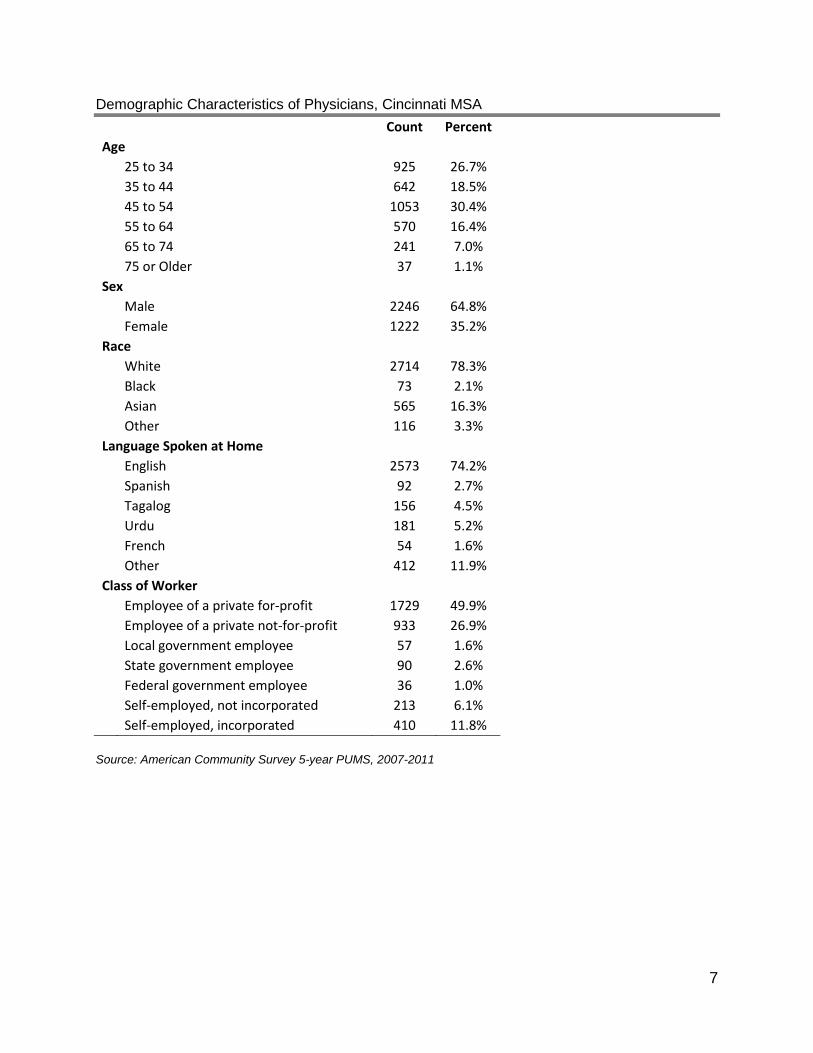
Summary In order to more narrowly define “physician,” our counts were limited to MDs and DOs who designate themselves in one of the following categories; Family Medicine, General Practice, Internal Medicine, and Pediatrics. We generated counts from three datasets, including the American Medical Association Masterfile (AMA), the National Plan and Provider Enumeration database (NPI), and the Area Resource File (ARF). The three available datasets result in very different physician counts, ranging from 896 in the AMA to 1,496 in the NPI. All three datasets show that most physicians fall into the “internal medicine” category.
Data Availability and Quality The three datasets used to generate our estimates reflect vastly different ways of counting the number of physicians. A physicians’ AMA record is established when they enter an accredited medical school. Certification information is continually added to that record. The NPI only reflects those physicians who have applied for and received a Medicare billing number. For our purposes, we have limited the dataset to those physicians whose record shows a Business Practice Location within Hamilton County. ARF totals are based on the AMA dataset.
Demographic data comes from the American Community Survey, and only provides a sample estimate for the Cincinnati MSA.
Detailed Tables and Charts
AMA NPI*
ARF (2011)
Family Medicine 228 267 232 General Practice 18 27 15 Internal Medicine 404 779 492 Pediatrics 246 423 370 Total 896 1,496 1,109
* Based on primary taxonomy
7
Demographic Characteristics of Physicians, Cincinnati MSA
Count Percent Age
25 to 34 925 26.7%
35 to 44 642 18.5%
45 to 54 1053 30.4%
55 to 64 570 16.4%
65 to 74 241 7.0%
75 or Older 37 1.1%
Sex
Male 2246 64.8%
Female 1222 35.2%
Race
White 2714 78.3%
Black 73 2.1%
Asian 565 16.3%
Other 116 3.3%
Language Spoken at Home
English 2573 74.2%
Spanish 92 2.7%
Tagalog 156 4.5%
Urdu 181 5.2%
French 54 1.6%
Other 412 11.9%
Class of Worker
Employee of a private for-profit 1729 49.9%
Employee of a private not-for-profit 933 26.9%
Local government employee 57 1.6%
State government employee 90 2.6%
Federal government employee 36 1.0%
Self-employed, not incorporated 213 6.1%
Self-employed, incorporated 410 11.8%
Source: American Community Survey 5-year PUMS, 2007-2011
8
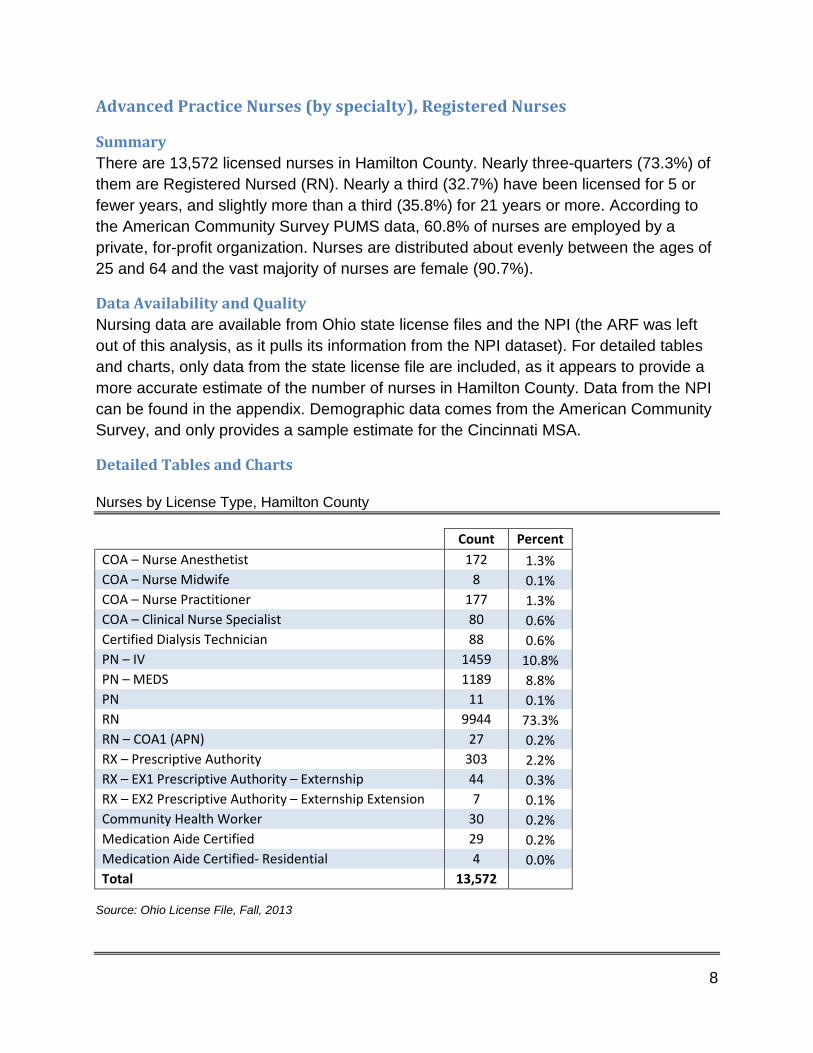
Advanced Practice Nurses (by specialty), Registered Nurses
Summary There are 13,572 licensed nurses in Hamilton County. Nearly three-quarters (73.3%) of them are Registered Nursed (RN). Nearly a third (32.7%) have been licensed for 5 or fewer years, and slightly more than a third (35.8%) for 21 years or more. According to the American Community Survey PUMS data, 60.8% of nurses are employed by a private, for-profit organization. Nurses are distributed about evenly between the ages of 25 and 64 and the vast majority of nurses are female (90.7%).
Data Availability and Quality Nursing data are available from Ohio state license files and the NPI (the ARF was left out of this analysis, as it pulls its information from the NPI dataset). For detailed tables and charts, only data from the state license file are included, as it appears to provide a more accurate estimate of the number of nurses in Hamilton County. Data from the NPI can be found in the appendix. Demographic data comes from the American Community Survey, and only provides a sample estimate for the Cincinnati MSA.
Detailed Tables and Charts Nurses by License Type, Hamilton County
Count Percent COA – Nurse Anesthetist 172 1.3% COA – Nurse Midwife 8 0.1% COA – Nurse Practitioner 177 1.3% COA – Clinical Nurse Specialist 80 0.6% Certified Dialysis Technician 88 0.6% PN – IV 1459 10.8% PN – MEDS 1189 8.8% PN 11 0.1% RN 9944 73.3% RN – COA1 (APN) 27 0.2% RX – Prescriptive Authority 303 2.2% RX – EX1 Prescriptive Authority – Externship 44 0.3% RX – EX2 Prescriptive Authority – Externship Extension 7 0.1% Community Health Worker 30 0.2% Medication Aide Certified 29 0.2% Medication Aide Certified- Residential 4 0.0% Total 13,572
Source: Ohio License File, Fall, 2013
9
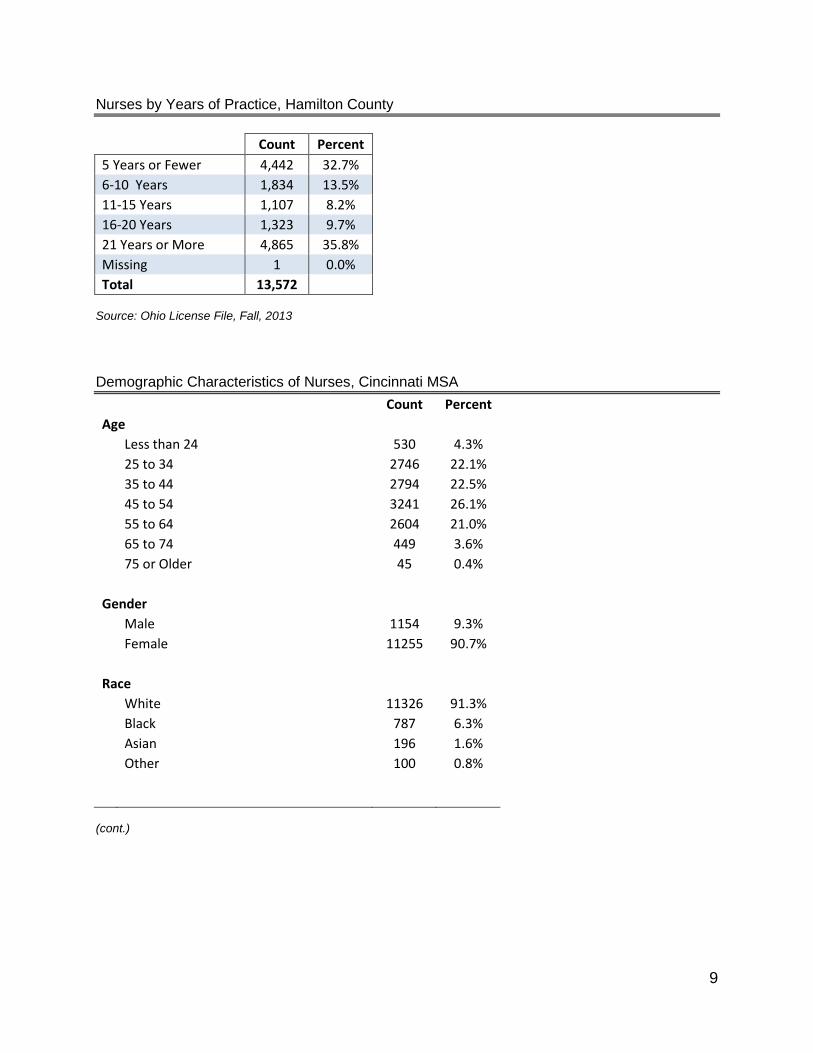
Nurses by Years of Practice, Hamilton County
Count Percent 5 Years or Fewer 4,442 32.7% 6-10 Years 1,834 13.5% 11-15 Years 1,107 8.2% 16-20 Years 1,323 9.7% 21 Years or More 4,865 35.8% Missing 1 0.0% Total 13,572
Source: Ohio License File, Fall, 2013 Demographic Characteristics of Nurses, Cincinnati MSA
Count Percent
Age
Less than 24 530 4.3%
25 to 34 2746 22.1%
35 to 44 2794 22.5%
45 to 54 3241 26.1%
55 to 64 2604 21.0%
65 to 74 449 3.6%
75 or Older 45 0.4%
Gender
Male 1154 9.3%
Female 11255 90.7%
Race
White 11326 91.3%
Black 787 6.3%
Asian 196 1.6%
Other 100 0.8%
(cont.)
10
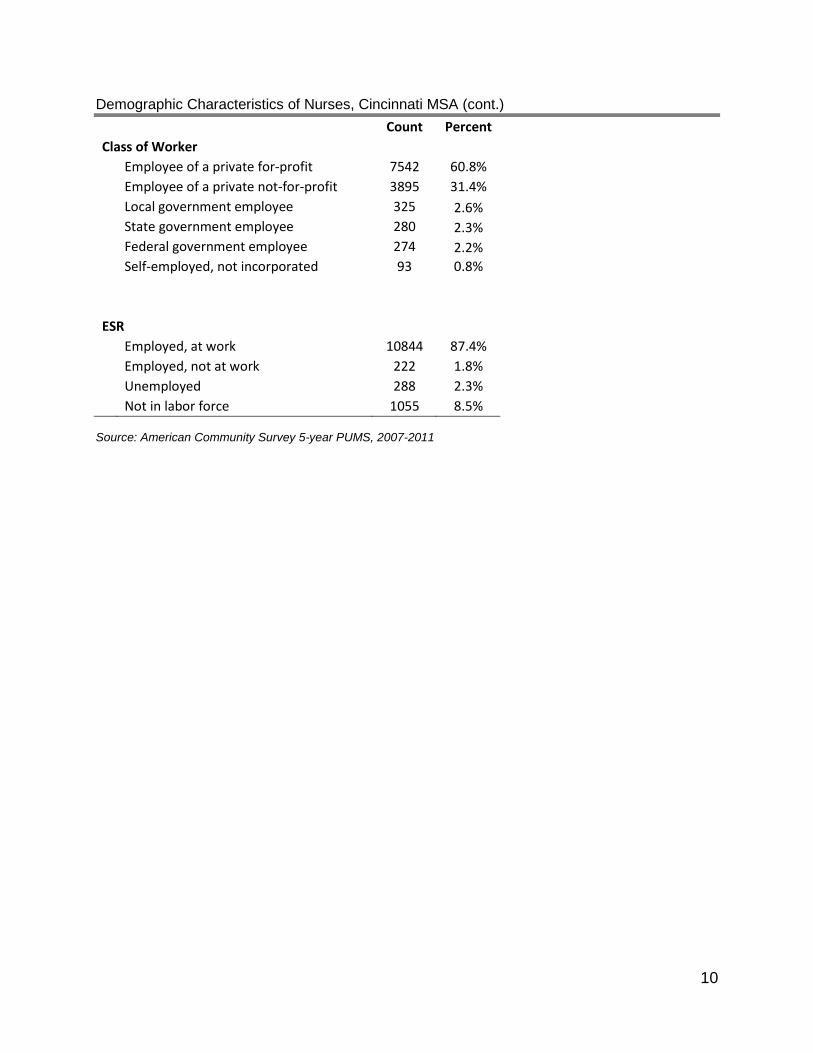
Demographic Characteristics of Nurses, Cincinnati MSA (cont.)
Count Percent
Class of Worker
Employee of a private for-profit 7542 60.8%
Employee of a private not-for-profit 3895 31.4%
Local government employee 325 2.6%
State government employee 280 2.3%
Federal government employee 274 2.2%
Self-employed, not incorporated 93 0.8%
ESR
Employed, at work 10844 87.4%
Employed, not at work 222 1.8%
Unemployed 288 2.3%
Not in labor force 1055 8.5%
Source: American Community Survey 5-year PUMS, 2007-2011
11
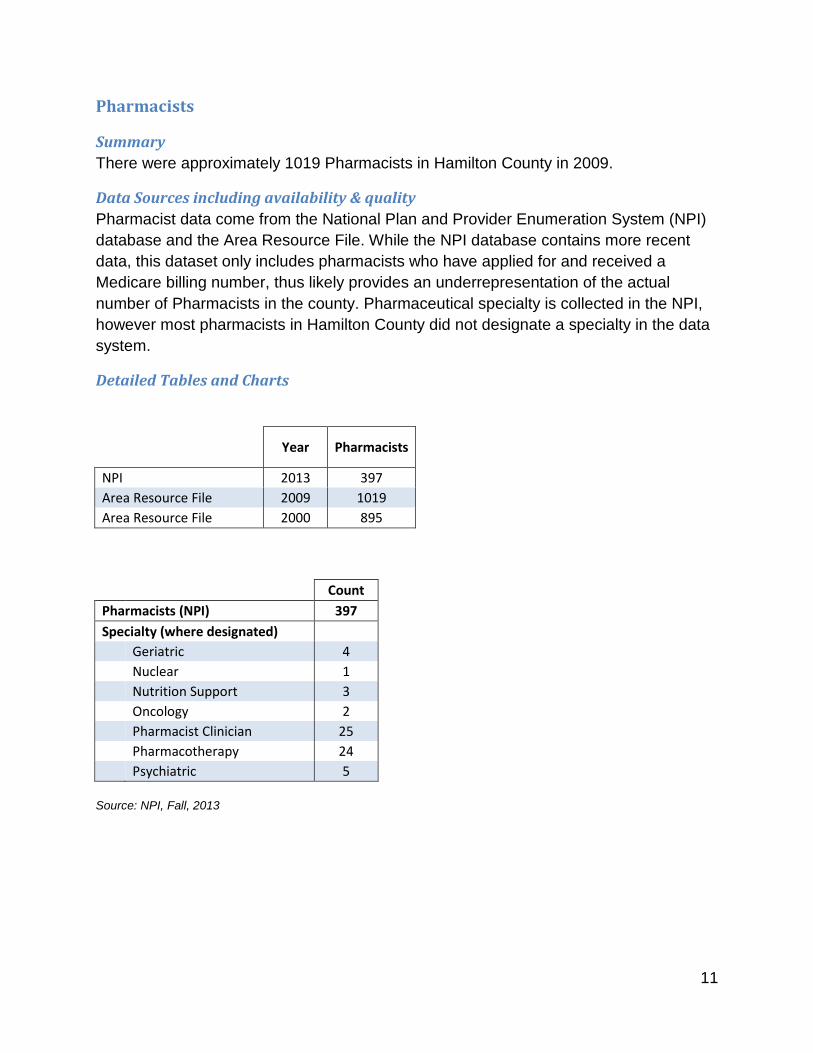
Pharmacists
Summary There were approximately 1019 Pharmacists in Hamilton County in 2009.
Data Sources including availability & quality Pharmacist data come from the National Plan and Provider Enumeration System (NPI) database and the Area Resource File. While the NPI database contains more recent data, this dataset only includes pharmacists who have applied for and received a Medicare billing number, thus likely provides an underrepresentation of the actual number of Pharmacists in the county. Pharmaceutical specialty is collected in the NPI, however most pharmacists in Hamilton County did not designate a specialty in the data system.
Detailed Tables and Charts
Year Pharmacists
NPI 2013 397 Area Resource File 2009 1019 Area Resource File 2000 895
Count Pharmacists (NPI) 397 Specialty (where designated) Geriatric 4 Nuclear 1 Nutrition Support 3 Oncology 2 Pharmacist Clinician 25 Pharmacotherapy 24 Psychiatric 5
Source: NPI, Fall, 2013
12
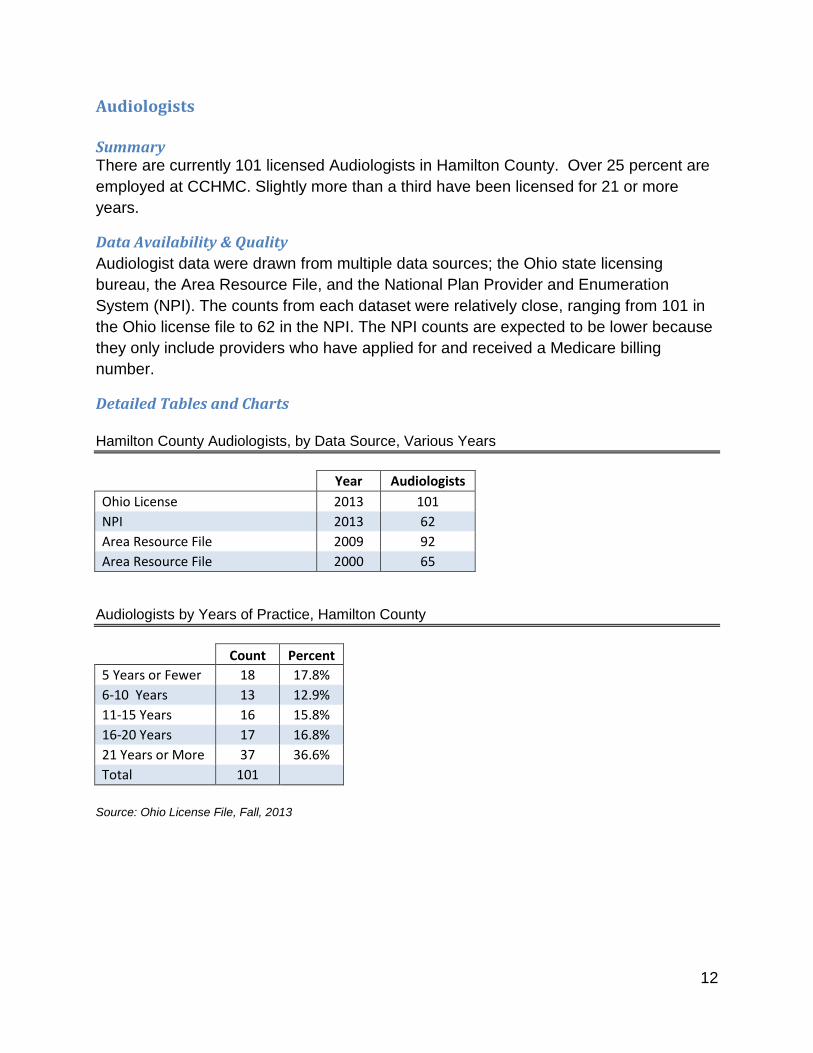
Audiologists Summary There are currently 101 licensed Audiologists in Hamilton County. Over 25 percent are employed at CCHMC. Slightly more than a third have been licensed for 21 or more years.
Data Availability & Quality Audiologist data were drawn from multiple data sources; the Ohio state licensing bureau, the Area Resource File, and the National Plan Provider and Enumeration System (NPI). The counts from each dataset were relatively close, ranging from 101 in the Ohio license file to 62 in the NPI. The NPI counts are expected to be lower because they only include providers who have applied for and received a Medicare billing number.
Detailed Tables and Charts Hamilton County Audiologists, by Data Source, Various Years
Year Audiologists Ohio License 2013 101 NPI 2013 62 Area Resource File 2009 92 Area Resource File 2000 65
Audiologists by Years of Practice, Hamilton County
Count Percent
5 Years or Fewer 18 17.8% 6-10 Years 13 12.9% 11-15 Years 16 15.8% 16-20 Years 17 16.8% 21 Years or More 37 36.6% Total 101
Source: Ohio License File, Fall, 2013
13
Physical Therapists
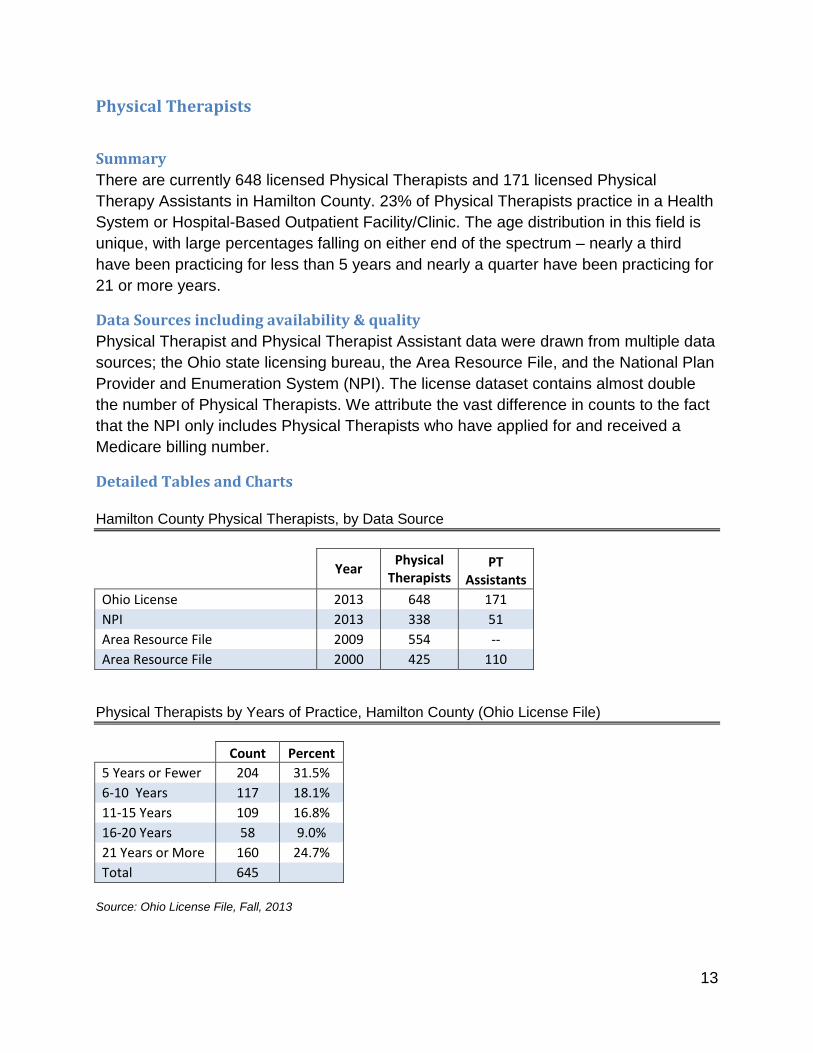
Summary There are currently 648 licensed Physical Therapists and 171 licensed Physical Therapy Assistants in Hamilton County. 23% of Physical Therapists practice in a Health System or Hospital-Based Outpatient Facility/Clinic. The age distribution in this field is unique, with large percentages falling on either end of the spectrum – nearly a third have been practicing for less than 5 years and nearly a quarter have been practicing for 21 or more years.
Data Sources including availability & quality Physical Therapist and Physical Therapist Assistant data were drawn from multiple data sources; the Ohio state licensing bureau, the Area Resource File, and the National Plan Provider and Enumeration System (NPI). The license dataset contains almost double the number of Physical Therapists. We attribute the vast difference in counts to the fact that the NPI only includes Physical Therapists who have applied for and received a Medicare billing number.
Detailed Tables and Charts Hamilton County Physical Therapists, by Data Source
Year Physical Therapists
PT Assistants
Ohio License 2013 648 171 NPI 2013 338 51 Area Resource File 2009 554 -- Area Resource File 2000 425 110
Physical Therapists by Years of Practice, Hamilton County (Ohio License File)
Count Percent
5 Years or Fewer 204 31.5% 6-10 Years 117 18.1% 11-15 Years 109 16.8% 16-20 Years 58 9.0% 21 Years or More 160 24.7% Total 645
Source: Ohio License File, Fall, 2013
14
Registered Dieticians
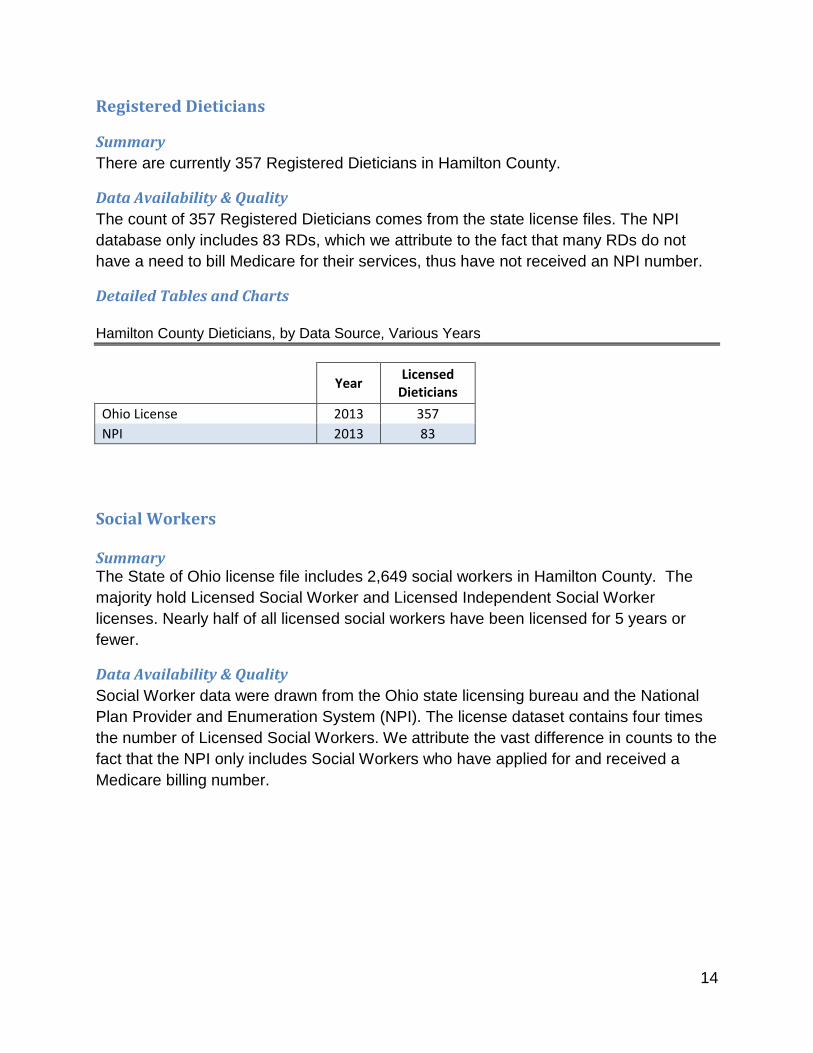
Summary There are currently 357 Registered Dieticians in Hamilton County.
Data Availability & Quality The count of 357 Registered Dieticians comes from the state license files. The NPI database only includes 83 RDs, which we attribute to the fact that many RDs do not have a need to bill Medicare for their services, thus have not received an NPI number.
Detailed Tables and Charts Hamilton County Dieticians, by Data Source, Various Years
Year Licensed Dieticians
Ohio License 2013 357 NPI 2013 83
Social Workers Summary The State of Ohio license file includes 2,649 social workers in Hamilton County. The majority hold Licensed Social Worker and Licensed Independent Social Worker licenses. Nearly half of all licensed social workers have been licensed for 5 years or fewer.
Data Availability & Quality Social Worker data were drawn from the Ohio state licensing bureau and the National Plan Provider and Enumeration System (NPI). The license dataset contains four times the number of Licensed Social Workers. We attribute the vast difference in counts to the fact that the NPI only includes Social Workers who have applied for and received a Medicare billing number.
15
Detailed Tables & Charts
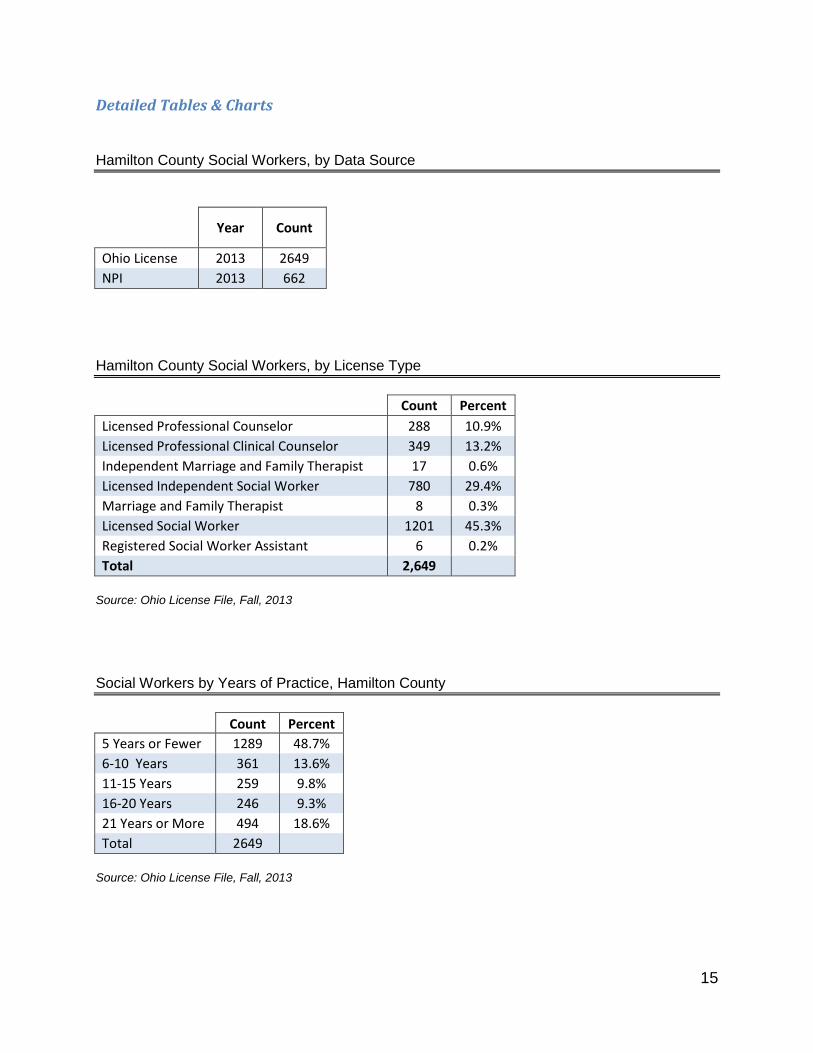
Hamilton County Social Workers, by Data Source
Year Count
Ohio License 2013 2649 NPI 2013 662
Hamilton County Social Workers, by License Type
Count Percent Licensed Professional Counselor 288 10.9% Licensed Professional Clinical Counselor 349 13.2% Independent Marriage and Family Therapist 17 0.6% Licensed Independent Social Worker 780 29.4% Marriage and Family Therapist 8 0.3% Licensed Social Worker 1201 45.3% Registered Social Worker Assistant 6 0.2% Total 2,649
Source: Ohio License File, Fall, 2013 Social Workers by Years of Practice, Hamilton County
Count Percent
5 Years or Fewer 1289 48.7% 6-10 Years 361 13.6% 11-15 Years 259 9.8% 16-20 Years 246 9.3% 21 Years or More 494 18.6% Total 2649
Source: Ohio License File, Fall, 2013
16
Speech-Language Pathologists
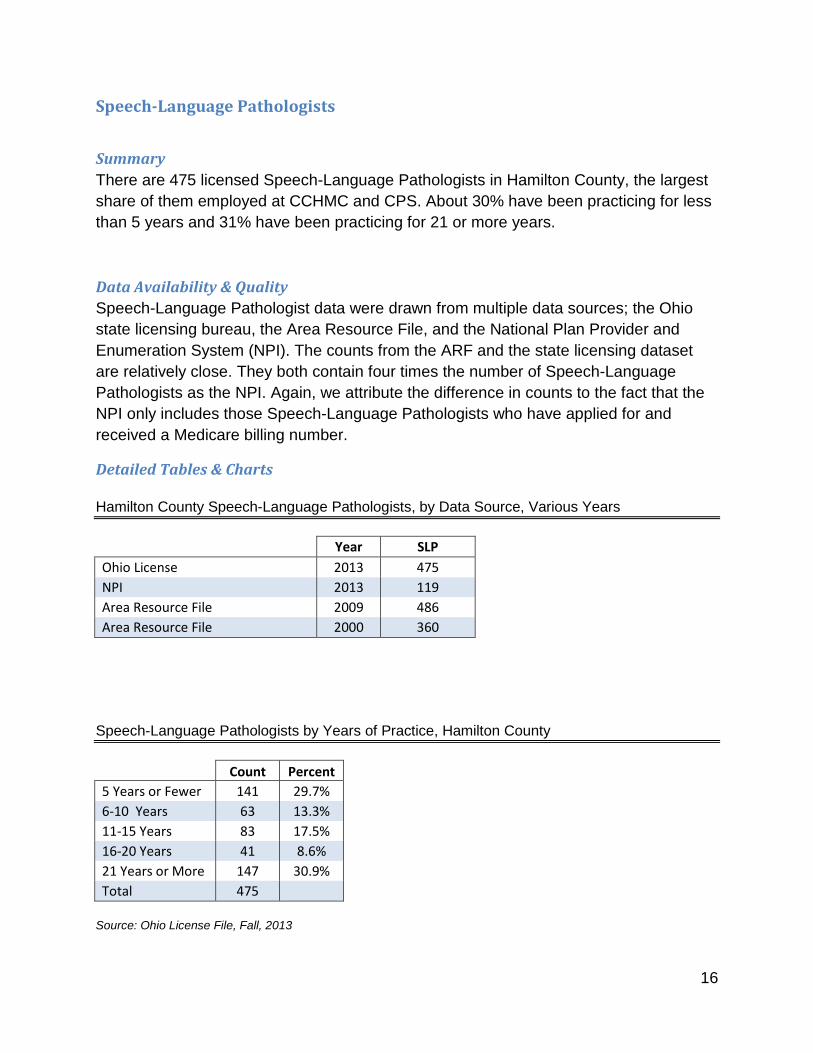
Summary There are 475 licensed Speech-Language Pathologists in Hamilton County, the largest share of them employed at CCHMC and CPS. About 30% have been practicing for less than 5 years and 31% have been practicing for 21 or more years.
Data Availability & Quality Speech-Language Pathologist data were drawn from multiple data sources; the Ohio state licensing bureau, the Area Resource File, and the National Plan Provider and Enumeration System (NPI). The counts from the ARF and the state licensing dataset are relatively close. They both contain four times the number of Speech-Language Pathologists as the NPI. Again, we attribute the difference in counts to the fact that the NPI only includes those Speech-Language Pathologists who have applied for and received a Medicare billing number.
Detailed Tables & Charts Hamilton County Speech-Language Pathologists, by Data Source, Various Years
Year SLP Ohio License 2013 475 NPI 2013 119 Area Resource File 2009 486 Area Resource File 2000 360
Speech-Language Pathologists by Years of Practice, Hamilton County
Count Percent
5 Years or Fewer 141 29.7% 6-10 Years 63 13.3% 11-15 Years 83 17.5% 16-20 Years 41 8.6% 21 Years or More 147 30.9% Total 475
Source: Ohio License File, Fall, 2013
17
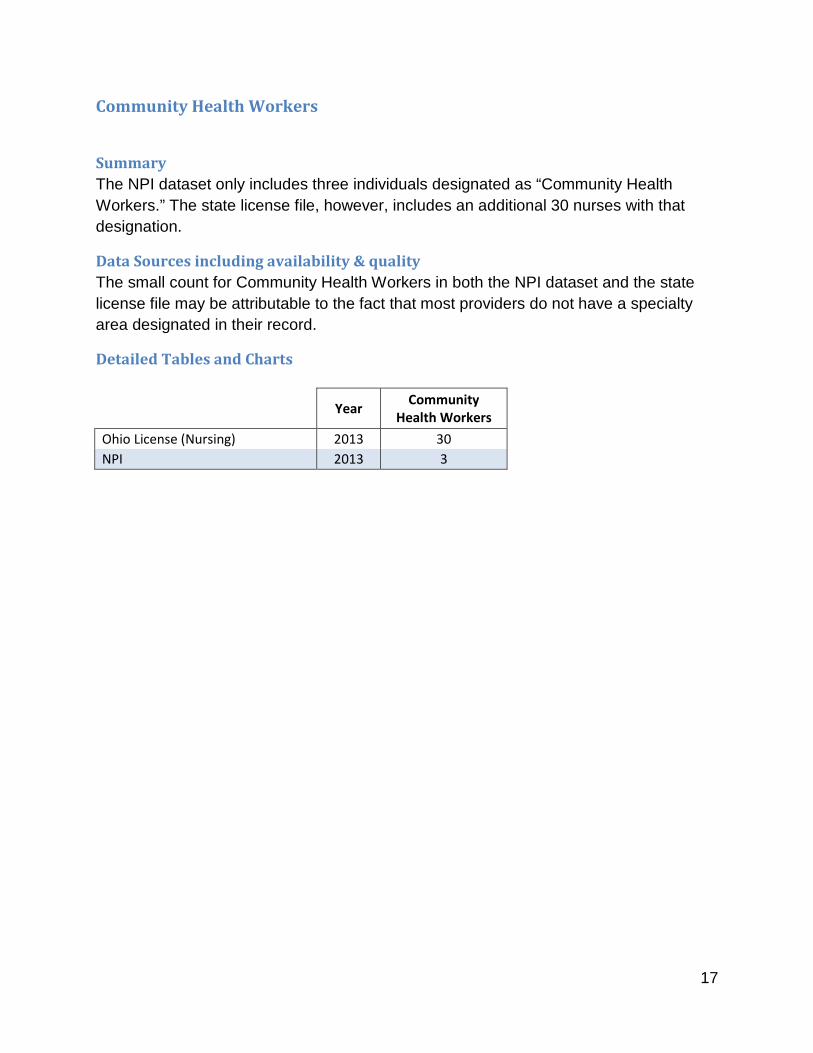
Community Health Workers
Summary The NPI dataset only includes three individuals designated as “Community Health Workers.” The state license file, however, includes an additional 30 nurses with that designation.
Data Sources including availability & quality The small count for Community Health Workers in both the NPI dataset and the state license file may be attributable to the fact that most providers do not have a specialty area designated in their record.
Detailed Tables and Charts
Year Community Health Workers
Ohio License (Nursing) 2013 30 NPI 2013 3
18
Community Profile
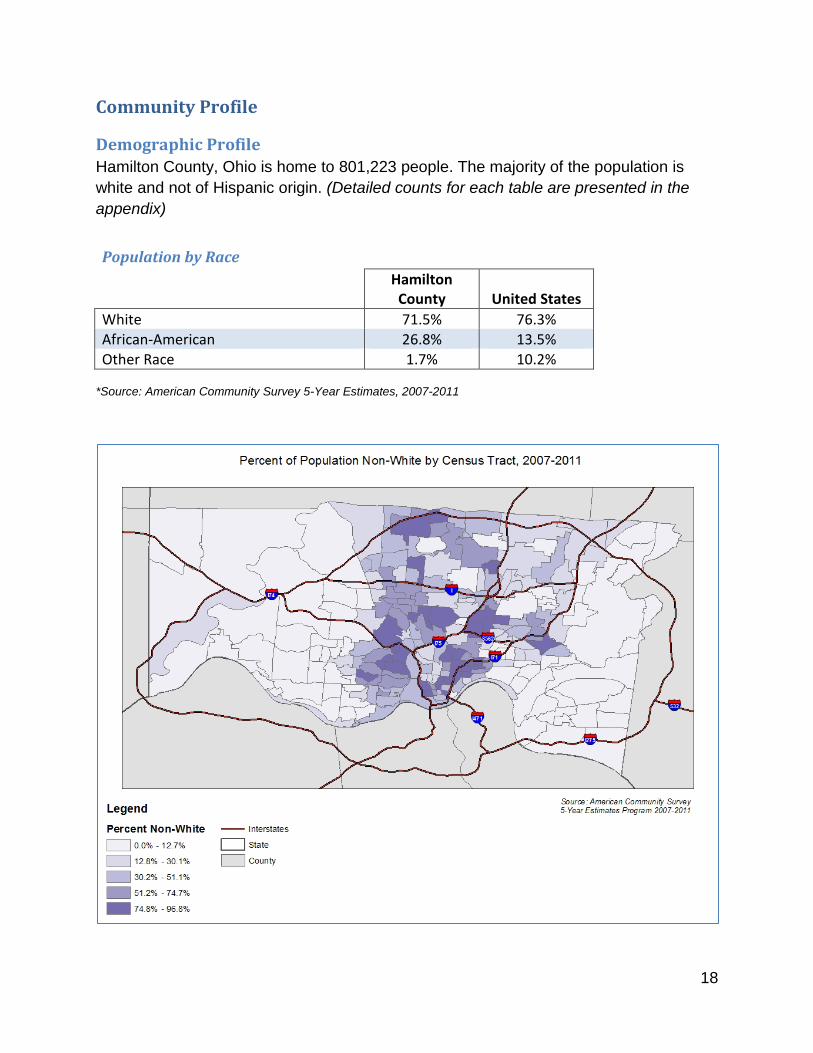
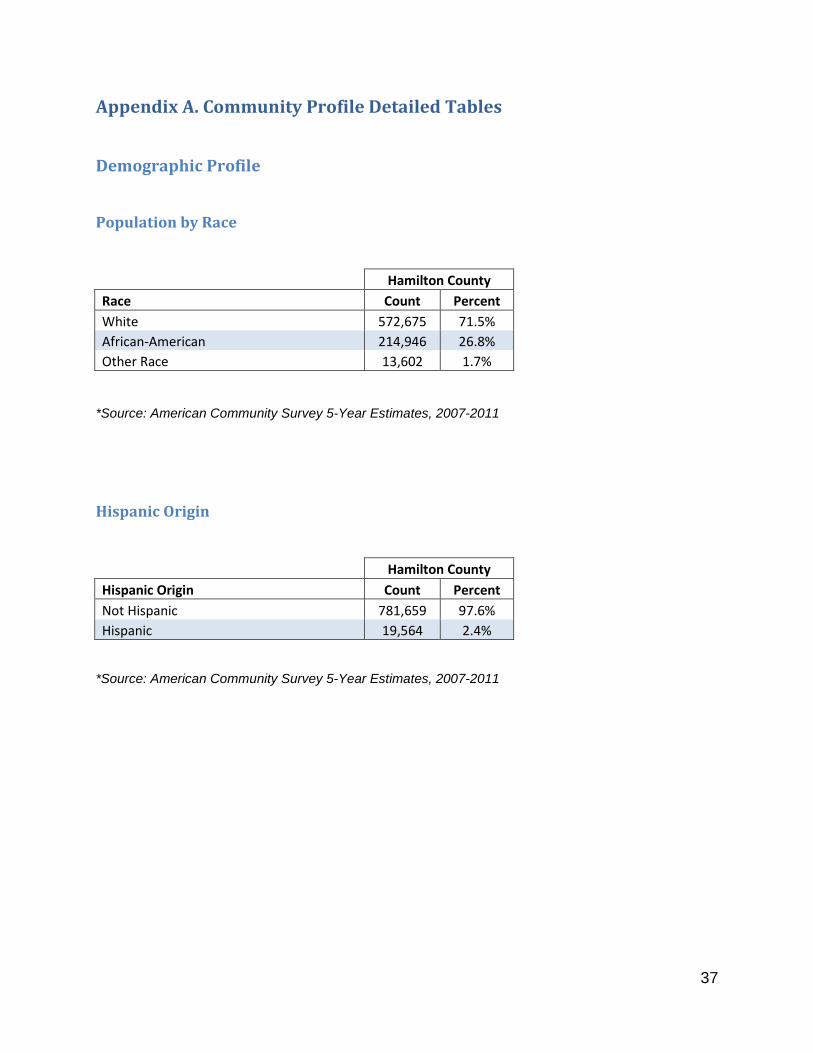
Demographic Profile Hamilton County, Ohio is home to 801,223 people. The majority of the population is white and not of Hispanic origin. (Detailed counts for each table are presented in the appendix)
Population by Race
Hamilton County United States
White 71.5% 76.3% African-American 26.8% 13.5% Other Race 1.7% 10.2%
*Source: American Community Survey 5-Year Estimates, 2007-2011
19
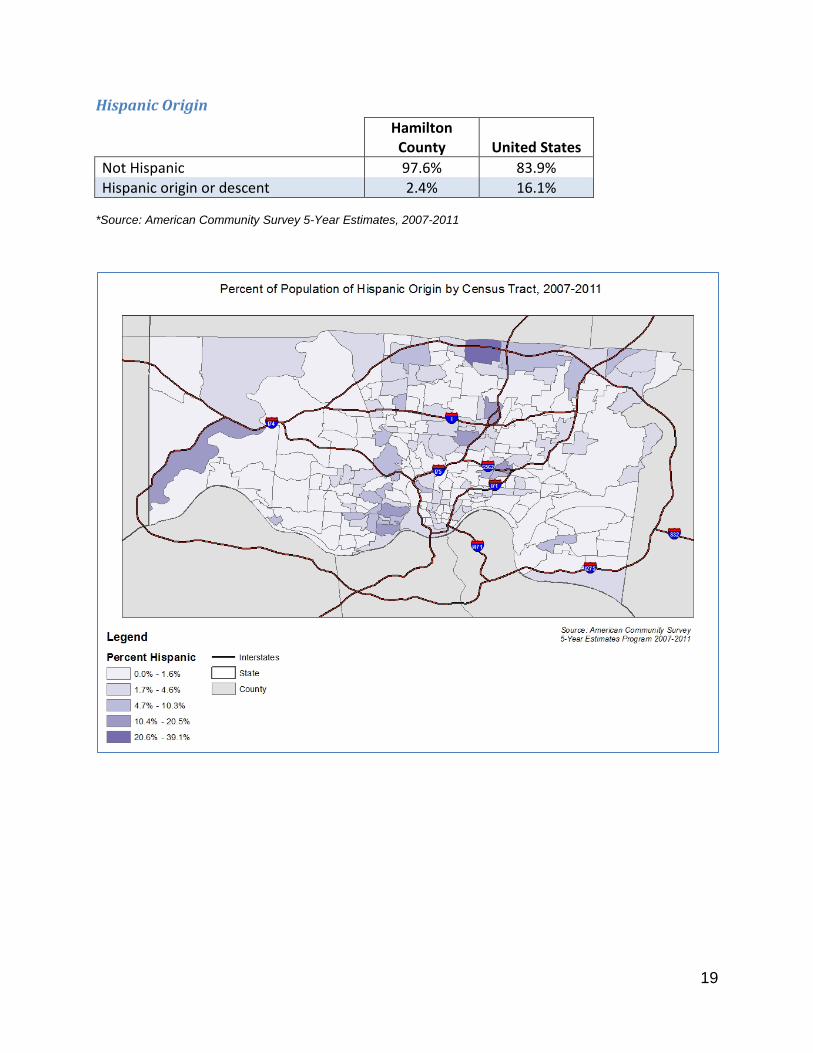
Hispanic Origin
Hamilton County United States
Not Hispanic 97.6% 83.9% Hispanic origin or descent 2.4% 16.1%
*Source: American Community Survey 5-Year Estimates, 2007-2011
20
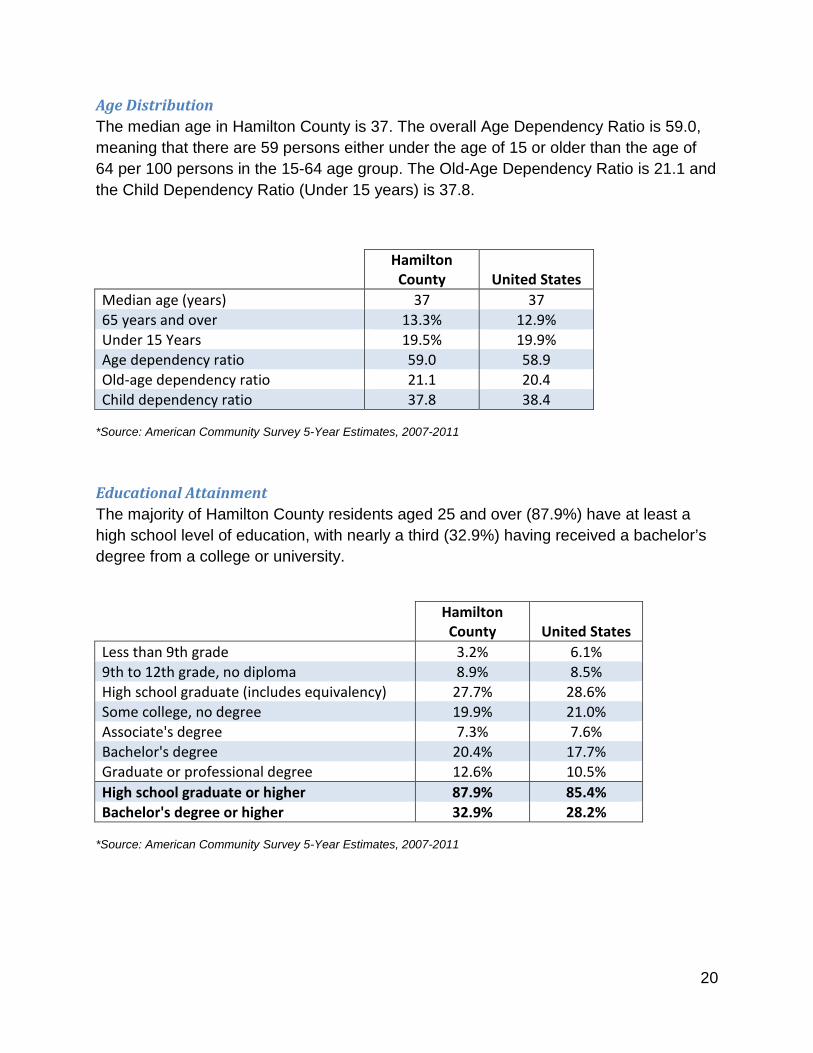
Age Distribution The median age in Hamilton County is 37. The overall Age Dependency Ratio is 59.0, meaning that there are 59 persons either under the age of 15 or older than the age of 64 per 100 persons in the 15-64 age group. The Old-Age Dependency Ratio is 21.1 and the Child Dependency Ratio (Under 15 years) is 37.8.
Hamilton County United States
Median age (years) 37 37 65 years and over 13.3% 12.9% Under 15 Years 19.5% 19.9% Age dependency ratio 59.0 58.9 Old-age dependency ratio 21.1 20.4 Child dependency ratio 37.8 38.4
*Source: American Community Survey 5-Year Estimates, 2007-2011
Educational Attainment
The majority of Hamilton County residents aged 25 and over (87.9%) have at least a high school level of education, with nearly a third (32.9%) having received a bachelor’s degree from a college or university.
Hamilton County United States
Less than 9th grade 3.2% 6.1% 9th to 12th grade, no diploma 8.9% 8.5% High school graduate (includes equivalency) 27.7% 28.6% Some college, no degree 19.9% 21.0% Associate's degree 7.3% 7.6% Bachelor's degree 20.4% 17.7% Graduate or professional degree 12.6% 10.5% High school graduate or higher 87.9% 85.4% Bachelor's degree or higher 32.9% 28.2%
*Source: American Community Survey 5-Year Estimates, 2007-2011
21
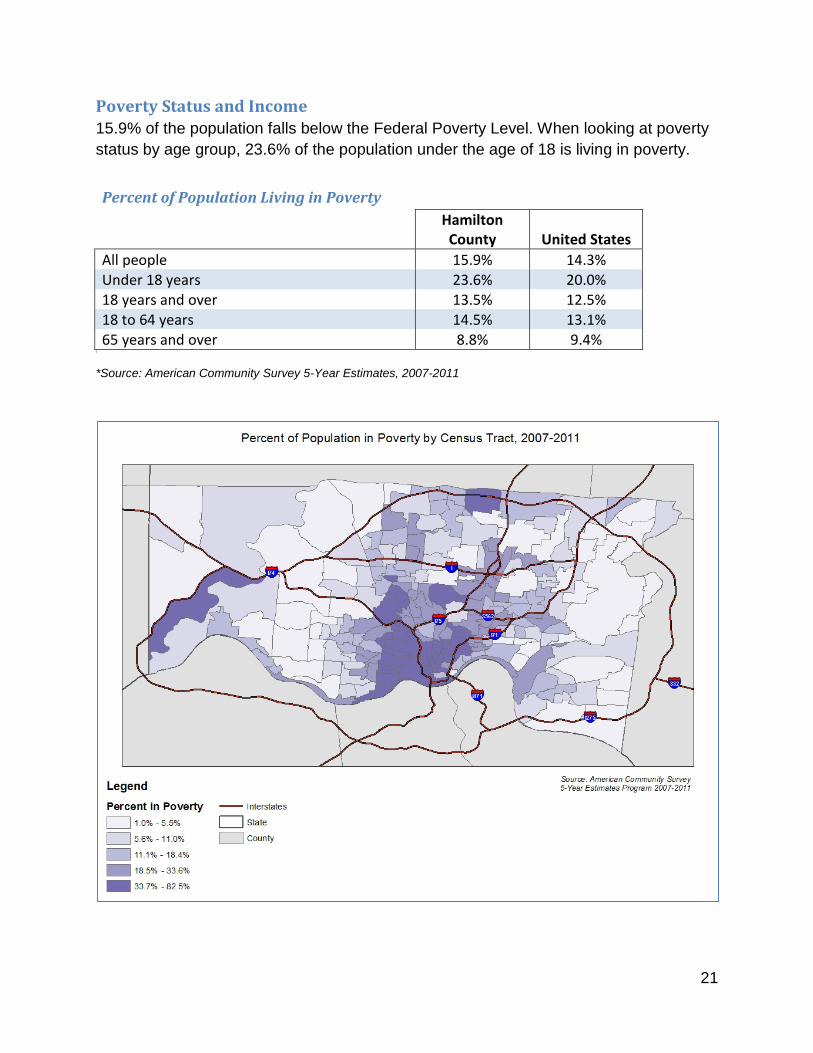
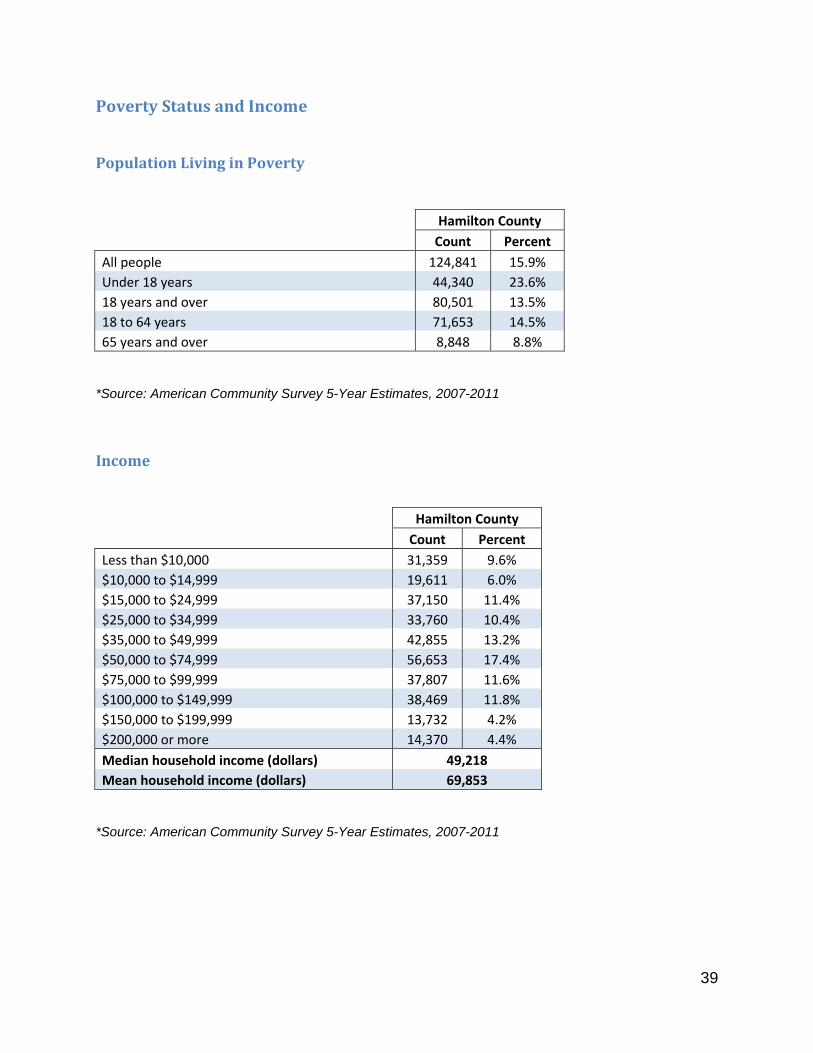
Poverty Status and Income 15.9% of the population falls below the Federal Poverty Level. When looking at poverty status by age group, 23.6% of the population under the age of 18 is living in poverty.
Percent of Population Living in Poverty
Hamilton County United States
All people 15.9% 14.3% Under 18 years 23.6% 20.0% 18 years and over 13.5% 12.5% 18 to 64 years 14.5% 13.1% 65 years and over 8.8% 9.4%
1
*Source: American Community Survey 5-Year Estimates, 2007-2011
22
Income
Hamilton County United States
Per Capita Income 29,197 27,915 Median Household Income 49,218 52,762
*Source: American Community Survey 5-Year Estimates, 2007-2011
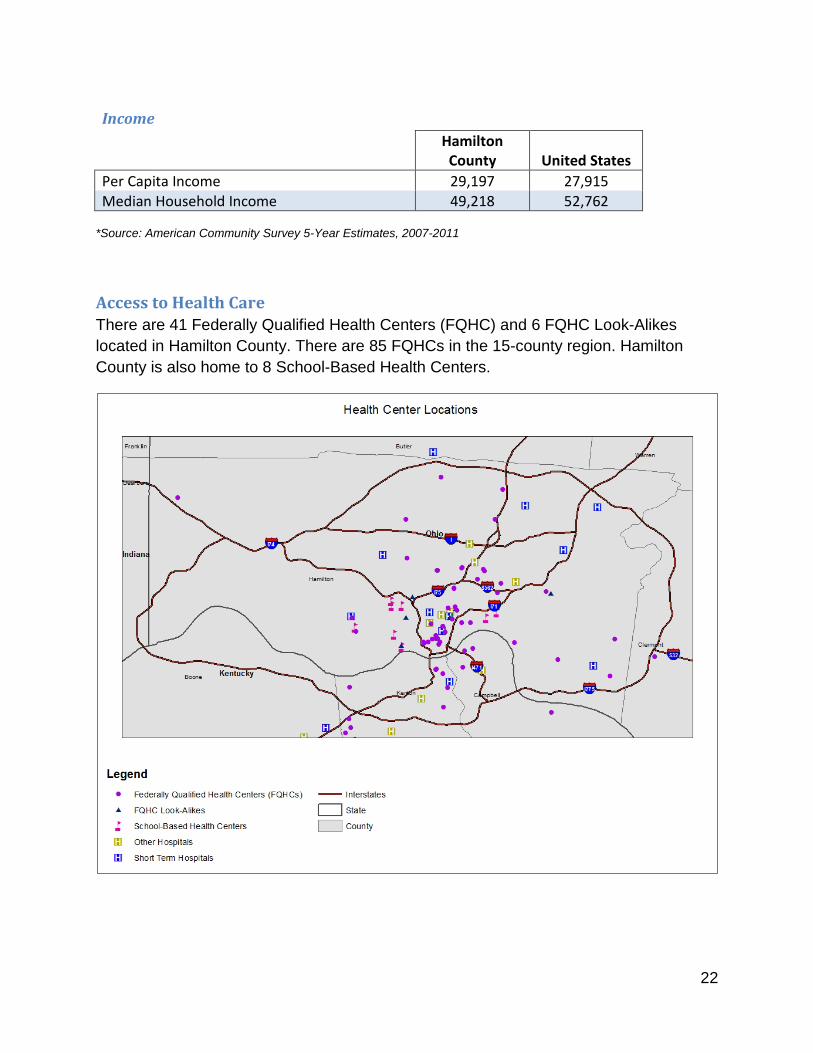
Access to Health Care There are 41 Federally Qualified Health Centers (FQHC) and 6 FQHC Look-Alikes located in Hamilton County. There are 85 FQHCs in the 15-county region. Hamilton County is also home to 8 School-Based Health Centers.
23
24
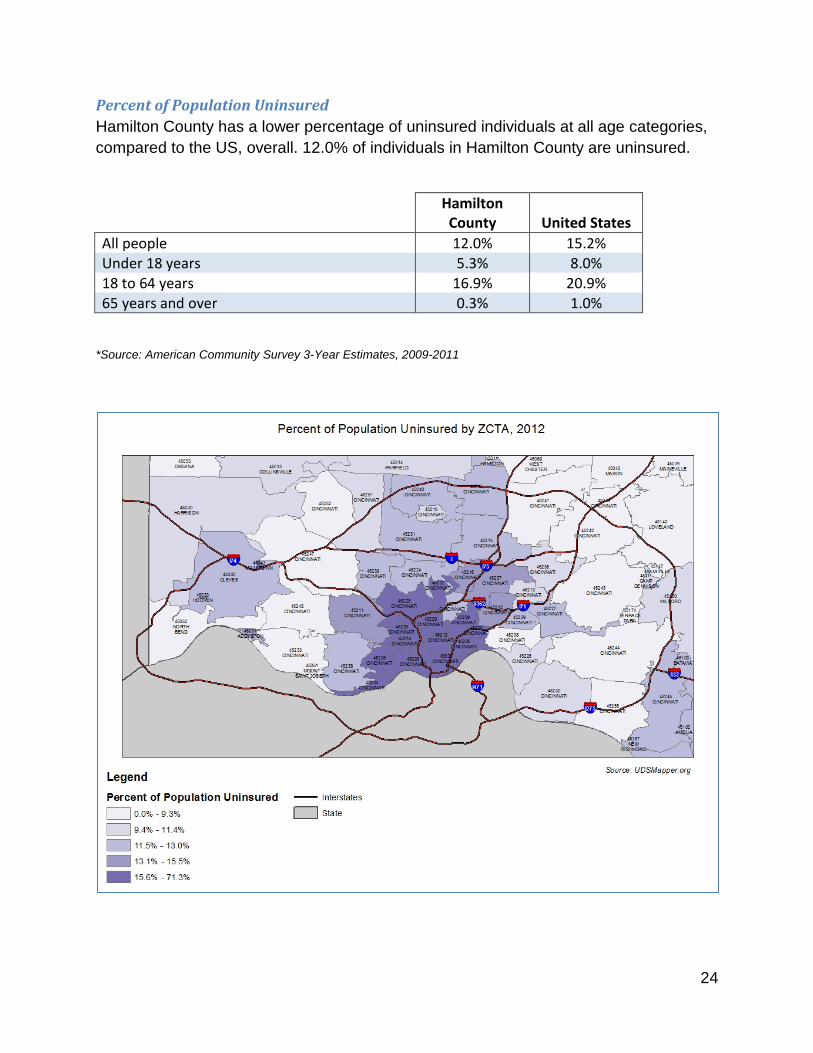
Percent of Population Uninsured Hamilton County has a lower percentage of uninsured individuals at all age categories, compared to the US, overall. 12.0% of individuals in Hamilton County are uninsured.
Hamilton County United States
All people 12.0% 15.2% Under 18 years 5.3% 8.0% 18 to 64 years 16.9% 20.9% 65 years and over 0.3% 1.0%
*Source: American Community Survey 3-Year Estimates, 2009-2011
25
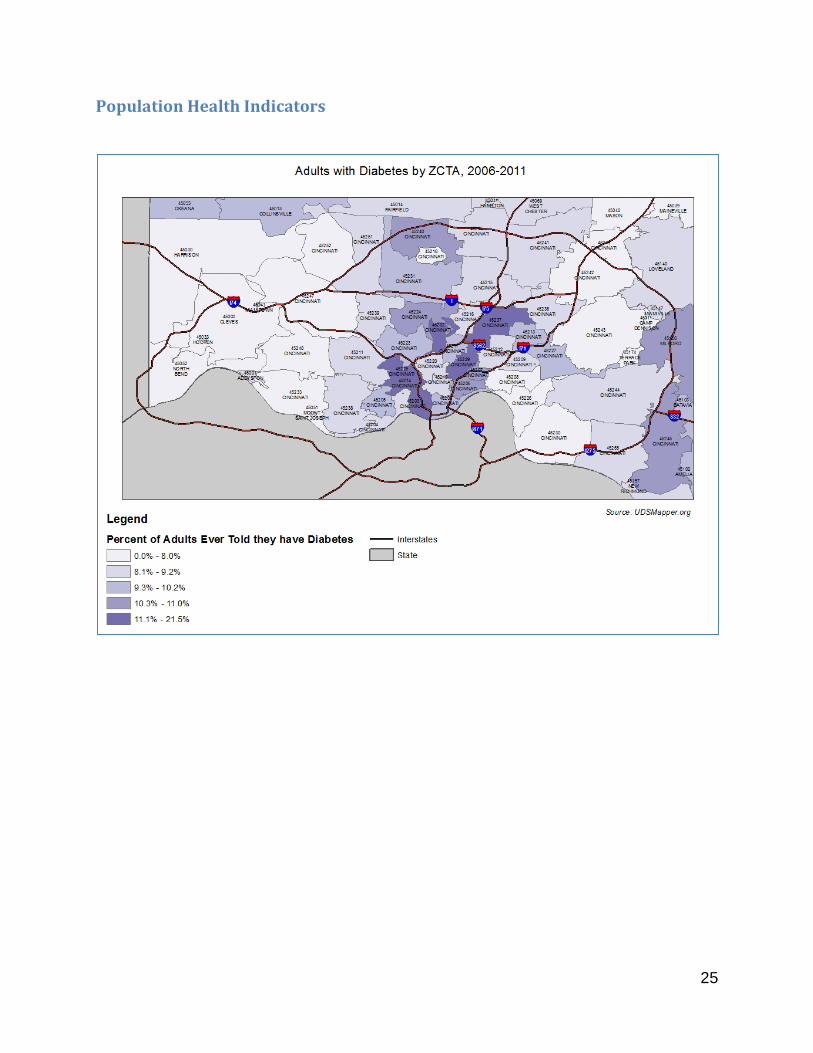
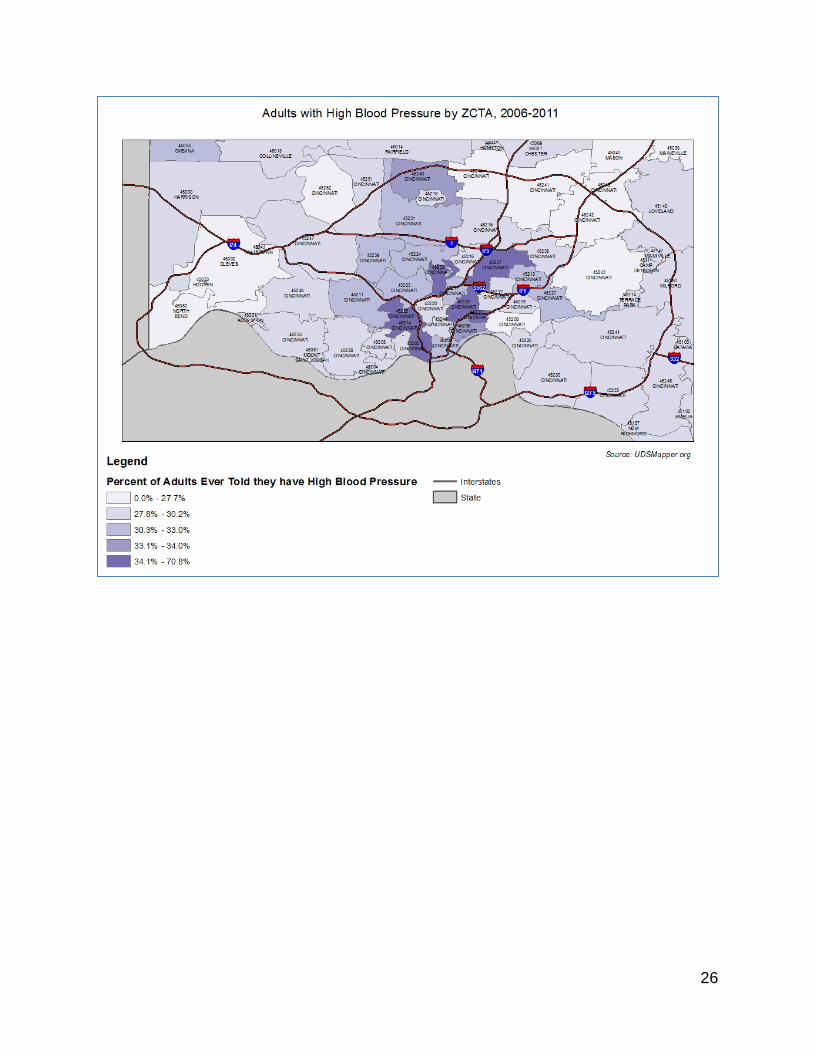
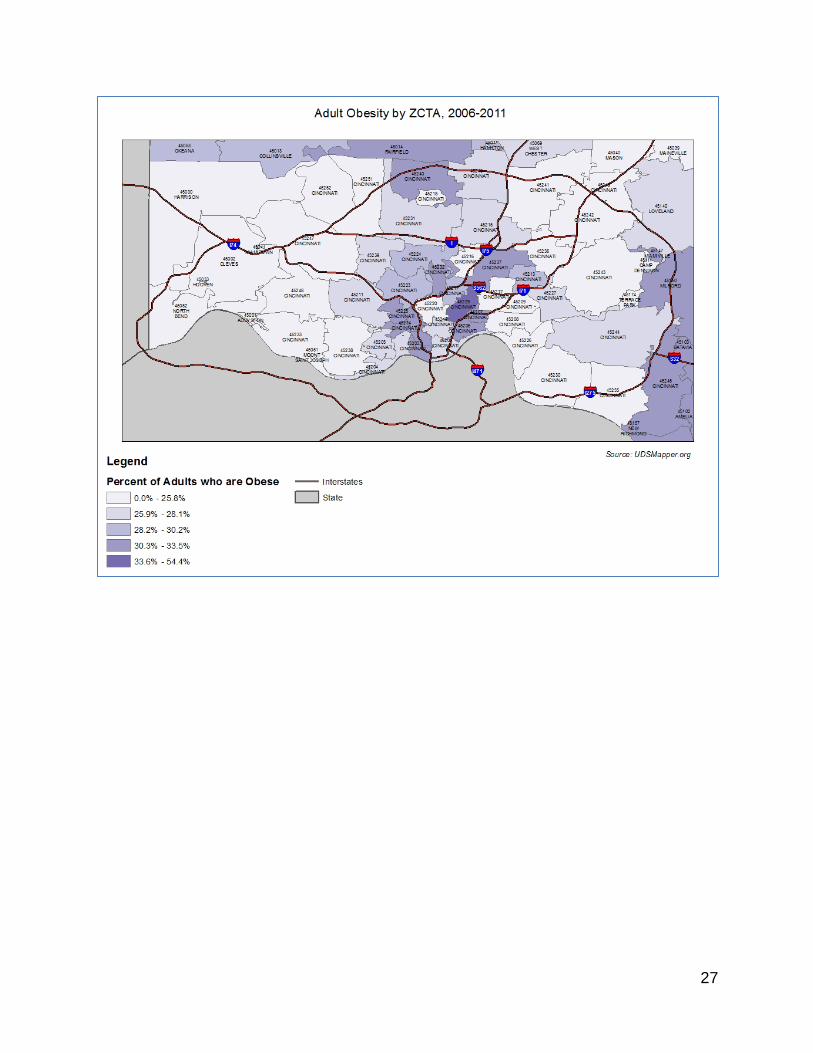
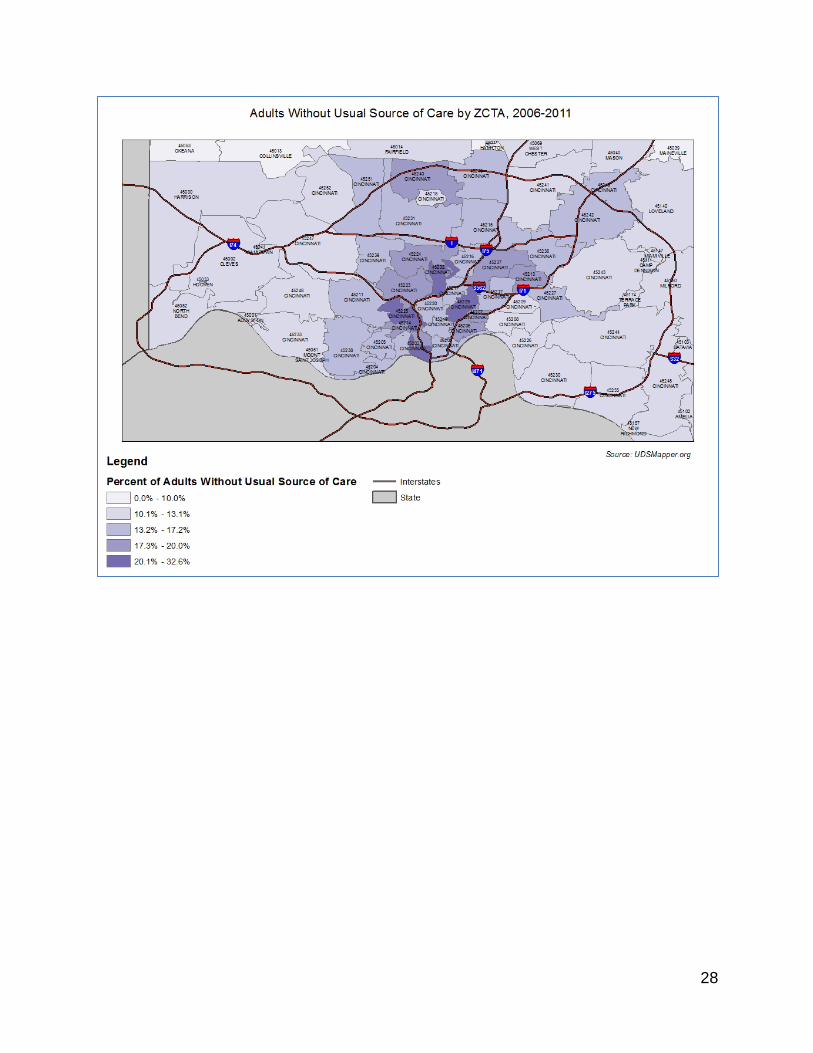
Population Health Indicators
26
27
28
29
30
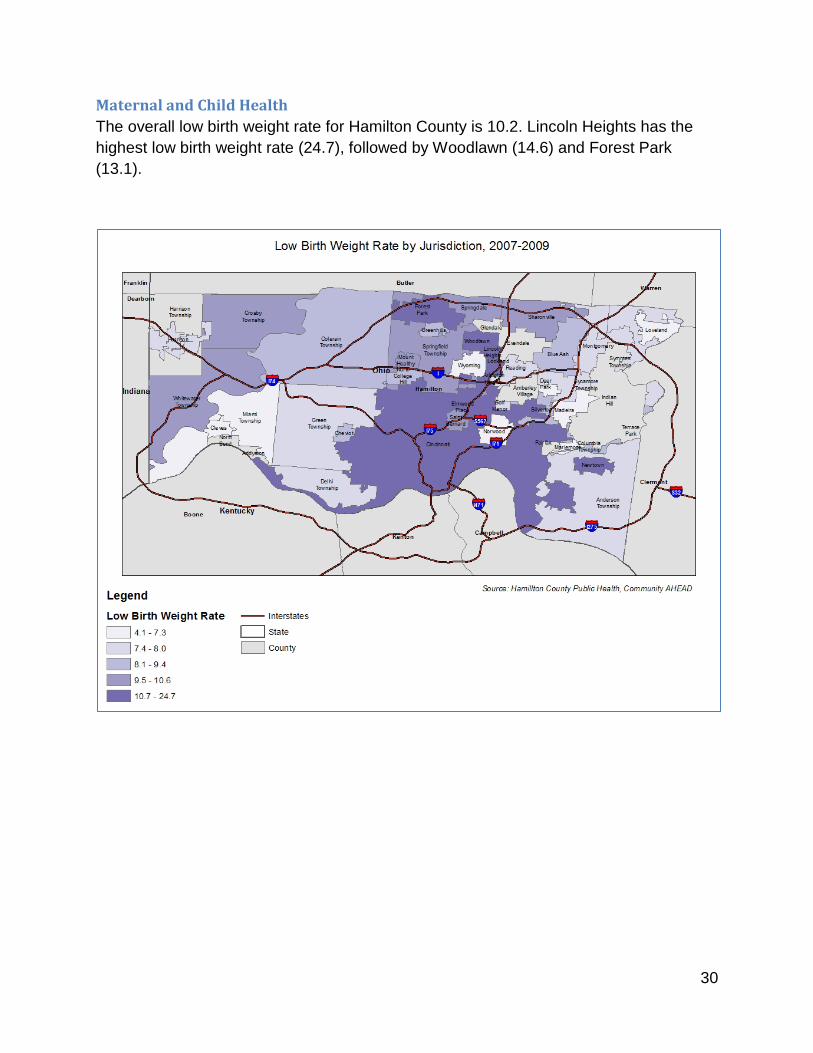
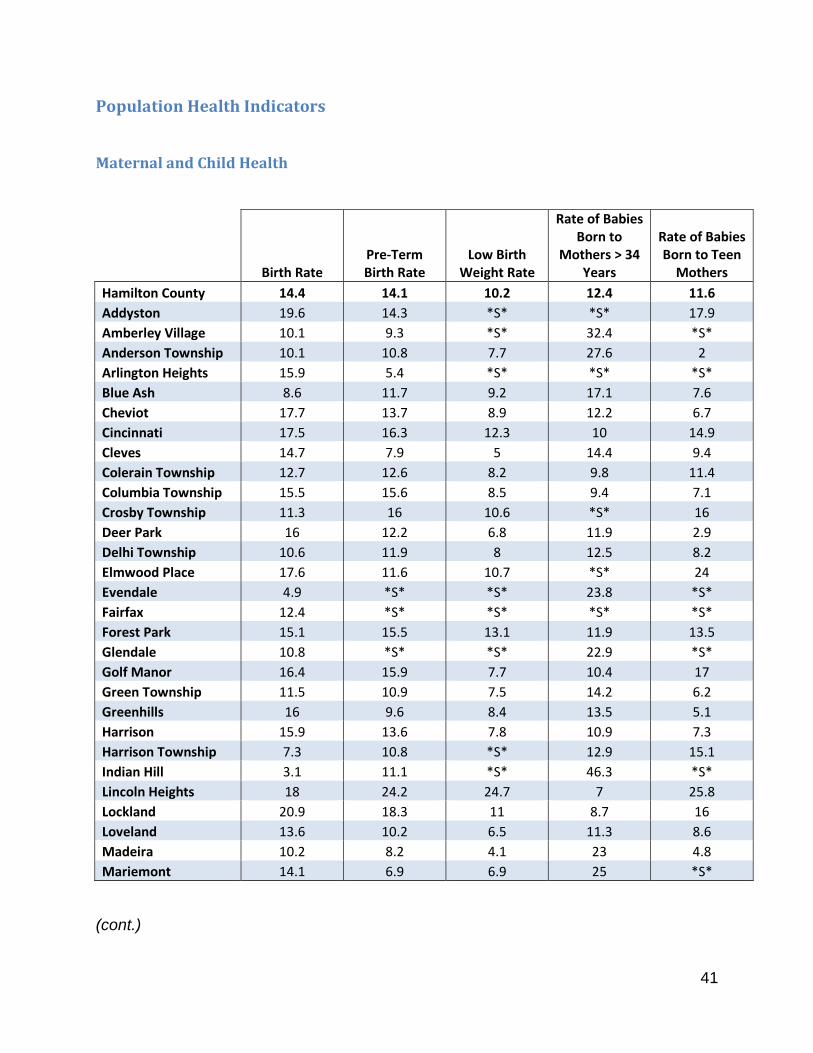
Maternal and Child Health The overall low birth weight rate for Hamilton County is 10.2. Lincoln Heights has the highest low birth weight rate (24.7), followed by Woodlawn (14.6) and Forest Park (13.1).
31
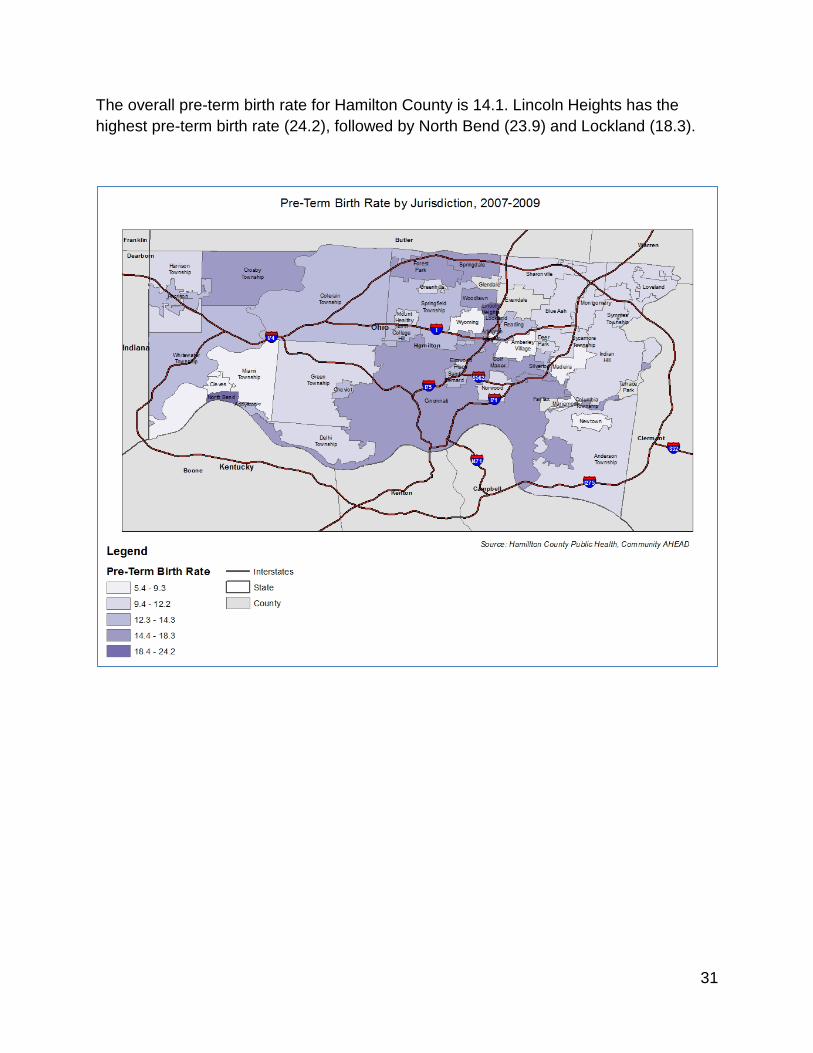
The overall pre-term birth rate for Hamilton County is 14.1. Lincoln Heights has the highest pre-term birth rate (24.2), followed by North Bend (23.9) and Lockland (18.3).
32
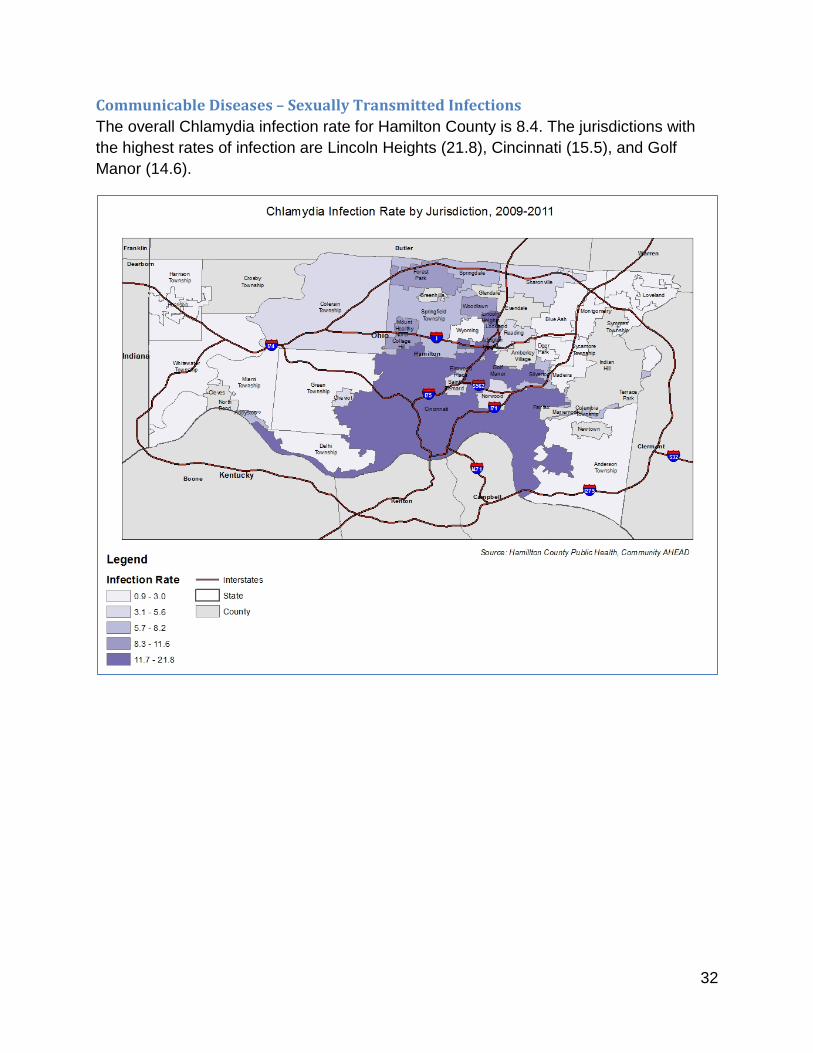
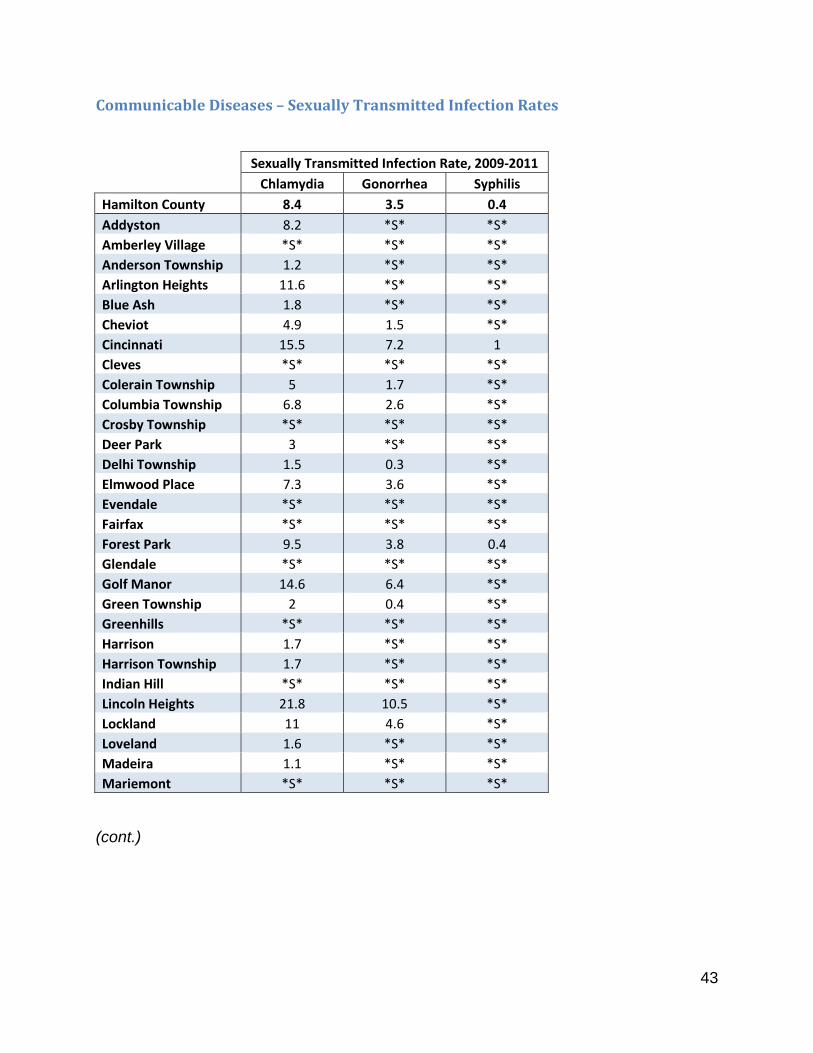
Communicable Diseases – Sexually Transmitted Infections The overall Chlamydia infection rate for Hamilton County is 8.4. The jurisdictions with the highest rates of infection are Lincoln Heights (21.8), Cincinnati (15.5), and Golf Manor (14.6).
33
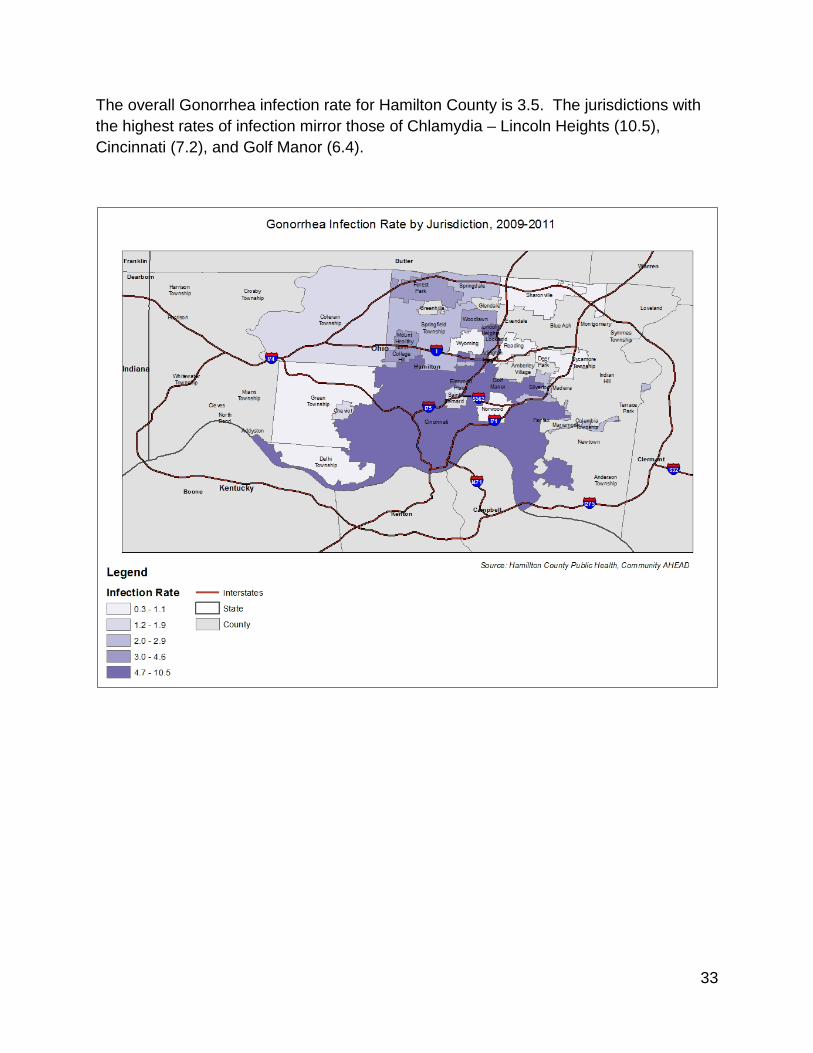
The overall Gonorrhea infection rate for Hamilton County is 3.5. The jurisdictions with the highest rates of infection mirror those of Chlamydia – Lincoln Heights (10.5), Cincinnati (7.2), and Golf Manor (6.4).
34
Mortality
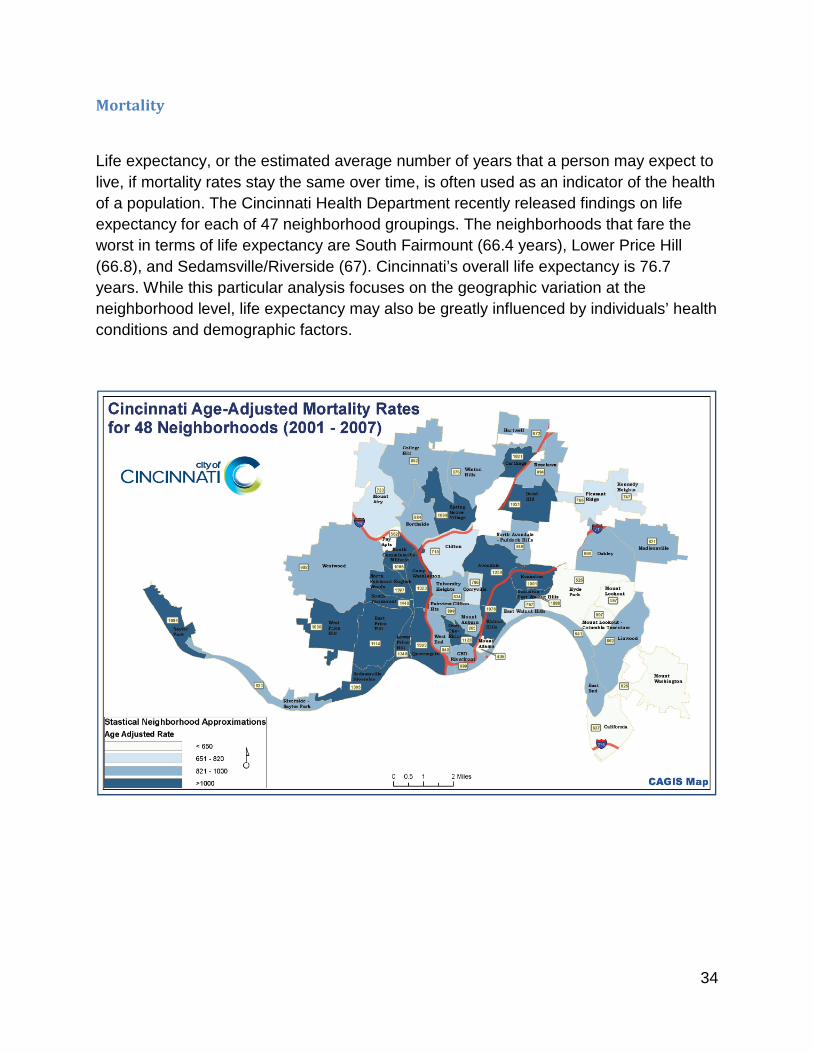
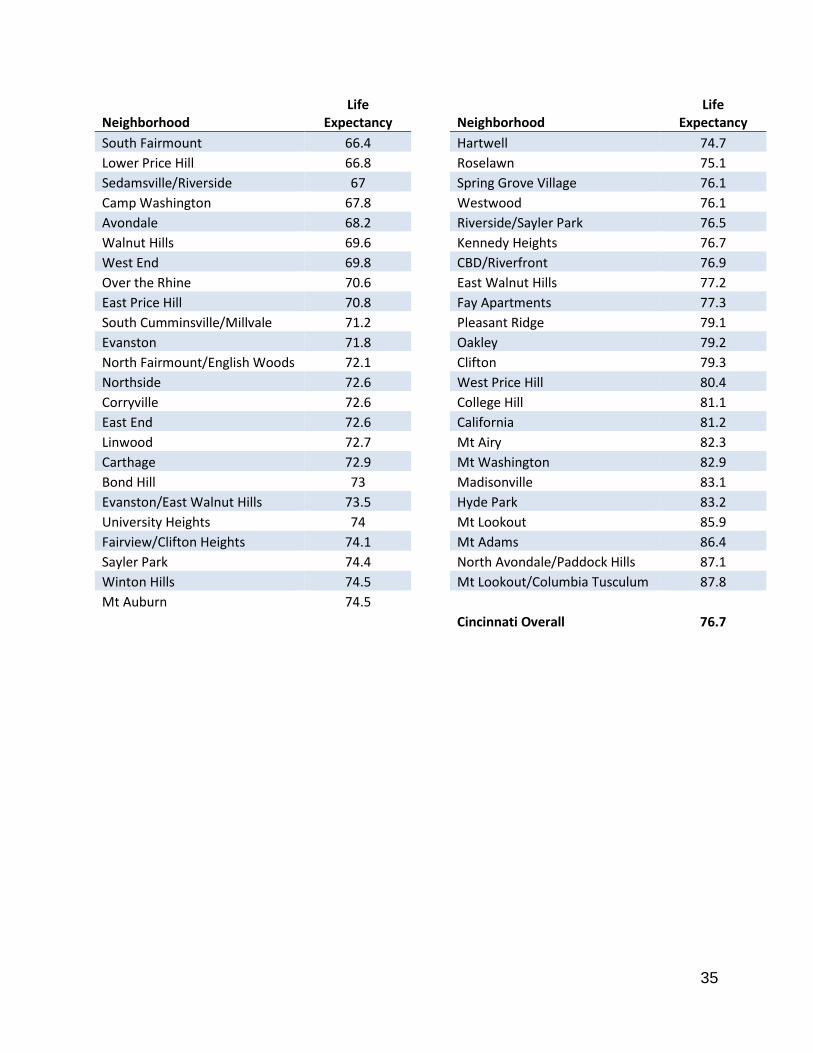
Life expectancy, or the estimated average number of years that a person may expect to live, if mortality rates stay the same over time, is often used as an indicator of the health of a population. The Cincinnati Health Department recently released findings on life expectancy for each of 47 neighborhood groupings. The neighborhoods that fare the worst in terms of life expectancy are South Fairmount (66.4 years), Lower Price Hill (66.8), and Sedamsville/Riverside (67). Cincinnati’s overall life expectancy is 76.7 years. While this particular analysis focuses on the geographic variation at the neighborhood level, life expectancy may also be greatly influenced by individuals’ health conditions and demographic factors.
35
Neighborhood Life
Expectancy
Neighborhood Life
Expectancy South Fairmount 66.4
Hartwell 74.7
Lower Price Hill 66.8
Roselawn 75.1 Sedamsville/Riverside 67
Spring Grove Village 76.1
Camp Washington 67.8
Westwood 76.1 Avondale 68.2
Riverside/Sayler Park 76.5
Walnut Hills 69.6
Kennedy Heights 76.7 West End 69.8
CBD/Riverfront 76.9
Over the Rhine 70.6
East Walnut Hills 77.2 East Price Hill 70.8
Fay Apartments 77.3
South Cumminsville/Millvale 71.2
Pleasant Ridge 79.1 Evanston 71.8
Oakley 79.2
North Fairmount/English Woods 72.1
Clifton 79.3 Northside 72.6
West Price Hill 80.4
Corryville 72.6
College Hill 81.1 East End 72.6
California 81.2
Linwood 72.7
Mt Airy 82.3 Carthage 72.9
Mt Washington 82.9
Bond Hill 73
Madisonville 83.1 Evanston/East Walnut Hills 73.5
Hyde Park 83.2
University Heights 74
Mt Lookout 85.9 Fairview/Clifton Heights 74.1
Mt Adams 86.4
Sayler Park 74.4
North Avondale/Paddock Hills 87.1 Winton Hills 74.5
Mt Lookout/Columbia Tusculum 87.8
Mt Auburn 74.5
Cincinnati Overall 76.7
36
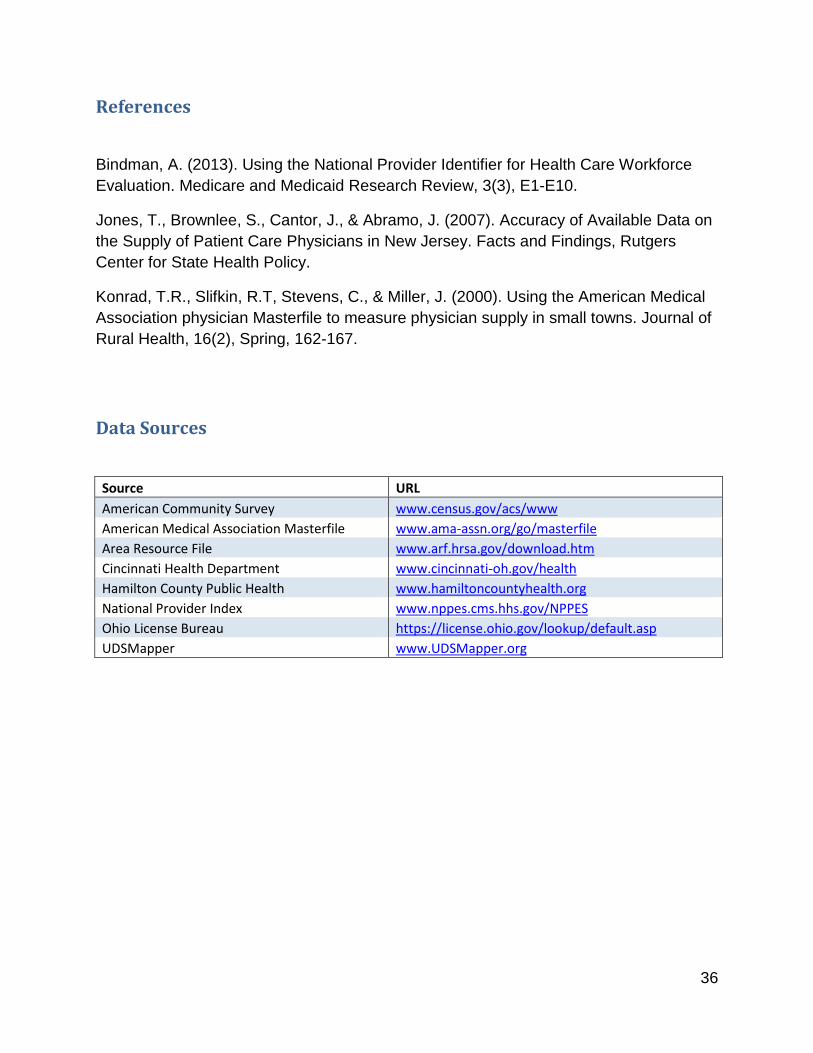
References
Bindman, A. (2013). Using the National Provider Identifier for Health Care Workforce Evaluation. Medicare and Medicaid Research Review, 3(3), E1-E10.
Jones, T., Brownlee, S., Cantor, J., & Abramo, J. (2007). Accuracy of Available Data on the Supply of Patient Care Physicians in New Jersey. Facts and Findings, Rutgers Center for State Health Policy.
Konrad, T.R., Slifkin, R.T, Stevens, C., & Miller, J. (2000). Using the American Medical Association physician Masterfile to measure physician supply in small towns. Journal of Rural Health, 16(2), Spring, 162-167.
Data Sources
Source URL American Community Survey www.census.gov/acs/www American Medical Association Masterfile www.ama-assn.org/go/masterfile Area Resource File www.arf.hrsa.gov/download.htm Cincinnati Health Department www.cincinnati-oh.gov/health Hamilton County Public Health www.hamiltoncountyhealth.org National Provider Index www.nppes.cms.hhs.gov/NPPES Ohio License Bureau https://license.ohio.gov/lookup/default.asp UDSMapper www.UDSMapper.org
37
Appendix A. Community Profile Detailed Tables
Demographic Profile
Population by Race
Hamilton County
Race Count Percent White 572,675 71.5% African-American 214,946 26.8% Other Race 13,602 1.7%
*Source: American Community Survey 5-Year Estimates, 2007-2011
Hispanic Origin
Hamilton County
Hispanic Origin Count Percent Not Hispanic 781,659 97.6% Hispanic 19,564 2.4%
*Source: American Community Survey 5-Year Estimates, 2007-2011

38
Age Distribution
Hamilton County
Count Percent
Under 5 years 52,987 6.6% 5 to 9 years 51,547 6.4% 10 to 14 years 51,883 6.5% 15 to 19 years 58,629 7.3% 20 to 24 years 58,604 7.3% 25 to 34 years 107,576 13.4% 35 to 44 years 100,351 12.5% 45 to 54 years 120,084 15.0% 55 to 59 years 52,358 6.5% 60 to 64 years 40,617 5.1% 65 to 74 years 52,704 6.6% 75 to 84 years 36,962 4.6% 85 years and over 16,921 2.1%
*Source: American Community Survey 5-Year Estimates, 2007-2011
Educational Attainment
Hamilton County
Count Percent Population 25 years and over 527,573 -- Less than 9th grade 16,998 3.2% 9th to 12th grade, no diploma 46,992 8.9% High school graduate (includes equivalency) 146,178 27.7% Some college, no degree 104,843 19.9% Associate's degree 38,753 7.3% Bachelor's degree 107,541 20.4% Graduate or professional degree 66,268 12.6% Percent high school graduate or higher 463,583 87.9% Percent bachelor's degree or higher 173,809 32.9%
*Source: American Community Survey 5-Year Estimates, 2007-2011
39
Poverty Status and Income
Population Living in Poverty
Hamilton County
Count Percent
All people 124,841 15.9% Under 18 years 44,340 23.6% 18 years and over 80,501 13.5% 18 to 64 years 71,653 14.5% 65 years and over 8,848 8.8%
*Source: American Community Survey 5-Year Estimates, 2007-2011
Income
Hamilton County
Count Percent
Less than $10,000 31,359 9.6% $10,000 to $14,999 19,611 6.0% $15,000 to $24,999 37,150 11.4% $25,000 to $34,999 33,760 10.4% $35,000 to $49,999 42,855 13.2% $50,000 to $74,999 56,653 17.4% $75,000 to $99,999 37,807 11.6% $100,000 to $149,999 38,469 11.8% $150,000 to $199,999 13,732 4.2% $200,000 or more 14,370 4.4% Median household income (dollars) 49,218 Mean household income (dollars) 69,853
*Source: American Community Survey 5-Year Estimates, 2007-2011

40
Access to Health Care
Percent of Population Uninsured
Hamilton County
Count Percent Total civilian noninstitutionalized population 94,766 12.0% Under 18 years 9,929 5.3% 18 to 64 years 84,555 16.9% 65 years and older 282 0.3%
*Source: American Community Survey 3-Year Estimates, 2009-2011
41
Population Health Indicators
Maternal and Child Health
Birth Rate
Pre-Term Birth Rate
Low Birth Weight Rate
Rate of Babies Born to
Mothers > 34 Years
Rate of Babies Born to Teen
Mothers Hamilton County 14.4 14.1 10.2 12.4 11.6 Addyston 19.6 14.3 *S* *S* 17.9 Amberley Village 10.1 9.3 *S* 32.4 *S* Anderson Township 10.1 10.8 7.7 27.6 2 Arlington Heights 15.9 5.4 *S* *S* *S* Blue Ash 8.6 11.7 9.2 17.1 7.6 Cheviot 17.7 13.7 8.9 12.2 6.7 Cincinnati 17.5 16.3 12.3 10 14.9 Cleves 14.7 7.9 5 14.4 9.4 Colerain Township 12.7 12.6 8.2 9.8 11.4 Columbia Township 15.5 15.6 8.5 9.4 7.1 Crosby Township 11.3 16 10.6 *S* 16 Deer Park 16 12.2 6.8 11.9 2.9 Delhi Township 10.6 11.9 8 12.5 8.2 Elmwood Place 17.6 11.6 10.7 *S* 24 Evendale 4.9 *S* *S* 23.8 *S* Fairfax 12.4 *S* *S* *S* *S* Forest Park 15.1 15.5 13.1 11.9 13.5 Glendale 10.8 *S* *S* 22.9 *S* Golf Manor 16.4 15.9 7.7 10.4 17 Green Township 11.5 10.9 7.5 14.2 6.2 Greenhills 16 9.6 8.4 13.5 5.1 Harrison 15.9 13.6 7.8 10.9 7.3 Harrison Township 7.3 10.8 *S* 12.9 15.1 Indian Hill 3.1 11.1 *S* 46.3 *S* Lincoln Heights 18 24.2 24.7 7 25.8 Lockland 20.9 18.3 11 8.7 16 Loveland 13.6 10.2 6.5 11.3 8.6 Madeira 10.2 8.2 4.1 23 4.8 Mariemont 14.1 6.9 6.9 25 *S*
(cont.)
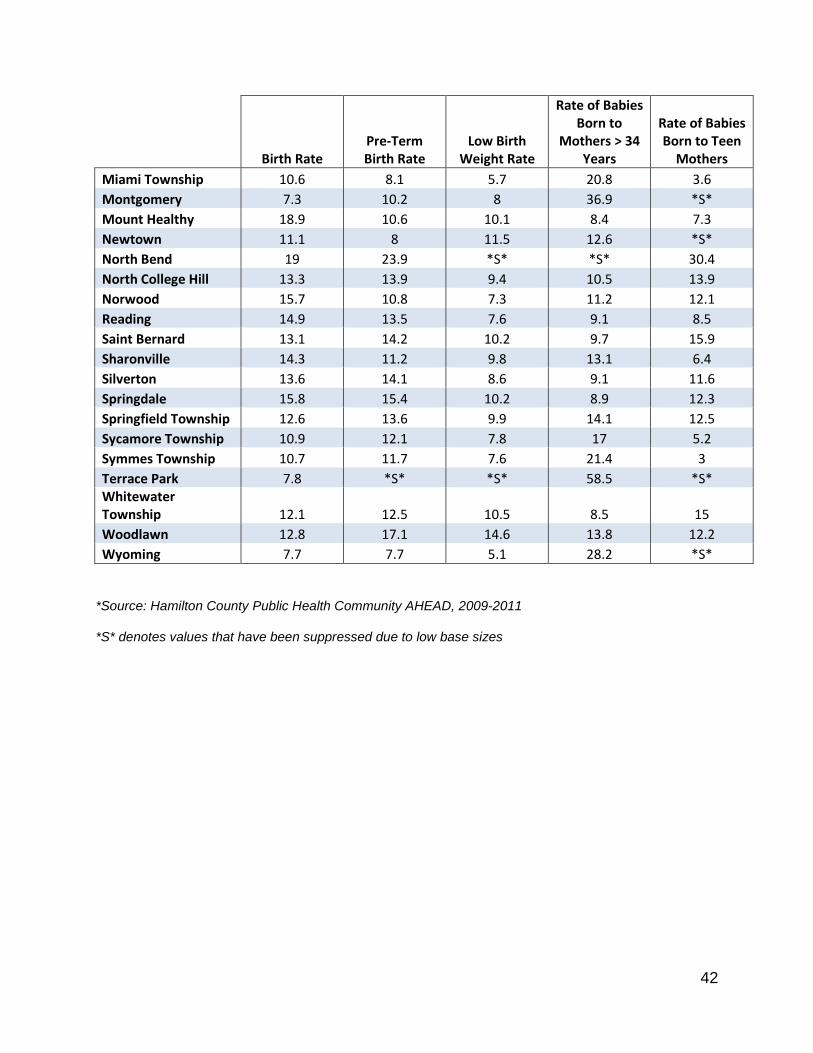
42
Birth Rate
Pre-Term Birth Rate
Low Birth Weight Rate
Rate of Babies Born to
Mothers > 34 Years
Rate of Babies Born to Teen
Mothers Miami Township 10.6 8.1 5.7 20.8 3.6 Montgomery 7.3 10.2 8 36.9 *S* Mount Healthy 18.9 10.6 10.1 8.4 7.3 Newtown 11.1 8 11.5 12.6 *S* North Bend 19 23.9 *S* *S* 30.4 North College Hill 13.3 13.9 9.4 10.5 13.9 Norwood 15.7 10.8 7.3 11.2 12.1 Reading 14.9 13.5 7.6 9.1 8.5 Saint Bernard 13.1 14.2 10.2 9.7 15.9 Sharonville 14.3 11.2 9.8 13.1 6.4 Silverton 13.6 14.1 8.6 9.1 11.6 Springdale 15.8 15.4 10.2 8.9 12.3 Springfield Township 12.6 13.6 9.9 14.1 12.5 Sycamore Township 10.9 12.1 7.8 17 5.2 Symmes Township 10.7 11.7 7.6 21.4 3 Terrace Park 7.8 *S* *S* 58.5 *S* Whitewater Township 12.1 12.5 10.5 8.5 15 Woodlawn 12.8 17.1 14.6 13.8 12.2 Wyoming 7.7 7.7 5.1 28.2 *S*
*Source: Hamilton County Public Health Community AHEAD, 2009-2011
*S* denotes values that have been suppressed due to low base sizes
43
Communicable Diseases – Sexually Transmitted Infection Rates
Sexually Transmitted Infection Rate, 2009-2011
Chlamydia Gonorrhea Syphilis
Hamilton County 8.4 3.5 0.4 Addyston 8.2 *S* *S* Amberley Village *S* *S* *S* Anderson Township 1.2 *S* *S* Arlington Heights 11.6 *S* *S* Blue Ash 1.8 *S* *S* Cheviot 4.9 1.5 *S* Cincinnati 15.5 7.2 1 Cleves *S* *S* *S* Colerain Township 5 1.7 *S* Columbia Township 6.8 2.6 *S* Crosby Township *S* *S* *S* Deer Park 3 *S* *S* Delhi Township 1.5 0.3 *S* Elmwood Place 7.3 3.6 *S* Evendale *S* *S* *S* Fairfax *S* *S* *S* Forest Park 9.5 3.8 0.4 Glendale *S* *S* *S* Golf Manor 14.6 6.4 *S* Green Township 2 0.4 *S* Greenhills *S* *S* *S* Harrison 1.7 *S* *S* Harrison Township 1.7 *S* *S* Indian Hill *S* *S* *S* Lincoln Heights 21.8 10.5 *S* Lockland 11 4.6 *S* Loveland 1.6 *S* *S* Madeira 1.1 *S* *S* Mariemont *S* *S* *S*
(cont.)
44
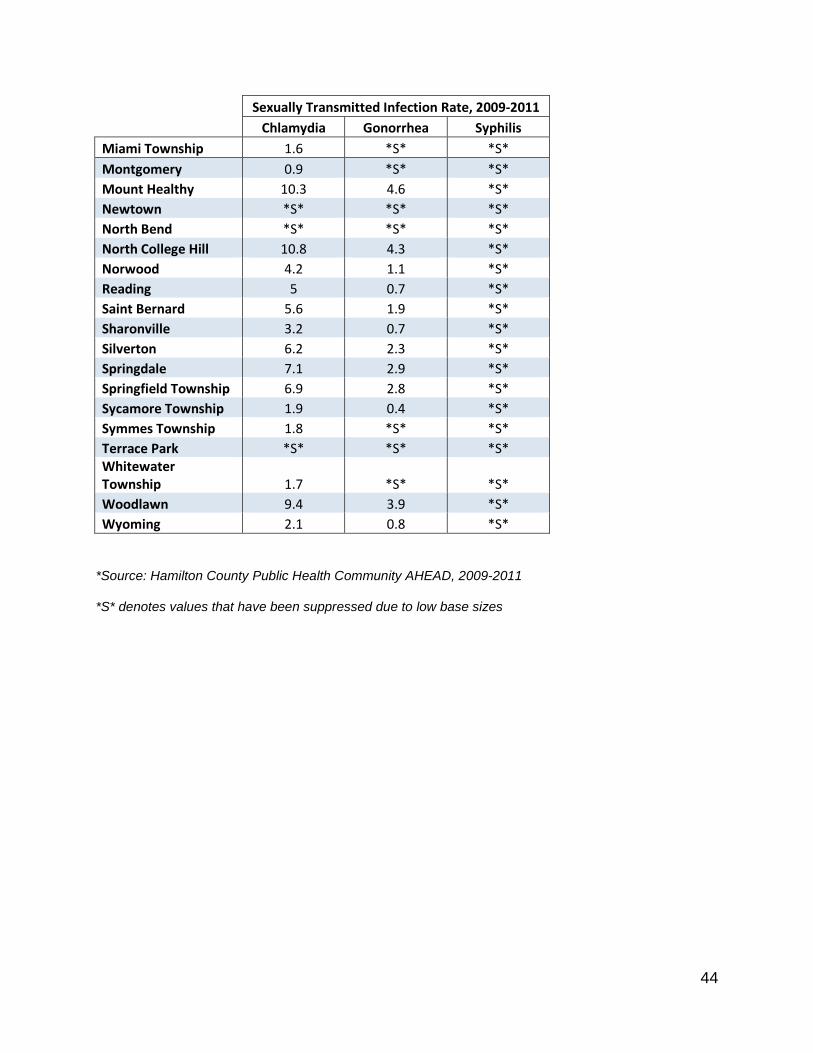
Sexually Transmitted Infection Rate, 2009-2011
Chlamydia Gonorrhea Syphilis
Miami Township 1.6 *S* *S* Montgomery 0.9 *S* *S* Mount Healthy 10.3 4.6 *S* Newtown *S* *S* *S* North Bend *S* *S* *S* North College Hill 10.8 4.3 *S* Norwood 4.2 1.1 *S* Reading 5 0.7 *S* Saint Bernard 5.6 1.9 *S* Sharonville 3.2 0.7 *S* Silverton 6.2 2.3 *S* Springdale 7.1 2.9 *S* Springfield Township 6.9 2.8 *S* Sycamore Township 1.9 0.4 *S* Symmes Township 1.8 *S* *S* Terrace Park *S* *S* *S* Whitewater Township 1.7 *S* *S* Woodlawn 9.4 3.9 *S* Wyoming 2.1 0.8 *S*
*Source: Hamilton County Public Health Community AHEAD, 2009-2011
*S* denotes values that have been suppressed due to low base sizes
45
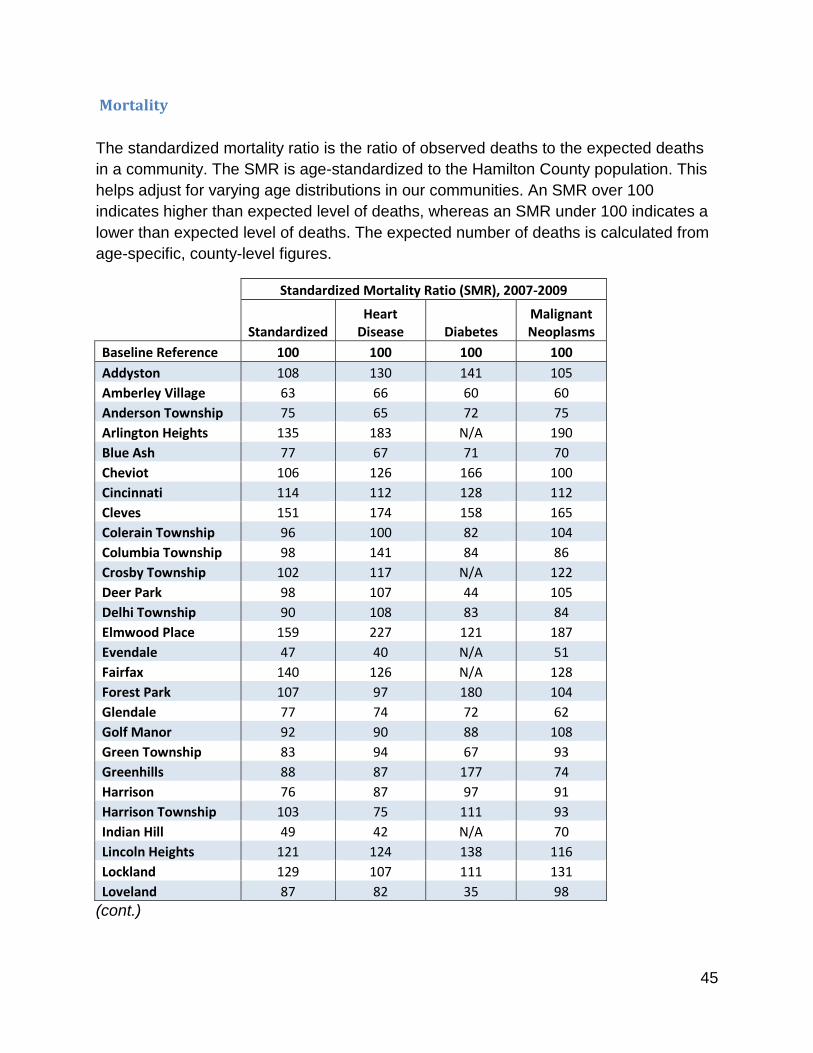
Mortality The standardized mortality ratio is the ratio of observed deaths to the expected deaths in a community. The SMR is age-standardized to the Hamilton County population. This helps adjust for varying age distributions in our communities. An SMR over 100 indicates higher than expected level of deaths, whereas an SMR under 100 indicates a lower than expected level of deaths. The expected number of deaths is calculated from age-specific, county-level figures.
Standardized Mortality Ratio (SMR), 2007-2009
Standardized
Heart Disease Diabetes
Malignant Neoplasms
Baseline Reference 100 100 100 100 Addyston 108 130 141 105 Amberley Village 63 66 60 60 Anderson Township 75 65 72 75 Arlington Heights 135 183 N/A 190 Blue Ash 77 67 71 70 Cheviot 106 126 166 100 Cincinnati 114 112 128 112 Cleves 151 174 158 165 Colerain Township 96 100 82 104 Columbia Township 98 141 84 86 Crosby Township 102 117 N/A 122 Deer Park 98 107 44 105 Delhi Township 90 108 83 84 Elmwood Place 159 227 121 187 Evendale 47 40 N/A 51 Fairfax 140 126 N/A 128 Forest Park 107 97 180 104 Glendale 77 74 72 62 Golf Manor 92 90 88 108 Green Township 83 94 67 93 Greenhills 88 87 177 74 Harrison 76 87 97 91 Harrison Township 103 75 111 93 Indian Hill 49 42 N/A 70 Lincoln Heights 121 124 138 116 Lockland 129 107 111 131 Loveland 87 82 35 98
(cont.)
46
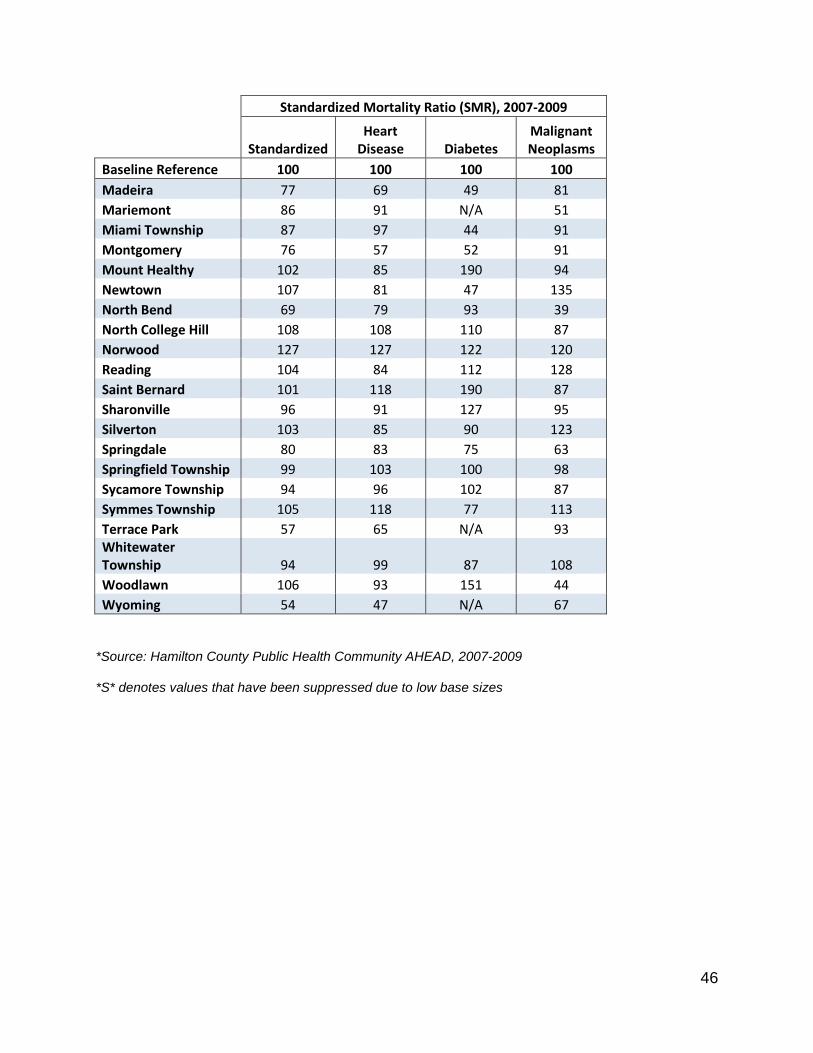
Standardized Mortality Ratio (SMR), 2007-2009
Standardized
Heart Disease Diabetes
Malignant Neoplasms
Baseline Reference 100 100 100 100 Madeira 77 69 49 81 Mariemont 86 91 N/A 51 Miami Township 87 97 44 91 Montgomery 76 57 52 91 Mount Healthy 102 85 190 94 Newtown 107 81 47 135 North Bend 69 79 93 39 North College Hill 108 108 110 87 Norwood 127 127 122 120 Reading 104 84 112 128 Saint Bernard 101 118 190 87 Sharonville 96 91 127 95 Silverton 103 85 90 123 Springdale 80 83 75 63 Springfield Township 99 103 100 98 Sycamore Township 94 96 102 87 Symmes Township 105 118 77 113 Terrace Park 57 65 N/A 93 Whitewater Township 94 99 87 108 Woodlawn 106 93 151 44 Wyoming 54 47 N/A 67
*Source: Hamilton County Public Health Community AHEAD, 2007-2009
*S* denotes values that have been suppressed due to low base sizes
47
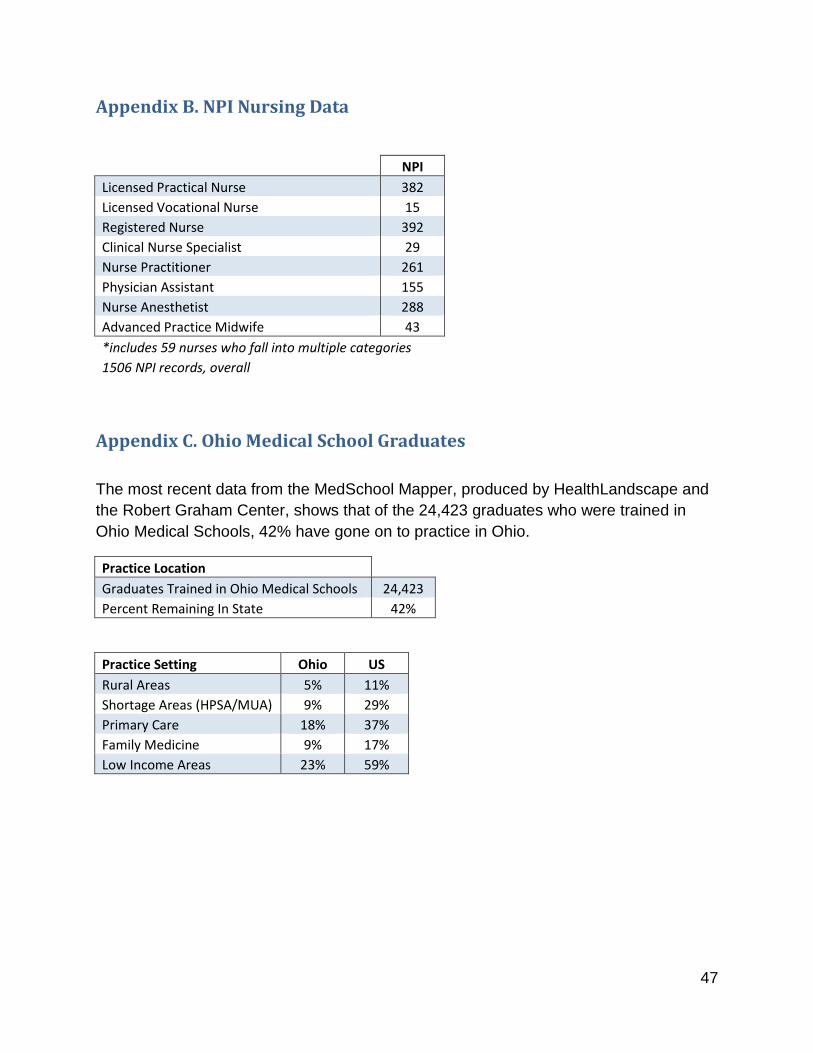
Appendix B. NPI Nursing Data
NPI
Licensed Practical Nurse 382 Licensed Vocational Nurse 15 Registered Nurse 392 Clinical Nurse Specialist 29 Nurse Practitioner 261 Physician Assistant 155 Nurse Anesthetist 288 Advanced Practice Midwife 43 *includes 59 nurses who fall into multiple categories 1506 NPI records, overall
Appendix C. Ohio Medical School Graduates The most recent data from the MedSchool Mapper, produced by HealthLandscape and the Robert Graham Center, shows that of the 24,423 graduates who were trained in Ohio Medical Schools, 42% have gone on to practice in Ohio.
Practice Location Graduates Trained in Ohio Medical Schools 24,423
Percent Remaining In State 42%
Practice Setting Ohio US Rural Areas 5% 11% Shortage Areas (HPSA/MUA) 9% 29% Primary Care 18% 37% Family Medicine 9% 17% Low Income Areas 23% 59%
48
Appendix D. Data Points Collected by the Ohio License Center
The state of Ohio maintains a database that captures Legal Name, Date of Birth, Birthplace, Practice/Employment History, Background Information, Practice Address, Residential Address, Professional Graduation, Credentials, Specialties, and Formal Actions for a variety of healthcare professionals. The specific information recorded varies by license type.