Virginia’s Dental Hygienist Workforce: 2017€™s Dental Hygienist Workforce: 2017 Healthcare...
30
Virginia’s Dental Hygienist Workforce: 2017 Healthcare Workforce Data Center May 2017 Virginia Department of Health Professions Healthcare Workforce Data Center Perimeter Center 9960 Mayland Drive, Suite 300 Richmond, VA 23233 804-367-2115, 804-527-4466(fax) E-mail: [email protected] Follow us on Tumblr: www.vahwdc.tumblr.com
Transcript of Virginia’s Dental Hygienist Workforce: 2017€™s Dental Hygienist Workforce: 2017 Healthcare...

Virginia’s Dental Hygienist Workforce: 2017
Healthcare Workforce Data Center
May 2017
Virginia Department of Health Professions Healthcare Workforce Data Center
Perimeter Center 9960 Mayland Drive, Suite 300
Richmond, VA 23233 804-367-2115, 804-527-4466(fax) E-mail: [email protected]
Follow us on Tumblr: www.vahwdc.tumblr.com

Virginia Department of Health Professions
David E. Brown, D.C. Director
Lisa R. Hahn, MPA
Chief Deputy Director
Healthcare Workforce Data Center Staff:
Dr. Elizabeth Carter, Ph.D. Director
Yetty Shobo, Ph.D. Deputy Director
Laura Jackson Operations Manager
Christopher Coyle Research Assistant
5,203 Dental Hygienists voluntarily participated in this survey. Without their efforts the work of the center would not be possible. The Department of Health Professions, the Healthcare Workforce Data Center, and the Board of Dentistry express our sincerest appreciation for your ongoing cooperation.
Thank You!

Virginia Board of Dentistry
President
A. Rizkalla, DDS Falls Church
Vice-President
John M. Alexander, DDS
Richmond
Secretary-Treasurer
Tonya A. Parris-Wilkins, DDS Chester
Members
Nathaniel C. Bryant, DDS
Chesapeake
Tammy C. Ridout, RDH Chesterfield
Augustus A. Petticolas, DDS
Forest
Patricia B. Bonwell, RDH, Ph.D. Montpelier
Bruce S. Wyman, DMD
Vienna
James D. Watkins, DDS Hampton
Carol R. Russek, JD
Midlothian
Executive Director
Sandra K. Reen

Contents
Results in Brief ............................................................................................................................................................................ 2
Summary of Trends .................................................................................................................................................................... 3
Survey Response Rates ............................................................................................................................................................... 4
The Workforce ............................................................................................................................................................................ 5
Demographics ............................................................................................................................................................................. 6
Background ................................................................................................................................................................................ 7
Education ................................................................................................................................................................................... 9
Current Employment Situation ................................................................................................................................................. 10
Employment Quality ................................................................................................................................................................. 11
Current Labor Market ............................................................................................................................................................... 12
Work Site Distribution .............................................................................................................................................................. 13
Establishment Type .................................................................................................................................................................. 14
Time Allocation ........................................................................................................................................................................ 16
Patient Workload ..................................................................................................................................................................... 17
Retirement & Future Plans ....................................................................................................................................................... 18
Full-Time Equivalency Units ...................................................................................................................................................... 20
Maps ........................................................................................................................................................................................ 21 Council on Virginia’s Future Regions ............................................................................................................................................ 21 Area Health Education Center Regions ........................................................................................................................................ 22 Workforce Investment Areas ....................................................................................................................................................... 23 Health Services Areas ................................................................................................................................................................... 24 Planning Districts .......................................................................................................................................................................... 25
Appendices ............................................................................................................................................................................... 26 Appendix A: Weights ................................................................................................................................................................... 26

1
The Dental Hygienist Workforce: At a Glance:
The Workforce Background Current Employment t Licensees: 5,907 Rural Childhood: 35% Employed in Prof.: 92% Virginia’s Workforce: 4,804 HS Diploma in VA: 58% Hold 1 Full-time Job: 52% FTEs: 3,148 Prof. Degree in VA: 65% Satisfied?: 93%
Survey Response Rate Education Job Turnover t All Licensees: 88% Associate: 54% Switched Jobs: 7% Renewing Practitioners: 94% Baccalaureate: 41% Employed over 2 yrs: 66%
Demographics Finances Time Allocation t Female: 98% Median Inc.: $50k-$60k Patient Care: 90%-99% Diversity Index: 33% Retirement Benefits: 49% Administration: 1%-9% Median Age: 44 Under 40 w/ Ed debt: 49% Patient Care Role: 93%
Source: Va. Healthcare Workforce Data Center

2
Results in Brief
5,203 dental hygienists voluntarily took part in the 2017 Dental Hygienist Workforce Survey. The Virginia
Department of Health Professions’ Healthcare Workforce Data Center (HWDC) administers the survey during the license renewal process, which takes place every March for dental hygienists. These survey respondents represent 88% of the 5,907 dental hygienists who are licensed in the state and 94% of renewing practitioners.
The HWDC estimates that 4,804 dental hygienists participated in Virginia’s workforce during the survey period,
which is defined as those dental hygienists who worked at least a portion of the year in the state or who live in the state and intend to return to work as a dental hygienist at some point in the future. Between April 2016 and March 2017, Virginia’s dental hygienist workforce provided 3,148 “full-time equivalency units”, which the HWDC defines simply as working 2,000 hours a year (or 40 hours per week for 50 weeks with 2 weeks off).
98% of all dental hygienists are female, including 97% of those dental hygienists who are under the age of 40. In a
random encounter between two dental hygienists, there is a 33% chance that they would be of different races or ethnicities, a measure known as the diversity index. This makes dental hygienists less diverse than Virginia’s population as a whole, which currently has a diversity index of 56%.
35% of dental hygienists grew up in a rural area, and 20% of these professionals currently work in non-metro areas
of the state. Overall, just 9% of Virginia’s dental hygienists work in non-metro areas of the state. Meanwhile, 58% of Virginia’s dental hygienists graduated from high school in Virginia, and 65% received their initial professional degree in the state. In total, 71% of the dental hygienist workforce has some educational background in the state.
54% of all dental hygienists hold an Associate’s degree as their highest professional degree, while another 41% have
earned a baccalaureate degree. 29% of dental hygienists currently have educational debt, including 49% of those who are under the age of 40. The median debt burden for those professionals with educational debt is between $10,000 and $20,000.
92% of dental hygienists are currently employed in the profession, and only 1% are involuntarily unemployed at the
moment. 52% of Virginia’s dental hygienists currently hold one full-time position, while 17% hold multiple positions at the same time. With respect to work hours, 51% of all dental hygienists currently work between 30 and 39 hours per week, while 29% work less than 30 hours per week.
The median annual income for Virginia’s dental hygienist workforce is between $50,000 and $60,000. In addition,
72% of dental hygienists who earn either a salary or an hourly wage at their primary work location also receive at least one employer-sponsored benefit, including 49% who have access to a retirement plan. 93% of dental hygienists indicate they are satisfied with their current employment situation, including 59% who indicate they are “very satisfied”.
66% of dental hygienists have worked at their primary work location for at least two years, while 7% switched jobs
at some point in the past year. 71% of all dental hygienists work at a solo dental practice at their primary work location, while another 18% work at a group dental practice. Overall, 94% of Virginia’s dental hygienists work at a for-profit establishment.
93% of all dental hygienists serve in a patient care role, meaning that at least 60% of their time is spent treating patients. The typical dental hygienist treats between 25 and 49 patients per week at her primary work location. In addition, those dental hygienists who also have a secondary work location treat an additional 1 to 24 patients per week on average.
25% of all dental hygienists expect to retire in the next decade, while half the current workforce expects to retire by
2037. Over the next two years, just 2% of dental hygienists plan on leaving the state to practice elsewhere, while another 2% plan on leaving the profession entirely. Meanwhile, 12% of dental hygienists expect to increase patient care activities, while 9% are planning to pursue additional educational opportunities.

3
Summary of Trends
In 2017, the number of dental hygienists who are licensed in the state increased from 5,727 to 5,907. At the same time, the number of licensees who voluntarily participated in the Dental Hygienist survey increased from 5,062 to 5,203. Although the response rate among Virginia’s licensed dental hygienists remained the same at 88% in 2017, the response rate among renewing practitioners increased from 92% to 94%. There were similar increases with respect to Virginia’s dental hygienist workforce and the number of FTEs provided by this workforce. In 2016, there were 4,684 dental hygienists in Virginia’s dental hygienist workforce, and this number increased to 4,804 in 2017. Meanwhile, the number of FTEs furnished by these dental hygienists increased from 3,045 to 3,148. Despite this increase, however, the typical dental hygienist actually provided fewer FTEs in 2017. In particular, the typical dental hygienist provided 0.70 FTEs in 2016, but this figure dipped to 0.69 FTEs in 2017. Although there was no change in the percentage of dental hygienists who are employed in the profession, there was a small uptick in the percentage of the workforce that has one full time job. In 2016, 51% of Virginia’s dental hygienists had one full-time job, but 52% had one in 2017. At the same time, Virginia’s dental hygienists are slightly less likely to work less than 60 hours per week. This percentage fell from 30% in 2016 to 29% in 2017. There was no change in either the median annual income of Virginia’s dental hygienists or in the percentage of wage and salaried dental hygienists who receive at least one employer-sponsored benefit. However, dental hygienists were somewhat more likely to receive specific employer-sponsored benefits in 2017. For example, while only 46% of wage and salaried dental hygienists had access to a retirement plant at work in 2016, this percentage increased to 49% in 2017. In addition, the percentage of dental hygienists who receive dental insurance increased from 14% to 15%. At the same time, there was a small change in how Virginia’s dental hygienists are compensated at their primary work location. In 2016, 77% of all dental hygienists received an hourly wage at their primary work location, but this figure increased to 78% in 2017. This increase came at the expense of those dental hygienists who are compensated with a salary at their primary location. Although 22% of all dental hygienists received a salary at their primary work location in 2016, only 21% receive a salary in 2017. Regardless, dental hygienists were slightly less satisfied with their current work situation in 2017. 61% of Virginia’s dental hygienist workforce were “very satisfied” with their profession in 2016, but this percentage fell to 59% in 2017. Instead, a greater percentage of dental hygienists indicated that they were only “somewhat satisfied” with their current work situation. In 2017, the percentage of these professionals increased from 32% to 34%. The dental hygienist labor market in Virginia showed some signs of improvement in 2017. 10% of Virginia’s dental hygienist workforce were underemployed in 2016, but this figure fell to 9% in 2017. At the same time, the percentage of dental hygienists who were involuntarily unemployed also dropped from 3% to 2%. Meanwhile, Virginia’s dental hygienist workforce were slightly less likely to stay with their employers over the long term. In 2016, 68% of dental hygienists had been at their primary work location for at least two years, but only 66% had done so in 2017. 72% of all dental hygienists worked at a solo dental practice in 2016, but this percentage dipped slightly to 71% in 2017. Instead, more dental hygienists worked at group dental practices. In 2016, 17% of Virginia’s dental hygienists workforce were employed at a group dental practice, but this percentage climbed slightly to 18% in 2017. Virginia’s dental hygienists have moved up their retirement expectations over the past year. In 2016, 64% of all dental hygienists expected to retire by the age of 65, but 65% expect to do so in 2017. This trend is more pronounced among those dental hygienists who expect to retire by the age of 60. In 2016, 36% of all dental hygienists expected to retire no later than the age of 60, but this percentage increased to 38% in 2017. Meanwhile, the percentage of dental hygienists who expect to retire within the next ten years increased from 23% to 25%.

4
Survey Response Rates
A Closer Look:
Response Rates
Statistic Non
Respondents Respondent
Response Rate
By Age
Under 30 73 611 89%
30 to 34 61 723 92%
35 to 39 75 706 90%
40 to 44 66 677 91%
45 to 49 76 628 89%
50 to 54 87 606 87%
55 to 59 77 575 88%
60 and Over 189 677 78%
Total 704 5,203 88%
New Licenses
Issued in Past Year
69 249 78%
Metro Status
Non-Metro 48 483 91%
Metro 428 3,910 90%
Not in Virginia 228 810 78%
Licensees License Status # %
Renewing Practitioners
5,291 90%
New Licensees 318 5%
Non-Renewals 298 5%
All Licensees 5,907 100%
Response Rates Completed Surveys 5,203
Response Rate, all licensees 88%
Response Rate, Renewals 94%
At a Glance:
Licensed Dental Hygienists Number: 5,907 New: 5% Not Renewed: 5%
Response Rates All Licensees: 88% Renewing Practitioners: 94%
Definitions
1. The Survey Period: The survey was conducted in March 2017.
2. Target Population: All Dental Hygienists who held a Virginia license at some point between April 2016 and March 2017.
3. Survey Population: The survey was available to dental hygienists who renewed their licenses online. It was not available to those who did not renew, including some dental hygienists newly licensed in 2017.
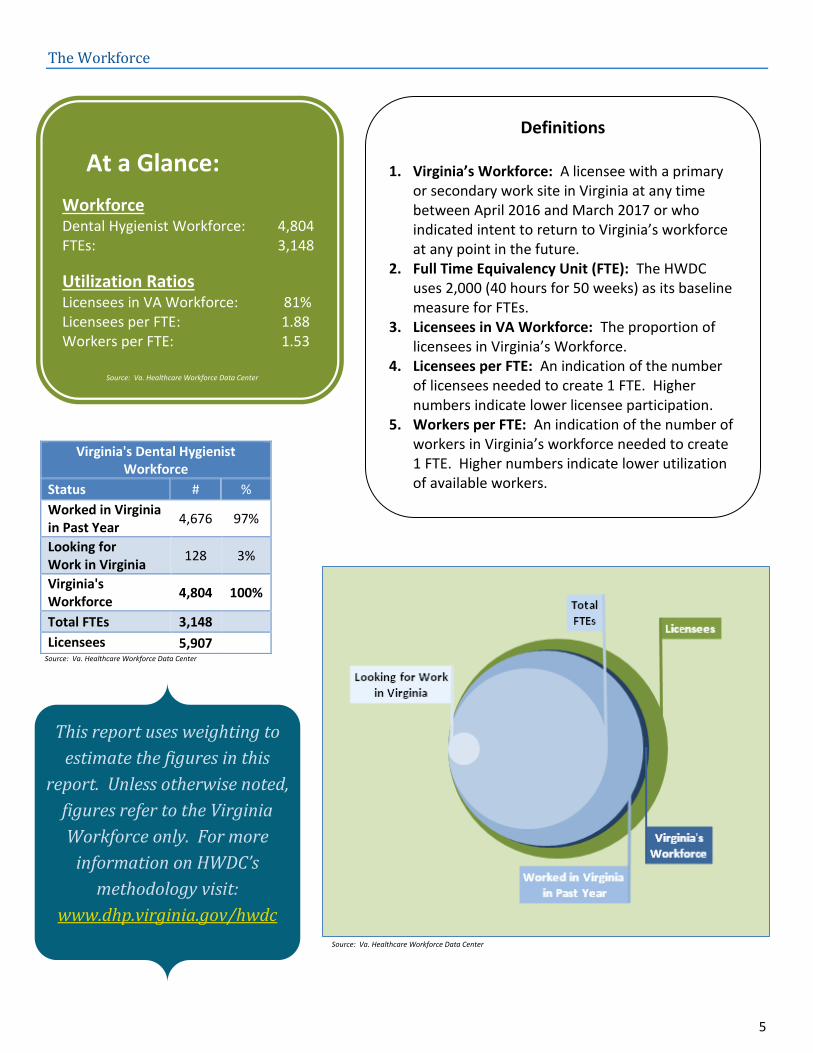
HWDC surveys tend to achieve very high response rates. 94% of renewing dental hygienists submitted a survey. These represent 88% of dental hygienists who
held a license at some point in the past year.
Source: Va. Healthcare Workforce Data Center
Source: Va. Healthcare Workforce Data Center
Source: Va. Healthcare Workforce Data Center
Source: Va. Healthcare Workforce Data Center
5
The Workforce
Virginia's Dental Hygienist Workforce
Status # %
Worked in Virginia in Past Year
4,676 97%
Looking for Work in Virginia
128 3%
Virginia's Workforce
4,804 100%
Total FTEs 3,148
Licensees 5,907
At a Glance:
Workforce Dental Hygienist Workforce: 4,804 FTEs: 3,148
Utilization Ratios Licensees in VA Workforce: 81% Licensees per FTE: 1.88 Workers per FTE: 1.53
Definitions
1. Virginia’s Workforce: A licensee with a primary or secondary work site in Virginia at any time between April 2016 and March 2017 or who indicated intent to return to Virginia’s workforce at any point in the future.
2. Full Time Equivalency Unit (FTE): The HWDC uses 2,000 (40 hours for 50 weeks) as its baseline measure for FTEs.
3. Licensees in VA Workforce: The proportion of licensees in Virginia’s Workforce.
4. Licensees per FTE: An indication of the number of licensees needed to create 1 FTE. Higher numbers indicate lower licensee participation.
5. Workers per FTE: An indication of the number of workers in Virginia’s workforce needed to create 1 FTE. Higher numbers indicate lower utilization of available workers.
This report uses weighting to
estimate the figures in this
report. Unless otherwise noted,
figures refer to the Virginia
Workforce only. For more
information on HWDC’s
methodology visit:
www.dhp.virginia.gov/hwdc
Source: Va. Healthcare Workforce Data Center
Source: Va. Healthcare Workforce Data Center
Source: Va. Healthcare Workforce Data Center

6
Demographics
A Closer Look:
Age & Gender
Age Male Female Total
# %
Male #
% Female
# % in Age
Group
Under 30 13 2% 548 98% 561 13%
30 to 34 18 3% 575 97% 594 14%
35 to 39 14 3% 550 98% 565 13%
40 to 44 14 3% 525 97% 539 13%
45 to 49 8 2% 492 99% 500 12%
50 to 54 0 0% 486 100% 486 11%
55 to 59 2 1% 452 100% 455 11%
60 + 4 1% 567 99% 571 13%
Total 73 2% 4,196 98% 4,270 100%
Race & Ethnicity
Race/ Ethnicity
Virginia* Dental
Hygienists Hygienists Under 40
% # % # %
White 63% 3,477 81% 1,326 77%
Black 19% 225 5% 111 6%
Asian 6% 251 6% 130 8%
Other Race 0% 61 1% 23 1% Two or more races
3% 84 2% 38 2%
Hispanic 9% 189 4% 102 6%
Total 100% 4,287 100% 1,730 100% *Population data in this chart is from the US Census, Annual Estimates of the Resident Population by Sex, Race, and Hispanic Origin for the United States, States, and Counties: July 1, 2015.
At a Glance:
Gender % Female: 98% % Under 40 Female: 97%
Age Median Age: 44 % Under 40: 40% % 55+: 24%
Diversity Diversity Index: 33% Under 40 Div. Index: 40%
In a chance encounter between two dental hygienists, there is a 33% chance they would be of a different race/ethnicity (a measure known as the Diversity Index).
40% of dental hygienists are under the age of 40. 97% of these professionals are female, and they have a diversity index of 40%.
Source: Va. Healthcare Workforce Data Center
Source: Va. Healthcare Workforce Data Center
Source: Va. Healthcare Workforce Data Center
Source: Va. Healthcare Workforce Data Center

7
Background
A Closer Look:
Primary Location: USDA Rural Urban Continuum
Rural Status of Childhood Location
Code Description Rural Suburban Urban
Metro Counties
1 Metro, 1 million+ 25% 61% 15%
2 Metro, 250,000 to 1 million 51% 37% 12%
3 Metro, 250,000 or less 63% 29% 8%
Non-Metro Counties
4 Urban pop 20,000+, Metro adj
61% 24% 15%
6 Urban pop, 2,500-19,999, Metro adj
72% 20% 8%
7 Urban pop, 2,500-19,999, nonadj
90% 5% 5%
8 Rural, Metro adj 76% 20% 4%
9 Rural, nonadj 61% 34% 5%
Overall 35% 52% 13%
At a Glance:
Childhood Urban Childhood: 13% Rural Childhood: 35%
Virginia Background HS in Virginia: 58% Prof. in VA: 65% HS or Prof. in VA: 71%
Location Choice % Rural to Non-Metro: 20% % Urban/Suburban
to Non-Metro: 4%
35% of dental hygienists grew up in a rural area, and 20% of this group currently
works in non-metro areas of the state. Overall, 9% of
dental hygienists currently work in non-metro areas of
Virginia.
Source: Va. Healthcare Workforce Data Center
Source: Va. Healthcare Workforce Data Center
Source: Va. Healthcare Workforce Data Center

8
Top Ten States for Dental Hygienist Recruitment
Rank All Dental Hygienists
High School # Dental School #
1 Virginia 2,490 Virginia 2,746
2 Outside U.S./Canada 244 North Carolina 211
3 Pennsylvania 157 Maryland 128
4 New York 140 West Virginia 126
5 North Carolina 132 New York 114
6 West Virginia 128 Pennsylvania 102
7 Maryland 126 Florida 97
8 Florida 89 Tennessee 86
9 New Jersey 74 Washington, D.C. 70
10 Michigan 60 Michigan 51
Rank Licensed in the Past 5 Years
High School # Dental School #
1 Virginia 557 Virginia 649
2 Outside U.S./Canada 71 North Carolina 61
3 Maryland 46 Maryland 45
4 Pennsylvania 41 West Virginia 31
5 North Carolina 37 Pennsylvania 28
6 West Virginia 31 Florida 26
7 California 20 New York 17
8 New York 19 Georgia 13
9 Florida 16 Washington, D.C. 13
10 Texas 15 Tennessee 12
58% of all dental hygienists earned their high
school degree in Virginia, and 65% received their
initial professional degree in the state.
At a Glance:
Not in VA Workforce Total: 1,104 % of Licensees: 19% Federal/Military: 6% Va Border State/DC: 18%
19% of Virginia’s licensees were not part of the state’s dental hygienist workforce. 82% of these
licensees worked at some point in the past year, and 71% currently work as dental hygienists.
Among dental hygienists who received their initial license in the past five years, 55% earned their
high school degree in Virginia, while 64% received their initial
professional degree in the state.
Source: Va. Healthcare Workforce Data Center
Source: Va. Healthcare Workforce Data Center
Source: Va. Healthcare Workforce Data Center

9
Education
A Closer Look:
Highest Dental Hygienist Degree Degree # %
Certificate 88 2%
Associate Degree 2,259 54%
Baccalaureate Degree 1,710 41%
Post-Graduate Cert. 13 0%
Master’s Degree 107 3%
Doctorate 5 0%
Total 4,182 100%
Educational Debt
Amount Carried
All Dental Hygienists
Hygienists under 40
# % # %
None 2,734 71% 820 51%
Less than $10,000 316 8% 202 13%
$10,000-$19,999 254 7% 173 11%
$20,000-$29,999 173 4% 122 8%
$30,000-$39,999 100 3% 78 5%
$40,000-$49,999 86 2% 58 4%
$50,000-$59,999 58 1% 46 3%
$60,000-$69,999 51 1% 36 2%
$70,000-$79,999 18 0% 11 1%
$80,000-$89,999 30 1% 21 1%
$90,000-$99,999 10 0% 4 0%
$100,000 or more 40 1% 22 1%
Total 3,869 100% 1,593 100%
At a Glance:
Education Associate: 54% Baccalaureate: 41%
Educational Debt Carry debt: 29% Under age 40 w/ debt: 49% Median debt: $10k-$20k
Source: Va. Healthcare Workforce Data Center 29% of dental hygienists carry educational debt, including 49% of those under the age of 40. For those
with educational debt, their median burden is between $10,000 and $20,000.
Source: Va. Healthcare Workforce Data Center
Source: Va. Healthcare Workforce Data Center
Source: Va. Healthcare Workforce Data Center
Source: Va. Healthcare Workforce Data Center

10
Current Employment Situation
A Closer Look:
Current Work Status Status # %
Employed, capacity unknown 2 0%
Employed in a dentistry related capacity
3,943 92%
Employed, NOT in a dentistry related capacity
109 3%
Not working, reason unknown 0 0%
Involuntarily unemployed 25 1%
Voluntarily unemployed 169 4%
Retired 40 1%
Total 4,288 100%
Current Weekly Hours Hours # %
0 hours 234 6%
1 to 9 hours 133 3%
10 to 19 hours 352 8%
20 to 29 hours 735 17%
30 to 39 hours 2,157 51%
40 to 49 hours 514 12%
50 to 59 hours 38 1%
60 to 69 hours 20 0%
70 to 79 hours 9 0%
80 or more hours 11 0%
Total 4,203 100%
Current Positions Positions # %
No Positions 234 6%
One Part-Time Position 1,101 26%
Two Part-Time Positions 371 9%
One Full-Time Position 2,194 52%
One Full-Time Position & One Part-Time Position
234 6%
Two Full-Time Positions 5 0%
More than Two Positions 96 2%
Total 4,235 100%
At a Glance:
Employment Employed in Profession: 92% Involuntarily Unemployed: 1%
Positions Held 1 Full-time: 52% 2 or More Positions: 17%
Weekly Hours: 40 to 49: 12% 60 or more: 1% Less than 30: 29%
92% of Virginia’s dental hygienists are currently employed in the profession, and only 1% are involuntarily unemployed. 52% currently hold
one full-time job, while 17% hold multiple positions simultaneously.
Source: Va. Healthcare Workforce Data Center
Source: Va. Healthcare Workforce Data Center
Source: Va. Healthcare Workforce Data Center
Source: Va. Healthcare Workforce Data Center

11
Employment Quality
A Closer Look:
Income Hourly Wage # %
Volunteer Work Only 36 1%
Less than $20,000 230 7%
$20,000-$29,999 202 6%
$30,000-$39,999 317 9%
$40,000-$49,999 469 13%
$50,000-$59,999 696 20%
$60,000-$69,999 679 19%
$70,000-$79,999 502 14%
$80,000-$89,999 238 7%
$90,000-$99,999 84 2%
$100,000 or More 73 2%
Total 3,525 100%
Job Satisfaction Level # %
Very Satisfied 2,481 59%
Somewhat Satisfied 1,411 34%
Somewhat Dissatisfied
199 5%
Very Dissatisfied 86 2%
Total 4,177 100%
Employer-Sponsored Benefits
Benefit # % % of Wage/Salary
Employees
Paid Vacation 2,590 66% 64%
Retirement 1,944 49% 49%
Paid Sick Leave 1,346 34% 34%
Dental Insurance 609 15% 15%
Group Life Insurance 507 13% 12%
Signing/Retention Bonus 93 2% 2%
Received At Least One Benefit 2,907 74% 72% *From any employer at time of survey.
At a Glance:
Earnings Median Income: $50k-$60k
Benefits Paid Vacation: 64% Retirement: 49%
Satisfaction Satisfied: 93% Very Satisfied: 59%
The typical dental hygienist made between $50,000 and $60,000 in the past year. Among dental hygienists
who were compensated at their primary work location with either a
salary or an hourly wage, 64% received paid vacation leave and 49% had
access to a retirement plan.
Source: Va. Healthcare Workforce Data Center
Source: Va. Healthcare Workforce Data Center
Source: Va. Healthcare Workforce Data Center
Source: Va. Healthcare Workforce Data Center

12
Current Labor Market
A Closer Look:
1
1 As reported by the US Bureau of Labor Statistics. The non-seasonally adjusted monthly unemployment rate ranged from 3.6% in April 2016 to 3.8% in March 2017. The unemployment rate from March 2017 was still preliminary at the time of publication.
Employment Instability in Past Year In the past year did you . . .? # %
Experience involuntary unemployment? 89 2%
Experience voluntary unemployment? 313 7%
Work part-time or temporary positions, but would have preferred a full-time/permanent position?
409 9%
Work two or more positions at the same time? 841 18%
Switch employers or practices? 315 7%
Experienced at least one 1,472 31%
Location Tenure
Tenure Primary Secondary
# % # %
Not Currently Working at this Location
126 3% 117 11%
Less than 6 Months 236 6% 155 15%
6 Months to 1 Year 393 10% 140 14%
1 to 2 Years 626 15% 191 19%
3 to 5 Years 712 18% 168 16%
6 to 10 Years 686 17% 128 12%
More than 10 Years 1,281 32% 131 13%
Subtotal 4,059 100% 1,030 100%
Did not have location 158
3,715
Item Missing 586
59
Total 4,804
4,804
Employment Type
Primary Work Site # %
Hourly Wage 2,634 78%
Salary/ Commission 699 21%
By Contract 38 1%
Business/ Practice Income
13 0%
Unpaid 10 0%
Subtotal 3,395 100%
Did not have location
158
Item Missing 1,250
At a Glance:
Unemployment Experience Involuntarily Unemployed: 2% Underemployed: 9%
Turnover & Tenure Switched Jobs: 7% New Location: 23% Over 2 years: 66% Over 2 yrs, 2nd location: 41%
Employment Type Hourly Wage: 78% Salary/Commission: 21%
Only 2% of Virginia’s dental hygienists experienced involuntary unemployment at some point in the past year. By comparison, Virginia’s average monthly unemployment rate
was 4.0% during the same time period.1
66% of dental hygienists have been employed at their primary work location for at
least two years.
78% of dental hygienists receive an hourly wage at their primary work location, while 21% earn a salary or work on commission.
Source: Va. Healthcare Workforce Data Center
Source: Va. Healthcare Workforce Data Center
Source: Va. Healthcare Workforce Data Center
Source: Va. Healthcare Workforce Data Center

13
Work Site Distribution
A Closer Look:
Regional Distribution of Work Locations
COVF Region
Primary Location
Secondary Location
# % # %
Central 733 18% 172 16%
Eastern 59 1% 29 3%
Hampton Roads 978 24% 222 21%
Northern 1,307 32% 391 36%
Southside 127 3% 29 3%
Southwest 176 4% 39 4%
Valley 225 6% 45 4%
West Central 402 10% 98 9%
Virginia Border State/DC
20 0% 17 2%
Other US State 13 0% 31 3%
Outside of the US 0 0% 5 0%
Total 4,040 100% 1,078 100%
Item Missing 605
11
Number of Work Locations
Locations
Work Locations in
Past Year
Work Locations
Now*
# % # %
0 130 3% 239 6%
1 2,970 71% 3,019 72%
2 620 15% 580 14%
3 336 8% 305 7%
4 49 1% 17 0%
5 28 1% 7 0%
6 or More
51 1% 17 0%
Total 4,184 100% 4,184 100% *At the time of survey completion, March 2017.
At a Glance:
Concentration Top Region: 32% Top 3 Regions: 75% Lowest Region: 1%
Locations 2 or more (Past Year): 26% 2 or more (Now*): 22%
22% of all dental hygienists currently have multiple work
locations, while 26% have worked at multiple locations over the past year.
32% of all dental hygienists work in Northern Virginia, the most of any region in the state. Along with Hampton Roads and Central Virginia, these three regions employ 75% of the state’s dental hygienist workforce.
Source: Va. Healthcare Workforce Data Center
Source: Va. Healthcare Workforce Data Center
Source: Va. Healthcare Workforce Data Center

14
Establishment Type
A Closer Look:
Location Sector
Sector
Primary Location
Secondary Location
# % # %
For-profit 3,676 94% 913 91%
Non-profit 63 2% 33 3%
State/local government 103 3% 42 4%
Veterans Administration 10 0% 1 0%
U.S. Military 53 1% 2 0%
Other Federal Government
9 0% 7 1%
Total 3,914 100% 998 100%
Did not have location 158
3715
Item missing 731
91
At a Glance: (Primary Locations)
Sector For Profit: 94% Federal: 2%
Top Establishments Solo Practice: 71% Group Practice: 18% Dental/Health Clinic: 6%
94% of dental hygienists work in for-profit establishments, while 2%
work for the federal government.
Source: Va. Healthcare Workforce Data Center
Source: Va. Healthcare Workforce Data Center
Source: Va. Healthcare Workforce Data Center

15
Location Type
Establishment Type
Primary Location
Secondary Location
# % # %
Solo Practice 2,725 71% 717 75%
Group Practice 672 18% 103 11%
Dental/Health Clinic 220 6% 56 6%
Dental School (including Combined Dental/Dental Hygiene)
64 2% 42 4%
Hospital/Health System 27 1% 3 0%
Public Health Program 18 0% 6 1%
Corrections 13 0% 6 1%
Insurance 10 0% 2 0%
K-12 School or Non-Dental College
10 0% 2 0%
Nursing Home/Long-Term Care Facility
8 0% 1 0%
Supplier Organization 6 0% 2 0%
Other 58 2% 16 2%
Total 3,831 100% 956 100%
Did Not Have a Location 158 3715
Among those dental hygienists who also have a secondary work
location, 75% work at a solo dental practice and 11% work at a group
dentist practice.
71% of dental hygienists work at a solo dental practice at their primary work location, while another 18% work at a
group dental practice.
Source: Va. Healthcare Workforce Data Center
Source: Va. Healthcare Workforce Data Center

16
Time Allocation
A Closer Look:
Time Allocation
Time Spent
Admin. Patient
Care Education Research Other
Prim. Site
Sec. Site
Prim. Site
Sec. Site
Prim. Site
Sec. Site
Prim. Site
Sec. Site
Prim. Site
Sec. Site
All or Almost All (80-100%)
2% 3% 87% 86% 1% 4% 0% 0% 0% 0%
Most (60-79%)
0% 0% 6% 3% 0% 0% 0% 0% 0% 0%
About Half (40-59%)
1% 1% 2% 2% 1% 1% 0% 0% 0% 0%
Some (20-39%)
5% 3% 1% 2% 2% 1% 0% 1% 1% 1%
A Little (1-20%)
55% 36% 2% 3% 14% 8% 8% 6% 12% 8%
None (0%)
37% 57% 2% 5% 82% 86% 92% 93% 86% 91%
At a Glance: (Primary Locations)
Typical Time Allocation Patient Care: 90%-99% Administration: 1%-9%
Roles Patient Care: 93% Administrative: 2% Education: 1%
Patient Care Hygienists Median Admin Time: 1%-9% Ave. Admin Time: 1%-9%
A typical dental hygienist spends nearly all of her time treating patients. In particular, 93% of dental hygienists fill
a patient care role, defined as spending 60% or more of their time on patient care activities.
Source: Va. Healthcare Workforce Data Center
Source: Va. Healthcare Workforce Data Center
Source: Va. Healthcare Workforce Data Center

17
Patient Workload
A Closer Look:
# of Patients Per Week
Patient Care Visits
Primary Secondary
# % # %
None 201 5% 103 10%
1-24 1,063 27% 676 68%
25-49 2,312 58% 171 17%
50-74 288 7% 31 3%
75-99 42 1% 7 1%
100-124 23 1% 4 0%
125-149 11 0% 5 1%
150-174 3 0% 1 0%
175-199 2 0% 0 0%
200 or More 12 0% 0 0%
Total 3,957 100% 998 100%
At a Glance:
Patient Workload (Median) Primary Location: 25-49 Secondary Location: 1-24
Source: Va. Healthcare Workforce Data Center
Source: Va. Healthcare Workforce Data Center
The typical dental hygienist treated between 25 and 49 patients per week
at her primary work location. For those dental hygienists who also had
a secondary work location, the median workload was between 1 and
24 patients per week.
Source: Va. Healthcare Workforce Data Center
Source: Va. Healthcare Workforce Data Center
Source: Va. Healthcare Workforce Data Center
Source: Va. Healthcare Workforce Data Center

18
Retirement & Future Plans
A Closer Look:
Retirement Expectations
Expected Retirement Age
All Dental Hygienists
Hygienists over 50
# % # %
Under age 50 325 9% - -
50 to 54 407 11% 33 3%
55 to 59 676 18% 127 10%
60 to 64 1,023 27% 408 31%
65 to 69 853 23% 483 37%
70 to 74 222 6% 135 10%
75 to 79 38 1% 28 2%
80 or over 19 1% 9 1%
I do not intend to retire 158 4% 81 6%
Total 3,723 100% 1,304 100%
Future Plans
2 Year Plans: # %
Decrease Participation
Leave Profession 113 2%
Leave Virginia 117 2%
Decrease Patient Care Hours 445 9%
Decrease Teaching Hours 12 0%
Increase Participation
Increase Patient Care Hours 554 12%
Increase Teaching Hours 129 3%
Pursue Additional Education 429 9%
Return to Virginia’s Workforce 47 1%
At a Glance:
Retirement Expectations All Dental Hygienists Under 65: 65% Under 60: 38% Hygienists 50 and over Under 65: 44% Under 60: 12%
Time until Retirement Within 2 years: 5% Within 10 years: 25% Half the workforce: By 2037
At a Glance:
Retirement Expectations All Dentists Under 65: 36% Under 60: 14% Dentists 50 and over Under 65: 19% Under 60: 4%
Time until Retirement Within 2 years: 8% Within 10 years: 28% Half the workforce: by 2034
65% of dental hygienists expect to retire by the age of 65. Among dental hygienists who are already at least age 50, 44% still expect to retire by age 65. More than one-third of dentists expect to retire by
the age of 65, but only 19% of those dentists who are age 50 or over expect to retire by the same age.
Meanwhile, another one-third of all dentists expect to work until at least age 70, including 8% who do not
expect to retire at all.
Within the next two years, 12% of Virginia’s dental hygienists plan on
increasing their patient care activities, and 9% plan on pursuing
additional educational opportunities.
Source: Va. Healthcare Workforce Data Center
Source: Va. Healthcare Workforce Data Center
Source: Va. Healthcare Workforce Data Center
Source: Va. Healthcare Workforce Data Center
Source: Va. Healthcare Workforce Data Center
Source: Va. Healthcare Workforce Data Center

19
Time to Retirement
Expect to retire within. . . # % Cumulative
%
2 years 194 5% 5%
5 years 199 5% 11%
10 years 549 15% 25%
15 years 569 15% 41%
20 years 502 13% 54%
25 years 486 13% 67%
30 years 444 12% 79%
35 years 322 9% 88%
40 years 196 5% 93%
45 years 73 2% 95%
50 years 17 0% 95%
55 years 3 0% 95%
In more than 55 years 11 0% 96%
Do not intend to retire 158 4% 100%
Total 3,723 100%
By comparing retirement expectation to age, we can estimate
the maximum years to retirement for dental hygienists. While only 5% of dental hygienists expect to retire in the next two years, 25% plan on
retiring within the next decade. More than half of the current
workforce expects to retire by 2037.
Using these estimates, retirements will begin to reach over 10% of the current workforce every five years by 2027. Retirements will peak at 15% of the current workforce between 2027 and 2032 before declining to under 10% of the current workforce again around 2052.
Source: Va. Healthcare Workforce Data Center
Source: Va. Healthcare Workforce Data Center
Source: Va. Healthcare Workforce Data Center
Source: Va. Healthcare Workforce Data Center

20
Full-Time Equivalency Units
A Closer Look: 2
2 Due to assumption violations in Mixed between-within ANOVA (Levene’s Test is significant)
Full-Time Equivalency Units
Age Average Median
Age
Under 30 0.67 0.71
30 to 34 0.69 0.74
35 to 39 0.67 0.70
40 to 44 0.63 0.67
45 to 49 0.73 0.70
50 to 54 0.69 0.70
55 to 59 0.69 0.70
60 and Over
0.65 0.61
Gender
Male 0.78 0.91
Female 0.69 0.75
At a Glance:
FTEs Total: 3,148 FTEs/1,000 Residents: 0.376 Average: 0.68
Age & Gender Effect Age, Partial Eta2: Negligible Gender, Partial Eta2: Negligible
Partial Eta2 Explained: Partial Eta2 is a statistical
measure of effect size.
The typical dental hygienist provided 0.69 FTEs in the past year, or approximately 28 hours per week for 50 weeks. Although FTEs appear to
vary by gender, statistical tests did not verify a difference exists.2
The typical (median) dentist provided 0.86 FTEs in 2012, or approximately 33 hours per week for 52 weeks. Although FTEs appear to vary by age and gender, statistical tests did not verify a difference exists.2
Source: Va. Healthcare Workforce Data Center
Source: Va. Healthcare Workforce Data Center
Source: Va. Healthcare Workforce Data Center
Source: Va. Healthcare Workforce Data Center
Source: Va. Healthcare Workforce Data Center
Source: Va. Healthcare Workforce Data Center
Source: Va. Healthcare Workforce Data Center
Source: Va. Healthcare Workforce Data Center

21
Maps
Council on Virginia’s Future Regions
22
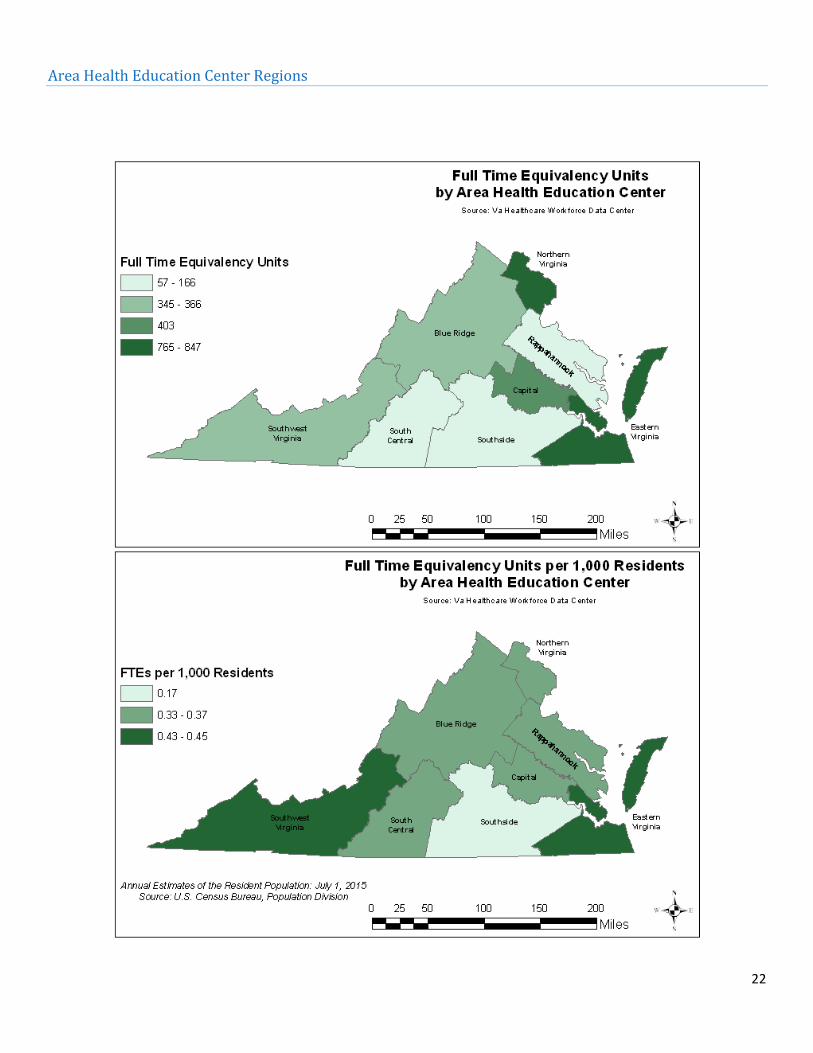
Area Health Education Center Regions

23
Workforce Investment Areas

24
Health Services Areas

25
Planning Districts
26
Appendices
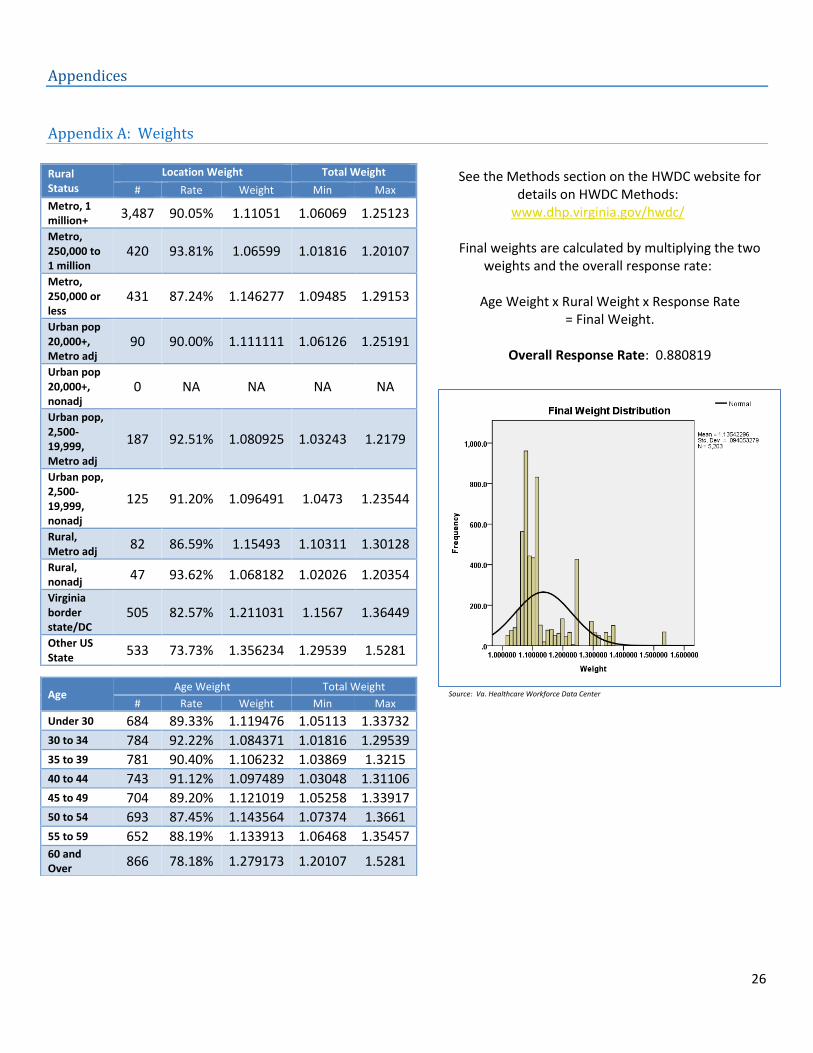
Appendix A: Weights
See the Methods section on the HWDC website for
details on HWDC Methods: www.dhp.virginia.gov/hwdc/
Final weights are calculated by multiplying the two
weights and the overall response rate:
Age Weight x Rural Weight x Response Rate = Final Weight.
Overall Response Rate: 0.880819
Rural Status
Location Weight Total Weight
# Rate Weight Min Max
Metro, 1 million+
3,487 90.05% 1.11051 1.06069 1.25123
Metro, 250,000 to 1 million
420 93.81% 1.06599 1.01816 1.20107
Metro, 250,000 or less
431 87.24% 1.146277 1.09485 1.29153
Urban pop 20,000+, Metro adj
90 90.00% 1.111111 1.06126 1.25191
Urban pop 20,000+, nonadj
0 NA NA NA NA
Urban pop, 2,500-19,999, Metro adj
187 92.51% 1.080925 1.03243 1.2179
Urban pop, 2,500-19,999, nonadj
125 91.20% 1.096491 1.0473 1.23544
Rural, Metro adj
82 86.59% 1.15493 1.10311 1.30128
Rural, nonadj
47 93.62% 1.068182 1.02026 1.20354
Virginia border state/DC
505 82.57% 1.211031 1.1567 1.36449
Other US State
533 73.73% 1.356234 1.29539 1.5281
Age Age Weight Total Weight
# Rate Weight Min Max
Under 30 684 89.33% 1.119476 1.05113 1.33732 30 to 34 784 92.22% 1.084371 1.01816 1.29539
35 to 39 781 90.40% 1.106232 1.03869 1.3215
40 to 44 743 91.12% 1.097489 1.03048 1.31106 45 to 49 704 89.20% 1.121019 1.05258 1.33917 50 to 54 693 87.45% 1.143564 1.07374 1.3661
55 to 59 652 88.19% 1.133913 1.06468 1.35457 60 and Over
866 78.18% 1.279173 1.20107 1.5281
Source: Va. Healthcare Workforce Data Center
Source: Va. Healthcare Workforce Data Center