The Sci-Bono Discovery Centre is registered as AR 2011... · The Sci-Bono Discovery Centre ... who...
32
The Sci-Bono Discovery Centre Annual Report 2011/2012 Sci-Bono Discovery Centre PO Box 61882, Marshalltown, 2107 Corner President and Miriam Makeba Street Newtown, Johannesburg 011 639 8400 www.sci-bono.co.za Follow us on Twitter @scibono or join Facebook/scibono01 The Sci-Bono Discovery Centre is registered as a not-for-profit company in terms of Section 21 of the Companies Act 71 of 2008 (Registration: 2004/010183/08) and is registered as a Public Benefit Organisation in terms of Section 30 of the Income Tax Act 58 of 1962 (PBO reference number 930014449). Sci-Bono is approved in terms of Section 18A of the Income Tax Act 58 of 1962 and is registered as a non-profit organisation (Registration: 056-334-NPO).
Transcript of The Sci-Bono Discovery Centre is registered as AR 2011... · The Sci-Bono Discovery Centre ... who...

The Sci-Bono Discovery CentreAnnual Report 2011/2012
Sci-Bono Discovery CentrePO Box 61882, Marshalltown, 2107Corner President and Miriam Makeba StreetNewtown, Johannesburg 011 639 8400
www.sci-bono.co.za Follow us on Twitter @scibono or join Facebook/scibono01
The Sci-Bono Discovery Centre is registered as a not-for-profit company in terms of Section 21 of the Companies Act 71 of 2008 (Registration: 2004/010183/08) and is registered as a Public Benefit Organisation in terms of Section 30 of the Income Tax Act 58 of 1962 (PBO reference number 930014449). Sci-Bono is approved in terms of Section 18A of the Income Tax Act 58 of 1962 and is registered as a non-profit organisation (Registration: 056-334-NPO).

Sci-Bono Discovery Centre Annual Report 2011/2012 - Discover Science 1Sci-Bono Discovery Centre Annual Report 2011/2012 - Discover Science
Vision and Goals
Sci-Bono envisions a society with the capacity
to compete in the global world of science and
technology, a society equipped with the skills,
attitudes and values needed to improve the quality
of life of all South Africans. Sci-Bono works towards
achieving this vision through the following goals:
• Improving the teaching and learning of mathematics,
science and technology in Gauteng schools
• Providing career education to all learners in Gauteng
• Promoting and improving public awareness of and
engagement with science, engineering and technology
To achieve these goals, Sci-Bono offers a wide range
of annual programmes, workshops and exhibitions for
learners, teachers and the general public, at its facilities in
Newtown and through an extensive outreach programme in
schools throughout Gauteng.
Message from the MEC 2
Chairperson’s Report 3
CEO’s Report 4
An Overview of Sci-Bono 6
Activities and Performance 8
Teacher Development 18
Corporate Services 20
Corporate Governance 22
Annual Financial Statements 27
Directors’ Responsibilities and Approval 29
Independent Auditors’ Report 30
Directors’ Report 32
Statement of Financial Position 34
Statement of Comprehensive Income 35
Statement of Changes In Equity 36
Statement of Cash Flows 37
Accounting Policies 38
Notes to the Annual Financial Statements 42
The following supplementary information does not form part of the Annual Financial Statements and is unaudited:
Detailed Income Statement 57
Supplementary Information 59
Contents

Sci-Bono Discovery Centre Annual Report 2011/2012 - Discover Science Sci-Bono Discovery Centre Annual Report 2011/2012 - Discover Science2 3
Message from the MEC
MEC CommentThe improvement of education remains one of government’s main priorities and the Gauteng Department of Education (GDE) has embarked on a number of important educational initiatives that aim to achieve national and provincial goals, including in the areas of mathematics, science and technology.
The GDE embarked on two key interventions in 2010: the Gauteng Primary Literacy Strategy (GPLS) and the Senior Secondary Intervention Programme (SSIP).
The GPLS focused initially on the improvement of teaching and learning in Grades 1 to 3, the critical foundation years of schooling. During the year we expanded the focus to include the improvement of teaching and learning in the area of numeracy.
Sci-Bono was asked to assist us in this area. The project has made good progress and has expanded in 2012 into the Gauteng Primary Language and Mathematics Strategy that will seek to improve the quality of education throughout the primary school system, particularly in our priority schools. I look forward to seeing Sci-Bono play a role, as part of the team that includes staff in the GDE and in higher education, and our other partners, who must work together as an integrated and effective unit to tackle this important task.
There is little doubt that SSIP contributed to the improvement of the Grade 12 pass rate at the end of 2010, and again in 2011. In 2011, we saw SSIP support thousands of Grade 12 learners who have enthusiastically praised the support provided through the project. Sci-Bono was asked to help manage the project and, together with the district implementation teams in Gauteng’s 15 districts, and various GDE head office officials, we were able to run this large-scale intervention successfully.
In 2012, we also expanded this programme, and we look to the new SSIP to contribute to further achievement in teaching and learning, particularly in our priority high schools. I would like to record our thanks to Sci-Bono for working with us as our partner in this project and for its contribution to the success of SSIP 2011.
The GDE recognises the contribution of its strategic partners, including Sci-Bono, to the delivery of effective education. Together we have important work to do and I am sure that we will continue to achieve important goals. I would like to thank the Board of Directors and the staff of Sci-Bono for their continued support and for their commitment to being part of the provincial team, led by GDE, that will take on the difficult challenges that face us in education during the next few years.
The past year has seen a dramatic increase in the commodification of education in the province. More low-fee private schools are emerging and the phenomenonhas been documented in various research findings. Results these schools are producing appear to be higher than average for learners in public schools. It has also been asserted that many of the teachers have better training but are teaching illegally.A further conclusion also claims that parents are more involved and are demanding an improved quality of education.It would appear that paying for schooling plays a significant role, making principals and educators more accountable to parents and school governing bodies.
That South Africa needs an improved public education system is acknowledged by all education stakeholders.How and at what price to achieve this are the questions which remain unanswered.International research shows that a good teacher trumps all other factors such as socio-economic status, class size, curriculum design, parents, education levels, school facilities, etc. Countries are increasingly conscious that low or lagging performance in mathematics and science education is a dire threat to their competitiveness and innovation potential.
To this end Sci-Bono remains a flagship project innovating mathematics and science education. Following the matriculation results in 2011, the Board has also charged management to examine the role of language in education. A partnership has been developed with several organisations to explore this at a conceptual level before making recommendations.
In reviewing its strategic direction, the Board has also agreed to more closely monitor obligations that Sci-Bono will undertake in the future, accompanied by the necessary staff and financial resources required for such obligations.
The Board has been strengthened in various technical areas. However, the resignation of Board members and the induction of new members remains a priority. Board renewal therefore remains a high priority. Given legislative changes, the Board has also undertaken an exercise to review the founding Articles and Memorandum of Association into a new Memorandum of Incorporation by the next annual general meeting in 2012.
The Board recognises that it remains largely dependent on the Gauteng Education Department for the funding of its operations.However, it is not likely in the foreseeable future that Sci-Bono can become an independent non-profit centre.
Barbara CreecyMember of the Executive CouncilGauteng Department of Education
Chairperson’s Report
The Board, after much deliberation, also agreed to and succeeded in obtaining a loan from the Development Bank of Southern Africa to complete its building project. Whilst ambitious, this new building will provide much-needed additional office, meeting and exhibition space to an already stretched facility.
Sci-Bono has been the recipient of support from many corporates, donors and professional associations, all of whom are acknowledged in this report.
The management and staff have excelled at many innovations and activities, and deserve acknowledgement and gratitude as Sci-Bono remains a destination of choice for Gauteng’s parents and children.
I owe deep gratitude to my fellow Board members for their sage but pragmatic advice.
Phiroshaw CamayChairperson

Sci-Bono Discovery Centre Annual Report 2011/2012 - Discover Science 5Sci-Bono Discovery Centre Annual Report 2011/2012 - Discover Science4
learners’ catering. Nevertheless, the strong cooperation between Sci-Bono, GDE and its district offices allowed the programme to achieve success. I believe that SSIP contributed to the improvement in the matric pass rate at the end of 2011.
Sci-Bono has also become involved in the Gauteng Primary Literacy and Numeracy Strategy (GPLNS) and has deployed two specialists to the GPLNS team. All education needs a strong foundation, and a solid educational base is probably the most important gift we can give a child. The GPLNS will have an impact on the future effectiveness of the entire school system.
These developments have imposed a heavy workload on our staff, many of whom have had to endure long days, seven-day working weeks, and levels of pressure and stress that our colleagues in most science centres would find unusual. I would like to express my gratitude to, pride in and admiration for my Sci-Bono colleagues, who together make this organisation an example of what a science centre can achieve.
Our constant evolution has necessitated a much heavier governance burden on the Board of Directors, which has had to oversee not only an organisation that continues to grow every year, but to ensure compliance with new and demanding corporate governance requirements. I would like to thank Sci-Bono’s chairperson for the considerable effort he commits to the organisation and to the members of the board, who, collectively and individually, have added so much value over the year.
Sci-Bono continues to occupy an important space in human resource development, between formal schooling on the one hand, and the world of work in science, engineering and technology (SET) on the other. We would achieve little without the cooperation of our colleagues in the schools and offices of the GDE or without the enthusiastic involvement and support of our friends in industry, community development, higher education and the national SET community. We share a commitment to our children and the youth of South Africa to provide the education, training and development opportunities they have a right to. We look forward to working together over the next year to give substance to that commitment.
The installation of the world famous Dialogue in the Dark experience, the first on the African continent, drew much public support. Sci-Bono is now one of the most successful leisure destinations for the public of Johannesburg and Gauteng. Sci-Bono’s outreach programmes to schools in disadvantaged communities have grown significantly, and the outreach team that worked with just over 48 000 learners in 2010, worked with more than 109 000 learners in 2011.
The increase in the scale of operations has inevitably had its challenges and we have had to pay careful attention to quality assurance, productivity and programme management. We have identified a need to improve staff training and have also initiated a stronger monitoring and evaluation process that will assist Sci-Bono to begin to measure its impact more accurately in future.
Sci-Bono’s strong relationship with the GDE has seen the organisation contributing to the efforts to improve schooling throughout the province. During 2011, the GDE again asked Sci-Bono to manage its flagship Senior Secondary Improvement Programme (SSIP). The programme was expanded to include Grade 10 and 11 and this led to the participation of about 130 000 learners.
Sci-Bono’s SSIP office was hard-pressed to cope with the administrative workload that includes the management of thousands of part-time tutors, the printing and distribution of millions of pages of educational resources, and the management of logistics including bus transport and
CEO’s ReportThe past year has again been one that has stretched Sci-Bono and its staff and taken us into new areas of activity in the two areas of engagement that most define Sci-Bono: firstly, Sci-Bono’s role as South Africa’s flagship science centre and, secondly, the organisation’s important role as a strategic partner of the Gauteng Department of Education (GDE). The extent of the increase in operational levels is indicated by a 97% increase in Sci-Bono’s annual budget, and more than doubling its total staff complement, from 110 staff members in 2010 to 232 in 2011.
Sci-Bono’s science centre operations have continued to grow and we saw our 2011 visitor numbers increase by 18.5% on the 2010 total, from 161 000 to 191 000. (Since opening our doors in April 2004, we have seen a growth of 707% in visitor numbers.) During this last year, we have grown Sci-Bono’s collection of science and technology exhibits and exhibitions, and have seen a particularly strong growth in the number and quality of our science, mathematics, technology and career education programmes.
As our range of activities and events has grown, we have seen an increase in public interest and support.
David KramerChief Executive Officer
CEO’s Report

Sci-Bono Discovery Centre Annual Report 2011/2012 - Discover Science 7Sci-Bono Discovery Centre Annual Report 2011/2012 - Discover Science6
An Overview of Sci-Bono
Sci-Bono staff structure
Chief Executive Officer
Chief Operating Officer
Director School Support Director Teacher Development Director Corporate Services
Snr Manager Exhibitory
Science Centre
Manager
BHP Career Centre
ManagerSnr Manager School Support Manager
ICT Centre Snr Manager
Teacher Development Snr
Manager Finance
Snr Manager
Marketing
Snr Manager Facilities
Manager School Support
Admin Manager School Support
Project Accountant
Manager Teacher Development
Manager Finance
Events Coordinator
ManagerHR Manager
Snr Technician
Snr Programme
OfficerPsychologist
Snr Programme
OfficerMarketing Assistant
Technician Programme Officer
Programme Facilitator
Snr Programme Officer
Outreach Teachers ICT Programme Officer Programme Officer Snr
BookkeeperGraphic
DesignerFacilities/ IT
Officer HR Officer
Bookings Clerk
Team Leader
Programme Officers Bookkeeper
Science Communicator ICT Trainer
Exhibitry Assistant Admin Clerk Admin Admin Clerk Gen. Admin
Clerk Reception/
CashierFacilities/
IT AssPayroll/ HR
Admin
Housekeeping
IntroductionSci-Bono is South Africa’s premier science centre. It supports maths, science and technology (MST) education and offers innovative, dynamic learning experiences that contribute to building South Africa’s science, engineering and technology capacity. Located in the cultural heartland of Newtown, Johannesburg, the centre houses a collection of a few hundred interactive MST exhibits and exhibitions.
Initiated by the Gauteng Department of Education (GDE) and the private sector in 2004, the centre is currently responsible for leading the Gauteng Mathematics, Science and Technology Strategy for the GDE, and receives annual funding for its mandated operations. Sci-Bono operations are governed by a long-term memorandum of agreement.
Sci-Bono has strong relationships with industry stakeholders and international governments that provide both programmatic support and funding for specific projects.
Sci-Bono has grown to become one of the most popular leisure and educational destinations in Gauteng and is open to schools and the public seven days a week.
Sci-Bono Discovery Centre Annual Report 2011/2012 - Discover Science Sci-Bono Discovery Centre Annual Report 2011/2012 - Discover Science8 9
Foundation Phase Week
Primary Maths Week
Early Childhood Development Week
ICT Week
Engineering Week
Finance Week
A total of 37 692 learners and 1 010 teachers participated in these events. All the events were planned and run in partnership with the relevant professional associations, interest groups and associations, companies, state departments and agencies, research councils, universities and individual scientists. Sci-Bono is grateful for their involvement, without which we would not have been able to run these programmes.
Mathematics, Science and Technology Shows2011 was the International Year of Chemistry and so Sci-Bono aligned its programme of daily science shows to that theme. We were fortunate to be able to host a few
Science Centre ProgrammesSci-Bono offers visitors to its centre in Newtown a wide range of exciting and intriguing science and technology experiences, programmes, events and activities. Most of these are offered to learners from schools. During the review period, Sci-Bono ran the following programmes:
Industry Focus Weeks These events aim to inform and educate young people about the working of various sectors of the economy, and to promote awareness of the work and study opportunities in those sectors. In 2011 the science centre and the BHP Billiton Career Centre ran the following weeks:
Understanding Climate Change
Aviation Week
Health Sciences Week
National Science Week
Earth Sciences Week
Science Festival Week
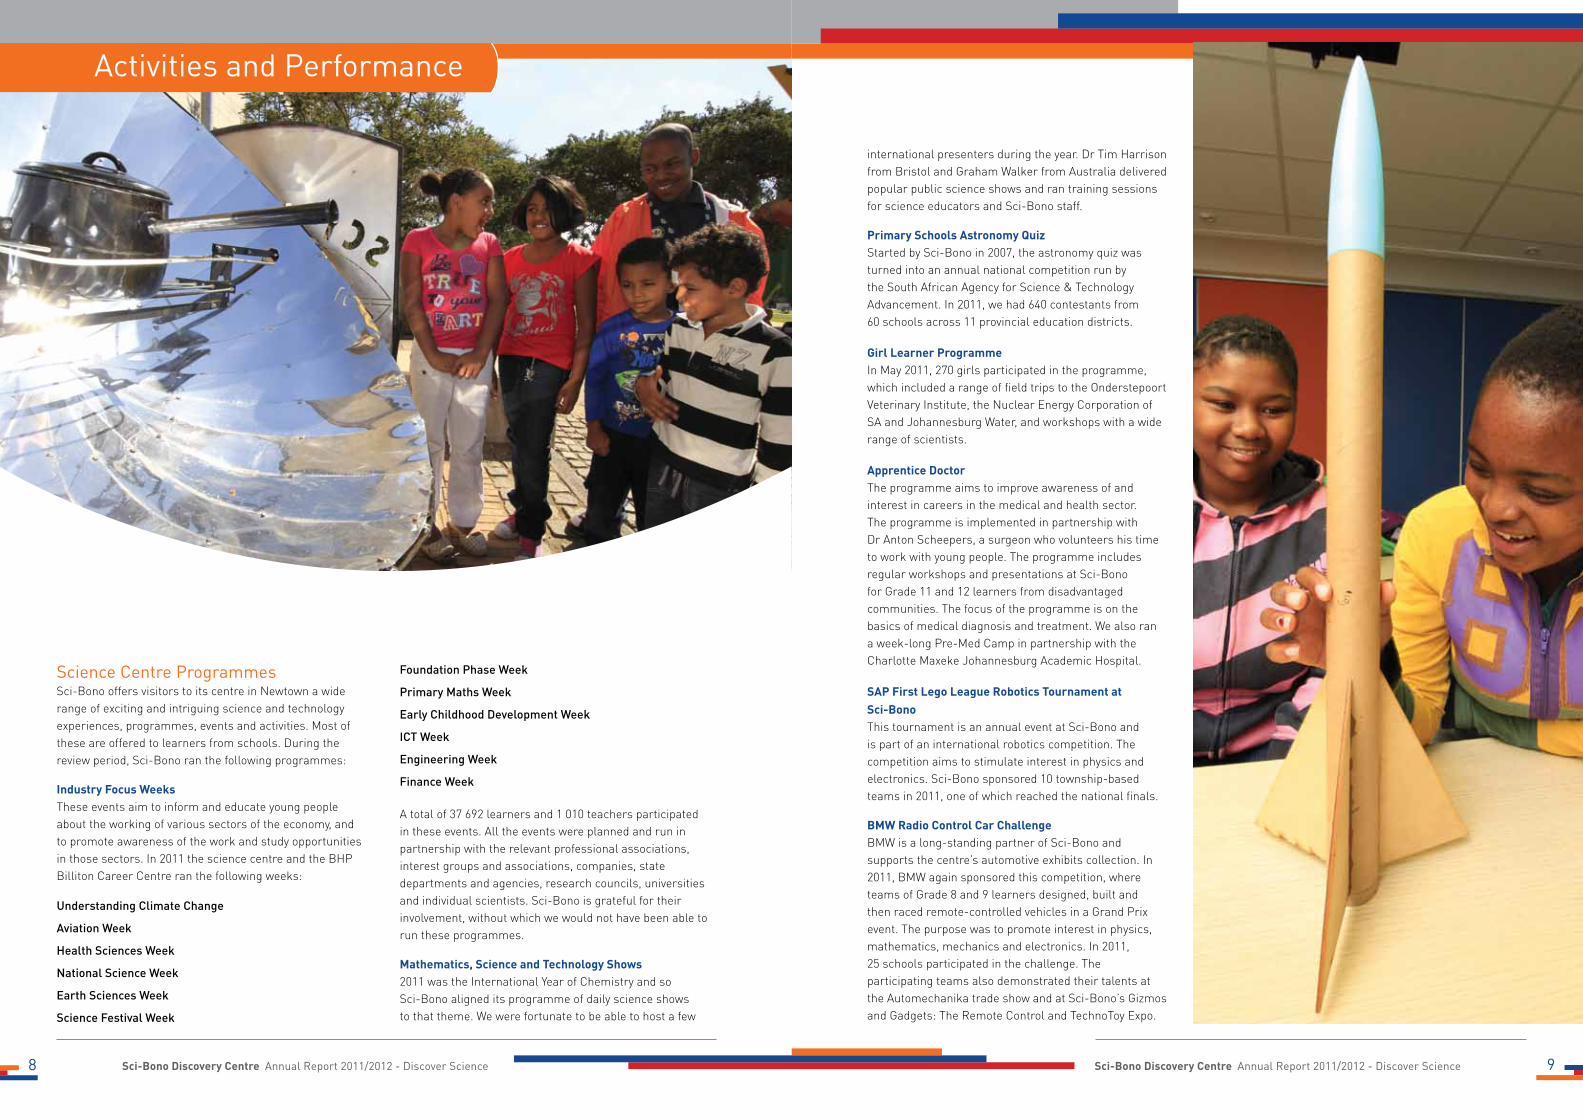
international presenters during the year. Dr Tim Harrison from Bristol and Graham Walker from Australia delivered popular public science shows and ran training sessions for science educators and Sci-Bono staff.
Primary Schools Astronomy Quiz Started by Sci-Bono in 2007, the astronomy quiz was turned into an annual national competition run by the South African Agency for Science & Technology Advancement. In 2011, we had 640 contestants from 60 schools across 11 provincial education districts.
Girl Learner ProgrammeIn May 2011, 270 girls participated in the programme, which included a range of field trips to the Onderstepoort Veterinary Institute, the Nuclear Energy Corporation of SA and Johannesburg Water, and workshops with a wide range of scientists.
Apprentice DoctorThe programme aims to improve awareness of and interest in careers in the medical and health sector. The programme is implemented in partnership with Dr Anton Scheepers, a surgeon who volunteers his time to work with young people. The programme includes regular workshops and presentations at Sci-Bono for Grade 11 and 12 learners from disadvantaged communities. The focus of the programme is on the basics of medical diagnosis and treatment. We also ran a week-long Pre-Med Camp in partnership with the Charlotte Maxeke Johannesburg Academic Hospital.
SAP First Lego League Robotics Tournament at Sci-BonoThis tournament is an annual event at Sci-Bono and is part of an international robotics competition. The competition aims to stimulate interest in physics and electronics. Sci-Bono sponsored 10 township-based teams in 2011, one of which reached the national finals.
BMW Radio Control Car ChallengeBMW is a long-standing partner of Sci-Bono and supports the centre’s automotive exhibits collection. In 2011, BMW again sponsored this competition, where teams of Grade 8 and 9 learners designed, built and then raced remote-controlled vehicles in a Grand Prix event. The purpose was to promote interest in physics, mathematics, mechanics and electronics. In 2011, 25 schools participated in the challenge. The participating teams also demonstrated their talents at the Automechanika trade show and at Sci-Bono’s Gizmos and Gadgets: The Remote Control and TechnoToy Expo.
Activities and Performance
Sci-Bono Discovery Centre Annual Report 2011/2012 - Discover Science 11
MinquizMinquiz is an annual science quiz run by Mintek for Grade 12 learners. Sci-Bono hosted the regional competitions and the national finals in 2011 with 53 competing teams.
Rocketry WorkshopsSci-Bono offers workshops for Grade 10 to 12 learners on the science of rocketry. The courses each run for five days and involve between 16 and 20 learners per course. The activity is run by qualified rocketeers and incorporates mathematics and physical science into the building of a miniature rocket. Many of the rockets built by participants reached an altitude of over 800m.
Speak2aScientist Sci-Bono’s public engagement with science programme Speak2aScientist has become increasingly popular, with 596 people attending the nine events in 2011. The programme is regularly used by the media as a reference point for science information.
Holiday Programmes Sci-Bono offers holiday activities during each school holiday. The programmes are offered mainly to children in orphanages, shelters and children’s homes and to those in local housing estates. The programmes include science and technology workshops as well as activities such as dance, drama and first aid training. We were supported by partners such as the Vuyani Dance Theatre and the City Year project. In 2011, 2 272 children participated in the programmes.
Musical ScienceSci-Bono regularly hosts the Johannesburg Philharmonic Orchestra, which presents a popular programme for primary school learners that looks at how the instruments in the orchestra work, and at the science of music composition and performance.
Birthday Parties Children’s birthday parties at Sci-Bono have become increasingly popular. In 2011, we hosted 8 634 visitors who attended birthday parties at the centre.
Gizmos and Gadgets: The Remote Control & TechnoToy ExpoThe annual family expo was attended by 1 000 families who participated in a variety of hands-on workshops and demonstrations, as well as a wide range of exhibitions. The programme was run in partnership with the N Gauge Guild and the Model Train Association.
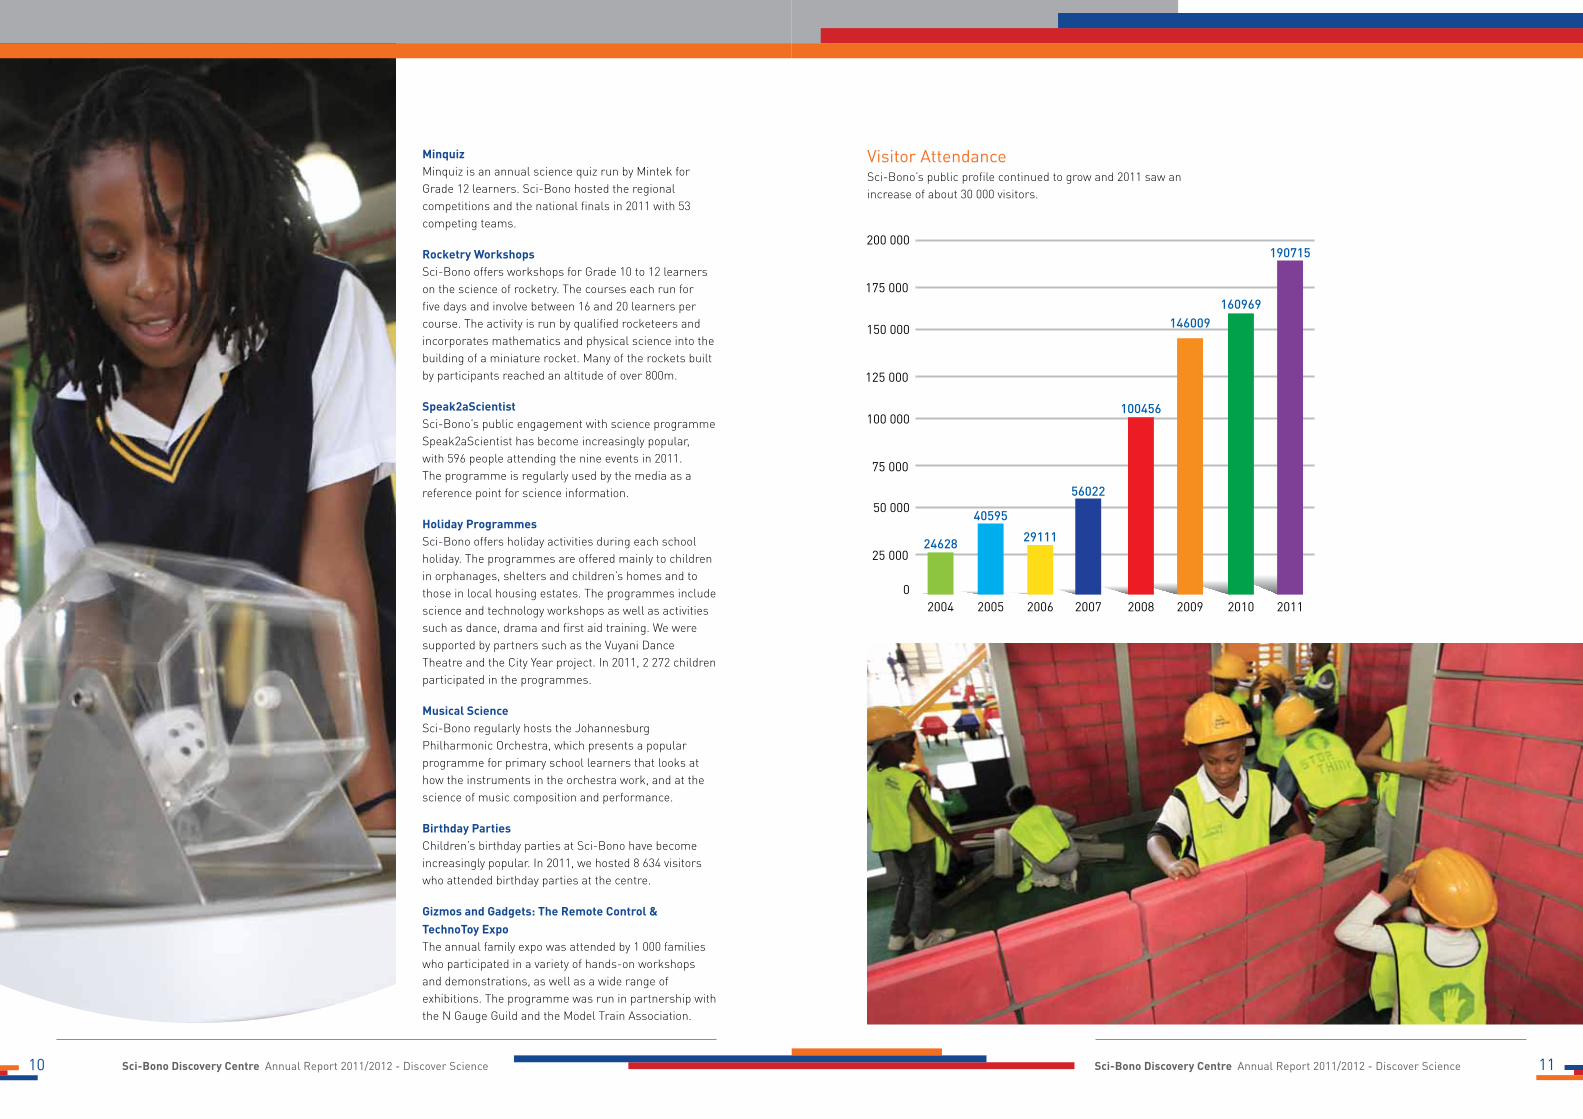
24628
40595
29111
56022
100456
160969146009
190715
2004 2005 2006 2007 2008 2009 2010 2011
200 000
150 000
100 000
50 000
175 000
125 000
75 000
25 000
0
Visitor AttendanceSci-Bono’s public profile continued to grow and 2011 saw an increase of about 30 000 visitors.
Sci-Bono Discovery Centre Annual Report 2011/2012 - Discover Science10
Sci-Bono Discovery Centre Annual Report 2011/2012 - Discover Science Sci-Bono Discovery Centre Annual Report 2011/2012 - Discover Science12 13
Exhibitry and ExhibitionsSci-Bono continues to offer a broad collection of interactive science and technology exhibitions and exhibits. By the end of the reporting period, Sci-Bono’s collection consisted of 333 permanent exhibits, almost all manufactured locally. The centre’s exhibitry policy is to offer exhibits that support the school curriculum and are also entertaining and intriguing enough to stimulate interest in science, mathematics and technology.
The Exhibitry Department has three highly experienced technicians and two technical specialists. This is a highly specialised field and the department is still looking for an exhibit technician with electrical and electronics expertise. This team has been able to keep the level of unserviceable exhibits well below the target of 8%. The department has now opened a new carpentry section that will greatly improve its in-house maintenance capacity.
Dialogue in the Dark installation; this unique space, which offers visitors the chance to experience the world as a blind person, is an internationally successful exhibition that was installed in Africa for the first time. The exhibition has been mounted in partnership with the South African National
The programme provides tuition to Grade 11 and 12 learners in 25 high schools, which are mainly rural and farm schools. The programme also provides learners with the opportunity to conduct curriculum-required experiments and investigations.
As part of the 2011 International Year of Chemistry, we were able to provide additional books and resources to the schools through a generous sponsorship from the Royal Society for Chemistry. The programme supported 41 959 learners in 2011. There is improvement in the matric results in some but not all of the client schools. While some schools have shown improvement in the quality of their passes, there is insufficient evidence to claim that the programme has had a positive impact in all the treated schools.
The Emasondosondo Primary Science, Mathematics and Technology ProjectThe programme targeted the feeder primary schools to those schools in the high school programme, and involved demonstrating teaching methods and resources to teachers, and stimulating learners’ interest and mastery of critical concepts in maths, science and technology learning. The team worked with 55 945 learners in 25 schools in 2011.
The SASRIA Mathematics Outreach ProgrammeThe Mathematics Outreach programme, funded by the South African Special Risks Insurance Association, targeted 10 high schools. The aim of the project is to improve learner achievement levels in maths in the project schools. The project started in August 2011 and so ran for only a short time before the start of the exam preparation period at the end of the year. The four schools that received most support during the period all showed improved maths results but it is not clear that this was as a result of the support provided. It is concerning that the schools had fewer maths candidates in 2011 than in 2010; this might be linked to their improved results. The programme continues in 2012.
merSETA Technology ProjectSci-Bono and merSETA have implemented a project to support skills development and technical education in Gauteng schools. The partnership has included the provision of technology kits and teacher training to 40 high schools in Gauteng. The project also allowed learners from those schools to interact with artisans and other role models at the Automechanika trade show in 2011.
Amateur Radio Portfolio ProjectThis project was initiated in 2009 by Sci-Bono, the South African Radio League and GDE, to enhance learners’ understanding of and performance in electrical technology.
Council for the Blind, with support from the National Lottery and Standard Bank. It was constructed by Sci-Bono’s technical team. The project created jobs for a group of eight blind and partially sighted guides.
During 2011, Sci-Bono’s exhibitry team worked with industrial design students at the University of the Witwatersrand to design prototype science exhibits as part of their studies. We have selected two of their proposals for new mining exhibits, which we will manufacture with support from the South African Institute of Mining and Metallurgy. With the generous support of BMW South Africa, we have replaced the old demonstration vehicle with a new Series 3 vehicle.
The Exhibitry Department continues to review and upgrade all educational signage for the exhibits collection. This project will be completed towards the end of 2012. We have also been offered further support from our partner science centre in France, and the French embassy, to replicate a chemistry exhibition. This will be installed in late 2012.
Outreach ProgrammesThe Emasondosondo Mobile Science LaboratoryThe programme is sponsored by the Royal Society of Chemistry and the Department of Science and Technology.
The project was piloted in 25 schools in 2010, but did not continue in 2011. There are plans to resuscitate the programme in 2012.
Automechanika Trade ShowSci-Bono partnered with merSETA and participated in the Automechanika trade show at Nasrec from 9 to 12 March 2011. The purpose was to contribute to the national and provincial economic development by helping to strengthen the science, engineering and human resource pool in South Africa, and in Gauteng province in particular. The partnership resulted in learners from 40 technical high schools gaining exposure to artisan career opportunities.
Outreach 2011The School Support Outreach programme reached a total of 109 240 learners
Outreach Programmes Learners
Learning Channel Attendance 7 410
Outreach GET 55 945
Outreach FET 41 959
SASRIA Tuition 3 926
TOTAL 109 240
Sci-Bono Discovery Centre Annual Report 2011/2012 - Discover Science Sci-Bono Discovery Centre Annual Report 2011/2012 - Discover Science14 15
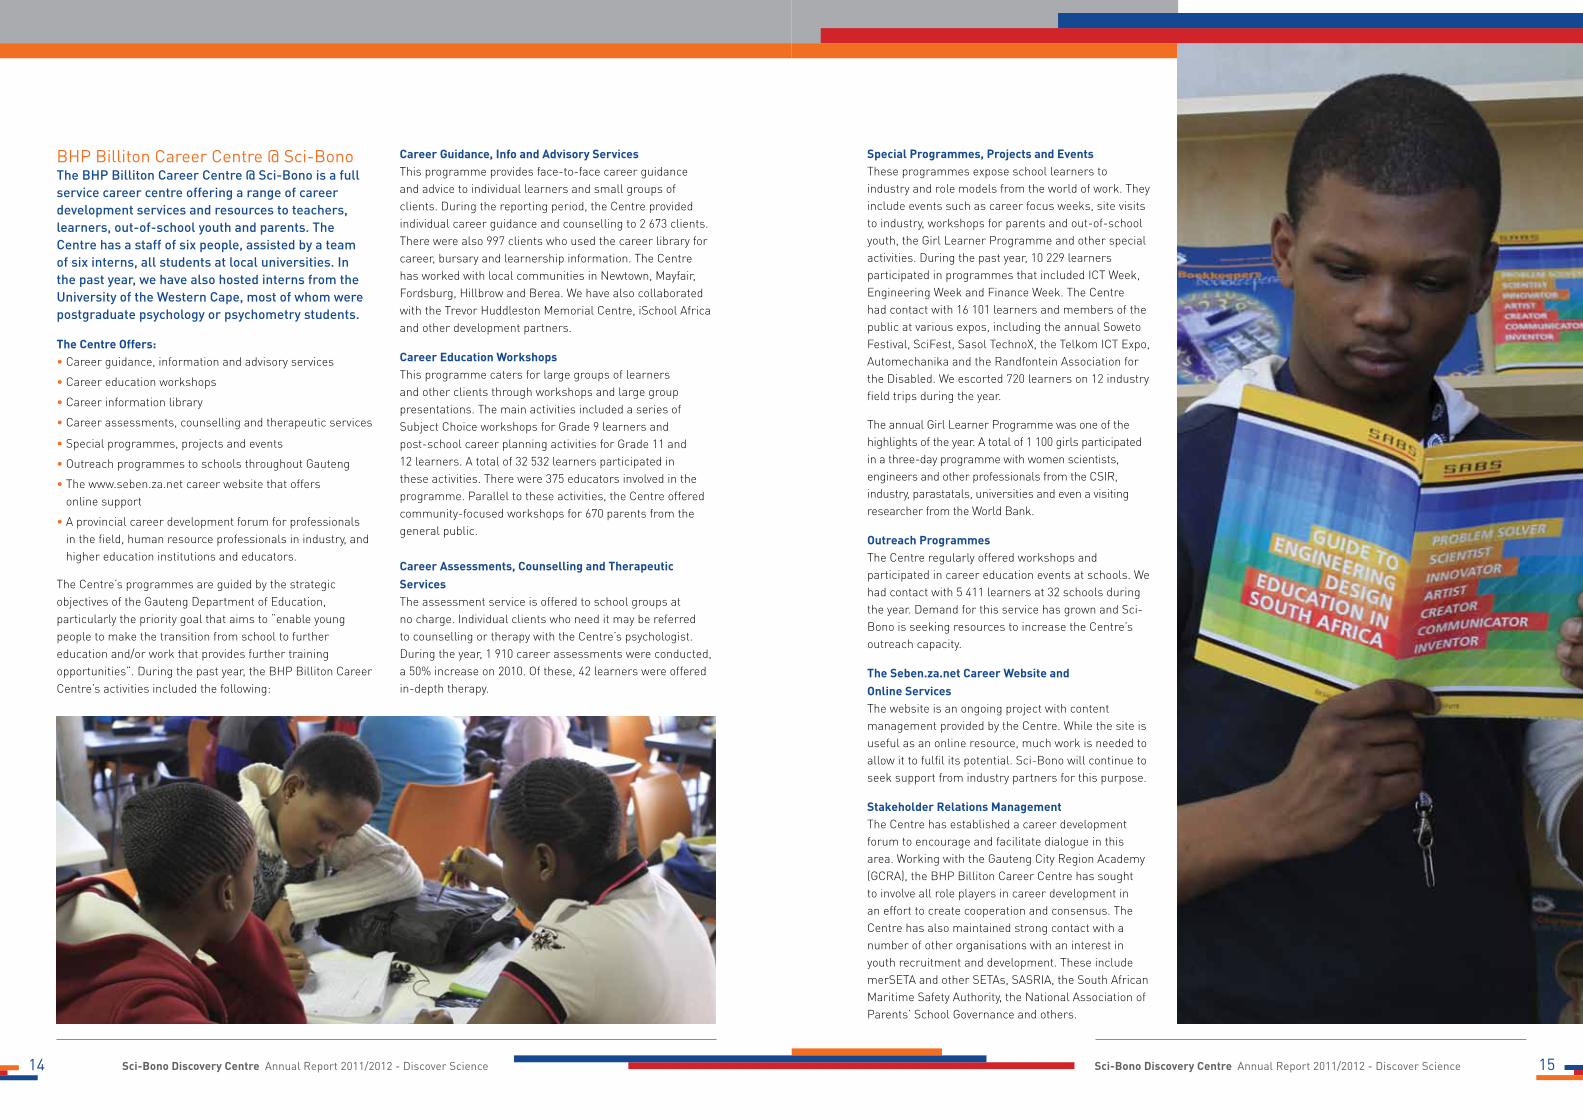
BHP Billiton Career Centre @ Sci-BonoThe BHP Billiton Career Centre @ Sci-Bono is a full service career centre offering a range of career development services and resources to teachers, learners, out-of-school youth and parents. The Centre has a staff of six people, assisted by a team of six interns, all students at local universities. In the past year, we have also hosted interns from the University of the Western Cape, most of whom were postgraduate psychology or psychometry students.
The Centre Offers: • Career guidance, information and advisory services
• Career education workshops
• Career information library
• Career assessments, counselling and therapeutic services
• Special programmes, projects and events
• Outreach programmes to schools throughout Gauteng
• The www.seben.za.net career website that offers online support
• A provincial career development forum for professionals in the field, human resource professionals in industry, and higher education institutions and educators.
The Centre’s programmes are guided by the strategic objectives of the Gauteng Department of Education, particularly the priority goal that aims to “enable young people to make the transition from school to further education and/or work that provides further training opportunities”. During the past year, the BHP Billiton Career Centre’s activities included the following:
Career Guidance, Info and Advisory ServicesThis programme provides face-to-face career guidance and advice to individual learners and small groups of clients. During the reporting period, the Centre provided individual career guidance and counselling to 2 673 clients. There were also 997 clients who used the career library for career, bursary and learnership information. The Centre has worked with local communities in Newtown, Mayfair, Fordsburg, Hillbrow and Berea. We have also collaborated with the Trevor Huddleston Memorial Centre, iSchool Africa and other development partners.
Career Education WorkshopsThis programme caters for large groups of learners and other clients through workshops and large group presentations. The main activities included a series of Subject Choice workshops for Grade 9 learners and post-school career planning activities for Grade 11 and 12 learners. A total of 32 532 learners participated in these activities. There were 375 educators involved in the programme. Parallel to these activities, the Centre offered community-focused workshops for 670 parents from the general public.
Career Assessments, Counselling and Therapeutic ServicesThe assessment service is offered to school groups at no charge. Individual clients who need it may be referred to counselling or therapy with the Centre’s psychologist. During the year, 1 910 career assessments were conducted, a 50% increase on 2010. Of these, 42 learners were offered in-depth therapy.
Special Programmes, Projects and EventsThese programmes expose school learners to industry and role models from the world of work. They include events such as career focus weeks, site visits to industry, workshops for parents and out-of-school youth, the Girl Learner Programme and other special activities. During the past year, 10 229 learners participated in programmes that included ICT Week, Engineering Week and Finance Week. The Centre had contact with 16 101 learners and members of the public at various expos, including the annual Soweto Festival, SciFest, Sasol TechnoX, the Telkom ICT Expo, Automechanika and the Randfontein Association for the Disabled. We escorted 720 learners on 12 industry field trips during the year.
The annual Girl Learner Programme was one of the highlights of the year. A total of 1 100 girls participated in a three-day programme with women scientists, engineers and other professionals from the CSIR, industry, parastatals, universities and even a visiting researcher from the World Bank.
Outreach ProgrammesThe Centre regularly offered workshops and participated in career education events at schools. We had contact with 5 411 learners at 32 schools during the year. Demand for this service has grown and Sci-Bono is seeking resources to increase the Centre’s outreach capacity.
The Seben.za.net Career Website and Online ServicesThe website is an ongoing project with content management provided by the Centre. While the site is useful as an online resource, much work is needed to allow it to fulfil its potential. Sci-Bono will continue to seek support from industry partners for this purpose.
Stakeholder Relations ManagementThe Centre has established a career development forum to encourage and facilitate dialogue in this area. Working with the Gauteng City Region Academy (GCRA), the BHP Billiton Career Centre has sought to involve all role players in career development in an effort to create cooperation and consensus. The Centre has also maintained strong contact with a number of other organisations with an interest in youth recruitment and development. These include merSETA and other SETAs, SASRIA, the South African Maritime Safety Authority, the National Association of Parents’ School Governance and others.
Sci-Bono Discovery Centre Annual Report 2011/2012 - Discover Science Sci-Bono Discovery Centre Annual Report 2011/2012 - Discover Science16 17
CEO’s Report
been emphatic about the programme’s influence on their improved achievement.
Relief Teacher ProgrammeSci-Bono has a database of about 250 trained teachers who have been deployed to relieve teachers invited to attend 15-day intensive training courses. Relief teachers have also been deployed to schools without maths and science teachers, or to schools where the permanent teachers need to be away for various reasons. The relief teachers were all rigorously selected and tested before being added to the pool.
In addition to its own programmes, Sci-Bono also managed certain GDE programmes on behalf of the department.
Supplementary Exam Support Programme 2012Sci-Bono was asked by the GDE to manage a programme of tuition for learners who registered to write supplementary exams in February. The sessions were run at 44 sites across the province and offered tuition in nine subjects. Sci-Bono also ran free daily walk-in classes at the centre in the period running up to the exams.
Senior Secondary Intervention Programme (SSIP)SSIP is the largest of the programmes managed for the GDE. The programme provided supplementary tuition in 10 subjects to 334 priority schools throughout Gauteng. This involved weekend and holiday tuition sessions for more than 47 000 Grade 12 learners and 85 000 learners in Grade 10 and 11. In 2011, the programme included a series of motivational talks and computer literacy training. Sci-Bono worked with the GDE and its district offices to run the programme. SASRIA provided additional support for the programme by adopting the SSIP site of the Ingqayizivele High School in Tembisa. SSIP has been generally recognised as having contributed to the improvement in the 2011 matric pass rate. Sci-Bono set up an SSIP management office to manage all the programme logistics, including tutor contracting and payment, printing and distribution of resources, learner catering and transport. The scale of the programme has presented management challenges in areas such as data management and administration.
School Support
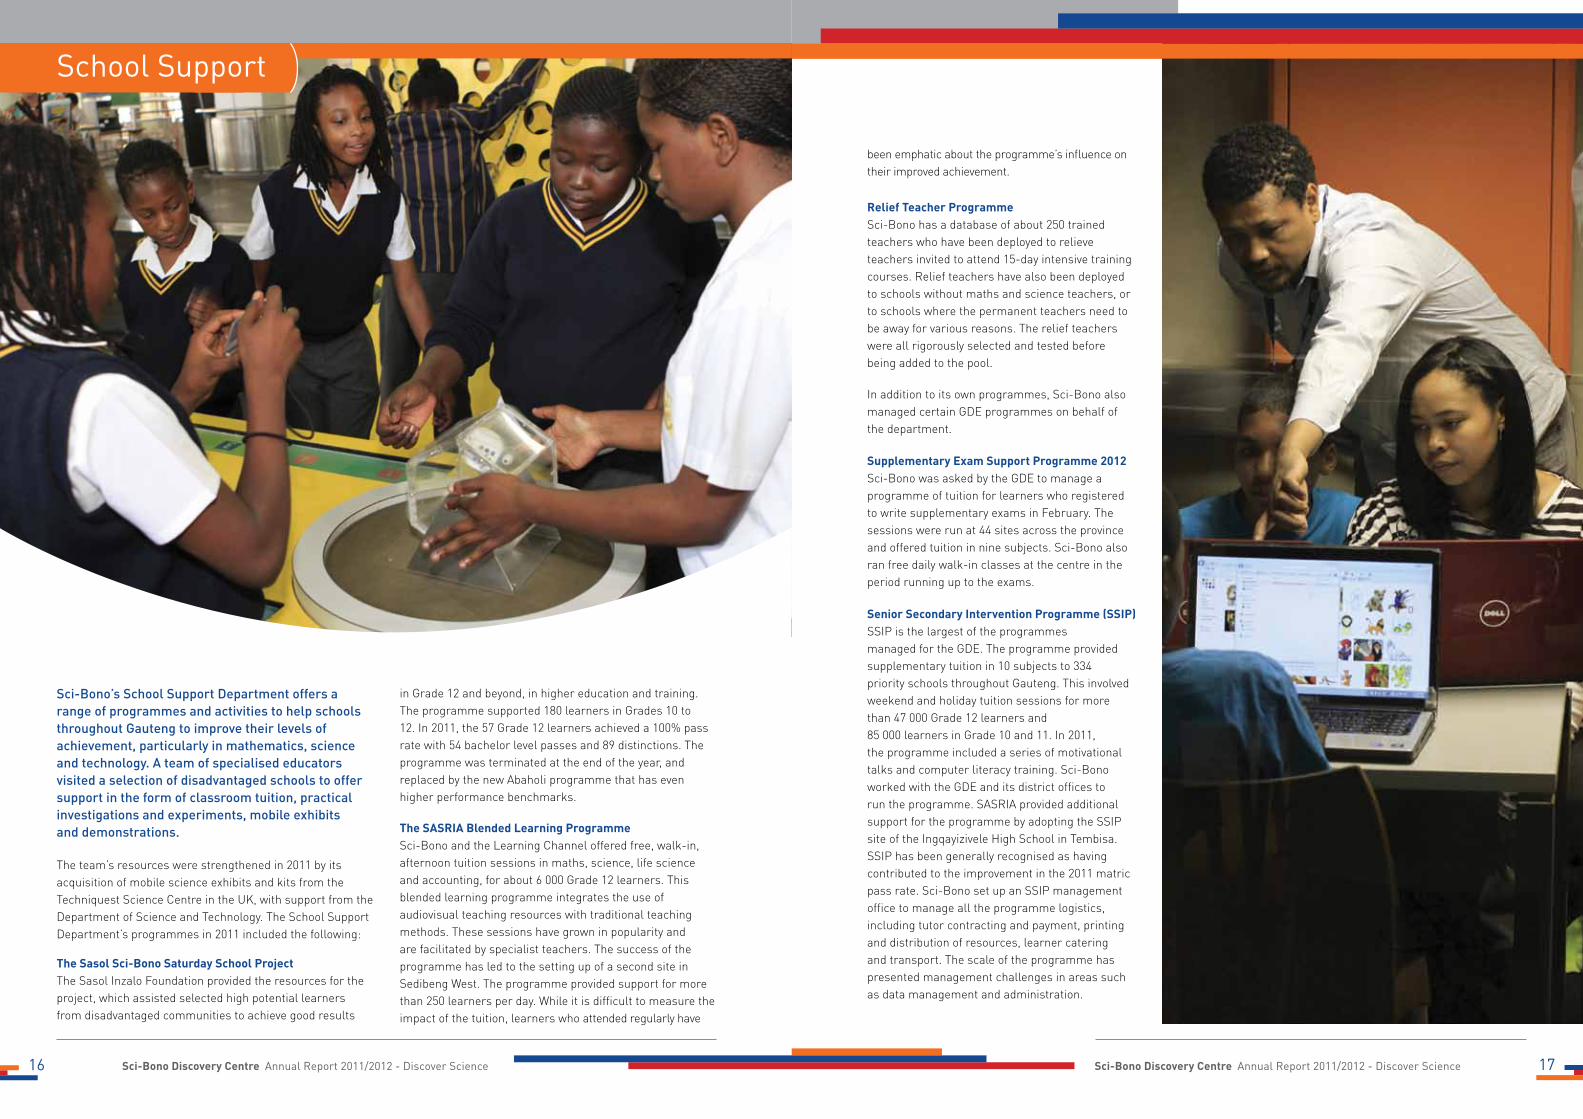
Sci-Bono’s School Support Department offers a range of programmes and activities to help schools throughout Gauteng to improve their levels of achievement, particularly in mathematics, science and technology. A team of specialised educators visited a selection of disadvantaged schools to offer support in the form of classroom tuition, practical investigations and experiments, mobile exhibits and demonstrations.
The team’s resources were strengthened in 2011 by its acquisition of mobile science exhibits and kits from the Techniquest Science Centre in the UK, with support from the Department of Science and Technology. The School Support Department’s programmes in 2011 included the following:
The Sasol Sci-Bono Saturday School ProjectThe Sasol Inzalo Foundation provided the resources for the project, which assisted selected high potential learners from disadvantaged communities to achieve good results
in Grade 12 and beyond, in higher education and training. The programme supported 180 learners in Grades 10 to 12. In 2011, the 57 Grade 12 learners achieved a 100% pass rate with 54 bachelor level passes and 89 distinctions. The programme was terminated at the end of the year, and replaced by the new Abaholi programme that has even higher performance benchmarks.
The SASRIA Blended Learning ProgrammeSci-Bono and the Learning Channel offered free, walk-in, afternoon tuition sessions in maths, science, life science and accounting, for about 6 000 Grade 12 learners. This blended learning programme integrates the use of audiovisual teaching resources with traditional teaching methods. These sessions have grown in popularity and are facilitated by specialist teachers. The success of the programme has led to the setting up of a second site in Sedibeng West. The programme provided support for more than 250 learners per day. While it is difficult to measure the impact of the tuition, learners who attended regularly have

Sci-Bono Discovery Centre Annual Report 2011/2012 - Discover Science Sci-Bono Discovery Centre Annual Report 2011/2012 - Discover Science18 19
Sci-Bono is involved in the numeracy component of the Gauteng Primary Literacy Strategy and has seconded two team members to the project team at the GDE. By the end of 2011, we had trained 386 primary school coaches for the project.
The inconsistent attendance rates at training events remain a challenge. Many identified teachers fail to arrive at their courses. There have also been challenges in developing materials that can be easily and effectively used by all teachers.
The DELL ICT Training CentreSci-Bono’s partnership with and support from the Dell Foundation has been of critical value in the centre’s ability to offer quality training. The Dell ICT Training Centre is an accredited Microsoft IT Academy, a registered Cisco training facility, and a SETA-accredited training institution. This allowed us to train 1 739 learners to use Microsoft applications during the year. The centre also cooperated with the GDE to offer Computer Applications Technology (CAT) training to 400 teachers.
Curriculum Delivery Resources and SupportSci-Bono, together with the GDE, has embarked on a Lesson Plan development project as part of an initiative to improve curriculum delivery throughout the province. An expert group of developers, made up largely of highly experienced teachers, supported by GDE curriculum specialists and Sci-Bono officials, developed and quality assured all the materials. Special care was taken to ensure that the materials were not only compliant with Curriculum Assessment Policy Statements and National Curriculum Statements, but that the plans were easy to read and follow. The project also provided teachers with the minimum resources needed to deliver lessons. A total of 579 lesson plans were developed for Grades 10 to 12. Lesson plans for Grades 1 to 3 and for Grades 4 to 6 were also developed.
Sci-Bono’s Teacher Training Department offers a variety of courses and training events to teachers across the province.
The Teacher Training ProgrammeTeacher training is an important component of Sci-Bono’s mandate to implement the Gauteng Mathematics, Science and Technology Strategy, on behalf of the GDE. Sci-Bono has offered training in all mathematics-, science- and technology-related subjects at all grade levels. The attendance profile of Sci-Bono’s teacher training activities in 2011 is shown below.
Teacher Training Target Achievement
SUBJECT Target Actual Achieved
Numeracy 6 900 9 981 145%
Mathematics – IP & SP 2 010 3 504 174%
Natural Sciences – IP 3 571 2 371 66%
Natural Sciences – SP 1 150 1 824 159%
Mathematics – FET 2 347 2 215 94%
Mathematical Literacy 1 907 807 42%
Physical Sciences 1 074 1 022 95%
Agricultural Sciences 55 98 178%
Life Sciences 520 1 258 242%
Subject Advisers (MST) 41 91 222%
Numeracy Master Trainers 100 330 330%
Master Trainers Physical Sciences 30 57 190%
Master Trainers Maths 290 307 106%
Master Trainers N/S & Technology 30 175 583%
Relief Teacher Programme 104 272 262%
FET Technology 325 303 93%
CAT Teacher Training 400 321 80%
ICT Skills for Teachers 1 500 1 859 124%
TOTAL 22 354 26 795 120%
MCAS (76% pass rate) 93
IT Essentials (83% pass rate) 69
Teacher Development
Sci-Bono Discovery Centre Annual Report 2011/2012 - Discover Science 21Sci-Bono Discovery Centre Annual Report 2011/2012 - Discover Science20
• Improving visitor safety management and staff training in health and safety
• Upgrading security, CCTV monitoring and access control
• Improving IT capacity, efficiency and data security
In the current year we focused on energy efficiency, ensuring that most areas are supported by the Uninterrupted Power Supply unit (UPS) and a back-up power generator, which has already had a positive impact on our consumption, and our expenditure on electricity has been reduced.
MarketingSci-Bono’s public visibility continued to grow in 2011 through a range of marketing strategies, as evidenced by an increase in family visits. The centre’s ability to attract new visitors to the inner city was recognised when Sci-Bono won the Johannesburg Development Agency’s Halala Award as
The Corporate Services department has rendered the full range of internal support to the organisation. A central focus for the year has been to streamline internal systems and policies to meet organisational needs. Improvements were made to our procurement systems, booking systems and security systems and we have launched an electronic submission process for quotations and tenders through our website.
Facilities Management and MaintenanceThe department’s focus has been on facilities development and maintenance, safety, occupational health, security and ICT management. These activities are aimed at ensuring full functionality of the centre and to enhance the quality of visitor experience at Sci-Bono. The key activities for the reporting period included:
• Improving energy efficiency and continuity
Corporate Services
the top leisure destination in the city. The centre’s coverage in print, broadcast and online increased by 43% from an Advertising Value Equivalent of about R14 million in 2010 to over R20 million in 2011. The following table shows the nature and value of Sci-Bono’s media coverage during the year:
Print Broadcast Online Total
AVE 2010 7,362,034 3,041,446 3,809,219 14,212,699
AVE 2011 10,656,204 4,966,034 4,732,590 20,354,828
% Growth 44.7% 63.3% 24.2% 43.2%
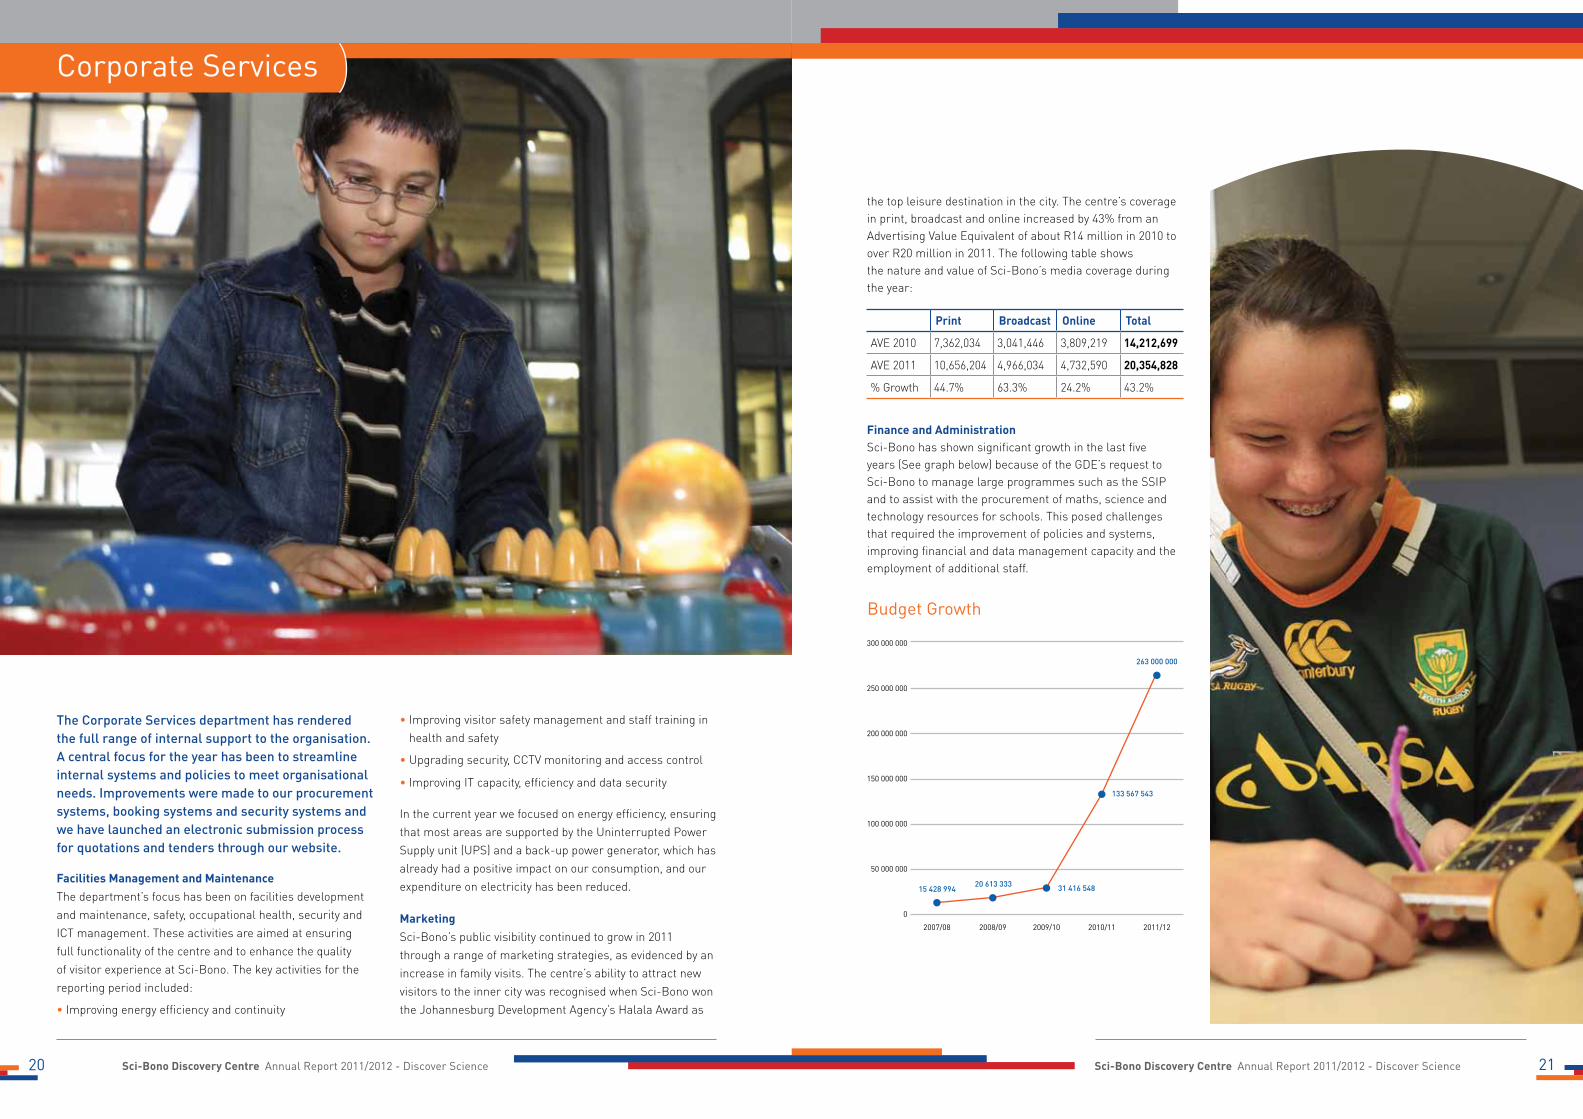
Finance and AdministrationSci-Bono has shown significant growth in the last five years (See graph below) because of the GDE’s request to Sci-Bono to manage large programmes such as the SSIP and to assist with the procurement of maths, science and technology resources for schools. This posed challenges that required the improvement of policies and systems, improving financial and data management capacity and the employment of additional staff.
300 000 000
250 000 000
200 000 000
150 000 000
100 000 000
50 000 000
0
2007/08 2008/09 2009/10 2010/11 2011/12
15 428 99420 613 333 31 416 548
133 567 543
263 000 000
Budget Growth
Sci-Bono Discovery Centre Annual Report 2011/2012 - Discover Science 23Sci-Bono Discovery Centre Annual Report 2011/2012 - Discover Science22
Company Secretary Sci-Bono does not deem it necessary to appoint a full-time company secretary. The Director: Corporate Services, under guidance of the CEO and the chairperson of the Board, is responsible for ensuring compliance with relevant legislation and regulations.
Ethical Leadership, Corporate Citizenship and Corporate Governance EthosSci-Bono’s Board operates in terms of a formally adopted Charter of Ethics and Values. The Charter aims to ensure a high standard of governance. The Board also adopted a fundraising policy in 2011 that commits Sci-Bono to ethical and transparent activities in this regard.
Board Committees The Board has the following committees:
Finance Committee Sci-Bono’s Finance Committee in 2011 was chaired by Mr Phiroshaw Camay (chairperson) and had two additional members in Ms Selemeng Mokose and Ms Angie Nathane from the GDE.
Sci-Bono is committed to applying sound corporate governance principles. We continuously update our policies so as to comply with best practice and with current statute and legislation.
Board of DirectorsBoard Meetings and Annual General MeetingsSci-Bono’s Board of Directors meets quarterly. The Finance Committee is scheduled to meet five times annually and the Risk and Audit Committee meets twice per annum. Sci-Bono’s Annual General Meeting is usually scheduled for September. Sci-Bono Board members are encouraged to attend all company events and special occasions in order to promote interaction with all stakeholders.
Remuneration of Directors and Members of the CommitteesDirectors of the Board and Board Committee members receive no remuneration.
Conflict of InterestAll directors are obliged to disclose any conflict or potential conflict of interest to the Board and Board Committees.
Corporate Governance
Audit CommitteeThe committee was formally established in August 2011. The Audit and Risk Charter was adopted and approved by the Board in September 2011. The committee had a vacancy at the end of February 2012, which will be filled in the new year. The committee is chaired by Mr Sathie Gounden and had one additional member, Mr Wayne Poggenpoel.
Development Committee (Ad-Hoc)In 2010, the Board approved the development of the Phase 3B construction project that will facilitate the provision of additional exhibition, educational and administrative facilities. A Development Committee has been set up by the Board for the duration of the project to oversee and monitor the project.
Internal Controls and Risk ManagementSci-Bono maintains a rigorous system of financial, managerial and other control over all its operations. This allows problems and deficiencies to be quickly detected and corrected. The Audit and Risk Committee has been tasked to regularly review the effectiveness of internal control. In February 2012, the Gauteng Department of Education conducted a risk compliance audit. No major deficiencies were identified.
External AuditThe reappointment of Sizwe Ntsaluba Gobodo Auditors (previously Gobodo Chartered Accountants) was approved by the AGM on 22 September 2011.
Internal AuditThe scale of Sci-Bono’s operations in the past has not warranted a permanent internal audit office. The internal audit function has been the responsibility of the Risk and Audit Committee. As the scale of operations increases, internal audit capacity is now being considered.
Risk ManagementGiven the nature of its operations, Sci-Bono makes use of a third-party provider to monitor health and safety on a regular and frequent basis. During the reporting period, this service was provided by WorkMed Ltd. All other risk management has been the responsibility of senior management.
Governance of Information TechnologyInformation systems audits are conducted to test the validity, completeness and accuracy of financial information. The finding of the risk compliance audit conducted by GDE was that there was no significant risk posed by the existing
information systems and processes. We will continue to review this from time to time.
Quality Management SystemsQuality AssuranceService levels in the Science Centre are monitored daily, throughout the week, as part of quality assurance. A report is tabled weekly to management.
Monitoring Achievement of Organisation TargetsOnce every two months all departments report to senior management on the achievement of set targets. Senior management immediately intervenes where achievement levels are not met.

Sci-Bono Discovery Centre Annual Report 2011/2012 - Discover Science Sci-Bono Discovery Centre Annual Report 2011/2012 - Discover Science24 25
Monitoring and Evaluation: Impact AssessmentIn 2011, Sci-Bono embarked on an exercise of drafting a policy and strategy for monitoring and evaluating all Sci-Bono programmes. Khulisa Management Services assisted in the design of the strategy. This is now being implemented throughout the organisation.
Stakeholder CommunicationsSci-Bono maintains close contact with its principal funder, the Gauteng Department of Education, and the CEO serves on the department’s executive management team. Departmental officials are involved in the management of all educational programmes. There is regular communication with Gauteng schools and teachers. Sci-Bono maintains regular contact with the Department of Science and Technology, with various science councils and with many professional and industrial associations.
There is frequent and regular cooperation with local universities, particularly with the University of the Witwatersrand and the University of Johannesburg. Sci-Bono serves on the board of the Newtown Improvement District, which oversees the management of the Newtown cultural precinct. Sci-Bono has partnerships and relationships with a range of private sector funders and organisations. Sci-Bono is a member of the Southern African Association of Science & Technology Centres (SAASTEC), and of the European Network of Science Centres and Museums (ECSITE).
Development and Transformation Sci-Bono is committed to sustainability and transformation and continually strives to be a responsible corporate citizen. It acknowledges the business imperatives to conduct its operations in a sustainable manner. Transformation is expressed through the adoption of various programmes that are in line with the various statutes. Sci-Bono policies express commitment towards the support, development and empowerment of communities.
Skills Development and TrainingGiven the nature of the organisation, Sci-Bono has to ensure that its employees have the necessary skills to undertake the ever-evolving work of the centre.
ICT TrainingManagement requires that all staff members at Sci-Bono show competence in basic ICT skills. The Dell ICT Training Centre @ Sci-Bono therefore provides regular training for staff across a range of applications.
Occupational Health and Safety TrainingSafety remains a priority at Sci-Bono. Safety management, first aid and other training is regularly provided to staff in these critical areas of our responsibility.
Training for Junior ManagersA training and mentorship programme for junior management was designed and delivered in-house, by using
senior managers. The programme began on 16 March 2011, and was completed at the end of May 2012. The next phase of the programme will focus on skills and development for science communicators.
Employment Equity Report Sci-Bono’s organisational demography at the end of the reporting period was as indicated below:
Management, Education and Admin Staff
African Asian Coloured White TOTAL
Female 33 2 4 1 40 44%
Male 36 5 5 5 51 56%
TOTAL 69 7 9 6 91
75.8% 7.7% 9.9% 6.6%
Science Communicators and Outreach Educators
African Asian Coloured White TOTAL
Female 63 0 1 0 64 48%
Male 67 0 1 0 68 52%
TOTAL 130 0 2 0 132
98% 0% 2% 0%

Sci-Bono Discovery Centre Annual Report 2011/2012 - Discover Science Sci-Bono Discovery Centre Annual Report 2011/2012 - Discover Science26 27
Board of DirectorsSci-Bono is governed by an active and experienced Board of Directors with a wide range of expertise. All directors are non-executive members in terms of the Sci-Bono Memorandum of Incorporation. As at 28 February 2011, the Board comprised the following non-executive directors:
Mr Phiroshaw Camay (chairperson)
Ms Gail Campbell
Ms Beverley Damonse Rev. Frank Chikane
Mr Tom Waspe Dr Stanley Liphadzi
Ms Selemeng Mokose Mr Sathie Gounden
Ms Nomfundo Mqadi
Executive Officio MemberDavid Kramer – chief executive officer
GDE RepresentativesAlbert Chanee and Len Davids
APPOINTMENTS AND RESIGNATIONSThe following changes took place in 2011/2012
New Appointments
Rev. Frank Chikane (20 June 2011)
Ms Felleng Yende (7 December 2011)
Mr Sathie Gounden (22 September 2011)
Resignations
Ms Lerato Motaung (12 July 2011)
Dr Isaac Machi (11 November 2011)
Cllr Rehana Moosajee (22 September 2011)
Ms Nomfundo Mqadi (7 December 2011)
Mr Suni Geness (25 September 2011)
Senior members of staff attend Board and committee meetings but are not members of these committees.
Board Meeting Attendance
Board Member Attendance
Mr Phiroshaw Camay 5/5
Ms Gail Campbell 4/5
Mr Tom Waspe 1/5
Ms Selemeng Mokose 2/5
Ms Beverley Damonse 2/5
Dr Stanley Liphadzi 2/5
Dr Isaac Machi 2/5
Rev Frank Chikane 2/3
Mr Sathie Gounden 2/3
Finance Committee
Finance Comm Member Attendance
Mr Phiroshaw Camay 5/6
Ms Selemeng Mokose 4/6
Ms Angie Nathane 2/6
Audit Committee
Audit Committee Attendance
Mr Wayne Poggenpoel 2/2
Mr Sathie Gounden 2/2
Annual Financial Statements
GDE SCIENCE EDUCATION CENTRE(Registration number 2004/010183/08)Trading as SCI-BONO DISCOVERY CENTREAnnual Financial Statements for the year ended 29 February 2012
General InformationCountry of incorporation and domicile South Africa
Nature of business and principal activities Science and exhibition centre
Directors Phiroshaw Camay
Gail Campbell
Albert Chanee - GDE Representative
Beverley Damonse
Len Davids - GDE Representative
Tom Waspe
Selemeng Mokose
Dr Stanely Liphadzi
Sathie Gounden
Rev Frank Chikane
Felleng Yende
Registered office Sci-Bono Discovery Centre
Miriam Makeba & President Street
Newtown
2001
Business address Sci-Bono Discovery Centre
Miriam Makeba & President Street
Newtown
2001
Postal address PO Box 61882
Marshalltown
2107
Bankers Standard Bank
Auditors SizweNtsalubaGobodo
Chartered Accountants (S.A.)
Registered Auditor
Secretary Fikile Mapela
Tax reference number 9058859159
Level of assurance These annual financial statements have been audited in compliance with the applicable requirements of the Companies Act 71 of 2008.
Preparer The annual financial statements were independently compiled by: SizweNtsalubaGobodo Advisory Division
Published 31 July 2012

Sci-Bono Discovery Centre Annual Report 2011/2012 - Discover Science Sci-Bono Discovery Centre Annual Report 2011/2012 - Discover Science28 29
Directors’ Responsibilities and ApprovalContents to the Annual Financial Statements
The directors are required in terms of the Companies Act 71 of 2008 to maintain adequate accounting records and are responsible for the content and integrity of the annual financial statements and related financial information included in this report. It is their responsibility to ensure that the annual financial statements fairly present the state of affairs of the company as at the end of the financial year and the results of its operations and cash flows for the period then ended, in conformity with International Financial Reporting Standards. The external auditors are engaged to express an independent opinion on the annual financial statements.
The annual financial statements are prepared in accordance with International Financial Reporting Standards and are based upon appropriate accounting policies consistently applied and supported by reasonable and prudent judgments and estimates.
The directors acknowledge that they are ultimately responsible for the system of internal financial control established by the company and place considerable importance on maintaining a strong control environment. To enable the directors to meet these responsibilities, the board sets standards for internal control aimed at reducing the risk of error or loss in a cost effective manner. The standards include the proper delegation of responsibilities within a clearly defined framework, effective accounting procedures and adequate segregation of duties to ensure an acceptable level of risk. These controls are monitored throughout the company and all employees are required to maintain the highest ethical standards in ensuring the company’s business is conducted in a manner that in all reasonable circumstances is above reproach. The focus of risk management in the company is on identifying, assessing, managing and monitoring all known forms of risk across the company. While operating risk cannot be fully eliminated, the company endeavours to minimise it by ensuring that appropriate infrastructure, controls, systems and ethical behaviour are applied and managed within predetermined procedures and constraints.
The directors are of the opinion, based on the information and explanations given by management, that the system of internal control provides reasonable assurance that the financial records may be relied on for the preparation of the annual financial statements. However, any system of internal financial control can provide only reasonable, and not absolute, assurance against material misstatement or loss.
The directors have reviewed the company’s cash flow forecast for the year to 28 February 2013 and, in the light of this review and the current financial position, they are satisfied that the company has or has access to adequate resources to continue in operational existence for the foreseeable future.
The external auditors are responsible for independently reviewing and reporting on the company’s annual financial statements. The annual financial statements have been examined by the company’s external auditors and their report is presented on page 30.
The annual financial statements set out on pages 32 to 60, which have been prepared on the going concern basis, were approved by the board on 31 July 2012 and were signed on its behalf by:
Phiroshaw Camay David KramerBoard Chairperson Chief Executive Officer
Directors’ Responsibilities and Approval 29
Independent Auditors’ Report 30
Directors’ Report 32
Statement of Financial Position 34
Statement of Comprehensive Income 35
Statement of Changes in Equity 36
Statement of Cash Flows 37
Accounting Policies 38
Notes to the Annual Financial Statements 42
The following supplementary information does not form part of the Annual Financial Statements and is unaudited:
Detailed Income Statement 57 Supplementary Information 59

3030 31

Sci-Bono Discovery Centre Annual Report 2011/2012 - Discover Science Sci-Bono Discovery Centre Annual Report 2011/2012 - Discover Science32 33
The directors submit their report for the year ended 29 February 2012.
1. Review of activitiesMain business and operationsThe company is engaged in promoting scientific literacy and public understanding of science education and technology and to improve maths, science and technology skills and education primarily in the Gauteng province and principally operates in South Africa.
The operating results and state of affairs of the company are fully set out in the attached annual financial statements and do not in our opinion require any further comment.
Net surplus of the company was R 30 686 465 (2011: R 40 662 550).
2. Going concernThe annual financial statements have been prepared on the basis of accounting policies applicable to a going concern. This basis presumes that funds will be available to finance future operations and that the realisation of assets and settlement of liabilities, contingent obligations and commitments will occur in the ordinary course of business. The fact that the total liabilities exceed the assets has not hindered the company’s ability to pay its debts as they become due in the normal course of business.
3. Events after the reporting periodThe directors are not aware of any matter or circumstance arising since the end of the financial year.
4. Non-current assetsThe entity commenced with the construction of the extension phase III. The total work in progress cost incurred was R11,661,885. Apart from this there have been no other major acquisitions of property, plant and equipment during the year.
5. DirectorsThe directors of the company during the year and to the date of this report are as follows:
Name Nationality Changes
Phiroshaw Camay South African
Gail Campbell South African
Albert Chanee South African
Beverley Damonse South African
Len Davids South African
Tom Waspe South African
Selemeng Mokose South African
Dr Stanley Liphadzi South African
Lerato Motaung South African Resigned 12 July 2011
Cllr Rehana Moosajee South African Resigned 22 September 2011
Sunil Geness South African Resigned 25 September 2011
Dr Isaac Machi South African Resigned 11 November 2011
Nomfundo Mqadi South African Resigned 07 December 2011
Sathie Gounden South African Appointed 22 September 2011
Rev Frank Chikane South African Appointed 20 June 2011
Felleng Yende South African Appointed 07 December 2011
6. SecretaryThe secretary of the company is Fikile Mapela of:
Business address Sci-Bono Discovery Centre
Miriam Makeba & President Street
Newtown
Johannesburg
2000
Postal address PO Box 61882
Marshalltown
2107
7. AuditorsSizweNtsalubaGobodo will continue in office in accordance with section 90 of the Companies Act 71 of 2008.
8. Taxation statusThe company is exempt from taxation as it is a Public Benefit Organisation (Registration no: 930014449) by the South African Revenue Service (SARS). This means, amongst other things, donations to GDE Science Education Centre will be tax deductible in the hands of the donors in terms of and subject to the limitations prescribed in section 18A of the Income Tax Act.
Directors’ Report

Sci-Bono Discovery Centre Annual Report 2011/2012 - Discover Science Sci-Bono Discovery Centre Annual Report 2011/2012 - Discover Science34 35
Statement of Financial Position
Figures in Rand Note(s) 2012 2011Restated
2010Restated
Revenue 12 376 414 190 030 100 589
Other income 13 270 376 256 168 390 366 31 692 744
Operating expenses (247 191 039) (132 661 869) (30 487 255)
Operating surplus 23 561 631 35 918 527 1 306 078
Investment revenue 14 7 154 426 4 758 220 6 751 686
Fair value adjustments 15 (21 460) - -
Finance costs 16 (8 132) (14 197) (35 176)
Surplus for the year 30 686 465 40 662 550 8 022 588
Other comprehensive income:
Gains and losses on property revaluation (841 547) (914 674) (914 674)
Total comprehensive income 29 844 918 39 747 876 7 107 914
Figures in Rand Note(s) 2012 2011Restated
2010Restated
Assets
Non-Current Assets
Property, plant and equipment 2 244 851 706 232 418 491 221 805 614
Intangible assets 3 136 797 42 741 78 217
244 988 503 232 461 232 221 883 831
Current Assets
Other financial assets 4 25 017 204 - -
Trade and other receivables 5 10 296 893 2 965 461 1 582 165
Cash and cash equivalents 6 107 902 586 112 941 550 84 017 524
143 216 683 115 907 011 85 599 689
Total Assets 388 205 186 348 368 243 307 483 520
Equity and Liabilities
Equity
Reserves 7 41 759 955 42 601 502 43 516 176
Retained income 114 954 229 84 267 764 43 605 214
156 714 184 126 869 266 87 121 390
Liabilities
Non-Current Liabilities
Finance lease obligation 8 - - 10 545
Deferred income 9 209 373 440 211 466 517 213 832 971
209 373 440 211 466 517 213 843 516
Current Liabilities
Finance lease obligation 8 - 14 819 45 262
Deferred income 9 2 471 623 - -
Provisions 10 738 500 934 573 479 431
Trade and other payables 11 18 599 659 9 083 068 5 993 921
Bank overdraft 6 307 780 - -
22 117 562 10 032 460 6 518 614
Total Liabilities 231 491 002 221 498 977 220 362 130
Total Equity and Liabilities 388 205 186 348 368 243 307 483 520
Statement of Comprehensive Income
Sci-Bono Discovery Centre Annual Report 2011/2012 - Discover Science Sci-Bono Discovery Centre Annual Report 2011/2012 - Discover Science36 37
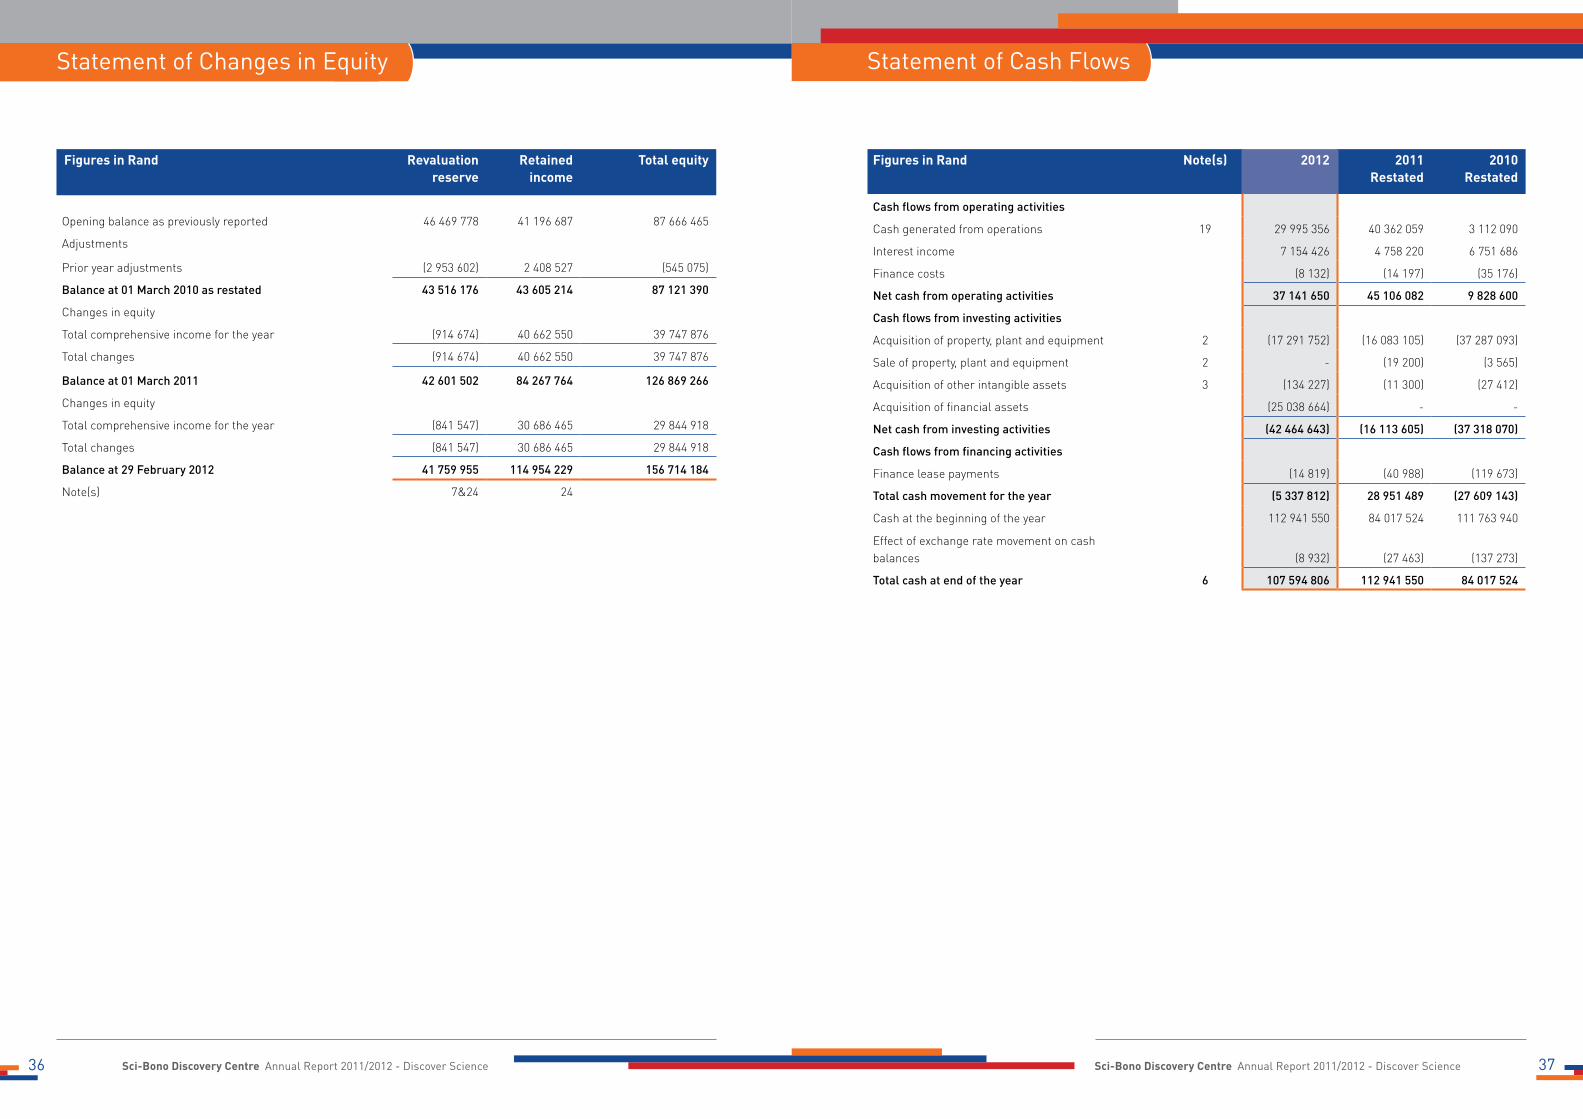
Statement of Cash Flows
Figures in Rand Revaluation reserve
Retained income
Total equity
Opening balance as previously reported 46 469 778 41 196 687 87 666 465
Adjustments
Prior year adjustments (2 953 602) 2 408 527 (545 075)
Balance at 01 March 2010 as restated 43 516 176 43 605 214 87 121 390
Changes in equity
Total comprehensive income for the year (914 674) 40 662 550 39 747 876
Total changes (914 674) 40 662 550 39 747 876
Balance at 01 March 2011 42 601 502 84 267 764 126 869 266
Changes in equity
Total comprehensive income for the year (841 547) 30 686 465 29 844 918
Total changes (841 547) 30 686 465 29 844 918
Balance at 29 February 2012 41 759 955 114 954 229 156 714 184
Note(s) 7&24 24
Statement of Changes in Equity
Figures in Rand Note(s) 2012 2011Restated
2010Restated
Cash flows from operating activities
Cash generated from operations 19 29 995 356 40 362 059 3 112 090
Interest income 7 154 426 4 758 220 6 751 686
Finance costs (8 132) (14 197) (35 176)
Net cash from operating activities 37 141 650 45 106 082 9 828 600
Cash flows from investing activities
Acquisition of property, plant and equipment 2 (17 291 752) (16 083 105) (37 287 093)
Sale of property, plant and equipment 2 - (19 200) (3 565)
Acquisition of other intangible assets 3 (134 227) (11 300) (27 412)
Acquisition of financial assets (25 038 664) - -
Net cash from investing activities (42 464 643) (16 113 605) (37 318 070)
Cash flows from financing activities
Finance lease payments (14 819) (40 988) (119 673)
Total cash movement for the year (5 337 812) 28 951 489 (27 609 143)
Cash at the beginning of the year 112 941 550 84 017 524 111 763 940
Effect of exchange rate movement on cash balances (8 932) (27 463) (137 273)
Total cash at end of the year 6 107 594 806 112 941 550 84 017 524
Sci-Bono Discovery Centre Annual Report 2011/2012 - Discover Science Sci-Bono Discovery Centre Annual Report 2011/2012 - Discover Science38 39
1. Presentation of Annual Financial StatementsThe annual financial statements have been prepared in accordance with International Financial Reporting Standards, and the Companies Act 71 of 2008. The annual financial statements have been prepared on the historical cost basis, and incorporate the principal accounting policies set out below. They are presented in South African Rands.
These accounting policies are consistent with the previous period.
1.1 Property, plant and equipmentThe cost of an item of property, plant and equipment is recognised as an asset when:
• it is probable that future economic benefits associated with the item will flow to the company; and
• the cost of the item can be measured reliably.
Property, plant and equipment is initially measured at cost.
Costs include costs incurred initially to acquire or construct an item of property, plant and equipment and costs incurred subsequently to add to, replace part of, or service it. If a replacement cost is recognised in the carrying amount of an item of property, plant and equipment, the carrying amount of the replaced part is derecognised.
Property, plant and equipment are depreciated on the diminishing balance method over their expected useful lives to their estimated residual value.
Property, plant and equipment is carried at cost less accumulated depreciation and any impairment losses.
The useful lives of items of property, plant and equipment have been assessed as follows:
Item Average useful life
Exhibits 10 years
Buildings 70 years
Capitalised lease equipment 5 years
Appliances 4 years
Furniture and fittings 7 years
Motor vehicles 7 years
Office equipment 5 years
Computer equipment 4 years
Telephone equipment 7 years
Signage 10 years
Laboratory equipment 5 years
Capital work-in-progress Not depreciated
The residual value, useful life and depreciation method of each asset are reviewed at the end of each reporting period. If the expectations differ from previous estimates, the change is accounted for as a change in accounting estimate.
The depreciation charge for each period is recognised in profit or loss unless it is included in the carrying amount of another asset.
The gain or loss arising from the derecognition of an item of property, plant and equipment is included in profit or loss when the item is derecognised. The gain or loss arising from the derecognition of an item of property, plant and equipment is determined as the difference between the net disposal proceeds, if any, and the carrying amount of the item.
1.2 Intangible assetsAn intangible asset is recognised when:
• it is probable that the expected future economic benefits that are attributable to the asset will flow to the entity; and
• the cost of the asset can be measured reliably.
Intangible assets are initially recognised at cost.
Expenditure on research (or on the research phase of an internal project) is recognised as an expense when it is incurred.
An intangible asset arising from development (or from the development phase of an internal project) is recognised when:
• it is technically feasible to complete the asset so that it will be available for use or sale.
• there is an intention to complete and use or sell it.• there is an ability to use or sell it.
• it will generate probable future economic benefits.
• there are available technical, financial and other resources to complete the development and to use or sell the asset.
• the expenditure attributable to the asset during its development can be measured reliably.
Intangible assets are carried at cost less any accumulated amortisation and any impairment losses.
The amortisation period and the amortisation method for intangible assets are reviewed every period-end.
Amortisation is provided to write down the intangible assets, on a straight line basis, to their residual values as follows:
Item Useful life
Website development costs 5 years
Software 5 years
1.3 Financial instrumentsFinancial instruments at amortised costFinancial instruments may be designated to be measured at amortised cost less any impairment using the effective interest method. These include trade and other receivables. At the end of each reporting period date, the carrying amounts of assets held in this category are reviewed to determine whether there is any objective evidence of impairment. If so, an impairment loss is recognised.
Trade and other receivablesTrade receivables are measured at initial recognition at fair value, and are subsequently measured at amortised cost using the effective interest rate method. Appropriate allowances for estimated irrecoverable amounts are recognised in profit or loss when there is objective evidence that the asset is impaired. Significant financial difficulties of the debtor, probability that the debtor will enter bankruptcy or financial reorganisation, and default or delinquency in payments (more than 30 days overdue) are considered indicators that the trade receivable is impaired. The allowance recognised is measured as the difference between the asset’s carrying amount and the present value of estimated future cash flows discounted at the effective interest rate computed at initial recognition.
The carrying amount of the asset is reduced through the use of an allowance account, and the amount of the loss is recognised in profit or loss within operating expenses. When a trade receivable is uncollectable, it is written off against the allowance account for trade receivables. Subsequent recoveries of amounts previously written off are credited against operating expenses in profit or loss.
Trade and other receivables are classified as loans and receivables.
Trade and other payablesTrade payables are initially measured at fair value, and are subsequently measured at amortised cost, using the effective interest rate method.
Cash and cash equivalentsCash and cash equivalents comprise cash on hand and demand deposits, and other short-term highly liquid investments that are readily convertible to a known amount of cash and are subject to an insignificant risk of changes in
value. These are initially and subsequently recorded at fair value.
1.4 LeasesA lease is classified as a finance lease if it transfers substantially all the risks and rewards incidental to ownership. A lease is classified as an operating lease if it does not transfer substantially all the risks and rewards incidental to ownership.
Finance leases – lesseeFinance leases are recognised as assets and liabilities in the statement of financial position at amounts equal to the fair value of the leased property or, if lower, the present value of the minimum lease payments. The corresponding liability to the lessor is included in the statement of financial position as a finance lease obligation.
The lease payments are apportioned between the finance charge and reduction of the outstanding liability. The finance charge is allocated to each period during the lease term so as to produce a constant periodic rate on the remaining balance of the liability.
The lease asset is depreciated over the lease term.
Operating leases – lessorOperating lease income is recognised as an income on a straight-line basis over the lease term.
Initial direct costs incurred in negotiating and arranging operating leases are added to the carrying amount of the leased asset and recognised as an expense over the lease term on the same basis as the lease income.
Income for leases is disclosed under revenue in profit or loss.
1.5 Impairment of assetsThe company assesses at each end of the reporting period whether there is any indication that an asset may be impaired. If any such indication exists, the company estimates the recoverable amount of the asset.
If there is any indication that an asset may be impaired, the recoverable amount is estimated for the individual asset. If it is not possible to estimate the recoverable amount of the individual asset, the recoverable amount of the cash-generating unit to which the asset belongs is determined.
If the recoverable amount of an asset is less than its carrying amount, the carrying amount of the asset is
Accounting Policies Accounting Policies
Sci-Bono Discovery Centre Annual Report 2011/2012 - Discover Science Sci-Bono Discovery Centre Annual Report 2011/2012 - Discover Science40 41
reduced to its recoverable amount. That reduction is an impairment loss.
An impairment loss of assets carried at cost less any accumulated depreciation or amortisation is recognised immediately in profit or loss. Any impairment loss of a revalued asset is treated as a revaluation decrease.
An entity assesses at each reporting date whether there is any indication that an impairment loss recognised in prior periods for assets other than goodwill may no longer exist or may have decreased. If any such indication exists, the recoverable amounts of those assets are estimated.
A reversal of an impairment loss of assets carried at cost less accumulated depreciation or amortisation other than goodwill is recognised immediately in profit or loss. Any reversal of an impairment loss of a revalued asset is treated as a revaluation increase.
1.6 Employee benefitsShort-term employee benefitsThe cost of short-term employee benefits, (those payable within 12 months after the service is rendered, such as paid vacation leave and sick leave, bonuses, and non-monetary benefits such as medical care), are recognised in the period in which the service is rendered and are not discounted.
Defined contribution plansPayments to defined contribution retirement benefit plans are charged as an expense as they fall due.
1.7 Provisions and contingenciesProvisions are recognised when:
• the company has a present obligation as a result of a past event;
• it is probable that an outflow of resources embodying economic benefits will be required to settle the obligation; and
• a reliable estimate can be made of the obligation.
The amount of a provision is the present value of the expenditure expected to be required to settle the obligation.
The provision shall be initially recognised at the best possible estimate at the reporting date. This value should take into account, if material, the time value of money. When the provision has a reimbursive condition from a third party, the reimbursement asset is to be recognised separately on when it is virtually certain payment will be received.
Provisions are not recognised for future operating losses.
Contingent assets and contingent liabilities are not recognised.
1.8 Government grantsGovernment grants are recognised when there is reasonable assurance that:
• the company will comply with the conditions attaching to them; and
• the grants will be received.
Government grants are recognised as income over the periods necessary to match them with the related costs that they are intended to compensate.
Government grants related to assets, including non-monetary grants at fair value, are presented in the statement of financial position by setting up the grant as deferred income or by deducting the grant in arriving at the carrying amount of the asset.
Grants related to income are presented as a credit in the profit or loss (separately).
Repayment of a grant related to income is applied first against any un-amortised deferred credit set up in respect of the grant. To the extent that the repayment exceeds any such deferred credit, or where no deferred credit exists, the repayment is recognised immediately as an expense.
Repayment of a grant related to an asset is recorded by increasing the carrying amount of the asset or reducing the deferred income balance by the amount repayable. The cumulative additional depreciation that would have been recognised to date as an expense in the absence of the grant is recognised immediately as an expense.
1.9 RevenueRevenue is measured at the fair value of the consideration received or receivable and represents the amounts receivable for goods and services provided in the normal course of business, net of trade discounts, and value added tax.
Interest is recognised, in profit or loss, using the effective interest rate method.
Gate entrance fee is recognised when the amount is received.
Donations are recognised to the extent that it is probable that future economic benefits will flow into the company and revenue can be reliably measured.
1.10 Translation of foreign currenciesForeign currency transactionsA foreign currency transaction is recorded, on initial recognition in Rands, by applying to the foreign currency amount the spot exchange rate between the functional currency and the foreign currency at the date of the transaction.
At the end of the reporting period:
• foreign currency monetary items are translated using the closing rate;
• non-monetary items that are measured in terms of historical cost in a foreign currency are translated using the exchange rate at the date of the transaction; and
• non-monetary items that are measured at fair value in a foreign currency are translated using the exchange rates at the date when the fair value was determined.
Exchange differences arising on the settlement of monetary items or on translating monetary items at rates different from those at which they were translated on initial recognition during the period or in previous annual financial statements are recognised in profit or loss in the period in which they arise.
Accounting Policies Accounting Policies

Sci-Bono Discovery Centre Annual Report 2011/2012 - Discover Science Sci-Bono Discovery Centre Annual Report 2011/2012 - Discover Science42 43
Figures in Rand 2010
Cost Accumulated depreciation
Carrying value
Buildings 76 071 544 (978 063) 75 093 481
Appliances 58 934 (45 412) 13 522
Computer equipment 588 954 (401 941) 187 013
Exhibits 12 325 226 (5 244 043) 7 081 183
Furniture and fixtures 1 134 099 (601 993) 532 106
Laboratory equipment - - -
Motor vehicles 567 587 (169 444) 398 143
Office equipment 229 282 (80 571) 148 711
Signage - - -
Telephone equipment 167 341 (79 959) 87 382
Tools 111 302 (14 634) 96 668
Capitalised lease equipment 241 275 (221 115) 20 160
Capital work in progress 138 147 245 - 138 147 245
Total 229 642 789 (7 837 175) 221 805 614
2. Property, plant and equipment
Figures in Rand 2012
Cost Accumulated depreciation
Carrying value
Buildings 229 224 716 (6 824 222) 222 400 494
Appliances 65 596 (56 180) 9 416
Computer equipment 2 658 235 (1 224 065) 1 434 170
Exhibits 13 908 337 (7 724 334) 6 184 003
Furniture and fixtures 2 798 538 (1 091 304) 1 707 234
Laboratory equipment 286 077 (87 917) 198 160
Motor vehicles 941 543 (341 250) 600 293
Office equipment 661 172 (259 716) 401 456
Signage 142 580 (21 624) 120 956
Telephone equipment 183 223 (128 911) 54 312
Tools 137 051 (57 725) 79 326
Capitalised lease equipment 241 275 (241 274) 1
Capital work in progress 11 661 885 - 11 661 885
Total 262 910 228 (18 058 522) 244 851 706
Figures in Rand 2011
Cost Accumulated depreciation
Carrying value
Buildings 226 171 640 (3 889 592) 222 282 048
Appliances 63 934 (54 152) 9 782
Computer equipment 2 562 663 (718 749) 1 843 914
Exhibits 13 332 167 (6 937 025) 6 395 142
Furniture and fixtures 1 486 722 (810 956) 675 766
Laboratory equipment 226 202 (46 876) 179 326
Motor vehicles 567 587 (257 648) 309 939
Office equipment 556 376 (152 277) 404 099
Signage 142 580 (7 243) 135 337
Telephone equipment 178 023 (110 670) 67 353
Tools 123 746 (30 909) 92 837
Capitalised lease equipment 241 275 (241 274) 1
Capital work in progress 22 947 - 22 947
Total 245 675 862 (13 257 371) 232 418 491
Notes to the Annual Financial Statements Notes to the Annual Financial Statements
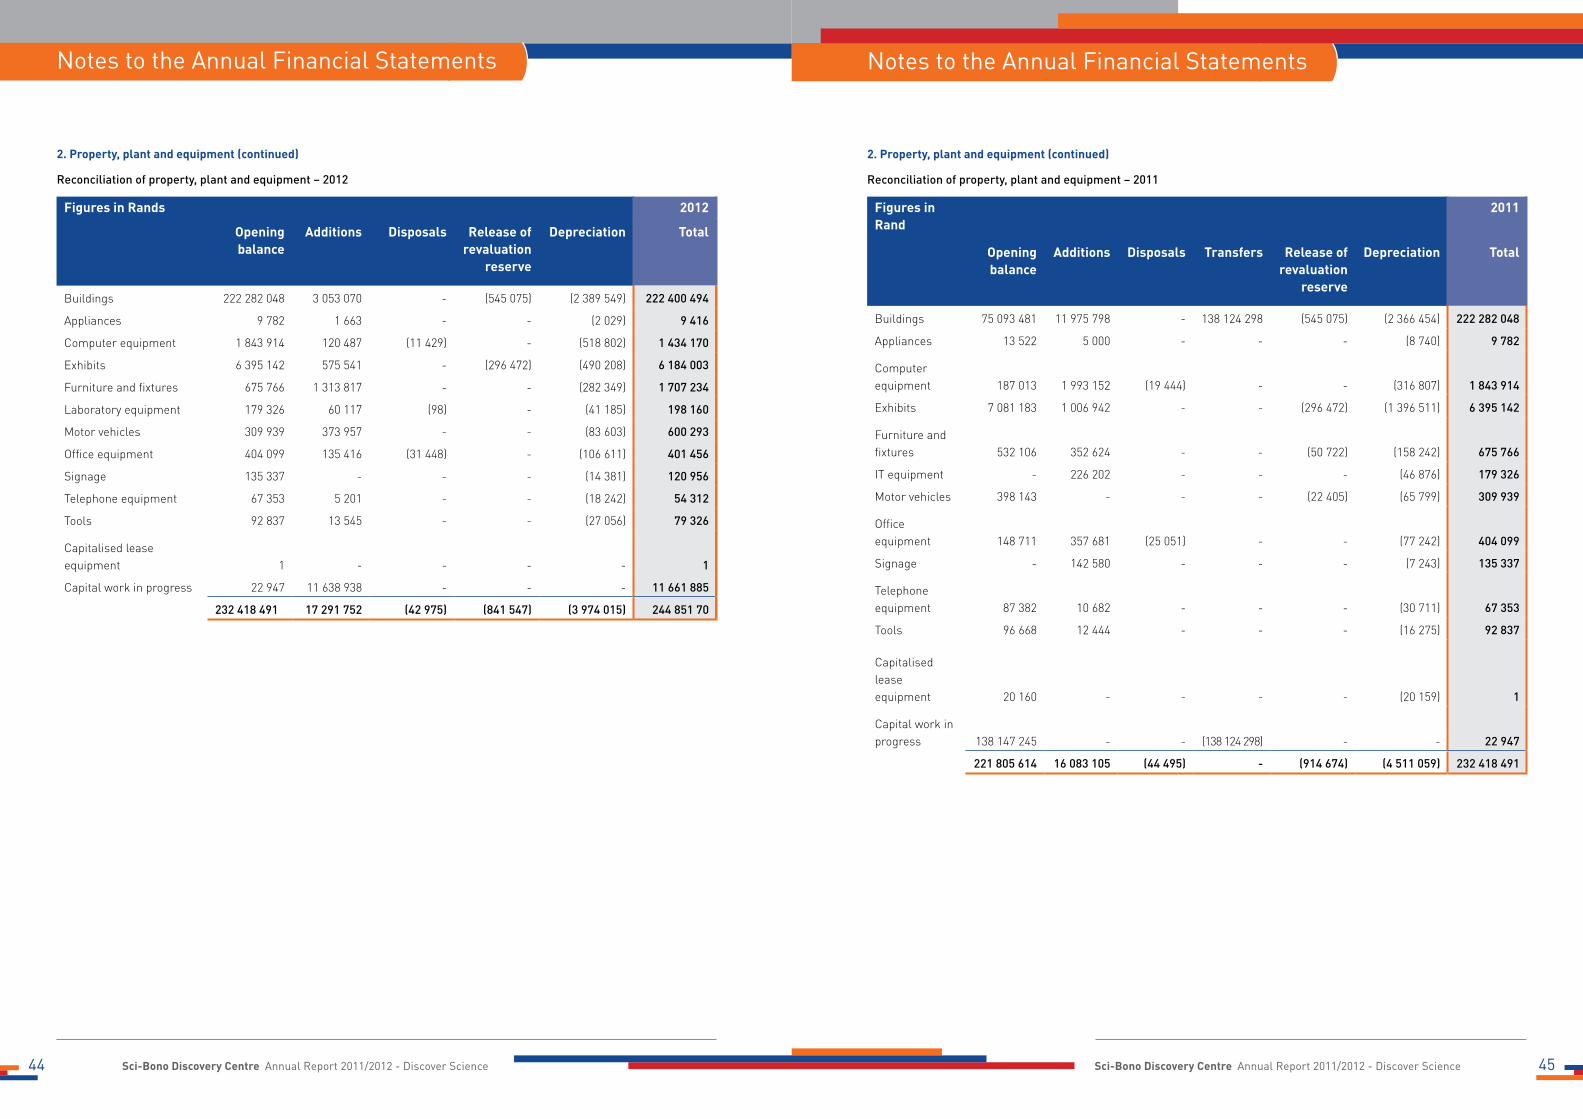
Sci-Bono Discovery Centre Annual Report 2011/2012 - Discover Science Sci-Bono Discovery Centre Annual Report 2011/2012 - Discover Science44 45
2. Property, plant and equipment (continued)
Reconciliation of property, plant and equipment – 2011
Figures in Rand
2011
Opening balance
Additions Disposals Transfers Release of revaluation
reserve
Depreciation Total
Buildings 75 093 481 11 975 798 - 138 124 298 (545 075) (2 366 454) 222 282 048
Appliances 13 522 5 000 - - - (8 740) 9 782
Computer equipment 187 013 1 993 152 (19 444) - - (316 807) 1 843 914
Exhibits 7 081 183 1 006 942 - - (296 472) (1 396 511) 6 395 142
Furniture and fixtures 532 106 352 624 - - (50 722) (158 242) 675 766
IT equipment - 226 202 - - - (46 876) 179 326
Motor vehicles 398 143 - - - (22 405) (65 799) 309 939
Office equipment 148 711 357 681 (25 051) - - (77 242) 404 099
Signage - 142 580 - - - (7 243) 135 337
Telephone equipment 87 382 10 682 - - - (30 711) 67 353
Tools 96 668 12 444 - - - (16 275) 92 837
Capitalised lease equipment 20 160 - - - - (20 159) 1
Capital work in progress 138 147 245 - - (138 124 298) - - 22 947
221 805 614 16 083 105 (44 495) - (914 674) (4 511 059) 232 418 491
2. Property, plant and equipment (continued)
Reconciliation of property, plant and equipment – 2012
Figures in Rands 2012
Opening balance
Additions Disposals Release of revaluation
reserve
Depreciation Total
Buildings 222 282 048 3 053 070 - (545 075) (2 389 549) 222 400 494
Appliances 9 782 1 663 - - (2 029) 9 416
Computer equipment 1 843 914 120 487 (11 429) - (518 802) 1 434 170
Exhibits 6 395 142 575 541 - (296 472) (490 208) 6 184 003
Furniture and fixtures 675 766 1 313 817 - - (282 349) 1 707 234
Laboratory equipment 179 326 60 117 (98) - (41 185) 198 160
Motor vehicles 309 939 373 957 - - (83 603) 600 293
Office equipment 404 099 135 416 (31 448) - (106 611) 401 456
Signage 135 337 - - - (14 381) 120 956
Telephone equipment 67 353 5 201 - - (18 242) 54 312
Tools 92 837 13 545 - - (27 056) 79 326
Capitalised lease equipment 1 - - - - 1
Capital work in progress 22 947 11 638 938 - - - 11 661 885
232 418 491 17 291 752 (42 975) (841 547) (3 974 015) 244 851 70
Notes to the Annual Financial Statements Notes to the Annual Financial Statements

Sci-Bono Discovery Centre Annual Report 2011/2012 - Discover Science Sci-Bono Discovery Centre Annual Report 2011/2012 - Discover Science46 47
3. Intangible assets
2012
Cost Accumulated amortisation
Carrying value
Software 233 437 (96 640) 136 797
Website development cost 49 840 (49 840) -
Total 283 277 (146 480) 136 797
2. Property, plant and equipment (continued)
Reconciliation of property, plant and equipment – 2010
Figures in Rand 2010
Opening balance
Additions Transfers Release of revaluation
reserve
Depreciation Total
Buildings - - 76 071 546 (545 075) (432 990) 75 093 481
Appliances 18 220 3 853 - - (8 551) 13 522
Computer equipment 191 802 130 547 - - (135 336) 187 013
Exhibits 5 660 829 1 911 953 180 445 (296 472) (375 572) 7 081 183
Furniture and fixtures 539 649 101 369 - (50 722) (58 190) 532 106
Motor vehicles 174 517 272 731 - (22 405) (26 700) 398 143
Office equipment 109 711 79 772 - - (40 772) 148 711
Telephone equipment 98 178 6 481 - - (17 277) 87 382
Tools 10 843 99 996 - - (14 171) 96 668
Capitalised lease equipment 90 241 - - - (70 081) 20 160
Capital work in progress 179 718 845 34 680 391 (76 251 991) - - 138 147 245
186 612 835 37 287 093 - (914 674) (1 179 640) 221 805 614
A register containing the information required by Regulation 25(3) of the Companies Regulations, 2011 is available for inspection at the registered office of the company.
2011
Cost Accumulated amortisation
Carrying value
Software 99 211 (58 131) 41 080
Website development cost 49 840 (48 179) 1 661
Total 149 051 (106 310) 42 741
2010
Cost / Valuation
Accumulated amortisation
Carrying value
Software 87 911 (22 154) 65 757
Website development cost 49 840 (37 380) 12 460
Total 137 751 (59 534) 78 217
Reconciliation of intangible assets 2012
Opening balance Additions Amortisation Total
Software 41 080 134 227 (38 510) 136 797
Website development 1 661 - (1 661) -
42 741 134 227 (40 171) 136 797
Reconciliation of intangible assets 2011
Opening balance Additions Amortisation Total
Software 65 757 11 300 (35 977) 41 080
Website development cost 12 460 - (10 799) 1 661
78 217 11 300 (46 776) 42 741
Reconciliation of intangible assets 2010
Opening balance Additions Amortisation Total
Software 44 351 27 412 (6 006) 65 757
Website development cost 32 396 - (19 936) 12 460
76 747 27 412 (25 942) 78 217
Notes to the Annual Financial Statements Notes to the Annual Financial Statements
3. Intangible assets (continued)
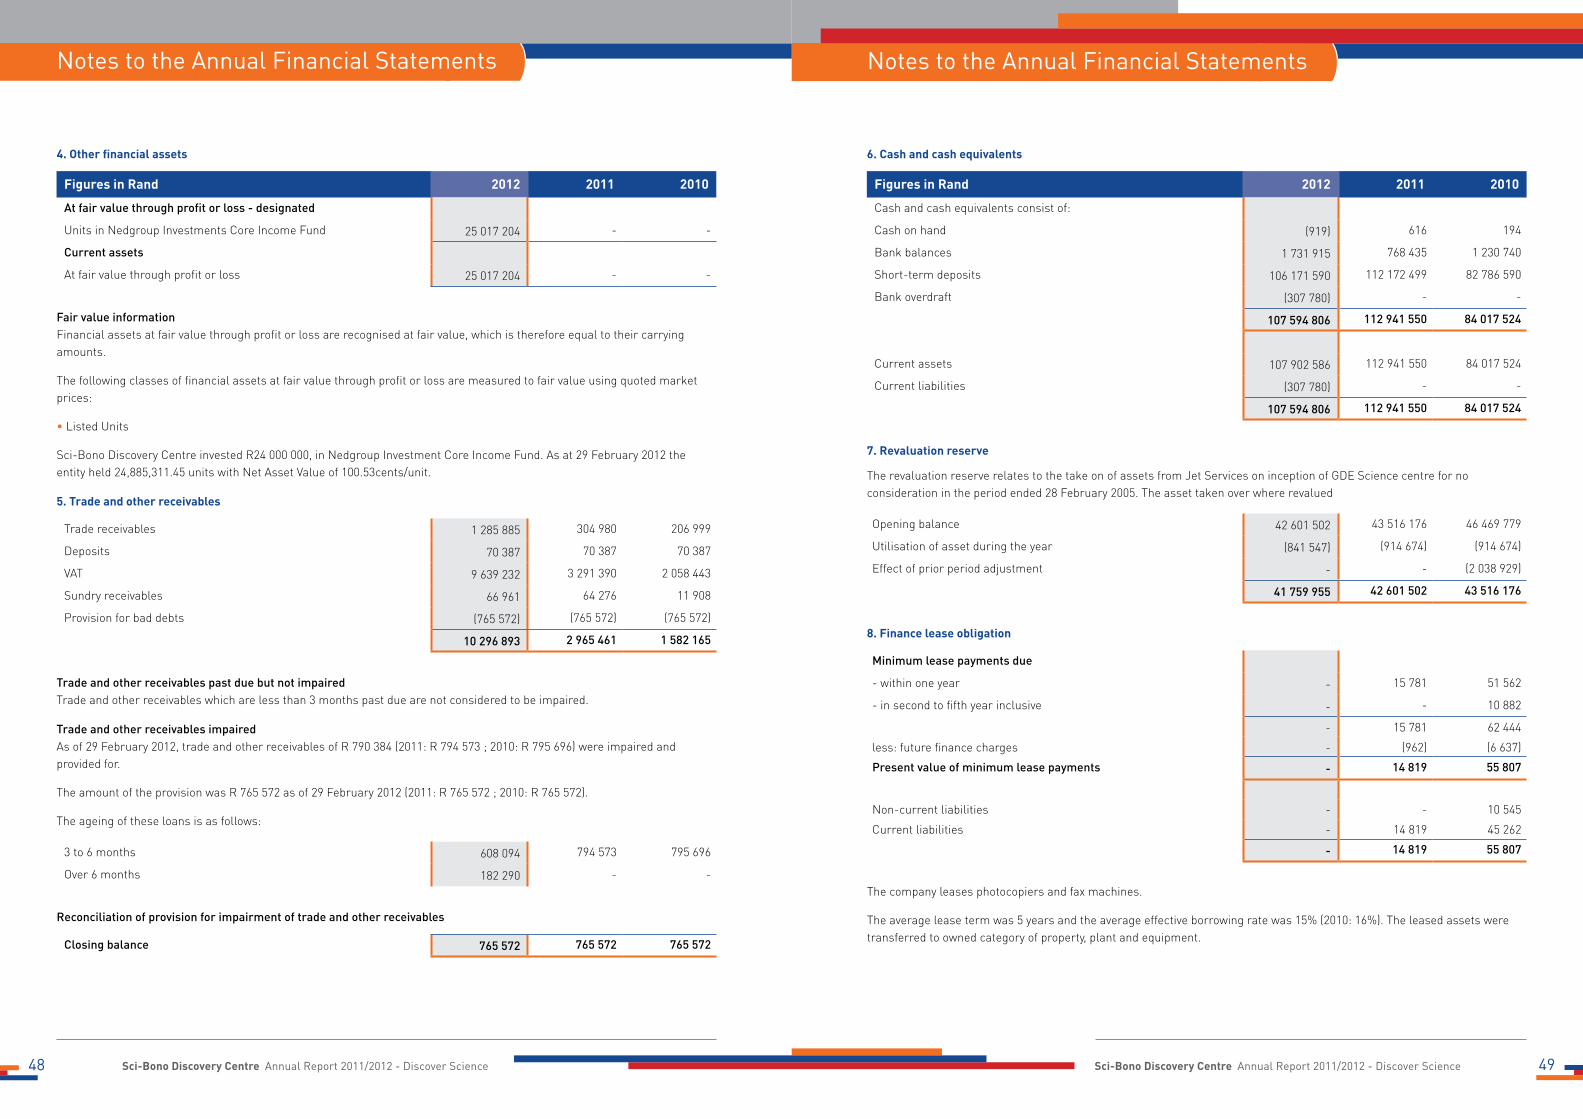
Sci-Bono Discovery Centre Annual Report 2011/2012 - Discover Science Sci-Bono Discovery Centre Annual Report 2011/2012 - Discover Science48 49
6. Cash and cash equivalents
Figures in Rand 2012 2011 2010
Cash and cash equivalents consist of:
Cash on hand (919) 616 194
Bank balances 1 731 915 768 435 1 230 740
Short-term deposits 106 171 590 112 172 499 82 786 590
Bank overdraft (307 780) - -
107 594 806 112 941 550 84 017 524
Current assets 107 902 586 112 941 550 84 017 524
Current liabilities (307 780) - -
107 594 806 112 941 550 84 017 524
7. Revaluation reserve
The revaluation reserve relates to the take on of assets from Jet Services on inception of GDE Science centre for no consideration in the period ended 28 February 2005. The asset taken over where revalued
Opening balance 42 601 502 43 516 176 46 469 779
Utilisation of asset during the year (841 547) (914 674) (914 674)
Effect of prior period adjustment - - (2 038 929)
41 759 955 42 601 502 43 516 176
8. Finance lease obligation
Minimum lease payments due
- within one year - 15 781 51 562
- in second to fifth year inclusive - - 10 882
- 15 781 62 444
less: future finance charges - (962) (6 637)
Present value of minimum lease payments - 14 819 55 807
Non-current liabilities - - 10 545
Current liabilities - 14 819 45 262
- 14 819 55 807
The company leases photocopiers and fax machines.
The average lease term was 5 years and the average effective borrowing rate was 15% (2010: 16%). The leased assets were transferred to owned category of property, plant and equipment.
4. Other financial assets
Figures in Rand 2012 2011 2010
At fair value through profit or loss - designated
Units in Nedgroup Investments Core Income Fund 25 017 204 - -
Current assets
At fair value through profit or loss 25 017 204 - -
Fair value informationFinancial assets at fair value through profit or loss are recognised at fair value, which is therefore equal to their carrying amounts.
The following classes of financial assets at fair value through profit or loss are measured to fair value using quoted market prices:
• Listed Units
Sci-Bono Discovery Centre invested R24 000 000, in Nedgroup Investment Core Income Fund. As at 29 February 2012 the entity held 24,885,311.45 units with Net Asset Value of 100.53cents/unit.
5. Trade and other receivables
Trade receivables 1 285 885 304 980 206 999
Deposits 70 387 70 387 70 387
VAT 9 639 232 3 291 390 2 058 443
Sundry receivables 66 961 64 276 11 908
Provision for bad debts (765 572) (765 572) (765 572)
10 296 893 2 965 461 1 582 165
Trade and other receivables past due but not impairedTrade and other receivables which are less than 3 months past due are not considered to be impaired.
Trade and other receivables impairedAs of 29 February 2012, trade and other receivables of R 790 384 (2011: R 794 573 ; 2010: R 795 696) were impaired and provided for.
The amount of the provision was R 765 572 as of 29 February 2012 (2011: R 765 572 ; 2010: R 765 572).
The ageing of these loans is as follows:
3 to 6 months 608 094 794 573 795 696
Over 6 months 182 290 - -
Reconciliation of provision for impairment of trade and other receivables
Closing balance 765 572 765 572 765 572
Notes to the Annual Financial Statements Notes to the Annual Financial Statements

Sci-Bono Discovery Centre Annual Report 2011/2012 - Discover Science Sci-Bono Discovery Centre Annual Report 2011/2012 - Discover Science50 51
11. Trade and other payables
Figures in Rand 2012 2011 2010
Trade payables 15 082 178 4 589 957 4 368 458
Other accruals 1 030 862 1 260 307 320 999
Payroll accruals 2 321 298 3 118 533 1 251 668
Deposits held 165 321 114 271 52 796
18 599 659 9 083 068 5 993 921
12. Revenue
Gate takings 376 414 190 030 100 589
13. Other income
Rental income 673 213 448 229 223 318
Grant income 266 197 924 164 725 011 30 290 684
Amortisation of deferred income 2 093 077 2 366 454 432 988
Insurance refunds 173 399 30 744 14 631
Venue hire 1 238 643 819 928 731 123
270 376 256 168 390 366 31 692 744
14. Investment revenue
Interest revenue
Bank 7 154 426 4 758 220 6 751 686
15. Fair value adjustments
Other financial assets (21 460) - -
16. Finance costs
Bank 8 132 14 197 35 176
17. Taxation
No provision has been made for 2012 tax as the company is exempt from taxation as it is a Public Benefit Organisation (Registration no: 930014449) by the South African Revenue Service.
18. Auditors’ remuneration
Fees 302 366 205 000 200 000
9. Deferred income
Non-current liabilitiesThe deferred income relates to government grants received for the construction of phase I and II, which was completed in the financial year ended 28 February 2011. The deferred income would be amortised as income over the useful lives of the building.
Current liabilitiesThe deferred income recognised relates to unfulfilled conditions attached to the grant assistance received. The unfulfilled grant conditions would be completed within the next 12 months.
Figures in Rand 2012 2011 2010
Non-current liabilities 209 373 440 211 466 517 213 832 971
Current liabilities 2 471 623 - -
211 845 063 211 466 517 213 832 971
Reconciliation of deferred income
Opening balance 211 466 517 213 832 971 214 265 959
Operating conditional grant not yet utilised 2 471 623 - -
Amortisation of deferred income recognised as income (2 093 077) (2 366 454) (432 988)
Closing balance 211 845 063 211 466 517 213 832 971
10. Provisions
Reconciliation of provisions
Figures in Rand 2012
Opening balance
Utilised during the
year
Total
Provision for leave pay 934 573 (196 073) 738 500
Figures in Rand 2011
Opening balance
Additions Total
Provision for leave pay 479 431 455 142 934 573
Figures in Rand 2010
Opening balance
Additions Total
Provision for leave pay 329 672 149 759 479 431
Notes to the Annual Financial Statements Notes to the Annual Financial Statements

Sci-Bono Discovery Centre Annual Report 2011/2012 - Discover Science Sci-Bono Discovery Centre Annual Report 2011/2012 - Discover Science52 53
21. Risk management
Capital risk managementThe company’s objectives when managing capital are to safeguard the company’s ability to continue as a going concern in order to provide returns for shareholder and benefits for other stakeholders and to maintain an optimal capital structure to reduce the cost of capital.
The capital structure of the company consists of debt, which includes the borrowings (excluding derivative financial liabilities) disclosed in notes 8 cash and cash equivalents disclosed in note 6, and equity as disclosed in the statement of financial position.
There are no externally imposed capital requirements.
There have been no changes to what the entity manages as capital, the strategy for capital maintenance or externally imposed capital requirements from the previous year.
Financial risk managementThe company’s activities expose it to a variety of financial risks: market risk (including currency risk, cash flow interest rate risk), credit risk and liquidity risk.
Liquidity riskPrudent liquidity risk management implies maintaining sufficient cash and marketable securities, the availability of funding through an adequate amount of committed credit facilities and the ability to close out market positions. Due to the dynamic nature of the underlying businesses, company treasury maintains flexibility in funding by maintaining availability under committed credit lines.
The company’s risk to liquidity is a result of the funds available to cover future commitments. The company manages liquidity risk through an ongoing review of future commitments and credit facilities.
The table below analyses the company’s financial liabilities into relevant maturity groupings based on the remaining period at the statement of financial position to the contractual maturity date. The amounts disclosed in the table are the contractual undiscounted cash flows. Balances due within 12 months equal their carrying balances as the impact of discounting is not significant.
At 29 February 2012 Less than 1 year
Trade and other payables 18 599 659
Cash and cash equivalents 107 594 806
At 28 February 2011 Less than 1 year
Trade and other payables 9 083 068
Cash and cash equivalents 112 941 550
At 28 February 2010 Less than 1 year
Trade and other payables 5 993 921
Cash and cash equivalents 84 017 524
Interest rate riskAs the company has no significant interest-bearing assets, the company’s income and operating cash flows are substantially independent of changes in market interest rates.
Notes to the Annual Financial Statements Notes to the Annual Financial Statements
19. Cash generated from operations
Figures in Rand 2012 2011 2010
Surplus before taxation 30 686 465 40 662 550 8 022 588
Adjustments for:
Depreciation and amortisation 4 014 185 4 557 833 1 202 596
Loss on sale of assets 42 975 63 695 3 565
Loss on foreign exchange 8 933 27 465 137 273
Interest received (7 154 426) (4 758 220) (6 751 686)
Finance costs 8 132 14 197 35 176
Fair value adjustments 21 460 - -
Movements in provisions (196 073) 455 142 174 083
Fixed asset adjustments - - 2 987
Changes in working capital:
Trade and other receivables (7 331 432) (1 383 296) 2 111 971
Trade and other payables 9 516 591 3 089 150 (1 393 475)
Deferred income 378 546 (2 366 457) (432 988)
29 995 356 40 362 059 3 112 090
20. Related parties
Relationships
Board representation and financial funder Gauteng Department of Education
Related party transactions
Grant income received from related parties
Gauteng Department of Education - Operations 191 899 000 154 153 497 25 250 000
Compensation to directors and other key management
Short-term employee benefits 3 010 678 3 075 295 2 780 256
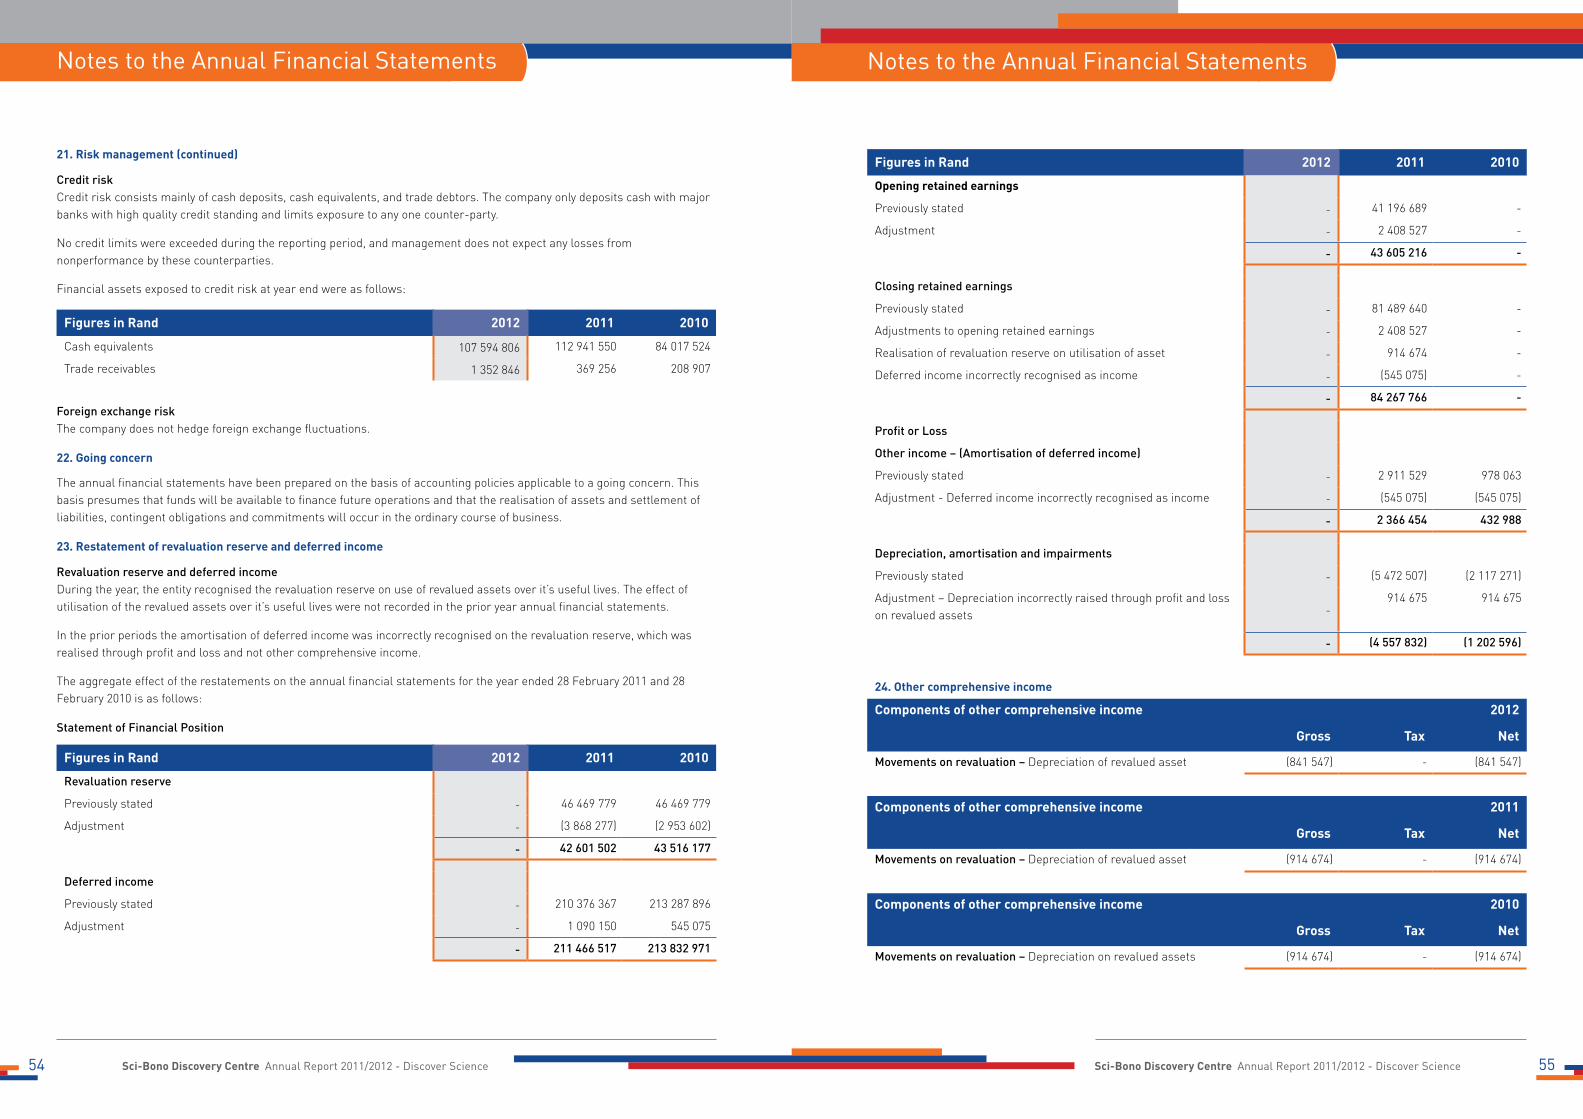
Sci-Bono Discovery Centre Annual Report 2011/2012 - Discover Science Sci-Bono Discovery Centre Annual Report 2011/2012 - Discover Science54 55
Figures in Rand 2012 2011 2010
Opening retained earnings
Previously stated - 41 196 689 -
Adjustment - 2 408 527 -
- 43 605 216 -
Closing retained earnings
Previously stated - 81 489 640 -
Adjustments to opening retained earnings - 2 408 527 -
Realisation of revaluation reserve on utilisation of asset - 914 674 -
Deferred income incorrectly recognised as income - (545 075) -
- 84 267 766 -
Profit or Loss
Other income – (Amortisation of deferred income)
Previously stated - 2 911 529 978 063
Adjustment - Deferred income incorrectly recognised as income - (545 075) (545 075)
- 2 366 454 432 988
Depreciation, amortisation and impairments
Previously stated - (5 472 507) (2 117 271)
Adjustment – Depreciation incorrectly raised through profit and loss on revalued assets -
914 675 914 675
- (4 557 832) (1 202 596)
24. Other comprehensive income
Components of other comprehensive income 2012
Gross Tax Net
Movements on revaluation – Depreciation of revalued asset (841 547) - (841 547)
Components of other comprehensive income 2011
Gross Tax Net
Movements on revaluation – Depreciation of revalued asset (914 674) - (914 674)
Components of other comprehensive income 2010
Gross Tax Net
Movements on revaluation – Depreciation on revalued assets (914 674) - (914 674)
21. Risk management (continued)
Credit riskCredit risk consists mainly of cash deposits, cash equivalents, and trade debtors. The company only deposits cash with major banks with high quality credit standing and limits exposure to any one counter-party.
No credit limits were exceeded during the reporting period, and management does not expect any losses from nonperformance by these counterparties.
Financial assets exposed to credit risk at year end were as follows:
Figures in Rand 2012 2011 2010
Cash equivalents 107 594 806 112 941 550 84 017 524
Trade receivables 1 352 846 369 256 208 907
Foreign exchange riskThe company does not hedge foreign exchange fluctuations.
22. Going concern
The annual financial statements have been prepared on the basis of accounting policies applicable to a going concern. This basis presumes that funds will be available to finance future operations and that the realisation of assets and settlement of liabilities, contingent obligations and commitments will occur in the ordinary course of business.
23. Restatement of revaluation reserve and deferred income
Revaluation reserve and deferred incomeDuring the year, the entity recognised the revaluation reserve on use of revalued assets over it’s useful lives. The effect of utilisation of the revalued assets over it’s useful lives were not recorded in the prior year annual financial statements.
In the prior periods the amortisation of deferred income was incorrectly recognised on the revaluation reserve, which was realised through profit and loss and not other comprehensive income.
The aggregate effect of the restatements on the annual financial statements for the year ended 28 February 2011 and 28 February 2010 is as follows:
Statement of Financial Position
Figures in Rand 2012 2011 2010
Revaluation reserve
Previously stated - 46 469 779 46 469 779
Adjustment - (3 868 277) (2 953 602)
- 42 601 502 43 516 177
Deferred income
Previously stated - 210 376 367 213 287 896
Adjustment - 1 090 150 545 075
- 211 466 517 213 832 971
Notes to the Annual Financial Statements Notes to the Annual Financial Statements

Sci-Bono Discovery Centre Annual Report 2011/2012 - Discover Science Sci-Bono Discovery Centre Annual Report 2011/2012 - Discover Science56 57Sci-Bono Discovery Centre Annual Report 2011/2012 - Discover Science Sci-Bono Discovery Centre Annual Report 2011/2012 - Discover Science56 57
25. New Standards and Interpretations
25.1 Standards and interpretations not yet effectiveThe company has chosen not to early adopt the following standards and interpretations, which have been published and are mandatory for the company’s accounting periods beginning on or after 01 March 2012 or later periods:
Standard/Interpretation: Effective date: Years beginning on or after
• IFRS 7 Amendments: Financial Instruments Disclosure 01 January 2013
• IAS 32 Amendment: Financial Instruments Presentation 01 January 2013
• IAS 1 Annual improvements: Presentation of financial statements
01 January 2013
• IAS 16 Annual improvements: Property, plant and equipment
01 January 2013
• IAS 32 Annual improvements: Financial instruments Presentation
01 January 2013
• IFRS 9 Financial Instruments 01 January 2013
25.2 Standards and interpretations not yet effective or relevantThe following standards and interpretations have been published and are mandatory for the company’s accounting periods beginning on or after 01 March 2012 or later periods but are not relevant to its operations:
Standard/Interpretation: Effective date: Years beginning on or after
• IAS 28 Amendment: Investments in Associates and Joint Ventures
01 January 2013
• IFRS 1 Amendment: First time adoption of international financial reporting standards - Government loans
01 January 2013
• IFRS 1 Annual Improvements: First time adoption of international financial reporting standards
01 January 2013
• IAS 34 Annual improvements: Interim financial reporting 01 January 2013
• IFRS 7 Amendments to IFRS 7 (AC 144) Disclosures – Transfers of financial assets
01 July 2011
• IFRS 13 Fair Value Measurement 01 January 2013
• IAS 1 Presentation of Financial Statements 01 July 2012
• IAS 19 Employee Benefits Revised 01 January 2013
Detailed Income StatementNotes to the Annual Financial Statements
Figures in Rand Note(s) 2012 2011 2010
Revenue
Gate takings 376 414 190 030 100 589
Other income
Rental income 673 213 448 229 223 318
Grant income 266 197 924 164 725 011 30 290 684
Insurance refunds 173 399 30 744 14 631
Amortisation of deferred income 2 093 077 2 366 454 432 988
Venue hire 1 238 643 819 928 731 123
Interest received 14 7 154 426 4 758 220 6 751 686
277 530 682 173 148 586 38 444 430
Expenses (Refer to page 58) (247 191 039) (132 661 869) (30 487 255)
Operating surplus 30 716 057 40 676 747 8 057 764
Fair value adjustments 15 (21 460) - -
Finance costs 16 (8 132) (14 197) (35 176)
(29 592) (14 197) (35 176)
Surplus for the year 30 686 465 40 662 550 8 022 588
The supplementary information presented does not form part of the annual financial statements and is unaudited

Sci-Bono Discovery Centre Annual Report 2011/2012 - Discover Science Sci-Bono Discovery Centre Annual Report 2011/2012 - Discover Science58 5959
Supplementary InformationDetailed Income Statement
Figures in Rand Note(s) 2012 2011 2010
Operating expenses
Administration and management fees - (1 784) -
Advertising (1 529 987) (293 373) (7 585)
Auditors remuneration 18 (302 366) (205 000) (200 000)
Bad debts - (34 020) -
Bank charges (175 020) (113 537) (43 780)
Cleaning (978 740) (784 953) (658 938)
Computer expenses (20 876) (19 102) (11 019)
Conference administration (391 767) (66 962) (15 146)
Depreciation, amortisation and impairments (4 014 185) (4 557 833) (1 202 596)
Employee costs (40 096 549) (25 465 427) (15 928 002)
Fines and penalties (3 805) (750) (350)
Functions and management events (2 699) (7 456) (61 462)
Gifts and honararia (7 927) (4 230) (7 361)
Hire (158 939) (43 494) (2 434)
Insurance (577 686) (524 799) (387 052)
Legal expenses (550) (550) (19 119)
Levies (14 784) (63 309) -
Loss on disposal of assets (42 975) (63 695) (3 565)
Loss on exchange differences (8 933) (27 465) (137 273)
Marketing (540) (232 274) -
Maths, science and technology improvement – Refer to page 60 (38 683 308) - -
Motor vehicle expenses (254 227) (144 303) (54 627)
Petrol and oil (18 047) (16 022) (8 986)
Postage (84 397) (282 355) (22 329)
Printing, publications and stationery (2 176 694) (1 804 556) (814 253)
Recruitment cost (169 588) (115 908) (84 821)
Rent paid (237 640) (4 039) (3 401)
Repairs and maintenance (1 707 930) (1 268 433) (313 567)
Security (1 193 173) (997 242) (612 002)
Senior secondary improvement programme – (SSIP) – Refer to page 59
(129 141 846) (78 532 583) -
Staff welfare (39 107) (137 747) (198 104)
Telephone and fax (692 991) (418 719) (237 137)
Training (2 406 147) (1 318 405) (1 425 161)
Training and material resources (12 438 444) (5 457 015) (3 649 317)
Transport and freight (6 749 622) (8 012 309) (2 399 966)
Travel – local (883 100) (349 791) (1 158 902)
Travel – overseas (58 649) (16 083) (141 281)
Water, electricity and rates (1 927 801) (1 276 346) (677 719)
(247 191 039) (132 661 869) (30 487 255)
1. Senior Secondary Improvement Programme
Description of expenditure 2012 2011 % change
Tutor costs 40 556 290 24 009 424 68.91 %
Materials and resources 7 632 502 2 801 688 172.42 %
Printing and publications 23 653 532 29 355 372 (19.42)%
Services providers and consumables 4 727 090 1 761 581 199.36 %
Training, maintenance and catering 40 280 512 13 455 325 168.34 %
Transport cost - (Buses) 12 291 920 7 149 193 71.93 %
129 141 846 78 532 583 64.44 %
2. Tutor costs
Description of expenditure 2012 2011 % change
The tutor cost incurred on the SSIP program relates to payments made to approximately 2500 tutors for various classes run for the senior secondary grade 10-12 learners 40 556 290 24 009 424 68.91 %
3. Materials and resources
Description of expenditure 2012 2011 % change
The material and resources cost relates to the procurement of additional learning resources such as dictionaries and text materials for learners in SSIP schools 7 632 502 2 801 688 172.42 %
4. Printing and publications
Description of expenditure 2012 2011 % change
The printing and publications cost incurred on the SSIP program relates primarily to the printing and delivery of material covered during the classes run for the senior secondary grade 10-12 learners 23 653 532 29 355 375 (19.42)%
5. Services providers and consumables
Description of expenditure 2012 2011 % change
This relates to the procurement of educational and tuition services for learners in Tshwane and for materials development services in respect of SSIP materials 4 727 090 1 761 581 168.34 %
The supplementary information presented does not form part of the annual financial statements and is unaudited The supplementary information presented does not form part of the annual financial statements and is unaudited

Sci-Bono Discovery Centre Annual Report 2011/2012 - Discover Science 61Sci-Bono Discovery Centre Annual Report 2011/2012 - Discover Science60
Supplementary information
6. Training, maintenance and catering
Description of expenditure 2012 2011 % change
This expenditure relates to the costs of catering to learners at SSIP sessions and for the provision of site management, security and cleaning at SSIP sites 40 280 512 13 455 325 199.36 %
7. Transport cost - (Buses)
Description of expenditure 2012 2011 % change
This expenditure was incurred for the hiring of buses to transport Grade 12 learners from various embarkation points to SSIP sites throughout Gauteng 12 291 920 7 149 193 71.93 %
8. Maths, Science and Technology Improvement program
Material and resources 2012 2011 % change
The Gauteng Department of Education has embarked on program to improve the maths, science and technology resources at schools in Gauteng. The GDE Science centre was tasked to procure, maths sets, calculators, microscopes and other materials, and supply them to various schools around Gauteng 38 683 308 - 100.00 %
The supplementary information presented does not form part of the annual financial statements and is unaudited
Thank you to sponsors and supporters
The activities of the Sci-Bono Discovery Centre are funded primarily by its principal, the Gauteng Department of Education (GDE). Thank you to our colleagues at the GDE for their continued support and encouragement. Sci-Bono also receives valuable support from its other partners in the private sector and from the local and international community.
In the 2011/2012 financial year, Sci-Bono received additional sponsorship from the following donors:
• ABSAFoundation• BHPBillitonDevelopmentTrust• BMWSA(Pty)Ltd• CIDA• CISCO• DELLSouthAfrica• DeutscheGesellschaftFurTechniscieZusammenarblit• DiwaliFeedingScheme• EmbassyofFranceinSouthAfrica• ESKOMDevelopmentFoundation• GobodoCharteredAccountants(SA)• J&CJoelSouthAfrica• Microsoft(STIC)• Mintek• MultimedMediaCC• Murray&RobertsLtd• NewtownImprovementDistrict• PlasconSouthAfrica(Pty)Ltd• RFDesignCC• RoyalSocietyofChemistry• SouthAfricanAgencyforScienceandTechnologyAdvancement• SAP• SasolGroupService(Pty)Ltd• WEBBIndustries• WirsamScientificandPrecisionEquipment