The Leaning Tower of Pisa - Society of Labor Economists · 1 The Leaning Tower of Pisa Decomposing...
29
1 The Leaning Tower of Pisa Decomposing achievement test scores into cognitive and noncognitive components Lex Borghans, Maastricht University Trudie Schils, Maastricht University Draft version October 31, 2012 Abstract Test scores on achievement tests depend on both cognitive and noncognitive skills. The predictive power of achievement tests is therefore potentially due to all components. The question of this paper is whether it is possible to disentangle cognitive and noncognitive factors from the performance on the test. Using data from the international achievement test PISA, we decompose the test scores into two factors. We investigate the development of the performance of students during the test, utilizing the (randomized) difference in the order of the test questions in the various test booklets. We document that performance substantially drops during the test and that this performance drop differs between types of students and countries. The estimated size of the drop is very stable over the years, while correlation between this drop and the test scores is small. This suggests that the decline in test scores during the test picks up something else than just cognition. The size of the decline in test scores during the test is related to personality traits, mainly to agreeableness, and to motivational attitudes towards learning. It also predicts outcomes in later life such as income and smoking in addition to the pure test score. The motivation effect can explain 19 percent of the variation in the average test scores between countries. JEL classification: I20, J24 The authors like to thank Jan van Damme, Maarten Groos, Daniel Hamermesh, James Heckman, Anna Salomons and seminar participants at the 2012 NBER Summer Institute, 2012 AEA Conference, 2011 EALE Conference, 2011 ESSLE, the Catholic University of Leuven, the conference of the Dutch organization of statisticians, the Swedish Institute for Social Science (SOFI), the University of Amsterdam, and Uppsala University for useful comments.
-
Upload
truongkiet -
Category
Documents
-
view
226 -
download
0
Transcript of The Leaning Tower of Pisa - Society of Labor Economists · 1 The Leaning Tower of Pisa Decomposing...

1
The Leaning Tower of Pisa
Decomposing achievement test scores into cognitive and
noncognitive components
Lex Borghans, Maastricht University
Trudie Schils, Maastricht University
Draft version October 31, 2012
Abstract
Test scores on achievement tests depend on both cognitive and noncognitive skills. The
predictive power of achievement tests is therefore potentially due to all components. The
question of this paper is whether it is possible to disentangle cognitive and noncognitive factors
from the performance on the test. Using data from the international achievement test PISA, we
decompose the test scores into two factors. We investigate the development of the performance of
students during the test, utilizing the (randomized) difference in the order of the test questions in
the various test booklets. We document that performance substantially drops during the test and
that this performance drop differs between types of students and countries. The estimated size of
the drop is very stable over the years, while correlation between this drop and the test scores is
small. This suggests that the decline in test scores during the test picks up something else than
just cognition. The size of the decline in test scores during the test is related to personality traits,
mainly to agreeableness, and to motivational attitudes towards learning. It also predicts outcomes
in later life such as income and smoking in addition to the pure test score. The motivation effect
can explain 19 percent of the variation in the average test scores between countries.
JEL classification: I20, J24
The authors like to thank Jan van Damme, Maarten Groos, Daniel Hamermesh, James Heckman, Anna Salomons
and seminar participants at the 2012 NBER Summer Institute, 2012 AEA Conference, 2011 EALE Conference, 2011
ESSLE, the Catholic University of Leuven, the conference of the Dutch organization of statisticians, the Swedish
Institute for Social Science (SOFI), the University of Amsterdam, and Uppsala University for useful comments.

2
1. Introduction
There is a growing awareness in the literature that standard measures in tests used for economic
analyses, even IQ but certainly achievement tests, do not only reflect students’ ability, knowledge
and intelligence but also seem to have powerful components related to noncognitive skills such as
personality traits and motivation. The predictive power of these tests can therefore be due to both
the cognitive abilities and noncognitive traits they measure. Neglecting these differences might
lead to an overestimation of the importance of cognitition and an unjustified unidimensional
interpretation of success. Separating these components improves our understanding of how
school performance affects later life outcomes.
The aim of this paper is to disentangle cognitive and noncognitive factors from the
performance one test. We show that this is possible, when using all information that is included
in the test, beyond the simple overall test score. Students typically perform better on the first than
on later questions in a test. We use the random variation in the order of the questions in the
different test booklets of the international PISA test to identify the decrease in performance
during the test. We show that performance indeed declines during the test, that differences
between groups are stable over time, that this decline differs from cognition, that it is related to
noncognitive skills such as personality traits and motivation, and that it predicts future outcomes.
This evidence suggests that the performance decline measures aspects of personality other than
ability or cognition that matter for success. We therefore conclude that it is possible to
disentangle congnitive and noncognitive components of personality that predict life outcomes
differently from one achievement test. This provide objective measures of personality not relying
on standard self assessment measures.
Recent literature provides ample evidence that to understand labor market and other
outcomes in life, skills have to be regarded as multidimensional. Autor, Levy and Murnane
(2003) have shown that developments in the labor market can be explained by distinguishing
different types of skills. Autor, Katz and Kearney (2006) use this distinction to explain the
polarization in the US labor market. Similar results are found for Britain (Goos and Manning,
2007) and Europe (Goos, Manning and Salomons, 2009). Cunha et al. (2010) show that in skill
acquisition both cognitive and noncognitive skills play a role. Heckman, Malofeeva, Pinto, and
Savelyev (2007) and Heckman and Rubinstein (2001) show that outcomes of individuals varying

3
from labor market success to risky behavior and health are predicted by both cognitive and
noncognitive skills. Psychological measures are therefore of potential relevance for economists.
Borghans et al (2008b) overview the psychological literature and discuss how this information
could be used in economic analyses. Most outcomes are affected by both dimensions. The degree
to which cognitive and noncognitive skills matter varies between the different outcomes.
A growing body of empirical literature shows that grades, achievement and IQ tests in
general load quit substantially on personality traits. Duckworth et al. (2009) give an overview of
the psychological literature about the link between personality and IQ. It can be expected that
there are differences between students in their motivation to perform well on a test. A study of
Eklöf (2007) on the test-motivation of Swedish students in TIMSS 2003 shows that some
students report competitive, comparative or social-responsibility reasons for being highly
motivated to perform well on the test, while others are more intrinsically motivated to do so.
Duckworth et al. (2011) show that a lack of test motivation is especially observed for students
that have below-average IQ. For high stakes tests other personality traits might become
important. Segal (2011) shows that scores on the AFQT increase when the test is high-stake.
Borghans et al. (2008b) show that improvements in IQ tests due to monetary incentives differ
between students with different personalities. Borghans et al. (2011) illustrate the indentification
problem that arises when different personality traits affects measures for personality.
A usual way to deal with differences in how students make tests is either to create a test
environment that is equal for all students or to control for unintended influences by using separate
measures. Both approaches face serious limitations. Test conditions can be equalized but it is
hard if not impossible to equalize motivation and attitude across students. Controling for
personality traits and motivation is typically based on self-assesment. Our approach contributes in
three ways to the literature. First, rather than applying additional tests we use the information
contained in the achievement test to disentangle its components. Second, in this way we get a
measure for a personality trait which is not self-assesed and therefore not biased by a lack of self-
knowledge of people and not vulnerable to manipulation by participants who can benefit from
suggesting specific personality traits (Paulhus 1984, Viswesvaran and Ones 1999, Sternberg et al.
2000, Sternberg 2001, Vazire and Carlson, 2010). Third, eliciting both cognitive and
noncognitive factors from the same source of information is the best proof that different
dimensions affect the test results.

4
The implications of a non-subjective reliable approach to decompose achievement test scores
into both the cognitive and noncognitive factors are large. In this way overestimation of the effect
of cognitive skills on schooling and later life outcomes can be avoided. Analyses based on one
single measure that captures both cognitive and non-cognitive factors mistakenly suggests that
one single factor determines future success. Alternative routes for educational interventions that
are not primarily targeted at cognitive performance but emphasize non-cognitive factors will than
be ignored. It can also have implications for the conclusions based on international tests such as
PISA. Differences in motivation and personality between countries could bias this picture.
Several studies suggest that such cross-country differences are even larger than within-country
differences. For example, Boe et al. (2002) concluded in a TIMSS 1995 study that test motivation
accounted for 53 percent of between-country variation in math achievements and only for 7
percent of between-student variation within classrooms.
The remainder of this paper is as follows. In section 2 we describe the approach that we use
to identify ability and personality in achievement tests. In section 3 we describe the data. In
Section 4 we present the main results of our analyses and the methods used, in section 5 we give
some implications and conclusions. The appendix provides some more detailed information on
the methods used and shows the result of the robustness checks.
2. Approach / theory
The basic idea of this paper is that if scores on achievement tests depend on the achievement of
participant i (ai) that the test intends to measure and on another personality trait of this person
(pi), also the correctness of each individual question j will depend on ai and pi. Personality could
of course be multidimensional, but here we assume a one-dimensional trait that affects test
scores. Additionally, also the circumstances under which a question j is asked to participant i (cij)
can affect the score. For each question j the correctness of the answer by participant i (yij) can be
written as:
ijijiijij cpafy ε+= ),,(
Assuming fj to be linear in ai en pi gives

5
ijijjiijjiijjij cpcacy εγβα +++= )()()(
Suppose that – given the circumstances under which a question was asked (cij) – the parameters
αj, βj, and γj would be known for each question, then ai and pi can be identified if the answers on
at least two questions are known and the ratio αj/βj differs for both questions. With information
about more questions and sufficient variation in αj/βj, ai and pi can be estimated with more
precision.
In general the parameters αj, βj, and γj are unknown though. Almlund et al. (2011) and
Borghans et al. (2011) show that this leads to a fundamental identification problem. Essentially
the system is a factor model. These factors can be extracted but every rotation gives a suitable set
of factors, so empirically it is not clear what factor to assign to achievement and what factor to
personality. If different types of people perform relatively well on some question rather than on
other it is not clear whether achievement is multi-dimensional or that this is the consequence of
the influence of personality on test performance . Based on the context of the test an
operationalization of the factors is needed, in which each factor is essentially defined. An easy
example would be a case in which the performance on some questions is only affected by one
factor.
In this paper we use the observation that the performance of students declines during the
test to disentangle ability and personality. This decline in performance during the test allows us to
define the personality factor as the component in performance that is related to the question
number. As an operationalization of the personality factor we therefore assume that only the
effect of pi on the performance on a question increases with the question number Qij:
ijijiij Qc 10)( ππββ +==
Since questions differ in difficulty we assume jγ to be a constant for each specific question and α
not to depend on i or j. This gives
( ) ( ) ijijijiiijjjiiiij QppaQppay επγπαεγππα ++++=++++= 1010

6
ijjijiiij Qy εγδδ +++= 10 with iii pa 00 παδ += and ii p11 πδ =
So a regression of yij on the question number gives the estimate of pi up to a linear transformation
with π1, assuming that αi and γi are not correlated with the question number Qij. Randomization of
the order of the questions makes it possible to identify pi without this assumption.
The equation also shows that this operationalization does not make the identification of ai
possible. The constant of the regression of yij on the question number depends both on
achievement and personality. If π0 is unknown a measure of achievement ai can therefore not be
measured. There are two straightforward options to operationalize achievement. One option is to
assume that pi does not affect the answer on a test in the beginning of the test. That implies the
assumption that π0=0. We use this assumption in this paper as a normalization, so defining ability
as the performance at the first question. Another option would be to assume that ai and pi are not
correlated. We will come back to that assumption later in the paper.
3. Data
PISA 2006
The PISA dataset is the first dataset used for this study. The Program for International Student
Assessment (PISA) is administered to 15-year-olds in schools in a wide range of countries. Four
assessments have so far been carried out (2000, 2003, 2006, and 2009).1 Students take tests with
questions on mathematics, reading and science. The main analyses in this paper are based on the
2006 wave, the other PISA waves are used for the robustness analyses. In 2006 398,750 students
in 57 countries were tested.2
In the 2006 PISA assessment, the questions are allocated to 13 item clusters (7 science, 2
reading and 4 mathematics), with each cluster representing 30 minutes of test time. The clusters
are divided into 13 different booklets, each containing four clusters, hence representing two hours
of test time. Students are allowed a short break after one hour. The distribution of clusters is
according to a rotating design whereby each cluster appears in four of the booklets and each pair
of clusters appears in one and only one booklet (OECD 2009b). Important for our research is that 1See www.pisa.oecd.org. 2 In 3 countries (Kyrgyztan, Lithuania and Thailand), student ids were not unique and were therefore excluded from the analyses.

7
the order of the clusters (and consequently the questions) differs between the various booklets
and that the booklets are randomly assigned to students. Information on which questions are in
which booklets is available in the PISA codebooks, including the position of the questions in the
test (OECD 2009c). So for every individual student in the PISA sample we know the order of the
questions he faced and whether he answered the questions correctly or not. We use the random
variation in the assignment of the booklets to students to estimate the drop in performance while
the test progresses.The number of test questions in the various booklets ranges from 51 to 60 in
2006.3 On average, students completed 97 percent of the test.
The analyses are run for all countries separately and for a representative sample of
individuals across all countries. We sampled 30,000 individuals from all countries that
participated in PISA 2006 in a ratio that reflects the number of 15-year olds in these countries as
a world sample.
Inventaar 2010
In addition to the PISA study, we used two other datasets for a more in-depth analysis of the
relation between the performance decline and student characteristics (e.g. personality traits) and
to investigate the relationship between our measure for ability and motivation and later outcomes
in life. First, we use data from Inventaar, a 2010 Dutch research on the performance of 15-year
old students (Schils 2011). The students in this sample attend secondary school in Limburg, a
southern region of the Netherlands, where about 75 percent of the complete 15-year old student
population participated in the research project. Part of the research was a math and reading test
that contains the released items from the 2000-2006 PISA tests and items from two other math
tests. In contrast to PISA, the order of the questions in the Inventaar data does not vary randomly
between the students, it only varies to a certain extent between tests designed for certain
educational levels. The order of the question could therefore pick up the decline in performance
during the test and a possible trend in the difficulty of the questions accross the test. However,
identification of the absolute performance drop is not needed since we are interested in
explaining differences in the performance drop. In addition, knowing the (ex ante) difficulty level
3 In 2006, in the science part of the test some questions were added on the opinion of students in the field of science questions. These questions were excluded from the analyses in our paper, and only test questions are used. Though it could be argued that the students did have to answer these opinion questions, it can as well be argued that because of the nature of the questions they were able to take a short break from the real test questions.

8
of the question from the source questionnaires (similar population), this test is constructed in such
a way that the question difficulty does not systematically change during the test.
In addition, the Inventaar data contains information on students’ personality and motivational
attitudes towards learning and school in general. Students and their parents had to complete 20
statements with which the BIG-5 personality is assessed. In addition, students had to complete
statements to assess their ambition (e.g. “I want to get high grades”, or “I want to be good in my
job later”) and grit (e.g. “I continue my tasks until I succeed”, “I do not quit easily”). The
Inventaar data also contains some information on motivational factors. First, students had to
complete statements with their motivation to go to school (e.g. “I like going to school”, “I would
quit school if I could find a job”) and motivation to learn (e.g. “I love to learn new things”, “I will
keep on learning for a long time”) is assessed. Second, there is information on how many times
the students are absent from school, i.e. playing truant, answered by both the parents and the
students. These questions enable us to test the relation between the test performance drop and
personality or motivation.
British Cohort Study 1970
To investigate the effect of the cognitive and noncognitive factors of the test score on later
outcomes we use the British Cohort Study (BSC70), a longitudinal survey of people born in a
specific week in 1970. At the age of 16 a math test is included that we analyze in a similar
fashion as PISA. The test consists of 60 questions. The reason for using these data in this paper is
that the cohort of the BSC70 has been followed over a long period of time. We use the survey at
the age of 36 to investigate whether the measures for achievement and motivation that can be
derived from the math test predict future outcomes and whether both measures add information to
the predictive power of the other measure. We use the following outcome measures: A dummy
for whether people are employed and whether their job is fulltime, the number of paid and unpaid
overwork hours the log of their net labor income are indicators of the labor market performance;
the level of their educational qualification as an educational outcomes; How frequent they read
newspapers and magazines and books; Whether they are victim of crime and whether they were
moved, warned, stopped, arrested, … by the police; self assessed health and an indicator for
smoking and drinking behavior as health outcomes; marital status (married, divorced and single)
and the number of children as family outcomes; and finally a measure for life satisfaction.

9
4. Results
Performance declines during the test
To show the decline of performance during the test we use the fact that the clusters of questions
in the PISA test have a different position in the various booklets. There are four clusters in each
booklet. Figure 1 shows the mean score of the questions in each cluster at the four different
positions of the booklet. The figure shows that with only one small exception, for each cluster of
questions the mean score is lower when the cluster is positioned at a later place in the booklet.
Figure 1: mean score of questions in each cluster, by position in the booklet
Figure 2 depicts the predicted probabilities of giving the correct answer for each question, given
their position in the test, controling with question dummies for the difficulty level of each
question. The figure clearly shows that students perform better on the earlier questions than on
the latter ones. Apparently students loose concentration or their willingness to do well on the test,
while they proceed. The decrease in performance during the test is approximately linear, in this
example with a 11 percent decline in the probability of answering the question correctly.
Figure 2: predicted probability of correct answer for each question by position in the test
0.1
.2.3
.4.5
Mea
n sc
ore
Sci
ence
1
Sci
ence
2
Sci
ence
3
Sci
ence
4
Sci
ence
5
Sci
ence
6
Sci
ence
7
Mat
h 1
Mat
h 2
Mat
h 3
Mat
h 4
Rea
d 1
Rea
d 2
mean if 1st cluster mean if 2nd clustermean if 3rd cluster mean if 4th cluster

10
Aa a next step in our analysis we therefore summarize the performance during the test with a
linear specification. A basic model is specified as follows:
(model a) ijijij Qy εδδ ++= 10
The dependent variable, yij is 0 if the answer of participant i on question j is wrong and 1 if he
answers this question rightly. The independent variable of interest, Qij is the sequence number of
the test question, rescaled such that the first question is numbered as 0 and the last question as 1.
The constant δ0 therefore represents the average student’s performance on the first question. The
estimated coefficient δ1 shows the pattern of the test performance drop (i.e. the slope). The
estimated coefficient equals the decline in performance from the first till the last question of the
test. Finally, εij is the error term. In our main model we treat questions that have not been reached
by the students as missing and the questions skipped as a wrong answer. Later in this paper we
show that a different treatment of these questions does not affect our results.
We use a fixed-effects model to cover the unobserved characteristics of the question. This
can be the difficulty level of the question or the nature of the question (e.g. multiple choice or
open), but also covers the type of the question (math, science or reading). The extended model is
specified as follows:
(model b) ijjijij Qy εγδδ +++= 10
with γj being the question fixed effect for question j.
.3.3
5.4
.45
.5
Pre
dict
ed p
roba
bilit
y co
rrec
t ans
wer
0 .2 .4 .6 .8 1
% of test questions completed

11
Alternatively, we include student characteristics, such as gender and socioeconomic
background that might have an effect on a student’s test performance.
(model c) ijijij SESFemaleQy εδδδδ ++++= 3210
For gender we include a dummy. For socioeconomic background we use the PISA index of
economic, social and cultural status that is derived from (a) the highest international socio-
economic index of occupational status; (b) the index of highest educational level of parents; and
(c) the index of home possessions (OECD 2007). We assess to which percentile of the country-
specific score distribution a student belongs. The index is standardized with a mean of 0 and a
standard deviation of 1. Fourth, we run a regression covering both question and student
characteristics at the same time:
(model d) ijjijij SESFemaleQy εγδδδδ +++++= 3210
Finally, in we run a regression including both question dummies and student fixed effects:
(model e) ijijijij Qy εδγδδ ++++= 10
in which iδ is the student fixed effect. Table 1 provides the estimates of the various models. All
estimates are significant and accounting for question or student characteristics does not change
the estimated drop substantially.
Table 1. Estimated performance decline during the test using different specifications, PISA 2006
qnr constant b se b se a. Basic model: only question number -0.09 0.001 0.47 0.001 b. Extended model: controlling for question -0.07 0.001 0.46 0.001 c. Extended model: controlling for student characteristics -0.09 0.001 0.51 0.001 d. Extended model: controlling for question and student characteristics -0.08 0.001 0.50 0.001 e. Extended model: controlling for question and student fixed effect -0.09 0.001 n.a.
Differences in the decline between groups are stable over time
An important question is whether this decline in test performance is a stable characteristic of the
PISA test and not something spurious. To investigate this, we estimated the model for each
country using PISA 2003 and PISA 2006. Figure 3 depicts the relationship between the 2003 and
2006 slopes (decline in performance during the test) and the 2003 and 2006 constants

12
(performance on the first question) of the country-specific models. It shows that these estimates
of the test performance drop per country are highly correlated between the waves of PISA
(correlations 0.84 and 0.89), indicating that they are indeed stable and thus robust indicators.
Figure 3. Relationship of the estimated drop in performance during the test and estimated performance on
first question between PISA2003 and PISA2006
Panel 3A: Estimated drop in the performance during the test
Panel 3B: Estimated performance on first question
-.14
-.12
-.1
-.08
-.06
-.04
2006
-.3 -.25 -.2 -.15 -.1 -.05
2003
Correlation 0.84
.4.5
.6.7
.8.9
2006
.3 .4 .5 .6 .7
2003
Correlation 0.89

13
The decline differs from ability
There is no strong correlation between the decline in performance and the performance on the
first question. This is shown in Figure 4. The high stability of the estimated decline together with
the low correlation between ability and the decline of performance suggest that this decline is
related to other characteristics than pure ability or cognition and that these noncognitive
influences on test scores vary substantially between countries.
Figure 4. Relationship between the estimated drop in the performance during the test and estimated
performance on first question, PISA2006
The correlation between the performance on the first question and the decline in performance
can also be investigated by estimating the performance decline for each student seperately to
calculate the correlation between the two estimates. A complication of doing this is that
individual estimates face quite some impressision. The errors in the estimates are negatively
correlated. A stronger (more negative) decline is associated with a higher performance on the first
question. To correct for the estimation error we substrated a matrix with the estimated
(co)variance of the estimation error from the covariance matrix of the estimates. Table 2 provides
the results.
Table 2. Raw and corrected standard deviation of the performance on the first question, and the
performance decline and the correlation between both variables.
-.14
-.12
-.1
-.08
-.06
-.04
Est
imat
ed c
ount
ry-le
vel t
est p
erfo
rman
ce d
rop
.4 .5 .6 .7 .8 .9
Estimated country-level performance on first question (constant)
Correlation 0.38

14
Raw standard deviation or
correlation
Average standard error Corrected standard
deviation or correlation
Model without slope
Average performance 0.202 0.063 0.192
Model with slope
Performance on the first
question
0.279 0.207 0.188
Performance decline 0.265 0.181 0.194
Correlation -0.068 -0.052 -0.043
For comparison reasons also the standard deviation of a model that only takes the average
performance into account is included. The standard deviation of the average probabilty to give
the right answer between students equals 0.202. The average standard error of each single
estimation equals 0.063. Taking this into account as a source of variation in the estimates brings
the standard deviation slightly down to 0.192.
The performance on the first question, in a model with a performance slope, is substantially
larger than the average performance. The reason for this is that the standard error of the estimates
is more than three times larger. After correcting the variation in the estimates for estiamtion error,
the remaining standard deviation equals 0.188. This is slightly lower than the standard deviation
of the model without a slope. The reason is that part of the variation in the model without slope,
is picked up by the variance in the performance decline in the extended model. The variation in
the performance on the last question is bigger than the variation on the first question in this
model.
The correlation between the estimated performance on the first question and the performance
decline equals -0.068 using the raw estimates. After correcting for measurement error a
correlation of -0.043 remains, confirming that there is not much correlation between the
performance on the first question and the performance decline.
The decline is related to personality traits and motivation
To verify our interpretation that the decline in performance during the test is related to
motivation and personality we interacted the sequence number of the question with measures of
personality traits. Pisa does not contain information about personality. We therefore used the
Dutch Inventaar 2010 data set. To test whether the test performance drop is related to personality

15
or motivational factors and outcomes in later life, we estimate interaction models, based on
model b:
(model f) ijjiijiijij ZQZQy εγδδδδ +++++= 5410
where Zi represents the following variables: The Big 5 personality traits (Openness,
Conscientiousness, Extraversion, Agreeableness, Neuroticism) and locus of control; motivation
to learn and go to school; and ambition and grit.
In theory it is possible to estimate the models for each student separately. The small number
of observations will give very unprecise estiamates though. That is why we prefer this approach
with interaction effects. By comparing the distribution of the individual estimates with the
estimated standard errors the size of the measurement errors and the variance and covariance of
the two perfomance measures can be estimated.
Table 3 summarizes the results for the personality traits and motivational attitudes. First
we explain the test performance drop by personality traits and their interaction with the question
number seperately (each personality trait in separate regression). From the Big 5 variables,
consicientiousness, but especially agreeableness turn out to be associated with a smaller
performance drop. In addition to the Big 5 personality traits, we looked at the interaction effect
with ambition and grit. In the separate models, we find that ambition has a positive effect on the
performance drop during the test, i.e. more ambitious students have a smaller performance drop
during the test. Finally, we investigated the relation between the test performance drop and
motivational factors. We find strong relations between the motivation of the student to learn and
to go to school and the performance drop during the test: more motivated students have smaller
performance drops. Students with higher absence rates have a larger performance drop during the
test.
When looking at the psychological traits simultaneously in one regression model four
psychological traits explain the performance drop. Agreeableness, ambition, motivation to learn
and in a negative way grit.
Table 3. Regression results for the interaction effects between personality traits and the estimated drop in
performance during the test, Inventaar 2010
Separate Simultaneous1 b se b se Openness 0.02 0.024 -0.01 0.032

16
Conscientiousness 0.04 0.020 ** -0.00 0.029
Extraversion -0.02 0.019 -0.03 0.026
Agreeableness 0.17 0.024 *** 0.13 0.036 ***
Neuroticism 0.01 0.018 -0.02 0.025
Ambition 0.18 0.026 *** 0.12 0.038 ***
Grit 0.02 0.020 -0.09 0.033 ***
Motivation to go to school 0.16 0.033 *** -0.02 0.024
Motivation to learn 0.14 0.026 *** 0.10 0.034 ***
Absence rate -0.02 0.006 *** -0.01 0.007 1All models are controlled for study track, sex and socio-economic background of the students.
The decline predicts future outcomes
To test whether the test performance drop is related to outcomes in later life, we turn to British
Cohort Study to estimate an interaction model in which both the performance on the first
question and the performance decline at age 16 are related to outcomes at age 36:
(model g) ijjiijiijij ZQZQy εγδδδδ +++++= 5410
where Zi represents later life outcomes such as marital status, employment status, highest
educational qualification, health status, drinking and smoking behavior.
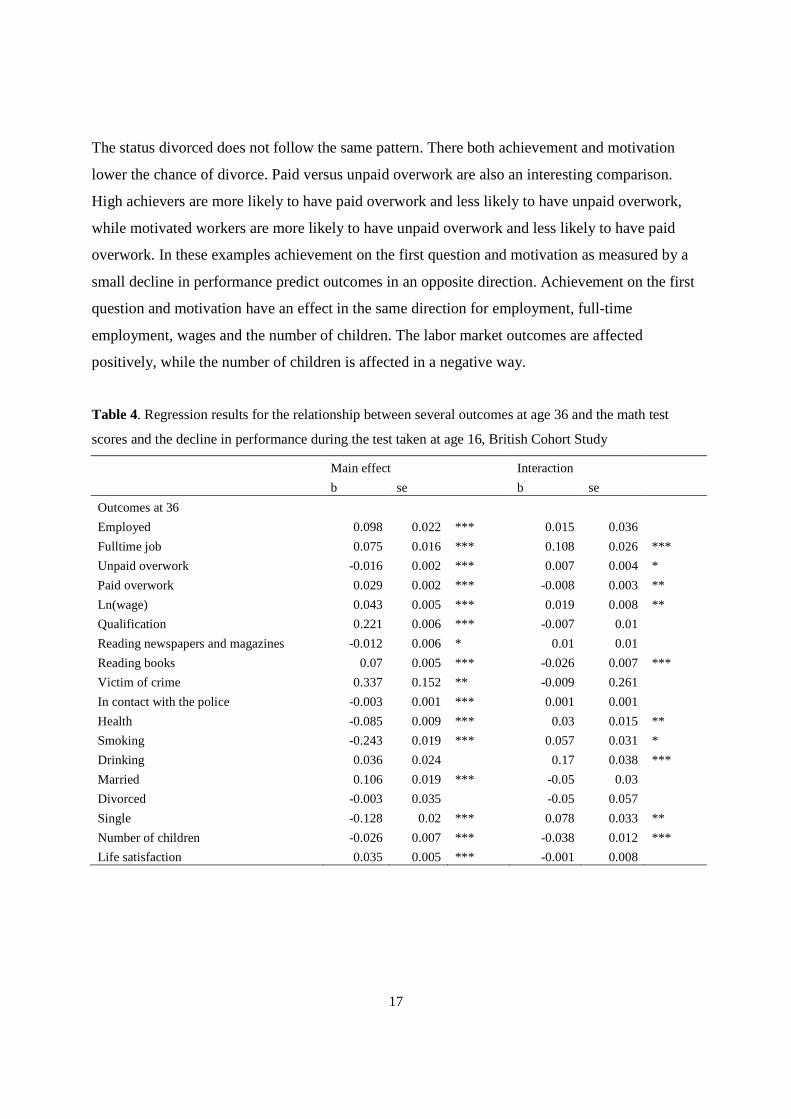
Based on the British Cohort Study, Table 4 shows that the decline in performance during the
test has a predictive value above the predicted value of the ability as measured by the
performance on the first question. For various outcomes both variables significantly predict
success 20 years later, e.g. fulltime work, academic qualification, smoking and drinking behavior.
When interpreting these estimates, one has to bear in mind that the proposed measures for
achievement might still be loaded with personality factors to some extent. To the extent that this
is the case, high estimates for the coefficient of achievement on the first question, might lead to
lower estimates for the performance drop in that regression to compensate for this. The table
shows that indeed positive estimates for the main effect are often associated with negative
estimates for the interaction effect. It is therefore important to look at the ratios of both
coefficients.
The variables single and married are examples of outcomes that are predicted by
achievement – high achievers have more a higher probability to be married and a lower
probability to be single – but reversely affected by the motivation factor: people with a high
performance drop have a higher probability to be married and a lower probability to be single.
17
The status divorced does not follow the same pattern. There both achievement and motivation
lower the chance of divorce. Paid versus unpaid overwork are also an interesting comparison.
High achievers are more likely to have paid overwork and less likely to have unpaid overwork,
while motivated workers are more likely to have unpaid overwork and less likely to have paid
overwork. In these examples achievement on the first question and motivation as measured by a
small decline in performance predict outcomes in an opposite direction. Achievement on the first
question and motivation have an effect in the same direction for employment, full-time
employment, wages and the number of children. The labor market outcomes are affected
positively, while the number of children is affected in a negative way.
Table 4. Regression results for the relationship between several outcomes at age 36 and the math test
scores and the decline in performance during the test taken at age 16, British Cohort Study
Main effect Interaction
b se b se
Outcomes at 36
Employed 0.098 0.022 *** 0.015 0.036
Fulltime job 0.075 0.016 *** 0.108 0.026 ***
Unpaid overwork -0.016 0.002 *** 0.007 0.004 *
Paid overwork 0.029 0.002 *** -0.008 0.003 **
Ln(wage) 0.043 0.005 *** 0.019 0.008 **
Qualification 0.221 0.006 *** -0.007 0.01
Reading newspapers and magazines -0.012 0.006 * 0.01 0.01
Reading books 0.07 0.005 *** -0.026 0.007 ***
Victim of crime 0.337 0.152 ** -0.009 0.261
In contact with the police -0.003 0.001 *** 0.001 0.001
Health -0.085 0.009 *** 0.03 0.015 **
Smoking -0.243 0.019 *** 0.057 0.031 *
Drinking 0.036 0.024 0.17 0.038 ***
Married 0.106 0.019 *** -0.05 0.03
Divorced -0.003 0.035 -0.05 0.057
Single -0.128 0.02 *** 0.078 0.033 **
Number of children -0.026 0.007 *** -0.038 0.012 ***
Life satisfaction 0.035 0.005 *** -0.001 0.008

18
5. Implications and conclusions
In this paper we investigated whether it is possible to disentangle ability and personality factors
from test results. We show that there is a drop in performance during the PISA test and provide
evidence that this decline is related to motivation and personality. Especially motivation and to
some extent agreeableness are important in explaining this drop in performance. Longitudinal
data shows that both the pure ability and motivation as measured by this decline in performance
predict later outcomes. This suggest that both ability and motivation matter for later succes. Both
factors matter differently for different outcomes suggesting that for some outcomes ability
matters most, while for other outcomes personality is more relevant. These findings have some
implications.
The impact on country rankings
We thus have shown that results on the PISA test are affected substantially by the motivation of
students to do well during the test. The remaining question is to what extent differences in
motivation affect the scores and the country rankings typically published to compare the
educational performance of countries. Estimating these slopes per country shows substantial
variation between countries, as Table 5 summarizes. The effect varies from 4 percent in Finland
to 15 percent in Greece. Note that in all countries the estimated decline in test performance is
highly significant.
There are two ways in which the PISA country scores can be adjusted to correct for
motivational issues. The first approach is to use the estimated performance on the first question
as a measure of ability. This assumes that at the first question motivation does not matter yet. We
expect this approach to underestimate the true effect of motivation. A second approach is to
regress PISA scores on the performance drop as a measure of motivation and to use residuals as
the corrected scores.
Table 5 shows the implications for the country rankings. The first column gives the
ranking based on raw scores. The difference between this league table and tables published by the
OECD is that we take together scores on math, science and language and that we use the plain
fraction of right answers, while the OECD reports estimates of ability using an Item Response
Model. However, we already reported on the high correlation between our raw score and the

19
PISA measures. The table shows that some countries move up substantially in the league table
when motivational factors are taken out while other countries move down in the rankings. Japan,
Great-Britain, Italy and Greece seem to have a much better performance if the measure would be
based on ability rather than on motivation, while for Belgium, Austria and Germany scores turn
out to be relatively high because their students seem to be more motivated.
Table 5: Country league tables, PISA 2006
Raw score Performance first question Performance drop Corrected score mean(goed) b se b se FIN 0.630 0.880 0.011 -0.042 0.003 0.726 HKG 0.600 0.847 0.012 -0.059 0.003 0.743 TAP 0.597 0.869 0.009 -0.074 0.002 0.767 CZE 0.584 0.838 0.011 -0.077 0.003 0.760 NLD 0.581 0.818 0.012 -0.075 0.003 0.752 KOR 0.575 0.820 0.011 -0.062 0.003 0.717 NZL 0.570 0.801 0.012 -0.062 0.003 0.713 JPN 0.566 0.892 0.011 -0.093 0.003 0.778 EST 0.559 0.807 0.012 -0.065 0.003 0.707 LIE 0.558 0.868 0.044 -0.071 0.011 0.721 BEL 0.557 0.817 0.009 -0.073 0.002 0.723 CAN 0.554 0.818 0.005 -0.070 0.001 0.716 AUS 0.553 0.819 0.007 -0.077 0.002 0.731 DEU 0.546 0.799 0.012 -0.064 0.003 0.693 CHE 0.539 0.847 0.007 -0.055 0.002 0.666 MAC 0.539 0.852 0.012 -0.070 0.003 0.699 AUT 0.531 0.833 0.012 -0.055 0.003 0.656 IRL 0.531 0.743 0.012 -0.059 0.003 0.668 GBR 0.527 0.753 0.007 -0.085 0.002 0.722 SWE 0.524 0.820 0.012 -0.078 0.003 0.704 POL 0.519 0.840 0.011 -0.085 0.003 0.712 ESP 0.517 0.813 0.006 -0.087 0.002 0.716 DNK 0.517 0.848 0.012 -0.070 0.003 0.677 HUN 0.515 0.793 0.012 -0.076 0.003 0.690 FRA 0.507 0.810 0.012 -0.083 0.003 0.695 ISL 0.505 0.794 0.014 -0.093 0.004 0.719 LVA 0.496 0.746 0.012 -0.087 0.003 0.696 SVN 0.495 0.800 0.010 -0.073 0.003 0.661 SVK 0.490 0.822 0.012 -0.080 0.003 0.673 NOR 0.489 0.797 0.012 -0.093 0.003 0.701 ITA 0.484 0.725 0.006 -0.105 0.001 0.723 LUX 0.484 0.799 0.012 -0.083 0.003 0.673 RUS 0.477 0.825 0.011 -0.100 0.003 0.705 HRV 0.477 0.756 0.011 -0.076 0.003 0.650 PRT 0.471 0.807 0.011 -0.086 0.003 0.668 GRC 0.460 0.770 0.012 -0.133 0.003 0.763 ISR 0.420 0.644 0.013 -0.121 0.003 0.705

20
URY 0.408 0.703 0.012 -0.135 0.003 0.718 CHL 0.400 0.737 0.011 -0.093 0.003 0.614 USA 0.398 0.763 0.010 -0.074 0.003 0.585 BGR 0.383 0.658 0.012 -0.097 0.003 0.605 SRB 0.380 0.699 0.011 -0.079 0.003 0.560 MEX 0.366 0.602 0.004 -0.084 0.001 0.560 TUR 0.363 0.588 0.011 -0.093 0.003 0.574 JOR 0.350 0.490 0.010 -0.086 0.003 0.546 ARG 0.341 0.623 0.012 -0.098 0.003 0.568 ROU 0.337 0.594 0.011 -0.109 0.003 0.587 COL 0.336 0.573 0.012 -0.104 0.003 0.573 MNE 0.320 0.563 0.012 -0.065 0.003 0.469 AZE 0.313 0.571 0.010 -0.048 0.003 0.422 BRA 0.301 0.576 0.008 -0.092 0.002 0.512 TUN 0.290 0.449 0.011 -0.106 0.003 0.532 IDN 0.288 0.618 0.007 -0.068 0.002 0.443 QAT 0.216 0.477 0.009 -0.102 0.002 0.450
Implications for test development
The approach we took in this paper show that it is possible to use achivement test to measure
multiple aspects of the skills and personality of a student. This offer the opportunity for objective
personality measures that could replace subjective self-assesed scores that are typically used in
psychology. As has been shown in Table 3 the performance decline as measured in this paper
represents both agreeableness and motivation. Furthermore Table 2 shows that the precision of
the measurement on an individual level is not very high yet. The method could be further
improved by developing questions for the test that typically load on a specific personality traits of
interest. Such a focus together with a stronger contrast between regular questions and these
questions that pick up a certain personality traits could improve the precision of the measures.
References
Almlund, Mathilde, Duckworth, Angela, Heckman, James J. and Kautz, Tim (2011). “Personality psychology and economics.” In E. A. Hanushek, S. Machin, and L. Wößmann (Eds.), Handbook of the Economics of Education, Volume 4, pp. 1–181. Amsterdam: Elsevier.Autor, Katz and Kearney (2006)
Autor, David H., Levy, Frank, Murnane, Richard J. (2003) , “The Skill Content of Recent Technological Change: An Empirical Exploration.” Quarterly Journal of Economics 118(4), pp. 1279-1333.

21
Baumert, J. and A. Demmrich (2001), “Test motivation in the assessment of student skills: The effects of incentives on motivation and performance.” European Journal of Psychology and Education 16 (3), pp. 441-462.
Boe, E.E., H. May and R. F. Boruch (2001), “Student task persistence in the third international mathematics and science study: a major source of achievement differences at the national, classroom and student levels.” Research Report no. 2002-TIMSS1, Centre for Research and Evaluation in Social Policy, University of Pennsylvania, Philadelphia.
Borghans, L. H. Meijers and B. Ter Weel (2008a), “The role of noncognitive skills in explaining cognitive test scores.” Economic Inquiry 46 (1), pp. 2-12.
Borghans, Lex, Duckworth, Angela L., Heckman, James J. and ter Weel, Bas (2008b), “The Economics and Psychology of Personality Traits.” Journal of Human Resources 43(4): 972-1059.
Borghans, L. H., B. Golsteyn, J. J. Heckman, and J. E. Humphries (2011), “IQ, Achievement and Personality.” Personality and Individual Differences 51, pp. 315–320.
Cunha, Flavio, Heckman, James J. and Schennach, Susanne M. (2010), “Estimating the Technology of Cognitive and Noncognitive Skill Formation.” Econometrica 78(3): 883-931.
Duckworth, A.L., Quinn, P.D., Lynam, D., Loeber, R., Moffit, T. and Caspi, A. (2010), “What intelligence tests test: Individual differences in test motivation and IQ.” Unpublished manuscript, University of Pennsylvania.
Eklof, H. (2007), “Test-taking motivation and mathematics performance in TIMSS 2003.” International Journal of Testing 7 (3), pp. 311-327.
Goos, Maarten and Manning, Allen (2007), “Lousy and Lovely Jobs: The Rising Polarization of Work in Britain.” Review of Economics and Statistics 89(1), pp. 118-33.
Goos, Maarten, Manning, Alan, Salomons, Anna (2009), “Job Polarization in Europe.” American Economic Review 99(2), pp. 58-63.
Heckman, James, Malofeeva, Lena, Pinto, Rodrigo, and Savelyev, Peter A. (2011). Understanding the mechanisms through which an influential early childhood program boosted adult outcomes. Unpublished manuscript, University of Chicago.
Heckman, James J. and Rubinstein, Yona (2001). “The Importance of Noncognitive Skills: Lessons from the Ged Testing Program.” American Economic Review 91(2): 145-149. OECD (2007), PISA 2006: Science competencies for tomorrow’s world, Paris: OECD. OECD (2009a), PISA 2009: Executive Summary, Paris: OECD. OECD (2009b), PISA 2006 Technical Report, Paris: OECD. OECD (2009c), PISA 2006 Data Analysis User Manual, Paris: OECD. Paulhus, Delroy L. (1984) “Two-Component Models of Socially Desirable Responding.” Journal
of Personality and Social Psychology 46(3), pp. 598-609. Schils, T. (2011), “De leerlingen in het derde jaar van het voortgezet onderwijs in Limburg:
sociale achtergrond en schoolprestaties.” Kaans reports K04201101-K04201104, Maastricht University.
Schmitt, D. P., J. Allik, R.R. McRae, and V. Benet-Martinez (2007), “The geographic distribution of big five personality traits: Patterns and profiles of human self-description across 56 nations.” Journal or Cross-Cultural Psychology 38, pp. 173-212.
Segal, Carmit (2011), “Working When No One is Watching: Motivation, Test Scores, and Economic Success” forthcoming in Management Science.
Sternberg, Robert J. (2001), “Successful Intelligence: Understanding What Spearman Had Rather Than What He Studied.” in Intelligence and Personality: Bridging the Gap in Theory and

22
Measurement. J. M. Collis, S. Messick and U. Schiefele, eds. Mahwah, NJ, Lawrence Erlbaum Associates, pp. 347-373.
Sternberg, Robert J., Forsythe, George B., Hedlund, Jennifer, Horvath, Joseph A., Wagner, Richard K., Williams, Wendy M., Snook, Scott A. and Grigorenko, Elena (2000). Practical Intelligence in Everyday Life. New York, NY, Cambridge University Press. Vazire, Simine and Erika N. Carlson (2010), Self-Knowledge of Personality: Do People Know Themselves? Social and Personality Psychology Compass 4/8, pp. 605-620.
Viswesvaran, Chockalingam and Ones, Deniz S. (1999), “Meta-Analyses of Fakability Estimates: Implications for Personality Measurement.” Educational and Psychological Measurement 59(2), pp. 197-210.

23
Appendix: robustness checks
Skipped versus questions not reached: differential treatments
The correctness of the answer (yij) is not always observed since there are students that do not
reach the end of the test and some questions are skipped by the student. Questions that are
skipped by the student are questions that the student saw, and of which he made some kind of
judgement on whether he would be able to answer them directly or leave them for later. Students
might also skip questions because they are of a certain kind that he or she does not like or of
which he or she knows he will not be able to answer them. Questions that are not reached might
be due to slow answering of the student for which various reasons can exist (e.g. too precise in
answering, slow reader, unmotivated). Figure A1 provides information about questions that are
skipped and questions that are not reached in the test, given the position of the question in the
test.
Figure A1. Percentage of students who did not reach or skipped question number x, PISA 2006
We observe a small increase in the probability that a question is skipped when the test progresses
(perhaps the student is more eager to find out whether the next question is a more easy one to
answer when time passes, or he is running out of motivation). We also observe that after half of
the test has passed the number of questions not reached starts to increase. A question is whether
the missings answers due to skipping or not reaching should be treated the same way as any
0.0
5.1
.15
.2
% o
f stu
dent
s
0 .2 .4 .6 .8 1
% of test questions completed
Did not reach the questionSkipped the question

24
incorrect answer. To verify the robustness of our findings we apply the model to five different
versions with respect to the inclusion of questions:
1. We treat all questions not answered (both not reached and skipped) as a wrong answer. This
most likely leads to an overestimation of the test performance drop
2. We treat questions not reached as missing and the questions skipped as a wrong answer.
3. We treat questions not answered (both not reached and skipped) as missing. This most likely
leads to an underestimation of the test performance drop.
4. Similar to version 2, but only using the first half of the test questions (i.e. all questions
reached by all students).
5. Similar to version 2, but not using the first five questions. One could argue that the student
has to get used to the test.
Table A1 shows the regression results of all models. Version 2 is the version presented in the
paper.
Table A1. Estimated performance decline during the test using different specifications, PISA 2006
Version 1 Version 2 Version 3 Version 4 Version 5 b se b se b se b se b se a. Basic model: only question number Qnr -0.14 0.001 -0.09 0.001 -0.06 0.0011 -0.10 0.004 -0.08 0.002 Constant 0.48 0.001 0.47 0.001 0.50 0.001 0.47 0.001 0.46 0.001 b. Extended model: controlling for student characteristics qnr -0.14 0.001 -0.09 0.001 -0.07 0.001 -0.10 0.004 -0.08 0.002 constant 0.52 0.001 0.51 0.001 0.54 0.001 0.517 0.001 0.50 0.001 c. Extended model: controlling for question qnr -0.12 0.001 -0.07 0.001 -0.05 0.001 -0.06 0.004 -0.08 0.002 constant 0.48 0.001 0.46 0.001 0.50 0.001 0.46 0.001 0.47 0.001 d. Extended model: controlling for question and student characteristics qnr -0.12 0.001 -0.08 0.001 -0.06 0.001 -0.06 0.004 -0.09 0.001 constant 0.51 0.001 0.50 0.001 0.54 0.001 0.50 0.001 0.50 0.001
Version 1: "not reached/skipped=0"; Version 2: "not reached=., skipped=0"; Version 3: "not reached/skipped=.";
Version 4: Version 2 but only first 50% of questions; Version 5: Version 2 without first 5 questions
The estimates including questions that are not reached or skipped as wrong answers
(version 1) give a substatial higher decline, as expected. At the other extreme we find the lowest
test performance drop if we exclude these questions. We could consider these two extreme cases
as the upper and lower bounds of the estimated test performance drop. It seems that excluding the

25
questions not reached, but keeping those skipped as wrong answers gives about the same
estimates as estimates that only use the first half of the test questions. This also seems intuitive.
Questions that are skipped by the student, are at least viewed and judged by him. The student
decided not to answer the question, most likely because he expected not to know the answer
easily. The questions that he did not reach, he also did not see and he did not had an opinion on
these questions. In what follows we will use this specification, so excluding questions that have
not been reached, but including those that are skipped as wrong answers. Additionally, we will
focus on the extended model including question and student characteristics. Figure A2 shows the
predicted probabilities for the first three versions graphically.
Figure A2. Predicted probability of a correct answer by position of the question in the test, controling for
the content of the question asked, PISA 2006.
In our models we added all questions for math, reading and science together. The scores
published by the OECD are seperare for math, reading and science. They are not measured as the
fraction of right answers but obtained from estimated scales (i.e. plausible values) based on Item
Response Theory (IRT). The correlations between our score and the scores as calculated by the
OECD are very high though, see table A2.
Table A2. Correlations our test scores and plausible values OECD
Plausible Value 1 OECD Plausible Value 2 OECD
.3.3
5.4
.45
.5
Pre
dict
ed p
roba
bilit
y co
rrec
t ans
wer
0 .2 .4 .6 .8 1
% of test questions completed
Not reached = 0, skipped = 0Not reached = ., skipped = 0Not reached = ., skipped = .

26
Test score variant 1 0.999 0.995 Test score variant 2 0.989 0.991 Test score variant 3 0.969 0.972 Test score variant 4 0.985 9.986 Test score variant 5 0.988 0.991
Differences between groups
The decline in test performance will of course also be related to personal differences between
students. In general it is observed that the test performance drop is smaller for girls. Figure A3
shows the estimated coefficients of the interaction effects of female and the test performance
drop. The performance drop during the test for girls is significantly smaller than that for boys,
however, girls perform worse on the first question. This effect is significant in the majority of
countries.
Figure A3.Gender differences in performance drop during the test, PISA 2006
Figure A4 shows the relation between the performance drop during the test and the
socioeconomic background of the students. There is a less clear pattern. It seems that students
from the lowest economic background (lowest 20 percent) have a smaller performance drop
during the test, but they also perform worse on the first question, however for the rest there is no
significant difference. There is also strong variation with respect to this interaction effect between
the various countries.
.35
.4.4
5.5
Pre
dict
ed p
roba
bilit
y co
rrec
t ans
wer
0 .2 .4 .6 .8 1
% of test questions completed
BoysGirls

27
Figure A4. Performance drop during the test and socio-economic background, PISA 2006
Figure A5 shows the performance drop during the test related to the type of question the student
had to answer, i.e. math, reading or science. In the first model presented in panel a, we analyze
the effect of the type of question that the student already had to answer on any type of question.
So the question that he currently faces can be of any type, and the bars reflect the effect of the
number of math, reading and science questions that the student had before the current question.
We observe that the number of reading questions has the largest impact on the performance drop
during the test and math and science have an equal impact.
Next, we look at a specific question the student currently faces; so first we look at the effect
of the number math, reading and science questions that the student already had to answer, given
that the current question is a math question, presented in panel b. We observe that for math and
science questions, the number of reading questions that the student had have the largest effect,
but for a reading question it is the other way around. One could argue that switching between
math or science and reading questions has the largest impact on the performance drop during the
test.
Figure A5. Performance drop during the test and type of test question, PISA 2006
Panel a. Question “x” includes all types
-.1
-.08
-.06
-.04
-.02
0
Siz
e pe
rfor
man
ce d
rop
s1 s2 s3 s4 s5 s6 s7 s8 s9 s10
Students' social economic status in percentiles

28
Panel b. Question “x” of a particular type
Personality models
Table A3 shows all results from the regressions using personality, i.e. also including the main
effects.
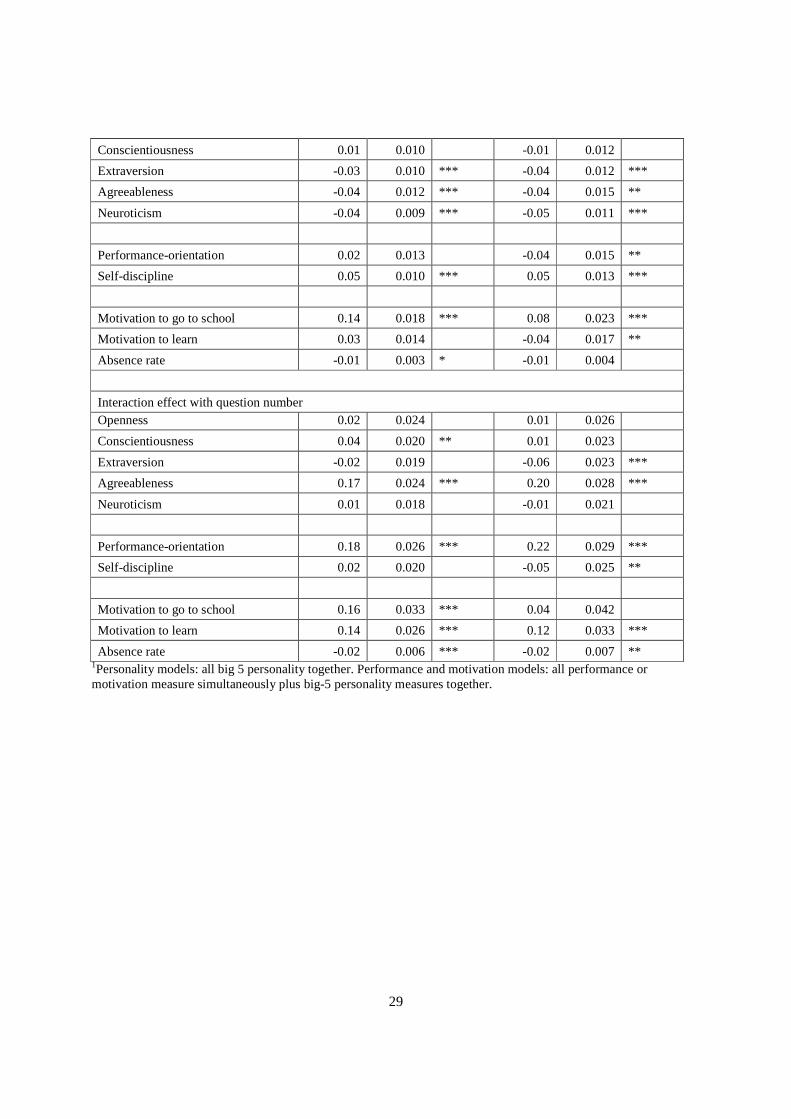
Table A3. Regression results for the relation between personality traits and the estimated drop in
performance during the test, Inventaar 2010 {table zoals in presentatie}
Separate Simultaneous1 b se b se Main effect Openness 0.03 0.013 ** 0.04 0.013 **
-.1
-.08
-.06
-.04
-.02
0S
ize
perf
orm
ance
dro
p
n_m n_r n_s
Number of questions had (n_m = #math, n_r = #reading, n_s = #science)
-.15
-.1
-.05
0S
ize
perf
orm
ance
dro
p
Q is math Q is reading Q is science
n_m n_r n_s n_m n_r n_s n_m n_r n_s
Number of questions had (n_m = #math, n_r = #reading, n_s = #science)
29
Conscientiousness 0.01 0.010 -0.01 0.012
Extraversion -0.03 0.010 *** -0.04 0.012 ***
Agreeableness -0.04 0.012 *** -0.04 0.015 **
Neuroticism -0.04 0.009 *** -0.05 0.011 ***
Performance-orientation 0.02 0.013 -0.04 0.015 **
Self-discipline 0.05 0.010 *** 0.05 0.013 ***
Motivation to go to school 0.14 0.018 *** 0.08 0.023 ***
Motivation to learn 0.03 0.014 -0.04 0.017 **
Absence rate -0.01 0.003 * -0.01 0.004
Interaction effect with question number Openness 0.02 0.024 0.01 0.026
Conscientiousness 0.04 0.020 ** 0.01 0.023
Extraversion -0.02 0.019 -0.06 0.023 ***
Agreeableness 0.17 0.024 *** 0.20 0.028 ***
Neuroticism 0.01 0.018 -0.01 0.021
Performance-orientation 0.18 0.026 *** 0.22 0.029 ***
Self-discipline 0.02 0.020 -0.05 0.025 **
Motivation to go to school 0.16 0.033 *** 0.04 0.042
Motivation to learn 0.14 0.026 *** 0.12 0.033 ***
Absence rate -0.02 0.006 *** -0.02 0.007 ** 1Personality models: all big 5 personality together. Performance and motivation models: all performance or motivation measure simultaneously plus big-5 personality measures together.