The Islamic University Gaza - library.iugaza.edu.ps · The Islamic University Gaza Faculty of...
82
Transcript of The Islamic University Gaza - library.iugaza.edu.ps · The Islamic University Gaza Faculty of...

The Islamic University Gaza
Faculty of Engineering _ Graduate Studies
Civil Engineering Department
Design and Rehabilitation of Structures
The Effect of Steel and Forta Ferro Fibers on Shrinkage Properties
of Normal Strength Concrete
في واالنكماشعلى خصائص التمدد لينيبروبالمواد الفايبر ومواد البولي تأثيردراسة
الباطون
Prepared by
Alaa . A . M . Bashir
عالء عبد القادر محمد بشير
Supervised By
Dr. Mohammed Arafa Dr. Mamoun Alqedra
A research submitted in partial fulfillment of the requirements for the degree of
master of science in civil engineering – design and rehabilitation of structures
May 2015

I
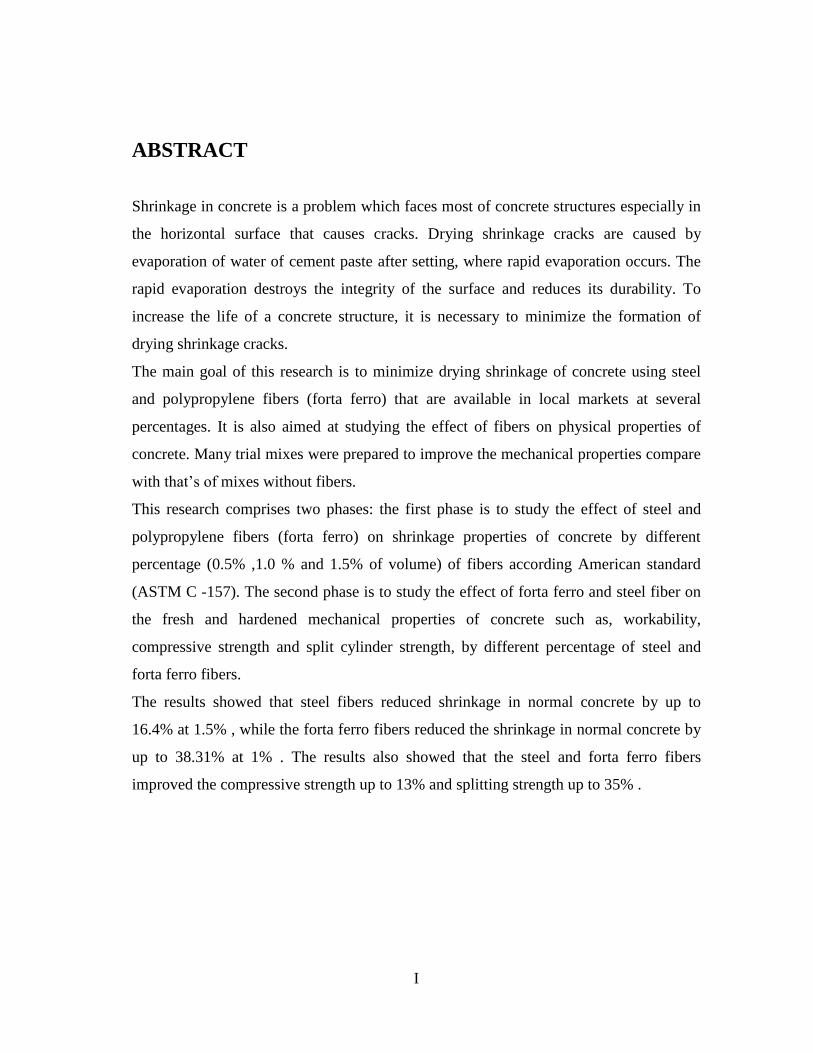
ABSTRACT
Shrinkage in concrete is a problem which faces most of concrete structures especially in
the horizontal surface that causes cracks. Drying shrinkage cracks are caused by
evaporation of water of cement paste after setting, where rapid evaporation occurs. The
rapid evaporation destroys the integrity of the surface and reduces its durability. To
increase the life of a concrete structure, it is necessary to minimize the formation of
drying shrinkage cracks.
The main goal of this research is to minimize drying shrinkage of concrete using steel
and polypropylene fibers (forta ferro) that are available in local markets at several
percentages. It is also aimed at studying the effect of fibers on physical properties of
concrete. Many trial mixes were prepared to improve the mechanical properties compare
with that’s of mixes without fibers.
This research comprises two phases: the first phase is to study the effect of steel and
polypropylene fibers (forta ferro) on shrinkage properties of concrete by different
percentage (0.5% ,1.0 % and 1.5% of volume) of fibers according American standard
(ASTM C -157). The second phase is to study the effect of forta ferro and steel fiber on
the fresh and hardened mechanical properties of concrete such as, workability,
compressive strength and split cylinder strength, by different percentage of steel and
forta ferro fibers.
The results showed that steel fibers reduced shrinkage in normal concrete by up to
16.4% at 1.5% , while the forta ferro fibers reduced the shrinkage in normal concrete by
up to 38.31% at 1% . The results also showed that the steel and forta ferro fibers
improved the compressive strength up to 13% and splitting strength up to 35% .

II
III
DEDICATIONS
I dedicate my thesis work to my father, mother, wife, sons and daughter for their endless
love, support and encouragement.
To those who taught us letters of gold and words of jewel of the utmost and sweetest
sentences in the whole knowledge. Who rewarded to us their knowledge simply and
from their thoughts made a lighthouse guides us through the knowledge and success
path, to our honored teachers and professors.
To our true friends who share us their feelings and hard work, through our research
accomplishment.

IV
ACKNOWLEDGMENTS
I would like to express my sincere appreciation to my supervisors, Dr. Mohamed Arafa
and Dr. Mamoun Alqedra for their help and guidance in the preparation and
development of this work. The constant encouragement, support and inspiration they
offered were fundamental to the completion of this research.
Special thanks go to the material and soil lab of the Islamic University of Gaza, for their
logistic facilitations and their continuous support. Finally, I would like to thank
everyone who gave advice or assistance that contributed to complete this research.

V
ABBREVIATIONS
ACI American Concrete Institute
ASTM American Society for Testing and Materials
SF Steel Fibers
FF Forta Ferro Fibers
W/C Water / Cement ratio
NSC Normal Strength Concrete
SCC Self-Compacting Concrete
RPC Reactive Powder Concrete
UHSC Ultra High Strength Concrete
UHPC Ultra High Performance Concrete
MAS Maximum aggregate size
SFRC Steel Fiber Reinforced Concrete
VI
TABLE OF CONTENTS
ABSTRACT…………………………………….……………………………………… I
III .………..…………………………… .………………………………………… الملخص
DEDICATIONS………………………….……………………………………………. IV
ACKNOWLEDGMENT……………….…………………………………………….... V
ABBREVIATIONS……………………….…………………………………...…….…VI
TABLE OF CONTENTS………………….…………………………………..……... VII
LIST OF TABLES…………………………………………………………………….. X
LIST OF FIGURES………………………………………………………..………….. XI
Chapter (1): Introduction …………………………...…..…………........ 1
1.1 Background ……………………………………………………….…….…….. 1
1.2 Problem statement ………………………………..………………….………. 2
1.3 Research objectives …………………………………………..…….……… 2
1.4 Scope pf Work ………………………………………………………….…….. 3
1.5 Methodology ……………………………………………………………….…. 3
1.6 Research layout …………………………………………………………..…...3
Chapter (2): Literature Review …….……………………………...…… 5
2.1 Type of Shrinkage……………………….…..…………………………..………….. 5
2.2 Drying Shrinkage Cracking……………………………….….......…………………. 6
2.3 Factors effecting on drying Shrinkage… .………………….………….……..……..6
2.3.1 External Factors ………………………………………………………….6
2.3.2 Internal Factors…………………………………………………………...7
2.4 Reducing Concrete Drying Shrinkage …………..……………….….…….…….… 11
2.5 Effect of Fibers on concrete… …….…………………….…….…………...……… 12
2.5.1 The effect of Fibers on shrinkage properties of concrete…….………… 13
2.5.2 The effect of Fibers on mechanical properties of Concrete…….………. 14

VII
Chapter (3): Materials and Experimental Program ………………..…17
3.1 Introduction ………………………………………………………….………..17
3.2 Experimental Program ………………………………..……………………… 17
3.3 Characterizations of Constituent Materials …………………………….…….. 19
3.3.1 Cement …………………………………………………………..….…. 19
3.3.2fine aggregate …….…………………………………………………….20
3.3.3 coarse aggregate ……………………………...……………………….. 21
3.3.4 polypropylene fiber ……………………….…………………..………. 22
3.3.5 Steel fibers …………………………………………………….………. 23
3.3.6 water ….. …………………………………………………..………..… 24
3.4 Design of Mixes ………. ……………………………………………….….... 24
3.5 Mixing procedure ……………………………………………………………..25
3.6 Equipment and testing specimens ……………………………………………. 26
3.6.1 Workability and slump test…..……….. …………………..……….…. 26
3.6.2 Compressive strength test …..……………………...………………… 26
3.6.3 Spilt tensile strength test ………………………………..…….………..28
3.6.4 Drying Shrinkage test ……………………………………….……….. 31
Chapter (4) Test Results and Discussion …………………….….…….. 35
4.1 Drying Shrinkage Result of Steel Fibers ……………………………………... 35
4.1.1 0.5 % of Steel Fiber Samples …………………………………………..35
4.1.2 1.0 % of Steel Fiber Samples …………………………………………..37
4.1.3 1.5 % of Steel Fiber Samples ………………………………………….39
4.1.4 Comparison between shrinkage of plain concrete and steel fibrous
concrete samples ……………………………………………………………………….42
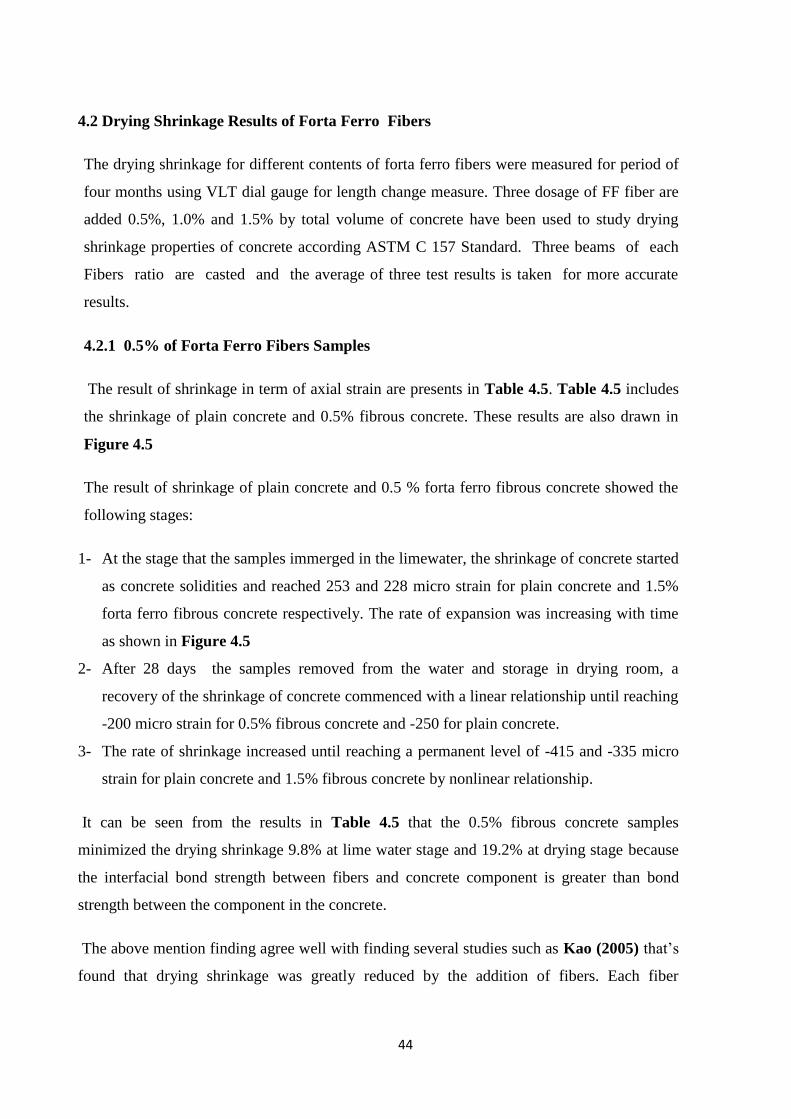
4.2 Drying Shrinkage Result of Forta Ferro Fibers…………………………….…44
4.2.1 0.5 % of Forta Ferro Fiber Samples…………………………….……...44
4.2.2 1.0 % of Forta Ferro Fiber Samples ……………………………………46
4.2.3 1.5 % of Forta Ferro Fiber Samples …………………………..………..48
4.2.4 Comparison between shrinkage of plain concrete and forta ferro fibrous
concrete samples………………………………………..……………………………….51

VIII
4.3 Maximum Shrinkage of Forta Ferro and Steel Fibers …………………………53
4.4 Fresh properties…………...……………………………………….…………. 54
4.4.1 Slump result……... …………………………………………………...…54
4.5 Hardened properties ………………..…………..……………..……………… 56
4.5.1Comperssive strength result ……………………..…………………...….56
4.5.2 Splitting strength result …………...……………………………………..59
Chapter (5) Conclusions and Recommendations …………….…...….. 62
References ……………………………………….………………...……. 64

IX
LIST OF TABLES
Table 3.1 : Cement characteristics according to manufacturer sheet tests……….…… 19
Table 3.2 : properties of fine aggregate………… ……………………….….……… 20
Table 3.3 : properties of coarse aggregate …….…………………………….…….… 21
Table 3.4 : Mix proportions, per one cubic meter of concrete ………….……… 24
Table 3.5 : SF contents in concrete per cubic meter………..……….………….. 25
Table 3.6 : FF contents in concrete per cubic meter………..……….………….. 25
Table 4.1 : Drying Shrinkage of 0.5% SF and Plain Concrete ………………... 36
Table 4.2 : Drying Shrinkage of 1.0% SF and Plain Concrete …….……………. 38
Table 4.3 : Drying Shrinkage of 1.5% SF and Plain Concrete …….………….... 41
Table 4.4 : Maximum Drying Shrinkage of SF ……....……................................... 43
Table 4.5 : Drying Shrinkage of 0.5% FF and Plain Concrete ………………... 45
Table 4.6 : Drying Shrinkage of 1.0% FF and Plain Concrete …….……………. 47
Table 4.7 : Drying Shrinkage of 1.5% FF and Plain Concrete …….………….... 50
Table 4.8 : Maximum Drying Shrinkage of FF …………………………………… 52
Table 4.9 : Maximum Drying Shrinkage of FF and SF………………………….. 53
Table 4.10 : Slump test of plain concrete and fibrous concrete…………………. 55
Table 4.11 : Compressive strength of plain concrete and fibrous concrete………. 58
Table 4.12 : Splitting Strength of plain and fibrous concretes specimens……….. 60
X
LIST OF FIGURES
Figure 2.1: Effect of water-cement ratio on shrinkage of cement pastes………………. 8
Figure 2.2 : Effect of aggregate volume concentration on shrinkage………………….. 9
Figure 2.3 : Comparative drying shrinkage of concrete, mortar and neat cement paste
50% relative humidity……………………………………………………..
10
Figure 3.1 : Experimental program ………………………………..……..…………… 18
Figure 3.2 : Ordinary Portland cement ……………………………….………….……... 19
Figure 3.3 : Sieve analysis result of fine aggregate ……………………..……………... 20
Figure 3.4 : Sieve analysis result of coarse aggregate ……………………….....……. 21
Figure 3.5 : Polypropylene fibers…………………………………....…………….…… 22
Figure 3.6 : Physical Properties of FORTA FERRO polypropylene Fiber……………. 23
Figure 3.7 : Steel fibers ……………………………..…..………………………………. 23
Figure 3.8 : The drum mixer …………………..…………………..…………………... 26
Figure 3.9 : Slump cone ………………………………………….………..………….. 26
Figure 3.10 : Cube specimens …………………………………….………..………. 27
Figure 3.11 : Cubes at curing basin ……………………………..……..……….……….. 27
Figure 3.12 : Force applied on the 100 mm cube ………………………………...……… 28
Figure 3.13 : Split cylinder test setup for cylinder 150 x 300mm ……………………… 30
Figure 3.14 : Force applied on cylinder ………………..………………………………… 30
Figure 3.15 : VLT gauge datum discs …………………………………………………… 31
Figure 3.16 : beam mold for shrinkage test 75x75x285mm………………………..……. 32
Figure 3.16 : Beam Shrinkage test Apparatus……………………………………………. 33
Figure 4.1: The effect of 0.5 % SF on Drying shrinkage of concrete …………….……. 37
Figure 4.2 : The effect of 1.0 % SF on Drying shrinkage of concrete ……………....... 39
Figure 4.3 : The effect of 1.5 % SF on Drying shrinkage of concrete ……………....... 42
Figure 4.4 : The effect of SF on drying shrinkage properties of concrete ……………… 43
Figure 4.5 : The effect of 0.5 % FF on Drying shrinkage of concrete …………….……. 46
Figure 4.6 : The effect of 1.0 % FF on Drying shrinkage of concrete …………….……. 48

XI
Figure 4.7 : The effect of 1.5 % FF on Drying shrinkage of concrete …………….……. 51
Figure 4.8: The effect of FF on drying shrinkage properties of concrete ……………… 52
Figure 4.9: Maximum drying shrinkage of FF and SF ……………….……….………. 54
Figure 4.10 : Effect of percentage of fibrous content on Slump ………………............... 56
Figure 4.11: The effect of fibrous on Compressive Strength of Concrete ..…………….. 59
Figure 4.12 : The effect of fibrous on splitting strength of concrete …………………….. 61

1
Chapter 1
Introduction
1.1 Background
Concrete is the most important building material. One of disadvantage of concrete its
brittleness. Fibers have been used since Biblical times to strengthen brittle materials. Since
then, the concept of dispersed fiber in cement-based materials has been considerably
developed (Shihada, 2010)
There are four main types of shrinkage: plastic, autogenous, carbonation and drying
shrinkage, plastic shrinkage is caused by evaporation of water during the first hours of
casting before setting, autogenous shrinkage is an important component of volume changes
resulting in the occurrence of cracks, carbonation shrinkage is a phenomenon very recently
recognized. carbon dioxide present in the atmosphere reacts in the presence of water with
hydrated cement, calcium hydroxide gets converted to calcium carbonate and also some
other cement compounds are decomposed, drying shrinkage is also caused by evaporation
of cement paste water after setting. Technically, drying shrinkage will continue for the life
of the concrete but most shrinkage will occur within the first three or four months after
placement (Ramseyer, 2006, Holt and Leivo, 2004).
In the past, several techniques have been proposed for studying shrinkage induced cracking
in cement based materials including a ring type specimen, a linear specimen with anchored
ends, a linear specimen held between a movable anda fixed grip and a plate type specimen.
These tests are well idealized in nature but do not represent the actual condition of restraints
in practice. A technique producing restraints comparable to the reality was recently
developed (Siddique et al., 2007).
The effect of forta ferro and steel fibers on the shrinkage properties of normal strength
concrete will be studied. Trial mixes of fibers will be added to get better properties of
drying shrinkage and mechanical properties (compressive strength and splitting strength).
2
1.2 Problem Statement
Drying shrinkage of concrete is the reduction in volume caused by the withdrawal of water
from hardened concrete stored in unsaturated air to the surroundings. It is also defined as
the time dependent strain measured at constant temperature in an unloaded and unrestrained
specimen (Gilbert, 1988).
Similarly, the use of fibers materials in fiber concrete presents potentials to create durable
concrete, particularly steel fibers and forta ferro have become popular in recent years for the
reinforcement of concrete materials, mainly due to their effectiveness in reducing cracking .
In this research, two types of fibers in different contents are used in the concrete mixes to
study the potential of reducing drying shrinkage in reinforced concrete structures.
1.3 Research Objectives
The main goal of the current research is to study the effect of forta ferro and steel fibers on
shrinkage properties of normal performance concrete with a high w/c ratio. This can be
achieved through the following objectives:
1- Study shrinkage properties of normal strength concrete without fibers, and study
shrinkage properties of normal concrete with forta ferro and steel fibers. Then, a
comparative study of concrete with and without fibers to identify the effect of fibers
on reducing shrinkage.
2- Determine the optimum amounts of forta ferro fibers and steel fibers that should be
used to decrease the drying shrinkage.
3- Obtain mechanical properties of fibers concrete such as compressive strength and
splitting tensile strength

3
1.4 Scope of Work
The scope of work is to study the effect of two types of fibers (Steel and Forta Ferro fiber)
on drying shrinkage of normal strength concrete, This study is to be carried out on
specimens according ASTM C-157 to determine the optimum percentage of forta ferro and
steel fibers to minimize drying shrinkage of wet normal performance concrete with a high
w/c ratio and find out the extent of their impact on the mechanical properties of concrete by
testing the fibrous concrete for compressive and splitting strength.
1.5 Methodology
1- Studying and reviewing previous researches related to reducing shrinkage
cracking
2- Executing the testing program.
Testing program consists of the following:
a) Test the shrinkage properties of normal strength concrete without fibers.
b) Test the effect of forta Ferro fibers on the shrinkage properties of normal
strength concrete with different percentages.
c) Test the effect of steel fibers on the shrinkage properties of normal strength
concrete with different percentages.
3- Analyze the result to determine the optimum mix for reducing shrinkage.
4- Perform the required tests on the optimum mix (compressive strength and
splitting tensile strength) and analyze the data.
5- Result analysis and recommendation.
6- Preparation of thesis document.
1.6 Research layout
This research contains five chapters as follow:
Chapter (1) Introduction
This chapter introduces a brief introduction on the effect of steel fiber and forta ferro
fibers on the shrinkage of normal strength concrete and the problem discussed in this
research in addition the methodology used.

4
Chapter (2) literature Review
This chapter illustrates studies on drying shrinkage of natural and effect of steel fiber and
forta Ferro on concrete.
Chapter (3) Materials and Experimental Program
This chapter presents the materials used in this research and its properties both fresh or
hardened and the tests applied on the drying shrinkage of normal strength concrete.
Chapter (4) Test Results and discussion
This chapter explains the results and summarizes the fresh and hardened properties of
concrete and drying shrinkage properties of concrete.
Chapter (5) Conclusion and recommendation
This chapter includes the main conclusions and recommendation drawn from this research.
References

5
CHAPTER 2
LITERATURE REVIEW
2.1 Type of concrete shrinkage
There are four main types of shrinkage in concrete; plastic, autogenous, carbonation and
drying shrinkage.
1- Plastic shrinkage cracking occurs when moisture evaporates from the surface of
freshly placed concrete faster than it is replaced by bleed water, the surface concrete shrinks.
Due to the restraint provided by the concrete below the drying surface layer, tensile stresses
develop in the weak, stiffening plastic concrete in fresh concrete (ACI 224, 2007), To avoid
plastic shrinkage, evaporation rates should not exceed 0.5kg/ /h (Mindess et al., 2003).
2- Autogenous shrinkage can also occur due to chemical shrinkage. Concretes that have
a finer pore structure will be more susceptible to autogenous shrinkage. Pozzolanic reactions
with mineral admixtures, such as silica fume, or faster setting cements with higher amounts
of C3A can lead to a finer pore structure. Mix proportioning is one method used to address
autogenous shrinkage (Holt and Leivo, 2004).
3- Carbonation shrinkage occurs when the concrete is exposed to air with high
concentrations of carbon dioxide and about 50% relative humidity for long periods. The
concrete behaves as if it were exposed to drying conditions with a relative humidity far
below the actual humidity (Brown et al., 2001). The conditions mentioned above occur most
often in structures like parking garages, while bridges seldom have these conditions
(Mindess et al., 2003). Therefore, this type of shrinkage is outside the scope of this work,
4- Drying shrinkage is caused by the loss of moisture from the cement paste constituent
after setting (ACI 224,2007), (Wong et al., 2007) defined drying shrinkage of concrete is
the reduction in volume caused by the withdrawal of water from hardened concrete stored in
unsaturated air to the surroundings, It is also defined as the time dependent strain measured
at constant temperature in an unloaded and unrestrained specimen(Gilbert, 1988).The
following sections explain more the drying shrinkage cracking.
6
2.2 Drying Shrinkage Cracking
Drying shrinkage is caused by evaporation of cement paste water after setting (ACI
224,2007), Drying shrinkage is of greater significant than plastic shrinkage and can lead to
cracking and warping of structural elements
Drying shrinkage, probably the most significant contributor to macroscopic dilation, is caused
by the migration of water from pores and capillaries. Drying shrinkage is usually described
with a delusion model, Micro crack formation and internally created stresses produce creep,
modify the time-dependent deformation and result in a complex nonlinear delusion process
(Chern and Young, 2000).
Shrinkage presents the greatest value at the member surfaces exposed to drying and de-
creases towards the interior of the member (Gilbert, 1988).If drying conditions are the same
at both top and bottom surfaces of the specimen, the total strain would be uniform over the
depth of the specimen; however, if drying occurs at a different rate from the top and bottom
surfaces, the total strain distribution becomes inclined and warping of the member would
result. Drying shrinkage induces tension and results in the formation of cracks, leading to
service ability and durability problems. Factors that affect drying shrinkage of concrete
include constituents, porosity, age of concrete, curing temperature, relative humidity,
moisture content and types of admixtures used (Barr et al,. 2003).
2.3 Factors effecting Drying Shrinkage
Since drying shrinkage is related to moisture loss from the concrete, it is influenced by
external factors that affect drying and internal factors related to the concrete and its
constituents.
2.3.1 External Factors
The external factors affecting loss of moisture from concrete are ambient conditions, and
size and shape of the concrete member.
1- Ambient conditions: Air temperature, relative humidity and wind velocity will affect the
loss of moisture from the concrete surface. (ACI 308, 2001) discusses how any
combination of these factors affects the evaporation rate, Different ambient conditions
on opposite sides of a member result in differential drying out, hence differential
7
shrinkage with the possible consequence of warping when all other factors are equal,
the typical effect of varying relative humidity on the drying shrinkage of concrete is
"higher drying shrinkage is to be expected with rise in ambient temperature, with
decrease in relative humidity, with increase in air movement around the concrete, and
with increase in the length of time for which concrete is subjected to drying conditions"(
Zhang and Li, 2001)
2- Member geometry: Large, thick concrete members dry out more slowly than small, thin
ones. For the same drying period, shrinkage of large-size members is lower than the
smaller-size ones which can dry out to their cores more quickly (CCAA, 2002).
2.3.2 Internal Factors
The internal factors affecting drying shrinkage of concrete are those related to its constituents:
cements, aggregates, admixtures; concrete mix design; water-cement ratio and water content;
aggregate properties and volume fraction; and those related to the construction of the
concrete: placing, compaction and curing.
1- Water content
The drying shrinkage of concrete increases with increasing its water content. The variation in
shrinkage with water content may be explained by the difference in types of water lost at the
various stages of drying mentioned earlier. It is also associated with the modulus of elasticity
of the concrete. Concrete of high water content (and high water-cement ratio) has a lower
strength and lower modulus of elasticity and hence has a greater tendency to shrinkage. The
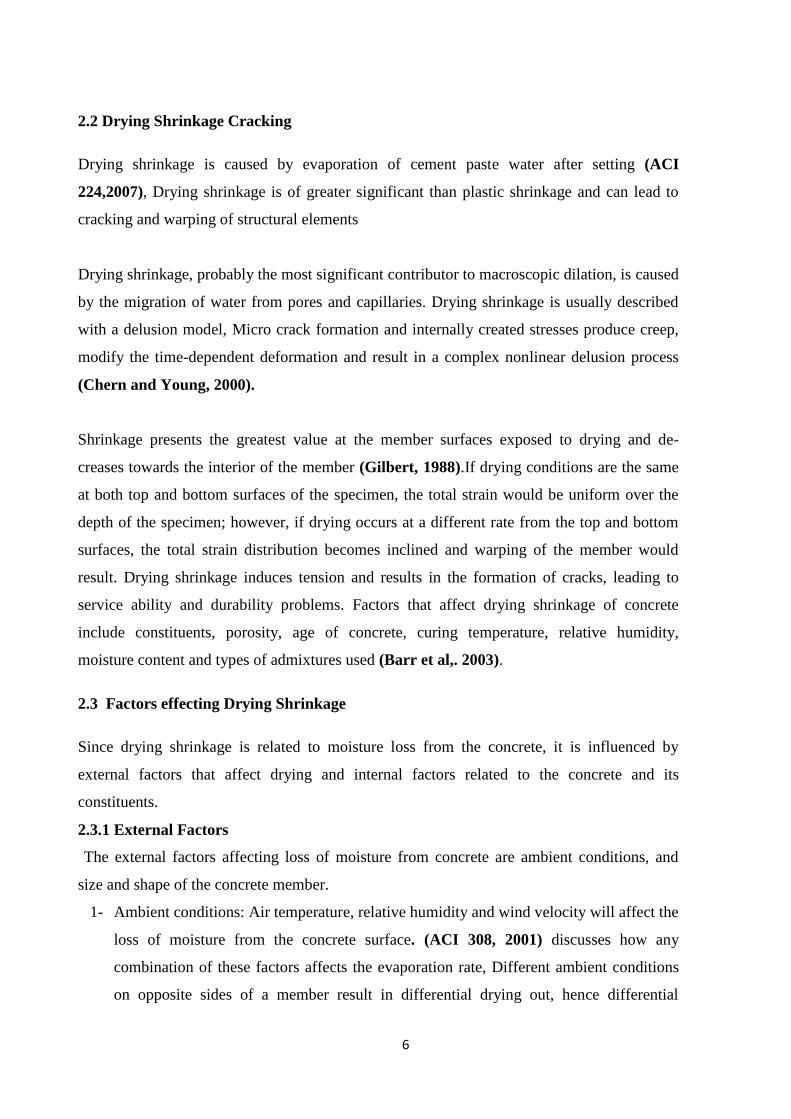
effect of water cement ratio on drying shrinkage is illustrated in Figure (2.1). As can be
noted, at ages beyond 28 days, higher water-cement ratios lead to significant increase in
drying shrinkage (Soroka, 1979).

8
Figure 2.1: Effect of water-cement ratio on shrinkage of cement paste(Soroka,1979)
(Hindy et al,.1994) studied concretes with water-cementations (w/cm) ratios of 0.22 and 0.28
to compare the effect of water- cementitious ratio on shrinkage. After 28 days of drying, they
found that the 0.28 w/cm and the 0.22 w/cm mixes exhibited shrinkage of 392 and 362 µm,
respectively. Similarly, after 365 days of drying, the 0.28 and 0.22 w/cm mixes exhibited
shrinkage of 702 and 630 µm, respectively. They also stated that the increase in w/cm
increased the shrinkage by providing more space for free water diffusion and reducing the
rigidity of the solid matrix that resists shrinkage.
2- Aggregates
Aggregate serves to restrain drying shrinkage, so increasing the aggregate content will lead to
a decrease in concrete shrinkage because it allows for a mixture with less paste. It has been
shown by many authors that in an increase in aggregate size and/or increase in aggregate
content, both resulting in an increase in aggregate volume, which provides a restraint for the
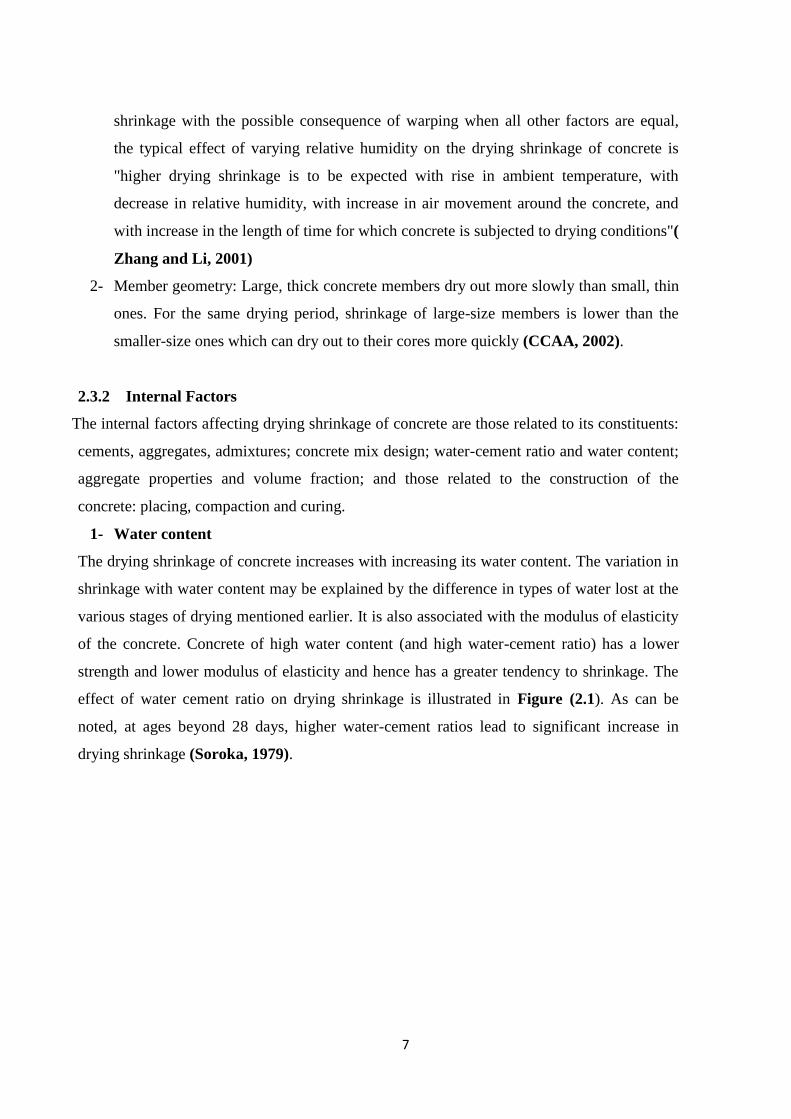
concrete and reduction shrinkage. (Rao, 2001). Figure (2.2) shows the relationship between
the aggregate and drying shrinkage on concrete (Rao, 2001).
9
Figure 2.2: Effect of aggregate volume concentration on shrinkage (Rao, 2001)
Aggregate type was also found to have a significant impact on shrinkage. Typically,
concretes containing aggregates with a lower modulus of elasticity produce more shrinkage
because of the aggregate’s diminished restraining ability. Aggregates with higher absorptions
and lower specific gravities typically have a lower modulus of elasticity and, thus, are more
susceptible to shrinkage (Neville and Brooks , 2010).
.
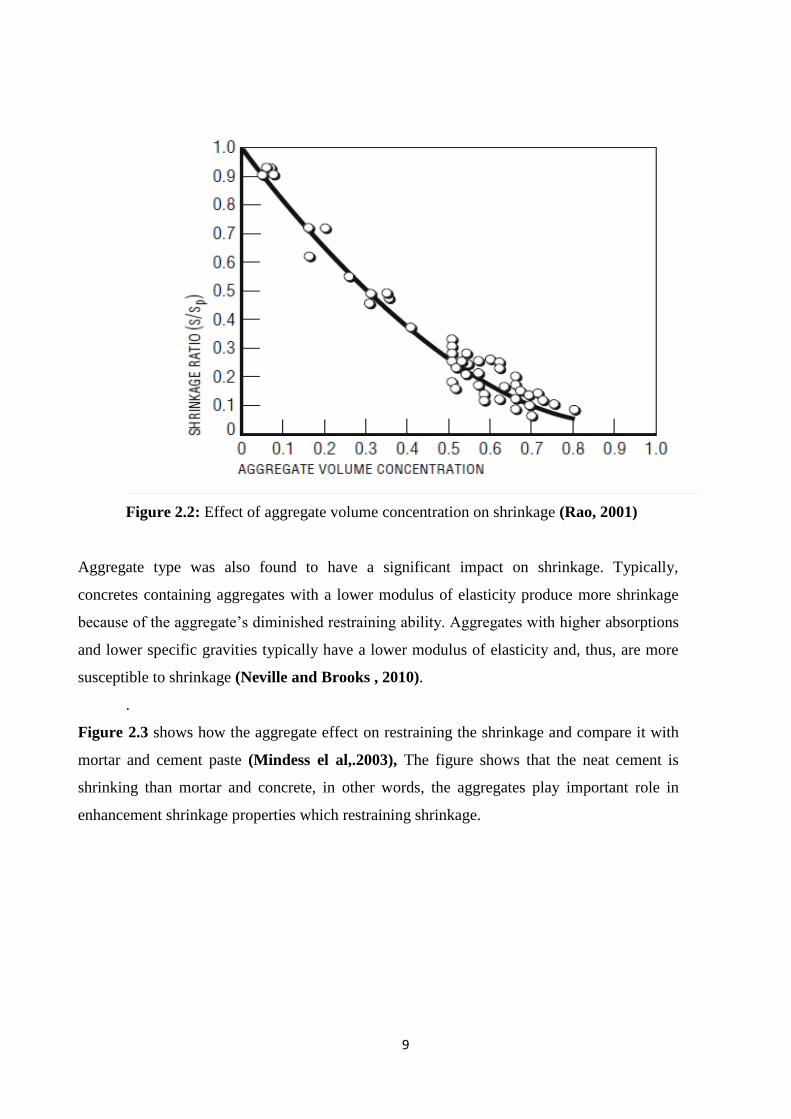
Figure 2.3 shows how the aggregate effect on restraining the shrinkage and compare it with
mortar and cement paste (Mindess el al,.2003), The figure shows that the neat cement is
shrinking than mortar and concrete, in other words, the aggregates play important role in
enhancement shrinkage properties which restraining shrinkage.
11
Figure 2.3 : Comparative drying shrinkage of concrete, mortar and neat cement paste
at 50% relative humidity (Mindess el al,.2003),
In summary, hard, dense aggregates with low absorption and high modulus of elasticity are
important for the production of concrete of low drying shrinkage. The effect of aggregate on
restraining the drying shrinkage of concrete is governed by:
1- The volume fraction of the aggregate
2- The modulus of elasticity of the aggregate
3- The shrinkage of the aggregate upon drying (CCAA, 2002)
3- Cement Fineness
Cement fineness can also be a factor in concrete shrinkage. Finer cement is one cause of a
finer pore structure. A finer pore structure can cause the meniscus that forms within the pores
upon drying, to have a greater radius of curvature leading to greater surface tension. This can
lead to more shrinkage (Holt and Leivo, 2004).
Although it is generally concluded that the composition of cement can affect drying
shrinkage, the effect is not completely determined, The effect of Tri calcium aluminate
(C3A) and alkali content have been observed to have a dominant effect. In turn, the effect of

11
C3A and alkali content on shrinkage is influenced by the gypsum content of the cement, ie
shrinkage of cements of the same C3A content differs for different gypsum contents
(Lindquist et al,.2005).
4- Construction practice
Concrete placing, compaction and curing are important factors in minimizing the magnitude
of drying shrinkage. Adding further water on site during placing of concrete to restore slump
or to aid with final finishing will increase the drying shrinkage of concrete.
Proper compaction and curing are required to produce dense concrete of reduced capillaries
and/or with discontinuous capillaries, resulting in reduced loss of moisture from the concrete
and reduced drying shrinkage. Applying appropriate curing measures immediately after
finishing the concrete will prevent drying of the concrete surface especially in hot weather
conditions.
Studies have found that proper curing of concrete is essential to decreased cracking on bridge
decks, which can improve the overall performance of a bridge deck (Lindquist et al.,2005).
However, the effect of the length of the curing period as a factor to decrease overall shrinkage
of concrete has been debatable. Some authors feel that prolonged moist curing delays the
advent of shrinkage but ultimately has little effect on the magnitude of shrinkage (Neville
and Brooks, 2010).
5- Admixtures
There are many types of admixtures available for incorporation in concrete to achieve/
enhance certain properties or to achieve economy or both. Generally, admixtures affect
shrinkage of the concrete to a varying degree depending on their formulation, their interaction
with the cement, their interaction with other admixtures in the mix, and on the variations or
adjustments, they bring about in the proportions of the concrete mix. A detailed discussion of
the effect of various admixtures can be found elsewhere (Ribeiro and Fiho, 2006), it is well
established that admixtures containing calcium chloride can increase the drying shrinkage of
concrete.
2.4 Reducing Drying Shrinkage of concrete
Some of the measures that can be taken to reduce the drying shrinkage of concrete include:
1- Use the minimum water content (consistent with placing and finishing requirements).
2- Use highest possible volume fraction of good quality aggregate and maximum possible
aggregate size.
12
3- Use shrinkage limited cement (Type SL) where available.
4- Do not use admixtures known to increase drying shrinkage, eg those containing
calcium chloride.
5- Ensure concrete is properly placed, compacted and cured.
6- Ensure forms is ample strength to sustain strong vibration of low-slump concretes.
7- Project drawings should include an adequate system of contraction joints to provide for
shrinkage. (ACI 224, 2004)
2.5 Effect of Fibers on concrete
Fibers provide internal restraint as well, particularly against movement before curing, they are
produced from different materials in various shapes and sizes, Typical fiber materials are
(ACI 544, 2002 )
1- Steel Fibers
These fibers compared to traditional fabric reinforcement, have a tensile strength typically 2-
3 times greater and a significant greater surface area to develop bond with the concrete matrix
(ACIFC, 1999). Steel fibers will continue to provide restraint after curing, the type of fibers
are straight, crimped, twisted, hooked, ringed, and paddled ends. In addition, the diameter
range from 0.25 to 0.76mm. ASTM A 820 provides a classification for four general types of
steel fibers based on the product used in their manufacture (ACI Committee 544, 1996):
Cold-drawn wire
Cut sheet
Melt extracted
Other fibers
2- Synthetic Fibers
Synthetic fibers are manufactured fibers resulting from research and development in the
petro- chemical and textile industries. Synthetic fiber reinforced concrete utilizes fibers
derived from organic polymers, which are available in a variety of formulations (ACI 544,
1996). Synthetic fiber types that have been tried in Portland cement concrete based matrices
are: acrylic, aramid, carbon, nylon, polyester, polyethylene and polypropylene. For many of
these fibers there is little reported research or field experience, while others are found in
13
commercial applications and have been the subject of extensive reporting (ACI 544, 1996).
Synthetic, organic fibers have low modulus of elasticity and high elongation properties while
steel, glass, asbestos and carbon fibers had high modulus of elasticity (Manolis et al, 1997).
The most popular synthetic fibers used in concrete ground floor-slabs are Polypropylene
(micro-synthetic) and structural (macro-synthetic).
2.5.1 The effect of Fibers on shrinkage properties of concrete
Drying shrinkage strain is of considerable importance to pavement applications because it has
a direct contribution to the spacing of the joints. There are conflicting evidences regarding the
effectiveness of fibers in limiting both free and restrained drying shrinkage strain in steel
fiber reinforced concrete (SFRC).
Generally, steel fiber concrete is more durable than plain concrete, having a positive
influence on the shrinkage behavior of concrete by reducing the number and controlling the
width of cracks (ACI 544, 2002). Ramakrishnan (1988) reported that the most significant
consequence of fiber addition to concrete is the delay and control of tensile cracking in the
composite material.
Zhang and Li (2001) showed that the fiber aspect ratio is an important material parameter
that strongly influences the composite shrinkage behavior. For the same fiber content,
composite shrinkage decreases nonlinearly and gradually shifts to a constant with an increase
in the fiber aspect ratio. A critical fiber aspect ratio exists regarding a composite shrinkage
reduction and a further increase in the fiber aspect ratio beyond this critical value does not
contribute to reducing the composite shrinkage
Edgington et al.(1974) found that the shrinkage properties of concrete over period of three
month was unaffected by the present of the steel fibers. litvin (1985) also reported in his
study that steel fibers concrete with compressive strength of 21-30 MPa has 5% to 7% less
shrinkage than its corresponding plain concrete
Work which was conducted by (chern and young, 2000) to study the influence of steel fiber
parameters testing age and ratio of the specimen volume to the exposed surface on shrinkage
characteristics of concrete. It was found that steel fibers restrain deformation more effectivity
at later ages due to the development of higher interfacial bond strength between fibers and
matrix. Therefore, the older the steel fiber reinforced concrete (SFRC) the less shrinkage
14
strain. It was also evident that both higher fiber content and aspect ratio was found to yield
less shrinkage than those of lower values.
Ramseyer (2006) shows that fibers slightly decrease ASTM unrestrained shrinkage results,
measured from 24 hours to 28 days, He also showed that fibers drastically reduce early age
shrinkage, depending on the dosage level; higher is better, up to a certain point that is
different for each fiber. Victor et al. (2009) showed that the use of steel fibers and the
application of thermal treatment decreased 14-day drying shrinkage by more than 57% and by
82% respectively.
Polypropylene showed a great ability to eliminate plastic shrinkage; however, the drying
shrinkage of the polypropylene reinforced concrete with w/c ratio 0.45, 0.55 and 0.65 is 2%,
5% and 11% respectively, lower than its corresponding plain concrete mixes at the age of 70
days. Various studies indicated that the shrinkage of polypropylene reinforced concrete
depends on different factors , which the most important are w/c ratio , age of concrete, fiber
content , and fiber length to maximum aggregate size ratio Al-tayyib et al., (1988), However,
Zollo (1984) reported in his study a 75% reduction in shrinkage of polypropylene reinforced
concrete.,.
Kao (2005) found that drying shrinkage was greatly reduced by the addition of fibers. Each
fiber described a curve, the shrinkage decreased with increasing dosage of polypropylene
fibers up to a point, and then increased as more fibers were added. The optimum dosage
varied, but with all fibers, reduction of at least 50% of the early age shrinkage was realized.
2.5.2 The effect of Fibers on mechanical properties of Concrete
1- The effect of Fibers on fresh properties of concrete
Knowledge of the fresh concrete properties is considered essential for proper design and
application of fiber reinforced concrete mixes (Ramakrishnan, 1988).
Achieving adequate workability is one of the most important problems generated when using
steel fiber reinforced concrete. The inclusion of the fibers into the concrete mix influences its
workability, with increasing in the fiber volume and aspect ratio leading to decreased
workability (Hannat, 1978 and Swamy, 1974).
No workability problem was encountered for the use of hooked steel fibers up to 1.5 percent
in the concrete mix. The straight fibers produce balling at high fiber content and require
special handling procedure. (Faisal, 1990)
15
(ACI 544, 2002) reported that in the typical ranges of volume fractions used for steel-fiber
reinforced concrete (0.25 to 1.5 volume percent), the addition of steel fibers may reduce the
measured slump of the composite as compared to plain concrete in the range of 25 to 102mm.
Kao (2005) worked with polymer fibers, and found a strong reduction in the slump of a
concrete with the addition of the fibers. This trend depended somewhat on the type of fibers;
the smaller the fiber, the more rapidly the slump decreased.
Polypropylene fibers act mechanically. They impart a cohesive effect by holding water at or
near the surface of the concrete, delaying evaporation and increasing cement hydration
(Knapton, 2003). The slump of fiber-dosed concrete is not significantly affected by the
addition of polypropylene fibers.
Balaguru and Khajuria (1996) obtained similar results on the slumps of mixes with fibers;
their work with polymeric fibers showed slumps decreasing with increasing fiber dosage
levels. With plain concrete, they had a slump of 8.9 inches; at the highest dosage rate, about 4
lb/yd3, they had a slump of only 1.6 inches. However, the decreased slump did not result in a
similar increase in the difficulty of vibratory compaction.
2- The effect of Fibers on hardened properties of concrete
A- Compressive strength
Compressive strength is slightly affected by the presence of fibers, with observed increases
ranging from 0 to 15% (Amir et al, 2002), also (Shendet et al 2012) observed that
compressive strength increases from 11 to 24% with addition of steel fibers.
The introduction of polypropylene fibers into the concrete mix has generally no significant
effect on the 28-days compressive strength of concrete cubes (Knapton, 2003). Aulia (2002)
in testing a number of aggregates and mixes with polypropylene fibers found that “the use of
0.2 % of polypropylene fibers by volume resulted in low influence on both the compressive
strength and modulus of elasticity of concrete. Essentially, there was no difference between
the compressive strength with and without fibers.
Almassri et al. (2012) Studied the effect of polypropylene fiber on ultra-high performance
self-compacting concrete (UHPSCC). Local available materials and the inclusion of
polypropylene fiber with different volume fraction are investigated to produce UHPSCC with
different mechanical properties, these properties includes fresh properties, compressive
strength, splitting tensile strength and flexural strength. The research showed that the addition

16
polypropylene fiber causes a small improvement of the compressive strength of UHPSCC
within range (1%-7%).
B- Splitting strength
Fibers have significant effect on splitting strength of concrete. Shendet et al (2012) observed
that splitting strength increases from 3 to 41% with addition of steel fibers. In addition,
(Amir et al 2002) reported that direct tension improved significantly, with increases of the
order of 30 to 40% of steel fibers.
Almassri et al. (2012) showed that the addition polypropylene fiber improves the splitting
strength of UHPSCC within range (20%-30%) according to the fiber percentage ,Faisal
(1990) observed that the splitting tensile strength improves 57% by adding polypropylene , Li
(2002) noted a moderate improvement in bending strength with the addition of Polypropylene
fibers, but stated that the major difference was in the behavior after reaching the ultimate
load. Instead of brittle failure, the fiber mix showed somewhat ductile behavior, with ultimate
deflection four times that of the plain concrete.
The effect of forta ferro and steel fibers on shrinkage properties of normal strength concrete
will be studied.

17
Chapter 3
Materials and Experimental Program
3.1 Introduction
This chapter discusses the characteristics of constituent materials used to measure the effect
of forta ferro and steel fibers on shrinkage properties of normal strength concrete, and the
experimental program linked to this research.
The purpose of the experiments is to investigate the reduction of drying shrinkage of concrete
using steel and forta ferro fibers.
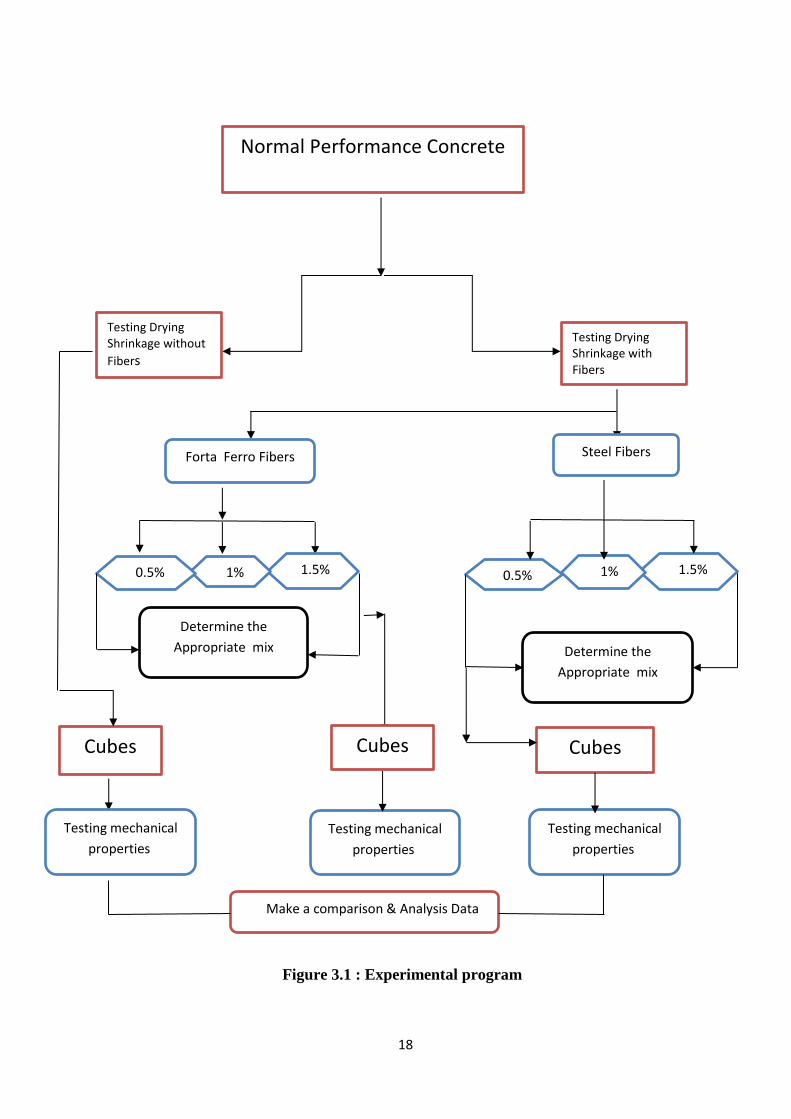
3.2 Experimental program
The experimental program was carried out to investigate the effects of adding steel and forta
ferro fibers on the shrinkage properties of the concrete mix. All test specimens were cast from
one batch of the same mix. The experimental design and the basic tests carried out on
materials used or casting concrete samples are discussed in this chapter, followed by a
brief description about mix deign and curing procedure adopted. At the end, tests conducted
on the specimens are discussed.
This study was designed to investigate the use of two types and three contents of fibers
reinforcement in concrete specimens. The first type used is a Polypropylene fiber (Forta
Ferro) for the percentages of 0.5%, 1% and 1.5% by volume. The second type is used steel
fibers with the same percent's see Figure (3.1), and test for drying shrinkage according
ASTM C157 and ASTM C490 standards. The study of mechanical properties includes
compressive strength and splitting strength.
18
Figure 3.1 : Experimental program
Testing Drying Shrinkage without
Fibers
Normal Performance Concrete
Testing Drying Shrinkage with Fibers
Steel Fibers Forta Ferro Fibers
0.5% 1.5% 1% 1.5% 1% 0.5%
Determine the
Appropriate mix
Determine the
Appropriate mix
Cubes Cubes Cubes
Testing mechanical
properties
Testing mechanical
properties
Testing mechanical
properties
Make a comparison & Analysis Data
19
3.3 Characterizations of constituent Materials
Most of the materials used in this study are materials obtained from the local markets. The
detailed properties of the materials used are as follows:
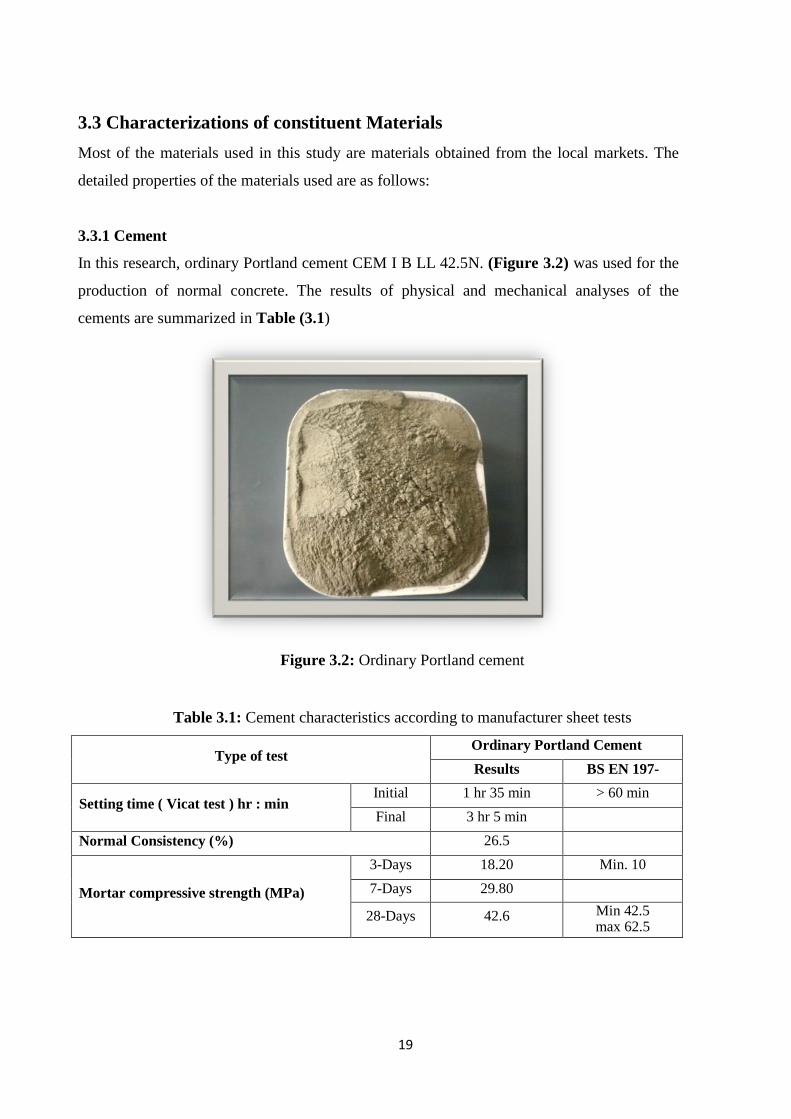
3.3.1 Cement
In this research, ordinary Portland cement CEM I B LL 42.5N. (Figure 3.2) was used for the
production of normal concrete. The results of physical and mechanical analyses of the
cements are summarized in Table (3.1)
Figure 3.2: Ordinary Portland cement
Table 3.1: Cement characteristics according to manufacturer sheet tests
Type of test Ordinary Portland Cement
Results BS EN 197-
1:2000 Setting time ( Vicat test ) hr : min
Initial 1 hr 35 min > 60 min
Final 3 hr 5 min
Normal Consistency (%) 26.5
Mortar compressive strength (MPa)
3-Days 18.20 Min. 10
7-Days 29.80
28-Days 42.6 Min 42.5 max 62.5
21
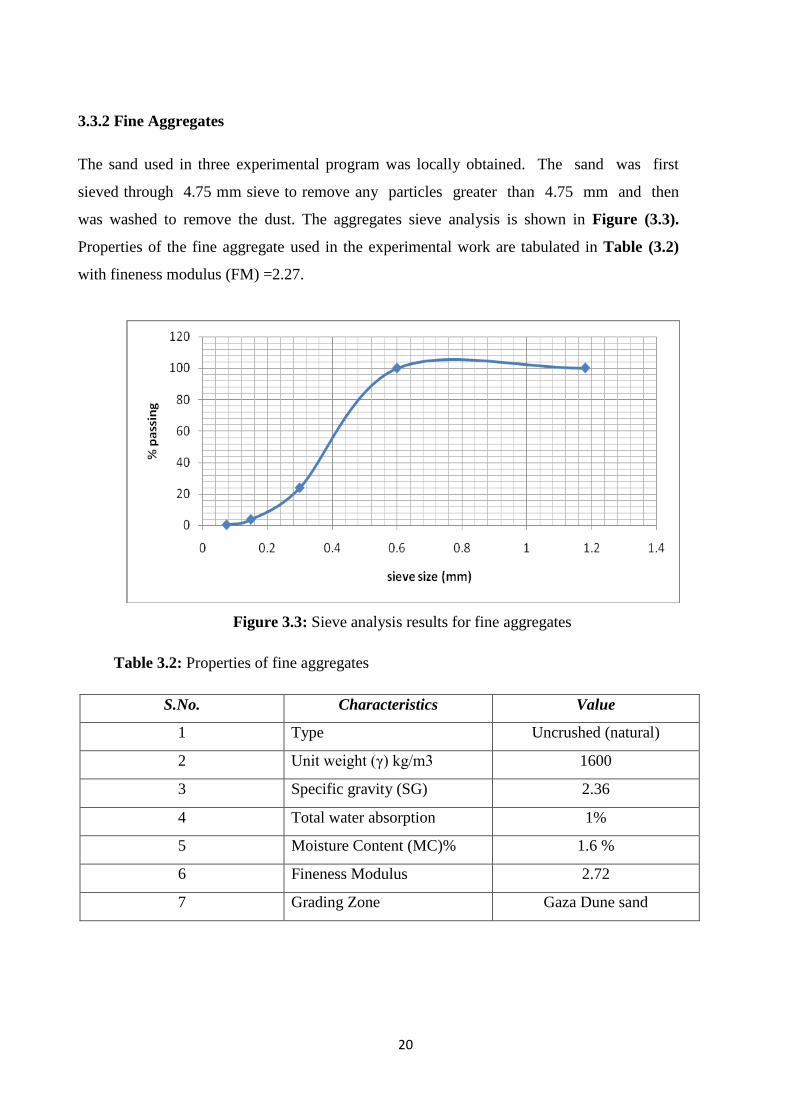
3.3.2 Fine Aggregates
The sand used in three experimental program was locally obtained. The sand was first
sieved through 4.75 mm sieve to remove any particles greater than 4.75 mm and then
was washed to remove the dust. The aggregates sieve analysis is shown in Figure (3.3).
Properties of the fine aggregate used in the experimental work are tabulated in Table (3.2)
with fineness modulus (FM) =2.27.
Figure 3.3: Sieve analysis results for fine aggregates
Table 3.2: Properties of fine aggregates
S.No. Characteristics Value
1 Type Uncrushed (natural)
2 Unit weight (γ) kg/m3 1600
3 Specific gravity (SG) 2.36
4 Total water absorption 1%
5 Moisture Content (MC)% 1.6 %
6 Fineness Modulus 2.72
7 Grading Zone Gaza Dune sand

21
3.3.3 Coarse Aggregates
Crushed limestone obtained from the West Bank quarries is generally used as a coarse
aggregate. Its decided the maximum size of the coarse aggregate. Locally available coarse
aggregate having the maximum size of 20 mm was used in this work. The aggregates were
washed to remove dust and dirt and were dried to surface dry condition. The aggregates
were tested per (ASTM C127, 2004) and (ASTM C128, 2004) Standard Specifications. The
sieve analysis results on coarse aggregate is given in Figure (3.4), and their properties used
in the experimental work are tabulated in Table (3.3).
Figure 3.4: Sieve analysis results for coarse aggregates
Table 3.3: Properties of Coarse aggregates
S.No. Characteristics Value
1. Type Coarse
2. Maximum size 20 mm
3. Specific gravity (20 mm) 2.65
4. Total water absorption (20 mm) 2.2%
5. Fineness modulus (20 mm) 7.68
6. Grading Zone West bank
22
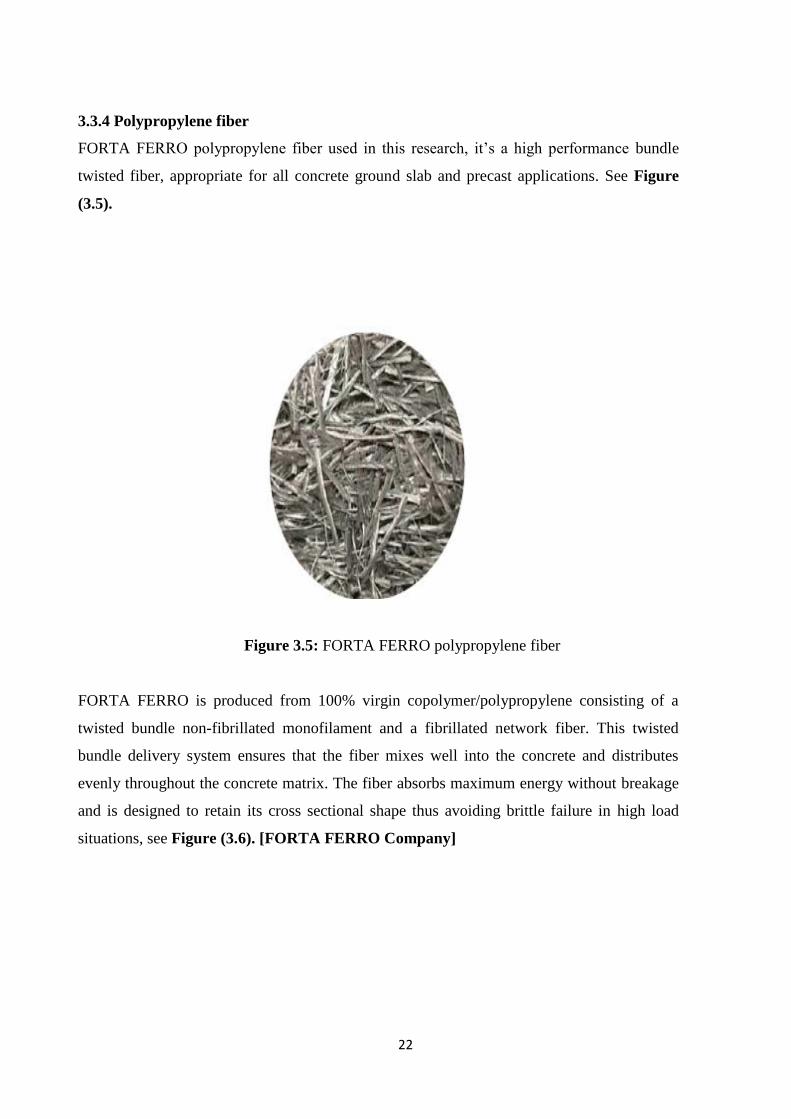
3.3.4 Polypropylene fiber
FORTA FERRO polypropylene fiber used in this research, it’s a high performance bundle
twisted fiber, appropriate for all concrete ground slab and precast applications. See Figure
(3.5).
Figure 3.5: FORTA FERRO polypropylene fiber
FORTA FERRO is produced from 100% virgin copolymer/polypropylene consisting of a
twisted bundle non-fibrillated monofilament and a fibrillated network fiber. This twisted
bundle delivery system ensures that the fiber mixes well into the concrete and distributes
evenly throughout the concrete matrix. The fiber absorbs maximum energy without breakage
and is designed to retain its cross sectional shape thus avoiding brittle failure in high load
situations, see Figure (3.6). [FORTA FERRO Company]

23
Figure 3.6: Physical Properties of FORTA FERRO polypropylene fiber
3.3.5 Steel Fibers
The fibers are used to improve hardened concrete properties and improve the ductility of the
normal concrete. The steel fibers used in this investigation are clean of rust or oil of straight
steel wire fibers. The used steel fibers are chopped or cut from steel wires. See Figure (3.7).
The steel wires are cut into the desired length around 13 mm and diameter 0.25 mm, with
length/diameter ≈ 52, Tensile strength ≈ 277 MPa and density of 7.8 g/cm3.
Figure 3.7: Steel Fibers
24
3.3.6 Water
Tap water was used in all concrete mixtures and in the curing of all the tests specimens. The
water source was used from the soil and material laboratory at IUG, which is considered safe
to drink. The principle concept of using water in concrete is “If you can drink it, you can
make concrete with it”.
3.4 Design of Mixes
The concrete mix is designed according to (ACI 211.1, 2003)to obtain compressive strength
of 25 MPa at 28 days and a 150mm slump with water to cement ratio of 0.5
The mix proportions of reinforcement concrete is shown in Table (3.4)with (free w/c ratio =
0.50).
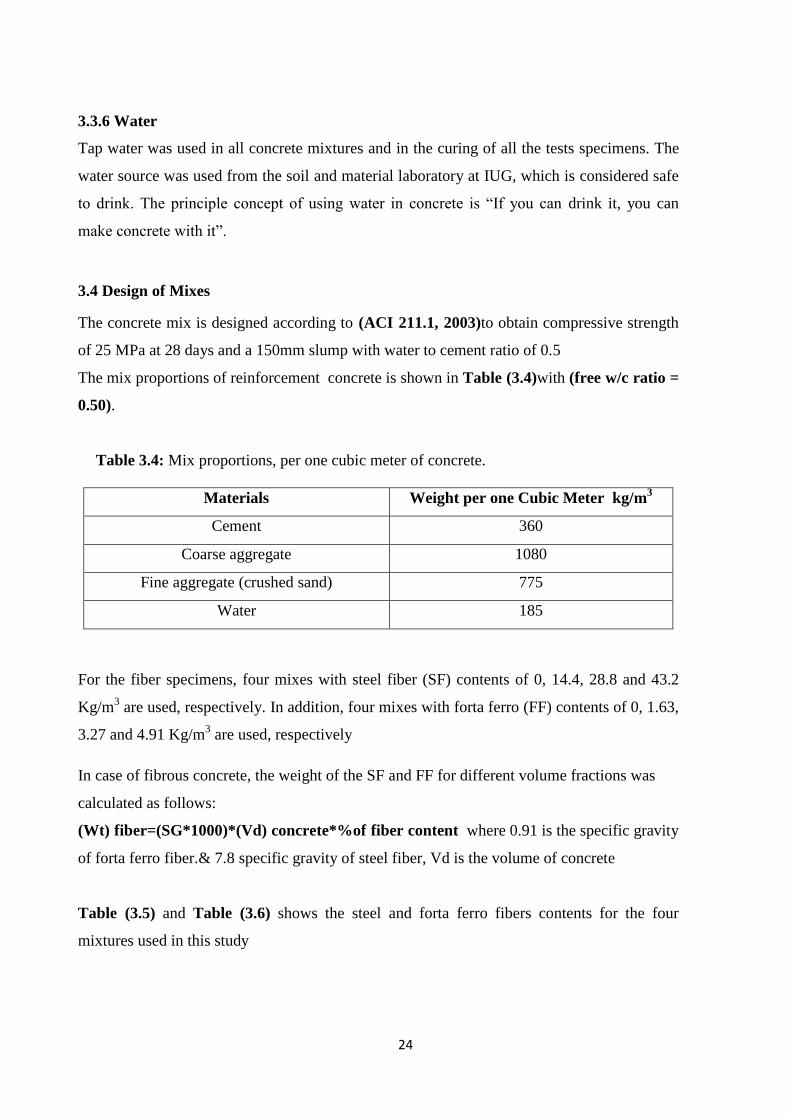
Table 3.4: Mix proportions, per one cubic meter of concrete.
Materials Weight per one Cubic Meter kg/m3
Cement 360
Coarse aggregate 1080
Fine aggregate (crushed sand) 775
Water 185
For the fiber specimens, four mixes with steel fiber (SF) contents of 0, 14.4, 28.8 and 43.2
Kg/m3 are used, respectively. In addition, four mixes with forta ferro (FF) contents of 0, 1.63,
3.27 and 4.91 Kg/m3 are used, respectively
In case of fibrous concrete, the weight of the SF and FF for different volume fractions was
calculated as follows:
(Wt) fiber=(SG*1000)*(Vd) concrete*%of fiber content where 0.91 is the specific gravity
of forta ferro fiber.& 7.8 specific gravity of steel fiber, Vd is the volume of concrete
Table (3.5) and Table (3.6) shows the steel and forta ferro fibers contents for the four
mixtures used in this study

25
Table 3.5: Steel Fibers contents in concrete per cubic meter
% Volume of steel
Fibers
Steel Fiber
Content
Kg/m3
Steel Fiber
Content
Kg/beam
SF 0.0 0 0
SF 0.5 14.4 0.023
SF 1.0 28.8 0.046
SF 1.5 43.2 0.069
Table 3.6: Forta Ferro Fibers contents in concrete per cubic meter
% Volume of Forta
Ferro Fibers
Forta Ferro
Kg/m3
Forta Ferro
Kg/beam
FF 0.5 1.63 0.0026
FF 1.0 3.27 0.0052
FF 1.5 4.91 0.0078
3.5 - Mixing procedures
1) Added cement, aggregate, sand and 50% of fibers in the mixer pan, and mixing for 2
minutes See Figure (3.8)
2) Added water to the dry materials, slowly for 1 minutes.
3) Mixing for minimum 5 min, during the mixing added remained fiber.
4) After final mixing, the mixer is stopped, turned up with its end right down, and the fresh
homogeneous concrete is poured into a clean plastic pan.
5) All specimens were cast and covered to prevent evaporation.

26
Figure 3.8: The drum mixer
3.6 Equipment and Test Specimens
3.6.1 Workability and Slump test
The slump test is used to determine the workability of concrete based on (ASTM C143,
2004),. Slump of concrete was determined at the site for the different contents of forta ferro
fibers, SF and all concrete mixes.
Figure 3.9: Slump cone
3.6.2 Compressive Strength Test
Twenty one cubic specimens of size 150 mm × 150 mm × 150 mm were cast for conducting
compressive strength test, three for each percentage of steel & forta ferro fiber. The
compressive strength test was based on (BS 1881, 2002) and was carried at the end of the
28 days of curing. The compressive strength of any mix was taken as the average strength of
three cubes according the following procedure.
27
1. After preparing the required quantity, the mixing water was added to the coarse aggregate
in the mixer and mixed for 3 minutes. Next, fine aggregate, cement and the rest of the
mixing water were added while the mixer is running for additional 3 minutes, then the
fibers were added to the mixture and mixed for an additional 3 minutes.
2. Emptying the concrete mixture from the mixer to a proper container.
3. After preparing the cubic molds of (15×15×15cm) and the specimens mold is filled with
concrete in 3 stages and tamping for each layers.
4. Level the surface of the molds and clean its external surface.
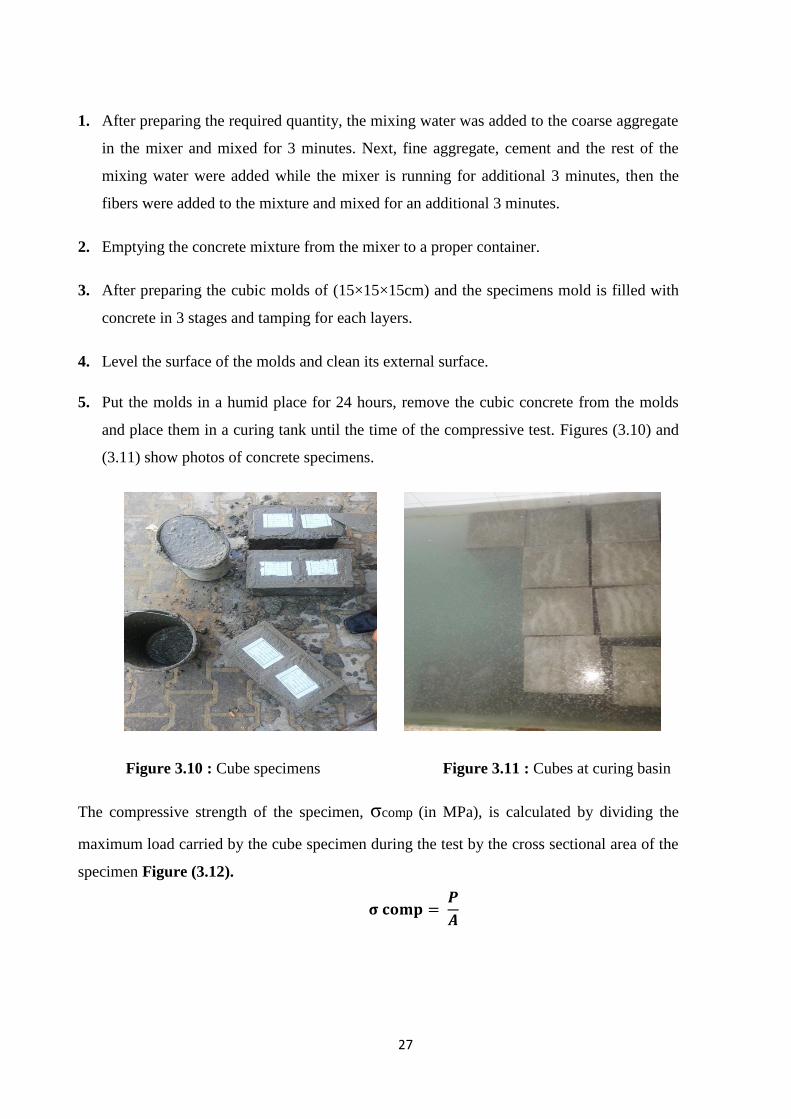
5. Put the molds in a humid place for 24 hours, remove the cubic concrete from the molds
and place them in a curing tank until the time of the compressive test. Figures (3.10) and
(3.11) show photos of concrete specimens.
Figure 3.10 : Cube specimens
Figure 3.11 : Cubes at curing basin
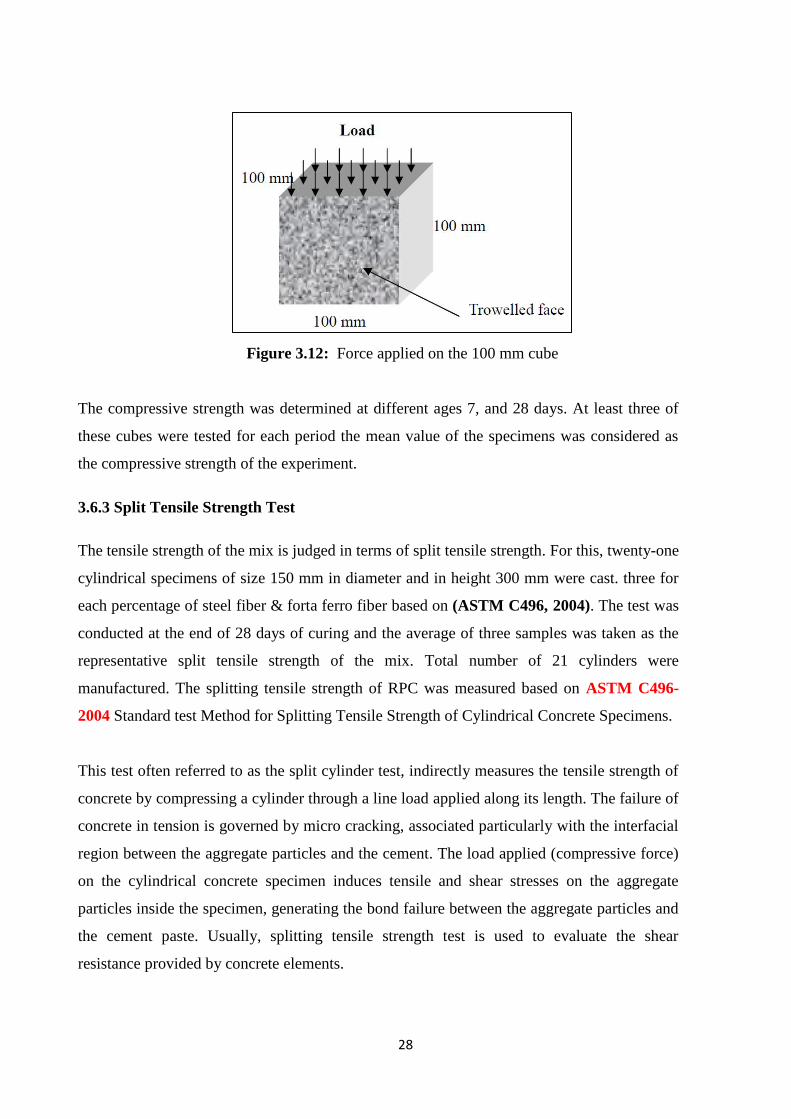
The compressive strength of the specimen, σcomp (in MPa), is calculated by dividing the
maximum load carried by the cube specimen during the test by the cross sectional area of the
specimen Figure (3.12).
28
Figure 3.12: Force applied on the 100 mm cube
The compressive strength was determined at different ages 7, and 28 days. At least three of
these cubes were tested for each period the mean value of the specimens was considered as
the compressive strength of the experiment.
3.6.3 Split Tensile Strength Test
The tensile strength of the mix is judged in terms of split tensile strength. For this, twenty-one
cylindrical specimens of size 150 mm in diameter and in height 300 mm were cast. three for
each percentage of steel fiber & forta ferro fiber based on (ASTM C496, 2004). The test was
conducted at the end of 28 days of curing and the average of three samples was taken as the
representative split tensile strength of the mix. Total number of 21 cylinders were
manufactured. The splitting tensile strength of RPC was measured based on ASTM C496-
2004 Standard test Method for Splitting Tensile Strength of Cylindrical Concrete Specimens.
This test often referred to as the split cylinder test, indirectly measures the tensile strength of
concrete by compressing a cylinder through a line load applied along its length. The failure of
concrete in tension is governed by micro cracking, associated particularly with the interfacial
region between the aggregate particles and the cement. The load applied (compressive force)
on the cylindrical concrete specimen induces tensile and shear stresses on the aggregate
particles inside the specimen, generating the bond failure between the aggregate particles and
the cement paste. Usually, splitting tensile strength test is used to evaluate the shear
resistance provided by concrete elements.
29
However, the most important advantage is that, when applying the splitting procedure, the
tensile strengths are practically independent either of the test specimen or of the test machine
sizes, being only a function of the concrete quality alone. Thus, much inconvenience is
eliminated, particularly with respect to the scale coefficient, which is involved in direct
tensile tests. For this reason, this procedure is considered to reproduce more exactly the real
concrete tensile strength.
The tensile strength of concrete is evaluated using a split cylinder test, in which a cylindrical
specimen is placed on its side and loaded in diametrical compression, so to induce transverse
tension. Practically, the load applied on the cylindrical concrete specimen induces tensile
stresses on the plane containing the load and relatively high compressive stresses in the area
immediately around it.
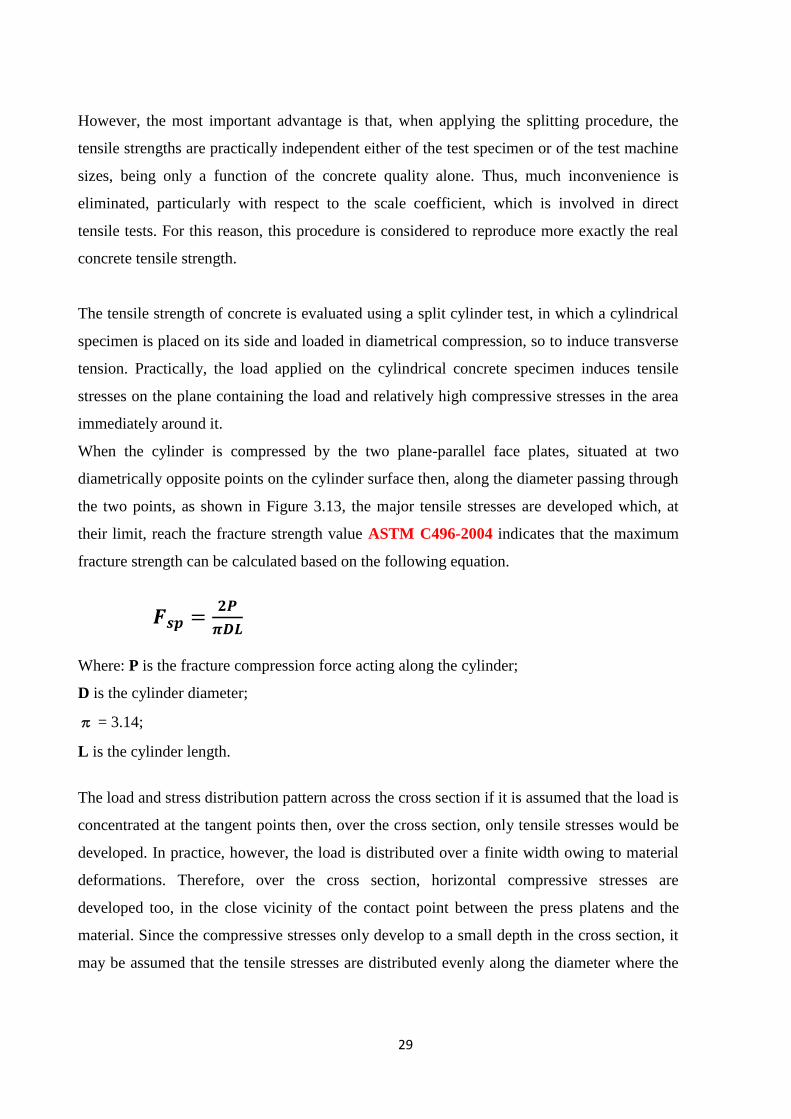
When the cylinder is compressed by the two plane-parallel face plates, situated at two
diametrically opposite points on the cylinder surface then, along the diameter passing through
the two points, as shown in Figure 3.13, the major tensile stresses are developed which, at
their limit, reach the fracture strength value ASTM C496-2004 indicates that the maximum
fracture strength can be calculated based on the following equation.
Where: P is the fracture compression force acting along the cylinder;
D is the cylinder diameter;
π = 3.14;
L is the cylinder length.
The load and stress distribution pattern across the cross section if it is assumed that the load is
concentrated at the tangent points then, over the cross section, only tensile stresses would be
developed. In practice, however, the load is distributed over a finite width owing to material
deformations. Therefore, over the cross section, horizontal compressive stresses are
developed too, in the close vicinity of the contact point between the press platens and the
material. Since the compressive stresses only develop to a small depth in the cross section, it
may be assumed that the tensile stresses are distributed evenly along the diameter where the

31
splitting takes place, the test set up and the illustrations of the test are shown in Figure (3.13)
and Figure (3.14).
Figure 3.13: Split cylinder test setup for cylinder 150 x 300mm
This test can be completed in a standard concrete compression-testing machine, with only one
special requirement: the bearing plates that load the specimen. Split cylinder tests were
conducted on 6 x 12 in. (150 x 300mm) cylinders, tensile stress in the cylinder and the
maximum tensile stress occur at the center of the cylinder.
All cylinder specimens were tested after 28 days from casting. Three cylinders were tested for
each patch, the mean values of the specimens were considered as split cylinder strength.
Figure 3.14: Force applied on cylinder
31
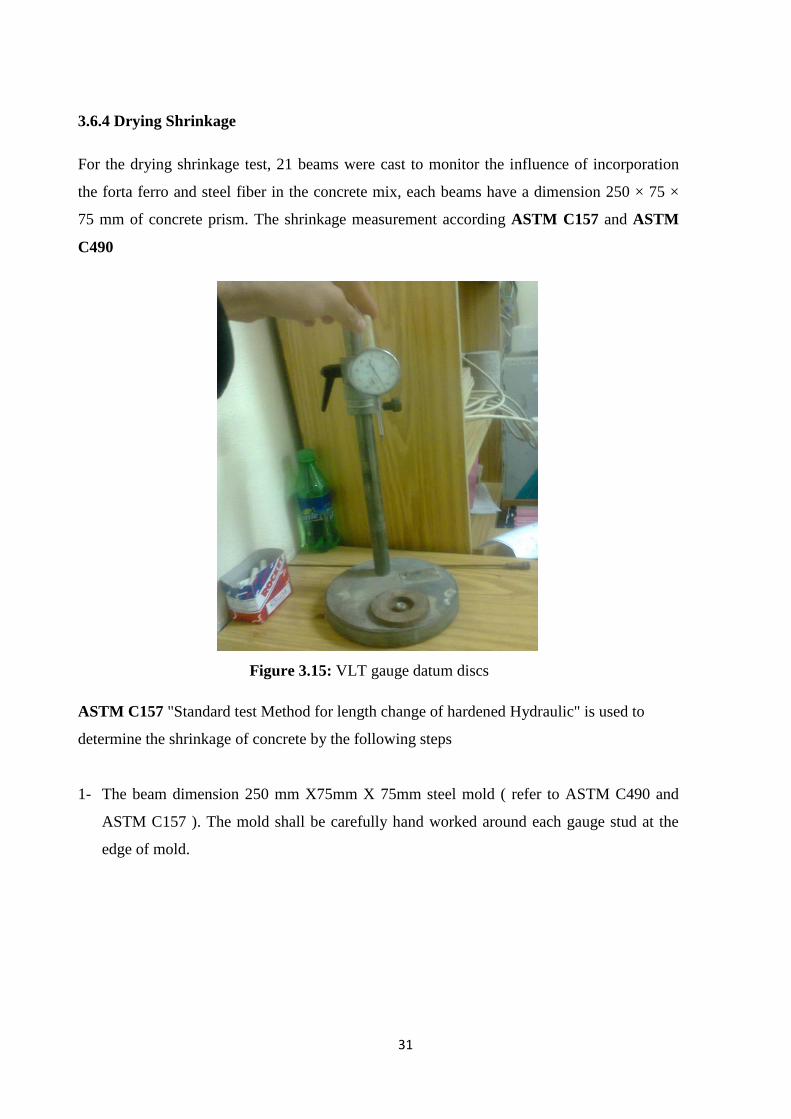
3.6.4 Drying Shrinkage
For the drying shrinkage test, 21 beams were cast to monitor the influence of incorporation
the forta ferro and steel fiber in the concrete mix, each beams have a dimension 250 × 75 ×
75 mm of concrete prism. The shrinkage measurement according ASTM C157 and ASTM
C490
Figure 3.15: VLT gauge datum discs
ASTM C157 "Standard test Method for length change of hardened Hydraulic" is used to
determine the shrinkage of concrete by the following steps
1- The beam dimension 250 mm X75mm X 75mm steel mold ( refer to ASTM C490 and
ASTM C157 ). The mold shall be carefully hand worked around each gauge stud at the
edge of mold.
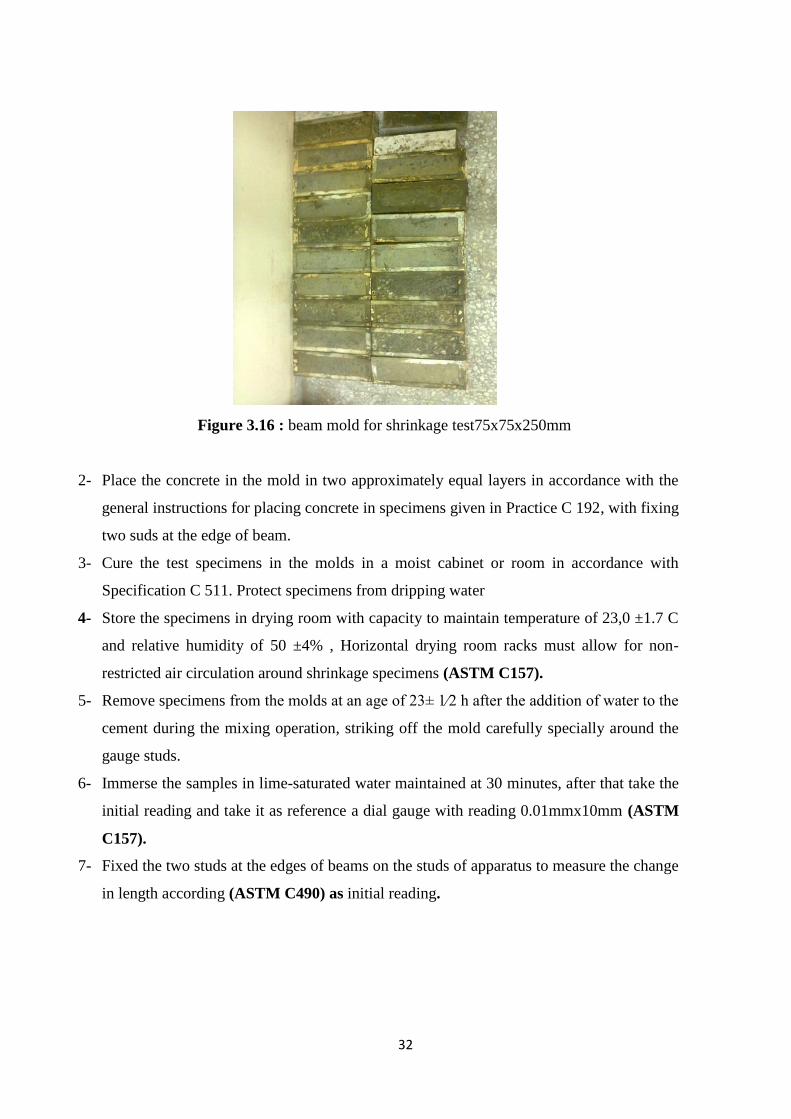
32
Figure 3.16 : beam mold for shrinkage test75x75x250mm
2- Place the concrete in the mold in two approximately equal layers in accordance with the
general instructions for placing concrete in specimens given in Practice C 192, with fixing
two suds at the edge of beam.
3- Cure the test specimens in the molds in a moist cabinet or room in accordance with
Specification C 511. Protect specimens from dripping water
4- Store the specimens in drying room with capacity to maintain temperature of 23,0 ±1.7 C
and relative humidity of 50 ±4% , Horizontal drying room racks must allow for non-
restricted air circulation around shrinkage specimens (ASTM C157).
5- Remove specimens from the molds at an age of 23± 1⁄2 h after the addition of water to the
cement during the mixing operation, striking off the mold carefully specially around the
gauge studs.
6- Immerse the samples in lime-saturated water maintained at 30 minutes, after that take the
initial reading and take it as reference a dial gauge with reading 0.01mmx10mm (ASTM
C157).
7- Fixed the two studs at the edges of beams on the studs of apparatus to measure the change
in length according (ASTM C490) as initial reading.
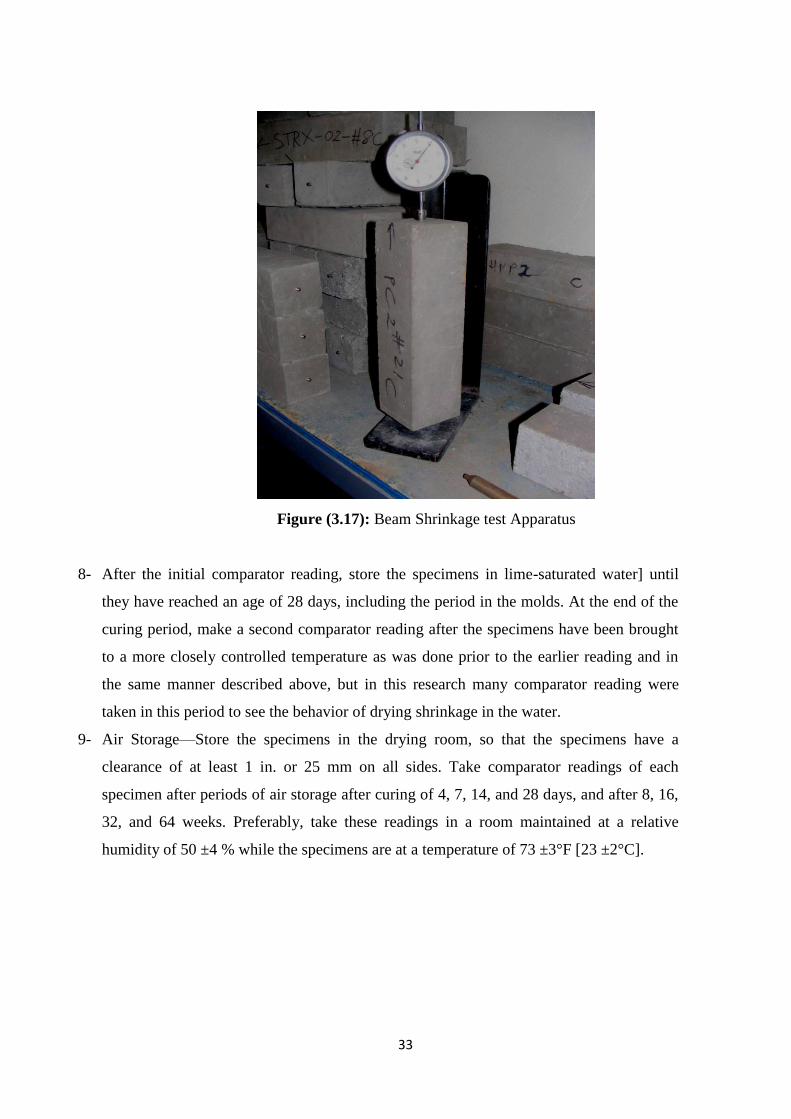
33
Figure (3.17): Beam Shrinkage test Apparatus
8- After the initial comparator reading, store the specimens in lime-saturated water] until
they have reached an age of 28 days, including the period in the molds. At the end of the
curing period, make a second comparator reading after the specimens have been brought
to a more closely controlled temperature as was done prior to the earlier reading and in
the same manner described above, but in this research many comparator reading were
taken in this period to see the behavior of drying shrinkage in the water.
9- Air Storage—Store the specimens in the drying room, so that the specimens have a
clearance of at least 1 in. or 25 mm on all sides. Take comparator readings of each
specimen after periods of air storage after curing of 4, 7, 14, and 28 days, and after 8, 16,
32, and 64 weeks. Preferably, take these readings in a room maintained at a relative
humidity of 50 ±4 % while the specimens are at a temperature of 73 ±3°F [23 ±2°C].

34
Length Change Calculation
The pertinent value calculated from shrinkage test result is is the length change in
percent (%) of specimen relative to specimen relative to the specimen initial 1 day reading
: Length Change Sample in (mm)
R: Final Reading
R1: initial comparator reading of specimen minus comparator reading of reference bar at
that same time; in millimeters
L: Beam length, 250 mm
Calculate length change values for each specimen to the nearest 0.001 % and report
averages to the nearest 0.01 %.
Drying Shrinkage Apparatus
The instrument consists of a channeled base over which two vertical pillars are fixed. An
adjustable cross plate in the top. A dial gauge in Figure (3.17) reading to 0.01mm x 10
mm, can be fixed to the top cross plate. The plunger end of the dial gauge can be located
upon 6.5 mm diameter ball or other reference point cemented in the specimen. On the
base there is similar recessed seating in which can be placed a second ball or reference
point in the specimen. Completed with stainless steel standardization bar with insulated
grip and 6.5 mm diameter. Balls mounted in the ends. Length comparator and reference
bar (refer to ASTM C 490)

35
CHAPTER 4:
RESULTES AND DISCUTION
In this chapter, the results of the effect of the steel fibers and forta ferro on drying shrinkage,
workability, compressive strength and splitting strength are discussed. Comparison between
the control concrete and the fibers added concrete is presented.
4.1 Drying Shrinkage Results of Steel Fibers
The drying shrinkage for different contents of Steel fibers were measured for a period of four
months using VLT dial gauge for length change measure. Three dosage of steel fiber are
added 0.5%, 1.0% and 1.5% by total volume of concrete have been used to study drying
shrinkage properties of concrete according ASTM C 157 Standard. Three beams of each
fibers ratio are casted and the average of three test results is taken for more accurate
results.
4.1.1 Steel Fibers Samples of 0.5% content.
The result of shrinkage in term of axial strain are presents in Table 4.1. Table 4.1 includes
the shrinkage of plain concrete and 0.5% fibrous concrete. These results are also drawn in
Figure 4.1
The result of shrinkage of plain concrete and 0.5% steel fibrous concrete showed the
following stages:
1- At first stage that the samples immerged in the lime water , the samples of plain concrete
and 0.5% steel fibrous concrete starts to expand until reaching 253 micro strain and 239
micro strain respectively, the rate of expansion was increases with time until 28 days by
as show in Figure 4.1
2- After 28 days the samples removed from the water and storage in drying room, the rate
of shrinkage increased until reaching zero at 34 and 33 days for plain concrete and 0.5%
fibrous concrete respectively, the rate of shrinkage continue was commenced increasing
with linear relationship until reaching -250 micro strain for plain concrete and -220 micro
strain for 0.5% fibrous concrete
36
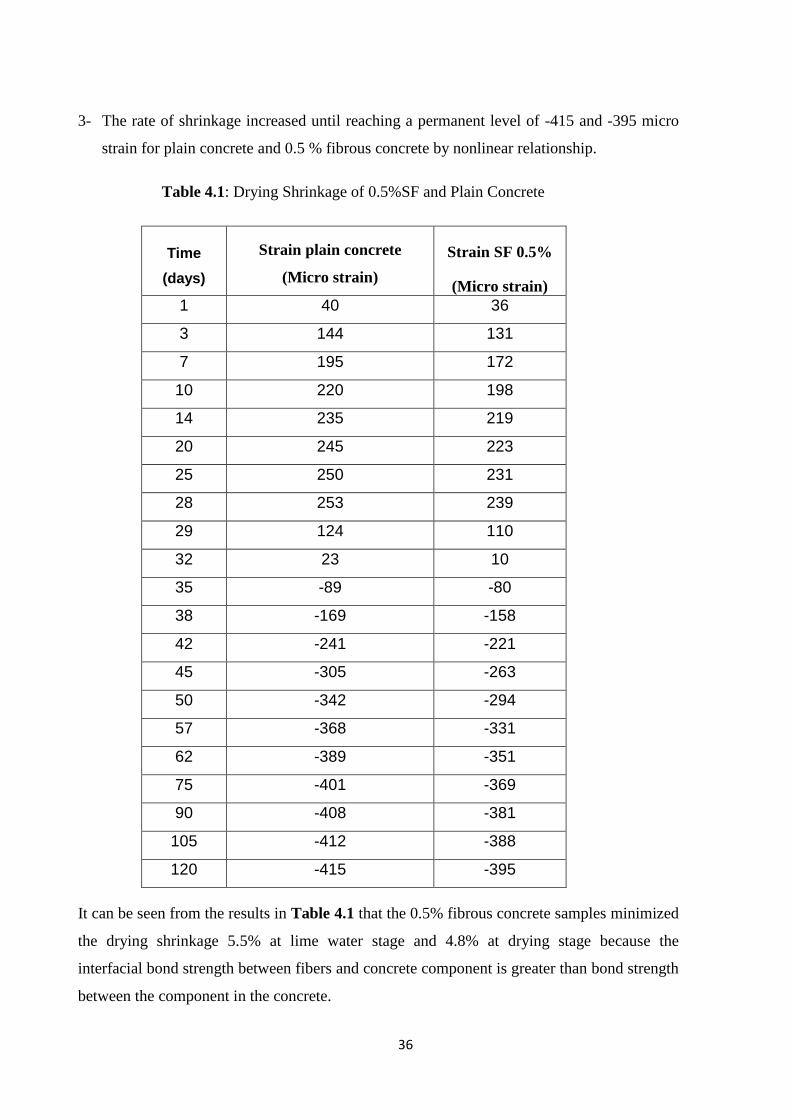
3- The rate of shrinkage increased until reaching a permanent level of -415 and -395 micro
strain for plain concrete and 0.5 % fibrous concrete by nonlinear relationship.
Table 4.1: Drying Shrinkage of 0.5%SF and Plain Concrete
Strain SF 0.5%
(Micro strain)
Strain plain concrete
(Micro strain)
Time
(days)
36 40 1
131 144 3
172 195 7
198 220 10
219 235 14
223 245 20
231 250 25
239 253 28
110 124 29
10 23 32
-80 -89 35
-158 -169 38
-221 -241 42
-263 -305 45
-294 -342 50
-331 -368 57
-351 -389 62
-369 -401 75
-381 -408 90
-388 -412 105
-395 -415 120
It can be seen from the results in Table 4.1 that the 0.5% fibrous concrete samples minimized
the drying shrinkage 5.5% at lime water stage and 4.8% at drying stage because the
interfacial bond strength between fibers and concrete component is greater than bond strength
between the component in the concrete.
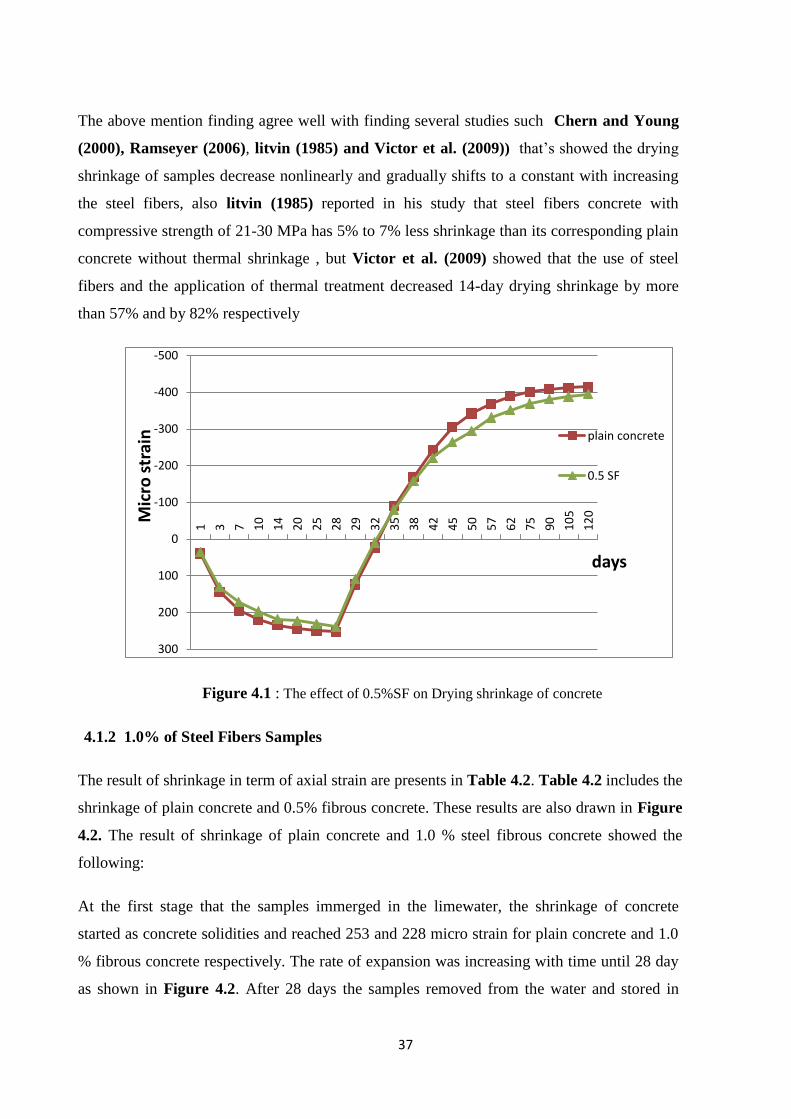
37
The above mention finding agree well with finding several studies such Chern and Young
(2000), Ramseyer (2006), litvin (1985) and Victor et al. (2009)) that’s showed the drying
shrinkage of samples decrease nonlinearly and gradually shifts to a constant with increasing
the steel fibers, also litvin (1985) reported in his study that steel fibers concrete with
compressive strength of 21-30 MPa has 5% to 7% less shrinkage than its corresponding plain
concrete without thermal shrinkage , but Victor et al. (2009) showed that the use of steel
fibers and the application of thermal treatment decreased 14-day drying shrinkage by more
than 57% and by 82% respectively
Figure 4.1 : The effect of 0.5%SF on Drying shrinkage of concrete
4.1.2 1.0% of Steel Fibers Samples
The result of shrinkage in term of axial strain are presents in Table 4.2. Table 4.2 includes the
shrinkage of plain concrete and 0.5% fibrous concrete. These results are also drawn in Figure
4.2. The result of shrinkage of plain concrete and 1.0 % steel fibrous concrete showed the
following:
At the first stage that the samples immerged in the limewater, the shrinkage of concrete
started as concrete solidities and reached 253 and 228 micro strain for plain concrete and 1.0
% fibrous concrete respectively. The rate of expansion was increasing with time until 28 day
as shown in Figure 4.2. After 28 days the samples removed from the water and stored in
-500
-400
-300
-200
-100
0
100
200
300
1 3 7 10
14
20
25
28
29
32
35
38
42
45
50
57
62
75
90
10
5
12
0Mic
ro s
trai
n
days
plain concrete
0.5 SF
38
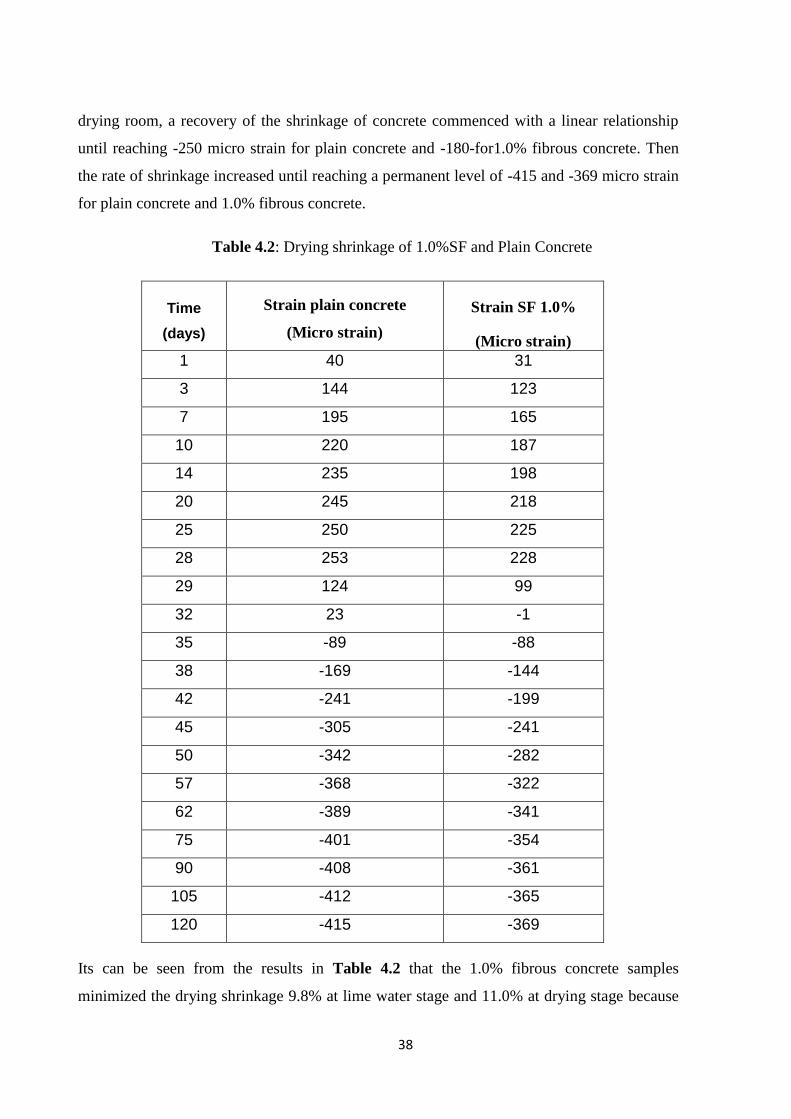
drying room, a recovery of the shrinkage of concrete commenced with a linear relationship
until reaching -250 micro strain for plain concrete and -180-for1.0% fibrous concrete. Then
the rate of shrinkage increased until reaching a permanent level of -415 and -369 micro strain
for plain concrete and 1.0% fibrous concrete.
Table 4.2: Drying shrinkage of 1.0%SF and Plain Concrete
Strain SF 1.0%
(Micro strain)
Strain plain concrete
(Micro strain)
Time
(days)
31 40 1
123 144 3
165 195 7
187 220 10
198 235 14
218 245 20
225 250 25
228 253 28
99 124 29
-1 23 32
-88 -89 35
-144 -169 38
-199 -241 42
-241 -305 45
-282 -342 50
-322 -368 57
-341 -389 62
-354 -401 75
-361 -408 90
-365 -412 105
-369 -415 120
Its can be seen from the results in Table 4.2 that the 1.0% fibrous concrete samples
minimized the drying shrinkage 9.8% at lime water stage and 11.0% at drying stage because
39
the interfacial bond strength between fibers and concrete component is greater than bond
strength between the component in the concrete.
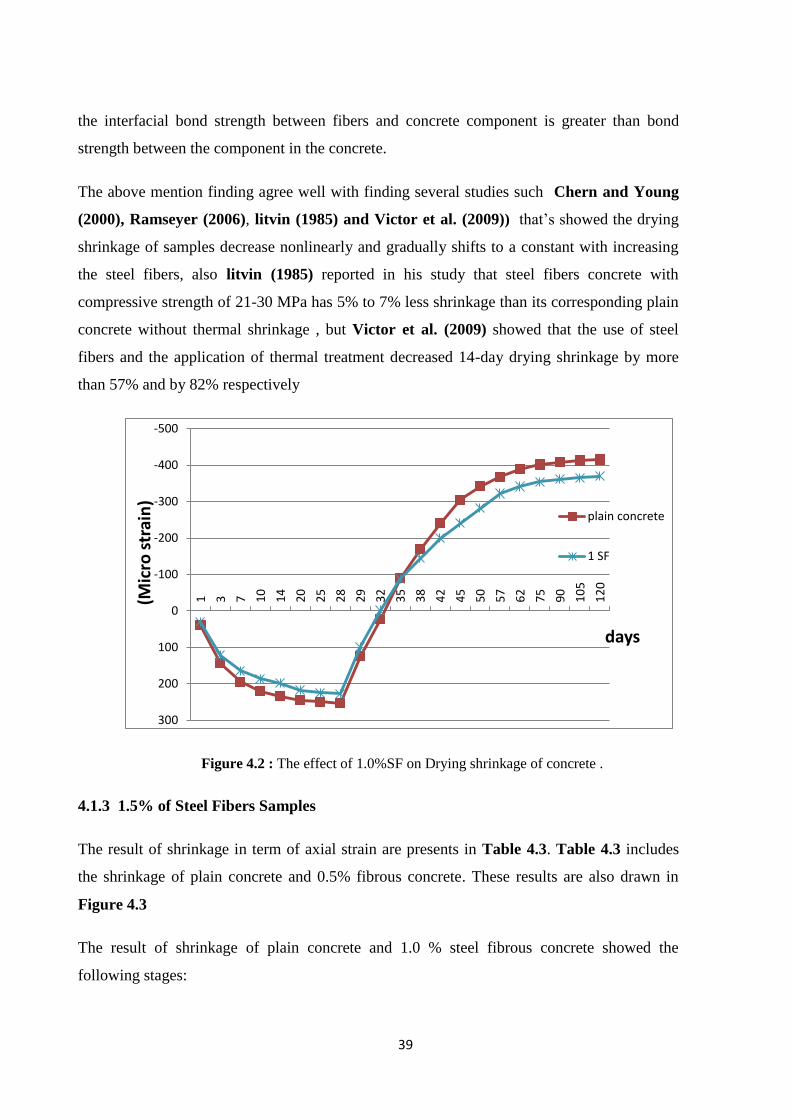
The above mention finding agree well with finding several studies such Chern and Young
(2000), Ramseyer (2006), litvin (1985) and Victor et al. (2009)) that’s showed the drying
shrinkage of samples decrease nonlinearly and gradually shifts to a constant with increasing
the steel fibers, also litvin (1985) reported in his study that steel fibers concrete with
compressive strength of 21-30 MPa has 5% to 7% less shrinkage than its corresponding plain
concrete without thermal shrinkage , but Victor et al. (2009) showed that the use of steel
fibers and the application of thermal treatment decreased 14-day drying shrinkage by more
than 57% and by 82% respectively
Figure 4.2 : The effect of 1.0%SF on Drying shrinkage of concrete .
4.1.3 1.5% of Steel Fibers Samples
The result of shrinkage in term of axial strain are presents in Table 4.3. Table 4.3 includes
the shrinkage of plain concrete and 0.5% fibrous concrete. These results are also drawn in
Figure 4.3
The result of shrinkage of plain concrete and 1.0 % steel fibrous concrete showed the
following stages:
-500
-400
-300
-200
-100
0
100
200
300
1 3 7 10
14
20
25
28
29
32
35
38
42
45
50
57
62
75
90
10
5
12
0
(Mic
ro s
trai
n)
days
plain concrete
1 SF

41
1- At the stage that the samples immerged in the limewater, the shrinkage of concrete started
as concrete solidities and reached 253 and 213 micro strain for plain concrete and 1.5 %
fibrous concrete respectively. The rate of expansion was increasing with time as shown in
Figure 4.3
2- After 28 days the samples removed from the water and storage in drying room, a recovery
of the shrinkage of concrete commenced with a linear relationship until reaching -120
micro strain for 1.5% fibrous concrete.
3- The rate of shrinkage increased until reaching a permanent level of -415 and -347 micro
strain for plain concrete and 1.5% fibrous concrete by nonlinear relationship.
Its can be seen from the results in Table 4.3 that the 1.5% fibrous concrete samples
minimized the drying shrinkage 15.8% at lime water stage and 16.3% at drying stage because
the interfacial bond strength between fibers and concrete component is greater than bond
strength between the component in the concrete.
The above mention finding agree well with finding several studies such Chern and Young
(2000), Ramseyer (2006), litvin (1985) and Victor et al. (2009)) that’s showed the drying
shrinkage of samples decrease nonlinearly and gradually shifts to a constant with increasing
the steel fibers, also litvin (1985) reported in his study that steel fibers concrete with
compressive strength of 21-30 MPa has 5% to 7% less shrinkage than its corresponding plain
concrete without thermal shrinkage , but Victor et al. (2009) showed that the use of steel
fibers and the application of thermal treatment decreased 14-day drying shrinkage by more
than 57% and by 82% respectively

41
Table 4.3: Drying shrinkage of 1.5%SF and Plain Concrete
Strain SF 1.5%
(Micro strain)
Strain plain concrete
(Micro strain)
Time
(days)
26 40 1
115 144 3
154 195 7
175 220 10
184 235 14
197 245 20
208 250 25
213 253 28
82 124 29
-11 23 32
-76 -89 35
-125 -169 38
-187 -241 42
-235 -305 45
-268 -342 50
-297 -368 57
-318 -389 62
-330 -401 75
-342 -408 90
-345 -412 105
-347 -415 120

42
Figure 4.3 : The effect of 1.5%SF on Drying shrinkage of concrete
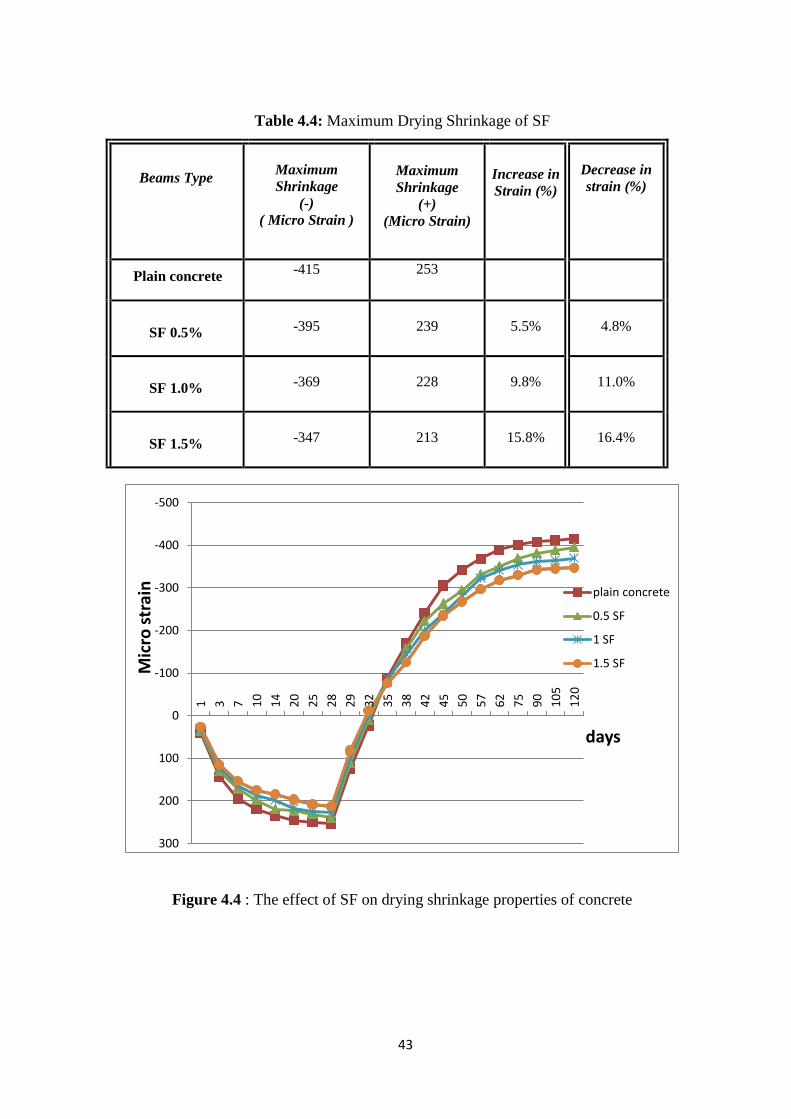
4.1.4 Comparison between Shrinkage of Plain Concrete and Steel Fibrous Concrete
Samples.
A comparison between the drying shrinkage of plain concrete and 0.5%, 1.0% and 1.5% steel
fibrous concrete sample is shown in Table 4.4 and Figure 4.4. The result shown in Table 4.4
and Figure 4.4 that SF with 0.5% ,1% and 1.5 % decrease the drying shrinkage by 5.5%
,11% and 16.4% respectively, the results in Figure (4.4) show that the drying shrinkage
decrease with increase the SF in Concrete.
At 1.5% SF content, the drying shrinkage decrease 16.4% in comparison with the control
concrete mix. This finding agrees with the observation made by other researchers such as
Chern and Young (2000), Ramseyer (2006), litvin (1985) and Victor et al. (2009))
-500
-400
-300
-200
-100
0
100
200
300
1 3 7 10 14 20 25 28 29 32 35 38 42 45 50 57 62 75 90 105120
Mic
ro s
trai
n
days
plain concrete
1.5 SF
43
Table 4.4: Maximum Drying Shrinkage of SF
Beams Type
Maximum
Shrinkage
(-)
( Micro Strain )
(Micro Strain)
Maximum
Shrinkage
(+)
(Micro Strain)
Increase in
Strain (%)
Decrease in
strain (%)
Plain concrete -415 253
SF 0.5% -395 239 5.5% 4.8%
SF 1.0% -369 228 9.8% 11.0%
SF 1.5% -347 213 15.8% 16.4%
Figure 4.4 : The effect of SF on drying shrinkage properties of concrete
-500
-400
-300
-200
-100
0
100
200
300
1 3 7 10
14
20
25
28
29
32
35
38
42
45
50
57
62
75
90
10
5
12
0
Mic
ro s
trai
n
days
plain concrete
0.5 SF
1 SF
1.5 SF
44
4.2 Drying Shrinkage Results of Forta Ferro Fibers
The drying shrinkage for different contents of forta ferro fibers were measured for period of
four months using VLT dial gauge for length change measure. Three dosage of FF fiber are
added 0.5%, 1.0% and 1.5% by total volume of concrete have been used to study drying
shrinkage properties of concrete according ASTM C 157 Standard. Three beams of each
Fibers ratio are casted and the average of three test results is taken for more accurate
results.
4.2.1 0.5% of Forta Ferro Fibers Samples
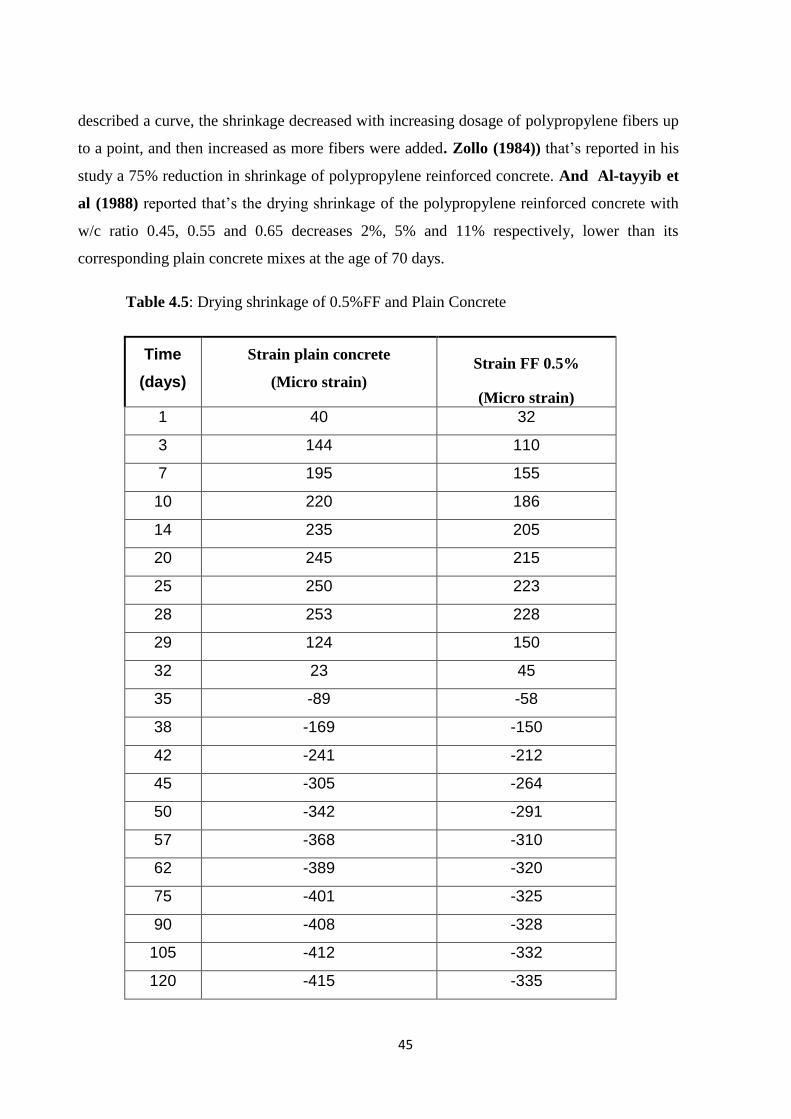
The result of shrinkage in term of axial strain are presents in Table 4.5. Table 4.5 includes
the shrinkage of plain concrete and 0.5% fibrous concrete. These results are also drawn in
Figure 4.5
The result of shrinkage of plain concrete and 0.5 % forta ferro fibrous concrete showed the
following stages:
1- At the stage that the samples immerged in the limewater, the shrinkage of concrete started
as concrete solidities and reached 253 and 228 micro strain for plain concrete and 1.5%
forta ferro fibrous concrete respectively. The rate of expansion was increasing with time
as shown in Figure 4.5
2- After 28 days the samples removed from the water and storage in drying room, a
recovery of the shrinkage of concrete commenced with a linear relationship until reaching
-200 micro strain for 0.5% fibrous concrete and -250 for plain concrete.
3- The rate of shrinkage increased until reaching a permanent level of -415 and -335 micro
strain for plain concrete and 1.5% fibrous concrete by nonlinear relationship.
It can be seen from the results in Table 4.5 that the 0.5% fibrous concrete samples
minimized the drying shrinkage 9.8% at lime water stage and 19.2% at drying stage because
the interfacial bond strength between fibers and concrete component is greater than bond
strength between the component in the concrete.
The above mention finding agree well with finding several studies such as Kao (2005) that’s
found that drying shrinkage was greatly reduced by the addition of fibers. Each fiber
45
described a curve, the shrinkage decreased with increasing dosage of polypropylene fibers up
to a point, and then increased as more fibers were added. Zollo (1984)) that’s reported in his
study a 75% reduction in shrinkage of polypropylene reinforced concrete. And Al-tayyib et
al (1988) reported that’s the drying shrinkage of the polypropylene reinforced concrete with
w/c ratio 0.45, 0.55 and 0.65 decreases 2%, 5% and 11% respectively, lower than its
corresponding plain concrete mixes at the age of 70 days.
Table 4.5: Drying shrinkage of 0.5%FF and Plain Concrete
Time
(days)
Strain plain concrete
(Micro strain)
Strain FF 0.5%
(Micro strain)
1 40 32
3 144 110
7 195 155
10 220 186
14 235 205
20 245 215
25 250 223
28 253 228
29 124 150
32 23 45
35 -89 -58
38 -169 -150
42 -241 -212
45 -305 -264
50 -342 -291
57 -368 -310
62 -389 -320
75 -401 -325
90 -408 -328
105 -412 -332
120 -415 -335
46
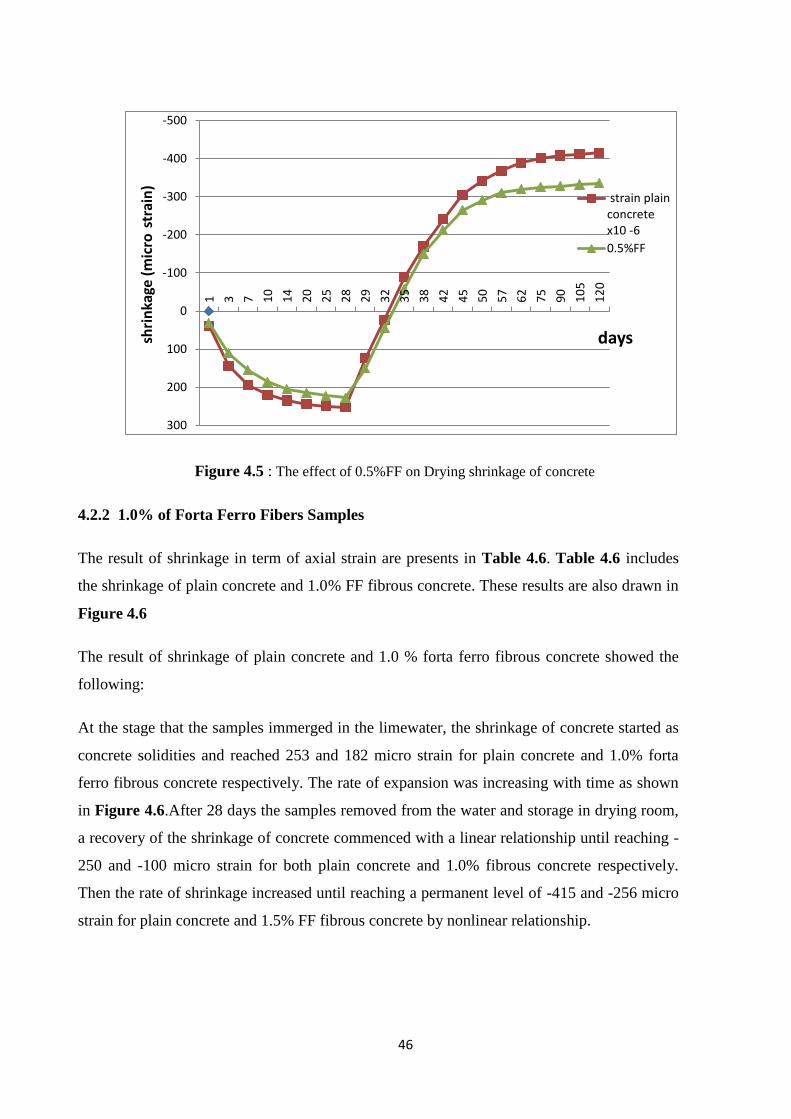
Figure 4.5 : The effect of 0.5%FF on Drying shrinkage of concrete
4.2.2 1.0% of Forta Ferro Fibers Samples
The result of shrinkage in term of axial strain are presents in Table 4.6. Table 4.6 includes
the shrinkage of plain concrete and 1.0% FF fibrous concrete. These results are also drawn in
Figure 4.6
The result of shrinkage of plain concrete and 1.0 % forta ferro fibrous concrete showed the
following:
At the stage that the samples immerged in the limewater, the shrinkage of concrete started as
concrete solidities and reached 253 and 182 micro strain for plain concrete and 1.0% forta
ferro fibrous concrete respectively. The rate of expansion was increasing with time as shown
in Figure 4.6.After 28 days the samples removed from the water and storage in drying room,
a recovery of the shrinkage of concrete commenced with a linear relationship until reaching -
250 and -100 micro strain for both plain concrete and 1.0% fibrous concrete respectively.
Then the rate of shrinkage increased until reaching a permanent level of -415 and -256 micro
strain for plain concrete and 1.5% FF fibrous concrete by nonlinear relationship.
-500
-400
-300
-200
-100
0
100
200
300
1 3 7 10
14
20
25
28
29
32
35
38
42
45
50
57
62
75
90
10
5
12
0
shri
nka
ge (
mic
ro st
rain
)
days
strain plainconcretex10 -6
0.5%FF

47
Table 4.6: Drying shrinkage of 1.0%FF and Plain Concrete
Time
(days)
Strain plain concrete
(Micro strain)
Strain FF 1.0%
(Micro strain)
1 40 10
3 144 70
7 195 111
10 220 141
14 235 162
20 245 171
25 250 178
28 253 182
29 124 111
32 23 32
35 -89 -43
38 -169 -102
42 -241 -145
45 -305 -176
50 -342 -207
57 -368 -220
62 -389 -235
75 -401 -246
90 -408 -250
105 -412 -253
120 -415 -256
It can be seen from the results in Table 4.6 that the 1.0% fibrous concrete samples minimized
the drying shrinkage 28.0% at lime water stage and 38.3% at drying stage because the
interfacial bond strength between fibers and concrete component is greater than bond strength
between the component in the concrete.

48
The above mention finding agree well with finding several studies such as Kao (2005) that’s
found that drying shrinkage was greatly reduced by the addition of fibers. Each fiber
described a curve, the shrinkage decreased with increasing dosage of polypropylene fibers up
to a point, and then increased as more fibers were added. Zollo (1984)) that’s reported in his
study a 75% reduction in shrinkage of polypropylene reinforced concrete. And Al-tayyib et
al (1988) reported that’s the drying shrinkage of the polypropylene reinforced concrete with
w/c ratio 0.45, 0.55 and 0.65 decreases 2%, 5% and 11% respectively, lower than its
corresponding plain concrete mixes at the age of 70 days.
Figure 4.6 : The effect of 1.0%FF on Drying shrinkage of concrete .
4.2.3 1.5% of Forta Ferro Fibers Samples
The result of shrinkage in term of axial strain are presents in Table 4.7. Table 4.7 includes
the shrinkage of plain concrete and 1.5% FF fibrous concrete. These results are also drawn in
Figure 4.7
The result of shrinkage of plain concrete and 1.0 % forta ferro fibrous concrete showed the
following stages:
-500
-400
-300
-200
-100
0
100
200
300
1 3 7 10
14
20
25
28
29
32
35
38
42
45
50
57
62
75
90
10
5
12
0
shri
nka
ge (
mic
ro s
trai
n)
days
strain plainconcretex10 -6
1%FF

49
1- At the stage that the samples immerged in the limewater, the shrinkage of concrete started
as concrete solidities and reached 253 and 208 micro strain for plain concrete and 1.0%
forta ferro fibrous concrete respectively. The rate of expansion was increasing with time
as shown in Figure 4.7
2- After 28 days the samples removed from the water and storage in drying room, a
recovery of the shrinkage of concrete commenced with a linear relationship until reaching
-250and -100 micro strain for both plain concrete and 1.5% FF fibrous concrete
respectively.
3- The rate of shrinkage increased with nonlinear relationship until reaching a permanent
level of -415 and -291 micro strain for plain concrete and 1.5% FF fibrous concrete.
Its can be seen from the results in Table 4.7 that the 1.5% fibrous concrete samples
minimized the drying shrinkage 17.7% at lime water stage and 29.8% at drying stage because
the interfacial bond strength between fibers and concrete component is greater than bond
strength between the component in the concrete.
The above mention finding agree well with finding several studies such as Kao (2005) that’s
found that drying shrinkage was greatly reduced by the addition of fibers. Each fiber
described a curve, the shrinkage decreased with increasing dosage of polypropylene fibers up
to a point, and then increased as more fibers were added. Zollo (1984)) that’s reported in his
study a 75% reduction in shrinkage of polypropylene reinforced concrete. And Al-tayyib et
al (1988) reported that’s the drying shrinkage of the polypropylene reinforced concrete with
w/c ratio 0.45, 0.55 and 0.65 decreases 2%, 5% and 11% respectively, lower than its
corresponding plain concrete mixes at the age of 70 days.

51
Table 4.7: Drying shrinkage of 1.5%FF and Plain Concrete
Time
(days)
Strain plain concrete
(Micro strain)
Strain FF 1.5%
(Micro strain)
1 40 21
3 144 95
17 195 132
10 220 165
14 235 184
20 245 195
25 250 202
28 253 208
29 124 132
32 23 41
35 -89 -51
38 -169 -122
42 -241 -173
45 -305 -213
50 -342 -244
57 -368 -264
62 -389 -275
75 -401 -282
90 -408 -286
105 -412 -289
120 -415 -291

51
Figure 4.7: The effect of 1.5%FF on Drying shrinkage of concrete
4.2.4 Comparison between shrinkage of plain concrete and forta ferro fibrous concrete
samples
A comparison between the drying shrinkage of plain concrete and 0.5%, 1.0% and 1.5% steel
fibrous concrete sample is shown in Table 4.8 and Figure 4.8, The result in Table (4.8) show
that FF with 0.5%,1.0% and 1.5% decrease the drying shrinkage 19.2% ,38.31 and 29.8%
respectively the result in Figure (4.8) show that the drying shrinkage decrease with increase
the FF in Concrete.
At 1.0% FF content, the drying shrinkage decrease 38.31% in comparison with the control
concrete mix. This finding agrees with the observation made by other researchers such as
(Kao (2005), Al-Tayyib et al , (1988) and Zollo (1984)).
-500
-400
-300
-200
-100
0
100
200
300
1 3 7 10
14
20
25
28
29
32
35
38
42
45
50
57
62
75
90
10
5
12
0
shri
nka
ge (
mic
ro s
trai
n)
days
strain plainconcretex10 -6
1.5% FF
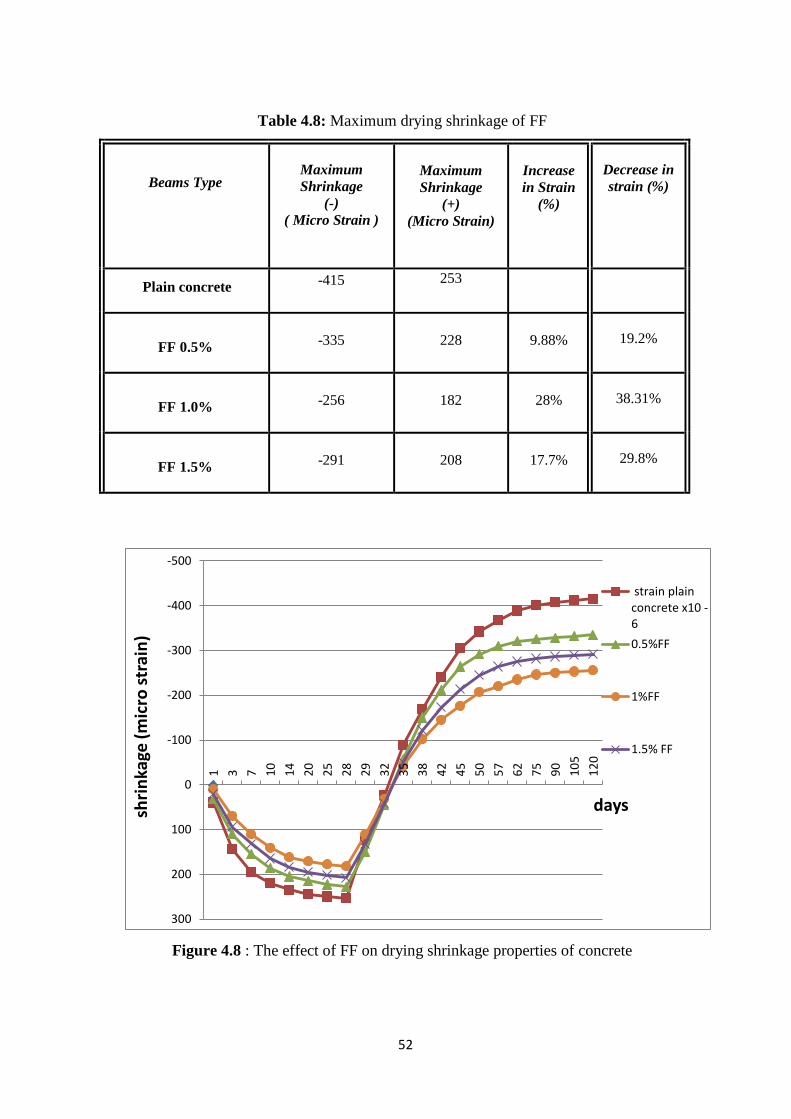
52
Table 4.8: Maximum drying shrinkage of FF
Beams Type
Maximum
Shrinkage
(-)
( Micro Strain )
(Micro Strain)
Maximum
Shrinkage
(+)
(Micro Strain)
Increase
in Strain
(%)
Decrease in
strain (%)
Plain concrete -415 253
FF 0.5% -335 228 9.88% 19.2%
FF 1.0% -256 182 28% 38.31%
FF 1.5% -291 208 17.7% 29.8%
Figure 4.8 : The effect of FF on drying shrinkage properties of concrete
-500
-400
-300
-200
-100
0
100
200
300
1 3 7 10
14
20
25
28
29
32
35
38
42
45
50
57
62
75
90
10
5
12
0
shri
nka
ge (
mic
ro s
trai
n)
days
strain plainconcrete x10 -6
0.5%FF
1%FF
1.5% FF

53
4.3 Maximum Shrinkage of Forta Ferro and Steel Fibers
From the above test of drying shrinkage. Certain percentages of FF and SF that reduce the
drying shrinkage far better than the plain concrete. Three dosage of SF and FF are added
0.5%,1%and 1.5% by total volume of concrete have been used to study drying shrinkage
properties of concrete according ASTM C 157 Standard, Table(4.9) Shows that 1.5% is the
optimum percentage of SF in concrete , it decreases the drying shrinkage about 16.4% , Also
1% is the optimum percentage of FF , it decreases the drying shrinkage about 38.31%
Table 4.9: Maximum drying shrinkage of FF and SF
Beams Type
Maximum
Shrinkage
(-)
( Micro Strain )
(Micro Strain)
Maximum
Shrinkage
(+)
(Micro Strain)
Increase in
Strain (%)
Decrease in
strain (%)
Plain concrete -415 253
Z
SF 0.5% -395 239 5.5% 4.8%
SF 1.0% -369 228 9.8% 11.0%
SF 1.5% -347 213 15.8% 16.4%
FF 0.5% -335 228 9.88% 19.2%
FF 1.0% -256 182 28% 38.31%
FF 1.5% -291 208 17.7% 29.8%
Table(4.9) Shows that 1.5% is the optimum percentage of SF in concrete , it decreases the
drying shrinkage about 16.4% , Also 1% is the optimum percentage of FF , it decreases the
drying shrinkage about 38.91%
The result observe that FF is better than SF for reducing the drying shrinkage of concrete ,
This finding agrees with the observation made by other researchers such as (Kao (2005), Al-

54
Tayyib et al, (1988), Zollo (1984) Chern and Young (2000), Ramseyer (2006), litvin
(1985) and Victor et al. (2009))
.
Figure 4.9 : Maximum drying shrinkage of FF and SF
4.4 Fresh properties
4.4.1 Slump Results
The Slump result for different contents of steel fibers and forta ferro fibers were tested
according ASTM C143.The steel fibers and forta ferro fibers ratios were taken as 0%,
0.5%, 1% and1.5% (by total volume).
In addition, the slump values for the different contents of steel fibers and forta ferro are
recorded as shown in Table (4.10). The relationship between slump values and Steel and
forta ferro fibers contents are shown in Figure (4.10). It is noticed that with the addition of
Steel fibers slump values are reduced. However, the mixes used are still workable. For SF
0.5% samples, the slump is reduced by 16% and at SF 1.5% the slump is reduced by 35%
compared with plain concrete slump. In addition, It is noticed that with the addition of forta
ferro fibers slump values are reduced. However, the mixes used are still workable for 0.5%
and 1% but it's not workable at 1.5% .For FF 0.5% and FF 1.0%, the slump is reduced by
0
50
100
150
200
250
300
350
400
450
SF 0.5 % FF 0.5% SF 1.0% FF 1.0% SF 1.5% FF 1.5%
PlainConcrete
0.50% 1.00% 1.50%
Plain Concrete
0.50% SF 0.5 %
0.50% FF 0.5%
1.00% SF 1.0%
1.00% FF 1.0%
1.50% SF 1.5%
1.50% FF 1.5%
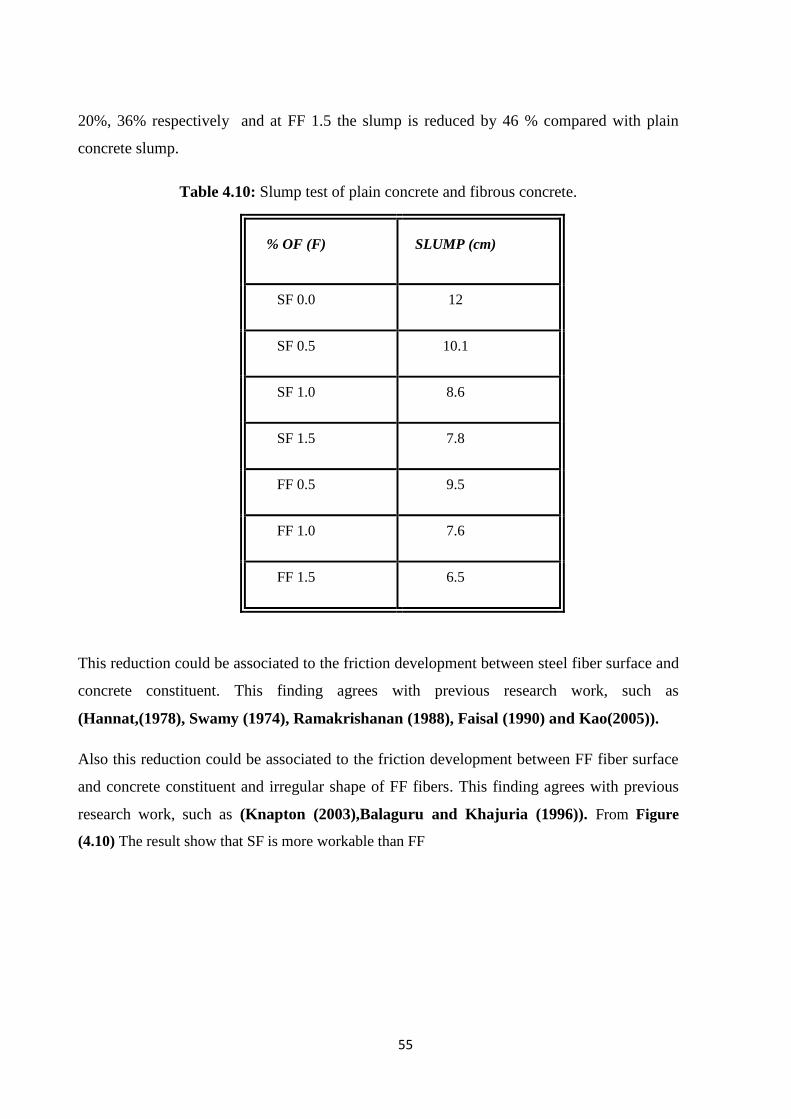
55
20%, 36% respectively and at FF 1.5 the slump is reduced by 46 % compared with plain
concrete slump.
Table 4.10: Slump test of plain concrete and fibrous concrete.
% OF (F) SLUMP (cm)
SF 0.0 12
SF 0.5 10.1
SF 1.0 8.6
SF 1.5 7.8
FF 0.5 9.5
FF 1.0 7.6
FF 1.5 6.5
This reduction could be associated to the friction development between steel fiber surface and
concrete constituent. This finding agrees with previous research work, such as
(Hannat,(1978), Swamy (1974), Ramakrishanan (1988), Faisal (1990) and Kao(2005)).
Also this reduction could be associated to the friction development between FF fiber surface
and concrete constituent and irregular shape of FF fibers. This finding agrees with previous
research work, such as (Knapton (2003),Balaguru and Khajuria (1996)). From Figure
(4.10) The result show that SF is more workable than FF
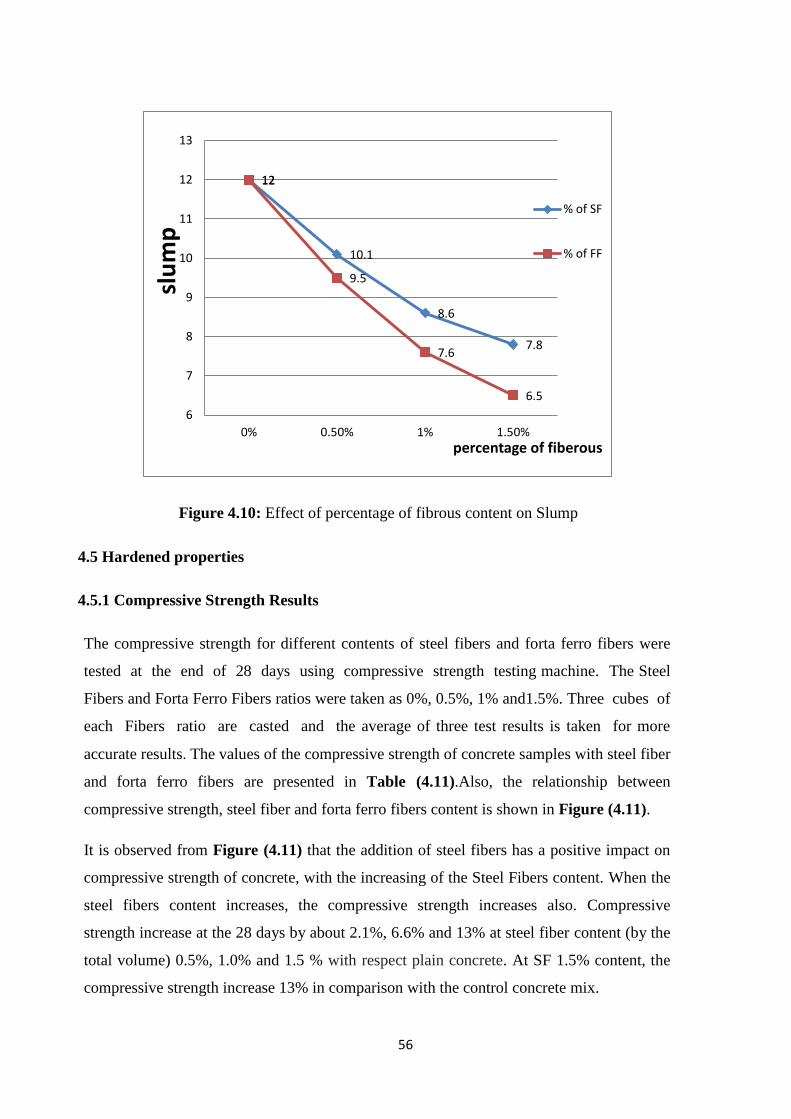
56
Figure 4.10: Effect of percentage of fibrous content on Slump
4.5 Hardened properties
4.5.1 Compressive Strength Results
The compressive strength for different contents of steel fibers and forta ferro fibers were
tested at the end of 28 days using compressive strength testing machine. The Steel
Fibers and Forta Ferro Fibers ratios were taken as 0%, 0.5%, 1% and1.5%. Three cubes of
each Fibers ratio are casted and the average of three test results is taken for more
accurate results. The values of the compressive strength of concrete samples with steel fiber
and forta ferro fibers are presented in Table (4.11).Also, the relationship between
compressive strength, steel fiber and forta ferro fibers content is shown in Figure (4.11).
It is observed from Figure (4.11) that the addition of steel fibers has a positive impact on
compressive strength of concrete, with the increasing of the Steel Fibers content. When the
steel fibers content increases, the compressive strength increases also. Compressive
strength increase at the 28 days by about 2.1%, 6.6% and 13% at steel fiber content (by the
total volume) 0.5%, 1.0% and 1.5 % with respect plain concrete. At SF 1.5% content, the
compressive strength increase 13% in comparison with the control concrete mix.
12
10.1
8.6
7.8
12
9.5
7.6
6.5
6
7
8
9
10
11
12
13
0% 0.50% 1% 1.50%
slu
mp
percentage of fiberous
% of SF
% of FF
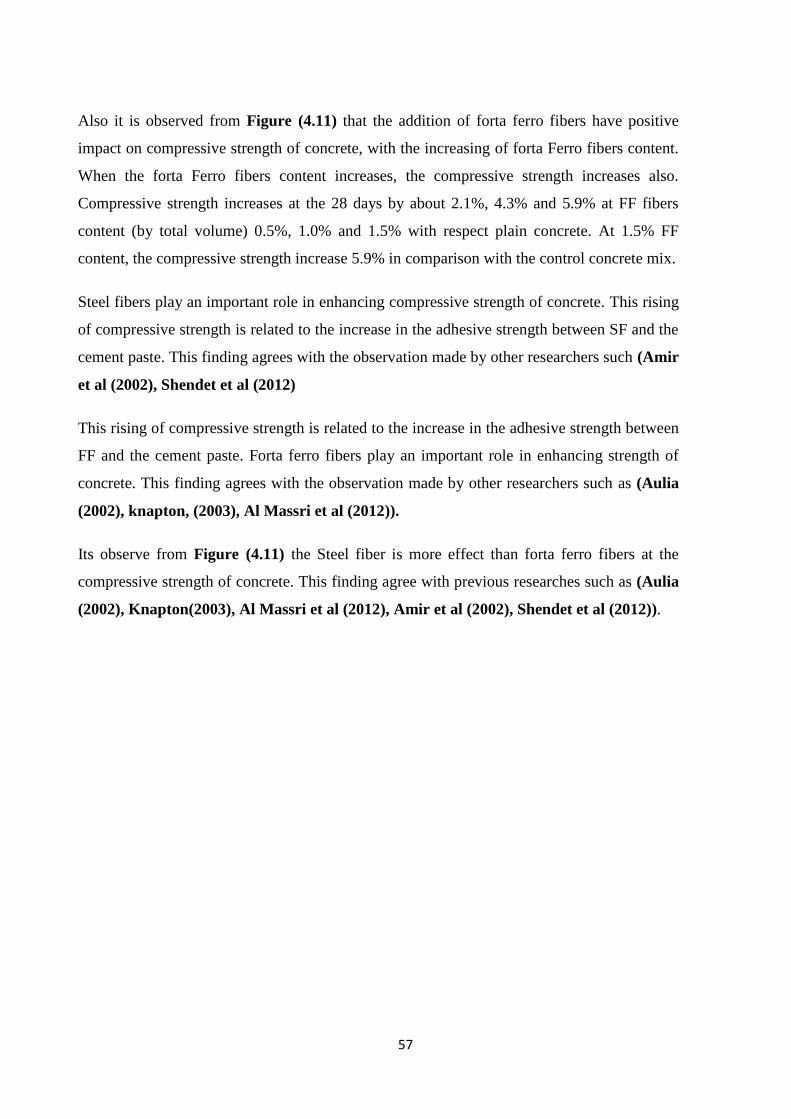
57
Also it is observed from Figure (4.11) that the addition of forta ferro fibers have positive
impact on compressive strength of concrete, with the increasing of forta Ferro fibers content.
When the forta Ferro fibers content increases, the compressive strength increases also.
Compressive strength increases at the 28 days by about 2.1%, 4.3% and 5.9% at FF fibers
content (by total volume) 0.5%, 1.0% and 1.5% with respect plain concrete. At 1.5% FF
content, the compressive strength increase 5.9% in comparison with the control concrete mix.
Steel fibers play an important role in enhancing compressive strength of concrete. This rising
of compressive strength is related to the increase in the adhesive strength between SF and the
cement paste. This finding agrees with the observation made by other researchers such (Amir
et al (2002), Shendet et al (2012)
This rising of compressive strength is related to the increase in the adhesive strength between
FF and the cement paste. Forta ferro fibers play an important role in enhancing strength of
concrete. This finding agrees with the observation made by other researchers such as (Aulia
(2002), knapton, (2003), Al Massri et al (2012)).
Its observe from Figure (4.11) the Steel fiber is more effect than forta ferro fibers at the
compressive strength of concrete. This finding agree with previous researches such as (Aulia
(2002), Knapton(2003), Al Massri et al (2012), Amir et al (2002), Shendet et al (2012)).
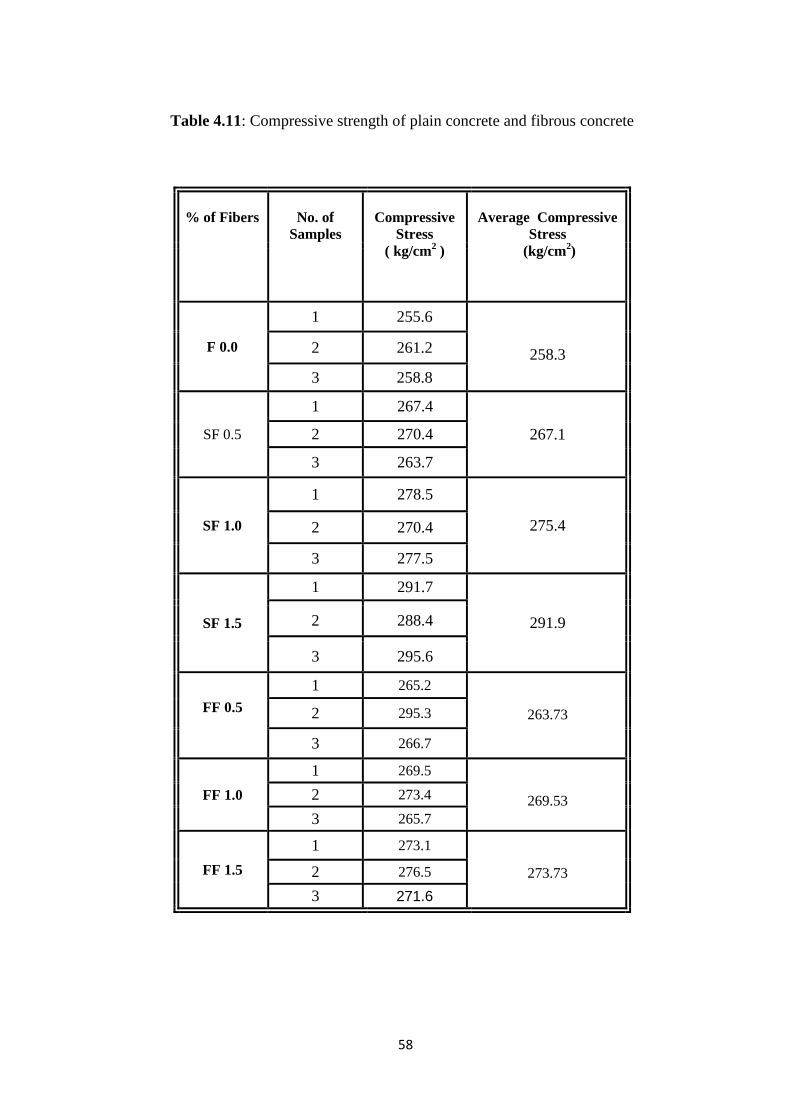
58
Table 4.11: Compressive strength of plain concrete and fibrous concrete
% of Fibers
No. of
Samples
Compressive
Stress
( kg/cm2 )
Average Compressive
Stress
(kg/cm2)
F 0.0
1 255.6
258.3 2 261.2
3 258.8
SF 0.5
1 267.4
267.1 2 270.4
3 263.7
SF 1.0
1 278.5
275.4 2 270.4
3 277.5
SF 1.5
1 291.7
291.9 2 288.4
3 295.6
FF 0.5
1 265.2
263.73 2 295.3
3 266.7
FF 1.0
1 269.5
269.53 2 273.4
3 265.7
FF 1.5
1 273.1
273.73 2 276.5
3 271.6

59
Figure 4.11: The effect of fibrous on Compressive Strength of Concrete
4.5.2 Spiltting Strength Results
The splitting strength for different contents of steel fibers and forta ferro fibers were tested at
the end of 28 days cylinders split tensile test machine. The steel fibers and forta ferro Fibers
ratios were taken as 0%, 0.5%, 1% and1.5%. Three cylindrical specimens of each Fibers
ratio are casted and the average of three test results is taken for more accurate results.
The values of the splitting strength are presented in Table (4.12). In addition, the relationship
between splitting strength, Steel and forta ferro fiber content is shown in Figure (4.12). It is
observed from Figure (4.12) that the addition of steel fibers has a positive impact on splitting
strength of concrete, with the increasing of the steel fibers content. When the steel fibers
content increases, the splitting strength increases also. Splitting strength increase at the 28
days by about 6%, 20.8% and 35.5 % at steel fiber content (by the total volume) 0.5%, 1.0%
and 1.5 % with respect plain concrete, also it is observed from Figure (4.12) that the addition
of forta ferro fibers has a positive impact on splitting strength of concrete, with the increasing
of the forta ferro fibers content. When the forta ferro fibers content increases, the compressive
258.3
267.1
275.4
291.9
258.3
263.73
269.53
273.73
240
250
260
270
280
290
300
0 0.5 1 1.5
Co
mp
ress
ive
stre
ngt
h
percentage of fiberous
SF
FF
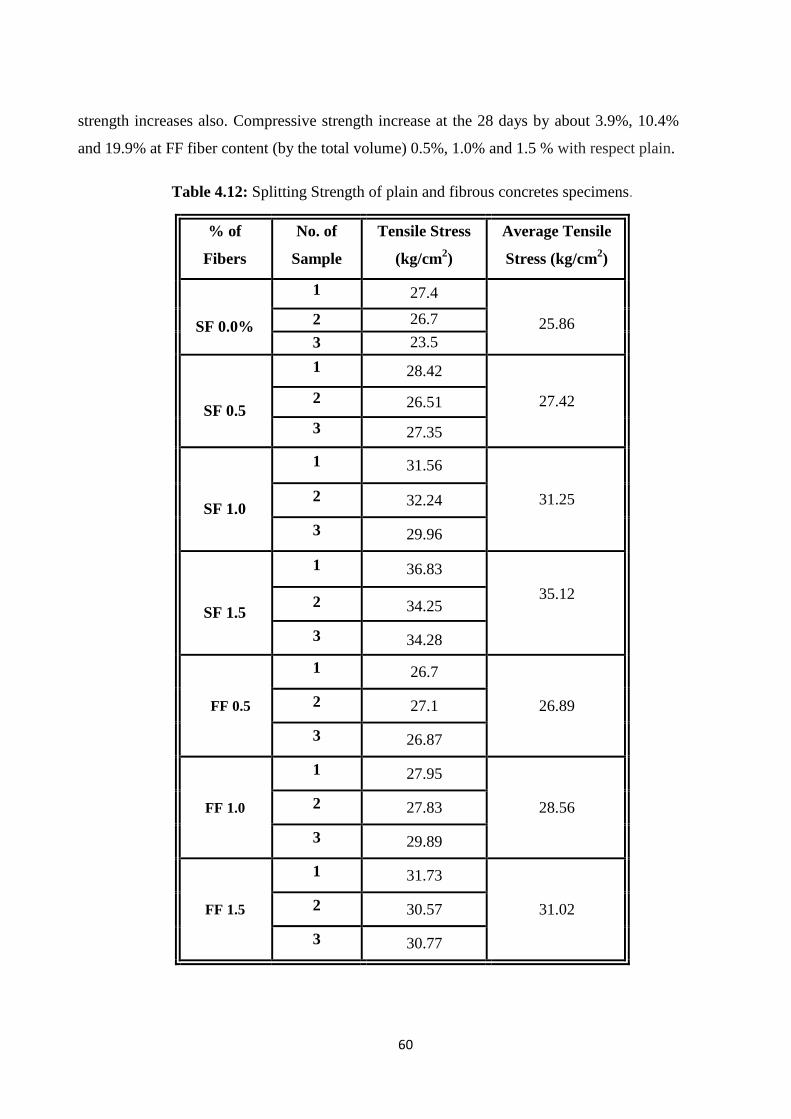
61
strength increases also. Compressive strength increase at the 28 days by about 3.9%, 10.4%
and 19.9% at FF fiber content (by the total volume) 0.5%, 1.0% and 1.5 % with respect plain.
Table 4.12: Splitting Strength of plain and fibrous concretes specimens.
% of
Fibers
No. of
Sample
Tensile Stress
(kg/cm2)
Average Tensile
Stress (kg/cm2)
SF 0.0%
1 27.4
25.86 2 26.7
3 23.5
SF 0.5
1 28.42
27.42 2 26.51
3 27.35
SF 1.0
1 31.56
31.25 2 32.24
3 29.96
SF 1.5
1 36.83
35.12
2 34.25
3 34.28
FF 0.5
1 26.7
26.89 2 27.1
3 26.87
FF 1.0
1 27.95
28.56 2 27.83
3 29.89
FF 1.5
1 31.73
31.02 2 30.57
3 30.77
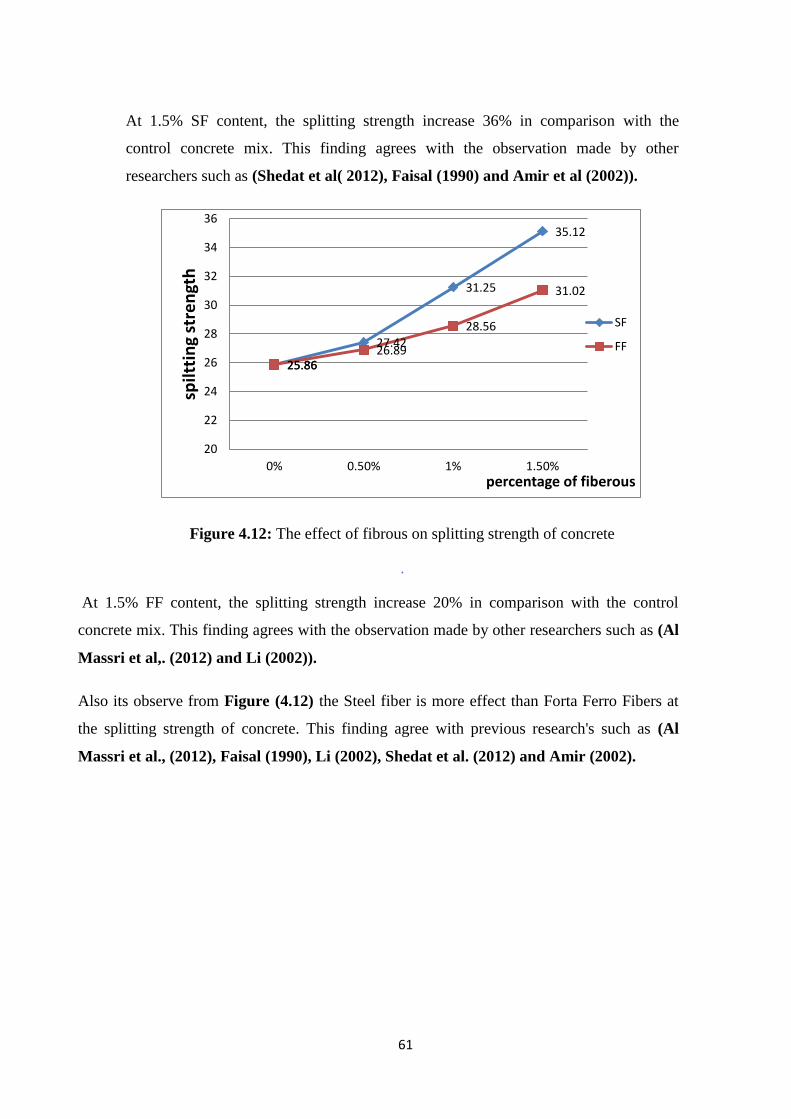
61
At 1.5% SF content, the splitting strength increase 36% in comparison with the
control concrete mix. This finding agrees with the observation made by other
researchers such as (Shedat et al( 2012), Faisal (1990) and Amir et al (2002)).
Figure 4.12: The effect of fibrous on splitting strength of concrete
.
At 1.5% FF content, the splitting strength increase 20% in comparison with the control
concrete mix. This finding agrees with the observation made by other researchers such as (Al
Massri et al,. (2012) and Li (2002)).
Also its observe from Figure (4.12) the Steel fiber is more effect than Forta Ferro Fibers at
the splitting strength of concrete. This finding agree with previous research's such as (Al
Massri et al., (2012), Faisal (1990), Li (2002), Shedat et al. (2012) and Amir (2002).
25.86
27.42
31.25
35.12
25.86 26.89
28.56
31.02
20
22
24
26
28
30
32
34
36
0% 0.50% 1% 1.50%
spilt
tin
g st
ren
gth
percentage of fiberous
SF
FF

62
Chapter (5)
Conclusions and Recommendations
5.1.1 Generals
In addition to the effect of the fibers on the drying shrinkage properties of concrete mixes, the
workability and hardened properties compressive strength and splitting strength were studied.
Two types of fibers steel fibers and polypropylene fibers with different contents were added
to the concrete and compared with the control mix. Based on the limited experimental work
carried out in this study,
5.1.1 Drying Shrinkage of concrete
1- Steel Fibers with 0.5% ,1% and 1.5% (by total volume ) decreases the drying shrinkage
5.5% ,11%and 16.4% respectively. The result show that the drying shrinkage decrease
with increase the SF in Concrete because bond interaction between fibers and cement
base.
2- Forta Ferro Fibers with 0.5%,1% and1.5%(by total volume) decreases the drying
shrinkage 19.2% ,38.31% and 29.8% respectively. The result show that the drying
shrinkage decrease 38.31 % at 1.0% FF dosage because the friction bond between cement
base and FF. However, at 1.5 % drying shrinkage increase from 38.31% to 29.8%.
5.1.2 Fresh properties
1) Increasing Forta Ferro content will slightly decrease the slump value of the reference
concrete , the slump value decrease about 21% ,36% and 46% at 0.5% , 1% and 1.5% at
0.5 w/c ratio.
2) Increasing steel fiber content will slightly decrease the slump value of the reference
concrete , the slump value decrease about 16% ,28 % and35% at 0.5% , 1% and 1.5% at
0.5 w/c ratio , at 1.5% of FF the slump value indicate that the mix are not good workable
(6.5 mm)

63
5.1.3 Hardened properties
Compressive strength of concrete
1) When the steel fibers content increases, the compressive strength increases also.
compressive strength increase at the 28 days by about 3.4%, 6.6% and 13% at steel fiber
content (by the total volume) 0.5%, 1.0% and 1.5 % with respect plain concrete
2) When the Forta Ferro fibers content increases, the compressive strength increases also.
compressive strength increase at the 28 days by about 2.1%, 4.3% and 5.9% at FF fiber
content (by the total volume) 0.5%, 1.0% and 1.5 % with respect plain concrete
Splitting tensile strength of concrete
1- When the steel fibers content increases, the splitting strength increases also. Splitting
strength increase at the 28 days by about 6%, 20.8% and 35.5 % at steel fiber content (by
the total volume) 0.5%, 1.0% and 1.5 % with respect plain concrete
2- When the Forta Ferro fibers content increases, the compressive strength increases also.
Compressive strength increase at the 28 days by about 3.9%, 10.4% and 19.9% at FF fiber
content (by the total volume) 0.5%, 1.0% and 1.5 % with respect plain concrete.
5.2 Recommendations for future research
Having carrying out this study several suggested for further research can be summarized as
follows:
1) The effect of FF and SF on the durability of concrete.
2) The effect of FF and SF on the drying shrinkage properties on UHPC and RPC with
different temperature condition.
3) The effect of FF and SF on the permeability of normal concrete , UHPC and RPC
4) The effect of FF and SF on drying shrinkage of normal concrete , UHPC and RPC at the
site with thermal effect

64
References.
ACI 209R-92"Prediction of creep, shrinkage, and temperature effect in
concrete structures", ACI Manual of Concrete Practice part 1( 2003).
ACI Committee 224 “Causes, Evaluation and Repair of Cracks in Concrete
Structures” (ACI 224.1R-07), Manual of Concrete Practice, Part 2, America
(2007).
ACI Committee 308 Standard Practice for Curing Concrete ACI Manual of
Concrete Practice, Part 2, 2001
ACI Committee 544 " State of the Art Report on Fiber reinforced concrete
(ACI544,1R-961), American concrete Institute,(2002).
ACIFC," An Introduction Guide: Steel fiber reinforced concrete industrial
ground floors", ACIFC, Warwickshire (1999)
Al- Tayyib. A. J , Al- Zahrani M.M , Rasheeduzzafar and Al- Sulaimani G. J,
"effect of polypropylene fiber reinforcement on the properties of fresh and
hardened concrete in Arabian Gulf environment" Cement and concrete
research, Vol. 18 .no.4p.561-570 July 1988
Amir, A., Mirsayah and Banthia, N " shear strength of steel- fiber-reinforced
concrete" ACI Materials Journal, 99 (5), pp.273-279 (2002) .
ASTM C109 “Standard Test Method for Compressive Strength of cube
Concrete Specimens”. American Society for Testing and Materials Standard
Practice C109, Philadelphia, Pennsylvania (2004).
ASTM C127 “Standard Test Method for Specific gravity and absorption of
coarse aggregate”, American Society for Testing and Materials Standard
Practice C127, Philadelphia, Pennsylvania (2004).
ASTM C128 “Standard Test Method for Specific gravity and absorption of
fine aggregate”, American Society for Testing and Materials Standard Practice
C128, Philadelphia, Pennsylvania (2004).
ASTM C143"Standard Test Method for Slump of Hydraulic-Cement
Concrete" American Society for Testing and Materials Standard Practice
C143, Philadelphia, Pennsylvania (2004)

65
ASTM C150 “Standard specifications of Portland cement " American Society
for Testing and Materials Standard Practice C150”, Philadelphia, Pennsylvania
(2004).
ASTM C157"Standard Test Method for Length Change of Hardened
Hydraulic-Cement Mortar and Concrete "”, American Society for Testing and
Materials Standard Practice C157, Philadelphia, Pennsylvania (2004)
ASTM C192 "Standard Practice for Making and Curing Concrete Test
Specimens in the Laboratory" American Society for Testing and Materials
Standard Practice C192, Philadelphia, Pennsylvania (2004)
ASTM C490 " Standard Practice for Use of Apparatus for the Determination
of Length Change of Hardened Cement Paste, Mortar, and Concrete "”,
American Society for Testing and Materials Standard Practice C490 ,
Philadelphia, Pennsylvania (2004).
ASTM C496 “Standard Test Method for Splitting Tensile Strength of
Cylindrical Concrete Specimens”. American Society for Testing and Materials
Standard Practice C496, Philadelphia, Pennsylvania (2004)
ASTM C511 "Standard Specification for Mixing Rooms, Moist Cabinets,
Moist Rooms, and Water Storage Tanks Used in the Testing of Hydraulic
Cements and Concretes" American Society for Testing and Materials Standard
Practice C511”, Philadelphia, Pennsylvania (2004)
ASTM C566. “Standard Test Method for Bulk density (" Unit weight") and
Voids in aggregate”. American Society for Testing and Materials Standard
Practice C566, Philadelphia,Pennsylvania (2004).
ASTM C595, "Standard Specification for Blended Hydraulic Cements"
American Society for Testing and Materials Standard Practice C595 ”,
Philadelphia, Pennsylvania (2004).
ASTM C642 “Standard Test Method for density, absorption, and voids in
hardened concrete”. American Society for Testing and Materials Standard
Practice C642, Philadelphia, Pennsylvania (2004).

66
ASTM C845 " Standard Specification for Expansive Hydraulic Cement"
American Society for Testing and Materials Standard Practice C845”,
Philadelphia, Pennsylvania (2004).
Aulia, T. B “Effects of Polypropylene Fibers on the Properties of High-
Strength Concretes.” Leipzig Annual Civil Engineering Report, n 7, 2002, p.
43-59 , (2002).
Balaguru, P., and Khajuria, A “Properties of Polymeric Fiber Reinforced
Concrete.” Transportation Research Record. No. 1532, Sep. 1996, p. 27-35,
(1996).
BIG B, Hoseinian SB, Beygi MA. "Shrinkage of concrete stored in natural"
(2003)
Brown, M., Sellers, G., Folliard, K., and Fowler, D “Restrained Shrinkage
Cracking of Concrete Bridge Decks: State-of-the-Art Review.” Texas
Department of Transportation – Research and Technology Implementation
Office. June,(2001)
Chern Jenn-Chuan and Young Chin-Huai " Factors Influencing the Drying
Shrinkage of Steel Fiber Reinforced Concrete" International Concrete Portal ,
(2000)
Concrete Society "Concrete industrial floors-A guide to their design and
construction" Technical Report No. 34, The concrete Society, Slough (1994).
Drying Shrinkage of Cement and concrete , Technical Notes Cement &
Concrete association of Australia , lectures Notes (CCAA), july 2002 ,
http/www.concrete.net.au/publication/pdf/DryingShrinkage.pdf
Edgington J., Hannant D.J., Williams R.I.T., Steel fiber reinforced concrete,
Current Paper CP69074, Building Research Establishment, Garston, Watford,
1974, 17 pp.
Faisal .F.F " Properties and Applications of Fiber reinforced concrete" Faculty
of engineering , king Abdulaziz University , Jadda , Saudi Arabia , (1990)
FORTA FERRO Company, http://www.forta- ferro.com
Gilbert RI. Time effect in concrete structure. United States: Elsevier Science
Publishing; (1988).

67
Hasan Ghassan Almassri, Mohammed Arafa and Maemon el khedra 2012"
Ultra High Performance Self Compacting Concrete with Polypropylene Fiber"
Islamic university of Gaza (2012)
Hindy, E., Miao, B., Chaallal, O., and Aitcin, P “Drying Shrinkage of Ready-
Mixed High-Performance Concrete,” ACI Structural Journal, Vol. 91, No. 3,
May-Jun., pp. 300-305. (1994).
Holt, E. and Leivo, M “Cracking Risks Associated with Early Age Shrinkage,”
Cement and Concrete Research, Vol. 26, No. 5, July, pp. 521-530, (2004)..
Kao, J. T "Investigation into the Use of Portland Cement Concrete with Fiber
Additives for Bridge Decks in the State of Oklahoma". University of
Oklahoma Press, Norman, Oklahoma (2005).
Knapton, J. "Ground bearing concrete slabs" Thomas Telford, London(2003)
Li, V“Large Volume, High-Performance Applications of Fibers in Shrinkage,”
Cement and Concrete Research, Vol. 26, No. 5, July, pp. 521-530 , (2002).
Lindquist, W., Darwin, D., Browning, J “Cracking and Chloride Contents in
Reinforced Concrete Bridge Decks,” SM Report No. 78, University of Kansas
Center for Research, Inc., Lawrence, Kansas, 453 pp., (2005)..
Litivin. A "Report to wire Reinforcement Institute on properties of concrete
containing polypropylene Fibers " Construction Technology Laboratories ,
Portland Cement association, 1985.
Mindess, S., Young, J. F., and Darwin, D "Concrete", 2nd ed., Prentice-Hall,
Inc., Englewood Cliffs, New Jersey, 644 pp. Concrete Institute, Farmington
Hills, MI, 22 pp (2003).
Neville, A. M and brooks J.J." Concrete Technology ", 2sc ed., John Wiley
and Sons, Inc., New York, NY, 844 pp (2010)..
Ramakrishnan, V " Materials and properties of fiber reinforced concrete,"
Civil Engineering, April, pp. 29-40, London (1988).
Ramseyer Chris (2006) "FIBER-REINFORCED CONCRETE AND BRIDGE
DECK CRACKING" Civil Engineering.”Journal of Applied Polymer Science,
v 83, 2002,p.660-686.

68
Rao. G. A “Long-term Drying Shrinkage of Mortar-Influence of Silica Fume
and Size of Fine Aggregate,” Cement and Concrete Research, Vol. 31, No. 2,
Feb.,pp.171-175 (2001).
Ribeiro MG, Fiho RP. Risk assessment of chemicals in foundries: the
international chemical toolkit pilot-project. J Hazard Mater 2006;136(3): 432–
7(2006).
Roper, H, Shrinkage Tensile Creep and Cracking Tendency of Concretes
Australian Road Research, Vol. 5, No. 6, December 1974, pp 26–35.
Roper, H, The Properties of Concrete Manufactured with Coarse Aggregate of
the Sydney Area university of Sydney, research report r204, January, 1973.
Shende1 A.M, Pande A.M, Gulfam Pathan M "Experimental Study on Steel
Fiber Reinforced Concrete for M-40 Grade" International Refereed Journal of
Engineering and Science (IRJES) ISSN (Online) 2319-183X, (Print) 2319-
1821 Volume 1, Issue 1 (September 2012), PP. 043-048 www.irjes.com
Shihada, S “Investigating the Use of Recycled Plastics as Shrinkage
Reinforcement in Non-Structural Concrete Slabs”, Islamic University, Gaza,
college of engineering, Research Center (2010).
Siddique, R., Khatib, J. and Kaur, I. “Use of recycled plastic in concrete”.
Waste Management (28), PP.835-1852 (2007).
Soroka, I, Portland Cement Paste and Concrete Macmillan Press ltd, (1979).
Victor Y. Garas, Lawrence F. Kahn, Kimberly E. Kurtis " Short-term tensile
creep and shrinkage of ultra-high performance concrete" January(2009)
Wong ACL, Childs PA, Berndt R, Macken T, Peng GD, Gowripalan N.
"Simultaneous measurement of shrinkage and temperature of reactive powder
concrete at early-age using fiber Bragg grating sensors". Cement Concrete
Compos (2007)
Zhang, J., and Li, V “Influences of Fibers on Drying Shrinkage of Fiber-
Reinforced Cementations Composite.” Journal of Engineering Mechanics, v
127, n 1, Jan (2001).
Zollo .R.F " Collated Fibrillated Polypropylene fibers in FRC" ACI Journaly ,
Vol. 81,pp 397-410,1 November (1984)