Islamic University of Gaza Electrical Engineering Department.


The Islamic University Gaza
Graduate Deanery
Faculty of Engineering
Civil Engineering Department
Engineering Project Management
" في قطاع غزةالتشييد صناعة في العروض استدراج إدارةالعوامل التي تؤثر على "
Factors Affecting the Selection of Procurement System in the
Construction Industry in Gaza Strip
Submitted by:
Eng. Qosai Abdalhakim El-Ghefari
Supervised by:
Dr. Khalid A. Al Hallaq
A Thesis Submitted in Partial Fulfillment of Requirements for the Degree of
Master in Civil Engineering/ Construction Management
Gaza, Palestine
October, 2015


شاء وفوق { ن ن نرفع درجات م
ل علليم ي عل ذل }كل
76سورة يوسف :
“All things are difficult before
they are easy”
Thomas Fuller (1608 -1661)

I
Dedication
Firstly, this research is lovingly dedicated to my beloved
Father and my beloved Mother whose words of support and
push for tenacity ring in my ears.
And without doubt, I dedicate this thesis to my beloved wife
for here generous encouragement that I will never forget.
A special feeling to my daughters Naya and Lelya who were
missing my direct care during my study.
To all my brothers, sisters, colleagues and friends for their
endless support.
Qosai A. El-Ghefari
October,2015
II
Acknowledgment
All glory and thanks goes to Almighty, Allah who bestowed me the
awareness, perseverance, mercy and help to make this accomplishment
possible.
I would like to express my sincere appreciation and admiration to my
direct supervisor Dr. Khalid Al-Hallaq for his steady guidance, help
and relentless support.
Wholeheartedly, I am very indebted to Construction Management
Staff at the Islamic University of Gaza.
Special thanks for each of statistician: Mr. Rabea Awad for his help in
the statistical arbitration of the questionnaire and their support in the
statistical analysis. In the same context, I want to thank Eng. Mahdi
Mahdi for his great help.
Finally, a special thanks goes to whom I belong to.
Thank you,
Qosai A. El-Ghefari
III
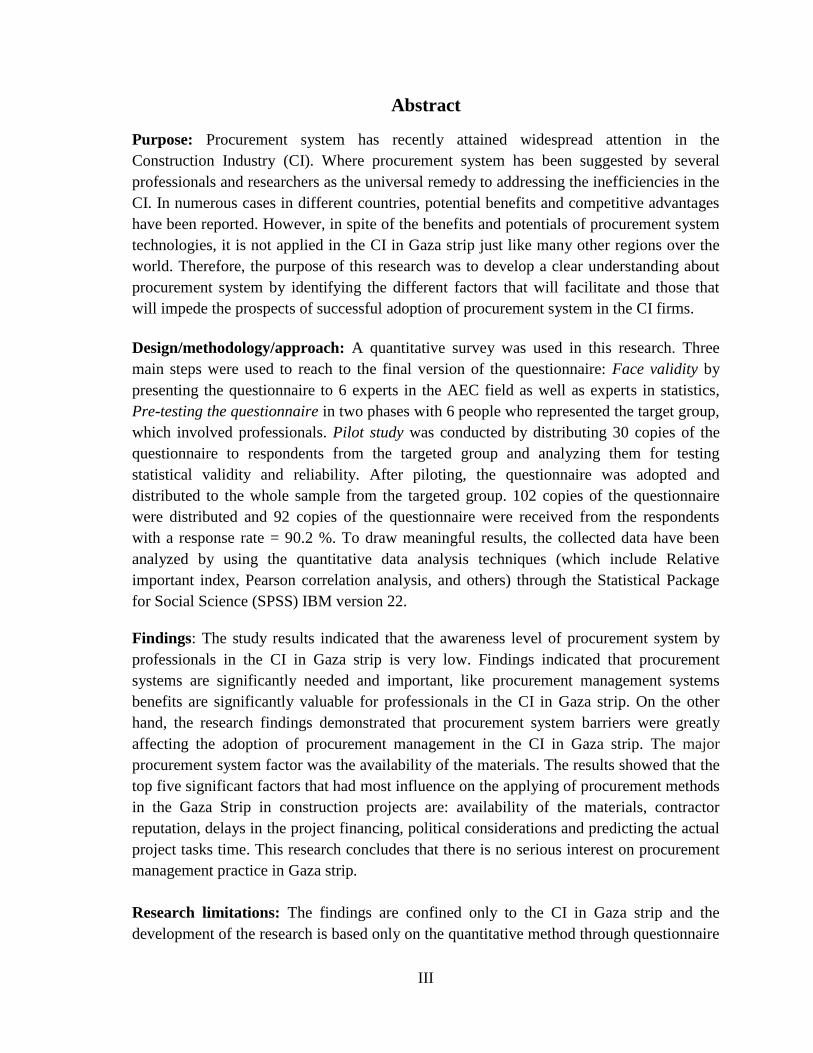
Abstract
Purpose: Procurement system has recently attained widespread attention in the
Construction Industry (CI). Where procurement system has been suggested by several
professionals and researchers as the universal remedy to addressing the inefficiencies in the
CI. In numerous cases in different countries, potential benefits and competitive advantages
have been reported. However, in spite of the benefits and potentials of procurement system
technologies, it is not applied in the CI in Gaza strip just like many other regions over the
world. Therefore, the purpose of this research was to develop a clear understanding about
procurement system by identifying the different factors that will facilitate and those that
will impede the prospects of successful adoption of procurement system in the CI firms.
Design/methodology/approach: A quantitative survey was used in this research. Three
main steps were used to reach to the final version of the questionnaire: Face validity by
presenting the questionnaire to 6 experts in the AEC field as well as experts in statistics,
Pre-testing the questionnaire in two phases with 6 people who represented the target group,
which involved professionals. Pilot study was conducted by distributing 30 copies of the
questionnaire to respondents from the targeted group and analyzing them for testing
statistical validity and reliability. After piloting, the questionnaire was adopted and
distributed to the whole sample from the targeted group. 102 copies of the questionnaire
were distributed and 92 copies of the questionnaire were received from the respondents
with a response rate = 90.2 %. To draw meaningful results, the collected data have been
analyzed by using the quantitative data analysis techniques (which include Relative
important index, Pearson correlation analysis, and others) through the Statistical Package
for Social Science (SPSS) IBM version 22.
Findings: The study results indicated that the awareness level of procurement system by
professionals in the CI in Gaza strip is very low. Findings indicated that procurement
systems are significantly needed and important, like procurement management systems
benefits are significantly valuable for professionals in the CI in Gaza strip. On the other
hand, the research findings demonstrated that procurement system barriers were greatly
affecting the adoption of procurement management in the CI in Gaza strip. The major
procurement system factor was the availability of the materials. The results showed that the
top five significant factors that had most influence on the applying of procurement methods
in the Gaza Strip in construction projects are: availability of the materials, contractor
reputation, delays in the project financing, political considerations and predicting the actual
project tasks time. This research concludes that there is no serious interest on procurement
management practice in Gaza strip.
Research limitations: The findings are confined only to the CI in Gaza strip and the
development of the research is based only on the quantitative method through questionnaire
IV
survey. Also, the previous studies related to procurement management in Gaza strip is not
widespread.
Practical implications: Procurement system awareness and interest need to be increased
through comprehensive education and training programs. Awareness of construction firms
about procurement systems should be enhanced by increasing the role of academic
institutions and universities. Cooperation between construction firms and consultants/
construction managers during the procurement phase should be developed to minimize
problems and enhance knowledge.
Keywords: Construction Industry (CI), Procurement Systems, Procurement Management,
Gaza Strip, Palestine.

V
ملخص البحث
واسع النطاق من قبل التشييد اهتماما صناعة في (PM)العروض استدراج اكتسب نظامالغرض:
نظامم اقتراح ضرورة االهتمام في حيث ت (CI).العديد من المهنيين والباحثين في صناعة االنشاءات
عديد من الحاالت حيث انه في ال (CI).نشاءات إلوض لعالج أوجه القصور في صناعة ااستدراج العر
على الرغم من العروض. جاستدرا نظام وفوائد ومميزات االهتمام فيالمختلفة تم االنتباه الى اهمية
في قطاع االنشاءات ال يتم بشكل متكامل كما يتم استدراج العروض إال ان تطبيقه لنظام هذه االهمية
في الدول المتقدمة.
استدراج العروض في نظامث هو تطوير فهم واضح لالبح كان الغرض من هذا ،وبناء على ذلك
العوامل التي من شأنها تسهيل تطبيق هذه االدارة في شركات دراسةالمشاريع االنشائية عن طريق
ومؤسسات البناء.
تم اختيار البحث الكمي وذلك باستخدام االستبانة التي تم تصميمها باالستناد على :منهجية البحث
، وقد تم استخدام ثالث خطوات رئيسية للوصول الى الشكل االخير من االستبانة .الدراسات السابقة
خبراء في مجال صناعة 6اختبار الصالحية من خالل تقديم االستبانة الى والتي كانت كالتالي:
من 6اختبار االستبانة على مرحلتين مع وقد تم .في مجال االحصاء الى خبراء باإلضافةاالنشاءات
طريق وقد اجريت دراسة تجريبية عن، في هذا البحث ممن يمثلون الفئة المستهدفة القةذوي الع
باإلضافةاختبار الصالحية االحصائي إلجراءمن االستبانة للفئة المستهدفة ةنسخ 30توزيع وتحليل
من العينة انة وتوزيعها على كاملالى اختبار الثبات. وبعد نجاح الدراسة التجريبية، تم اعتماد االستب
استبانة لتكون بذلك نسبة 92تم جمع عدد استبانة في حين 102. حيث تم توزيع عدد الفئة المستهدفة
. وبعد ذلك تم تحليل البيانات كميا الستنباط نتائج ذات مغزى باستخدام برنامج %90.2= االستجابة
SPSS اصدار (IBM 22 .)
في صناعة استدراج العروضنظام اهتمام المختصين بن مستوى أ أشارت نتائج الدراسة النتائج:
تطبيق إدارة ل هميةمدى الحاجة واألاالنشاءات منخفض في قطاع غزة، في حين اظهرت الدراسة
من ناحية أخرى أظهرت نتائج الدراسة وجود عراقيل استدراج العروض في صناعة االنشاءات.
أوضحت الدراسة أن و .ل الجهات المختصةمن قب استدراج العروض نظام بشكل كبير في تطبيق
عة ا: توفر المواد االساسية في صناستدراج العروض هينظام على تطبيق أكثر خمس عوامل تؤثر
والمؤثرات السياسية، والزمن الفعلي لتنفيذ والتأخير في تمويل المشروع وسمعة المقاول، اإلنشاءات
نظام جدية من قبل صناع القرار في تطبيق وجود عدمالمشروع. في حين انه كان من الواضح بنود
استدراج العروض في المشاريع االنشائية في قطاع غزة.
كما أن العينة ،اقتصرت نتائج هذا البحث فقط على صناعة االنشاءات في قطاع غزة قيود البحث:
ملون في مجاالت شملت المهندسين المدنيين المسجلين في نقابة المهندسين في قطاع غزة والذين يع

VI
هذا ، وقد اعتمدوفي مجاالت أخرى مختلفة ومدراء المشاريعتب امكالالتصميم واإلشراف ومهندسي
االستبانة. البحث على الطريقة الكمية من خالل
استدراج نظام نتائج هذا البحث تبين ان هناك ضرورة ملحة لزيادة االهتمام بموضوع االثار العملية:
المختلفة باإلضافة الى ذلك يجب على الهيئات بالتدريعليم وتلبرامج شمولية لمن خالل العروض
ن تقوم بدورها في ابراز ة كالجامعات بشكل عام أتخصصممراكز الالونقابة المهندسين وبشكل عام
اإلنشائية، كما يجب أن يتم التعاون بين شركات في المشاريع ادارة استدراج العروض اهمية
ستشاريين/ مدراء االنشاء خالل مرحلة استدراج العروض لتعزيز المعرفة وتقليل المقاوالت واال
.األخطاء خالل هذه المرحلة
نظام استدراج العروض، ادارة استدراج العروض، قطاع غزة، فلسطين. الكلمات المفتاحية:
VII
Table of contents
Dedication .................................................................................................................................................... I
Acknowledgment ........................................................................................................................................ II
Abstract ..................................................................................................................................................... III
البحث ملخص .................................................................................................................................................... V
Table of contents ..................................................................................................................................... VII
List of abbreviations .................................................................................................................................. X
List of Tables ............................................................................................................................................ XI
List of Figures .......................................................................................................................................... XII
Chapter 1: Introduction ............................................................................................................................. 1
1.1 Background ................................................................................................................................... 1
1.2 Importance of the research ............................................................................................................ 2
1.3 Research Aim ................................................................................................................................ 2
1.4 Research objectives ....................................................................................................................... 2
1.5 Statement of the problem .............................................................................................................. 3
1.6 Research limitations ...................................................................................................................... 3
1.7 Thesis structure ............................................................................................................................. 3
Chapter 2: Background and Literature Review....................................................................................... 6
2.1 Introduction and definitions .......................................................................................................... 6
2.2 A Brief historical background ....................................................................................................... 7
2.3 Procurement Systems .................................................................................................................... 7
2.4 Selection of Procurement Method ............................................................................................... 11
2.5 Needs for different procurement methods ................................................................................... 21
2.6 Local Studies ............................................................................................................................... 22
2.7 Chapter Summary ....................................................................................................................... 24
Chapter 3: Methodology ........................................................................................................................... 30
3.1 Introduction ..................................................................................................................................... 30
3.2 Research strategy ............................................................................................................................ 30
3.3 Research design ............................................................................................................................... 30
3.4 Data Collection Methodology: ........................................................................................................ 33
3.5 Population: ...................................................................................................................................... 34
VIII
3.6 Sample size ..................................................................................................................................... 34
3.7 Data collection ................................................................................................................................ 35
3.8 Research location ............................................................................................................................ 35
3.9 Research limitation.......................................................................................................................... 35
3.10 Face validity .................................................................................................................................... 35
3.11 Questionnaire content...................................................................................................................... 35
3.12 Data measurement ........................................................................................................................... 36
3.13 Pre-testing the questionnaire ........................................................................................................... 37
3.14 Pilot Study ....................................................................................................................................... 37
3.15 Validity of the Research .................................................................................................................. 37
3.16 Reliability of the Research .............................................................................................................. 42
3.17 Final amendment to the questionnaire ............................................................................................ 44
3.18 Questionnaire distribution and collection ....................................................................................... 44
3.19 Measurements ................................................................................................................................. 44
3.20 Summary ......................................................................................................................................... 47
Chapter 4: Results and discussion ........................................................................................................... 53
4.1 Introduction ..................................................................................................................................... 53
4.2 Organizational profiles .................................................................................................................... 53
4.2.1 Organization Age: ........................................................................................................................... 53
4.2.2 Organization size ............................................................................................................................ 54
4.2.3 Company field of work ................................................................................................................... 54
4.2.4 Organization size ............................................................................................................................ 54
4.2.5 Size of the construction projects done for the last three years ........................................................ 55
4.3 General information about respondents .......................................................................................... 55
4.3.1 Gender ............................................................................................................................................. 55
4.3.2 Specialization .................................................................................................................................. 56
4.3.3 Highest earned degree ..................................................................................................................... 56
4.3.4 Age .................................................................................................................................................. 56
4.3.5 Years of experience ......................................................................................................................... 57
4.3.6 Work position .................................................................................................................................. 57
4.4 Means, Ranks and Relative importance Index (RII) ...................................................................... 57
4.4.1 Relative importance Index (RII). ................................................................................................... 58
4.4.1.1 Factors related to cost...................................................................................................................... 58
4.4.1.2 Factors related to the project duration ............................................................................................. 59
4.4.1.3 Factors related to the quality ........................................................................................................... 60
IX
4.4.1.4 Project Characteristics ..................................................................................................................... 62
4.4.1.5 External Environment ..................................................................................................................... 63
4.5 One sample t test ............................................................................................................................. 65
4.6 One way ANOVA test .................................................................................................................... 65
4.6.1 Difference of responses due to the gender ...................................................................................... 65
4.6.2 Difference of responses due to the specialization ........................................................................... 66
4.6.3 Difference of responses due to the educational qualification .......................................................... 67
4.6.4 Difference of responses due to the age of the respondents ............................................................. 67
4.6.5 Difference of responses due to the Years of experience of the respondents ................................... 68
4.6.6 Difference of responses due to the work position of the respondents ............................................. 69
4.7 Top ten factors affecting on selection of procurement system in constructions industry over
the procedures and policies in Supply Management ................................................................................... 70
Chapter 5: Conclusion and recommendations ....................................................................................... 73
5.1 Introduction ..................................................................................................................................... 73
5.2 Conclusion ...................................................................................................................................... 73
5.3 Recommendations ........................................................................................................................... 74
References .................................................................................................................................................. 76
Appendix A : Questionnaire (English) .................................................................................................... 81
Appendix B : Questionnaire (Arabic) ..................................................................................................... 87
X
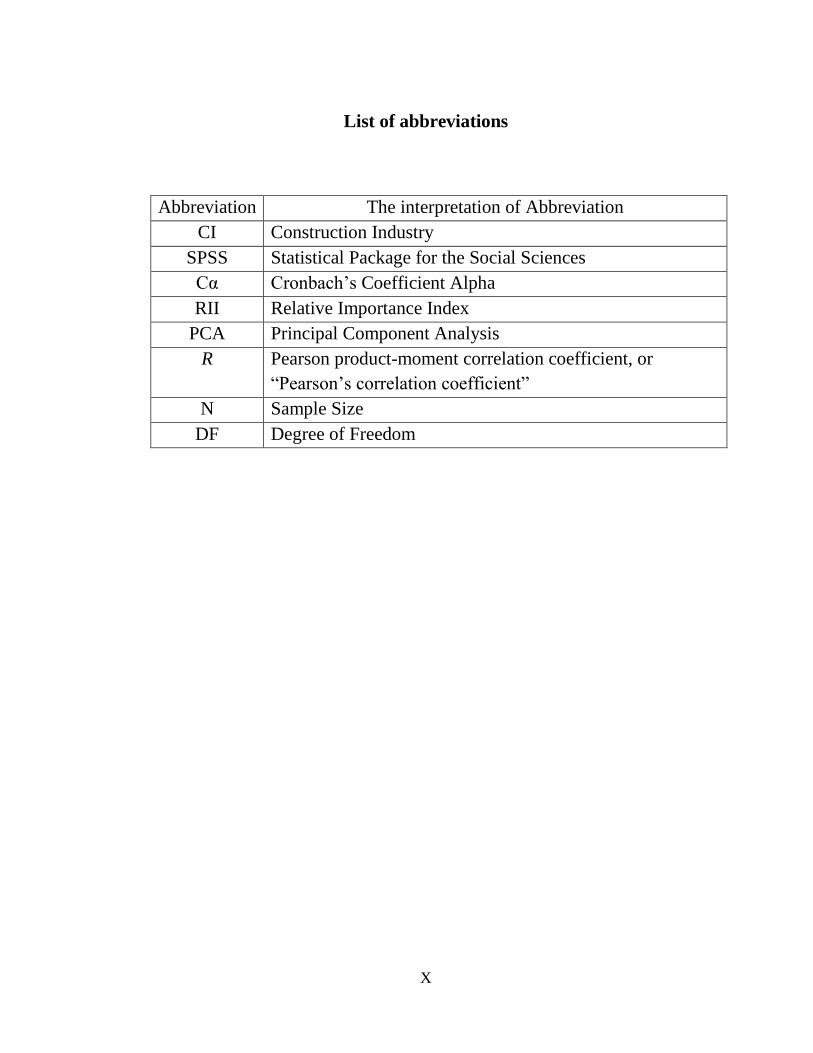
List of abbreviations
Abbreviation The interpretation of Abbreviation
CI Construction Industry
SPSS Statistical Package for the Social Sciences
Cα Cronbach’s Coefficient Alpha
RII Relative Importance Index
PCA Principal Component Analysis
R Pearson product-moment correlation coefficient, or
“Pearson’s correlation coefficient”
N Sample Size
DF Degree of Freedom
XI
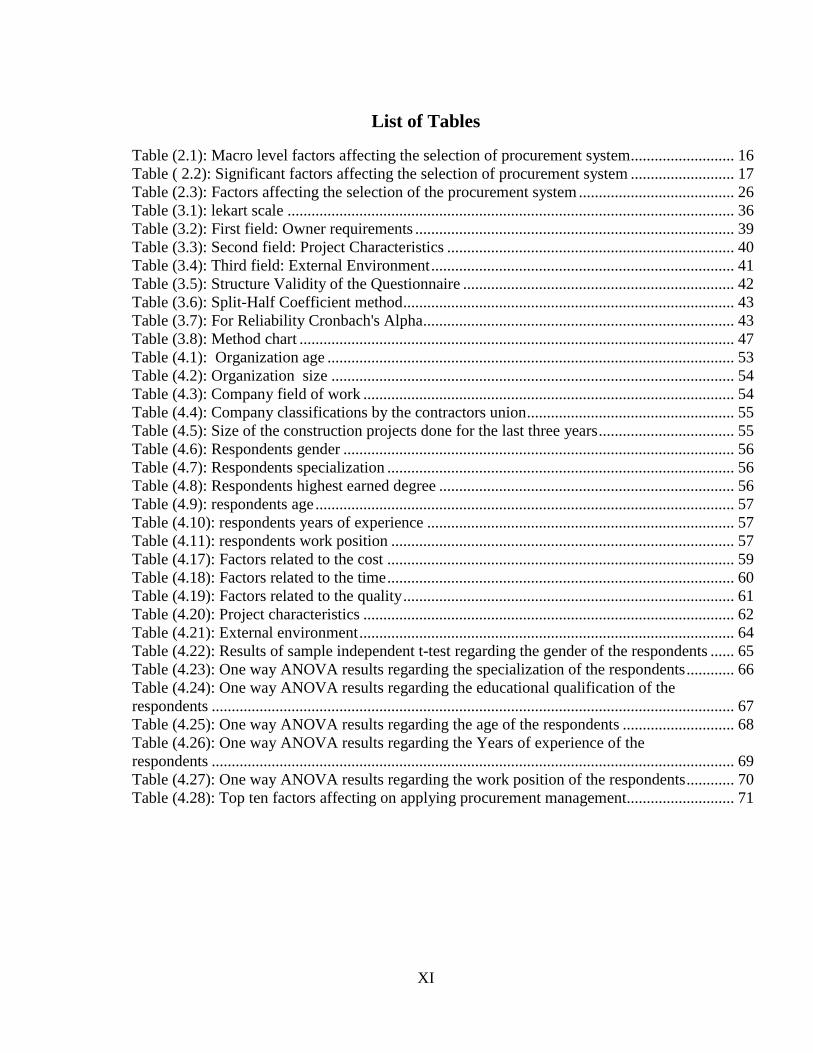
List of Tables
Table (2.1): Macro level factors affecting the selection of procurement system.......................... 16
Table ( 2.2): Significant factors affecting the selection of procurement system .......................... 17
Table (2.3): Factors affecting the selection of the procurement system ....................................... 26
Table (3.1): lekart scale ................................................................................................................ 36
Table (3.2): First field: Owner requirements ................................................................................ 39
Table (3.3): Second field: Project Characteristics ........................................................................ 40
Table (3.4): Third field: External Environment ............................................................................ 41
Table (3.5): Structure Validity of the Questionnaire .................................................................... 42
Table (3.6): Split-Half Coefficient method ................................................................................... 43
Table (3.7): For Reliability Cronbach's Alpha.............................................................................. 43
Table (3.8): Method chart ............................................................................................................. 47
Table (4.1): Organization age ...................................................................................................... 53
Table (4.2): Organization size ..................................................................................................... 54
Table (4.3): Company field of work ............................................................................................. 54
Table (4.4): Company classifications by the contractors union .................................................... 55
Table (4.5): Size of the construction projects done for the last three years .................................. 55
Table (4.6): Respondents gender .................................................................................................. 56
Table (4.7): Respondents specialization ....................................................................................... 56
Table (4.8): Respondents highest earned degree .......................................................................... 56
Table (4.9): respondents age ......................................................................................................... 57
Table (4.10): respondents years of experience ............................................................................. 57
Table (4.11): respondents work position ...................................................................................... 57
Table (4.17): Factors related to the cost ....................................................................................... 59
Table (4.18): Factors related to the time ....................................................................................... 60
Table (4.19): Factors related to the quality ................................................................................... 61
Table (4.20): Project characteristics ............................................................................................. 62
Table (4.21): External environment .............................................................................................. 64
Table (4.22): Results of sample independent t-test regarding the gender of the respondents ...... 65
Table (4.23): One way ANOVA results regarding the specialization of the respondents ............ 66
Table (4.24): One way ANOVA results regarding the educational qualification of the
respondents ................................................................................................................................... 67
Table (4.25): One way ANOVA results regarding the age of the respondents ............................ 68
Table (4.26): One way ANOVA results regarding the Years of experience of the
respondents ................................................................................................................................... 69
Table (4.27): One way ANOVA results regarding the work position of the respondents ............ 70
Table (4.28): Top ten factors affecting on applying procurement management........................... 71

XII
List of Figures
Figure 1( 2.1): Categorization of Procurement Arrangements…………….………...………8
Figure 2(3.1): Methodology flowchart…..……………………………..…………………..33

XIII
Chapter 1
1
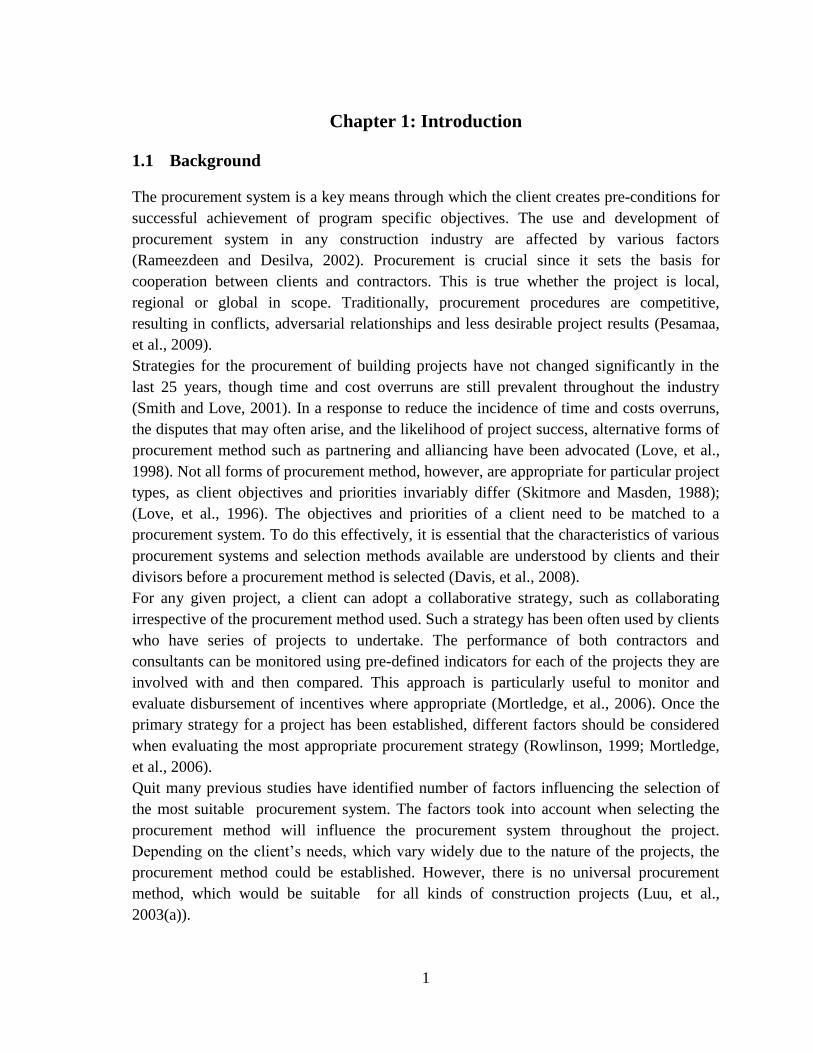
Chapter 1: Introduction
1.1 Background
The procurement system is a key means through which the client creates pre-conditions for
successful achievement of program specific objectives. The use and development of
procurement system in any construction industry are affected by various factors
(Rameezdeen and Desilva, 2002). Procurement is crucial since it sets the basis for
cooperation between clients and contractors. This is true whether the project is local,
regional or global in scope. Traditionally, procurement procedures are competitive,
resulting in conflicts, adversarial relationships and less desirable project results (Pesamaa,
et al., 2009).
Strategies for the procurement of building projects have not changed significantly in the
last 25 years, though time and cost overruns are still prevalent throughout the industry
(Smith and Love, 2001). In a response to reduce the incidence of time and costs overruns,
the disputes that may often arise, and the likelihood of project success, alternative forms of
procurement method such as partnering and alliancing have been advocated (Love, et al.,
1998). Not all forms of procurement method, however, are appropriate for particular project
types, as client objectives and priorities invariably differ (Skitmore and Masden, 1988);
(Love, et al., 1996). The objectives and priorities of a client need to be matched to a
procurement system. To do this effectively, it is essential that the characteristics of various
procurement systems and selection methods available are understood by clients and their
divisors before a procurement method is selected (Davis, et al., 2008).
For any given project, a client can adopt a collaborative strategy, such as collaborating
irrespective of the procurement method used. Such a strategy has been often used by clients
who have series of projects to undertake. The performance of both contractors and
consultants can be monitored using pre-defined indicators for each of the projects they are
involved with and then compared. This approach is particularly useful to monitor and
evaluate disbursement of incentives where appropriate (Mortledge, et al., 2006). Once the
primary strategy for a project has been established, different factors should be considered
when evaluating the most appropriate procurement strategy (Rowlinson, 1999; Mortledge,
et al., 2006).
Quit many previous studies have identified number of factors influencing the selection of
the most suitable procurement system. The factors took into account when selecting the
procurement method will influence the procurement system throughout the project.
Depending on the client’s needs, which vary widely due to the nature of the projects, the
procurement method could be established. However, there is no universal procurement
method, which would be suitable for all kinds of construction projects (Luu, et al.,
2003(a)).
2
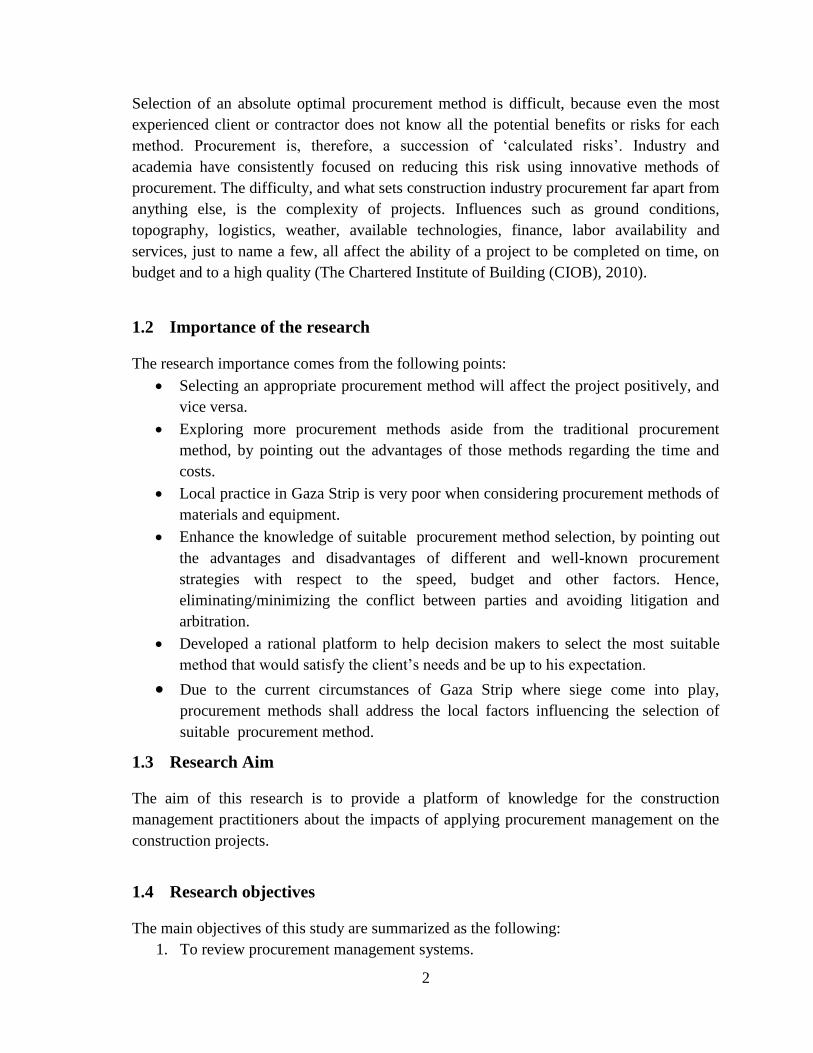
Selection of an absolute optimal procurement method is difficult, because even the most
experienced client or contractor does not know all the potential benefits or risks for each
method. Procurement is, therefore, a succession of ‘calculated risks’. Industry and
academia have consistently focused on reducing this risk using innovative methods of
procurement. The difficulty, and what sets construction industry procurement far apart from
anything else, is the complexity of projects. Influences such as ground conditions,
topography, logistics, weather, available technologies, finance, labor availability and
services, just to name a few, all affect the ability of a project to be completed on time, on
budget and to a high quality (The Chartered Institute of Building (CIOB), 2010).
1.2 Importance of the research
The research importance comes from the following points:
Selecting an appropriate procurement method will affect the project positively, and
vice versa.
Exploring more procurement methods aside from the traditional procurement
method, by pointing out the advantages of those methods regarding the time and
costs.
Local practice in Gaza Strip is very poor when considering procurement methods of
materials and equipment.
Enhance the knowledge of suitable procurement method selection, by pointing out
the advantages and disadvantages of different and well-known procurement
strategies with respect to the speed, budget and other factors. Hence,
eliminating/minimizing the conflict between parties and avoiding litigation and
arbitration.
Developed a rational platform to help decision makers to select the most suitable
method that would satisfy the client’s needs and be up to his expectation.
Due to the current circumstances of Gaza Strip where siege come into play,
procurement methods shall address the local factors influencing the selection of
suitable procurement method.
1.3 Research Aim
The aim of this research is to provide a platform of knowledge for the construction
management practitioners about the impacts of applying procurement management on the
construction projects.
1.4 Research objectives
The main objectives of this study are summarized as the following:
1. To review procurement management systems.
3
2. To assess the impacts of procurement management systems on the construction
projects.
3. To compile a list of the different factors affecting the selection of procurement
management systems and determine the most important factors.
4. To identify the most common factors affecting on the procurement system in Gaza
strip.
1.5 Statement of the problem
While the procurement process is the keystone of the construction project, whether it is
labor, material, equipment or consultant procurement, it is imperative to develop a rational
and systematic approach regarding the selection of the most suitable procurement method.
Inappropriate procurement method would yield unsatisfactory results in terms of time, cost
and quality from the client’s perspective. Moreover, it would lead to disputes and
allegations between parties.
To overcome the problems arising from implementing unsuitable procurement method, the
factors supporting the decision-making concerning the selection criteria will be identified,
evaluated and examined in terms of their effects to the procurement systems practice.
1.6 Research limitations
This thesis is restricted by the following limitations:
This research will take into account the locally conventional widely used
procurement methods for construction work only. Any uncommon rarely used
methods will be neglected, for practical purposes,
For the sake of generality and getting a wide point of view, the research will take
into account the opinion of two work-related parties beside the clients, i.e.,
procurement experts and contractors. However, for practical reasons, stakeholders,
shareholders, regulators and any other parties will not be involved,
Civil engineers who has a valid registration in the Engineering Association will be
involved in this study. Revoked consultants will not be included, and;
Collected data throughout this research will cover the last ten years, only.
1.7 Thesis structure
This research consists of six main chapters as followings
Chapter one: Introduction: this chapter shows the main objectives of research,
statement of the problem and limitations of research;
4
Chapter two: Literature review: this chapter shows a historical review from
previous studied to identify the main factors influencing the selection of
procurement system in construction projects;
Chapter three: Methodology: this chapter shows the main methodologies used in
previous studies and the methodology used in this research in order to achieve the
required objectives;
Chapter four: Results analysis: this chapter shows analysis, description and
discussion of research results;
Chapter five: Developing a framework: this chapter shows data collection, data
analysis, verification and framework design.
Chapter six: Conclusion and recommendations.
Appendix.

5
Chapter 2
6
Chapter 2: Background and Literature Review
2.1 Introduction and definitions
Since “Procurement Method” is the keystone for the construction projects, and choosing a
suitable procurement method would result in a good success of the project plan, it is vital
to start some of the definitions of the procurement system, listing both advantages and
disadvantages, and pointing out the places and projects where certain methods are more
favorable than the others.
(Weele, 2010) Defined “Procurement” as a broad term to be “the acquisition of goods,
services or works from an external source. It is favorable that the goods, services or works
are appropriate and that they are procured at the best possible cost to meet the needs of the
acquirer in terms of quality and quantity, time, and location.”. Procurement strategy is the
outcome of a series of decisions, which are made during the early stages of a project, and it
is one of the most important decisions facing the project client (Odhigu, et al., 2005). A
successful procurement system is one, which leads to a completed project, which meets the
client’s objectives. In addition, the selection and use of an appropriate procurement system
contributes significantly to the success of a construction project (Mortledge, et al., 2006).
While (Masterman, 1992) defined it as an organizational structure adopted by the client for
the implementation and at times eventual operation of a project. Meanwhile, according to
(Rameezdeen, et al., 2006), procurement is a key means through which the clients create
the pre-conditions for the successful achievement of project-specific objectives. For (Love,
et al., 1998), the procurement method is an organizational system that assigns specific
responsibilities and authorities to people and organizations, and defined the relationship of
the various elements in the construction industry.
Whereas, (Walker and Rowlinson, 2008) defined procurement system as the acquisition of
project resources for the realization of a constructed facility. According to (Love, et al.,
1998), A procurement system (or sometimes known as delivery system) is “an
organizational system that assigns specific responsibilities and authorities to people and
organizations, and defines the various elements in the construction of a project.
Some of the terms in the construction industry are considered synonymous with
procurement systems include terms such as project approach, procurement delivery
methods, project delivery systems and contractual arrangements. Therefore, for the purpose
of this study, the term procurement system has been adopted as a contemporary term to
refer to all the terms synonymous with it.
According to (Leadra, et al., 2006), the procurement systems (routes) deliver the
procurement strategy or what the author can refer to as the procurement process, which
according to the author is a key factor in determining the success or failure of any particular
project. (Leadra, et al., 2006) Highlight the fact that even though terminologies used in the
description of procurement systems differ from one country to the other, the recommended
7
practice for selection of the procurement systems is almost the same across country
boundaries.
For (Samarasinghe, et al., 2012) purchasing is “a fundamental function of material
procurement that refers to the acquisition of goods and services and an establishment of
mutually acceptable terms and conditions between a seller and a buyer”.
2.2 A Brief historical background
Until the technological developments of the past 20 years, conventional ideology regarded
procurement as the practice-based administrative process of buying the goods and services
required to satisfy the functional needs of managers. Rules, regulations, procedures and
protocols were typical of the process. Procurement staff stood as financial and operating
sentinels between the managers and their material requirements, centralizing the supply
task and creating management control over expenditure. Procurement was both a powerful
and sometimes hated position with its virtual monopoly over acquisition (CIPS Australia,
2007).
Some researchers suggested that the modern evolution of procurement is characterized by
the principal business and government requirements of the time. For example, (Monzcka, et
al., 2002) suggested that the evolution of procurement can be traced through a number of
stages: emergence around the mid-nineteenth, through a period of recognition before World
War II, rapid increase in sophistication in procurement during that War, followed by a
period of quiet gestation. However, in the last 35 years, the profession had moved into a
period of major reform in materials management and faced the challenges of globalization,
technological change and the emergence of supply chain management.
In the last decade, there was continues growth in the construction industry accompanied
with development in the procurement systems. With the large-scale projects, a remarkable
implementation of more advance and sophisticated procurement methods was observed,
with more implementing of the “Design and Construct” method. This could be attributed to
the need of a fast and fixable construction process. (Larmour, 2011) Stated that this decade
also saw a shift in the procurement method for public sector projects. The increased use of
private finance to fund public projects, and a desire to meet the collaborating.
2.3 Procurement Systems
As shown in Figure (2.1), Procurement systems can be categorized into two main
categories, i.e., the traditional procurement system and the nontraditional procurement
system. The traditional procurement has three contracting arrangements, i.e. lump sum,
measure and pay and the prime cost. While the nontraditional procurement system has three
major subcategory contracting arrangements, i.e. integrated, management oriented and
8
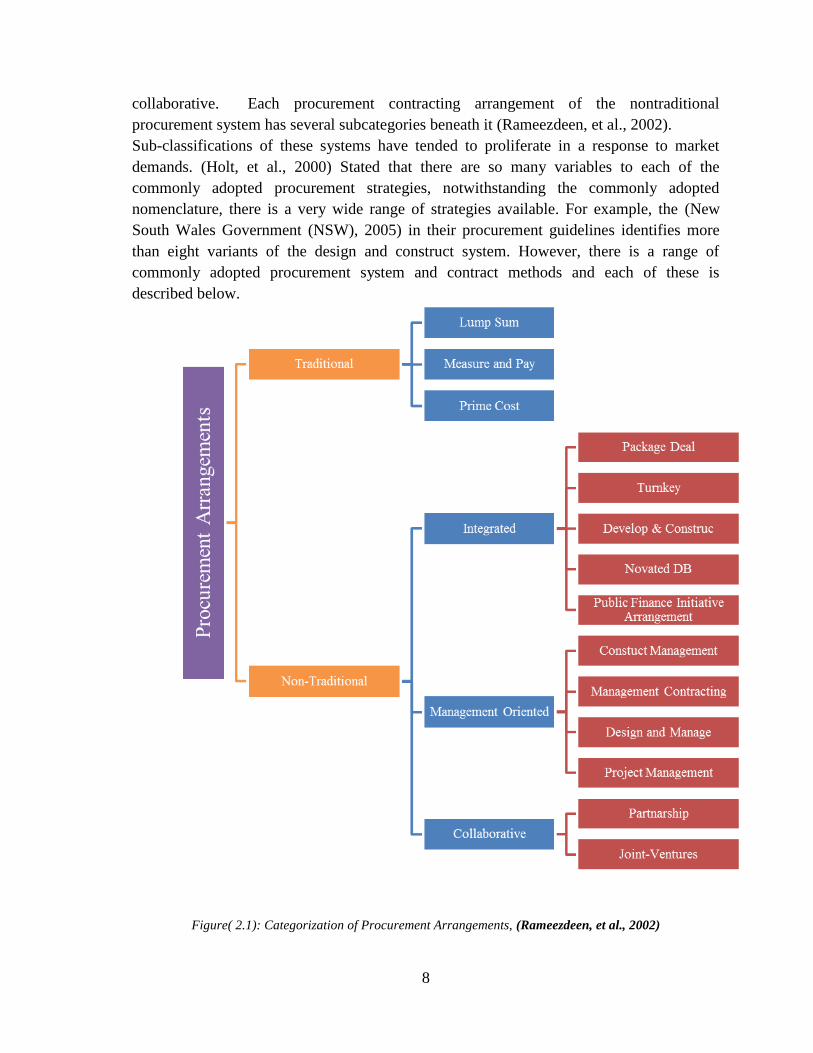
collaborative. Each procurement contracting arrangement of the nontraditional
procurement system has several subcategories beneath it (Rameezdeen, et al., 2002).
Sub-classifications of these systems have tended to proliferate in a response to market
demands. (Holt, et al., 2000) Stated that there are so many variables to each of the
commonly adopted procurement strategies, notwithstanding the commonly adopted
nomenclature, there is a very wide range of strategies available. For example, the (New
South Wales Government (NSW), 2005) in their procurement guidelines identifies more
than eight variants of the design and construct system. However, there is a range of
commonly adopted procurement system and contract methods and each of these is
described below.
Figure 1( 2.1): Categorization of Procurement Arrangements
Figure( 2.1): Categorization of Procurement Arrangements, (Rameezdeen, et al., 2002)
9
Under the traditional approach, there is no clear link between the design and the
construction works. Consultant is hired to carry out both the design and the cost-relating
issues, while the contractor is hired to carry out the construction work (Davis, et al., 2008).
According to (Masterman, 1992), there are three different contracts fallen under the
traditional procurement system, i.e., Lump sum contracts, Measurement contracts and Cost
reimbursement.
Tradition Procured is delivered in a consecutive manner, where the design phase is mostly
to be completed before the construction works start. Moreover, management is a shared
task between the consultant and the contractor, and there is therefore little scope for
involvement of either of the parties in the other’s activities. (Odhigu, et al., 2005) Stated
situations where traditional procurement system would be preferable, those situations are
when product quality is wanted; Price certainty is wanted before the start of construction; a
program allows sufficient time; a balance of risk is to be placed between the client and
contractors; and a client wishes to appoint designers and contractors separately.
However, many of today’s construction and engineering projects are very costly and highly
complex, employing new materials and technologically advance construction methods.
Typically, demands are being made upon the construction process not just in terms of time,
cost and quality, buy also in those of project organization, management and procurement.
Prior to mid-1980s, the mainstream of the construction industry in developed countries has
followed traditional methods of procurement. Many clients today, however, are
increasingly dissatisfied with the traditional approach and its operational characteristics and
actively seek alternative methods of procurement, organization and management to meet
their increasingly complex demands.
One consequence of the above has been the global development of new, alternative
procurement methods, which can be categorized by the way in which the interaction
between the design and construction of the project is managed, to integrated procurement
systems, management-oriented procurement system and in more recent time, partnering
(Turina, et al., 2008).
This is where the “Design and Construct” of the integrated procurement system became a
feasible alternative for the traditional procurement system. Where all of these elements of
managing and design and construction merge into two basic elements of “design and built”
and become the responsibility of one organization, mostly but not always, the contractor.
(Masterman, 1992) Defines the “Design and Construct” procurement system as “An
arrangement where one contracting organization takes sole responsibility, normally on a
lump sum fixed price basis, for the bespoke design and construction of a client’s project”.
Through the “Design and Construct” Procurement System (DSPS), a single organization is
carrying out both the design and construct work. While the client only awards the contract,
thus this form is the most straightforward from the perspective of responsibility and
communication. The organization in charge of the project will likely deliver the greatest
performance benefits to the client through innovation, standardization and integrated supply
10
chain. Furthermore, many surveys have established that clients perceive the design and
build system as providing better value for money, and giving rise to less disputes than other
procurement systems, and the surveys suggest that, an experienced client with a clear brief
can use it satisfactorily with projects of most sizes (Odhigu, et al., 2005).
The ability of the “Design and Construct” to fulfill the needs of the clients’ are far
advanced than the traditional procurement system. Where simplified contractual
arrangements could be obtained between the client and the contractor, with a total
responsibility given to the contractor including the responsibility to hire subcontractors and
suppliers. Besides that, it integrate the design and the construction processes, encourages
professionals to work towards the real interests of the client. Moreover, it improves
communication between the designing team and the implementation team.
The operational efficiency of this procurement system is highly remarkable, where the
client knows at any time whom to contact, i.e. contractor. In addition, the “design and
built” procurement system can reduce both the duration by allowing the overlap in the
design and construct process, and cost where the client will know to a certain point of
accuracy the financial commitment before commencing work on site. Both performance
will maximized due to the detailed designs from the designing team, and change will be
minimized due to solid designs and high level of compatibility between designing and
construction teams (Turina, et al., 2008).
Another form of the nontraditional procurement system is the “Management Procurement
System” (MPS), which fall into the management-oriented procurement system. In which
several variants of management procurement forms exist, which include management
contracting, construction management and design and manage. There are some subtle
differences between these procurement methods. In the case of management contracting,
the contractor has direct contractual links with all the works contractors and is responsible
for all construction work. In construction management, a contractor is paid a fee to
professionally manage, develop a program and coordinate the design and construction
activities, and to facilitate collaboration to improve the project’s constructability (Davis, et
al., 2008). A design and manage strategy is similar to management contracting. Under a
design and manage contract, the contractor is paid a fee and assumes responsibility, not
only for works contractors, but also for the design team. The common variations of design
and manage are the contractor where he plays the role of a project design and management
organization designs and manages the work, generally for a fee and delivers the project by
employing works contractors as its subcontractors to design/or construct. While the
consultant plays the role of a project, designer/manager, who designs and manages the
work, obtains subcontract tenders from works contractors who then each enter into a direct
contract with the client (Turner, 1990).
Finally, there is the “Collaborative Procurement System” (CPS). A procurement system
said to be collaborative when buyers from different organizations collaborate in order to
achieve greater efficiency and better negotiating power with suppliers; we refer to this as a
“buyer–buyer relationship.” It may be that because public sector organizations have similar
11
goals and objectives, collaboration is easier in buyer–buyer relationships than in buyer–
supplier or supplier–supplier relationships (Elmer Christine, 2013). Collaborating, a
concept, which provides a governance framework for the establishment of collaboration,
can be beneficial for all parties involved if implemented successfully. Construction
collaborating case studies in various countries (Chan, et al., 2003; Eriksson and Nilsson,
2008; Naoum, 2003; (Bresnen and Marshall, 2002) Argue that collaborating increases the
possibility that projects are completed within budget, on time, with the least number of
conflicts, claims and work defects, and with a good client-contractor relationship (Löfgren,
et al., 2009). One quantitative study, conducted by (Larson, 1995), supports that partnering
projects achieve superior results in controlling costs, technical performance, and in
satisfying customers compared to non-partnering projects. Another more recent
investigation conducted by (Nyström, 2007), did not however find any clear differences in
project performance when comparing the performances of ten partnering projects with ten
similar non-partnering projects. Hence, there is a comprehensible need for similar
quantitative studies on how collaborating and collaboration affect project performance
today.
(Cartlidge, 2002) Stated that under a collaborative system, the client lays down a
framework for the overall administration of the project within which he/she has the
discretion to use the most appropriate of all the procurement systems contained within the
other three categories. In a collaborative procurement system, quantity surveyors play an
integral role by providing a wide range of services, which include contractual issues; it also
offers quantity surveyors an opportunity to act as independent advisors within the system.
2.4 Selection of Procurement Method
Many factors in today's global market have influenced companies to search for a
competitive advantage by focusing attention on their entire supply chain. Of the various
activities involved in supply chain management, purchasing is one of strategic because it
provides companies with opportunities to reduce costs and, consequently, increase profits.
It has been estimated that the selection of an appropriate procurement system could reduce
the construction project cost by 5% of its total cost (Business Roundtable, 1982). An
essential task within the purchasing function is procurement method selection. In most
industries, the cost of raw materials and component parts represents the largest percentage
of the total product cost. For instance, in high technology firms, purchased materials and
services account for up to 80% of the total product cost (Weber, et al., 1991). Therefore,
selecting the right suppliers is key to the procurement process and represents a major
opportunity for companies to reduce costs across its entire supply chain (Mendoza, 2007).
Supplier selection is the purchasing function that forms the foundation for the success or
failure of projects. Therefore, supplier selection criteria should be well defined. Supplier
selection is a multi-criteria decision making problem, which includes both qualitative and
12
quantitative considerations. A trade-off between tangible and intangible criteria is
important in selecting the best supplier (Samarasinghe, et al., 2012).
One of the strongest criticisms to the procurement system selections was the variables used
in the selection models. The other, is the utility developed through opinions of the industry
experts. Particularly, there is critical criticisms about the subjective nature of assigning
values to procurement selection parameters to obtain mean utility values. Another relevant
question is that, in reality, does the client or his representative use a structured model for
the selection rather than unstructured and ad hock? (Shiyamini, 2005).
The increasing importance of supply chain management is motivating companies to fit
purchasing and sourcing strategies into their supply chain objectives. One of the purchasing
functions is selecting suppliers capable of procuring the demanded items that meet the
required specifications. Thus, supplier selection is an essential task of purchasing
(Monczka, et al., 2005). Purchasing as a whole plays a key role in corporate strategic
success through the appropriate selection of suppliers supporting the company's long-term
strategy and competitive positioning (Ellram, et al., 1994).
Since every procurement system has its exclusive characteristics, advantages and
constraints, there is hardly any single best system that could suit all kinds of clients and
projects (Nahapiet H., et al., 1985). The selection of a procurement system therefore
becomes a very important task for the clients, as employing an inappropriate procurement
system may lead to project failure (Chua, et al., 1999). The consequences may be time and
cost overruns and/or general dissatisfaction (Bennett, et al., 1990; Sharif, et al., 1994).
The selection of an appropriate procurement system depends largely on the accurate
identification of client requirements. Many researchers have attempted to compile a list of
client requirements that might affect the selection of a procurement system (Masterman, et
al., 1994). According to (S.Thomas, et al., 2002) nine common factors affecting the
selection of procurement systems. Those factors are Speed, certainty of completion time,
certainty of price, quality level, flexibility, responsibility, complexity, price competition
and risks allocation/avoidance.
It was found out that only time certainty and price certainty were as unambiguous criteria,
as the completion date and price could be objectively predicted by the client beforehand.
However, the other seven were regarded by the experts as subjective. Different perceptions
of the remaining seven factors would yield different recommendations for procurement
system.
Numerous techniques exist for the selection of procurement system. The choice of
procurement system is now so wide and projects are becoming so complex, that the
selection process needs to be carried out in a disciplined and objective manner within the
framework of the clients overall strategic project objectives.
Nevertheless, the major difficulties associated with procurement selection include:
No single person, has been found who is familiar with all the primary
procurement methods (Hamiliton, 1987)
13
No consensus has been found between experts which easily systemizes
procurement selection; and
No mutually exclusive sets of criteria uniquely and completely determine the
appropriate procurement method for a specific project (Ireland, 1985).
The selection and use of an appropriate procurement system are fundamental to the success
of a construction project. However, the procurement selection process involves the analysis
of complex and dynamic criteria such as cost certainty, time certainty, speed, flexibility,
etc. Procurement selection is therefore, plagued with uncertainty and vagueness that is
difficult to be represented by a generalized set of rules. In reality, decisions in procurement
selection are usually derived from intuition and experience (Luu, et al., 2003).
(Thwala, et al., 2012) Used the triangulation approach to investigate factors influencing the
selection of procurement systems in the South African construction industry. It was
established after factor analysis that five factors significantly influence the selection of
procurement systems. The five factors in the order of importance in terms of their utility
value scores are procurement policy, project characteristics, socio-economic consideration,
capital cost, and client requirements.
The study further revealed that, although the procurement choice or the utility value (level
of satisfaction) by different procurement decision-makers is not in total agreement with
each other, the utility value of any particular procurement type does not have a significant
influence on the choice of procurement system. Based on that, Construction planners,
managers and all other stakeholders involved in procurement decision-making should
formulate a systematic selection approach, as this will assist in eliminating unnecessary
project demands.
Factors that influence the selection of procurement systems cut across all the phases of the
project. Therefore, these factors are categorically classified into internal and external
factors. Factors from the internal environment were further classified into client
characteristics and project characteristics.
1. Internal Factors
A. Client Characteristics:
clients’ level of knowledge and control,
Political and social consideration,
Familiarity of procurement systems,
Competition,
Funding arrangement,
Government public/private sector projects, and
Risk allocation.
B. Project Characteristics:
Size and technical complexity of the project,
Influence of the project life cycle,
Expedited project delivery,
14
Time, and
Quality and Price certainty.
2. External Factors:
Market competition,
Information technology,
Regulatory environment,
Natural causes, and
Globalization.
The choice of different procurement methods in the construction industry is now so varied,
and this has resulted in the need to conduct a selection process for any specific project in a
disciplined and systematic manner. A useful guideline can be drawn based on the three
criteria of determining project success of time, cost and quality. The Traditional method
will benefit in Cost and Quality but at the expense of Time. The Design and Build method
will benefit Cost and Time but at the expense of Quality. The Management Contracting
method will benefit in Time and Quality but at the expense of Cost. The aforementioned
factors can be used as a guideline for the professional building team before any
commitment is made on the choice of the procurement method for their construction
projects.
(Love, et al., 1998) Used the following criteria to examine client requirements and hence,
selecting the proper procurement system:
Speed (during both design and construction);
Certainty (price and the stipulated time and knowledge of how much the client
has to
pay at each period during the construction phase);
Flexibility in accommodating design changes;
Quality (contractors reputation, aesthetics and confidence in design);
Complexity (client may specify particular subcontractor, or buildability
analysis);
Risk allocation/avoidance;
Responsibility (completion of program, price, product quality, design and
construction);
Price competition (covering such issues as value for money, maintenance costs
and
competitive tendering); and
Disputes and arbitration.
It was found out that the two most common procurement methods used by the clients are
the traditional and novation and the Procurement Path Decision Chart. A simple set of
criteria have been identified, as being generally adequate and sufficient for procurement
15
selection and that there is a reasonable consensus on their appropriate weightings for each
path. Moreover, greater involvement and interaction between client and consultants is
indicated for a more effective procurement process. It is suggested that participants have to
put aside their own objectives by considering the clients strategic project objectives in a
holistic manner. This can be effectively achieved with a project management organization,
which acts as a control mechanism for the client and participants.
(Odhigu, et al., 2005) Investigated the impacts of procurement systems on the performance
of construction projects in East Malaysia. The research showed that traditional procurement
system benefits cost and quality but at the expense of time. In other words, traditional
procurement system has positive impacts on project objectives of cost and quality and
negative impact on project time. Design and build procurement system benefits cost and
time but at the expense of quality and this implies that the impacts of design and build
procurement system on project objectives of cost and time are positive with negative
impact on project quality.
Furthermore, (Walker, et al., 2008) Indicate that, the main drivers that influence
procurement choice relates to project characteristic (project type), project sponsors’
expectations and their perceptions of what contributes value, and the extent to which the
rules and methods to deliver the project may be known. In order for project to be
successful, the procurement system should address the technical features of the project, the
client, the contractor’s needs and other relevant stakeholders’ expectations.
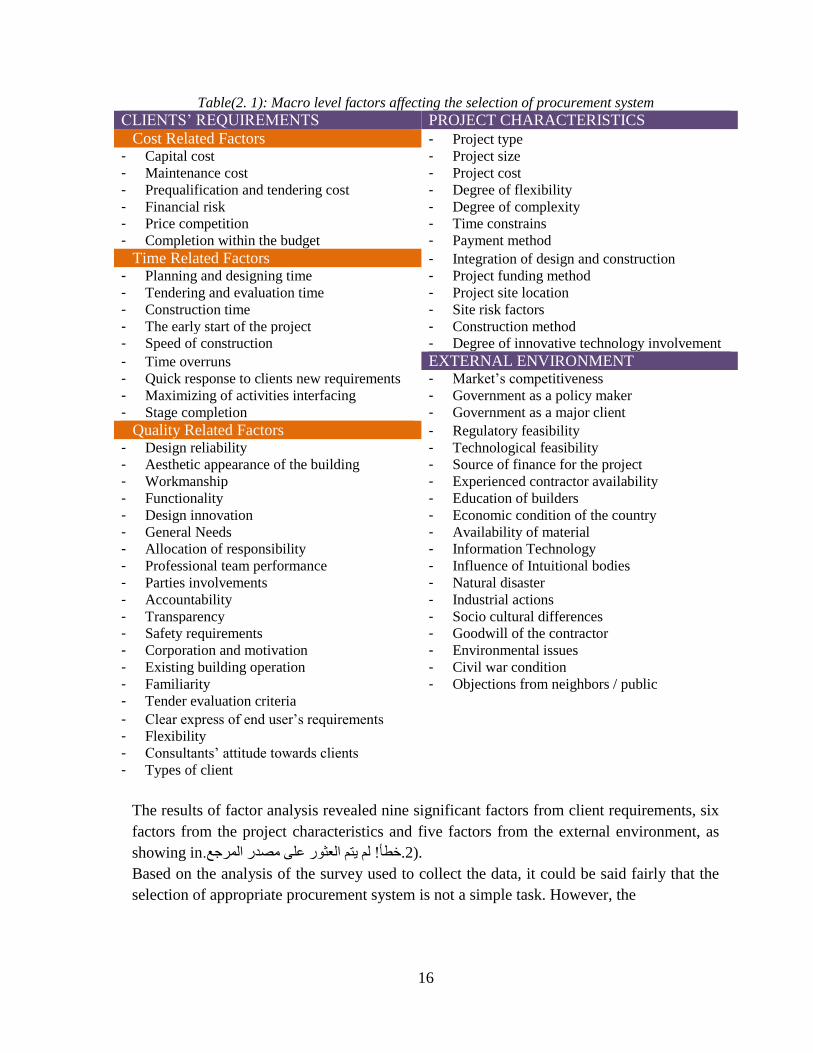
(Shiyamini , et al., 2007) Proposed a selection model based on factors affecting the
selection of procurement system in terms of client requirements & characteristics, project
characteristics and external environment. Clients’ requirements were focused on cost, time,
quality and other general aspects, which affect the procurement system selection thus
ensuring that the selection criteria have been focused at macro level. The overall factors
that affect the selection process are listed in Table(2. 1).
16
Table(2. 1): Macro level factors affecting the selection of procurement system
CLIENTS’ REQUIREMENTS PROJECT CHARACTERISTICS
Cost Related Factors - Project type
- Capital cost - Project size
- Maintenance cost - Project cost
- Prequalification and tendering cost - Degree of flexibility
- Financial risk - Degree of complexity
- Price competition - Time constrains
- Completion within the budget - Payment method
Time Related Factors - Integration of design and construction
- Planning and designing time - Project funding method
- Tendering and evaluation time - Project site location
- Construction time - Site risk factors
- The early start of the project - Construction method
- Speed of construction - Degree of innovative technology involvement
- Time overruns EXTERNAL ENVIRONMENT - Quick response to clients new requirements - Market’s competitiveness
- Maximizing of activities interfacing - Government as a policy maker
- Stage completion - Government as a major client
Quality Related Factors - Regulatory feasibility
- Design reliability - Technological feasibility
- Aesthetic appearance of the building - Source of finance for the project
- Workmanship - Experienced contractor availability
- Functionality - Education of builders
- Design innovation - Economic condition of the country
- General Needs - Availability of material
- Allocation of responsibility - Information Technology
- Professional team performance - Influence of Intuitional bodies
- Parties involvements - Natural disaster
- Accountability - Industrial actions
- Transparency - Socio cultural differences
- Safety requirements - Goodwill of the contractor
- Corporation and motivation - Environmental issues
- Existing building operation - Civil war condition
- Familiarity - Objections from neighbors / public
- Tender evaluation criteria - Clear express of end user’s requirements
- Flexibility
- Consultants’ attitude towards clients
- Types of client
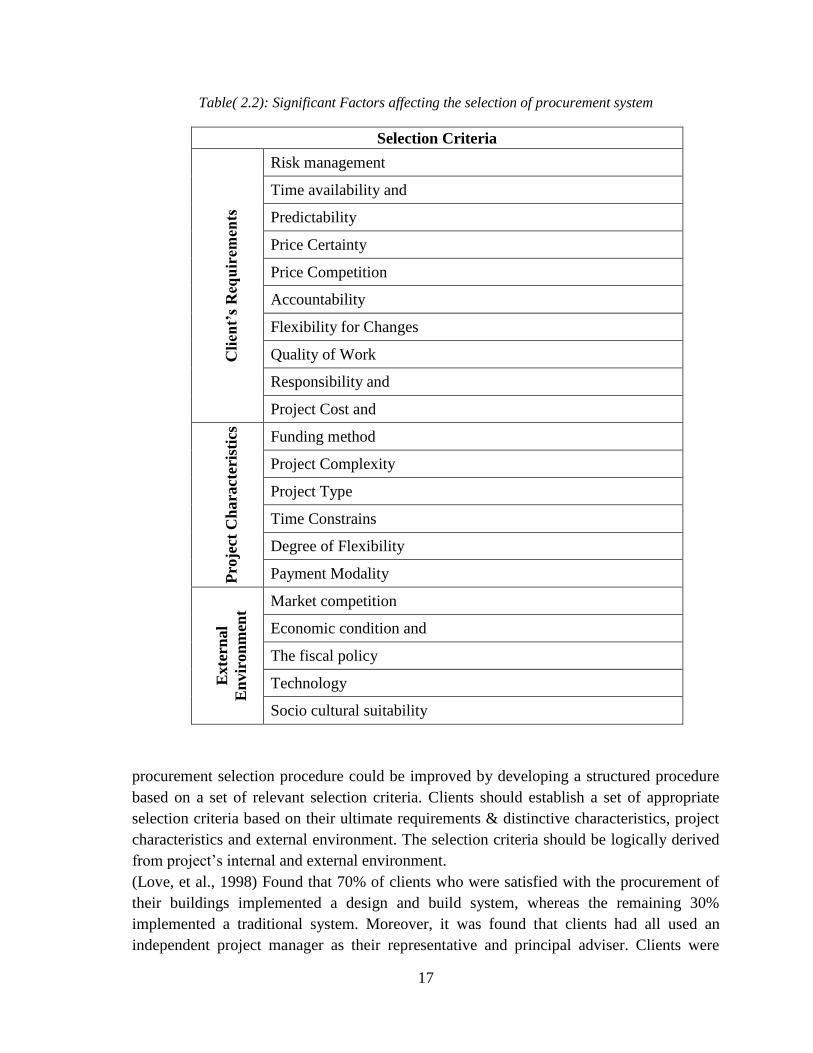
The results of factor analysis revealed nine significant factors from client requirements, six
factors from the project characteristics and five factors from the external environment, as
showing in.2.خطأ! لم يتم العثور على مصدر المرجع).
Based on the analysis of the survey used to collect the data, it could be said fairly that the
selection of appropriate procurement system is not a simple task. However, the
17
Table( 2.2): Significant Factors affecting the selection of procurement system
Selection Criteria
Cli
ent’
s R
equ
irem
ents
Risk management
Time availability and
Predictability
Price Certainty
Price Competition
Accountability
Flexibility for Changes
Quality of Work
Responsibility and
Project Cost and
Pro
ject
Ch
ara
cte
rist
ics
Funding method
Project Complexity
Project Type
Time Constrains
Degree of Flexibility
Payment Modality
Exte
rnal
En
vir
on
men
t
Market competition
Economic condition and
The fiscal policy
Technology
Socio cultural suitability
procurement selection procedure could be improved by developing a structured procedure
based on a set of relevant selection criteria. Clients should establish a set of appropriate
selection criteria based on their ultimate requirements & distinctive characteristics, project
characteristics and external environment. The selection criteria should be logically derived
from project’s internal and external environment.
(Love, et al., 1998) Found that 70% of clients who were satisfied with the procurement of
their buildings implemented a design and build system, whereas the remaining 30%
implemented a traditional system. Moreover, it was found that clients had all used an
independent project manager as their representative and principal adviser. Clients were
18
questioned on the factors that contributed to their satisfaction. The following fundamental
factors were identified:
Completion of the project on time and to budget;
Completion to the desired technical specification and quality;
Teamwork and commitment from all participants;
Ability of participants to understand the goals and objectives of the project;
Effective communication both formally and informally between participants;
and
An independent project manager.
(Jayasuriya and Rameezdeen, 2008) Studied the selection of procurement system based on
the nature of the project, i.e. routine construction project vs. disaster reconstruction
projects.
It was found out that factors affecting the routine construction projects are time certainty,
cost certainty, speed, flexibility, responsibility, complexity, price competition, risk
allocation, and quality. And while these factors are crucial to procurement selection of a
routine project, the same factors might not be appropriate for a disaster reconstruction
project. Even if they are found to be suitable , the priorities might be different. The task of
reconstruction after a major disaster event can be an onerous challenge. It requires
deliberate and coordinated efforts of all stakeholders for effective and efficient recovery of
the affected community.
Davidson, et al. (2007) Identified following major challenges for the post disaster
reconstruction, as following:
The scene is generally very chaotic and resources are in scare supply, with
simultaneous projects being launched by numerous local and international
organizations for housing and infrastructure repairs, for livelihoods creation and for
a range of other social programs.
Project must be completed as quickly as possible to foster recovery and to
satisfy donors who want to see results.
The post disaster period is generally seen as good opportunity to engage in
activities that will increase the level of development and reduce vulnerability to
future disasters, implying that projects must be implemented with sustainability in
mind.
(Wilkinson, et al., 2006) Noted following requirements to be met by a procurement method
used for disaster reconstruction.
1. Short time for rebuilding,
2. Low cost,
3. Use of local labor, material and plant,
19
4. Well-developed communication link between the parties,
5. Well-developed relationships between the parties, and
6. Local industry familiarity with the construction procurement framework.
The selection of the procurement system to be used throughout the rest of the project shall
be made as early as possible. The risks associated with each procurement system and how
they can affect the client should be considered. In design and construct forms of
procurement the contractor predominately assumes the risk for design and construction of
the project. Design and construct variations exist where the level of design risk can be
apportioned more evenly, for example, novation. With traditional lump sum contracts, the
intention is that there should usually be a fair and balance of risk between parties. The
balance can be adjusted as required, but the greater the risk to be assumed by the contractor,
the higher the tender figure is likely to be. With management forms of procurement, the
balance of risk is most onerous for the client as the contractor is providing only
‘management expertise’ to a project. However, under a design and manage method a high
of risk can be placed on the contractor for design integration (Davis, et al., 2008).
(Rameezdeen, et al., 2002) Studied the trend of construction procurement system in Sri-
Lanka. Results highlighted the dominance of separated procurement systems, i.e. traditional
system. However, it can be noted that the share of separated systems as a whole is
diminishing, paving the way for the implementation of other systems. For the factors
affecting the change in the use of procurement systems, it was found out that external
factors lead to this change, i.e. the political factors, economical factors, technological
factors, financial factors, and many other factors. Those environmental factors influence the
industry in various way, thus, determining the procurement shares and trends.
The economical aspect enhanced the design and management procurement system after the
decrease in construction workload and high inflation, where contractors diversifying into
areas of design and management to ensure adequate work for survival. On the technological
side, the new technologies increased the complexity of the construction projects; this led
the industry to seek improved project organizations procedures and practices in order to be
in line with those technologies. While the government policies played a major role in the
construction industry through playing the role of a major client, regulating authority and
administrator of the development of the industry.
The financial factors come into play where most developing countries frequently obtain
finance for major development projects through development aid funds, Both bi-lateral and
multi-lateral aid constitute a major portion of the development budget. These lending
institutions essentially safeguard their interests by dictating the methodologies that the
borrowers should follow. The procurement route is one such area where their advice is
focused. For example, if the project is funded by World Bank or Asian Development Bank,
the procedures for procurement will be according to their whims and fancies. Thus, the
issue of client's choice in the procurement of major construction projects becomes
secondary to the perceived benefits of financial arrangements.
20
Over the years, various procurement selection models have been developed to help the
client choose the most appropriate procurement system for their specific needs (Ireland,
1985; Skitmore, et al., 1988; Masterman, 1992). For example, work done by (Skitmore, et
al., 1988) modified the multiattribute technique of Building Economic Development
Committee procurement path decision chart and went on to use discriminant analysis to
distinguish between the different procurement paths for decision-making purpose. The
main difficulties associated with those models are the following:
All models seem to ignore some important factors in the selection of the most
appropriate procurement system.
The available options in the database of a number of existing models are
limited.
Some of the models are conditional and cannot be used by any client.
Some of the models require the use of advanced mathematical technique, which
are considered time consuming.
A number of the existing models adopt a primitive approach to the selection
process and limit the number of options to be considered.
Against those shortcomings in the models used to select the procurement system, (Alhazmi,
et al., 2000) proposed the Project Procurement System Selection Model (PPSSM).
The model is based a framework to be used in evaluating the activities associated with the
design and construction of a project in relation to various procurement system. This
framework concentrate on examining the relationship between different procurement
systems with reference to the following six criteria:
1. Project Characteristics,
2. Market attributes,
3. Contractor and architect/engineer (A/E) needs,
4. Categories of client,
5. Client design organization, and
6. Local design and construction regulations.
In this framework, client’s need are listed into four categories:
1. Cost,
2. Time,
3. Quality, and
4. General needs.
Based on the testing model adopted through the study, five procurement systems were
eliminated based on the feasibility ranking criteria. Those models systems are traditional
method, two-stage tendering, continuity contracts, serial contracts and cost-reimbursable
contracts. Another screening phase were used to evaluate the remaining procurement
21
methods based on the advantages and disadvantages of each procurement system. It was
found out that both negotiation and turnkey methods could be considered as inappropriate
when being compared to the others. The third screening phase was a weighted evaluation
process to identify the optimum procurement system with reference to the criteria
considered influential in the selection process. Results indicated that mean values of both
“package deals” and “develop and construct” falls into the fair range, and to be eliminated.
This study concluded that the PPSSM have the potential to assist the client in the
construction industry in the procurement system selection. The outcome of the survey
indicated that public clients in Sudia Arabia – were the survey was distributed – selected
the design and built as the most appropriate procurement system for their projects.
(Wijewardana, et al., 2013) Studied the impact of government policies and regulations on
the selecting process of proper procurement system, where the government is an important
participant in the construction industry of every country, playing the role of a major client,
regulating authority and the administrator of the development of the industry. Government
policies and regulations are very rigid external factors, which affect to the construction
procurement selection. This could be seen where the clients have to follow government
procedure in choosing a particular procurement rout to construction project. The
conclusions concerning the Sri-Lankan construction industry is that a few number of
procurement methods are used. Even though there are many problems occurred with
conventional procurement methods, alternative procurement methods are hardly appeared
in Sri Lankan context. Government of every country plays an important and major role in
construction industry as the major client and the major regulating authority. As a major
regulating authority, government has introduced policies and regulations, which affected to
the construction industry. Therefore, government policies and regulations on construction
industry are likely to significantly affect the adoption of alternative procurement methods.
2.5 Needs for different procurement methods
(Shiyamini , et al., 2007) Reported that, different procurement systems are used for
different projects and the precise choice may help to avoid problems and be the key to the
attainment of project specific goals. (Tookey, et al., 2001) Stated that in today there are
number of different types of procurement routes available for clients to choose from which
has their own proponents and inherent strengths and weaknesses. Therefore, a choosing
procurement method is very crucial in construction project. To satisfy the requirement of
time completion on time or earlier a plethora of non-traditional procurement methods have
emerged in the marketplace, which has resulted in design and construction schedules being
compressed and construction commencing before the final design is complete (Hanna, et
al., 1999).
Therefore, there should be different procurement methods existing to choose the proper one
for particular project. According to (Love , et al., 2008) choosing the appropriate
procurement system for construction projects is a complex and challenging task for clients
22
particularly when professional advice has not been sought. (Eriksson, et al., 2010) Reported
that in recent years there has been an increasing interest in world about the use of
collaborating in order to improve collaboration among construction project actors. The
value that lies in having this model tested is potentially great as the construction literature
has many indications that cooperation and collaboration may be a good strategy for
achieving project success.
2.6 Local Studies
(ElAgha, 2013) Carried out a study to investigate procurement systems in Gaza Strip and
factors affecting the selection of the optimum procurement systems. The results of the
survey questionnaire, which was distributed among procurement experts and consultant,
indicated that
The top six significant factors that have most influence on the selection of procurement
methods in the Gaza Strip in construction projects are: price competition; degree of project
complexity; time constrains of project; project size; client's financial capability and client's
experience in procurement methods. This research concludes that there is no variety of
procurement methods used in the Gaza Strip construction industry where a traditional
procurement method with a measure and pay method based on bill of quantities is
preferred. This is because of the most of professionals' in Gaza Strip are not familiar and
not widely experienced with the other alternative procurement methods.
One of the main recommendations of this research is to use the proposed conceptual
framework using the multi-attribute utility approach (MAUA) as a decision support system
for the selection of appropriate procurement method for construction projects in the Gaza
Strip.
The findings from the empirical survey of this study show that there are twelve most
influential factors/criteria affecting the selection of procurement method in construction
projects in Gaza Strip, which are:
1. Price competition,
2. Degree of project complexity,
3. Time constrains of project,
4. Project size,
5. Client's financial capability,
6. Client's experience in procurement methods,
7. Availability of qualified personnel (procurement staff),
8. Risk avoidance/allocation,
9. Project type and nature,
10. Availability of procurement system in the local market,
11. Responsibility allocation,
12. Procurement policy.
23
While the six least influential factors, as evaluated by procurement specialists and
consultants, are:
1. Material availability,
2. Geotechnical investigation,
3. Stakeholder integration,
4. Delays in obtaining environmental approval,
5. Environment impact, and
6. Social factors.
The results also give a general indication that both the conventional (traditional) and non-
conventional procurement methods are currently embraced in Gaza Strip. This study
reveals approximately two-thirds (69.10%) of construction projects are executed using
variants of traditional procurement method; 20.60% are through variants of management
procurement method; 7.40% are executed through design and build method; and 2.90% are
executed through public private partnership PPP (collaborative) method in Gaza.
Results also indicated that procurement methods in use are still much of variants of
traditional methods. Gaza Strip construction remains in the phase of almost exclusively
using traditional methods. This may be likely due to procurement staff and consultants are
well familiar with traditional methods and this familiarity was found regarding to a long
age existence of the traditional procurement systems in the Gaza Strip construction
industry. It could be noted that the percentages of the use of design and build and PPPP
(collaborative) methods are still significantly very low, indicating that the clients and their
representatives are still not well familiar with this variant of non-conventional procurement
system, or are yet to appreciate their advantages. The results of the study indicate that only
8.80% are familiar with design and build method while 4.40% are familiar with PPP
procurement method.
(Al-Shorafa, 2009) Amid through his research to develop a framework for the best practice
of material supply chain process through the project phases that suits the local construction
industry in order to help contractors to have the right materials in the right quantities (at the
right place) at the right moment at minimal cost. This will assist contractors to improve
their productivity, minimize losses and increase competitiveness. To realize the research
aim, a survey questionnaire was used to achieve the following objectives: exploring the
current practices of material supply chain process, identifying the important activities that
form the material supply chain process, studying the contractor/ supplier relationship,
studying the impact of the Israeli closure of the Gaza Strip on the material supply chain
process, providing solution to the risks and uncertainties inherent in the construction
industry, identifying the most occurred problems facing the contractors through the project
phases and finally identifying the key factors that may contribute in integrating the phases
of the material supply chain process.
The study reveals that contractor/supplier relationship is based on project-by-project basis.
Most of the contractors do not form long-term agreement or partnership with the suppliers.
24
Competitive pricing is the most important criteria adopted for selection of the suppliers and
it is primarily based on the lowest price. The study shows that different level of minimum
buffer stocks and buffer time were advocated by the respondents to mitigate the
uncertainties inherent in the construction setting and the problem of Israeli closure to the
borders of the Gaza Strip. Poor communication among the parties involved is the common
problem occurred in each phase of the material-supply chain process. Finally, the study
reveals that understanding the client needs and objectives by the contractors, subcontractors
and suppliers and committing to these needs and objectives, establishing a protocol for
dealing effectively with disputes and problems that may arise between the project
participant during the course of project implementation and establishing a system among
the project participants for communication and share project information in timely and
accurate manner, are the most key factors that contribute in integrating the project phases
and the project participants.
(Enshassi, et al., 2012) Stated that a project can be procured using different procurement
methods ranging from single source: direct hiring, negotiation, restrictive bid, to open
competition procurement. An owner may select a contractor through competitive bidding,
such as the lowest-bidder system and the non-lowest-bidder system. Procurement type is a
critical decision because it defines the method to select the key player in the project, which
is the construction firm that is expected to deliver the project. This decision greatly affects
the performance because if the construction firm is not qualified to achieve the project
goals, serious problems may arise during and after construction.
The finding obtained from three case studies exposed in Gaza Strip is the existence of a
proportional relation between awarding bids to lowest price and the problems encountered
during implementation when used a traditional procurement method. The three cases of the
study were awarded to lowest price contractors; the results show the existence of the
following problems:
1. Considerable delay in the project handover,
2. Disputes between the project partners,
3. Contractor's claims against the client which lead to disputes issues,
4. Low level of quality in some items, and
5. Increase of the final project cost.
Accordingly, there is a need to change the traditional system for contractor selection and
awarding contracts from the “lowest price” to “multi-criteria selection” practices. This can
be implemented by establishing alternative procurement methods to select contractors
based on technical and financial criteria.
2.7 Chapter Summary
Throughout this chapter, the definitions of the procurement system were introduced, where
different procurement system exists. A historical survey was carried out to check the

25
background of the procurement systems and its development over the years. While after,
procurement systems were introduced based on their nature and categorized into two main
groups, the traditional and nontraditional procurement systems, including the subcategories.
The aim of this illustration is to shed some lights on those procurement systems and
highlight the advantages and advantages.
In-detail, thorough and comprehensive literature review was carried out to identify the
factors affecting the selection of the procurement system, including some models used to
assist in selection of procurement systems.
Table (2.3) is designated to summarize the factors affecting the selection of the
procurement system based on the literature review carried out in the aforementioned
subsections. Factors are divided into three groups, i.e. clients’ requirements, project
characteristics and external factors, where the clients’ requirement section will contain
three subcategories, i.e. cost related factors, time related factors, quality related factors.
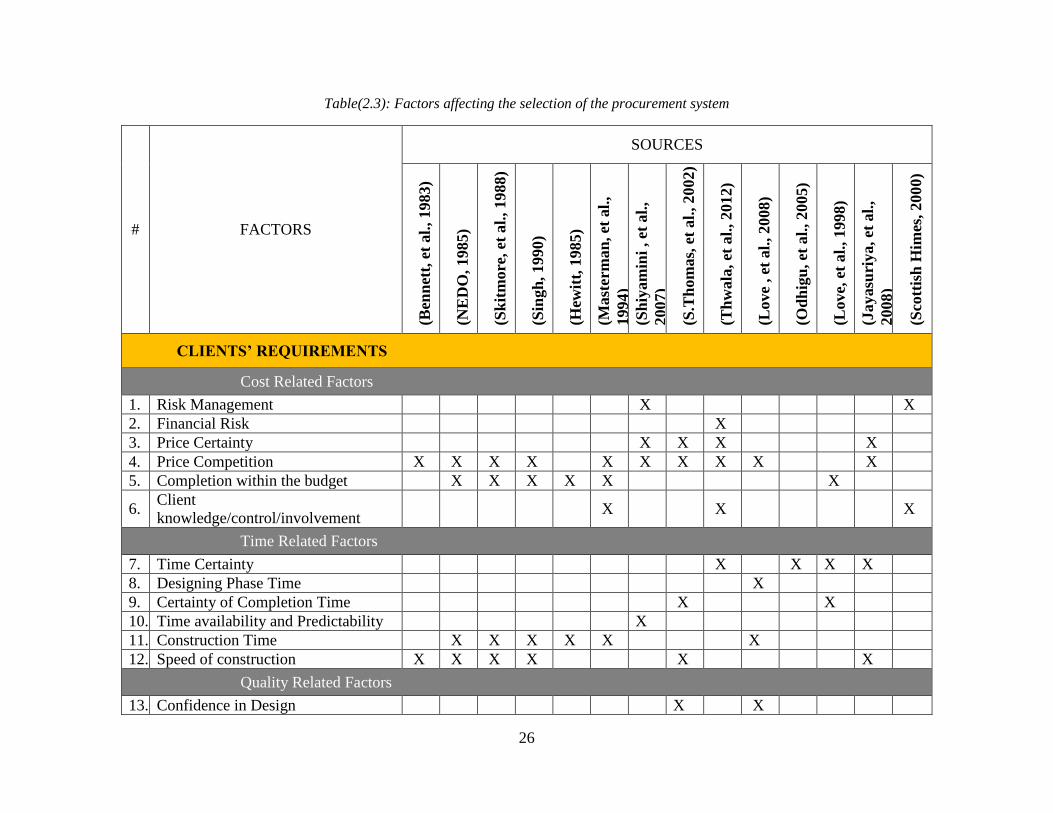
26
Table(2.3): Factors affecting the selection of the procurement system
# FACTORS
SOURCES
(Ben
net
t, e
t al.
, 1983)
(NE
DO
, 1985)
(Sk
itm
ore
, et
al.
, 1988
)
(Sin
gh
, 1990)
(Hew
itt,
1985)
(Mast
erm
an
, et
al.
,
1994)
(Sh
iyam
ini
, et
al.
,
2007)
(S.T
hom
as,
et
al.
, 2002)
(Th
wala
, et
al.
, 2012)
(Love
, et
al.
, 2008)
(Od
hig
u, et
al.
, 2005)
(Love,
et
al.
, 1998)
(Jayasu
riya, et
al.
,
2008)
(Sco
ttis
h H
imes
, 200
0)
CLIENTS’ REQUIREMENTS
Cost Related Factors
1. Risk Management X X
2. Financial Risk X
3. Price Certainty X X X X
4. Price Competition X X X X X X X X X X
5. Completion within the budget X X X X X X
6. Client
knowledge/control/involvement X X X
Time Related Factors
7. Time Certainty X X X X
8. Designing Phase Time X
9. Certainty of Completion Time X X
10. Time availability and Predictability X
11. Construction Time X X X X X X
12. Speed of construction X X X X X X
Quality Related Factors
13. Confidence in Design X X
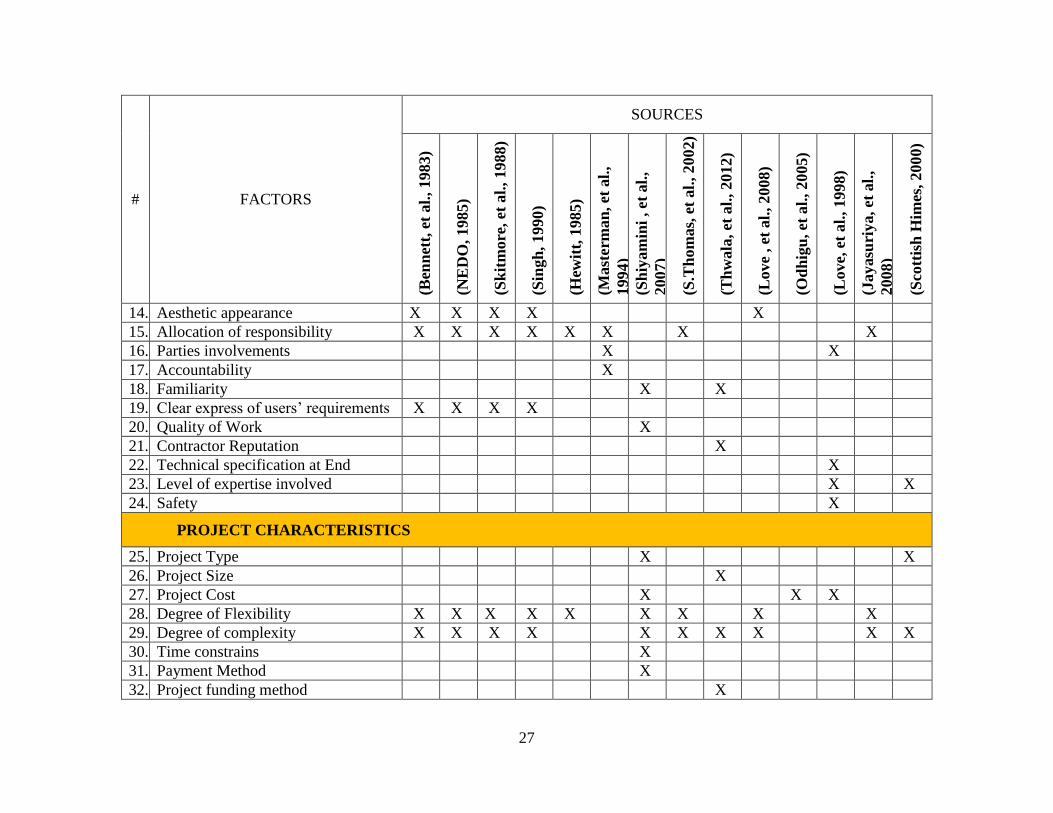
27
# FACTORS
SOURCES
(Ben
net
t, e
t al.
, 1983)
(NE
DO
, 1985)
(Sk
itm
ore
, et
al.
, 1988
)
(Sin
gh
, 1990)
(Hew
itt,
1985)
(Mast
erm
an
, et
al.
,
1994)
(Sh
iyam
ini
, et
al.
,
2007)
(S.T
hom
as,
et
al.
, 2002)
(Th
wala
, et
al.
, 2012)
(Love
, et
al.
, 2008)
(Od
hig
u, et
al.
, 2005)
(Love,
et
al.
, 1998)
(Jayasu
riya, et
al.
,
2008)
(Sco
ttis
h H
imes
, 200
0)
14. Aesthetic appearance X X X X X
15. Allocation of responsibility X X X X X X X X
16. Parties involvements X X
17. Accountability X
18. Familiarity X X
19. Clear express of users’ requirements X X X X
20. Quality of Work X
21. Contractor Reputation X
22. Technical specification at End X
23. Level of expertise involved X X
24. Safety X
PROJECT CHARACTERISTICS
25. Project Type X X
26. Project Size X
27. Project Cost X X X
28. Degree of Flexibility X X X X X X X X X
29. Degree of complexity X X X X X X X X X X
30. Time constrains X
31. Payment Method X
32. Project funding method X
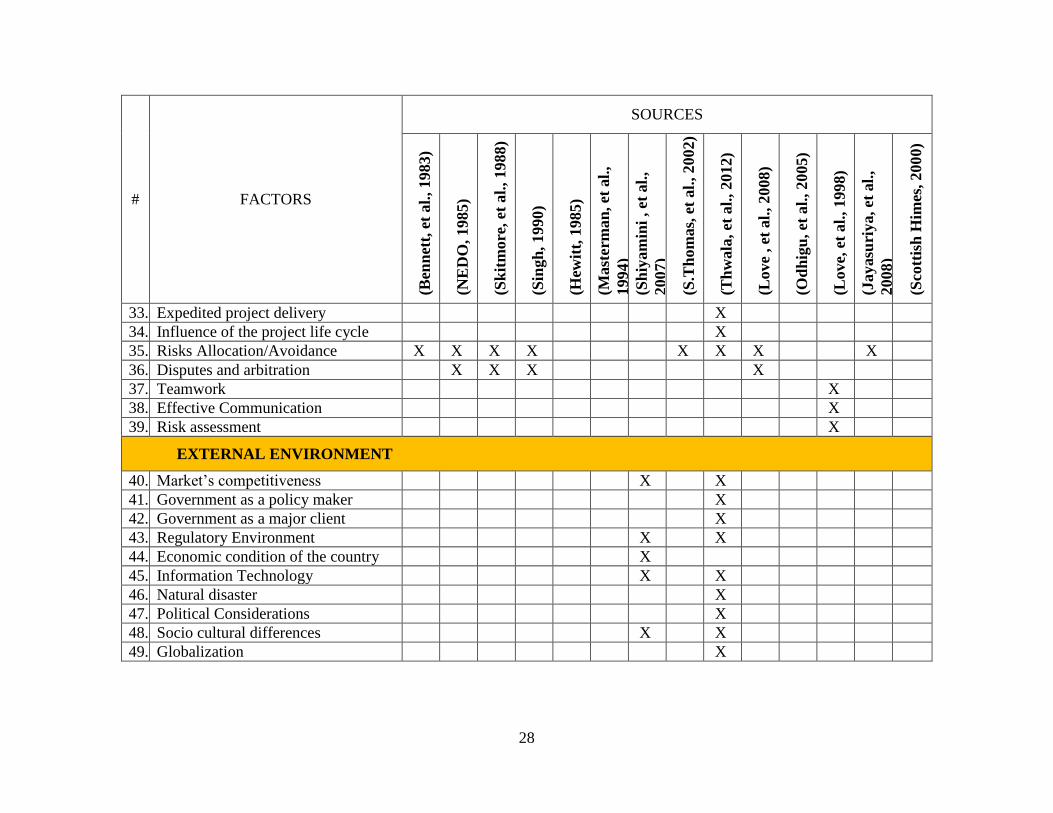
28
# FACTORS
SOURCES
(Ben
net
t, e
t al.
, 1983)
(NE
DO
, 1985)
(Sk
itm
ore
, et
al.
, 1988
)
(Sin
gh
, 1990)
(Hew
itt,
1985)
(Mast
erm
an
, et
al.
,
1994)
(Sh
iyam
ini
, et
al.
,
2007)
(S.T
hom
as,
et
al.
, 2002)
(Th
wala
, et
al.
, 2012)
(Love
, et
al.
, 2008)
(Od
hig
u, et
al.
, 2005)
(Love,
et
al.
, 1998)
(Jayasu
riya, et
al.
,
2008)
(Sco
ttis
h H
imes
, 200
0)
33. Expedited project delivery X
34. Influence of the project life cycle X
35. Risks Allocation/Avoidance X X X X X X X X
36. Disputes and arbitration X X X X
37. Teamwork X
38. Effective Communication X
39. Risk assessment X
EXTERNAL ENVIRONMENT
40. Market’s competitiveness X X
41. Government as a policy maker X
42. Government as a major client X
43. Regulatory Environment X X
44. Economic condition of the country X
45. Information Technology X X
46. Natural disaster X
47. Political Considerations X
48. Socio cultural differences X X
49. Globalization X

29
Chapter 3
30
Chapter 3: Methodology
3.1 Introduction
Chapter three presents the research methodology which is used to study the impacts of
applying procurement management system on the construction projects. The methodology
chapter includes information about the research strategy, research design, population,
sample size, data collection, questionnaire design, questionnaire content, instrument
validity, pilot study and analyzing the data.
3.2 Research strategy
Research can be defined as a systematic investigation or careful endeavour into study of
materials and sources in order to establish facts and reach new conclusions or collate old
facts (Oxford Dictionaries, 2013).
Research strategy can be defined as the way in which the research objectives can be
questioned. There are two major types of research strategies, namely, quantitative research
and qualitative research (Naoum, 2007). Quantitative approach in general refers to
explaining phenomena by using numerical data that are analyzed using mathematically
based methods particularly statistics. The greatest strength of quantitative research is that it
produces quantifiable, reliable data that are usually generalizable to some larger population.
Quantitative analysis also allows researchers to test specific hypotheses, in contrast to
qualitative research, which is more exploratory (Crossman, 2013). Qualitative research is
the second type of the scientific research; qualitative research is especially effective in
obtaining culturally specific information about the values, opinions, behaviors, and social
contexts of particular populations (QRCA, 2013). The quantitative approach will be the
main strategy of research to collect the data and perspectives of the respondents.
3.3 Research design
Generally, research design directs the research strategy by defining and development of a
plan of scientific investigation that will guide the collection and analysis of data. In order to
investigate the research questions and hypotheses, a quantitative survey approach involving
professionals (Architects, Civil engineers, Mechanical engineers, Electrical engineers, and
any other related specialization) in Gaza strip, Palestine has been involved. The research
technique was chosen as a questionnaire research to measure objectives.
This research was carried out in various phases that were undertaken to achieve the overall
research objectives. These phases are:
31
First stage: Theme identification (Problem definition)
It was initiated to identify the problem, define the problem, establish aim, objectives,
hypothesis and key research questions, and develop research plan/strategy by deciding on
the research approach and deciding on the research technique.
Second stage: Literature Review
As part of this study a literature review was performed including collecting existing
knowledge on the subject, reading and note-taking from different sources such as:
• Refereed academic research journals
• Refereed conferences
• Dissertations/theses
• Reports/occasional papers/ white papers
• Government publications
• Books
The review of literature for this study revealed several interesting points; the concept of the
procurement management on the construction.
Third stage: Questionnaire design and development
Questionnaires have been widely used for descriptive and analytical surveys in order to find
out facts, opinions and views on what is happening, who, where, how many or how much
(Naoum, 2007). Through this stage, the following points have been identified: types of
questions, the question format, the sequence of questions, and the covering letter.
Fourth stage: Face validity
Face validity was important to see whether the measurement procedure (the questionnaire)
in the study appears to be a valid or not. It was a “common-sense” assessment by experts in
the procurement management field and as well as experts in statistics.
Fifth stage: Pre-testing the questionnaire
Pre-testing the questionnaire was done to make sure that the questionnaire is going to
deliver the right data and to ensure the quality of the collected data. In other words, pre-
testing the questionnaire was important and necessary step to find out if the survey has any
logic problems, if the questions are too hard to understand, if the wording of the questions
is ambiguous, or if it has any response bias, etc. The pre-testing was conducted in two
phases and each phase has been tested with 6 professionals in the procurement management
industry in Gaza strip. The questionnaire was modified based on the results of the pre-
testing, thus questions have become clear to be answered in a way that helps to achieve the
target of the study.
Sixth stage: Pilot study
A trial run on the questionnaire was done before circulating it to the whole sample in order
to get valuable responses and to detect areas of possible shortcomings. Pilot study test
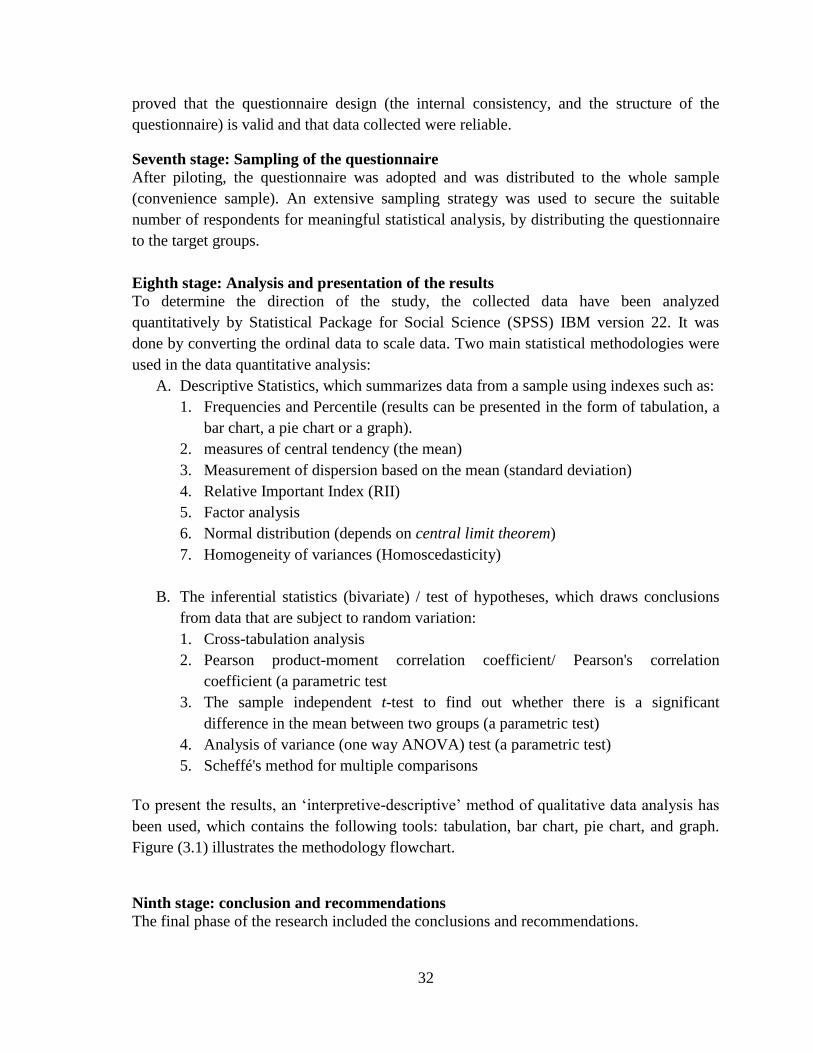
32
proved that the questionnaire design (the internal consistency, and the structure of the
questionnaire) is valid and that data collected were reliable.
Seventh stage: Sampling of the questionnaire
After piloting, the questionnaire was adopted and was distributed to the whole sample
(convenience sample). An extensive sampling strategy was used to secure the suitable
number of respondents for meaningful statistical analysis, by distributing the questionnaire
to the target groups.
Eighth stage: Analysis and presentation of the results
To determine the direction of the study, the collected data have been analyzed
quantitatively by Statistical Package for Social Science (SPSS) IBM version 22. It was
done by converting the ordinal data to scale data. Two main statistical methodologies were
used in the data quantitative analysis:
A. Descriptive Statistics, which summarizes data from a sample using indexes such as:
1. Frequencies and Percentile (results can be presented in the form of tabulation, a
bar chart, a pie chart or a graph).
2. measures of central tendency (the mean)
3. Measurement of dispersion based on the mean (standard deviation)
4. Relative Important Index (RII)
5. Factor analysis
6. Normal distribution (depends on central limit theorem)
7. Homogeneity of variances (Homoscedasticity)
B. The inferential statistics (bivariate) / test of hypotheses, which draws conclusions
from data that are subject to random variation:
1. Cross-tabulation analysis
2. Pearson product-moment correlation coefficient/ Pearson's correlation
coefficient (a parametric test
3. The sample independent t-test to find out whether there is a significant
difference in the mean between two groups (a parametric test)
4. Analysis of variance (one way ANOVA) test (a parametric test)
5. Scheffé's method for multiple comparisons
To present the results, an ‘interpretive-descriptive’ method of qualitative data analysis has
been used, which contains the following tools: tabulation, bar chart, pie chart, and graph.
Figure (3.1) illustrates the methodology flowchart.
Ninth stage: conclusion and recommendations
The final phase of the research included the conclusions and recommendations.
33
Figure 2(3.1): Methodology flowchart
3.4 Data Collection Methodology:
In order to collect the needed data for this research , we use the secondary resources in
collecting data such as books, journals, statistics and web pages , in addition to preliminary
resources that not available in secondary resources through distribute questionnaires on
study population in order to get their opinions about procedures and policies in Supply
Management in construction projects.
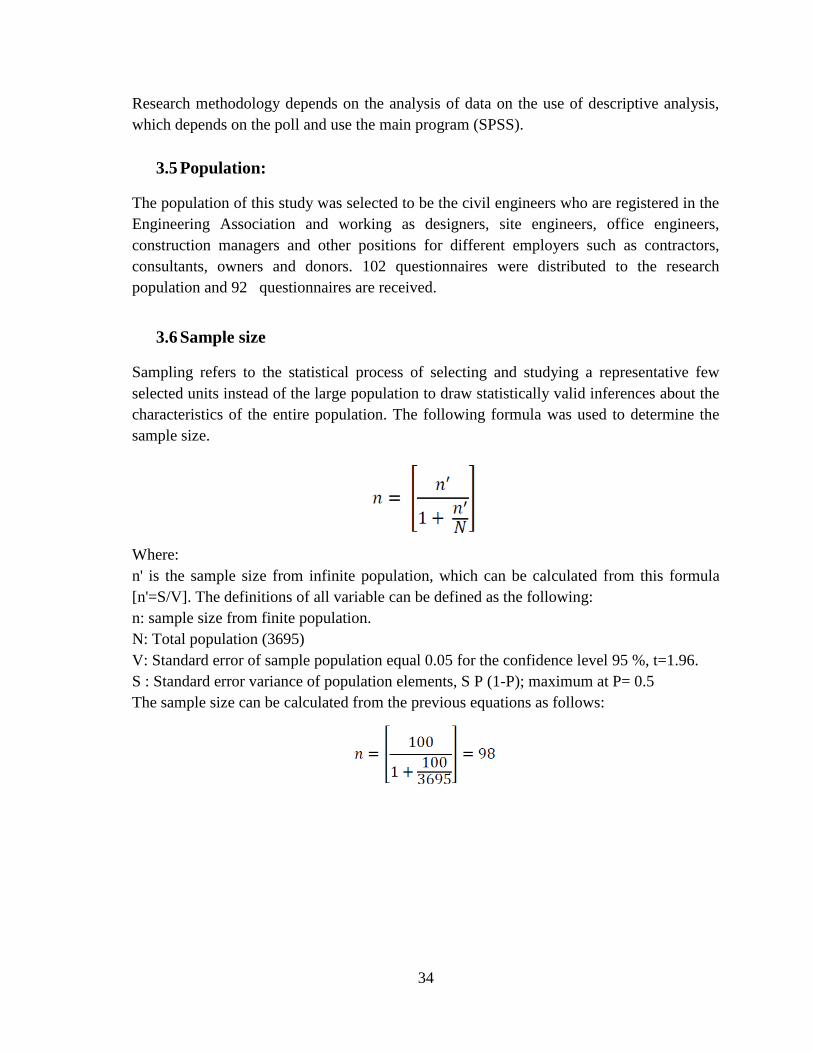
34
Research methodology depends on the analysis of data on the use of descriptive analysis,
which depends on the poll and use the main program (SPSS).
3.5 Population:
The population of this study was selected to be the civil engineers who are registered in the
Engineering Association and working as designers, site engineers, office engineers,
construction managers and other positions for different employers such as contractors,
consultants, owners and donors. 102 questionnaires were distributed to the research
population and 92 questionnaires are received.
3.6 Sample size
Sampling refers to the statistical process of selecting and studying a representative few
selected units instead of the large population to draw statistically valid inferences about the
characteristics of the entire population. The following formula was used to determine the
sample size.
Where:
n' is the sample size from infinite population, which can be calculated from this formula
[n'=S/V]. The definitions of all variable can be defined as the following:
n: sample size from finite population.
N: Total population (3695)
V: Standard error of sample population equal 0.05 for the confidence level 95 %, t=1.96.
S : Standard error variance of population elements, S P (1-P); maximum at P= 0.5
The sample size can be calculated from the previous equations as follows:
35
3.7 Data collection
As previously mentioned the questionnaire was adopted to be the tool of data collection in
this research. The questions of the questionnaire were constructed to obtain good results
and warranting a high rate of return, these questions are constructed based on:
- Literature review which it seeks systematic reading of previous information which is
related to the area of investigation.
- Pilot study which it involves testing, wordings, adding and deleting of questions.
- Several interviews with experts to obtain various opinions and thoughts which can be
significant for questions formulation.
- The experience of the researcher and some engineers in the field of construction
management.
3.8 Research location
This research has been conducted in Gaza Strip not including West Bank due to political
situation. Gaza Strip is constituted of four governorates including Northern, Gaza, Middle,
and Southern. Researcher was keen for survey distribution and data collection to cover
most of these areas.
3.9 Research limitation
This research is limited to construction projects and also the civil engineers who are
registered in the Engineers Association and working as designers, site engineers, office
engineers, construction managers and other positions.
3.10 Face validity
Face validity was important to see whether the questionnaire appears to be a valid or not. It
was a “common-sense” assessment by experts in the procurement managements field as
well as experts in statistics (Salkind, 2010). The questionnaire was presented to 6 experts
(from Gaza city as well as outside Palestine) by hand delivery and by email at different
periods for assessment the validity of the questionnaire. Many useful and important
modifications have been made for the questionnaire.
3.11 Questionnaire content
The questionnaire was provided with a covering letter explaining the purpose of the study,
the way of responding, the aim of the research and the security of the information in order
to encourage a high response. The questionnaire included multiple choice questions: which
36
used widely in the questionnaire, the variety in these questions aims first to meet the
research objectives, and to collect all the necessary data that can support the discussion,
results and recommendations in the research.
The sections in the questionnaire will verify the objectives in this research is to develop a
clear understanding about procedures and policies in procurement management on the
construction projects as the following:
Section One: General information about respondents consists from 6 items.
Section Two: General information about organization s consists from 5 items.
Section Three: procedures and policies in Supply Management in construction projects.
And sub divided into fields as follows:
1. Owner requirements contain 20 items, and divided into three sub fields.
a) Factors related to the cost contain 6 items.
b) Factors related to the time contain 4 items
c) Factors related to the quality contain 10 items
2. Project Characteristics contains 10 items.
3. External Environment contains 9 items.
3.12 Data measurement
In order to be able to select the appropriate method of analysis, the level of measurement
must be understood. For each type of measurement, there was/were an appropriate
method/s that can be applied and not others. In this research, ordinal scales were used.
Ordinal scale is a ranking or a rating data that normally uses integers in ascending or
descending order. The numbers assigned to the important (1, 2, 3, 4, 5) do not indicate that
the interval between scales are equal, nor do they indicate absolute quantities. They are
merely numerical labels
(Naoum, 2007). Likert scales (originally devised by R. Likert in 1932) which were used in
this questionnaire, are devices to discover strength of feeling or attitude towards a given
statement or series of statements and the implication here is that the higher the category
chosen, the greater the strength of agreement, but care has to be taken not to read too much
in these ranked scales. They are usually a three, five or seven-point range and ask
respondents to indicate rank order of agreement or disagreement by circling the appropriate
number (Bell, 2005). For this study, the five-point scale was chosen as the showing in
Table (3.1):
Table 4(3.1) lekart scale
Level Very High
Important High
Important Medium
important Low
important Very low
important
Scale 5 4 3 2 1
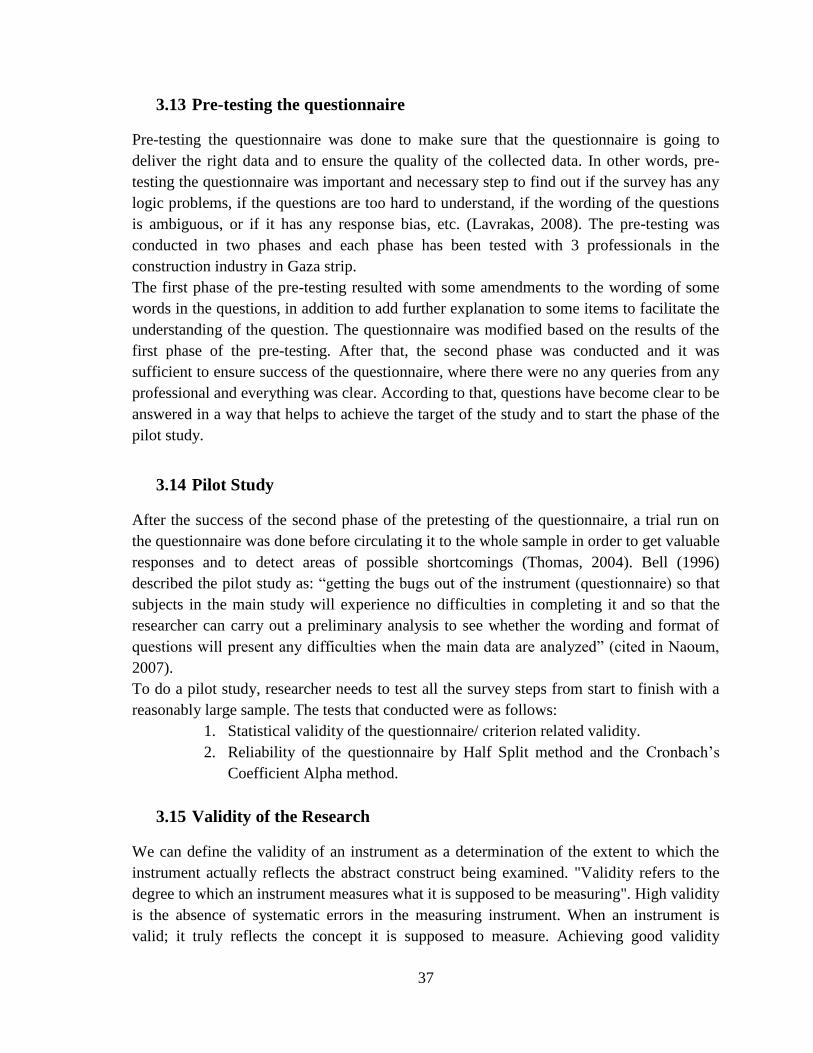
37
3.13 Pre-testing the questionnaire
Pre-testing the questionnaire was done to make sure that the questionnaire is going to
deliver the right data and to ensure the quality of the collected data. In other words, pre-
testing the questionnaire was important and necessary step to find out if the survey has any
logic problems, if the questions are too hard to understand, if the wording of the questions
is ambiguous, or if it has any response bias, etc. (Lavrakas, 2008). The pre-testing was
conducted in two phases and each phase has been tested with 3 professionals in the
construction industry in Gaza strip.
The first phase of the pre-testing resulted with some amendments to the wording of some
words in the questions, in addition to add further explanation to some items to facilitate the
understanding of the question. The questionnaire was modified based on the results of the
first phase of the pre-testing. After that, the second phase was conducted and it was
sufficient to ensure success of the questionnaire, where there were no any queries from any
professional and everything was clear. According to that, questions have become clear to be
answered in a way that helps to achieve the target of the study and to start the phase of the
pilot study.
3.14 Pilot Study
After the success of the second phase of the pretesting of the questionnaire, a trial run on
the questionnaire was done before circulating it to the whole sample in order to get valuable
responses and to detect areas of possible shortcomings (Thomas, 2004). Bell (1996)
described the pilot study as: “getting the bugs out of the instrument (questionnaire) so that
subjects in the main study will experience no difficulties in completing it and so that the
researcher can carry out a preliminary analysis to see whether the wording and format of
questions will present any difficulties when the main data are analyzed” (cited in Naoum,
2007).
To do a pilot study, researcher needs to test all the survey steps from start to finish with a
reasonably large sample. The tests that conducted were as follows:
1. Statistical validity of the questionnaire/ criterion related validity.
2. Reliability of the questionnaire by Half Split method and the Cronbach’s
Coefficient Alpha method.
3.15 Validity of the Research
We can define the validity of an instrument as a determination of the extent to which the
instrument actually reflects the abstract construct being examined. "Validity refers to the
degree to which an instrument measures what it is supposed to be measuring". High validity
is the absence of systematic errors in the measuring instrument. When an instrument is
valid; it truly reflects the concept it is supposed to measure. Achieving good validity
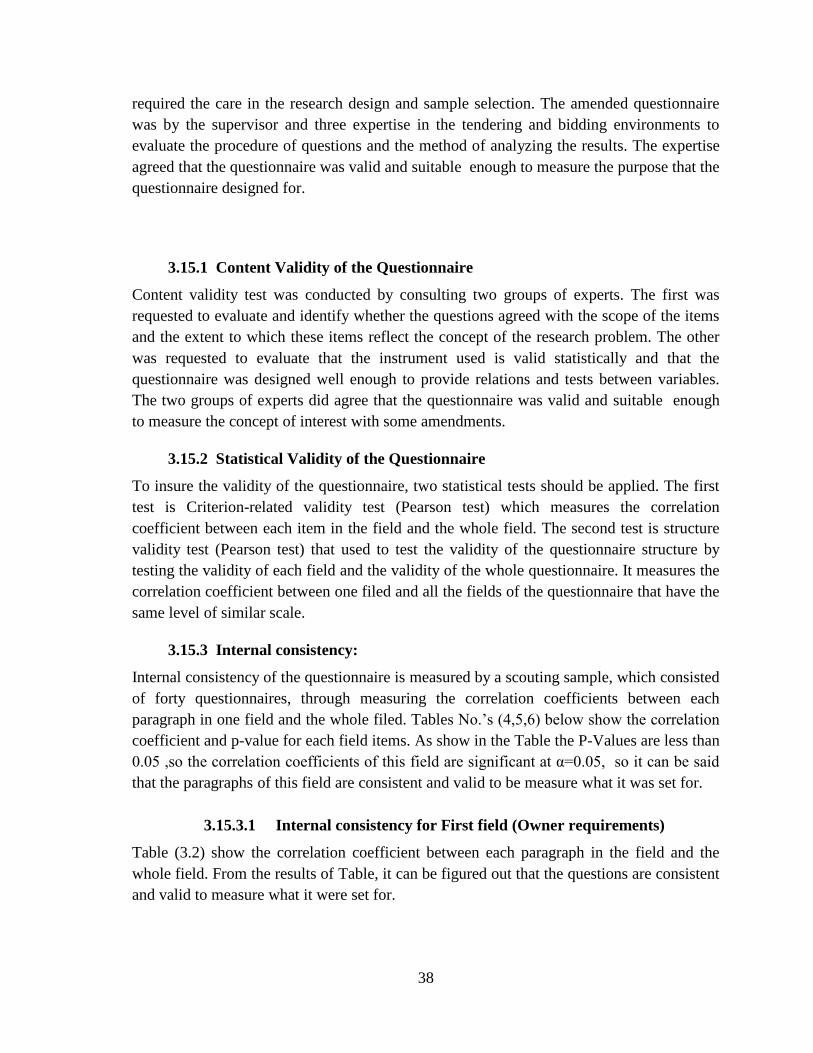
38
required the care in the research design and sample selection. The amended questionnaire
was by the supervisor and three expertise in the tendering and bidding environments to
evaluate the procedure of questions and the method of analyzing the results. The expertise
agreed that the questionnaire was valid and suitable enough to measure the purpose that the
questionnaire designed for.
3.15.1 Content Validity of the Questionnaire
Content validity test was conducted by consulting two groups of experts. The first was
requested to evaluate and identify whether the questions agreed with the scope of the items
and the extent to which these items reflect the concept of the research problem. The other
was requested to evaluate that the instrument used is valid statistically and that the
questionnaire was designed well enough to provide relations and tests between variables.
The two groups of experts did agree that the questionnaire was valid and suitable enough
to measure the concept of interest with some amendments.
3.15.2 Statistical Validity of the Questionnaire
To insure the validity of the questionnaire, two statistical tests should be applied. The first
test is Criterion-related validity test (Pearson test) which measures the correlation
coefficient between each item in the field and the whole field. The second test is structure
validity test (Pearson test) that used to test the validity of the questionnaire structure by
testing the validity of each field and the validity of the whole questionnaire. It measures the
correlation coefficient between one filed and all the fields of the questionnaire that have the
same level of similar scale.
3.15.3 Internal consistency:
Internal consistency of the questionnaire is measured by a scouting sample, which consisted
of forty questionnaires, through measuring the correlation coefficients between each
paragraph in one field and the whole filed. Tables No.’s (4,5,6) below show the correlation
coefficient and p-value for each field items. As show in the Table the P-Values are less than
0.05 ,so the correlation coefficients of this field are significant at α=0.05, so it can be said
that the paragraphs of this field are consistent and valid to be measure what it was set for.
3.15.3.1 Internal consistency for First field (Owner requirements)
Table (3.2) show the correlation coefficient between each paragraph in the field and the
whole field. From the results of Table, it can be figured out that the questions are consistent
and valid to measure what it were set for.
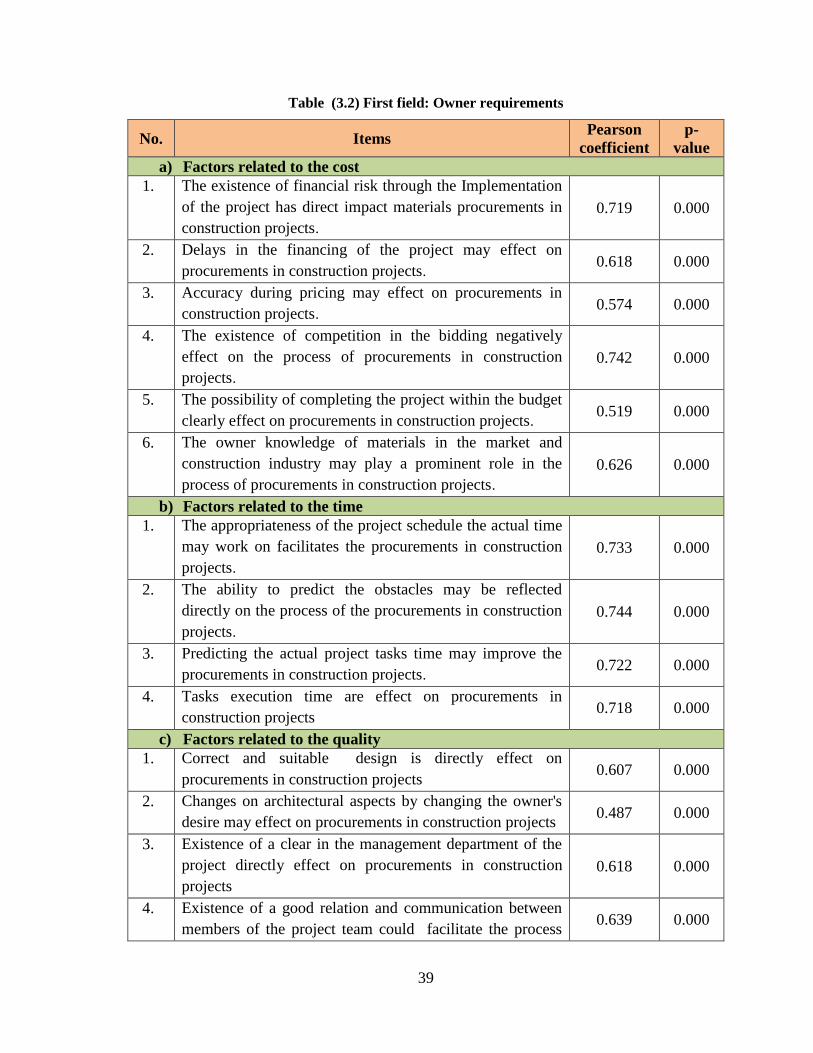
39
Table5(3.2) First field: Owner requirements
No. Items Pearson
coefficient
p-
value
a) Factors related to the cost
1. The existence of financial risk through the Implementation
of the project has direct impact materials procurements in
construction projects.
0.719 0.000
2. Delays in the financing of the project may effect on
procurements in construction projects. 0.618 0.000
3. Accuracy during pricing may effect on procurements in
construction projects. 0.574 0.000
4. The existence of competition in the bidding negatively
effect on the process of procurements in construction
projects.
0.742 0.000
5. The possibility of completing the project within the budget
clearly effect on procurements in construction projects. 0.519 0.000
6. The owner knowledge of materials in the market and
construction industry may play a prominent role in the
process of procurements in construction projects.
0.626 0.000
b) Factors related to the time
1. The appropriateness of the project schedule the actual time
may work on facilitates the procurements in construction
projects.
0.733 0.000
2. The ability to predict the obstacles may be reflected
directly on the process of the procurements in construction
projects.
0.744 0.000
3. Predicting the actual project tasks time may improve the
procurements in construction projects. 0.722 0.000
4. Tasks execution time are effect on procurements in
construction projects 0.718 0.000
c) Factors related to the quality
1. Correct and suitable design is directly effect on
procurements in construction projects 0.607 0.000
2. Changes on architectural aspects by changing the owner's
desire may effect on procurements in construction projects 0.487 0.000
3. Existence of a clear in the management department of the
project directly effect on procurements in construction
projects
0.618 0.000
4. Existence of a good relation and communication between
members of the project team could facilitate the process 0.639 0.000
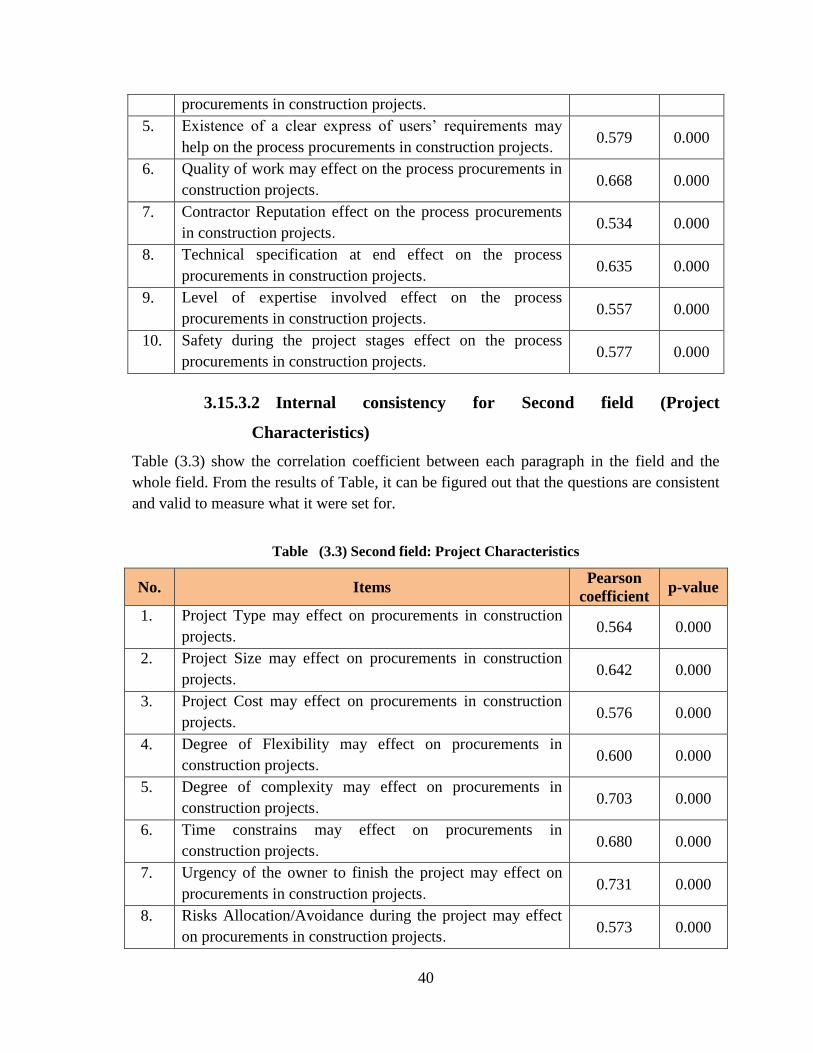
40
procurements in construction projects.
5. Existence of a clear express of users’ requirements may
help on the process procurements in construction projects. 0.579 0.000
6. Quality of work may effect on the process procurements in
construction projects. 0.668 0.000
7. Contractor Reputation effect on the process procurements
in construction projects. 0.534 0.000
8. Technical specification at end effect on the process
procurements in construction projects. 0.635 0.000
9. Level of expertise involved effect on the process
procurements in construction projects. 0.557 0.000
10. Safety during the project stages effect on the process
procurements in construction projects. 0.577 0.000
3.15.3.2 Internal consistency for Second field (Project
Characteristics)
Table (3.3) show the correlation coefficient between each paragraph in the field and the
whole field. From the results of Table, it can be figured out that the questions are consistent
and valid to measure what it were set for.
Table 6(3.3) Second field: Project Characteristics
No. Items Pearson
coefficient p-value
1. Project Type may effect on procurements in construction
projects. 0.564 0.000
2. Project Size may effect on procurements in construction
projects. 0.642 0.000
3. Project Cost may effect on procurements in construction
projects. 0.576 0.000
4. Degree of Flexibility may effect on procurements in
construction projects. 0.600 0.000
5. Degree of complexity may effect on procurements in
construction projects. 0.703 0.000
6. Time constrains may effect on procurements in
construction projects. 0.680 0.000
7. Urgency of the owner to finish the project may effect on
procurements in construction projects. 0.731 0.000
8. Risks Allocation/Avoidance during the project may effect
on procurements in construction projects. 0.573 0.000
41
No. Items Pearson
coefficient p-value
9. Disputes and arbitration may effect on procurements in
construction projects 0.589 0.000
10. Teamwork during the project may effect on procurements
in construction projects 0.655 0.000
3.15.3.3 Internal consistency for Third field (External Environment)
Table (3.4) show the correlation coefficient between each paragraph in the field and the
whole field. From the results of Table, it can be figured out that the questions are consistent
and valid to measure what it were set for.
Table 7(3.4) Third field: External Environment
No. Items Pearson
coefficient p-value
1. Market’s competitiveness directly effect on procurements
in construction projects 0.608 0.000
2. Government as a policy maker may effect on procurements
in construction projects 0.706 0.000
3. Government as a major client may effect on procurements
in construction projects 0.640 0.000
4. Regulatory Environment may effect on procurements in
construction projects 0.622 0.000
5. Economic condition of the country may effect on
procurements in construction projects 0.541 0.000
6. Information Technology may effect on procurements in
construction projects 0.644 0.000
7. Natural disaster may effect on procurements in
construction projects 0.609 0.000
8. Political Considerations may effect on procurements in
construction projects 0.637 0.000
9. Availability of the materials may effect on procurements in
construction projects 0.634 0.000
3.15.3.4 Structure Validity of the Questionnaire
Structure validity is the second statistical test that used to test the validity of the
questionnaire structure by testing the validity of each field and the validity of the whole
questionnaire. It measures the correlation coefficient between one filed and all the fields of
the questionnaire that have the same level of liker scale.
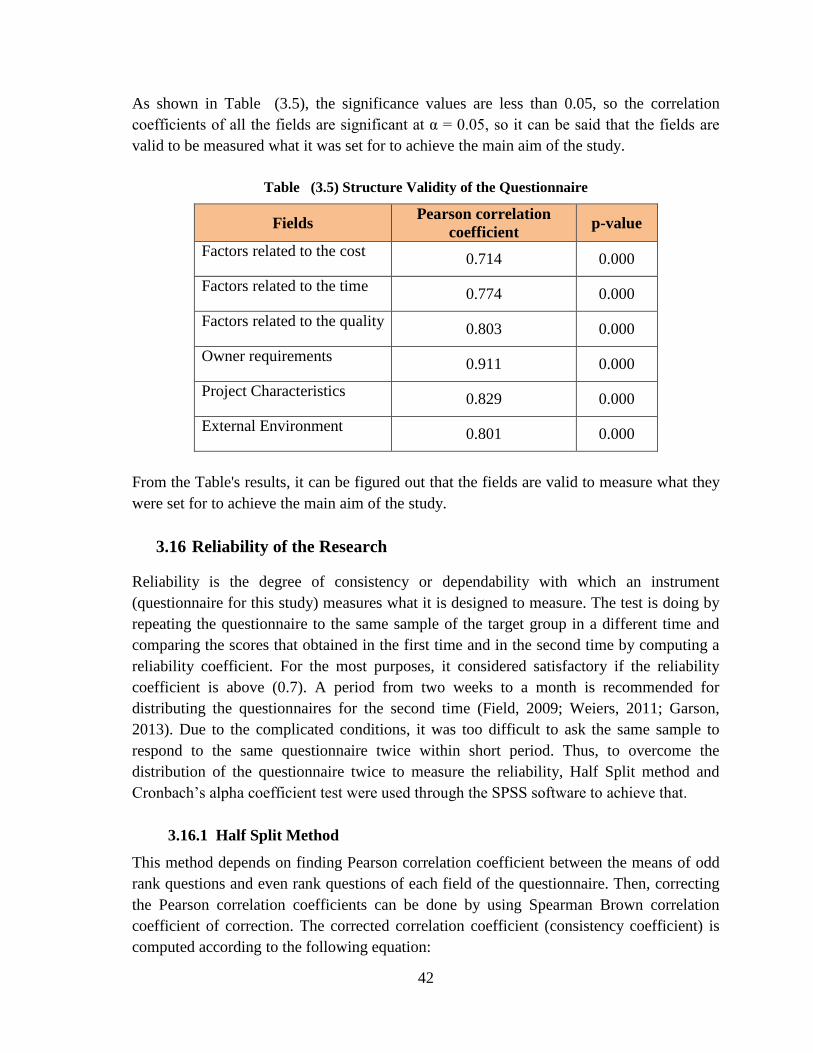
42
As shown in Table (3.5), the significance values are less than 0.05, so the correlation
coefficients of all the fields are significant at α = 0.05, so it can be said that the fields are
valid to be measured what it was set for to achieve the main aim of the study.
Table 8(3.5) Structure Validity of the Questionnaire
Fields Pearson correlation
coefficient p-value
Factors related to the cost 0.714 0.000
Factors related to the time 0.774 0.000
Factors related to the quality 0.803 0.000
Owner requirements 0.911 0.000
Project Characteristics 0.829 0.000
External Environment 0.801 0.000
From the Table's results, it can be figured out that the fields are valid to measure what they
were set for to achieve the main aim of the study.
3.16 Reliability of the Research
Reliability is the degree of consistency or dependability with which an instrument
(questionnaire for this study) measures what it is designed to measure. The test is doing by
repeating the questionnaire to the same sample of the target group in a different time and
comparing the scores that obtained in the first time and in the second time by computing a
reliability coefficient. For the most purposes, it considered satisfactory if the reliability
coefficient is above (0.7). A period from two weeks to a month is recommended for
distributing the questionnaires for the second time (Field, 2009; Weiers, 2011; Garson,
2013). Due to the complicated conditions, it was too difficult to ask the same sample to
respond to the same questionnaire twice within short period. Thus, to overcome the
distribution of the questionnaire twice to measure the reliability, Half Split method and
Cronbach’s alpha coefficient test were used through the SPSS software to achieve that.
3.16.1 Half Split Method
This method depends on finding Pearson correlation coefficient between the means of odd
rank questions and even rank questions of each field of the questionnaire. Then, correcting
the Pearson correlation coefficients can be done by using Spearman Brown correlation
coefficient of correction. The corrected correlation coefficient (consistency coefficient) is
computed according to the following equation:
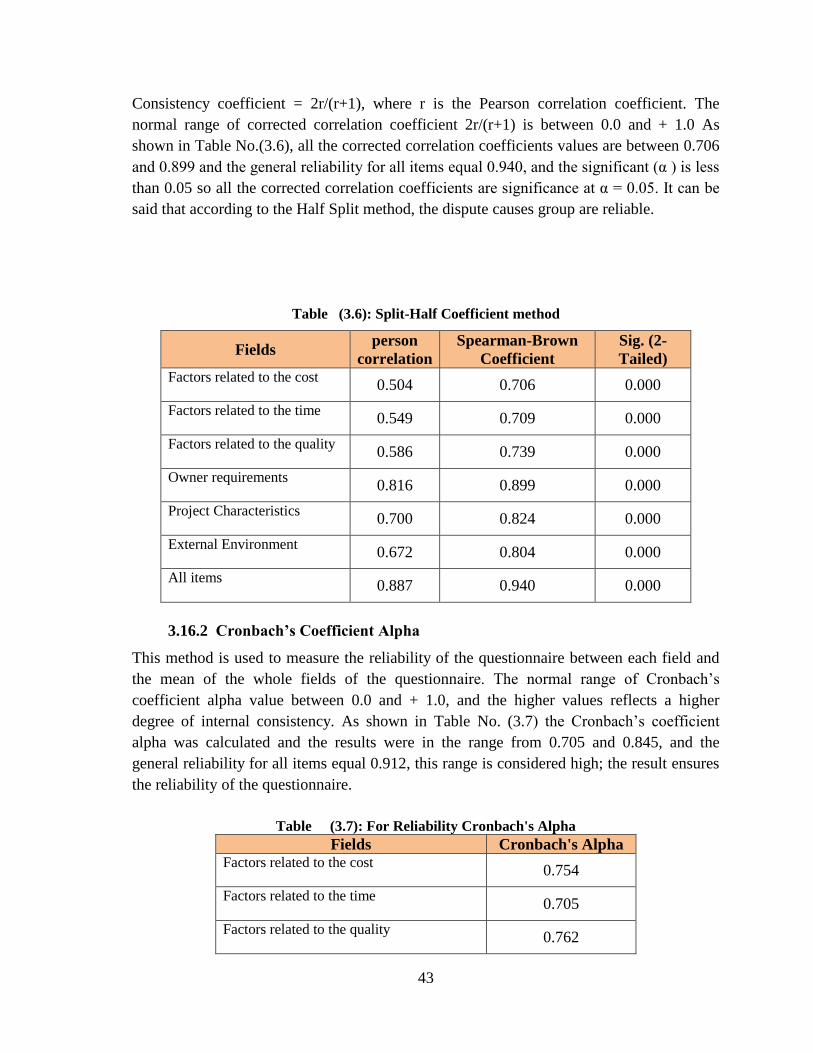
43
Consistency coefficient = 2r/(r+1), where r is the Pearson correlation coefficient. The
normal range of corrected correlation coefficient 2r/(r+1) is between 0.0 and + 1.0 As
shown in Table No.(3.6), all the corrected correlation coefficients values are between 0.706
and 0.899 and the general reliability for all items equal 0.940, and the significant (α ) is less
than 0.05 so all the corrected correlation coefficients are significance at α = 0.05. It can be
said that according to the Half Split method, the dispute causes group are reliable.
Table 9(3.6): Split-Half Coefficient method
Fields person
correlation
Spearman-Brown
Coefficient
Sig. (2-
Tailed) Factors related to the cost
0.504 0.706 0.000
Factors related to the time 0.549 0.709 0.000
Factors related to the quality 0.586 0.739 0.000
Owner requirements 0.816 0.899 0.000
Project Characteristics 0.700 0.824 0.000
External Environment 0.672 0.804 0.000
All items 0.887 0.940 0.000
3.16.2 Cronbach’s Coefficient Alpha
This method is used to measure the reliability of the questionnaire between each field and
the mean of the whole fields of the questionnaire. The normal range of Cronbach’s
coefficient alpha value between 0.0 and + 1.0, and the higher values reflects a higher
degree of internal consistency. As shown in Table No. (3.7) the Cronbach’s coefficient
alpha was calculated and the results were in the range from 0.705 and 0.845, and the
general reliability for all items equal 0.912, this range is considered high; the result ensures
the reliability of the questionnaire.
Table 10(3.7): For Reliability Cronbach's Alpha
Fields Cronbach's Alpha Factors related to the cost
0.754
Factors related to the time 0.705
Factors related to the quality 0.762
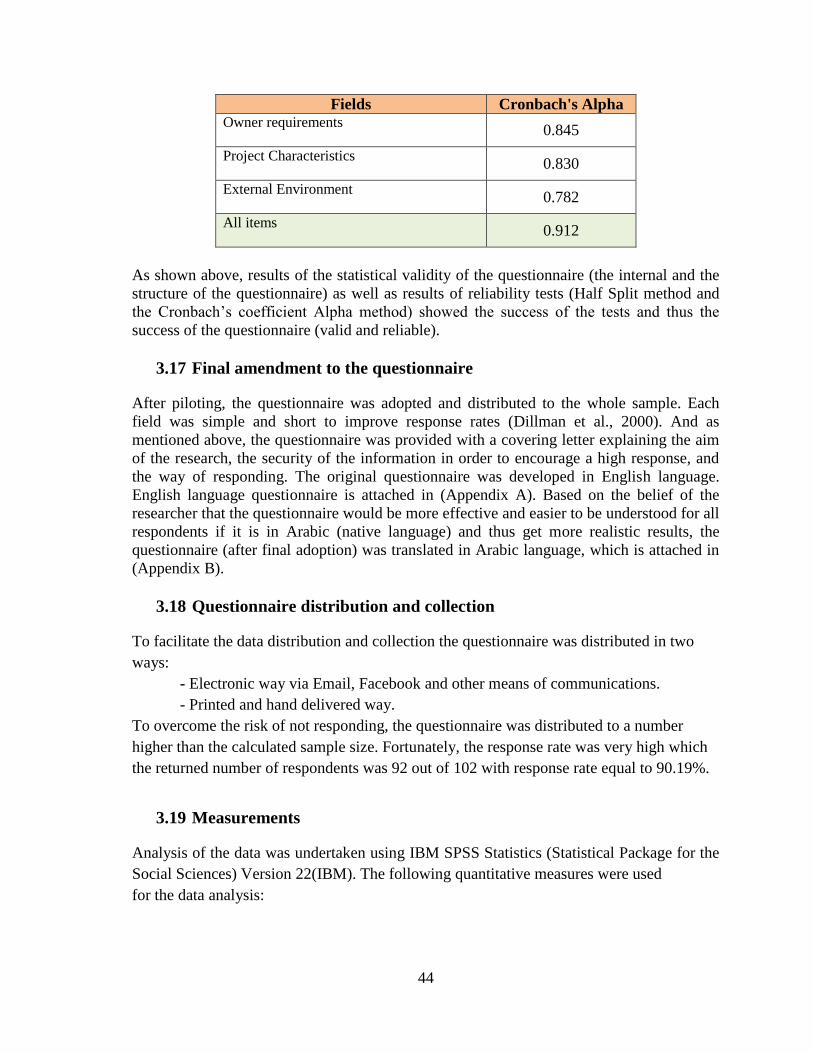
44
Fields Cronbach's Alpha Owner requirements
0.845
Project Characteristics 0.830
External Environment 0.782
All items 0.912
As shown above, results of the statistical validity of the questionnaire (the internal and the
structure of the questionnaire) as well as results of reliability tests (Half Split method and
the Cronbach’s coefficient Alpha method) showed the success of the tests and thus the
success of the questionnaire (valid and reliable).
3.17 Final amendment to the questionnaire
After piloting, the questionnaire was adopted and distributed to the whole sample. Each
field was simple and short to improve response rates (Dillman et al., 2000). And as
mentioned above, the questionnaire was provided with a covering letter explaining the aim
of the research, the security of the information in order to encourage a high response, and
the way of responding. The original questionnaire was developed in English language.
English language questionnaire is attached in (Appendix A). Based on the belief of the
researcher that the questionnaire would be more effective and easier to be understood for all
respondents if it is in Arabic (native language) and thus get more realistic results, the
questionnaire (after final adoption) was translated in Arabic language, which is attached in
(Appendix B).
3.18 Questionnaire distribution and collection
To facilitate the data distribution and collection the questionnaire was distributed in two
ways:
- Electronic way via Email, Facebook and other means of communications.
- Printed and hand delivered way.
To overcome the risk of not responding, the questionnaire was distributed to a number
higher than the calculated sample size. Fortunately, the response rate was very high which
the returned number of respondents was 92 out of 102 with response rate equal to 90.19%.
3.19 Measurements
Analysis of the data was undertaken using IBM SPSS Statistics (Statistical Package for the
Social Sciences) Version 22(IBM). The following quantitative measures were used
for the data analysis:
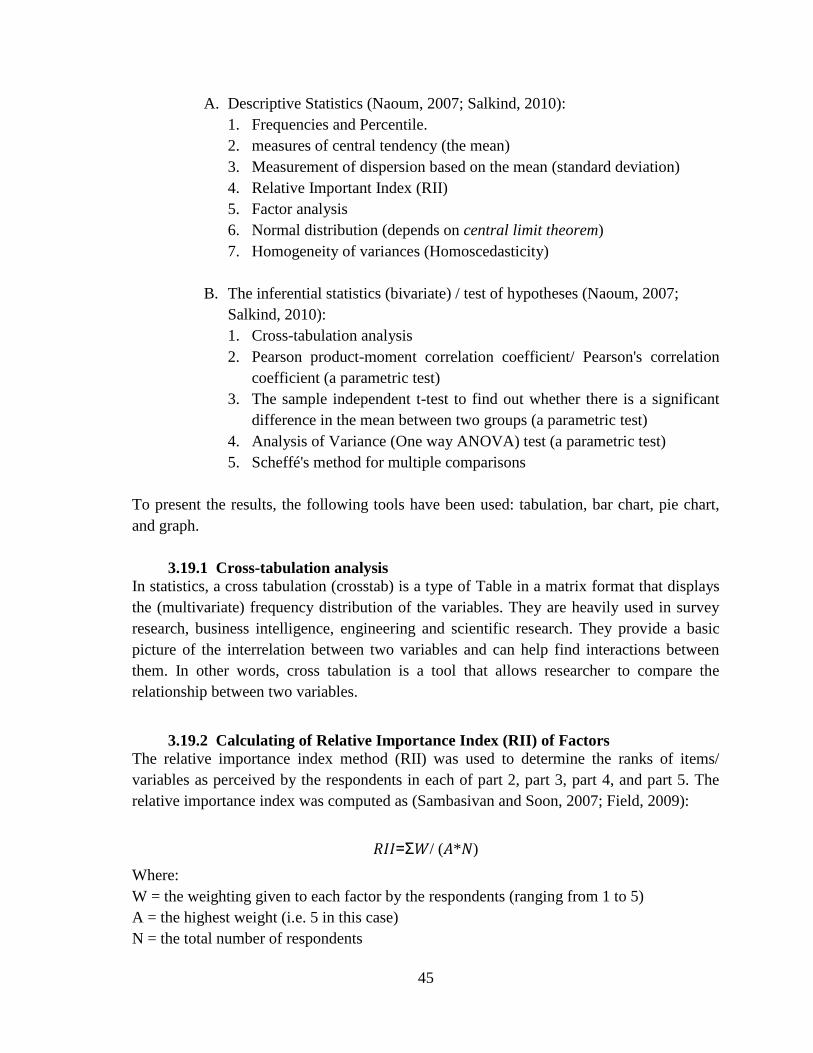
45
A. Descriptive Statistics (Naoum, 2007; Salkind, 2010):
1. Frequencies and Percentile.
2. measures of central tendency (the mean)
3. Measurement of dispersion based on the mean (standard deviation)
4. Relative Important Index (RII)
5. Factor analysis
6. Normal distribution (depends on central limit theorem)
7. Homogeneity of variances (Homoscedasticity)
B. The inferential statistics (bivariate) / test of hypotheses (Naoum, 2007;
Salkind, 2010):
1. Cross-tabulation analysis
2. Pearson product-moment correlation coefficient/ Pearson's correlation
coefficient (a parametric test)
3. The sample independent t-test to find out whether there is a significant
difference in the mean between two groups (a parametric test)
4. Analysis of Variance (One way ANOVA) test (a parametric test)
5. Scheffé's method for multiple comparisons
To present the results, the following tools have been used: tabulation, bar chart, pie chart,
and graph.
3.19.1 Cross-tabulation analysis
In statistics, a cross tabulation (crosstab) is a type of Table in a matrix format that displays
the (multivariate) frequency distribution of the variables. They are heavily used in survey
research, business intelligence, engineering and scientific research. They provide a basic
picture of the interrelation between two variables and can help find interactions between
them. In other words, cross tabulation is a tool that allows researcher to compare the
relationship between two variables.
3.19.2 Calculating of Relative Importance Index (RII) of Factors
The relative importance index method (RII) was used to determine the ranks of items/
variables as perceived by the respondents in each of part 2, part 3, part 4, and part 5. The
relative importance index was computed as (Sambasivan and Soon, 2007; Field, 2009):
𝑅𝐼𝐼=Σ𝑊/ (𝐴*𝑁)
Where:
W = the weighting given to each factor by the respondents (ranging from 1 to 5)
A = the highest weight (i.e. 5 in this case)
N = the total number of respondents
46
The RII value had a range from 0 to 1 (0 not inclusive), the higher the value of RII, the
more impact of the attribute. However, RII doesn't reflect the relationship between the
various items.
As such analysis does not provide any meaningful outcomes in terms of understanding the
clustering effects of the similar items and the predictive capacity, further analysis is
required using advanced statistical methods. Factor analysis was used to reduce the items
and investigating the clustering effects.
3.19.3 Parametric tests
Parametric test: a test that requires data from one of the large catalogue of distributions that
statisticians have described. Normally this term is used for parametric tests based on the
normal distribution, which require four basic assumptions that must be met for the test to be
accurate: a normally distributed sampling distribution (researcher can approximate using a
normal distribution after invoking the central limit theorem), homogeneity of variance,
interval or ratio data, and independence (Field, 2009; Weiers, 2011).
3.19.3.1 Pearson product-moment correlation coefficient/ Pearson's
correlation coefficient
Correlation refers to any of a broad class of statistical relationships involving dependence.
The most familiar measure of dependence between two quantities (two sets of data or two
variables) is the Pearson product-moment correlation coefficient, or “Pearson's correlation
coefficient”, commonly called simply “the correlation coefficient”. It shows the linear
relationship between two sets of data. Two letters are used to represent the Pearson
correlation: Greek letter rho (ρ) for a population and the letter (r) for a sample (Filed, 2009;
Treiman, 2009).
The Pearson's product-moment coefficient measures the strength and direction of the
relationship between two quantitative variables. It is used to measure the strength of a
linear association between two variables, where the value r = 1 means a perfect positive
correlation and the value r = -1 means a perfect negative correlation. The sign of (r)
denotes the nature of the relationship, while the value of (r) denotes the strength of
relationship (Filed, 2009; Treiman, 2009).
Requirements to apply the test
• Scale of measurement should be interval or ratio
• Variables should be approximately normally distributed
• The association should be linear
• There should be no outliers in the data
3.19.3.2 Sample Independent t-test
The t-test is a parametric test which helps the researcher to compare whether two groups
have different average (mean) values (for example, whether men and women have different
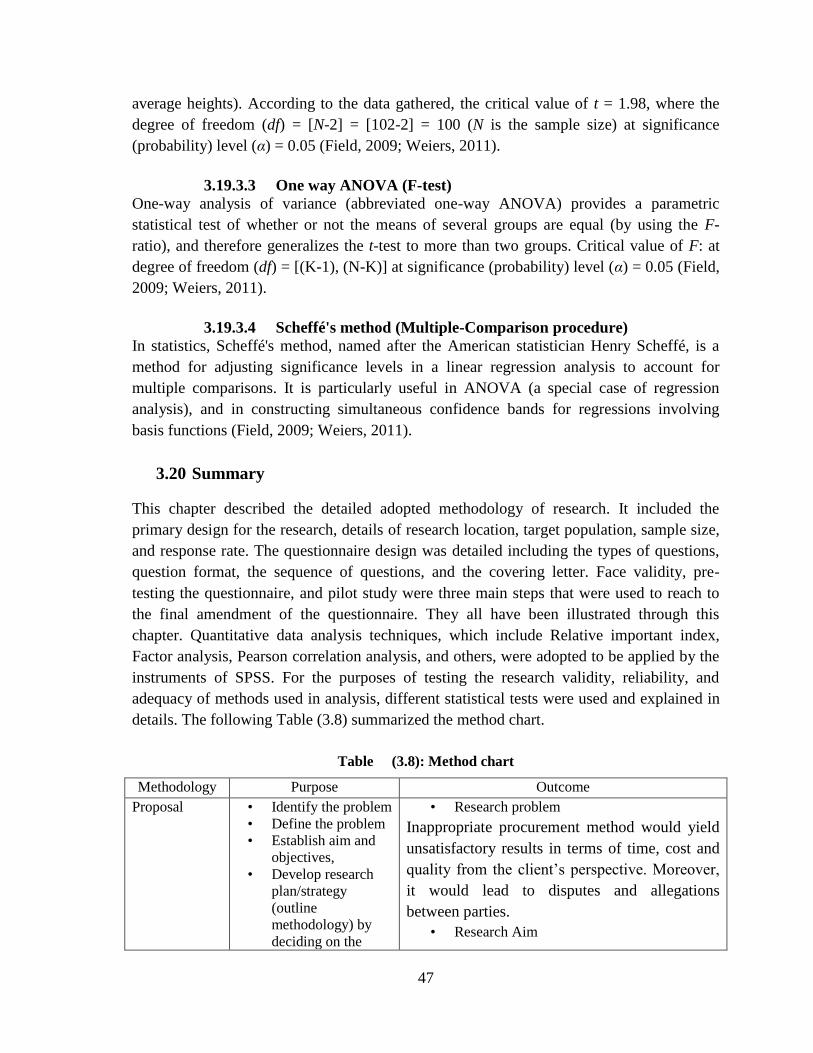
47
average heights). According to the data gathered, the critical value of t = 1.98, where the
degree of freedom (df) = [N-2] = [102-2] = 100 (N is the sample size) at significance
(probability) level (α) = 0.05 (Field, 2009; Weiers, 2011).
3.19.3.3 One way ANOVA (F-test)
One-way analysis of variance (abbreviated one-way ANOVA) provides a parametric
statistical test of whether or not the means of several groups are equal (by using the F-
ratio), and therefore generalizes the t-test to more than two groups. Critical value of F: at
degree of freedom (df) = [(K-1), (N-K)] at significance (probability) level (α) = 0.05 (Field,
2009; Weiers, 2011).
3.19.3.4 Scheffé's method (Multiple-Comparison procedure)
In statistics, Scheffé's method, named after the American statistician Henry Scheffé, is a
method for adjusting significance levels in a linear regression analysis to account for
multiple comparisons. It is particularly useful in ANOVA (a special case of regression
analysis), and in constructing simultaneous confidence bands for regressions involving
basis functions (Field, 2009; Weiers, 2011).
3.20 Summary
This chapter described the detailed adopted methodology of research. It included the
primary design for the research, details of research location, target population, sample size,
and response rate. The questionnaire design was detailed including the types of questions,
question format, the sequence of questions, and the covering letter. Face validity, pre-
testing the questionnaire, and pilot study were three main steps that were used to reach to
the final amendment of the questionnaire. They all have been illustrated through this
chapter. Quantitative data analysis techniques, which include Relative important index,
Factor analysis, Pearson correlation analysis, and others, were adopted to be applied by the
instruments of SPSS. For the purposes of testing the research validity, reliability, and
adequacy of methods used in analysis, different statistical tests were used and explained in
details. The following Table (3.8) summarized the method chart.
Table 11(3.8): Method chart
Methodology Purpose Outcome
Proposal • Identify the problem
• Define the problem
• Establish aim and
objectives,
• Develop research
plan/strategy
(outline
methodology) by
deciding on the
• Research problem
Inappropriate procurement method would yield
unsatisfactory results in terms of time, cost and
quality from the client’s perspective. Moreover,
it would lead to disputes and allegations
between parties.
• Research Aim
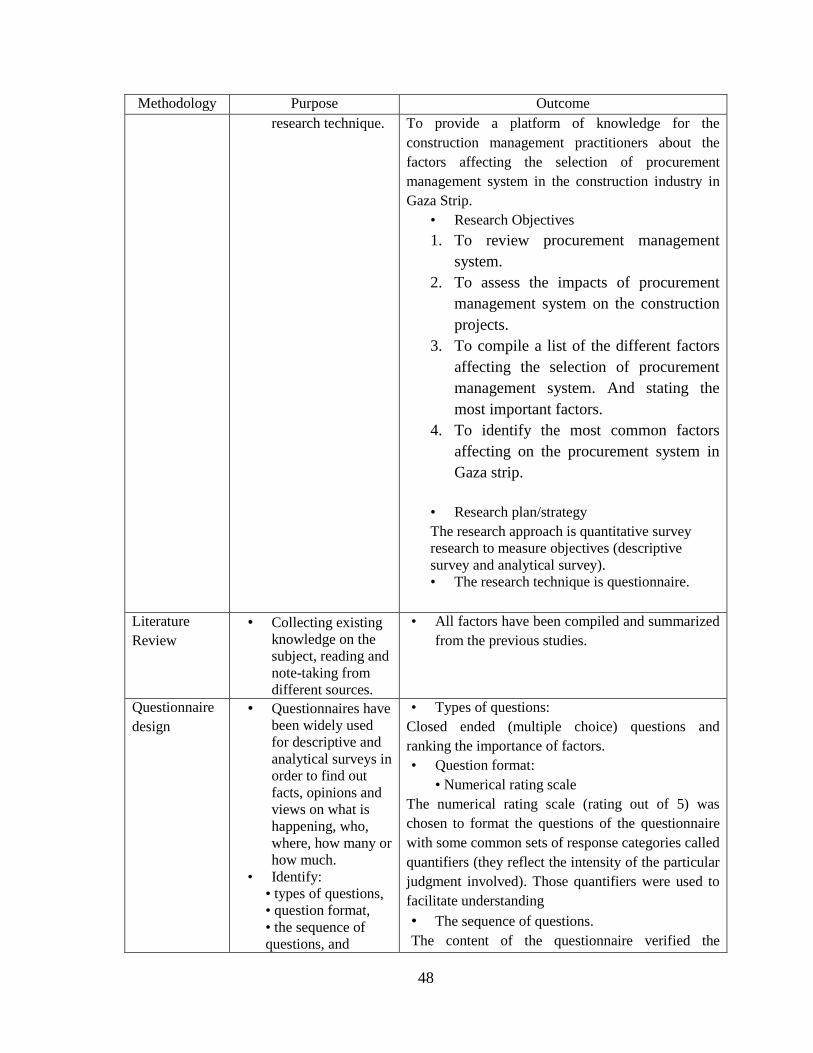
48
Methodology Purpose Outcome
research technique. To provide a platform of knowledge for the
construction management practitioners about the
factors affecting the selection of procurement
management system in the construction industry in
Gaza Strip.
• Research Objectives
1. To review procurement management
system.
2. To assess the impacts of procurement
management system on the construction
projects.
3. To compile a list of the different factors
affecting the selection of procurement
management system. And stating the
most important factors.
4. To identify the most common factors
affecting on the procurement system in
Gaza strip.
• Research plan/strategy
The research approach is quantitative survey
research to measure objectives (descriptive
survey and analytical survey).
• The research technique is questionnaire.
Literature
Review • Collecting existing
knowledge on the
subject, reading and
note-taking from
different sources.
• All factors have been compiled and summarized
from the previous studies.
Questionnaire
design • Questionnaires have
been widely used
for descriptive and
analytical surveys in
order to find out
facts, opinions and
views on what is
happening, who,
where, how many or
how much. • Identify:
• types of questions,
• question format,
• the sequence of
questions, and
• Types of questions:
Closed ended (multiple choice) questions and
ranking the importance of factors.
• Question format:
• Numerical rating scale
The numerical rating scale (rating out of 5) was
chosen to format the questions of the questionnaire
with some common sets of response categories called
quantifiers (they reflect the intensity of the particular
judgment involved). Those quantifiers were used to
facilitate understanding
• The sequence of questions.
The content of the questionnaire verified the
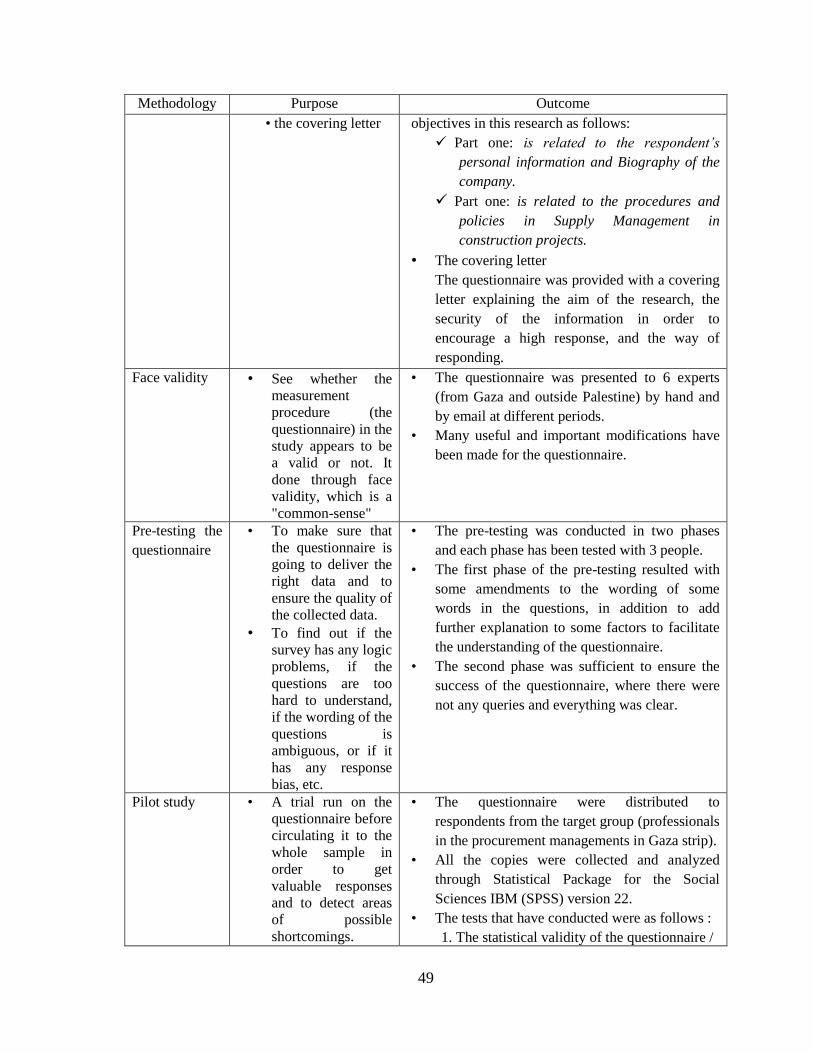
49
Methodology Purpose Outcome
• the covering letter objectives in this research as follows:
Part one: is related to the respondent’s
personal information and Biography of the
company.
Part one: is related to the procedures and
policies in Supply Management in
construction projects.
• The covering letter
The questionnaire was provided with a covering
letter explaining the aim of the research, the
security of the information in order to
encourage a high response, and the way of
responding.
Face validity • See whether the
measurement
procedure (the
questionnaire) in the
study appears to be
a valid or not. It
done through face
validity, which is a
"common-sense"
• The questionnaire was presented to 6 experts
(from Gaza and outside Palestine) by hand and
by email at different periods.
• Many useful and important modifications have
been made for the questionnaire.
Pre-testing the
questionnaire
• To make sure that
the questionnaire is
going to deliver the
right data and to
ensure the quality of
the collected data.
• To find out if the
survey has any logic
problems, if the
questions are too
hard to understand,
if the wording of the
questions is
ambiguous, or if it
has any response
bias, etc.
• The pre-testing was conducted in two phases
and each phase has been tested with 3 people.
• The first phase of the pre-testing resulted with
some amendments to the wording of some
words in the questions, in addition to add
further explanation to some factors to facilitate
the understanding of the questionnaire.
• The second phase was sufficient to ensure the
success of the questionnaire, where there were
not any queries and everything was clear.
Pilot study • A trial run on the
questionnaire before
circulating it to the
whole sample in
order to get
valuable responses
and to detect areas
of possible
shortcomings.
• The questionnaire were distributed to
respondents from the target group (professionals
in the procurement managements in Gaza strip).
• All the copies were collected and analyzed
through Statistical Package for the Social
Sciences IBM (SPSS) version 22.
• The tests that have conducted were as follows :
1. The statistical validity of the questionnaire /
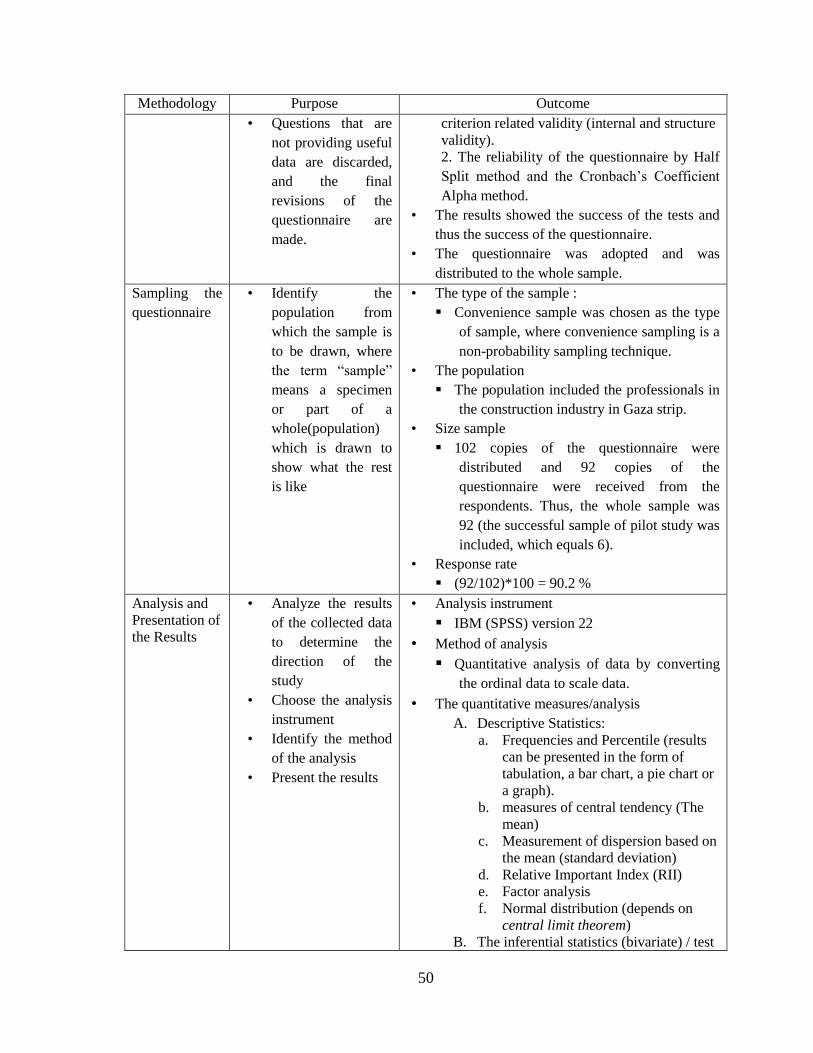
50
Methodology Purpose Outcome
• Questions that are
not providing useful
data are discarded,
and the final
revisions of the
questionnaire are
made.
criterion related validity (internal and structure
validity).
2. The reliability of the questionnaire by Half
Split method and the Cronbach’s Coefficient
Alpha method.
• The results showed the success of the tests and
thus the success of the questionnaire.
• The questionnaire was adopted and was
distributed to the whole sample.
Sampling the
questionnaire
• Identify the
population from
which the sample is
to be drawn, where
the term “sample”
means a specimen
or part of a
whole(population)
which is drawn to
show what the rest
is like
• The type of the sample :
Convenience sample was chosen as the type
of sample, where convenience sampling is a
non-probability sampling technique.
• The population
The population included the professionals in
the construction industry in Gaza strip.
• Size sample
102 copies of the questionnaire were
distributed and 92 copies of the
questionnaire were received from the
respondents. Thus, the whole sample was
92 (the successful sample of pilot study was
included, which equals 6).
• Response rate
(92/102)*100 = 90.2 %
Analysis and
Presentation of
the Results
• Analyze the results
of the collected data
to determine the
direction of the
study
• Choose the analysis
instrument
• Identify the method
of the analysis
• Present the results
• Analysis instrument
IBM (SPSS) version 22
• Method of analysis
Quantitative analysis of data by converting
the ordinal data to scale data.
• The quantitative measures/analysis
A. Descriptive Statistics:
a. Frequencies and Percentile (results
can be presented in the form of
tabulation, a bar chart, a pie chart or
a graph).
b. measures of central tendency (The
mean)
c. Measurement of dispersion based on
the mean (standard deviation)
d. Relative Important Index (RII)
e. Factor analysis
f. Normal distribution (depends on
central limit theorem)
B. The inferential statistics (bivariate) / test
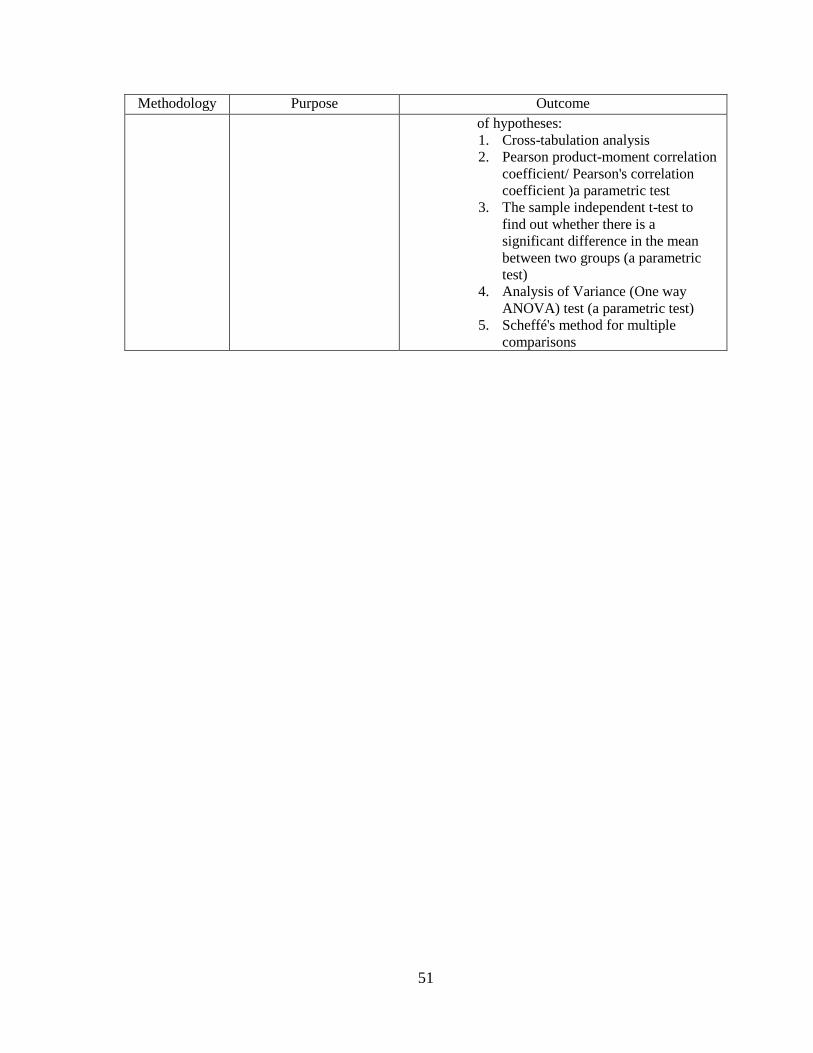
51
Methodology Purpose Outcome
of hypotheses:
1. Cross-tabulation analysis
2. Pearson product-moment correlation
coefficient/ Pearson's correlation
coefficient )a parametric test
3. The sample independent t-test to
find out whether there is a
significant difference in the mean
between two groups (a parametric
test)
4. Analysis of Variance (One way
ANOVA) test (a parametric test)
5. Scheffé's method for multiple
comparisons

52
Chapter 4
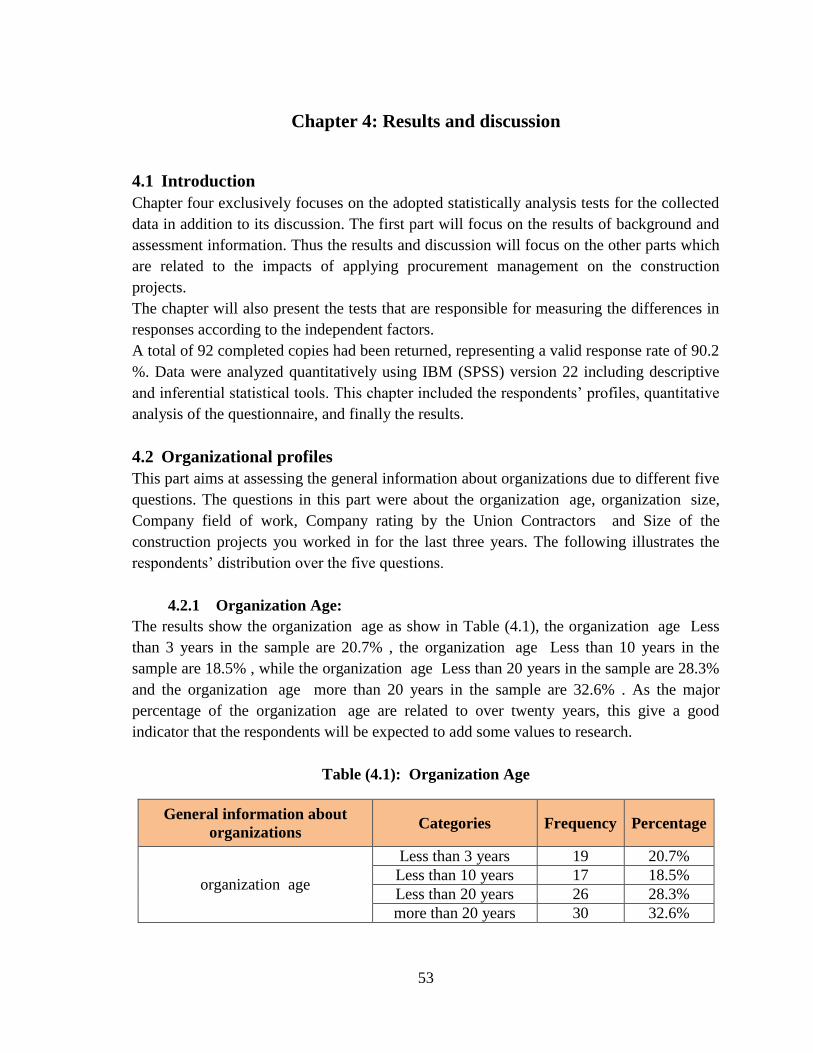
53
Chapter 4: Results and discussion
4.1 Introduction
Chapter four exclusively focuses on the adopted statistically analysis tests for the collected
data in addition to its discussion. The first part will focus on the results of background and
assessment information. Thus the results and discussion will focus on the other parts which
are related to the impacts of applying procurement management on the construction
projects.
The chapter will also present the tests that are responsible for measuring the differences in
responses according to the independent factors.
A total of 92 completed copies had been returned, representing a valid response rate of 90.2
%. Data were analyzed quantitatively using IBM (SPSS) version 22 including descriptive
and inferential statistical tools. This chapter included the respondents’ profiles, quantitative
analysis of the questionnaire, and finally the results.
4.2 Organizational profiles
This part aims at assessing the general information about organizations due to different five
questions. The questions in this part were about the organization age, organization size,
Company field of work, Company rating by the Union Contractors and Size of the
construction projects you worked in for the last three years. The following illustrates the
respondents’ distribution over the five questions.
4.2.1 Organization Age:
The results show the organization age as show in Table (4.1), the organization age Less
than 3 years in the sample are 20.7% , the organization age Less than 10 years in the
sample are 18.5% , while the organization age Less than 20 years in the sample are 28.3%
and the organization age more than 20 years in the sample are 32.6% . As the major
percentage of the organization age are related to over twenty years, this give a good
indicator that the respondents will be expected to add some values to research.
Table (4.1): Organization Age
General information about
organizations Categories Frequency Percentage
organization age
Less than 3 years 19 20.7%
Less than 10 years 17 18.5%
Less than 20 years 26 28.3%
more than 20 years 30 32.6%
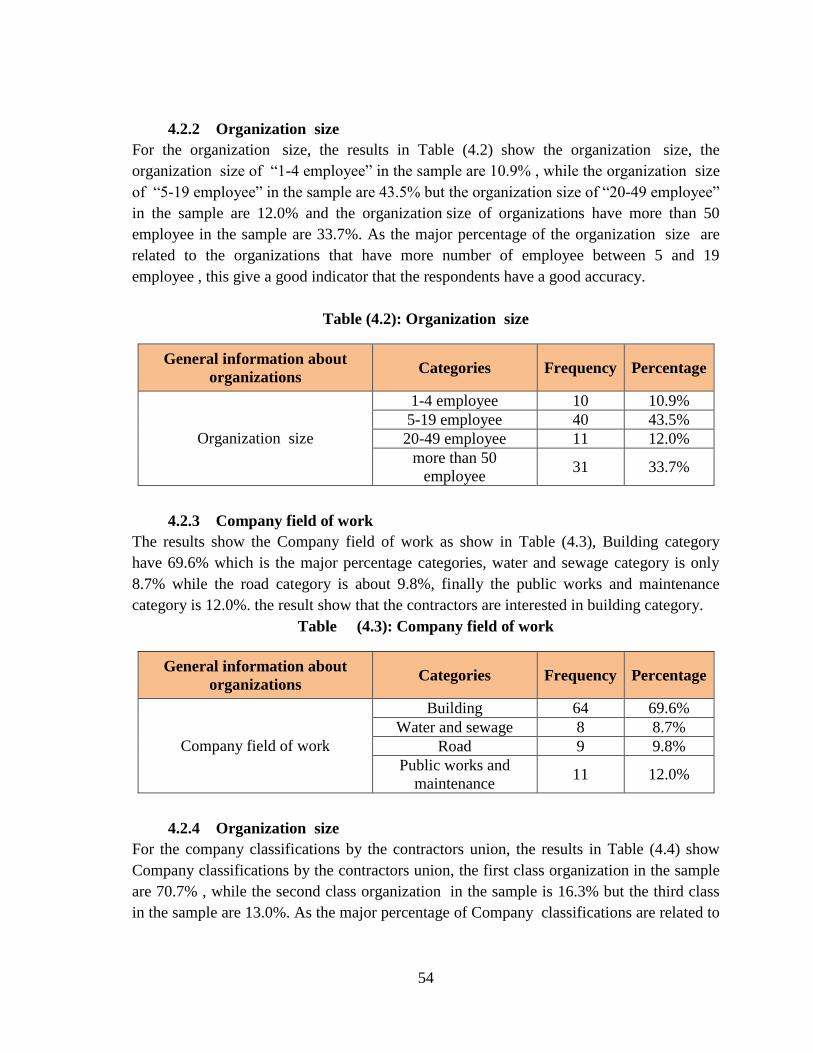
54
4.2.2 Organization size
For the organization size, the results in Table (4.2) show the organization size, the
organization size of “1-4 employee” in the sample are 10.9% , while the organization size
of “5-19 employee” in the sample are 43.5% but the organization size of “20-49 employee”
in the sample are 12.0% and the organization size of organizations have more than 50
employee in the sample are 33.7%. As the major percentage of the organization size are
related to the organizations that have more number of employee between 5 and 19
employee , this give a good indicator that the respondents have a good accuracy.
Table (4.2): Organization size
4.2.3 Company field of work
The results show the Company field of work as show in Table (4.3), Building category
have 69.6% which is the major percentage categories, water and sewage category is only
8.7% while the road category is about 9.8%, finally the public works and maintenance
category is 12.0%. the result show that the contractors are interested in building category.
Table 12(4.3): Company field of work
4.2.4 Organization size
For the company classifications by the contractors union, the results in Table (4.4) show
Company classifications by the contractors union, the first class organization in the sample
are 70.7% , while the second class organization in the sample is 16.3% but the third class
in the sample are 13.0%. As the major percentage of Company classifications are related to
General information about
organizations Categories Frequency Percentage
Organization size
1-4 employee 10 10.9%
5-19 employee 40 43.5%
20-49 employee 11 12.0%
more than 50
employee 31 33.7%
General information about
organizations Categories Frequency Percentage
Company field of work
Building 64 69.6%
Water and sewage 8 8.7%
Road 9 9.8%
Public works and
maintenance 11 12.0%
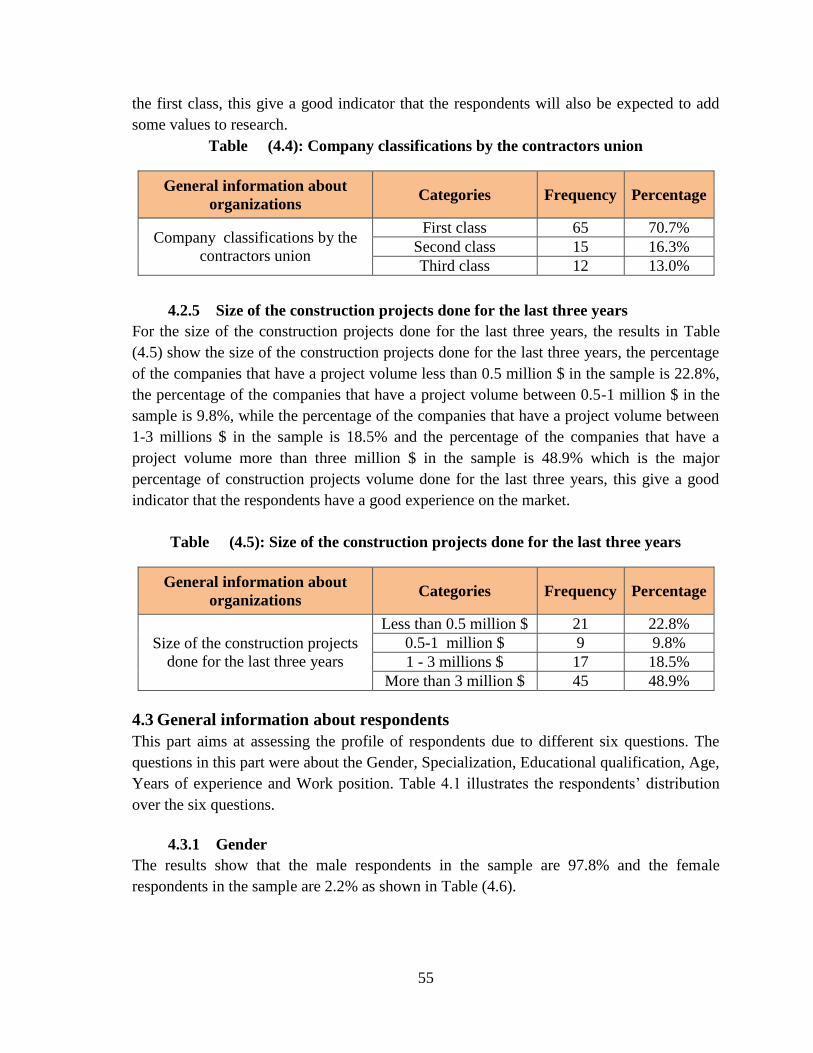
55
the first class, this give a good indicator that the respondents will also be expected to add
some values to research.
Table 13(4.4): Company classifications by the contractors union
4.2.5 Size of the construction projects done for the last three years
For the size of the construction projects done for the last three years, the results in Table
(4.5) show the size of the construction projects done for the last three years, the percentage
of the companies that have a project volume less than 0.5 million $ in the sample is 22.8%,
the percentage of the companies that have a project volume between 0.5-1 million $ in the
sample is 9.8%, while the percentage of the companies that have a project volume between
1-3 millions $ in the sample is 18.5% and the percentage of the companies that have a
project volume more than three million $ in the sample is 48.9% which is the major
percentage of construction projects volume done for the last three years, this give a good
indicator that the respondents have a good experience on the market.
Table 14(4.5): Size of the construction projects done for the last three years
4.3 General information about respondents
This part aims at assessing the profile of respondents due to different six questions. The
questions in this part were about the Gender, Specialization, Educational qualification, Age,
Years of experience and Work position. Table 4.1 illustrates the respondents’ distribution
over the six questions.
4.3.1 Gender
The results show that the male respondents in the sample are 97.8% and the female
respondents in the sample are 2.2% as shown in Table (4.6).
General information about
organizations Categories Frequency Percentage
Company classifications by the
contractors union
First class 65 70.7%
Second class 15 16.3%
Third class 12 13.0%
General information about
organizations Categories Frequency Percentage
Size of the construction projects
done for the last three years
Less than 0.5 million $ 21 22.8%
0.5-1 million $ 9 9.8%
1 - 3 millions $ 17 18.5%
More than 3 million $ 45 48.9%
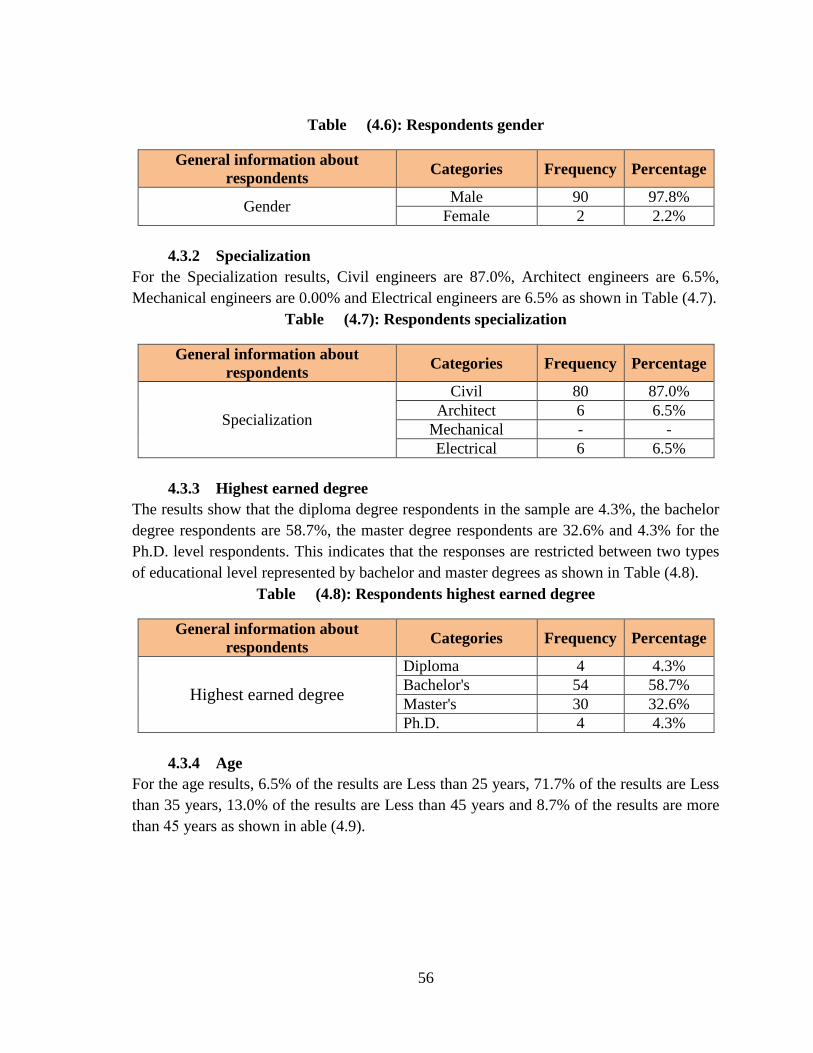
56
Table 15(4.6): Respondents gender
4.3.2 Specialization
For the Specialization results, Civil engineers are 87.0%, Architect engineers are 6.5%,
Mechanical engineers are 0.00% and Electrical engineers are 6.5% as shown in Table (4.7).
Table 16(4.7): Respondents specialization
4.3.3 Highest earned degree
The results show that the diploma degree respondents in the sample are 4.3%, the bachelor
degree respondents are 58.7%, the master degree respondents are 32.6% and 4.3% for the
Ph.D. level respondents. This indicates that the responses are restricted between two types
of educational level represented by bachelor and master degrees as shown in Table (4.8).
Table 17(4.8): Respondents highest earned degree
4.3.4 Age
For the age results, 6.5% of the results are Less than 25 years, 71.7% of the results are Less
than 35 years, 13.0% of the results are Less than 45 years and 8.7% of the results are more
than 45 years as shown in able (4.9).
General information about
respondents Categories Frequency Percentage
Gender Male 90 97.8%
Female 2 2.2%
General information about
respondents Categories Frequency Percentage
Specialization
Civil 80 87.0%
Architect 6 6.5%
Mechanical - -
Electrical 6 6.5%
General information about
respondents Categories Frequency Percentage
Highest earned degree
Diploma 4 4.3%
Bachelor's 54 58.7%
Master's 30 32.6%
Ph.D. 4 4.3%
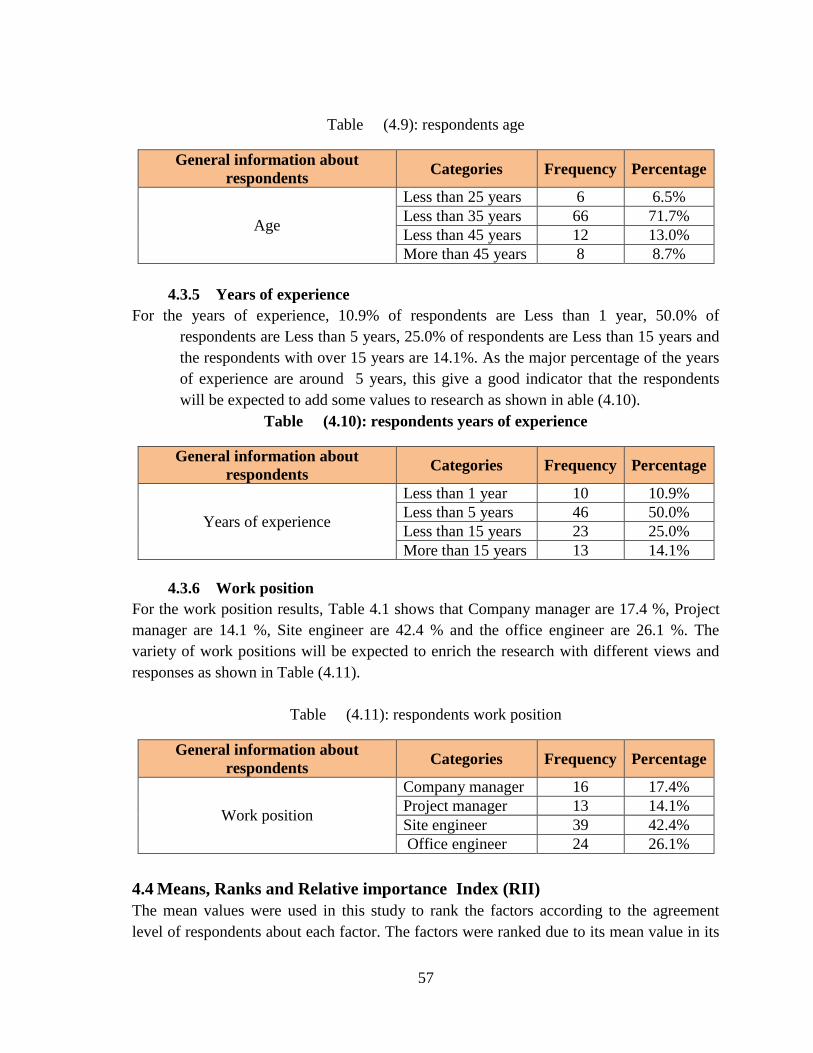
57
Table 18(4.9): respondents age
4.3.5 Years of experience
For the years of experience, 10.9% of respondents are Less than 1 year, 50.0% of
respondents are Less than 5 years, 25.0% of respondents are Less than 15 years and
the respondents with over 15 years are 14.1%. As the major percentage of the years
of experience are around 5 years, this give a good indicator that the respondents
will be expected to add some values to research as shown in able (4.10).
Table 19(4.10): respondents years of experience
4.3.6 Work position
For the work position results, Table 4.1 shows that Company manager are 17.4 %, Project
manager are 14.1 %, Site engineer are 42.4 % and the office engineer are 26.1 %. The
variety of work positions will be expected to enrich the research with different views and
responses as shown in Table (4.11).
Table 20(4.11): respondents work position
4.4 Means, Ranks and Relative importance Index (RII)
The mean values were used in this study to rank the factors according to the agreement
level of respondents about each factor. The factors were ranked due to its mean value in its
General information about
respondents Categories Frequency Percentage
Age
Less than 25 years 6 6.5%
Less than 35 years 66 71.7%
Less than 45 years 12 13.0%
More than 45 years 8 8.7%
General information about
respondents Categories Frequency Percentage
Years of experience
Less than 1 year 10 10.9%
Less than 5 years 46 50.0%
Less than 15 years 23 25.0%
More than 15 years 13 14.1%
General information about
respondents Categories Frequency Percentage
Work position
Company manager 16 17.4%
Project manager 13 14.1%
Site engineer 39 42.4%
Office engineer 24 26.1%
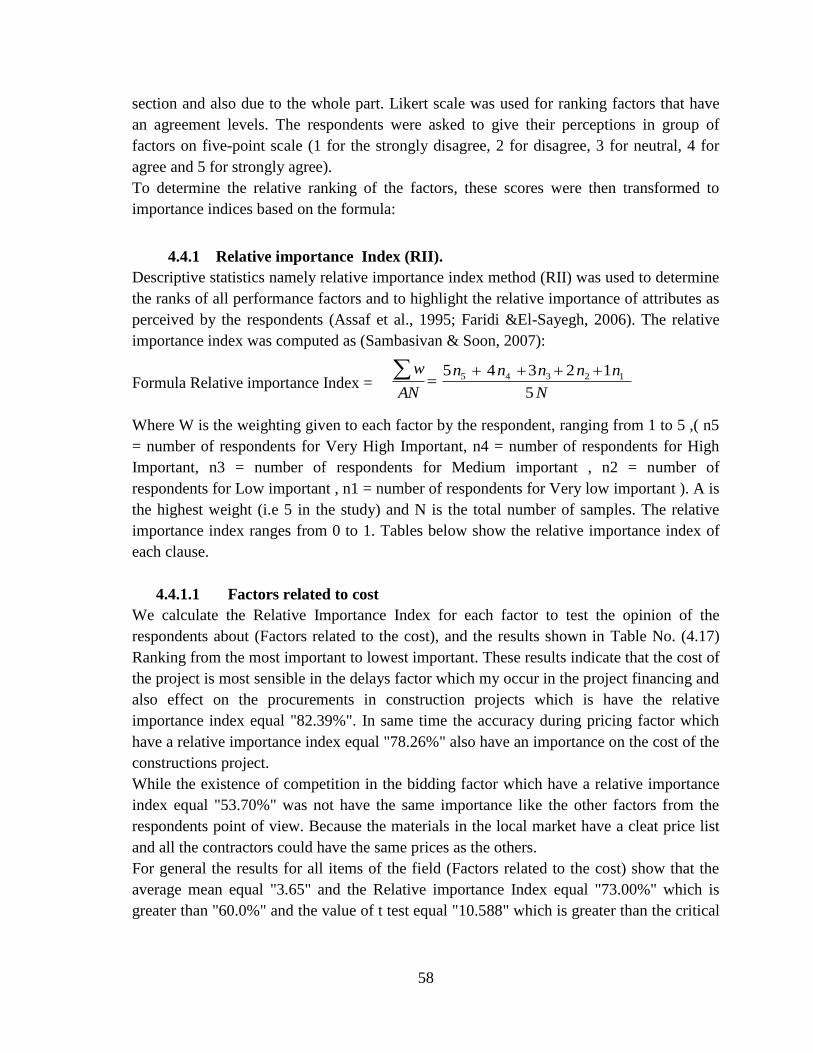
58
section and also due to the whole part. Likert scale was used for ranking factors that have
an agreement levels. The respondents were asked to give their perceptions in group of
factors on five-point scale (1 for the strongly disagree, 2 for disagree, 3 for neutral, 4 for
agree and 5 for strongly agree).
To determine the relative ranking of the factors, these scores were then transformed to
importance indices based on the formula:
4.4.1 Relative importance Index (RII).
Descriptive statistics namely relative importance index method (RII) was used to determine
the ranks of all performance factors and to highlight the relative importance of attributes as
perceived by the respondents (Assaf et al., 1995; Faridi &El-Sayegh, 2006). The relative
importance index was computed as (Sambasivan & Soon, 2007):
Formula Relative importance Index =
Where W is the weighting given to each factor by the respondent, ranging from 1 to 5 ,( n5
= number of respondents for Very High Important, n4 = number of respondents for High
Important, n3 = number of respondents for Medium important , n2 = number of
respondents for Low important , n1 = number of respondents for Very low important ). A is
the highest weight (i.e 5 in the study) and N is the total number of samples. The relative
importance index ranges from 0 to 1. Tables below show the relative importance index of
each clause.
4.4.1.1 Factors related to cost
We calculate the Relative Importance Index for each factor to test the opinion of the
respondents about (Factors related to the cost), and the results shown in Table No. (4.17)
Ranking from the most important to lowest important. These results indicate that the cost of
the project is most sensible in the delays factor which my occur in the project financing and
also effect on the procurements in construction projects which is have the relative
importance index equal "82.39%". In same time the accuracy during pricing factor which
have a relative importance index equal "78.26%" also have an importance on the cost of the
constructions project.
While the existence of competition in the bidding factor which have a relative importance
index equal "53.70%" was not have the same importance like the other factors from the
respondents point of view. Because the materials in the local market have a cleat price list
and all the contractors could have the same prices as the others.
For general the results for all items of the field (Factors related to the cost) show that the
average mean equal "3.65" and the Relative importance Index equal "73.00%" which is
greater than "60.0%" and the value of t test equal "10.588" which is greater than the critical
N
nnnnn
AN
w
5
12345 12345
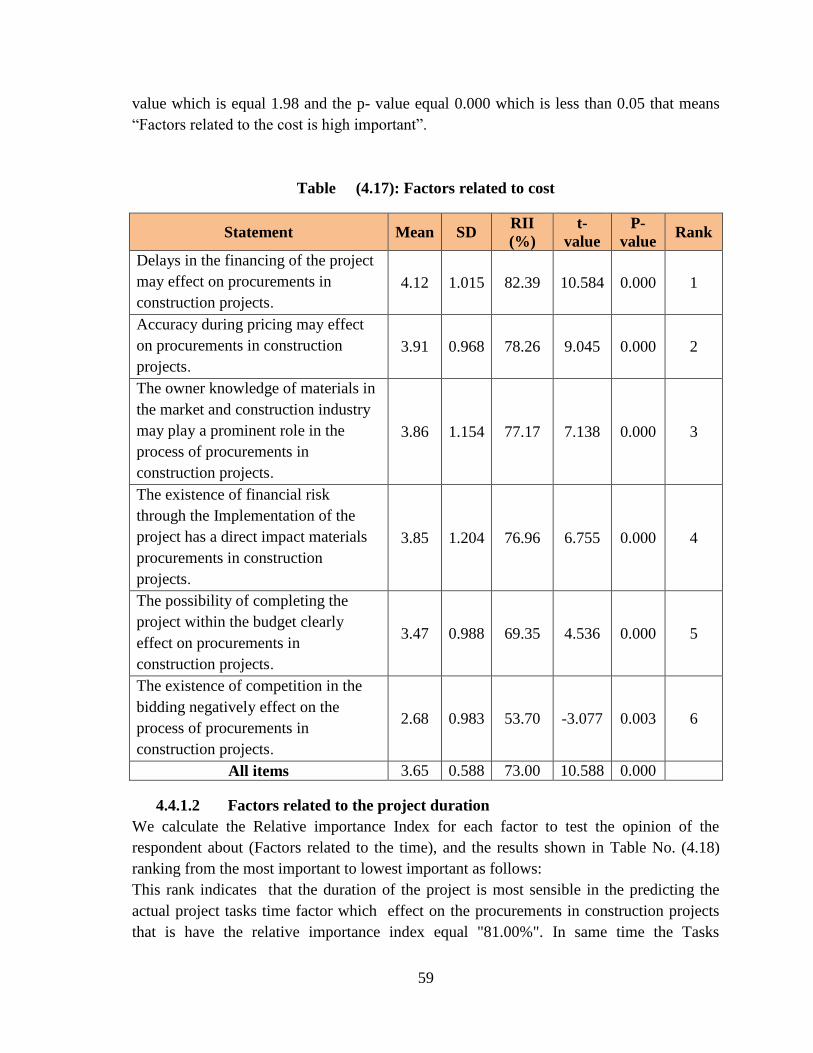
59
value which is equal 1.98 and the p- value equal 0.000 which is less than 0.05 that means
“Factors related to the cost is high important”.
Table 21(4.17): Factors related to cost
Statement Mean SD RII
(%)
t-
value
P-
value Rank
Delays in the financing of the project
may effect on procurements in
construction projects.
4.12 1.015 82.39 10.584 0.000 1
Accuracy during pricing may effect
on procurements in construction
projects.
3.91 0.968 78.26 9.045 0.000 2
The owner knowledge of materials in
the market and construction industry
may play a prominent role in the
process of procurements in
construction projects.
3.86 1.154 77.17 7.138 0.000 3
The existence of financial risk
through the Implementation of the
project has a direct impact materials
procurements in construction
projects.
3.85 1.204 76.96 6.755 0.000 4
The possibility of completing the
project within the budget clearly
effect on procurements in
construction projects.
3.47 0.988 69.35 4.536 0.000 5
The existence of competition in the
bidding negatively effect on the
process of procurements in
construction projects.
2.68 0.983 53.70 -3.077 0.003 6
All items 3.65 0.588 73.00 10.588 0.000
4.4.1.2 Factors related to the project duration
We calculate the Relative importance Index for each factor to test the opinion of the
respondent about (Factors related to the time), and the results shown in Table No. (4.18)
ranking from the most important to lowest important as follows:
This rank indicates that the duration of the project is most sensible in the predicting the
actual project tasks time factor which effect on the procurements in construction projects
that is have the relative importance index equal "81.00%". In same time the Tasks
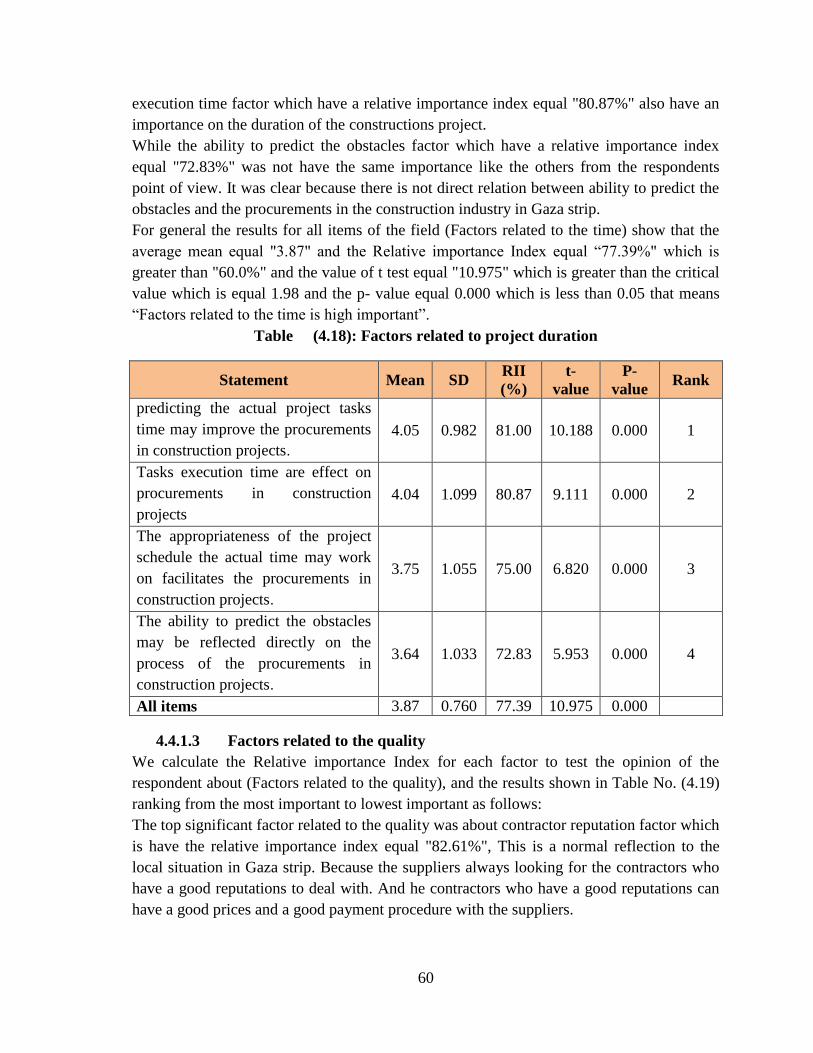
60
execution time factor which have a relative importance index equal "80.87%" also have an
importance on the duration of the constructions project.
While the ability to predict the obstacles factor which have a relative importance index
equal "72.83%" was not have the same importance like the others from the respondents
point of view. It was clear because there is not direct relation between ability to predict the
obstacles and the procurements in the construction industry in Gaza strip.
For general the results for all items of the field (Factors related to the time) show that the
average mean equal "3.87" and the Relative importance Index equal “77.39%" which is
greater than "60.0%" and the value of t test equal "10.975" which is greater than the critical
value which is equal 1.98 and the p- value equal 0.000 which is less than 0.05 that means
“Factors related to the time is high important”.
Table 22(4.18): Factors related to project duration
Statement Mean SD RII
(%)
t-
value
P-
value Rank
predicting the actual project tasks
time may improve the procurements
in construction projects.
4.05 0.982 81.00 10.188 0.000 1
Tasks execution time are effect on
procurements in construction
projects
4.04 1.099 80.87 9.111 0.000 2
The appropriateness of the project
schedule the actual time may work
on facilitates the procurements in
construction projects.
3.75 1.055 75.00 6.820 0.000 3
The ability to predict the obstacles
may be reflected directly on the
process of the procurements in
construction projects.
3.64 1.033 72.83 5.953 0.000 4
All items 3.87 0.760 77.39 10.975 0.000
4.4.1.3 Factors related to the quality
We calculate the Relative importance Index for each factor to test the opinion of the
respondent about (Factors related to the quality), and the results shown in Table No. (4.19)
ranking from the most important to lowest important as follows:
The top significant factor related to the quality was about contractor reputation factor which
is have the relative importance index equal "82.61%", This is a normal reflection to the
local situation in Gaza strip. Because the suppliers always looking for the contractors who
have a good reputations to deal with. And he contractors who have a good reputations can
have a good prices and a good payment procedure with the suppliers.
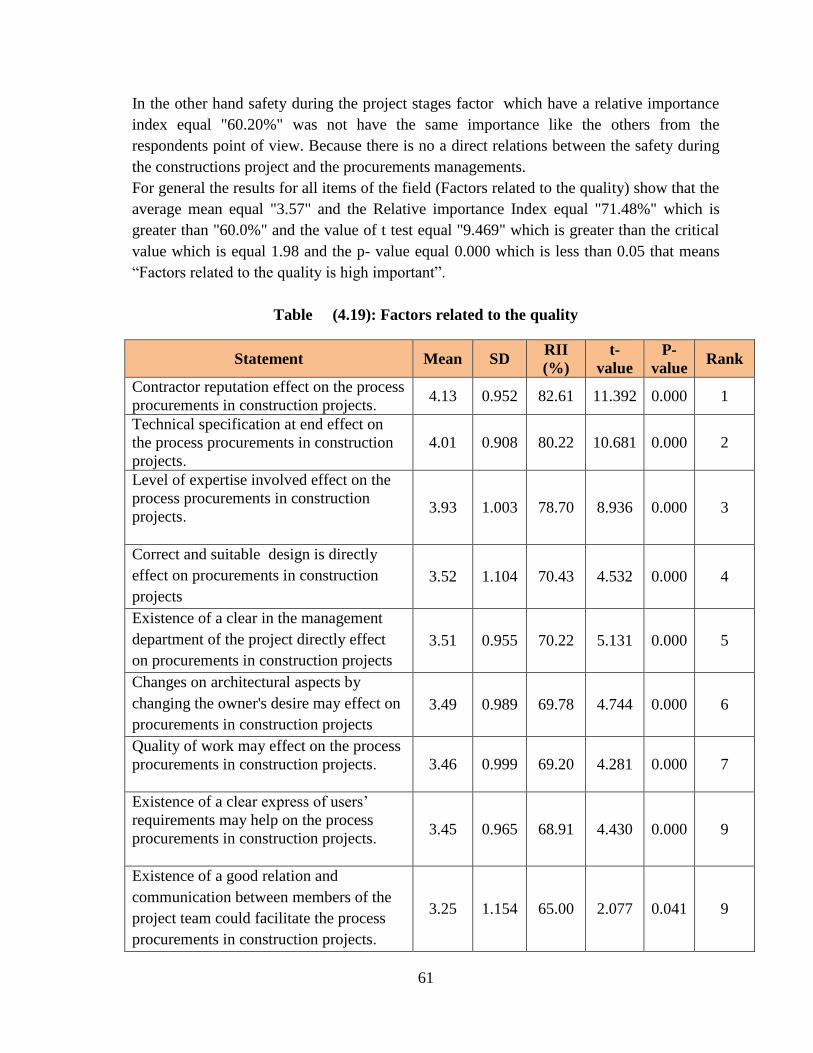
61
In the other hand safety during the project stages factor which have a relative importance
index equal "60.20%" was not have the same importance like the others from the
respondents point of view. Because there is no a direct relations between the safety during
the constructions project and the procurements managements.
For general the results for all items of the field (Factors related to the quality) show that the
average mean equal "3.57" and the Relative importance Index equal "71.48%" which is
greater than "60.0%" and the value of t test equal "9.469" which is greater than the critical
value which is equal 1.98 and the p- value equal 0.000 which is less than 0.05 that means
“Factors related to the quality is high important”.
Table 23(4.19): Factors related to the quality
Statement Mean SD RII
(%)
t-
value
P-
value Rank
Contractor reputation effect on the process
procurements in construction projects. 4.13 0.952 82.61 11.392 0.000 1
Technical specification at end effect on
the process procurements in construction
projects.
4.01 0.908 80.22 10.681 0.000 2
Level of expertise involved effect on the
process procurements in construction
projects.
3.93 1.003 78.70 8.936 0.000 3
Correct and suitable design is directly
effect on procurements in construction
projects
3.52 1.104 70.43 4.532 0.000 4
Existence of a clear in the management
department of the project directly effect
on procurements in construction projects
3.51 0.955 70.22 5.131 0.000 5
Changes on architectural aspects by
changing the owner's desire may effect on
procurements in construction projects
3.49 0.989 69.78 4.744 0.000 6
Quality of work may effect on the process
procurements in construction projects.
3.46 0.999 69.20 4.281 0.000 7
Existence of a clear express of users’
requirements may help on the process
procurements in construction projects.
3.45 0.965 68.91 4.430 0.000 9
Existence of a good relation and
communication between members of the
project team could facilitate the process
procurements in construction projects.
3.25 1.154 65.00 2.077 0.041 9
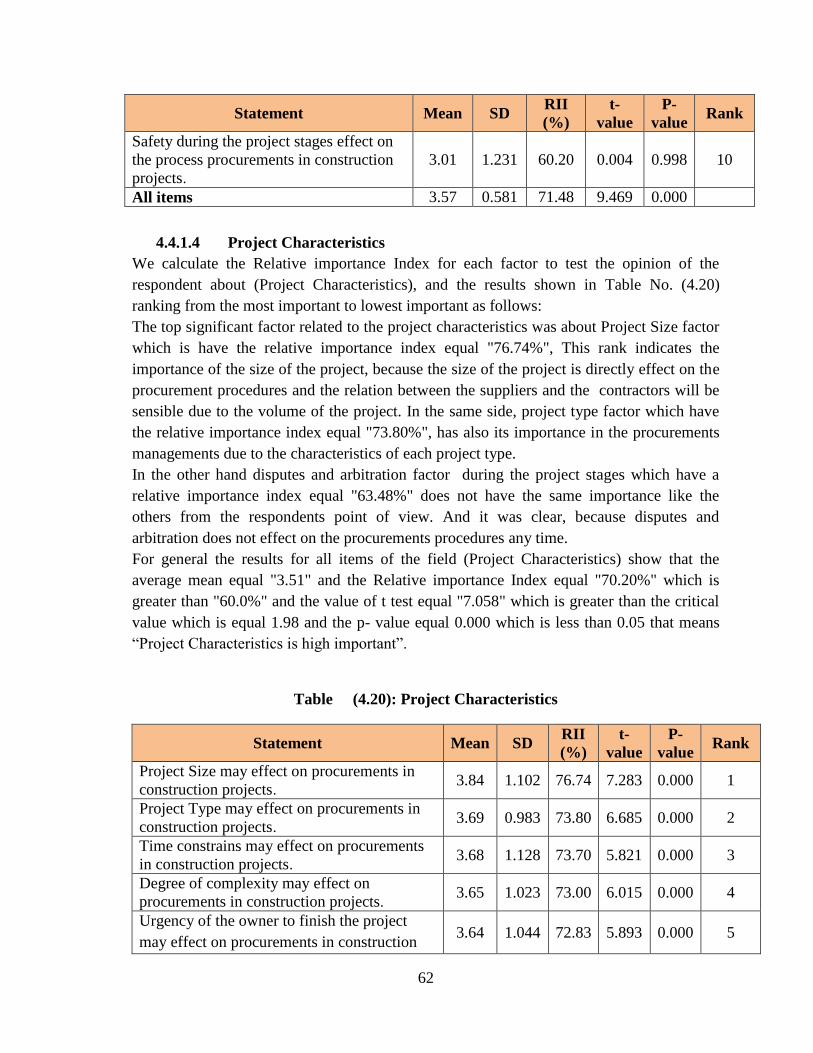
62
Statement Mean SD RII
(%)
t-
value
P-
value Rank
Safety during the project stages effect on
the process procurements in construction
projects.
3.01 1.231 60.20 0.004 0.998 10
All items 3.57 0.581 71.48 9.469 0.000
4.4.1.4 Project Characteristics
We calculate the Relative importance Index for each factor to test the opinion of the
respondent about (Project Characteristics), and the results shown in Table No. (4.20)
ranking from the most important to lowest important as follows:
The top significant factor related to the project characteristics was about Project Size factor
which is have the relative importance index equal "76.74%", This rank indicates the
importance of the size of the project, because the size of the project is directly effect on the
procurement procedures and the relation between the suppliers and the contractors will be
sensible due to the volume of the project. In the same side, project type factor which have
the relative importance index equal "73.80%", has also its importance in the procurements
managements due to the characteristics of each project type.
In the other hand disputes and arbitration factor during the project stages which have a
relative importance index equal "63.48%" does not have the same importance like the
others from the respondents point of view. And it was clear, because disputes and
arbitration does not effect on the procurements procedures any time.
For general the results for all items of the field (Project Characteristics) show that the
average mean equal "3.51" and the Relative importance Index equal "70.20%" which is
greater than "60.0%" and the value of t test equal "7.058" which is greater than the critical
value which is equal 1.98 and the p- value equal 0.000 which is less than 0.05 that means
“Project Characteristics is high important”.
Table 24(4.20): Project Characteristics
Statement Mean SD RII
(%)
t-
value
P-
value Rank
Project Size may effect on procurements in
construction projects. 3.84 1.102 76.74 7.283 0.000 1
Project Type may effect on procurements in
construction projects. 3.69 0.983 73.80 6.685 0.000 2
Time constrains may effect on procurements
in construction projects. 3.68 1.128 73.70 5.821 0.000 3
Degree of complexity may effect on
procurements in construction projects. 3.65 1.023 73.00 6.015 0.000 4
Urgency of the owner to finish the project
may effect on procurements in construction 3.64 1.044 72.83 5.893 0.000 5
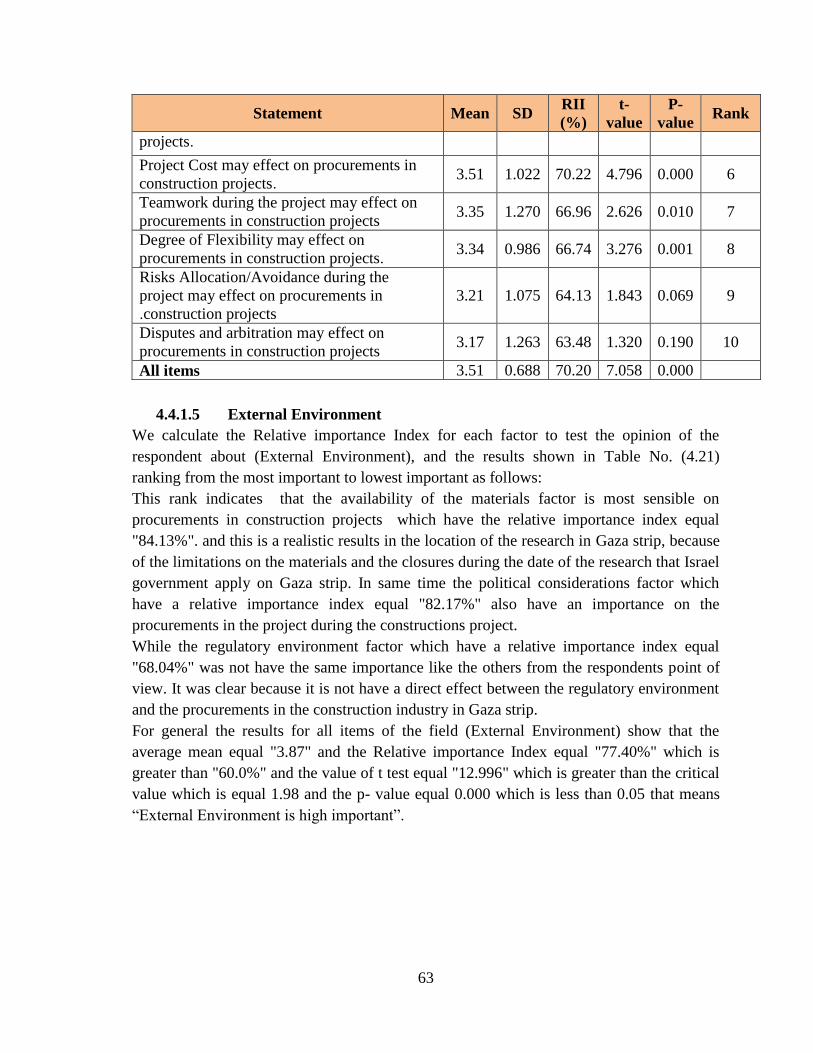
63
Statement Mean SD RII
(%)
t-
value
P-
value Rank
projects.
Project Cost may effect on procurements in
construction projects. 3.51 1.022 70.22 4.796 0.000 6
Teamwork during the project may effect on
procurements in construction projects 3.35 1.270 66.96 2.626 0.010 7
Degree of Flexibility may effect on
procurements in construction projects. 3.34 0.986 66.74 3.276 0.001 8
Risks Allocation/Avoidance during the
project may effect on procurements in
construction projects.
3.21 1.075 64.13 1.843 0.069 9
Disputes and arbitration may effect on
procurements in construction projects 3.17 1.263 63.48 1.320 0.190 10
All items 3.51 0.688 70.20 7.058 0.000
4.4.1.5 External Environment
We calculate the Relative importance Index for each factor to test the opinion of the
respondent about (External Environment), and the results shown in Table No. (4.21)
ranking from the most important to lowest important as follows:
This rank indicates that the availability of the materials factor is most sensible on
procurements in construction projects which have the relative importance index equal
"84.13%". and this is a realistic results in the location of the research in Gaza strip, because
of the limitations on the materials and the closures during the date of the research that Israel
government apply on Gaza strip. In same time the political considerations factor which
have a relative importance index equal "82.17%" also have an importance on the
procurements in the project during the constructions project.
While the regulatory environment factor which have a relative importance index equal
"68.04%" was not have the same importance like the others from the respondents point of
view. It was clear because it is not have a direct effect between the regulatory environment
and the procurements in the construction industry in Gaza strip.
For general the results for all items of the field (External Environment) show that the
average mean equal "3.87" and the Relative importance Index equal "77.40%" which is
greater than "60.0%" and the value of t test equal "12.996" which is greater than the critical
value which is equal 1.98 and the p- value equal 0.000 which is less than 0.05 that means
“External Environment is high important”.
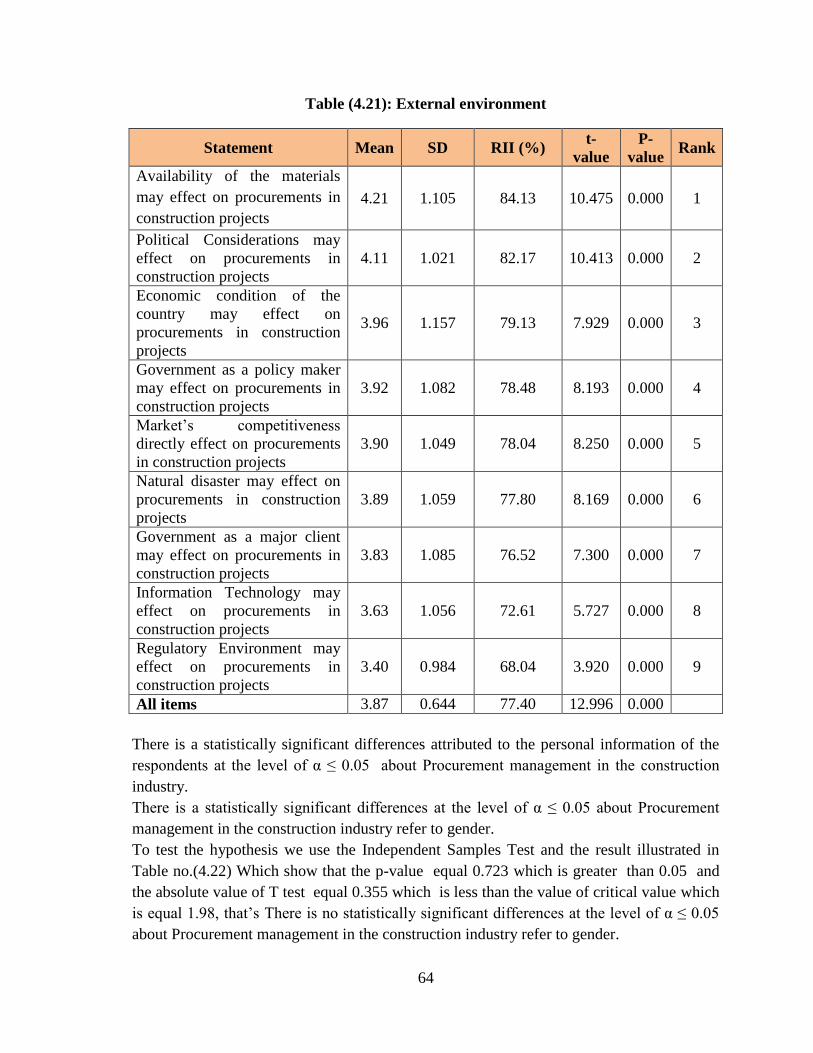
64
Table (4.21): External environment
Statement Mean SD RII (%) t-
value
P-
value Rank
Availability of the materials
may effect on procurements in
construction projects
4.21 1.105 84.13 10.475 0.000 1
Political Considerations may
effect on procurements in
construction projects
4.11 1.021 82.17 10.413 0.000 2
Economic condition of the
country may effect on
procurements in construction
projects
3.96 1.157 79.13 7.929 0.000 3
Government as a policy maker
may effect on procurements in
construction projects
3.92 1.082 78.48 8.193 0.000 4
Market’s competitiveness
directly effect on procurements
in construction projects
3.90 1.049 78.04 8.250 0.000 5
Natural disaster may effect on
procurements in construction
projects
3.89 1.059 77.80 8.169 0.000 6
Government as a major client
may effect on procurements in
construction projects
3.83 1.085 76.52 7.300 0.000 7
Information Technology may
effect on procurements in
construction projects
3.63 1.056 72.61 5.727 0.000 8
Regulatory Environment may
effect on procurements in
construction projects
3.40 0.984 68.04 3.920 0.000 9
All items 3.87 0.644 77.40 12.996 0.000
There is a statistically significant differences attributed to the personal information of the
respondents at the level of α ≤ 0.05 about Procurement management in the construction
industry.
There is a statistically significant differences at the level of α ≤ 0.05 about Procurement
management in the construction industry refer to gender.
To test the hypothesis we use the Independent Samples Test and the result illustrated in
Table no.(4.22) Which show that the p-value equal 0.723 which is greater than 0.05 and
the absolute value of T test equal 0.355 which is less than the value of critical value which
is equal 1.98, that’s There is no statistically significant differences at the level of α ≤ 0.05
about Procurement management in the construction industry refer to gender.
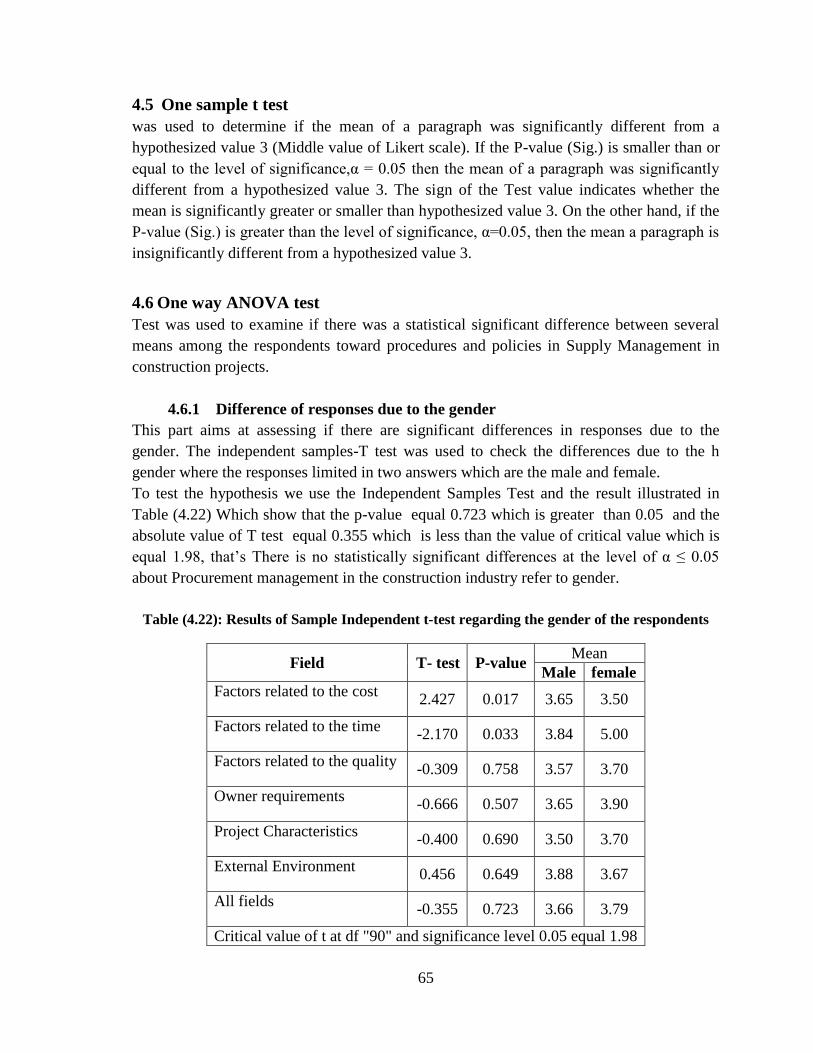
65
4.5 One sample t test
was used to determine if the mean of a paragraph was significantly different from a
hypothesized value 3 (Middle value of Likert scale). If the P-value (Sig.) is smaller than or
equal to the level of significance,α = 0.05 then the mean of a paragraph was significantly
different from a hypothesized value 3. The sign of the Test value indicates whether the
mean is significantly greater or smaller than hypothesized value 3. On the other hand, if the
P-value (Sig.) is greater than the level of significance, α=0.05, then the mean a paragraph is
insignificantly different from a hypothesized value 3.
4.6 One way ANOVA test
Test was used to examine if there was a statistical significant difference between several
means among the respondents toward procedures and policies in Supply Management in
construction projects.
4.6.1 Difference of responses due to the gender
This part aims at assessing if there are significant differences in responses due to the
gender. The independent samples-T test was used to check the differences due to the h
gender where the responses limited in two answers which are the male and female.
To test the hypothesis we use the Independent Samples Test and the result illustrated in
Table (4.22) Which show that the p-value equal 0.723 which is greater than 0.05 and the
absolute value of T test equal 0.355 which is less than the value of critical value which is
equal 1.98, that’s There is no statistically significant differences at the level of α ≤ 0.05
about Procurement management in the construction industry refer to gender.
Table (4.22): Results of Sample Independent t-test regarding the gender of the respondents
Field T- test P-value Mean
Male female
Factors related to the cost 2.427 0.017 3.65 3.50
Factors related to the time -2.170 0.033 3.84 5.00
Factors related to the quality -0.309 0.758 3.57 3.70
Owner requirements -0.666 0.507 3.65 3.90
Project Characteristics -0.400 0.690 3.50 3.70
External Environment 0.456 0.649 3.88 3.67
All fields -0.355 0.723 3.66 3.79
Critical value of t at df "90" and significance level 0.05 equal 1.98
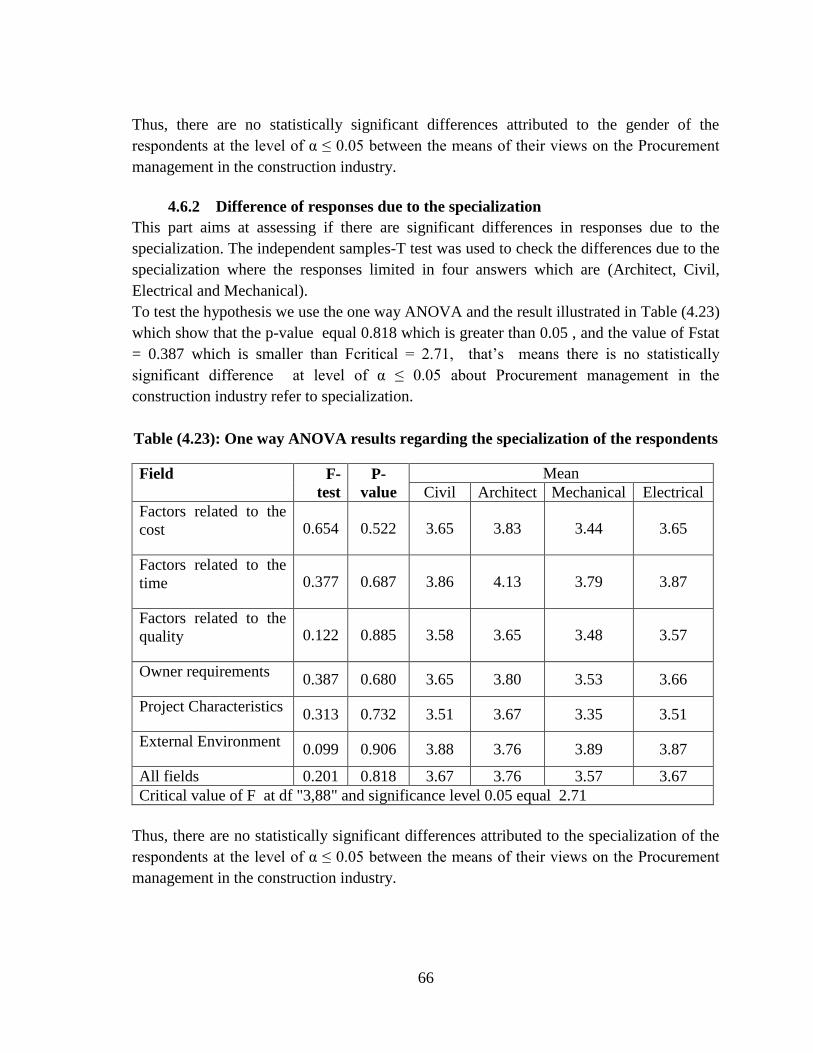
66
Thus, there are no statistically significant differences attributed to the gender of the
respondents at the level of α ≤ 0.05 between the means of their views on the Procurement
management in the construction industry.
4.6.2 Difference of responses due to the specialization
This part aims at assessing if there are significant differences in responses due to the
specialization. The independent samples-T test was used to check the differences due to the
specialization where the responses limited in four answers which are (Architect, Civil,
Electrical and Mechanical).
To test the hypothesis we use the one way ANOVA and the result illustrated in Table (4.23)
which show that the p-value equal 0.818 which is greater than 0.05 , and the value of Fstat
= 0.387 which is smaller than Fcritical = 2.71, that’s means there is no statistically
significant difference at level of α ≤ 0.05 about Procurement management in the
construction industry refer to specialization.
Table (4.23): One way ANOVA results regarding the specialization of the respondents
Field F-
test
P-
value
Mean
Civil Architect Mechanical Electrical
Factors related to the
cost 0.654 0.522 3.65 3.83 3.44 3.65
Factors related to the
time 0.377 0.687 3.86 4.13 3.79 3.87
Factors related to the
quality 0.122 0.885 3.58 3.65 3.48 3.57
Owner requirements 0.387 0.680 3.65 3.80 3.53 3.66
Project Characteristics 0.313 0.732 3.51 3.67 3.35 3.51
External Environment 0.099 0.906 3.88 3.76 3.89 3.87
All fields 0.201 0.818 3.67 3.76 3.57 3.67
Critical value of F at df "3,88" and significance level 0.05 equal 2.71
Thus, there are no statistically significant differences attributed to the specialization of the
respondents at the level of α ≤ 0.05 between the means of their views on the Procurement
management in the construction industry.
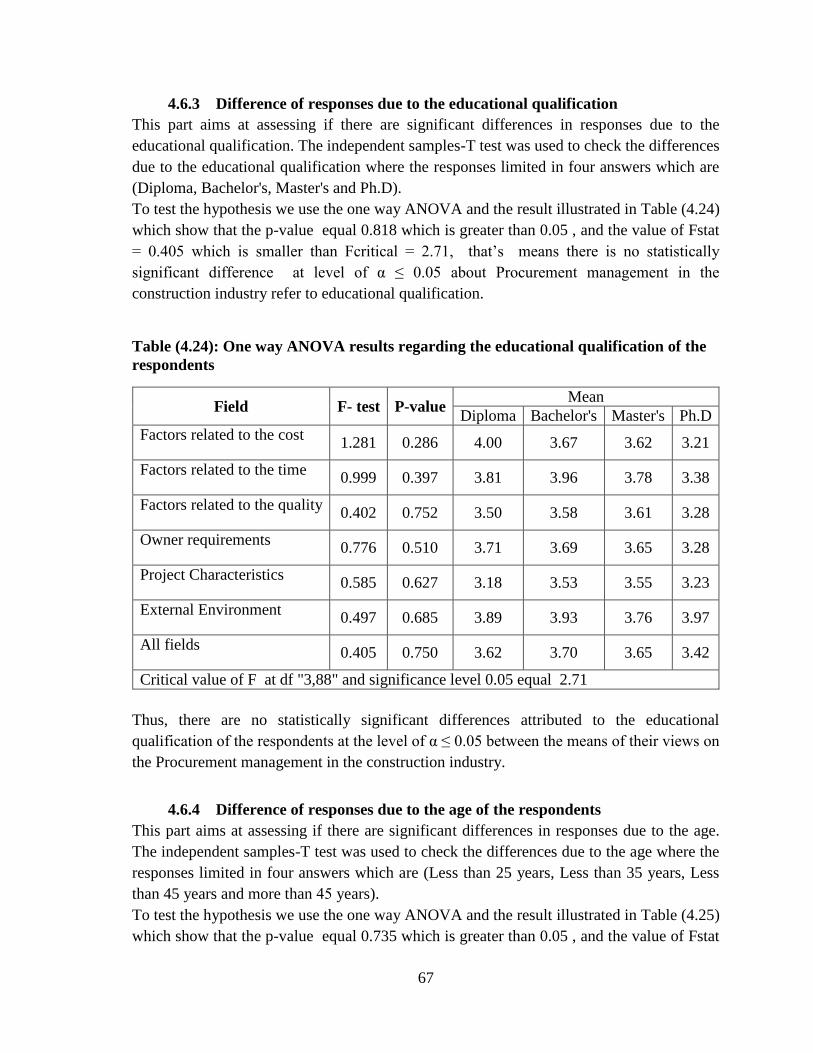
67
4.6.3 Difference of responses due to the educational qualification
This part aims at assessing if there are significant differences in responses due to the
educational qualification. The independent samples-T test was used to check the differences
due to the educational qualification where the responses limited in four answers which are
(Diploma, Bachelor's, Master's and Ph.D).
To test the hypothesis we use the one way ANOVA and the result illustrated in Table (4.24)
which show that the p-value equal 0.818 which is greater than 0.05 , and the value of Fstat
= 0.405 which is smaller than Fcritical = 2.71, that’s means there is no statistically
significant difference at level of α ≤ 0.05 about Procurement management in the
construction industry refer to educational qualification.
Table (4.24): One way ANOVA results regarding the educational qualification of the
respondents
Field F- test P-value Mean
Diploma Bachelor's Master's Ph.D
Factors related to the cost 1.281 0.286 4.00 3.67 3.62 3.21
Factors related to the time 0.999 0.397 3.81 3.96 3.78 3.38
Factors related to the quality 0.402 0.752 3.50 3.58 3.61 3.28
Owner requirements 0.776 0.510 3.71 3.69 3.65 3.28
Project Characteristics 0.585 0.627 3.18 3.53 3.55 3.23
External Environment 0.497 0.685 3.89 3.93 3.76 3.97
All fields 0.405 0.750 3.62 3.70 3.65 3.42
Critical value of F at df "3,88" and significance level 0.05 equal 2.71
Thus, there are no statistically significant differences attributed to the educational
qualification of the respondents at the level of α ≤ 0.05 between the means of their views on
the Procurement management in the construction industry.
4.6.4 Difference of responses due to the age of the respondents
This part aims at assessing if there are significant differences in responses due to the age.
The independent samples-T test was used to check the differences due to the age where the
responses limited in four answers which are (Less than 25 years, Less than 35 years, Less
than 45 years and more than 45 years).
To test the hypothesis we use the one way ANOVA and the result illustrated in Table (4.25)
which show that the p-value equal 0.735 which is greater than 0.05 , and the value of Fstat
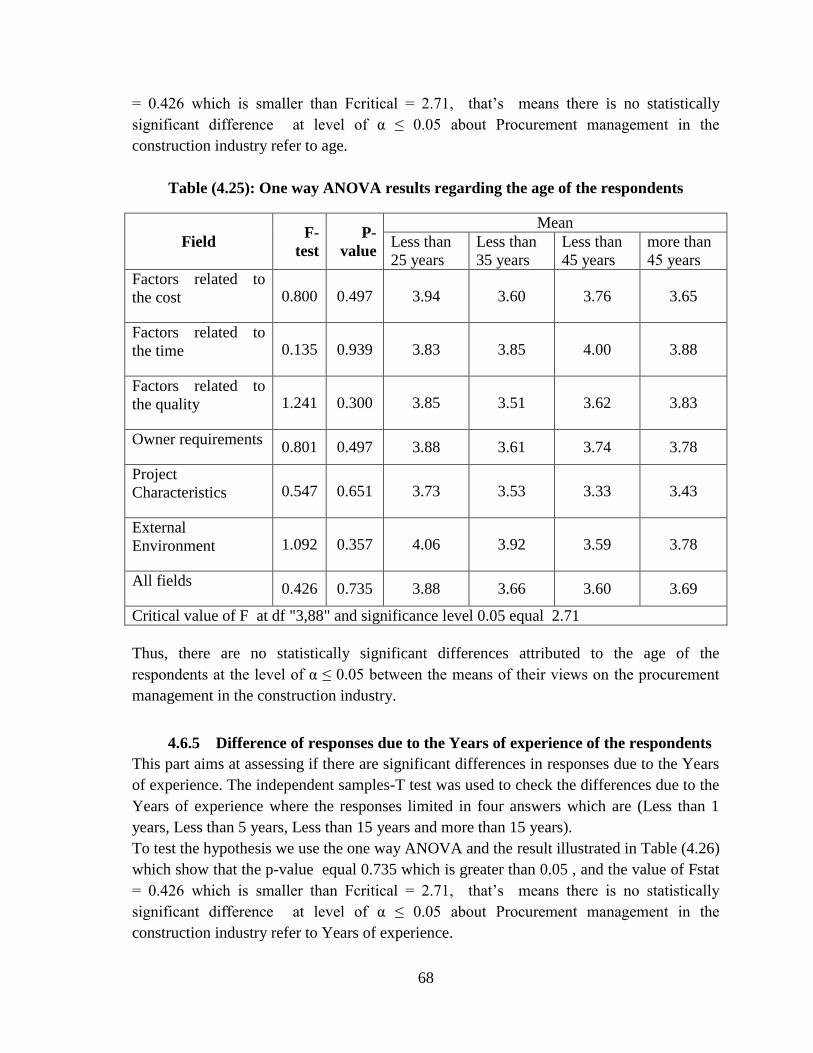
68
= 0.426 which is smaller than Fcritical = 2.71, that’s means there is no statistically
significant difference at level of α ≤ 0.05 about Procurement management in the
construction industry refer to age.
Table (4.25): One way ANOVA results regarding the age of the respondents
Field F-
test
P-
value
Mean
Less than
25 years
Less than
35 years
Less than
45 years
more than
45 years
Factors related to
the cost 0.800 0.497 3.94 3.60 3.76 3.65
Factors related to
the time 0.135 0.939 3.83 3.85 4.00 3.88
Factors related to
the quality 1.241 0.300 3.85 3.51 3.62 3.83
Owner requirements 0.801 0.497 3.88 3.61 3.74 3.78
Project
Characteristics 0.547 0.651 3.73 3.53 3.33 3.43
External
Environment 1.092 0.357 4.06 3.92 3.59 3.78
All fields 0.426 0.735 3.88 3.66 3.60 3.69
Critical value of F at df "3,88" and significance level 0.05 equal 2.71
Thus, there are no statistically significant differences attributed to the age of the
respondents at the level of α ≤ 0.05 between the means of their views on the procurement
management in the construction industry.
4.6.5 Difference of responses due to the Years of experience of the respondents
This part aims at assessing if there are significant differences in responses due to the Years
of experience. The independent samples-T test was used to check the differences due to the
Years of experience where the responses limited in four answers which are (Less than 1
years, Less than 5 years, Less than 15 years and more than 15 years).
To test the hypothesis we use the one way ANOVA and the result illustrated in Table (4.26)
which show that the p-value equal 0.735 which is greater than 0.05 , and the value of Fstat
= 0.426 which is smaller than Fcritical = 2.71, that’s means there is no statistically
significant difference at level of α ≤ 0.05 about Procurement management in the
construction industry refer to Years of experience.
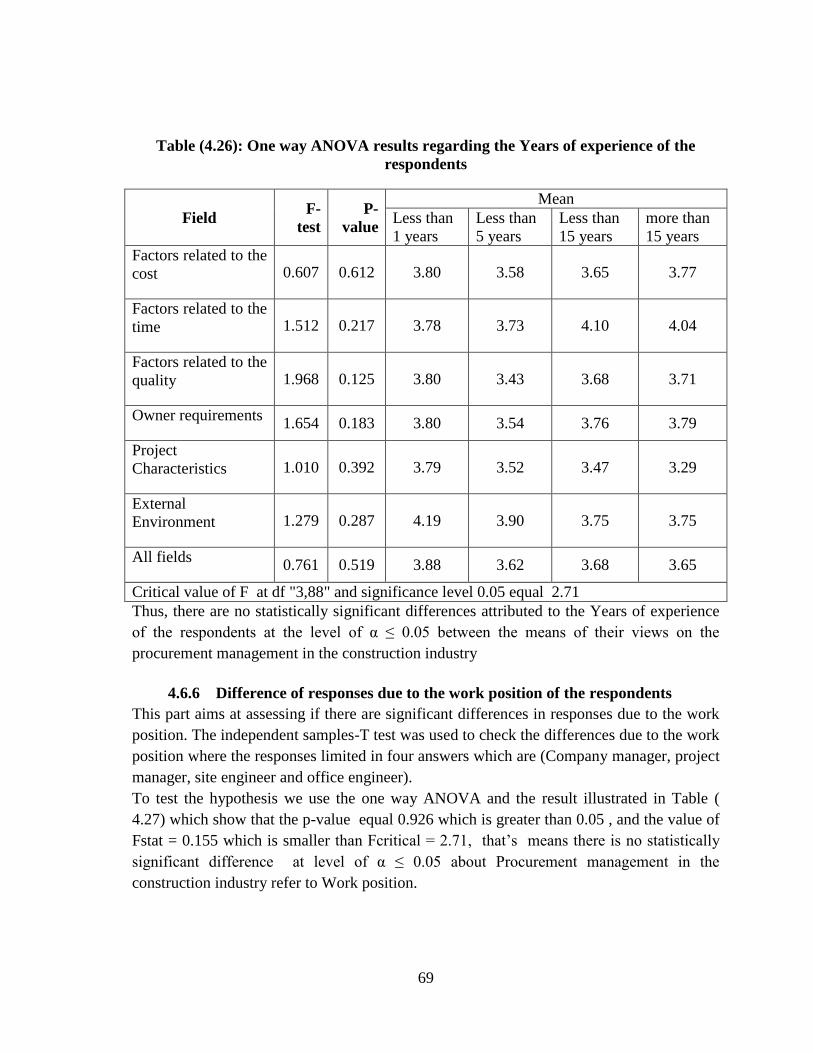
69
Table (4.26): One way ANOVA results regarding the Years of experience of the
respondents
Field F-
test
P-
value
Mean
Less than
1 years
Less than
5 years
Less than
15 years
more than
15 years
Factors related to the
cost 0.607 0.612 3.80 3.58 3.65 3.77
Factors related to the
time 1.512 0.217 3.78 3.73 4.10 4.04
Factors related to the
quality 1.968 0.125 3.80 3.43 3.68 3.71
Owner requirements 1.654 0.183 3.80 3.54 3.76 3.79
Project
Characteristics 1.010 0.392 3.79 3.52 3.47 3.29
External
Environment 1.279 0.287 4.19 3.90 3.75 3.75
All fields 0.761 0.519 3.88 3.62 3.68 3.65
Critical value of F at df "3,88" and significance level 0.05 equal 2.71
Thus, there are no statistically significant differences attributed to the Years of experience
of the respondents at the level of α ≤ 0.05 between the means of their views on the
procurement management in the construction industry
4.6.6 Difference of responses due to the work position of the respondents
This part aims at assessing if there are significant differences in responses due to the work
position. The independent samples-T test was used to check the differences due to the work
position where the responses limited in four answers which are (Company manager, project
manager, site engineer and office engineer).
To test the hypothesis we use the one way ANOVA and the result illustrated in Table (
4.27) which show that the p-value equal 0.926 which is greater than 0.05 , and the value of
Fstat = 0.155 which is smaller than Fcritical = 2.71, that’s means there is no statistically
significant difference at level of α ≤ 0.05 about Procurement management in the
construction industry refer to Work position.
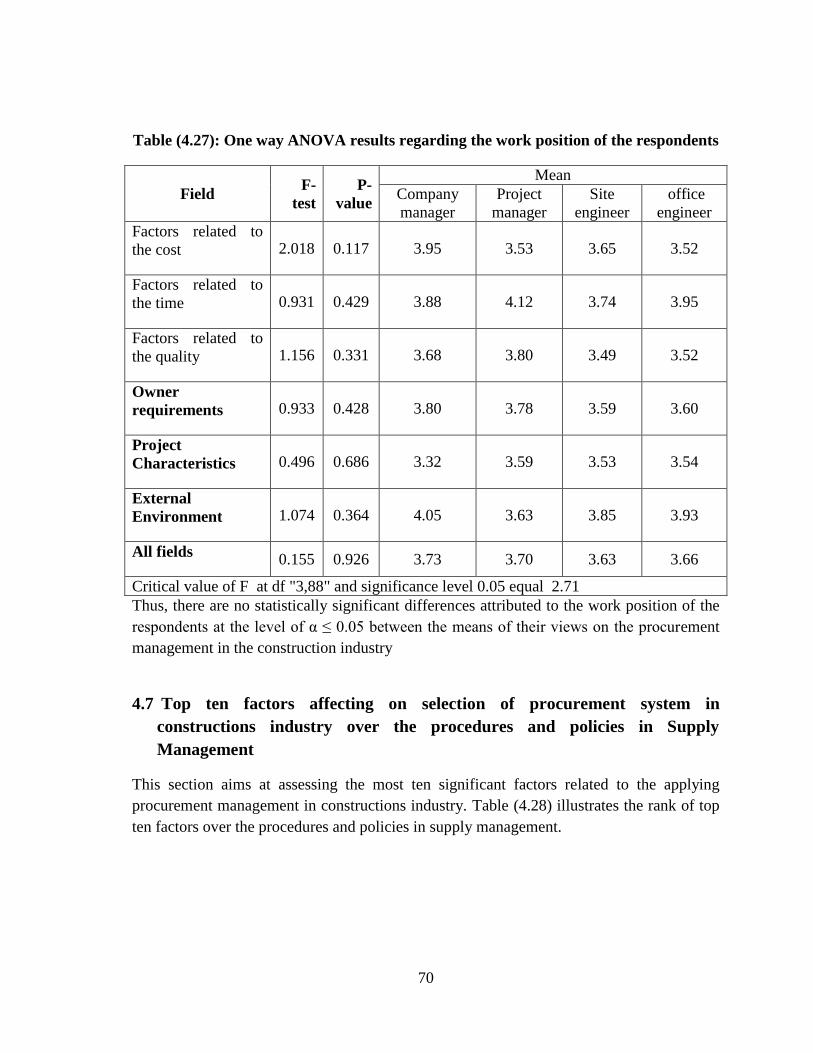
70
Table (4.27): One way ANOVA results regarding the work position of the respondents
Field F-
test
P-
value
Mean
Company
manager
Project
manager
Site
engineer
office
engineer
Factors related to
the cost 2.018 0.117 3.95 3.53 3.65 3.52
Factors related to
the time 0.931 0.429 3.88 4.12 3.74 3.95
Factors related to
the quality 1.156 0.331 3.68 3.80 3.49 3.52
Owner
requirements 0.933 0.428 3.80 3.78 3.59 3.60
Project
Characteristics 0.496 0.686 3.32 3.59 3.53 3.54
External
Environment 1.074 0.364 4.05 3.63 3.85 3.93
All fields 0.155 0.926 3.73 3.70 3.63 3.66
Critical value of F at df "3,88" and significance level 0.05 equal 2.71
Thus, there are no statistically significant differences attributed to the work position of the
respondents at the level of α ≤ 0.05 between the means of their views on the procurement
management in the construction industry
4.7 Top ten factors affecting on selection of procurement system in
constructions industry over the procedures and policies in Supply
Management
This section aims at assessing the most ten significant factors related to the applying
procurement management in constructions industry. Table (4.28) illustrates the rank of top
ten factors over the procedures and policies in supply management.
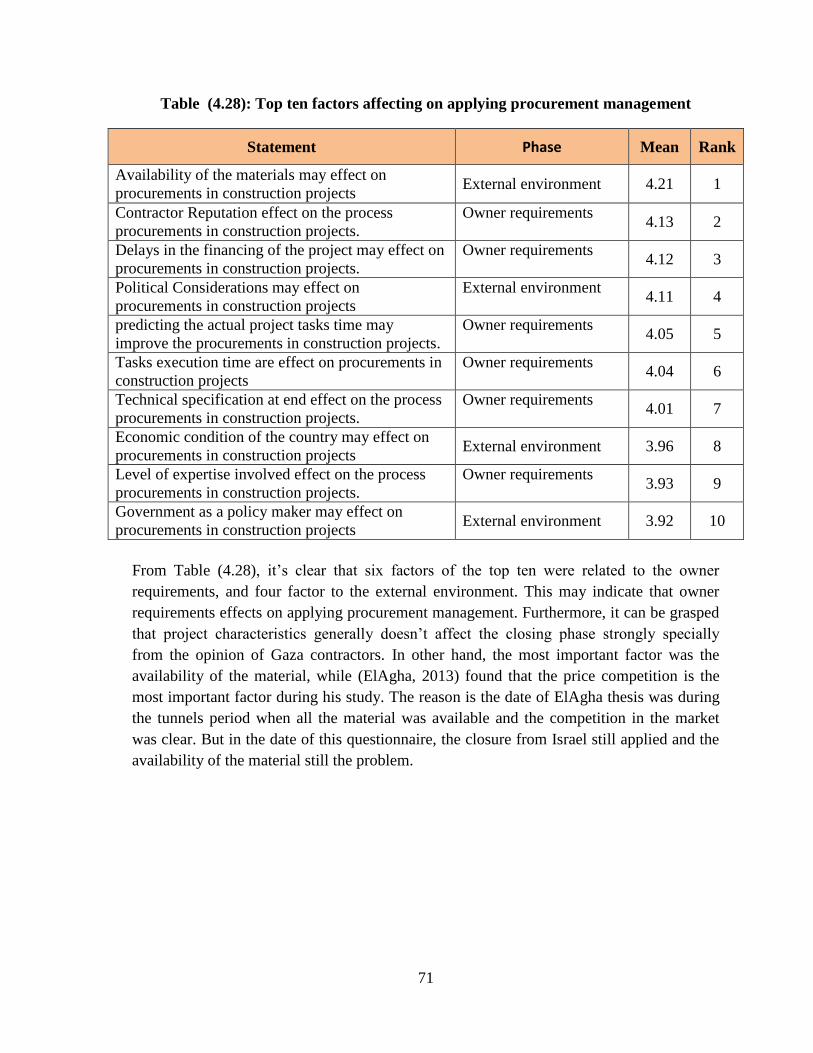
71
Table (4.28): Top ten factors affecting on applying procurement management
Statement Phase Mean Rank
Availability of the materials may effect on
procurements in construction projects External environment 4.21 1
Contractor Reputation effect on the process
procurements in construction projects.
Owner requirements
4.13 2
Delays in the financing of the project may effect on
procurements in construction projects.
Owner requirements
4.12 3
Political Considerations may effect on
procurements in construction projects
External environment
4.11 4
predicting the actual project tasks time may
improve the procurements in construction projects.
Owner requirements
4.05 5
Tasks execution time are effect on procurements in
construction projects
Owner requirements
4.04 6
Technical specification at end effect on the process
procurements in construction projects.
Owner requirements
4.01 7
Economic condition of the country may effect on
procurements in construction projects External environment 3.96 8
Level of expertise involved effect on the process
procurements in construction projects.
Owner requirements
3.93 9
Government as a policy maker may effect on
procurements in construction projects External environment 3.92 10
From Table (4.28), it’s clear that six factors of the top ten were related to the owner
requirements, and four factor to the external environment. This may indicate that owner
requirements effects on applying procurement management. Furthermore, it can be grasped
that project characteristics generally doesn’t affect the closing phase strongly specially
from the opinion of Gaza contractors. In other hand, the most important factor was the
availability of the material, while (ElAgha, 2013) found that the price competition is the
most important factor during his study. The reason is the date of ElAgha thesis was during
the tunnels period when all the material was available and the competition in the market
was clear. But in the date of this questionnaire, the closure from Israel still applied and the
availability of the material still the problem.

72
Chapter 5
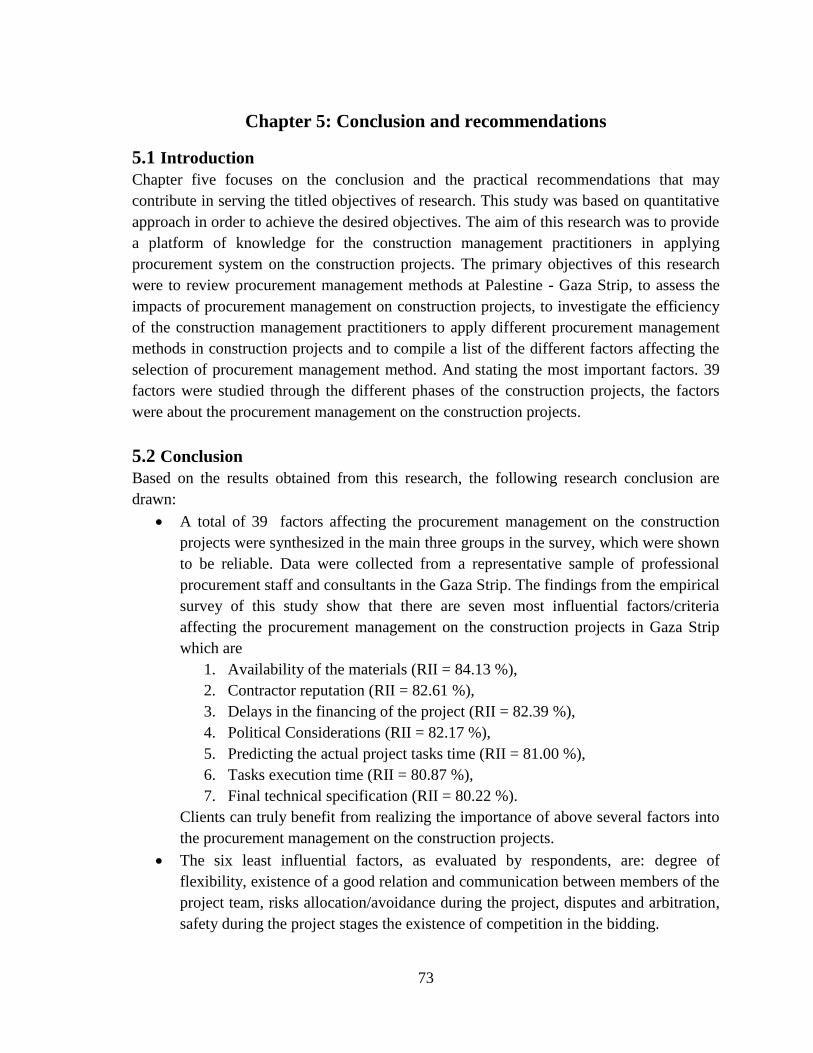
73
Chapter 5: Conclusion and recommendations
5.1 Introduction
Chapter five focuses on the conclusion and the practical recommendations that may
contribute in serving the titled objectives of research. This study was based on quantitative
approach in order to achieve the desired objectives. The aim of this research was to provide
a platform of knowledge for the construction management practitioners in applying
procurement system on the construction projects. The primary objectives of this research
were to review procurement management methods at Palestine - Gaza Strip, to assess the
impacts of procurement management on construction projects, to investigate the efficiency
of the construction management practitioners to apply different procurement management
methods in construction projects and to compile a list of the different factors affecting the
selection of procurement management method. And stating the most important factors. 39
factors were studied through the different phases of the construction projects, the factors
were about the procurement management on the construction projects.
5.2 Conclusion
Based on the results obtained from this research, the following research conclusion are
drawn:
A total of 39 factors affecting the procurement management on the construction
projects were synthesized in the main three groups in the survey, which were shown
to be reliable. Data were collected from a representative sample of professional
procurement staff and consultants in the Gaza Strip. The findings from the empirical
survey of this study show that there are seven most influential factors/criteria
affecting the procurement management on the construction projects in Gaza Strip
which are
1. Availability of the materials (RII = 84.13 %),
2. Contractor reputation (RII = 82.61 %),
3. Delays in the financing of the project (RII = 82.39 %),
4. Political Considerations (RII = 82.17 %),
5. Predicting the actual project tasks time (RII = 81.00 %),
6. Tasks execution time (RII = 80.87 %),
7. Final technical specification (RII = 80.22 %).
Clients can truly benefit from realizing the importance of above several factors into
the procurement management on the construction projects.
The six least influential factors, as evaluated by respondents, are: degree of
flexibility, existence of a good relation and communication between members of the
project team, risks allocation/avoidance during the project, disputes and arbitration,
safety during the project stages the existence of competition in the bidding.
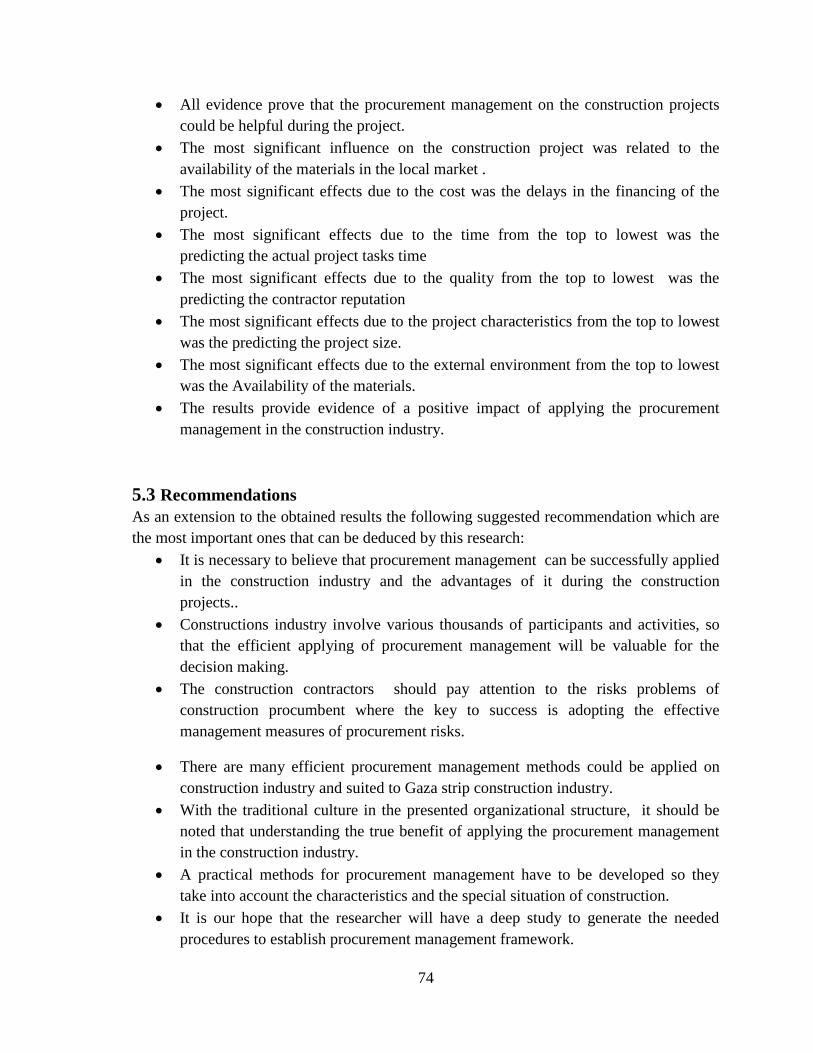
74
All evidence prove that the procurement management on the construction projects
could be helpful during the project.
The most significant influence on the construction project was related to the
availability of the materials in the local market .
The most significant effects due to the cost was the delays in the financing of the
project.
The most significant effects due to the time from the top to lowest was the
predicting the actual project tasks time
The most significant effects due to the quality from the top to lowest was the
predicting the contractor reputation
The most significant effects due to the project characteristics from the top to lowest
was the predicting the project size.
The most significant effects due to the external environment from the top to lowest
was the Availability of the materials.
The results provide evidence of a positive impact of applying the procurement
management in the construction industry.
5.3 Recommendations
As an extension to the obtained results the following suggested recommendation which are
the most important ones that can be deduced by this research:
It is necessary to believe that procurement management can be successfully applied
in the construction industry and the advantages of it during the construction
projects..
Constructions industry involve various thousands of participants and activities, so
that the efficient applying of procurement management will be valuable for the
decision making.
The construction contractors should pay attention to the risks problems of
construction procumbent where the key to success is adopting the effective
management measures of procurement risks.
There are many efficient procurement management methods could be applied on
construction industry and suited to Gaza strip construction industry.
With the traditional culture in the presented organizational structure, it should be
noted that understanding the true benefit of applying the procurement management
in the construction industry.
A practical methods for procurement management have to be developed so they
take into account the characteristics and the special situation of construction.
It is our hope that the researcher will have a deep study to generate the needed
procedures to establish procurement management framework.

75
References
76
References
Alhazmi, T., & McCaffer, R. (2000, June). Project Procurement System Selection Model.
Journal of Construction Engineering and Management, 126(3), 176-184.
Al-Shorafa, A. (2009). A Framework For Construction Materials Supply Chain Process in
the Local Construction Industry. Gaza - PALESTINE: Islamic University of Gaza.
Bennett, J., & Grice, A. (1990). Procurement systems for building, Quantity Surveying
Techniques — New Directions. Oxford: BSP Professional Books.
Bennett, M. K.,Erondu, N. E., and kennedy, M. B. (1983) . J. Biol. Chem. 258, 12735-
12744.
Bresnen, M., & Marshall, N. (2002). The engineering or evolution of co-operation? A tale
of two partnering projects. 20(7), 497-505.
Business Roundtable. (1982). Contractual Arrangements. New York.
Cartlidge, D. (2002). New aspects of quantity surveying practice.
Chan, A., Chan, D., & Ho, K. (n.d.).(2003). An empirical study of the benefits of
construction partnering in Hong Kong. 21(5), 523-533.
Chua, D., Kog, Y., & Loh, P. (1999). Critical success factors for different project
objectives. Journal of Construction Engineering and Management, ASCE, 125(3),
142-150.
CIPS Australia. (2007). A Short History of Procurement.
Crossman, 2013 N.D. Crossman, B. Burkhard, S. Nedkov, L. Willemen, K. Petz, I. Palomo,
E.G. Drakou, B. Martín-Lopez, T. McPhearson, K. Boyanova, R. Alkemade, B.
Egoh, M.B. Dunbar, J. Maes
Davidson, C., Johnson , C., Lizarralde , G., & Sliwinski, A. (2007). Truths and Myths about
Community Participation in Post Disaster Housing Projects. Habitat International,
31, 100-115.
Davis, P., Love, P., & Baccarini, D. (2008). Building Procurement Methods. AUSTRALIA:
CRC Construction Innovation.
ElAgha, O. (2013). Factors affecting the selection of procurement methods in the
construction projects in Gaza Strip. Gaza: The Islamic University of Gaza.
Ellram, L., & Carr, A. (1994). Strategic purchasing: A history and review of the literature.
International Journal of Purchasing and Materials Management, 30(2), 10-18.
Elmer , B., & Christine , H. (2013). Collaborative Procurement: A Relational View of
Buyer–Buyer Relationships.
77
Enshassi, A., & Modough, Z. (2012). Case studies in awarding the lowest bid price in
construction projects. IUG Journal of Natural and Engineering Studies, 113-137.
Eriksson, P., & Westerberg , M. (2010). Effects of procurement on construction project
performance. Sweden: Division of Entrepreneurship and Industrial Organisation,
Lulea University of Technology.
Eriksson, P., & Nilsson, T. (2008). Client perceptions of barriers to partnering.
Engineering. 15(6), 527-539.
Hamiliton, I. (1987). Developing expert systems for management applications. In Building
Cost Modelling, 441-451.
Hanna, A., Russell, J., Gotzin , T., & Nordheim, E. (1999). Impact of change orders on the
labor efficiency for mechanical contractors. Construction and Engineering
Management, 125(3), 176-184.
Holt, G., Proverbs, D., & Love, P. (2000). Survey findings on UK construction
procurement: Is it achieving lowest cost, or value ? 5, 13-20.
Ireland, V. (1985). The role of managerial actions in cost, time and quality performance of
high rise. Construction Management and Economics, 3, 59-87.
Jayasuriya, S., & Rameezdeen, R. (2008). Construction procurement selection:
Comparative study of routine projects vs. disaster reconstruction projects.
Larmour, J. (2011). A Study of Procurement Routes and heir Use in the Commercial Sector,
PhD Dissertation. Interdisciplinary Design for the Built Environment.
Larson, E. (1995). Project Partnering: Results of Study of 280 Construction Projects. 11(2),
30-35.
Leadra, O., Austeng, K., Haugen, T., & Klakegg , O. (2006). Procurement routes in public
building and construction projects. 132(7), 689-696.
Löfgren, P., & Eriksson, P. (2009). Effects of collaboration in projects on construction
project performance. Procs 25th Annual ARCOM Conference. Nottingham, UK:
Association of Researchers in Construction Management.
Love , E., Davis , P., Edwards , D., & Baccarini , D. (2008). Uncertainty avoidance: public
sector clients and procurement selection. 21(7), 753-776.
Love, P., & Mohamed, S. (1996). Project Management: The Key to Procuring Fast
Buildings. 2(1), 1-6.
Love, P., Skitmore, M., & Earl, G. (1998). Selecting an appropriate procurement method
for the construction process: an empirical study. 16(2), 221-223.
Luu, D., Ng, S., & Chen, S. (2003a). A case-based procurement advisory system for
construction. 34, 429–438.
78
Luu, D., Thomas, S., & Chen, S. (2003b). Parameters Governing the Selection of
Procurement System, An Empirical Survey. 209-218.
Masterman, J. (1992). An introduction to building procurement systems (Vol. 2). London:
Spon Press.
Masterman, J., & Gameson, R. (1994). Client characteristics and needs in relation to their
selection of procurement systems. Procurement Systems Symposium. 175. Hong
Kong: CIB Publication .
Mendoza, A. (2007). Effective methodologies for supplier selection and order quantity
allocation (PhD Thesis). The Pennsylvania State University.
Monczka, R., Trent, R., & Handfield, R. (2005). Purchasing & supply Chain management.
Thomson, Ohio.
Monzcka, R., Trent, R., & Handfield, R. (2002). Purchasing and Supply Chain
Management. Ohio, USA: South-Western College Publishing.
Mortledge, R., Smith, A., & Kashiwagi, D. (2006). Building Procurement. UK: Oxford.
Nahapiet H., & Nahapiet J. (1985). The Management of Construction Projects, Case
Studies from the UK and USA. Ascot: Chartered Institue of Building.
Naoum, S. (2003). An Overview into the Concept of Partnering. 21(1), 71-76.
Naoum, S. G. (2007). Dissertation research and writing for construction students,. Oxford:
Butterworth-Heinemann.
New South Wales Government (NSW). (2005). Procurement Methodology Guidelines for
Construction. Sydney, Australia: NSW Government.
NEDO (1985). Think About Building: A Successful Business Customer’s Guide to Using
the Construction Industry. National Economic Development Agency, London.
Nyström, J. (2007). Partnering: Definition, Theory and Evaluation - Doctoral Thesis.
Royal Institute of Technology (KTH).
Odhigu, F., Azhar , Y., Nazatul, S., & Junaid, M. (2005). Cost Benefit Analysis of
Procurement Systems and the Performance of Construction Projects in East
Malaysia. Information Management and Business Review, 2(5), 181-192.
Pesamaa, O., Eriksson, P. E., & Hair, J. F. (2009). Validating a Model of Cooperative
Procurement In the Construction Industry. 27, 552-559.
Rameezdeen, R., & De Silva, S. (2002). Trends in Construction Procurement System in Sri
Lanka. Built-Environment, 02(02), 12-22.
Rameezdeen, R., & Ratnasabapathy, S. (2006). A Multiple Decisive Factor Model For
Construction Procurement System Selection. Conference Proceedings of the 6th
79
Annual Research Conference, the Royal Institution of Chartered Surveyors.
London.
Rowlinson, S. (1999). Procurement Systems: A Guide to Best Practice in Construction.
276-299.
S.Thomas, N., Luu, D., Chen, S., & . (2002). Decision criteria and their subjectivity in
construction procurement selection. THE AUSTRALIAN JOURNAL OF
CONSTRUCTION ECONOMICS AND BUILDING, 2(1), 70-80.
Samarasinghe, D., Tookey, J., Olabode, J., Rotimi, B., & Thiruchelvam, S. (2012). Supplier
Selection in the Construction Material Purchasing Function.
Sharif, A., & Morledge, R. (1994). A functional approach to modelling procurement
systems internationally and the identification of necessary support frameworks.
Procurement Systems Symposium. 175. Hong Kong: CIB Publication.
Shiyamini , R., & Raufdeen , R. (2007). A Decision Support System for the Selection of
Best Procurement System in Construction. 7(2).
Shiyamini, R., Rameezdeen, R., & Amaratunga, D. (2005). Macro analysis of construction
procurement trends in Sri Lanka. 5th International Postgraduate Conference in the
Built and Human Environment, (pp. 525-536).
Singh, B.N. (1990). Chromosome inversions in Indian Drosophila
melanogaster. Genetica 81(2): 85-88.
Skitmore, R., & Masden, D. (1988). Which Procurement System? – Towards a Universal
Procurement Selection Technique. Construction Management and Economics, 6,
71-89.
Smith, J., & Love, P. (2001). Adapting to Client Needs in Construction – a Dialogue. 19,
71-78.
The Chartered Institute of Building (CIOB). (2010). Procurement in the Construction
Industry. United Kingdom: Englemere, Kings Ride, Ascot.
Thwala, W., & Mathonsi, M. (2012). Selection Of Procurement Systems In The South
African Construction Industry: An Exploratory Study. 13-26.
Tookey, J., Murray , M., Hardcastle , C., & Langford, D. (2001). Construction procurement
routes: re-defining the contours of construction procurement. Engineering,
Construction and Architectural Management, 8(1), 20-30.
Turina, N., Radujkovic, M., & Car-Pusic, D. (2008). "Design and Built" in comparison with
the traditional procurement method and the possibility of its application in the
Croatian construction industry. 8th International Conference: Organization,
Technology and Management in Construction. Umag, Hrvatska.
Turner, A. (1990). Building Procurement. Macmillan, UK.
80
Walker, D., & Rowlinson, S. (2008). Procurement systems: A cross-industry project
management perspective. London: Taylor & Francis.
Weber, C., Current, J., & Benton, W. (1991). Vendor Selection Criteria and Methods.
European Journal of Operational Research, 50(1), 2-18.
Weele, A. (2010). Purchasing and Supply Chain Management: Analysis, Strategy,
Planning and Practice. Cengage Learning EMEA.
Wijewardana, C., Jayasena , H., & Ranadewa, K. (2013). Impact of government policies
and regulations when adopting alternative procurement methods. The Second World
Construction Symposium, Socio-Economic Sustainability in Construction. Colombo,
Sri-Lanka.
Wilkinson, S., Masurier, J., & Gupta, S. (2006). The Development of a Contractual
Framework for Disaster Reconstruction. CD Rom proceedings of the CIB
Conference. Helsinki, Finland.

81
Appendix A : Questionnaire (English)
The Islamic University of Gaza Engineering Faculty
Graduate Studies Construction Management Program
(Questionnaire)
Procurement Management In The Construction Industry
This Questionnaire is Partial Fulfillment of the Requirement for the Degree of Master of Science in Construction Management
Supervisor:
Dr. Khalid Abdel Raouf Al Hallaq Dept. of Civil Engineering, IUG
Researcher:
Qosai Abdalhakim El-Ghefari
August ,2015
82
Survey Covering Letter
The Islamic University of Gaza August 2015 Dear Sir/Madam,
To start, I appreciate that the questionnaire will take some of your valuable time.
However, without your kind and expert input the ambitions of this research work can't be
realized. To this end, I would like to thank you very much for your valued and kind
consideration.
If you agree to participate, all the responses you provide will be completely
confidential and will be used for the research purposes only.
My name is Qosai El-Ghefari and i am currently working on a research about applying
procurement management in the construction industry. This research aim to provide a
platform of knowledge for the construction management practitioners about applying
procurement management on the construction projects. This research is being carried out in
the Gaza Strip area, and your address has been selected by a scientific sampling method to
ensure a representative picture of different views.
Questionnaire contents:
- Part 1: General information about the respondent and the organization.
- Part 2: Factors affecting the selection of procurement system.
Yours faithfully,
Qosai El-Ghefari
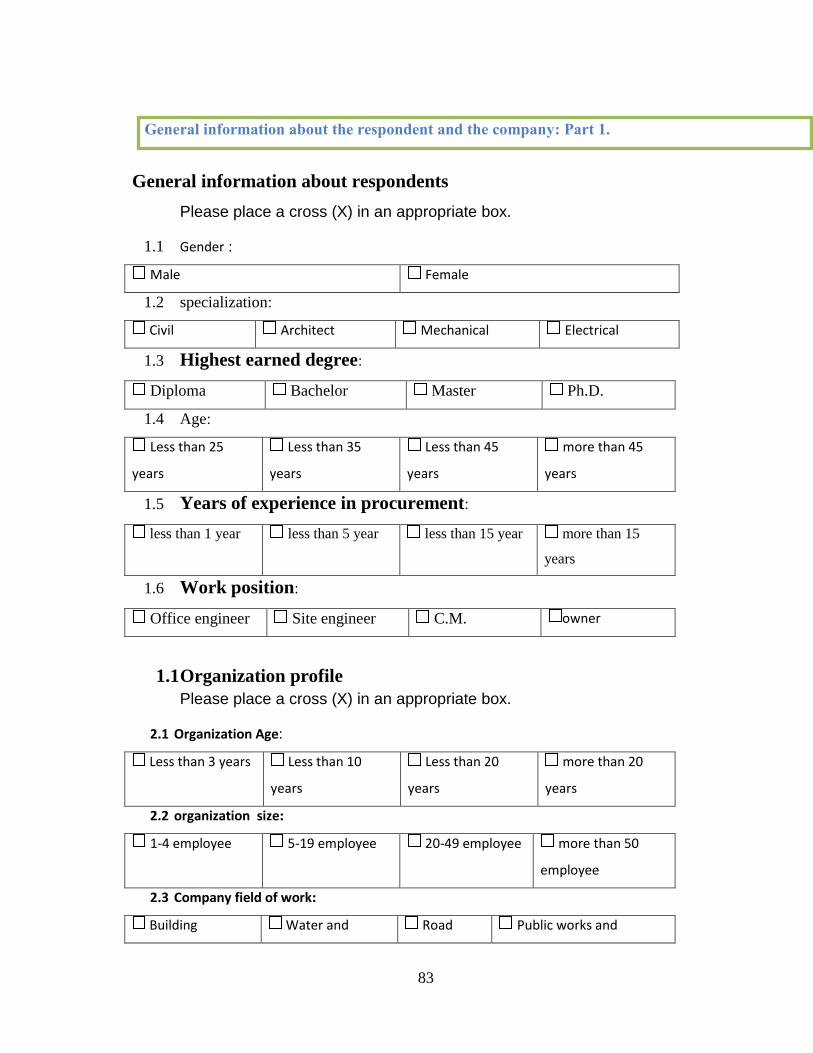
83
General information about respondents
Please place a cross (X) in an appropriate box.
1.1 Gender :
Female Male
1.2 specialization:
Electrical Mechanical Architect Civil
1.3 Highest earned degree:
Ph.D. Master Bachelor Diploma
1.4 Age:
more than 45
years
Less than 45
years
Less than 35
years
Less than 25
years
1.5 Years of experience in procurement:
more than 15
years
less than 15 year less than 5 year less than 1 year
1.6 Work position:
owner C.M. Site engineer Office engineer
1.1 Organization profile
Please place a cross (X) in an appropriate box.
2.1 Organization Age:
more than 20
years
Less than 20
years
Less than 10
years
Less than 3 years
2.2 organization size:
more than 50
employee
20-49 employee 5-19 employee 1-4 employee
2.3 Company field of work:
Public works and Road Water and Building
1 tr P :yieit c tetatr rtae oasr rni tiueaerier er rni lare eG .
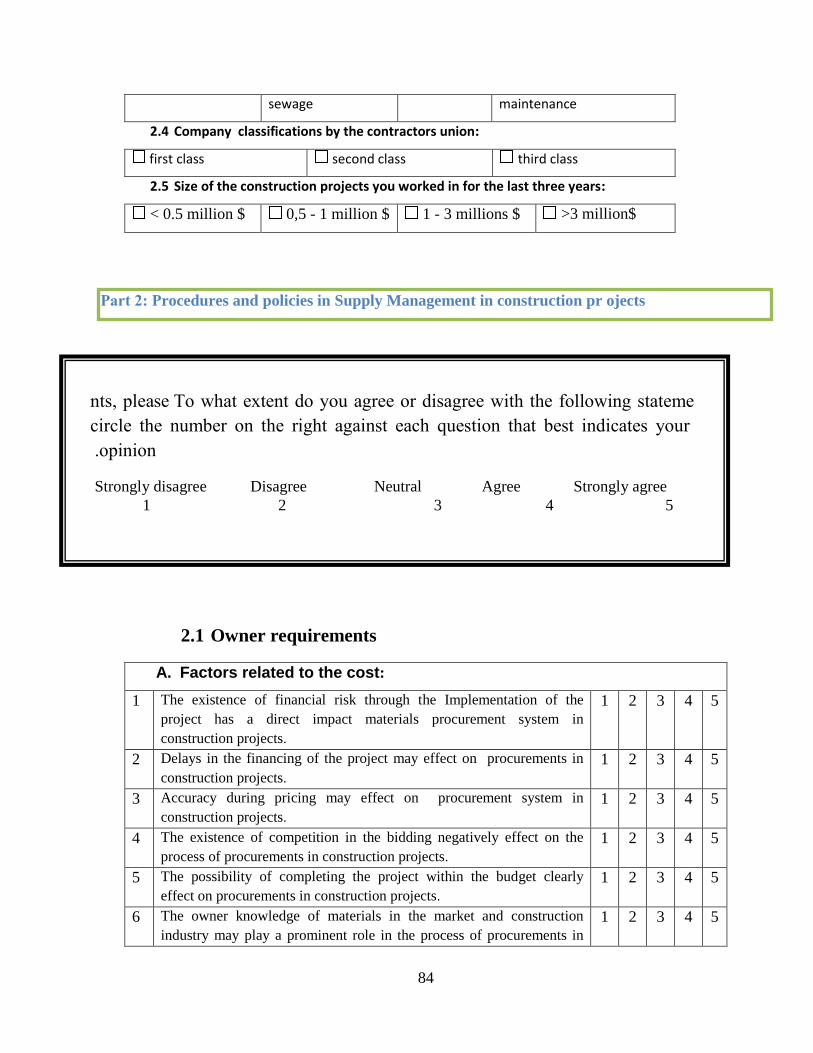
84
maintenance sewage
2.4 Company classifications by the contractors union:
third class second class first class
2.5 Size of the construction projects you worked in for the last three years:
>3 million$ 1 - 3 millions $ 0,5 - 1 million $ < 0.5 million $
2.1 Owner requirements
A. Factors related to the cost:
1 The existence of financial risk through the Implementation of the
project has a direct impact materials procurement system in
construction projects.
1 2 3 4 5
2 Delays in the financing of the project may effect on procurements in
construction projects.
1 2 3 4 5
3 Accuracy during pricing may effect on procurement system in
construction projects.
1 2 3 4 5
4 The existence of competition in the bidding negatively effect on the
process of procurements in construction projects.
1 2 3 4 5
5 The possibility of completing the project within the budget clearly
effect on procurements in construction projects.
1 2 3 4 5
6 The owner knowledge of materials in the market and construction
industry may play a prominent role in the process of procurements in
1 2 3 4 5
1 tr t: 1rocedures and policies in Supply Management in construction pr ojects
en eohw TnwTxw an ent herTT nr attherTT etwo woT onttnetxe twhwToTxwta ltThtT
tr tT woT xtonTr nx woT rteow hehtxtw Th o atTtwtnx wohw nTtw txat hwTt entr
nltxtnx.
Strongly disagree Disagree Neutral Agree Strongly agree
1 2 3 4 5
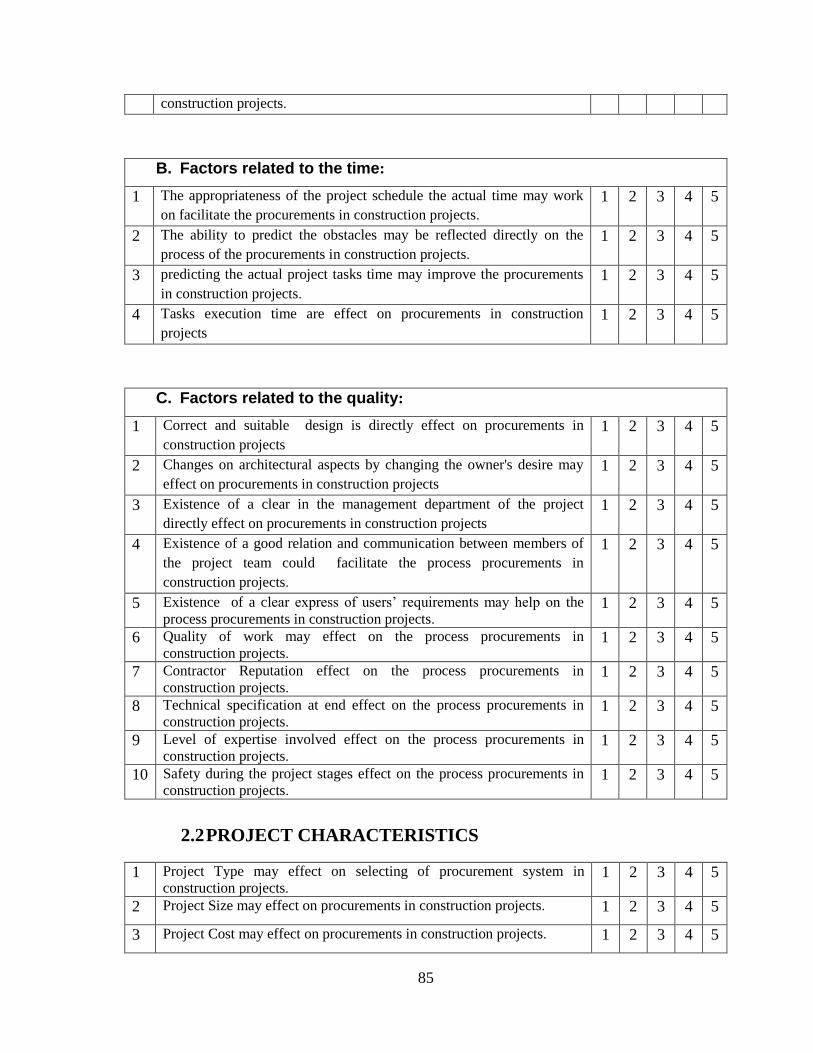
85
construction projects.
B. Factors related to the time:
1 The appropriateness of the project schedule the actual time may work
on facilitate the procurements in construction projects.
1 2 3 4 5
2 The ability to predict the obstacles may be reflected directly on the
process of the procurements in construction projects.
1 2 3 4 5
3 predicting the actual project tasks time may improve the procurements
in construction projects.
1 2 3 4 5
4 Tasks execution time are effect on procurements in construction
projects
1 2 3 4 5
C. Factors related to the quality:
1 Correct and suitable design is directly effect on procurements in
construction projects
1 2 3 4 5
2 Changes on architectural aspects by changing the owner's desire may
effect on procurements in construction projects
1 2 3 4 5
3 Existence of a clear in the management department of the project
directly effect on procurements in construction projects
1 2 3 4 5
4 Existence of a good relation and communication between members of
the project team could facilitate the process procurements in
construction projects.
1 2 3 4 5
5 Existence of a clear express of users’ requirements may help on the
process procurements in construction projects. 1 2 3 4 5
6 Quality of work may effect on the process procurements in
construction projects. 1 2 3 4 5
7 Contractor Reputation effect on the process procurements in
construction projects. 1 2 3 4 5
8 Technical specification at end effect on the process procurements in
construction projects. 1 2 3 4 5
9 Level of expertise involved effect on the process procurements in
construction projects. 1 2 3 4 5
10 Safety during the project stages effect on the process procurements in
construction projects. 1 2 3 4 5
2.2 PROJECT CHARACTERISTICS
1 Project Type may effect on selecting of procurement system in
construction projects. 1 2 3 4 5
2 Project Size may effect on procurements in construction projects. 1 2 3 4 5
3 Project Cost may effect on procurements in construction projects. 1 2 3 4 5
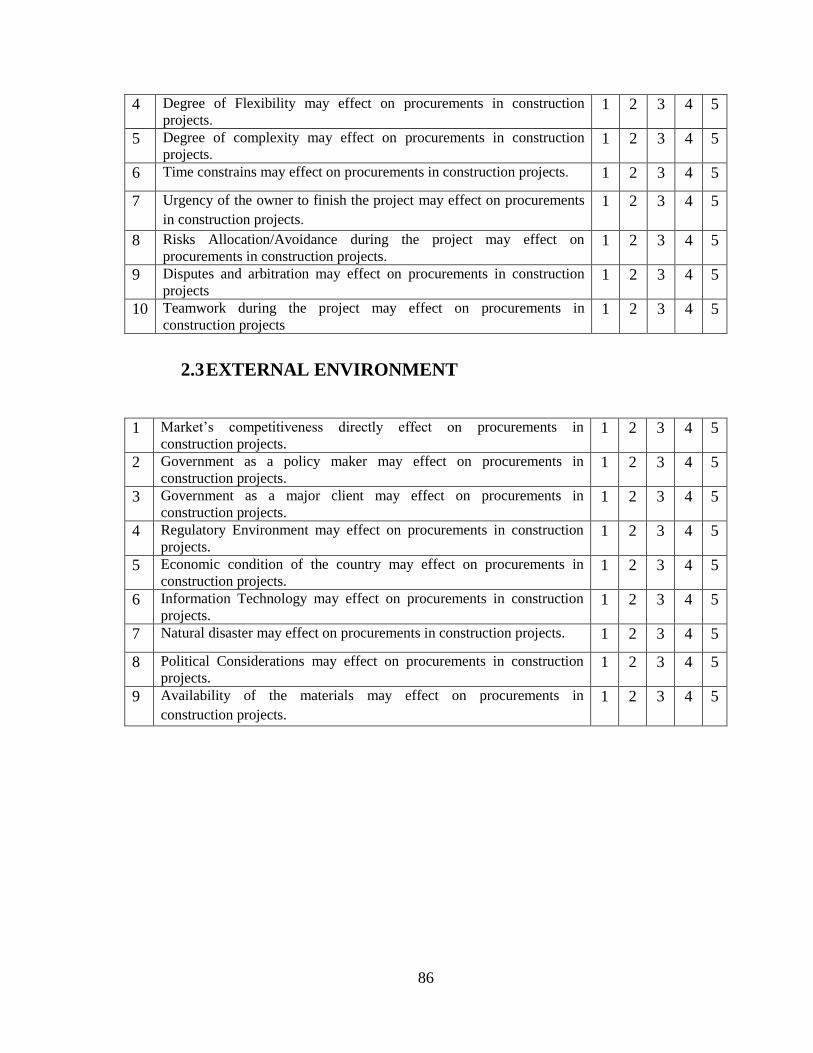
86
4 Degree of Flexibility may effect on procurements in construction
projects. 1 2 3 4 5
5 Degree of complexity may effect on procurements in construction
projects. 1 2 3 4 5
6 Time constrains may effect on procurements in construction projects. 1 2 3 4 5
7 Urgency of the owner to finish the project may effect on procurements
in construction projects.
1 2 3 4 5
8 Risks Allocation/Avoidance during the project may effect on
procurements in construction projects. 1 2 3 4 5
9 Disputes and arbitration may effect on procurements in construction
projects 1 2 3 4 5
10 Teamwork during the project may effect on procurements in
construction projects 1 2 3 4 5
2.3 EXTERNAL ENVIRONMENT
1 Market’s competitiveness directly effect on procurements in
construction projects. 1 2 3 4 5
2 Government as a policy maker may effect on procurements in
construction projects. 1 2 3 4 5
3 Government as a major client may effect on procurements in
construction projects. 1 2 3 4 5
4 Regulatory Environment may effect on procurements in construction
projects. 1 2 3 4 5
5 Economic condition of the country may effect on procurements in
construction projects. 1 2 3 4 5
6 Information Technology may effect on procurements in construction
projects. 1 2 3 4 5
7 Natural disaster may effect on procurements in construction projects. 1 2 3 4 5
8 Political Considerations may effect on procurements in construction
projects. 1 2 3 4 5
9 Availability of the materials may effect on procurements in
construction projects.
1 2 3 4 5

87
Appendix B : Questionnaire (Arabic)
الجامعة اإلسالمية كلية الهندسة
عمادة الدراسات العليا
عن استبيان
في استدراج العروضالعوامل التي تؤثر على نظام "
"صناعة التشييد في قطاع غزة
اإلجراءات من خالل دراسةيهدف إلى دراسة العوامل المؤثرة في ادارة التوريدات في المشاريع االنشائية االستبيانهذا
اسات والخطوات باإلضافة إلى تحديد العقبات و المشاكل التي تواجه عمليات جلب المواد. و السي
مع األخذ بعين االعتبار أمانة و دقة وواقعية المعلومات و مع العلم أن االستبياننقدر عاليا تعاونكم معنا بتعبئة هذا
غراض البحث العلمي . نرجو من حضراتكم قراءة لن يتم استخدامها إال في أ االستبيانالمعلومات الموجودة في هذا
بدقة و عناية . االستبيانالتعليمات السابقة لكل جزء من أجزاء
نشكر لكم مسبقا تعاونكم و دعمكم لمسيرة البحث العلمي
الباحث قصي عبدالحكيم موسى الغفري
المشرف
خالد الحالقالدكتور :
2015 أغسطس
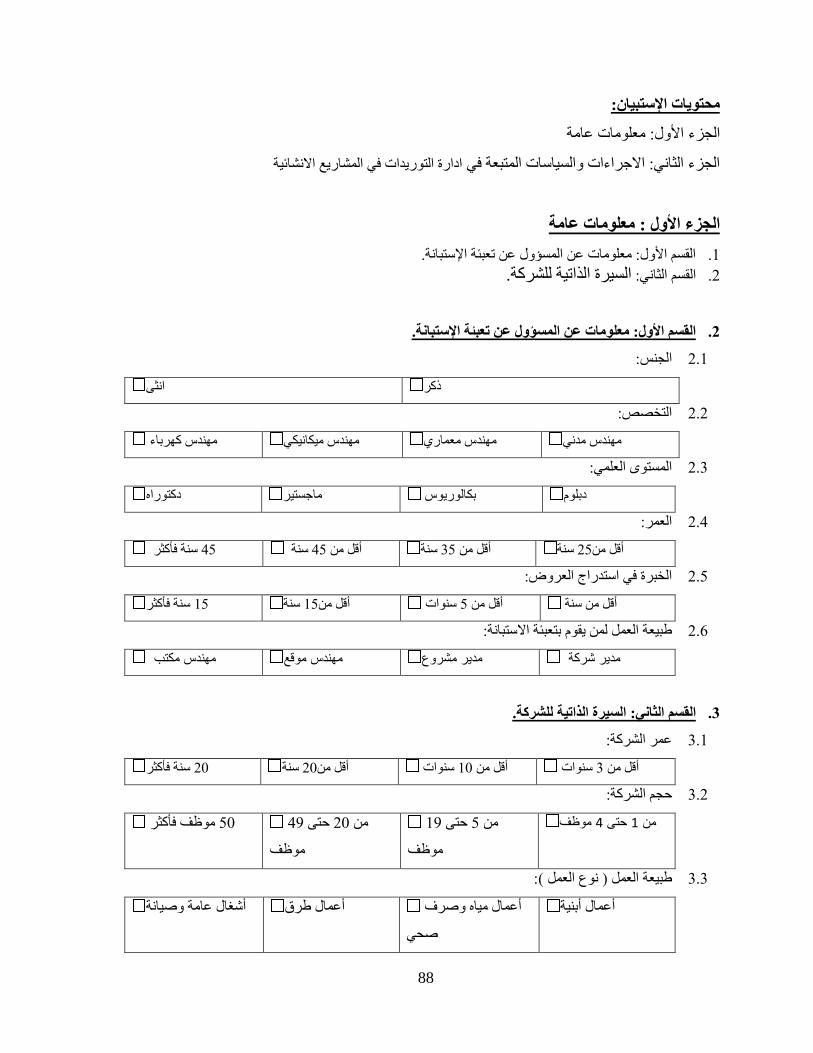
88
تستبيا:: محتويات اإل
األول: معلومات عامة الجزء
ادارة التوريدات في المشاريع االنشائيةالجزء الثاني: االجراءات والسياسات المتبعة في
معلومات عامة األول : الجزء
.القسم األول: معلومات عن المسؤول عن تعبئة اإلستبانة .1
للشركة.السيرة الذاتية : الثانيالقسم .2
t. ومات عن المسؤول عن تعبئة اإلتستبانةالقسم األول: معل.
:الجنس 2.1
ذكر انثى
:التخصص 2.2
مهندس مدني مهندس معماري مهندس ميكانيكي مهندس كهرباء
المستوى العلمي: 2.3
دبلوم بكالوريوس ماجستير هدكتورا
العمر: 2.4
سنة 25أقل من سنة 35أقل من سنة 45أقل من سنة فأكثر 45
:الخبرة في استدراج العروض 2.5
أقل من سنة سنوات 5أقل من سنة 15أقل من سنة فأكثر 15
:طبيعة العمل لمن يقوم بتعبئة االستبانة 2.6
مدير شركة مدير مشروع مهندس موقع مهندس مكتب
للشركة.السيرة الذاتية : الثانيالقسم .3
:عمر الشركة 3.1
سنوات 10أقل من سنوات 3أقل من سنة 20أقل من سنة فأكثر 20
:م الشركةحج 3.2
موظف 4حتى 1من 19حتى 5من
موظف
49حتى 20من
موظف
موظف فأكثر 50
:) نوع العمل ( طبيعة العمل 3.3
أبنيةأعمال أعمال مياه وصرف
صحي
أعمال طرق أشغال عامة وصيانة
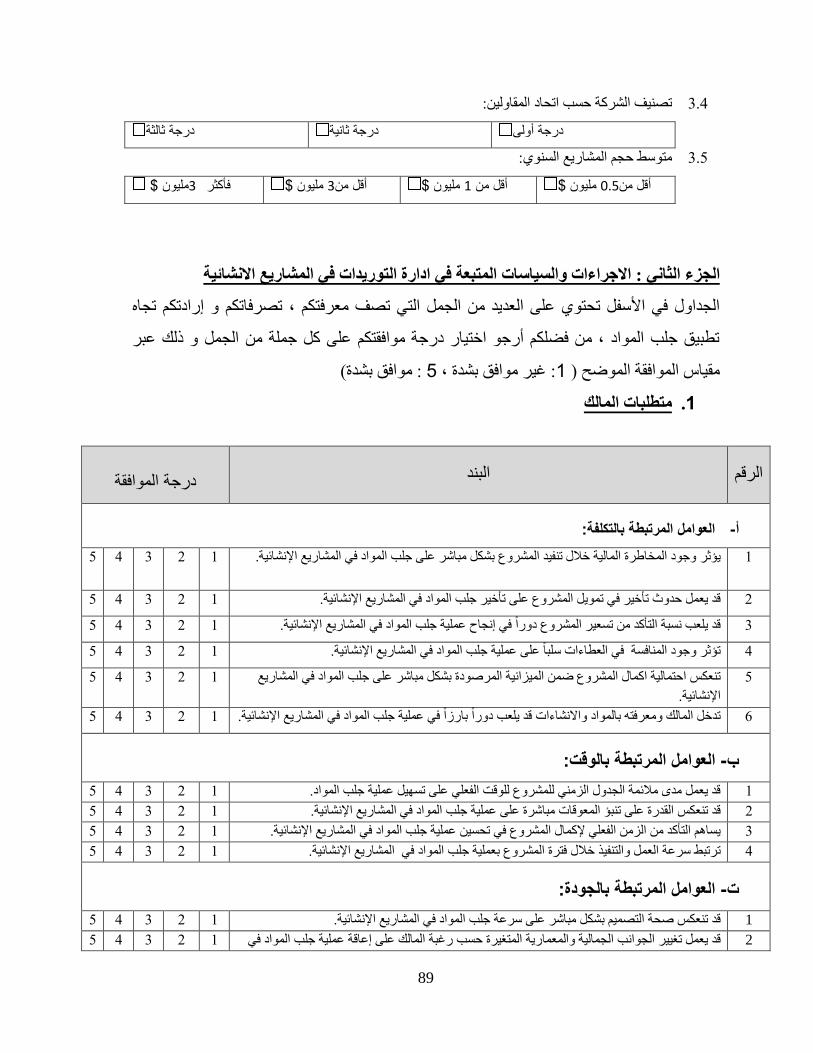
89
حسب اتحاد المقاولين: تصنيف الشركة 3.4
درجة أولى درجة ثانية درجة ثالثة
:متوسط حجم المشاريع السنوي 3.5
مليون $ 0.5أقل من مليون $ 1أقل من مليون $ 3أقل من مليون $ 3 فأكثر
ادارة التوريدات في المشاريع االنشائيةفي الجزء الثاني : االجراءات والسياتسات المتبعة
و إرادتكم تجاه تصرفاتكمالجداول في األسفل تحتوي على العديد من الجمل التي تصف معرفتكم ،
تطبيق جلب المواد ، من فضلكم أرجو اختيار درجة موافقتكم على كل جملة من الجمل و ذلك عبر
(موافق بشدة: 5، غير موافق بشدة: 1مقياس الموافقة الموضح )
متطلبات المالك .1
مالرق درجة الموافقة البند
العوامل المرتبطة بالتكلفة: -أ
5 4 3 2 1 ب المواد في المشاريع اإلنشائية.وجود المخاطرة المالية خالل تنفيد المشروع بشكل مباشر على جليؤثر 1
5 4 3 2 1 ب المواد في المشاريع اإلنشائية.خير في تمويل المشروع على تأخير جلقد يعمل حدوث تأ 2
5 4 3 2 1 ب المواد في المشاريع اإلنشائية.لعب نسبة التأكد من تسعير المشروع دورا في إنجاح عملية جلقد ي 3
5 4 3 2 1 نشائية.ب المواد في المشاريع اإلسلبا على عملية جلجود المنافسة في العطاءات وتؤثر 4
ب المواد في المشاريع بشكل مباشر على جلمشروع ضمن الميزانية المرصودة تنعكس احتمالية اكمال ال 5
اإلنشائية.
1 2 3 4 5
5 4 3 2 1 ب المواد في المشاريع اإلنشائية.تدخل المالك ومعرفته بالمواد واالنشاءات قد يلعب دورا بارزا في عملية جل 6
ل المرتبطة بالوقت:العوام -ب
5 4 3 2 1 قد يعمل مدى مالئمة الجدول الزمني للمشروع للوقت الفعلي على تسهيل عملية جلب المواد. 1
5 4 3 2 1 مباشرة على عملية جلب المواد في المشاريع اإلنشائية. تنبؤ المعوقات على قد تنعكس القدرة 2
5 4 3 2 1 ب المواد في المشاريع اإلنشائية.يساهم التأكد من الزمن الفعلي إلكمال المشروع في تحسين عملية جل 3
5 4 3 2 1 المواد في المشاريع اإلنشائية. بعملية جلبل والتنفيذ خالل فترة المشروع ترتبط سرعة العم 4
العوامل المرتبطة بالجودة: -ت
5 4 3 2 1 ل مباشر على سرعة جلب المواد في المشاريع اإلنشائية.نعكس صحة التصميم بشكقد ت 1
5 4 3 2 1ب المواد في على إعاقة عملية جلرية المتغيرة حسب رغبة المالك عمل تغيير الجوانب الجمالية والمعماقد ي 2
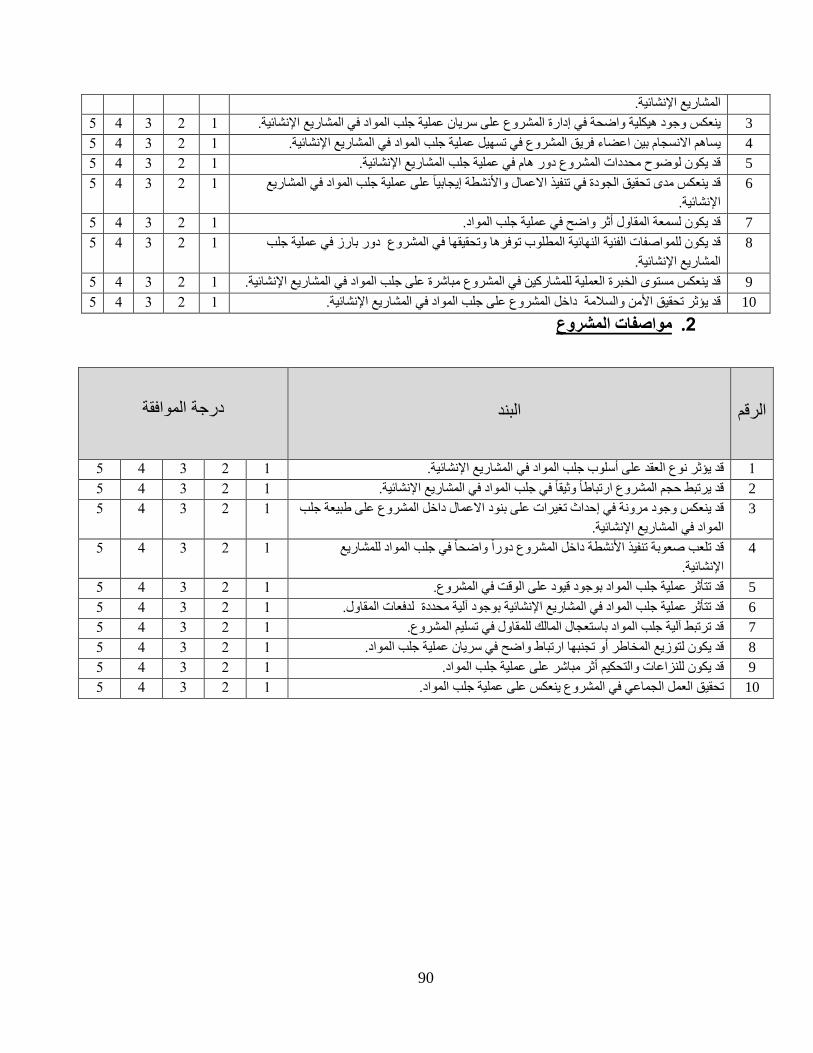
90
المشاريع اإلنشائية.
5 4 3 2 1 لمواد في المشاريع اإلنشائية.وجود هيكلية واضحة في إدارة المشروع على سريان عملية جلب ا ينعكس 3
5 4 3 2 1 ب المواد في المشاريع اإلنشائية.في تسهيل عملية جلنسجام بين اعضاء فريق المشروع يساهم اال 4
5 4 3 2 1 وضوح محددات المشروع دور هام في عملية جلب المشاريع اإلنشائية.لقد يكون 5
المواد في المشاريع فيذ االعمال واألنشطة إيجابيا على عملية جلبنعكس مدى تحقيق الجودة في تنقد ي 6
اإلنشائية.
1 2 3 4 5
5 4 3 2 1 أثر واضح في عملية جلب المواد.سمعة المقاول قد يكون ل 7
المشروع دور بارز في عملية جلب في لمواصفات الفنية النهائية المطلوب توفرها وتحقيقهالقد يكون 8
نشائية.المشاريع اإل
1 2 3 4 5
5 4 3 2 1 ب المواد في المشاريع اإلنشائية.قد ينعكس مستوى الخبرة العملية للمشاركين في المشروع مباشرة على جل 9
5 4 3 2 1 ؤثر تحقيق األمن والسالمة داخل المشروع على جلب المواد في المشاريع اإلنشائية.قد ي 10
مواصفات المشروع .2
مالرق
رجة الموافقةد البند
5 4 3 2 1 ب المواد في المشاريع اإلنشائية.قد يؤثر نوع العقد على أسلوب جل 1
5 4 3 2 1 ب المواد في المشاريع اإلنشائية.قد يرتبط حجم المشروع ارتباطا وثيقا في جل 2
ب نعكس وجود مرونة في إحداث تغيرات على بنود االعمال داخل المشروع على طبيعة جلقد ي 3
المواد في المشاريع اإلنشائية.
1 2 3 4 5
جلب المواد للمشاريع لعب صعوبة تنفيذ األنشطة داخل المشروع دورا واضحا فيقد ت 4
اإلنشائية.
1 2 3 4 5
5 4 3 2 1 قد تتأثر عملية جلب المواد بوجود قيود على الوقت في المشروع. 5
5 4 3 2 1 وجود آلية محددة لدفعات المقاول.اإلنشائية بقد تتأثر عملية جلب المواد في المشاريع 6
5 4 3 2 1 لمالك للمقاول في تسليم المشروع.قد ترتبط آلية جلب المواد باستعجال ا 7
5 4 3 2 1 واضح في سريان عملية جلب المواد.توزيع المخاطر أو تجنبها ارتباط لقد يكون 8
5 4 3 2 1 ر على عملية جلب المواد.قد يكون للنزاعات والتحكيم أثر مباش 9
5 4 3 2 1 روع ينعكس على عملية جلب المواد.تحقيق العمل الجماعي في المش 10
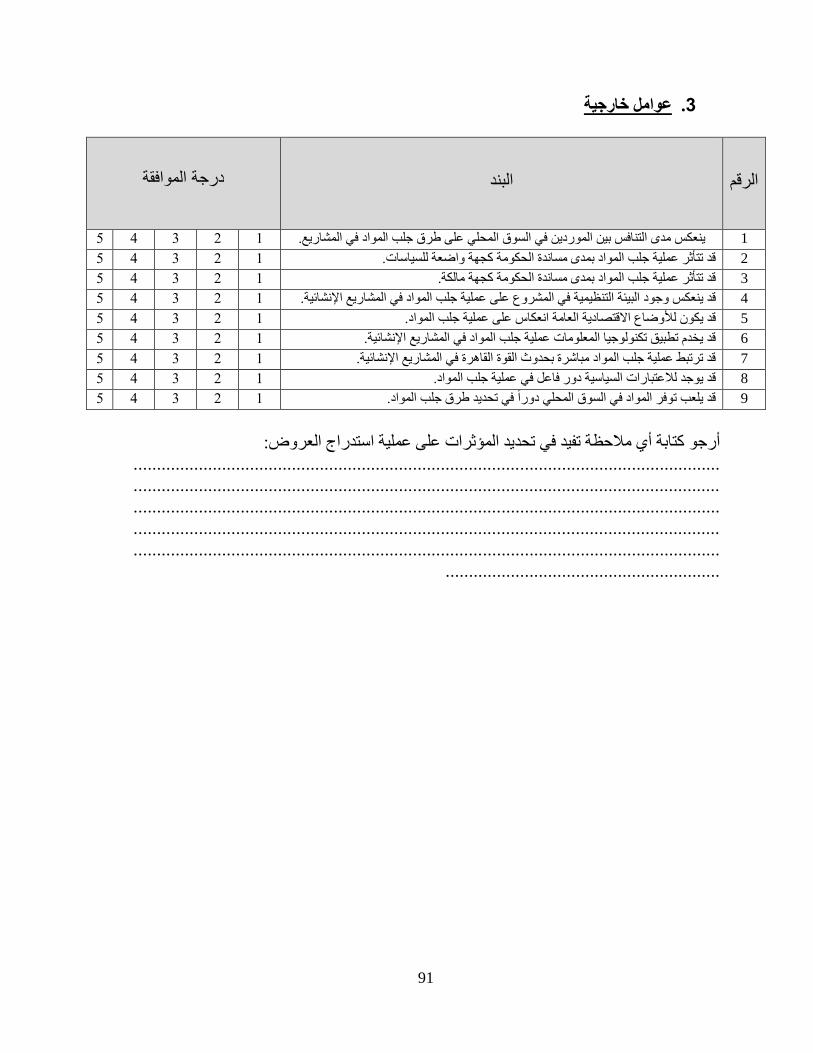
91
عوامل خارجية .3
مالرق
درجة الموافقة البند
5 4 3 2 1 على طرق جلب المواد في المشاريع.ينعكس مدى التنافس بين الموردين في السوق المحلي 1
5 4 3 2 1 ة الحكومة كجهة واضعة للسياسات. قد تتأثر عملية جلب المواد بمدى مساند 2
5 4 3 2 1 بمدى مساندة الحكومة كجهة مالكة.قد تتأثر عملية جلب المواد 3
5 4 3 2 1 ب المواد في المشاريع اإلنشائية.نعكس وجود البيئة التنظيمية في المشروع على عملية جلقد ي 4
5 4 3 2 1 ة انعكاس على عملية جلب المواد. كون لألوضاع االقتصادية العامقد ي 5
5 4 3 2 1 ب المواد في المشاريع اإلنشائية.قد يخدم تطبيق تكنولوجيا المعلومات عملية جل 6
5 4 3 2 1 القاهرة في المشاريع اإلنشائية. قد ترتبط عملية جلب المواد مباشرة بحدوث القوة 7
5 4 3 2 1 ة دور فاعل في عملية جلب المواد.لالعتبارات السياسي قد يوجد 8
5 4 3 2 1 قد يلعب توفر المواد في السوق المحلي دورا في تحديد طرق جلب المواد. 9
استدراج العروض:كتابة أي مالحظة تفيد في تحديد المؤثرات على عملية أرجو
..............................................................................................................................
..............................................................................................................................
..............................................................................................................................
..............................................................................................................................
..............................................................................................................................
...........................................................

92
All thanks and praise belongs
to
ALLAH
“Al-hamdulillah”