Islamic University -Gaza
107
Transcript of Islamic University -Gaza


Evaluation the effect of environmental and social factors on adult
patients with chronic renal failure in Gaza governorates:
retrospective study.
بلفشل الكلوي المزمن ب الببلغين المصببين ىمرضالتقييم تأثير العوامل البيئيت والاجتمبعيت على
: دراست ذاث أثر رجع.غزة ف محبفظبث
By
Fadi F. Esleem
Supervisors
Dr. Zeyad Abu Heen
Dr. Yousef Aljeesh
A Thesis Submitted in Partial Fulfillment of the Requirements for
the Degree of Master of Science in Environmental Health.
Nov. 2015
Islamic University-Gaza
Deanship of Graduate Studies
Faculty of science
Department of Environmental & Earth Sciences
Master of Environmental science


I
EPIGRAPH
عمي أنعمت التي نعمتك أشكر أن أوزعني رب﴿
وأدخمني ترضاه صالحا أعمن وأن والدي وعمى
.(99 اخ -)سسح انم ﴾الصالحين عبادك في برحمتك
"O my Lord! So order me that I may be grateful for Thy favors, which Thou has bestowed on me and on my parents, and that I may work the righteousness that will please Thee: and admit me, by Thy Grace, to the ranks of Thy Righteous Servants".

II
ABSTRACT Background: Chronic renal failure is currently recognized as an important global
population health problem. The study aims to evaluate the effect of environmental and
social factors on adult patients with chronic renal failure in Gaza governorates.
Methodology: Retrospective study was conducted during the period from April to
August 2015; in all hospitals in Gaza governorates. Study sample are a systematic
random sample, which include 235 patients; all participants were subjected to
questionnaire; response rate is 100%.
Results: The study findings showed that male participant (56.6%) higher than female
participant (43.4%); the highest age group is more than 50 years, which represent
46%; about 65% of patients are treated in Al Shifa hospital; about 74% of subjects are
married, and 49.2% are considered relative to his wife or her husband; 68.5% of
subjects their education level is less than Tawjihi (12th
stage); 71% of participants are
suffering from chronic disease other than CRF; 46% of participants were used
medications without prescribe; the highest type of medications that the patients used it
is anti-inflammatory medications; the highest age group when sustained CRF is 51
years and more; 86.4% of participants don't have history of CRF among parents;
91.5% of subjects are unemployed now; while 47.2% were had jobs before sustaining
CRF; the highest jobs is governmental jobs and buildings jobs; about 60% of subjects,
their monthly income is less than 1000 NIS.
Regarding to pesticides, 45.1% of participants were used pesticides inside their home;
also 92.8% of subjects don’t expose to environmental poisons. The study shows that
58% of subjects, are eating fast ready meals, sweets and soft drinks. As well as 57%
are taking too much coffee and tea. And 45.5% are eating canned foods. Also 51.1%
eating too much foods that contain carbohydrates; 70.6% eating too much food which
contain proteins; 78.3% eating too much food that contain vitamins; 84.3% eating a
red meat; 91.1% eating a white meat; 85.1% eating a sea foods; 74.9% don’t practice
an exercise or sports. About 70% of subjects, were non-smokers before CRF. In other
hand 54% of participants are considered passive smokers. About half of subjects were
used a municipality water as a source of drinking and cocking water before CRF. As
well as 63% were drinking 2 litters and less per day. Finally the results reveals that
74% of participants have low knowledge about CRF before having it. Also 85.5% of
patients didn’t attended to health education programs.
Conclusion: There is no statistically significant variations between gender and
(governorate, residency, living in a crowded area, lived beside industrial area, using
pesticides, lived in agricultural area, and knowledge about CRF). Also the results
showed that there is statistically significant differences between gender and [exposure
to chemicals during work, amount of drinking water, (Consumption of ready meals,
sweets, and soft drinks), drinking much coffee and tea, consumption of canned food,
and consumption of much salted food].
Key words: chronic renal failure, environmental factors, social factors, socio
demographic characteristic , poisons, exposure to chemicals, Gaza strip, Palestine.
III
ملخص الرسالة
انفشم انكه انضي عزجش حبنب يشكهخ عبنخ يخ، رؤصش عه طحخ الاسب. رذف ز انذساسخ إن :الخلفية
رمى رأصش انعايم انجئخ الاجزبعخ عه انشػ انجبنغ انظبث ثبنفشم انكه انضي ف يحبفظبد
غضح.
، ف 5195رى رطجك دساسخ راد أصش سجع ف انفزشح يب ث شش أثشم حز شش أغسطس نعبو :المنهجية
يشغ، كم انشبسك لبيا 535يسزشفبد يحبفظبد غضح. عخ انذساسخ عخ عشائخ يزظخ رشم
يعذل اسزجبثخ انشبسك نلاسزجبخ كب %.911ثزعجئخ الاسزجبخ، حش أ
يعذل يشبسكخ انزكس )أ :النتائج %( ف 43.4%(، أعه ي يعذل يشبسكخ الابس )56.6ظشد انزبئج أ
% ي انعخ انكهخ نهذساسخ،46انز رضم سخ يب فق 51 انذساسخ، أعه يجعخ عش نهشبسك
% عزجش 49% ي انشبسك يزضج، 74% ي انشبسك زعبنج ف يسزشف انشفبء، حان 65
% ي 79% ي انشبسك يسزاى انزعه ألم ي رج، 68.5البسة نضجبرى ا صجبرى، ثب
% كبا سزخذي الأدخ 46انشبسك كبا عب ي أيشاع يضيخ أخش غش انفشم انكه انضي،
بثبد، أظشد انذساسخ أؼب أ أعه فئخ ثذ طفبد ؽجخ، أعه ع ي ز الأدخ يؼبداد الانز
% لا جذ نذى رأسخ ؽج لإطبثخ أحذ انذى 86.4سخ فب فق، 59عشخ عذ الاطبثخ ثبنشع
كب نذى عم لجم الاطبثخ 47.5% ي انشبسك لا عه حبنب، ثب 99.5ثشع انفشم انكه انضي،
% ي انشبسك 61ه ز الأعبل انظبئف انحكيخ أعبل انجبء، حان ثبنفشم انكه انضي، اع
شكم. 9111دخهى انشش ألم ي
% ي انشبسك كبا سزخذي انجذاد انحششخ داخم يبصنى، أؼب 45.9ثبنسجخ نهجذاد انحششخ،
% ي انشبسك كبا أكه الأؽعخ 58% نى زعشػا لأ سو ثئخ. أصجزذ انذساسخ أؼب أ 95.8
% 45.5% كبا زبن انمح انشب ثكضشح، 57انجبضح انسشعخ انحهبد انششثبد انغبصخ، أؼب
% 71.6% كبا زبن الأؽعخ انز رحز عه كشثذساد ثكضشح، 59.9كبا أكه انعهجبد ثكضشح،
% كبا زبن الأؽعخ انز رحز عه 78.3عخ انز رحز عه ثشر ثكضشح، كبا زبن الأؽ
% 85.9% كبا أكه انهحو انجؼبء، 99.9% كبا أكه انهحو انحشاء، 84.3فزبيبد ثكضشح، ثب
% ي 71حان % كبا لا بسس انزبس أ انشبػخ. 74.9كبا أكه انأكلاد انجحشخ،
% ي انشبسك كبا يذخ سهجب. 54انشبسك كبا غش يذخ لجم الاطبثخ ثبنفشم انكه انضي،
حان ظف انشبسك كبا سزخذي يب انجهذخ كظذس سئس نهششة انطجخ لجم الاطبثخ ثبنفشم
% ي انشبسك 74يب. أخشا أثشصد انذساسخ أ نزش ا الم 5% كبا ششث فمؾ 63انكه انضي،
% نى حظها 85.5كب نذى يسز يعشفخ يخفغ ثخظص انفشم انكه انضي لجم الاطبثخ ث، أؼب
عه أ ثشبيج رضمف طح.
يطمخ ف انسك انسك، يكب انحبفظخ،) انجس ث إحظبئخ دلانخ راد اخزلافبد جذ لا :الاستنتاج
لجم جذا انفاك انخؼشاد غسم انضل، داخم انجذاد اسزخذاو طبعخ، يطمخ ثجبت انسك يضدحخ،
انزبئج أظشد ،(انضي انكه انفشم ثخظص انظحخ انعهيبد صساعخ، يطمخ ف انسك الأكم، أؼب
زى انز انب كخ انعم، أصبء انكبئخ نهاد انزعشع] انجس ث إحظبئخ دلانخ راد اخزلافبد رجذ أ
ربل انشب، انمح ششة ي الاكضبس( انغبصخ انششثبد انحهبد انجبضح انأكلاد ربل) ششثب،
[.ثكضشح انبنحخ الأؽعخ ربل انعهجخ، انأكلاد
انفشم انكه انضي، انعايم انجئخ، انعايم الاجزبعخ، انخظبئض الاجزبعخ :المفتاحية الكلمات
، لطبع غضح، فهسط.نسو، انزعشع نهاد انكبئخانجغشافخ، ا

IV
DEDICATION
To the first teacher of all people, prophet
MOHAMMED (peace be upon him).
To my Parents, who have always been so close
to me whenever i needed. It is their
unconditional love that motivates me to set
higher targets.
To my Brothers and Sisters.
To my friends, and all persons who help me in
preparing this thesis.
For their patient, endless support,
encouragement and love.

V
ACKNOWLEDGEMENT I am grateful to all people who helped me to pass this academic stage for their moral support, confidence, and encouragement. My appreciation to my academic supervisors, Dr. Zeyad Abu Heen and Dr. Yousef AlJeesh, for their patient friendly, continuous support, encouragement and advice. Thanks to all experts who validate the questionnaire, and gave me feedback about it; those experts are (Prof. Dr: Sohier Eweda, Dr. Jehad Hammad, Dr. Nasser Abu El Nour, Dr. Yasser El Nahal, Dr. Ashraf El Jedi, Dr. Ahmed Al Sha'er, Dr. Ahmed Ayed, and Dr. Mohammed Abu Daya). I would like to thank artificial kidney department teams in Al shefa hospital, Shohdaa al Aqsa hospital, Nasser hospital and Abu Youssef al Najar hospital. Grateful and deep respect to all people and teachers who taught me at the Islamic University-Gaza, and provided me with a new knowledge and skills. My deep thanks to the academic group with whom I spent the best days in my education carrier, my colleagues at the school of Environmental science/ Environmental health; those colleagues are (Shehda Muhsen, Raed Lubbad, Sami Alkronz, Muhannad Younis, and Mohammed Barhoum). My special thanks to all persons who help me in data collection, those are (Hadeel Hussein, Mohammed Abu El-Komboz, Ahmed El Manasra, Ahmed Alpashliqi, Nour Abu Nada, Ibrahem EL Jamala, Mohamed Joudah, Ahmed Muhsen, Mohammed Salama). Also I extend my sincere thanks and gratitude to my uncle (Sabri Hamdia) and his wife (Nesma Ayyad), for their moral support, and Proofreading Services to my thesis. Finally I would like to thank all people who participate in this study and give it the terminal picture.
VI
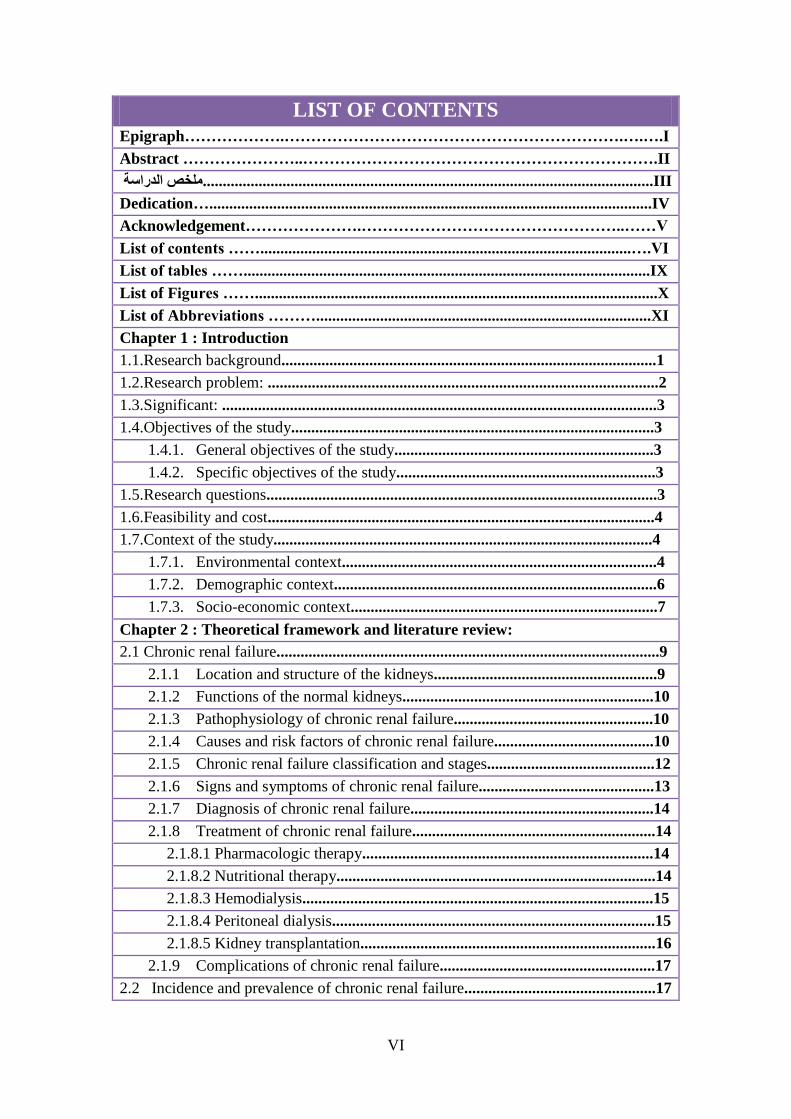
LIST OF CONTENTS
Epigraph……………….……………………………………………………….….….I
Abstract …………………..………………………………………………………….II
III.................................................................................................................الدراسة ملخص
Dedication…...............................................................................................................IV
Acknowledgement………………….…………………………………………..……V
List of contents …….............................................................................................….VI
List of tables ……......................................................................................................IX
List of Figures …….....................................................................................................X
List of Abbreviations ………....................................................................................XI
Chapter 1 : Introduction
1.1.Research background..............................................................................................1
1.2.Research problem: ..................................................................................................2
1.3.Significant: .............................................................................................................3
1.4.Objectives of the study...........................................................................................3
1.4.1. General objectives of the study.................................................................3
1.4.2. Specific objectives of the study.................................................................3
1.5.Research questions..................................................................................................3
1.6.Feasibility and cost.................................................................................................4
1.7.Context of the study...............................................................................................4
1.7.1. Environmental context...............................................................................4
1.7.2. Demographic context.................................................................................6
1.7.3. Socio-economic context.............................................................................7
Chapter 2 : Theoretical framework and literature review:
2.1 Chronic renal failure................................................................................................9
2.1.1 Location and structure of the kidneys........................................................9
2.1.2 Functions of the normal kidneys...............................................................10
2.1.3 Pathophysiology of chronic renal failure..................................................10
2.1.4 Causes and risk factors of chronic renal failure........................................10
2.1.5 Chronic renal failure classification and stages..........................................12
2.1.6 Signs and symptoms of chronic renal failure............................................13
2.1.7 Diagnosis of chronic renal failure.............................................................14
2.1.8 Treatment of chronic renal failure.............................................................14
2.1.8.1 Pharmacologic therapy.........................................................................14
2.1.8.2 Nutritional therapy................................................................................14
2.1.8.3 Hemodialysis........................................................................................15
2.1.8.4 Peritoneal dialysis.................................................................................15
2.1.8.5 Kidney transplantation..........................................................................16
2.1.9 Complications of chronic renal failure......................................................17
2.2 Incidence and prevalence of chronic renal failure................................................17
VII
2.2.1 Incidence and prevalence of chronic renal failure worldwide…….….…17
2.2.2 Incidence and prevalence of chronic renal failure in the Arab world...…19
2.2.3 Incidence and Prevalence of CRF in the Gaza governorates ……..…….20
2.3 Literature review……………………………………………….………….……22
Chapter 3 : Methodology
3.1. Study design………………………………………………………………...…...27
3.2. Study population………………………………………………………………...27
3.3. Period of the study……………………………………………………………….27
3.4. Area of the study…………………………………………………………….…..27
3.5. Sample size………….……………………………………………………….…..27
3.6. Response rate…………………………………………………………….……....27
3.7. Study instruments……………………………………………………………..…28
3.8. Construction of questionnaire………………………………………………...…28
3.9. Validity of questionnaire…………………………………………………...……29
3.9.1. Face validity………………………………………………………………29
3.9.2. Content validity…………………………………………………………...29
3.10. Pilot study………………………………………………………………………29
3.11. Data collection………………………………………………………………….30
3.12. Data entry………………………………………………………………………30
3.13. Data analysis………………………………………………………………...…30
3.14. Inclusion and Exclusion criteria……………………………………………..…30
3.14.1. Inclusion criteria…………………………………………………………30
3.14.2. Exclusion criteria………………………………………………………...30
3.15. Ethical considerations………………………………………………………….31
3.16. Limitation of the study……………………………………………………...….31
Chapter 4 : Results and Discussion:
A. Descriptive part:
A.4.1.Distribution of study participants by socio demographic characteristics...32
A.4.1.1. Distribution of study participants by gender………………………….….…32
A.4.1.2. Distribution of study participants by age group………………………....….32
A.4.1.3. Distribution of study participants by hospital which treated in it………..…33
A.4.1.4. Distribution of study participants by marital status……………………...….33
A.4.1.5. Distribution of study participants by level of education………………...….35
A.4.2. Distribution of study participants by medical history characteristics...…36
A.4.2.1. Distribution of study participants by presence of chronic disease other than
CRF………………………………………………………………………………..…36
A.4.2.2. Distribution of study participants by presence of renal obstruction……..….38
A.4.2.3. Distribution of study participants by presence of renal cysts……………….39
A.4.2.4. Distribution of study participants by presence of hemorrhage and
dehydration………………………………………………………………………..….40
A.4.2.5. Distribution of study participants by usage of medications……………...…41

VIII
A.4.2.6. Distribution of study participants by presence of blood disease………...….43
A.4.2.7. Distribution of study participants by age when sustained CRF………….…44
A.4.2.8. Distribution of participants by frequency of dialysis by governorates...…....45
A.4.2.9. Distribution of study participants by presence of chronic renal failure among
parents………………………...………………………....................................…...…46
A.4.2.10. Distribution of study participants by presence of chronic renal failure
among relatives……………………………………………...……………………….46
A.4.2.11. Distribution of study participants by kidney transplantation…………..….47
A.4.3. Distribution of the study participants by environmental factors
characteristics………………………………………………………………...……..48
A.4.3.1. Distribution of study participants by place of residency……………………48
A.4.3.2. Distribution of study participants by work conditions…………………...…50
A.4.3.3. Distribution of study participants by monthly income…………………...…53
A.4.3.4. Distribution of study participants by working years…………………….….54
A.4.3.5. Distribution of study participants by exposure to chemical substances…….55
A.4.3.6. Distribution of study participants by exposure to pesticides/insecticides......57
A.4.3.7. Distribution of study participants by exposure to environmental poisons.....59
A.4.3.8. Distribution of study participants by drinking unsafe water…………….….59
A.4.4. Distribution of the study participants by social factors characteristics.…63
A.4.4.1. Distribution of the study participants by social status…………….……...…63
A.4.4.2. Distribution of study participants by nutritional habits……………………..64
A.4.4.3. Distribution of study participants by smoking and drug abuse………….… 69
A.4.5. Distribution of study participants by knowledge characteristics…….…..71
A.4.5.1. Distribution of study participants by knowledge about CRF…………….…71
A.4.5.2. Distribution of study participants by health check-ups and health status......72
A.4.5.3. Distribution of study participants by protective knowledge……………...…73
B. Inferential statistic part:
B.4.1. Relationship between gender and governorate & residency among CRF
patients………………..………………..………………..………………..….………75
B.4.2. Relationship between gender and exposure to chemicals and pesticides among
CRF patients….……………..………………..………………………..………….….76
B.4.3. Relationship between gender and drinking water and consumed food among
CRF patients………………..………………..………………..………………….…..77
B.4.4. Relationship between gender and knowledge among CRF patients………….79
Chapter 5 : Conclusion and Recommendations:
5.1. Conclusion……………..………………..………………..…………………...…80
5.2. Recommendations………………………………………….……………………82
References………………..………………..………………..….……………..……..83
Annex 1………………..………………..………………..…………………...……...86
Annex 2 ………..………………..………………..………………..………………...87

IX
LIST OF TABLES Table (2.1): Incidence of ESRD in the Arab world 2006.…………………….……..19
Table (2.2): Prevalence of ESRD in the Arab world 2006…….……………..….…..20
Table (2.3): Growing incidence and mortality for people with chronic renal failure
patients in the Gaza governorates during the (2002-2015)……………..……..……..21
Table (4.1): Distribution of participants by socio demographic characteristics….…..34
Table (4.2): Presence of chronic disease (other than RF) ……………..………....….37
Table (4.3): Presence of renal obstruction ………..…………..………………..….…39
Table (4.4): Presence of renal cysts……………..………………..……………...…...40
Table (4.5): Presence of hemorrhage and dehydration……………..……………..….41
Table (4.6): Use of medications………………..………………..……………...…....42
Table (4.7): Presence of blood disease………………..………………..…………….44
Table (4.8): Distribution of study participants by age when sustained renal failure…45
Table (4.9): Distribution of frequency of dialysis by governorates…………….....…46
Table (4.10): presence of renal failure among parents……………..……………...…46
Table (4.11): Presence of renal failure among relatives……………..………….……47
Table (4.12): Distribution of study participants by kidney transplant…………….…48
Table (4.13): Place of residency……………..……………….……………..….….…49
Table (4.14): Work conditions………………..……………..………………..….…..52
Table (4.15): Distribution of participants by exposure to chemical substances…...…56
Table (4.16): Distribution of study participants by exposure to pesticides
/insecticides....………………..………………..………………..…………….…..….58
Table (4.17): Distribution of study participants by water source………………….…60
Table (4.18): Distribution of study participants by water characteristics……....……61
Table (4.19): Distribution of study participants by social factors…………….…..….63
Table (4.20): Distribution of study participants by type and frequency of food
groups……………..………………..………………..………………..…………...…64
Table (4.21): Distribution of study participants by fast ready meals and poor
nutrition..……………..…………… ……………..………………..……………...…65
Table (4.22): Distribution of study participants by food contents……………..……66
Table (4.23): Distribution of the study participants by consumption of meats and
salted food………………………..………………..………………….………..……67
Table (4.24): Distribution of the participants by practicing exercise or sports…...….68
Table (4.25): Distribution of study participants by smoking and drug abuse…….….70
Table (4.26): Distribution of study participants by knowledge about renal failure….72
Table (4.27): Distribution of study participants by health check-ups and health
status.............................................................................................................................73
Table (4.28): Distribution of study participants by protective knowledge………..…74
Table (4.29): Relationship between gender and governorate & residency among
chronic renal failure patients………………..………………..…………………..…..76
Table (4.30): Relationship between gender and exposure to chemicals and pesticides
among chronic renal failure patients……………………..…….…………...……..…77
Table (4.31): Relationship between gender and drinking water and consumed food
among chronic renal failure patients………………….…..…………………..……..78
Table (4.32): Relationship between gender and knowledge among chronic renal
failure patients………………..………………..……………………………………79

X
LIST OF FIGURES Figure (1.1): Population in Palestine, 2015……………..…..……………..…….….…7
Figure (1.2): Palestinian families in Palestine by family type 2014…………..….…...8
Figure (2.1): Anterior view of urinary organs of female ………..………………….....9
Figure (2.2): Number of CRF cases by years……………..………..…..…….............21
Figure (2.3): Number of CRF deaths by years………..……..………..………...........22
Figure (4.1): Distribution of participants by level of education ………........…..……35
Figure (4.2): Distribution of study participants by monthly income…….…….……..54
Figure (4.3): Distribution of study participants by working years………….…..……55
Figure (4.4): Distribution of participants by exposure to environmental poisons.…...59
Figure (4.5): Distribution of participants by amount of drinking water daily……..…62
XI
LIST OF ABBREVIATIONS ACR Albumin to Creatinine Ratio
AIDS Acquired Immune Deficiency Syndrome
BNHI Bureau of National Health Insurance
BUN Blood Urea Nitrogen
CAPD Continuous Ambulatory Peritoneal
Dialysis
CAT Chronic Arsenic Toxicity
CAT scan Computed Axial Tomography scan
CCPD Continuous Cycler-assisted Peritoneal
Dialysis
Cm Centimeter
CRF Chronic Renal Failure
CT scan Computerized Tomography scan
DM Diabetes mellitus
eGFR estimate Glomerular Filtration Rate
ESRD End-Stage Renal Disease
ESRF End-Stage Renal Failure
GFR Glomerular Filtration Rate
HT Hypertension
IVP Intravenous Pyelography
L3 3rd
Lumbar spine segment
MDRD Modification of Diet in Renal Disease
Mg Milligram
mL Milliliter
MRI Magnetic Resonance Imaging
NCD Non Communicable Diseases
NKF KDOQI™ National Kidney Foundation developed
criteria, as part of its Kidney Disease
Outcomes Quality Initiative
NSAIDs Non-Steroidal Anti-Inflammatory Drugs
PCBS Palestinian Central Bureau of Statistics
Pmp or p.m.p per million population
RF Renal Failure
RRT Renal Replacement Therapy
SES Socioeconomic Status
SPSS Statistical Package for Social Sciences
T12 12th
Thoracic Vertebra
TDS Total dissolved solids
WHO World Health Organization
1
Chapter 1 : Introduction
1.1. Research background:
Renal failure (RF) results when the kidneys cannot remove the body’s metabolic
wastes or perform their regulatory functions; the substances normally eliminated in
the urine accumulate in the body fluids as a result of impaired renal excretion, leading
to a disruption in endocrine and metabolic functions as well as fluid, electrolyte, and
acid–base disturbances; renal failure is a systemic disease and is a final common
pathway of many different kidney and urinary tract diseases; each year, the number of
deaths from irreversible renal failure increases. (Smeltzer S., et.al 2008).
Chronic renal failure (CRF) is currently recognized as an important global population
health problem. In developed countries, the progressive increase in numbers of
chronic renal failure patients and those requiring renal replacement therapy (RRT) is
reaching epidemic levels, growing by 5–8% annually, although data are scarce for
developing countries, it is estimated that by 2030, 70% of patients with End Stage
Renal Disease (ESRD, stage 5 CKD), will be in developing countries where such
growing demand will outstrip the budgetary capabilities of health care systems.
(Orantes C., et.al 2011).
Although the health and medical achievements in the health sector and elimination of
diseases had been developed since the early period, but that did not prevent the
existence and prevalence of chronic renal failure. The intensity has been increased in
recent times in the Arab and European countries and estimated the median percentage
of the number of patients to European countries is about (296) cases per million
inhabitants, while in the countries of the Arab world is estimated between (80-122)
cases per million inhabitants. (Medokh H., 2013).
In Palestine and Gaza governorates specifically, despite the development of health
and progress through the creation of many of the hospitals and health centers
widespread throughout Gaza governorates, but that did not prevent the spread of some
diseases, especially chronic renal failure, which is one of the chronic diseases and
serious that spread in the Gaza governorates.
Chronic renal failure is a key component of Non Communicable Diseases (NCD). In
developing countries such as India, non‐communicable diseases (for example; cardio
vascular disease, chronic renal disease) are the major cause of mortality compared
with communicable diseases (for example; infections in the form of diarrhea,
respiratory tract infections, tuberculosis). There is no concrete data on the true
incidence and prevalence of chronic renal failure in the developing world. (Johnson
S., et.al 2012).

2
Disparities in the prevalence and progression of kidney disease are generally thought
to be a function of group of differences in the prevalence of kidney disease risk
factors such as diabetes, hypertension, obesity, family history of hypertension and
kidney disease, low birth weight, prenatal kidney injury and congenital injury.
However, there are many environmental and social factors that believed to be a cause
of the chronic renal failure.
It is believed that environmental factors cause the chronic renal failure include:
occupational exposures, residence in the inner city or 'urban' location, exposure to
industrial chemicals, drinking unsafe water, exposure to pesticides, environmental
toxins such as snake bites, and some other factors .
Social factors for chronic renal failure include: age, gender, heredity, husband
relative, poverty and income, lack of health insurance, educational attainment,
substance abuse, diet and stress. (Bruce M., et.al 2009).
1.2. Research problem:
This thesis focuses on one of the important health problem in both developed and
developing countries, namely chronic renal failure (CRF).
Renal failure became represents a difficult challenge for all countries in the world
where reports showed that morbidity rate of chronic renal failure are high and there
are (500 million) people in the world suffering from chronic renal failure by the year
2011. (Medokh H., 2013).
Chronic renal failure is increasing in the Gaza governorates. Statistics indicate that the
number of Palestinian people living with chronic renal failure in the Gaza
governorates in 2003 (236) case, while in the year 2007 (322) case, and the number of
deaths for the year 2007 reached (89) deaths, either in the year 2011 the number of
people with chronic renal failure (394) case and the number of deaths in 2011 reached
(104) deaths.
In 2012 chronic renal failure has been considered in the seventh rank among the major
diseases that can cause the death, in the rate of 4.6% of the total mortality in Palestine;
while in the year 2013 it has been considered in the eighth rank, in the rate of 4.3%;
either in the 2014 also it has been considered in the eighth rank, in the rate of 3.9% of
the total mortality in Palestine. (Palestinian Central Bureau of Statistics).
Finally in the 2015, the number of chronic renal failure patients reached (524) patients
in the Gaza governorates hospitals.
All of this confirms the seriousness of the chronic renal failure and the need for
response to this disease by scientific methods to understand, interpret and avoid this
disease.
3
1.3. Significant:
Chronic renal failure increases in the Gaza governorates by the time, and there is a
lack of actual scientific research about the effect of environmental and social factors
on patients with chronic renal failure.
Because of the environmental and social factors are an important direct and indirect
determinants of health, and deteriorating environmental and social conditions are
major contributory factors to poor health. This study aims to solve the important
problem of public health that affects to the population, and deal with the spread of
chronic renal failure disease which is one of the most important causes of death
globally and locally. It also aims to provide the responsible, hospitals, health staff and
those interested in the results of this study to take advantage of it.
1.4. Objectives of the study:
1.4.1. General objectives of the study:
The general objective of the study is to evaluate the effect of environmental and social
factors on adult patients with chronic renal failure in Gaza governorates.
1.4.2. Specific objectives of the study:
1. To determine the geographic distribution of chronic renal failure in Gaza
governorates and the prevalence of each governorate.
2. To identify the environmental factors that are related to patients with chronic
renal failure.
3. To identify the social factors that are related to patients with chronic renal
failure.
4. To demonstrate the source of drinking water for the patient with chronic renal
failure before and after the disease.
5. To explore the level of patient's knowledge about chronic renal failure.
1.5. Research questions:
1. What is the medical history of the patients with chronic renal failure?
2. What are the governorate that contains the largest number of patients with
chronic renal failure and the prevalence of each governorate?
3. Are the environmental factors (occupational exposures, residence in the inner
city or "urban" location, exposure to industrial chemicals, drinking unsafe
water, exposure to pesticides, environmental toxins) associated with chronic
renal failure in Gaza governorates?
4
4. Are the social factors (age, gender, heredity, husband relative, poverty and
income, lack of health insurance, educational attainment, substance abuse,
diet, and stress) associated with chronic renal failure in Gaza governorates?
5. What is the source of drinking water for the patients with chronic renal failure
before and after the disease ?
6. What is the level of patient's knowledge and awareness about chronic renal
failure?
1.6. Feasibility and cost:
This study was conducted at hospitals in Gaza governorates as requirements for the
study at department of Environmental & Earth sciences/Environmental Health,
Islamic University-Gaza.
Discussion and exchange of ideas with responsible persons from department of
Environmental & Earth sciences, general primary health care, governmental hospitals
directors, and different specialties made the implementation of this study more
feasible. This study was self-funded; the researcher was responsible for all needed
cost. It is supervised by department of Environmental & Earth sciences, and nursing
collage at Islamic University-Gaza; and carried out with co-ordination between
department of Environmental & Earth sciences, nursing collage, artificial kidney
department at four hospitals in Gaza governorates "Al Shifa hospital, Shohada Al
Aqsa hospital, Abu Youssef Al Najar hospital, and Nasser hospital".
1.7. Context of the study:
1.7.1. Environmental context:
Gaza strip is a semi-arid region of roughly 365 km2 which lies on the Mediterranean
Sea. On this narrow strip, almost 1.82 million of the Palestinian people live and work.
The ground water is used for irrigation, as well as for industrial and domestic
purposes. A "Catastrophic" water shortage, water pollution with high salinity and
micro-pollutants, lack of sewage and solid waste treatment, maritime pollution,
overcrowding, poverty and uncontrolled use of pesticides are the most pressing
environmental problems in Gaza strip.
Mediterranean sea is used for the disposal of sewage water, solid wastes, agricultural
and industrial waste water. There is absence of environmental policy, awareness,
education and legislation. In general these environmental problems have multiplied
the Palestinians human environment problems, socio-economic problems and
increasing health hazards. Therefore, the environment in Gaza strip requires a more
thoughtful and comprehensive policy and planning of awareness and conservation.
5
There is need for regional and international support and cooperation in the fields of
building the infrastructure of Gaza strip environment and the environmental policy,
planning, strategy, legislation, information, awareness, education, monitoring, impact
assessment, protection and pollution control.
The main source of water in Gaza strip is the ground water (about 5000 well) which is
used for irrigation as well as for industrial and domestic purposes. The total
consumption about 120 million cubic meter (MCM)/year and the recharge about 70
MCM /year. In fact, per capita water consumption in Gaza strip is less 4– 5 times
other countries. This has led to the depletion of available quantities in Gaza strip and
reduction of ground water storage as well as the degradation of water quality.
Water sources in Gaza strip are subjected to excessive over-exploitation and over-
pumping , this has led to degradation of water quality in Gaza strip, where sever water
shortage are experienced and where the situation has become catastrophic.
It is clear that the problems facing Gaza strip may be not only the shortage of water
(about 50 MCM/year) but also pollution of this water with different pollutants
(salinity such as chloride and nitrate and micro-pollutants such as pesticides ,
fertilizers , detergents and heavy metals). In some areas of Gaza strip the quality of
water is deteriorating and it is declared that not only unfit for human consumption but
also, to some extent, for agricultural uses. For example chloride and nitrate
concentration in some wells reaches more than 1500 and 100 ppm respectively.
In addition to the over – pumping, the absence of an effective water supply network in
Gaza strip produces high losses of water extracted and contaminates domestic water
supply in some areas.
Gaza strip produced about 35 MCM/Year sewage water. Unfortunately more than
50% the raw sewage is discharged untreated in the Mediterranean sea where the
biological oxygen demand increases. Therefore, the surface water pollution represents
a real threat to the life of organisms and humans. The rest of sewage is collected in
three central sewage collecting pools with semi treatment such as the first step of
primary treatment which is the aeration and sometimes the secondary treatment.
When these pools filled with sewage water, it's flooded aside and pollutes the ground
water because our aquifer is shallow.
Sewage networks cover no more than 70 % of total residential areas in the Gaza strip.
So far, there is no adequate sewage collection and treatment facilities where use of
septic tanks to drain waste water is still widespread thus causing, through leakage , the
contamination and pollution of the aquifers which are already over - pumped and
increasingly saline.
Open sewage channels spread in some parts of the Gaza strip , particularly in refugee
camps, creating health hazards through the accumulation of garbage and wastes.
6
Gaza strip produced about 0.68 MCM/Year solid waste. There is no enough dumping
sites, sanitary landfills, containers and vehicles. Therefore, the solid waste is,
unfortunately, sometimes thrown everywhere. Efficient waste disposal machinery is
to some extent absent. Gaza strip utilizes the old method of landfills to dispose of
refuses in nature thus negatively affecting the environment.
This of course leads, in turn, to the spread of diseases and increases the difficulties
encountered for disposal. More than 350 metric tons of formulated pesticides (more
than 100 pesticides) in addition to 800 metric tons of Methyl Bromide are used
annually in Gaza strip. Such heavy use of pesticides causes water pollution and soil
degradation and contamination of the agricultural products which finally affects
seriously the human and animals. It was found that 19 of these pesticides, that have
been used, are internationally suspended, cancelled and banned pesticides, according
to their mutogencity, carcinogencity, teratogencity and delayed neurtoxicity.
In Gaza strip there is a large number of transportation means estimated at about
35,000 to 45,000 motor vehicles, that constitute the major source of air pollution.
What adds to the problem that cars available in Gaza strip are old and outdated. Car
exhausts release to the ambient air large quantities of carbon monoxide, carbon
dioxide, nitrogen oxides, hydrocarbons and lead that are considered very poisonous
and some may be carcinogenic and may affect the respiratory and nervous system.
Melting Lead and burning solid wastes are other major sources of air pollution in
Gaza. (Environmental Quality Authority,2008).
1.7.2. Demographic context:
The population in Palestine reached to 4,18 million in the middle of 2015. Among
them there are 2,38 males and 2,30 females with gender rate estimated with 103,3
male for 100 female. In Gaza governorates, the number of population estimated for
the same year around 1,82 million between them 925 thousands for males and 895
thousands for females.
Gaza governorate considered as one of the most populated governorate in Gaza strip,
where the number estimated with 626 thousands of people, while in Rafah
governorate it is the least populated area in Gaza governorates, and the number of
population estimated with 226 thousands of people.
The population density in Palestine is high in general and in Gaza governorates in
particular, due to the concentration of 1.82 million people in an area of no more than
365 square kilometer, the majority of them are Palestinian refugees who forced to
leave their villages in 1948. In addition to the high normal growth which the
Palestinian society characterized by it. where the estimated density for 2015 about
778 person/km2. Distributed at 506 person/ km
2 in the west bank, while 4,986
person/kilometer in Gaza governorates; see figure (1.1). (PCBS, The conditions of the
resident population in 2015).

7
Figure (1.1): Population in Palestine, 2015. (PCBS,2015).
1.7.3. Socio-economic context:
Participation in the workforce is considered as a key indicator of the extent of job
market activity and effectiveness in providing job opportunities. The result of
comprehensive survey for workforce, pointed that the percentage of participation in
Palestine reached 45.6 % from the total of man power (the individuals who are 15
years or more) during the first quarter in 2015 (that's mean that there is among 10
persons their ages 15 years or more there are 4 participants individuals in man power).
That involves 45.6% in west bank and 45.5% in Gaza governorates.
The percentage of female participation in the workforce is very low, if it is compared
with the male, where the percentage of female participation reached to 18.8%, (18.3%
in the West Bank, and 19.7% in Gaza governorates), compared with the percentage of
males in the workforce, that reached to 71.7%, (72.2% in the West Bank and 70.7%
in Gaza governorates). Workforce is divided into two categories, the first category is
the employees, and the second is the unemployed. The employees are categorized into
full employees, and time-related underemployed, also the percentage of employees in
Palestine of the total participants in the workforce reached 74.4%, 3.6% of them
classified as underemployed.
Palestinian data indicate that in 2014 the percentage of individuals (15 years and
more) who have completed their undergraduate degree and higher education has
reached 12.5%, by 12.5% for males compared with 12.4% for females. While the
percentage of persons who didn’t complete any educational stage amounted to 9.6%,
by 7.3% for males compared with 11.8% for females.
506
4,986
0
1000
2000
3000
4000
5000
6000
west bank Gaza strip
Po
pu
latio
n d
en
sity (
pe
rso
ns / k
m 2
)
area
8
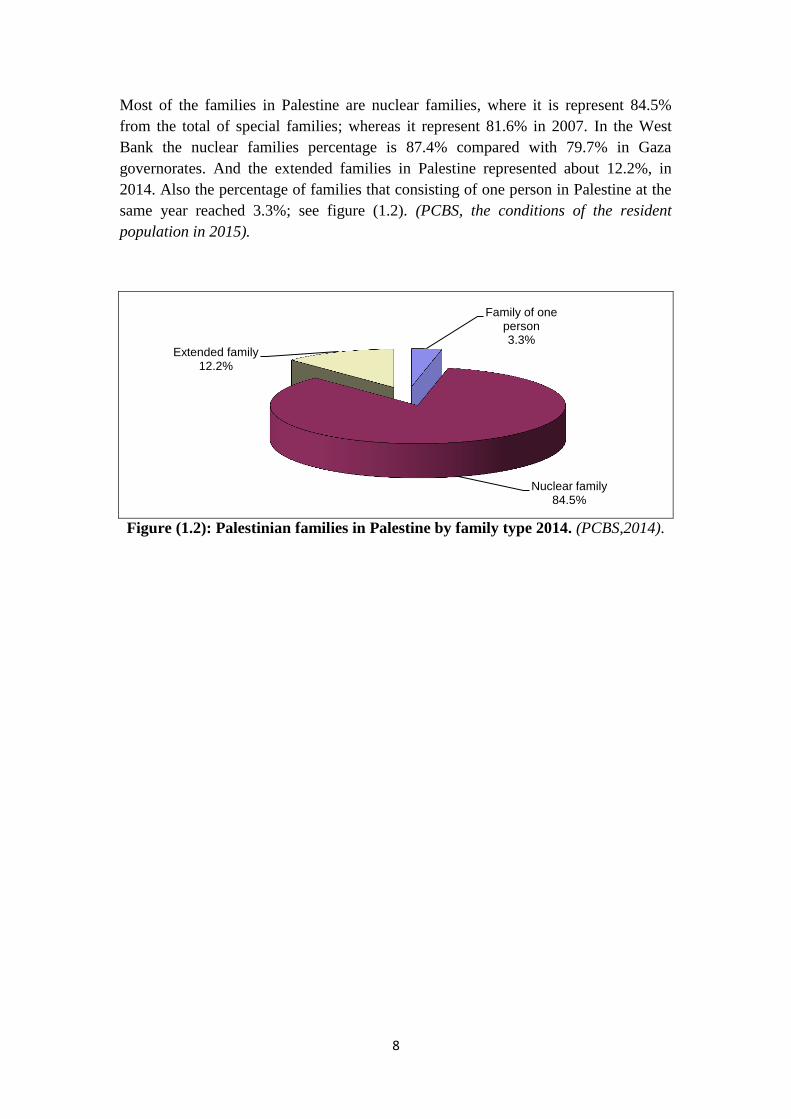
Most of the families in Palestine are nuclear families, where it is represent 84.5%
from the total of special families; whereas it represent 81.6% in 2007. In the West
Bank the nuclear families percentage is 87.4% compared with 79.7% in Gaza
governorates. And the extended families in Palestine represented about 12.2%, in
2014. Also the percentage of families that consisting of one person in Palestine at the
same year reached 3.3%; see figure (1.2). (PCBS, the conditions of the resident
population in 2015).
Figure (1.2): Palestinian families in Palestine by family type 2014. (PCBS,2014).
Family of one person 3.3%
Nuclear family 84.5%
Extended family 12.2%

9
Chapter 2 : Theoretical framework and literature review:
2.1. Chronic renal failure:
Chronic renal failure, or ESRD, is a progressive, irreversible deterioration in renal
function, in which the body’s ability to maintain metabolic and fluid and electrolyte
balance fails, resulting in uremia or azotemia (retention of urea and other nitrogenous
wastes in the blood). (Smeltzer S., et.al 2008).
2.1.1 Location and structure of the kidneys:
The kidney lies against the dorsal body wall in a retroperitoneal position (beneath the
parietal peritoneum) in the superior lumber region. The kidneys extend from the T12 to
the L3 vertebra; thus they receive some protection from the lower part of rib cage.
Because it is crowded by the liver, the right kidney is positioned slightly lower than
the left. An adult kidney is about 12 cm (5 inches) long, 6 cm (2.5 inches) wide, and 3
cm (1 inches) thick, about the size of a large bar of soap. It is convex laterally and has
a medial indentation called hilus. Several structures, including the ureters, the renal
blood vessels, and nerves, enter or exit the kidney at the hilus. Atop each kidney is an
adrenal gland, which is part of the endocrine system and is a distinctly separate organ
functionally. A fibrous, transparent renal capsule encloses each kidney and gives a
fresh kidney a glistening appearance. A fatty mass, the adipose capsule, surrounds
each kidney and helps hold it in place against the muscles of the trunk wall. See figure
(2.1). (Marieb E., 2003).
Figure (2.1): Anterior view of urinary organs of female.
11
2.1.2 Functions of the normal kidneys:
Each kidney contains up to a million functioning units called nephrons. A nephron
consists of a filtering unit of tiny blood vessels called a glomerulus attached to a
tubule. When blood enters the glomerulus, it is filtered and the remaining fluid then
passes along the tubule. In the tubule, chemicals and water are either added to or
removed from this filtered fluid according to our body needs.
The kidney is primarily responsible for the removal of metabolic waste from the
body; in addition the kidneys do the following functions: regulation of water and
electrolyte balance, excretion of bioactive substances (hormones and many foreign
substances, specifically drugs), regulation of arterial blood pressure, regulation of red
blood cells production, regulation of vitamin D production, and gluconeogenesis.
(Basheer K., 2011).
2.1.3 Pathophysiology of chronic renal failure:
As renal function declines, the end products of protein metabolism (which are
normally excreted in urine) accumulate in the blood. Uremia develops and adversely
affects every system in the body. The rate of decline in renal function and progression
of chronic renal failure is related to the underlying disorder, the urinary excretion of
protein, and the presence of hypertension. The disease tends to progress more rapidly
in patients who excrete significant amounts of protein or have elevated blood pressure
than in those without these conditions. (Smeltzer S., et.al 2008).
2.1.4 Causes and risk factors of chronic renal failure:
Chronic renal failure may be caused by systemic diseases, such as diabetes mellitus
(leading cause); hypertension; chronic glomerulonephritis; pyelonephritis; obstruction
of the urinary tract; hereditary lesions, as in polycystic kidney disease; vascular
disorders; infections; medications; or toxic agents. Also environmental and
occupational agents that have been implicated in chronic renal failure include lead,
cadmium, mercury, and chromium. (Smeltzer S., et.al 2008).
The principal reported causes of CKD worldwide are diabetes mellitus (DM) (30–
40%), and hypertension (HT) (25–30%), associated primarily with behavioral risk
factors, and aging. Recognized environmental risk factors for CKD include exposure
to heavy metals (lead, cadmium, arsenic, mercury and uranium); agrochemicals; and
nephrotoxic substances such as aristolochic acid, and some Chinese herbal remedies.
Other CKD risk factors described are use of nonsteroidal anti-infl ammatory drugs
(NSAIDs), and the infectious diseases leptospirosis, hantavirus, leprosy and malaria
(endemic in Central America). Other rare causes include heat stroke in mine workers
and repeated episodes of rhabdomyolysis. (Orantes C., et.al 2011).
11
Risk factors make it more likely that a disease will develop later. There are some risk
factors, like age or family history, that we cannot control. But we can control other
risk factors, and perhaps slow down or even prevent some diseases. For instance,
controlling blood pressure and blood sugar may help your kidneys work longer.
Chronic renal failure include the following risk factor:
1) Modifiable risk factors:
a) Diabetes:
Some studies showed that almost 40% of new dialysis patients have diabetes, making
it the fastest growing risk factor for kidney disease. Type 2 diabetes is the number one
cause of kidney failure, responsible for more than one of every three new cases.
b) High blood pressure (Hypertension):
High blood pressure puts more stress on blood vessels throughout the body, including
the kidney filters (nephrons). Hypertension is the number two cause of kidney failure.
c) Blockages:
Scarring from infections or a malformed lower urinary tract system (birth defect) can
force urine to back up into the kidney and damage it. Blood clots or plaques of
cholesterol that block the kidney’s blood vessels can reduce blood flow to the kidney
and cause damage. Repeated kidney stones can block the flow of urine from the
kidney and are another kind of obstruction that can damage the kidneys.
d) Overuse of painkillers and allergic reactions to antibiotics
Heavy use of painkillers containing ibuprofen (Advil, Motrin), naproxen (Aleve), or
acetaminophen (Tylenol) have been linked to interstitial nephritis, a kidney
inflammation that can lead to kidney failure.
e) Drug abuse
Use of certain non-prescription drugs, such as heroin or cocaine, can damage the
kidneys, and may lead to kidney failure and the need for dialysis.
f) Inflammation
Certain illnesses, like glomerulonephritis (inflammation of the filtering units of the
kidneys), can damage the kidneys, sometimes enough to cause CKD. Some
glomerulonephritis is inherited, and some may be an immune response to infections
like strep throat.

12
2) Non modifiable risk factors.:
a) Family history of kidney disease
Persons that have one or more family members who have CKD, are on dialysis, or
have a kidney transplant, they may be at higher risk.
b) Premature birth
Some study showed that about one in five very premature infants (less than 32 weeks
gestation) may have calcium deposits in parts of the kidney called nephrons. This is
termed nephrocacinosis. Sometimes, individuals with this condition may go on to
develop kidney problems later in life.
c) Age
Since kidney function is reduced in older people, the older are, at the greater risk.
d) Trauma/accident
Accidents, injuries, some surgeries, and certain radiocontrast dyes that doctors use to
monitor blood flow to heart and other organs can damage the kidneys or reduce blood
flow to the kidneys, causing acute (temporary) kidney failure. Sometimes acute
kidney failure will get better, but it may lead to CKD.
e) Certain diseases
Having certain diseases puts people at higher risk for kidney disease. These diseases
include systemic lupus erythematosus (a connective tissue disease), sickle cell
anemia, cancer, AIDS, hepatitis C, and congestive heart failure.
(http://www.lifeoptions.org) accessed on 12/8/2015.
2.1.5 Chronic renal failure classification and stages:
Chronic renal failure is the presence of kidney damage, manifested by abnormal
albumin excretion or decreased kidney function, quantified by measured or estimated
glomerular filtration rate (GFR), that persists for more than three months. Although
creatinine clearances can be calculated from urine creatinine concentration measured
in a 24 hour urine collection and a concomitant serum creatinine concentration, a
more practical approach in the office is to estimate GFR (estimated GFR or eGFR)
from the serum creatinine concentration, using either the Cockcroft-Gault or the
Modification of Diet in Renal Disease (MDRD) Study estimating equations.

13
To facilitate assessment of CKD severity and, the National Kidney Foundation
developed criteria, as part of its Kidney Disease Outcomes Quality Initiative (NKF
KDOQI™), stratify CKD patients:
- Stage 1: normal eGFR ≥ 90 mL/min per 1.73 m2 and persistent albuminuria.
- Stage 2: eGFR between 60 to 89 mL/min per 1.73 m2.
- Stage 3: eGFR between 30 to 59 mL/min per 1.73 m2.
- Stage 4: eGFR between 15 to 29 mL/min per 1.73 m2.
- Stage 5: eGFR of < 15 mL/min per 1.73 m2 or end-stage renal disease.
(Thomas, R., et.al, 2008).
2.1.6 Signs and symptoms of chronic renal failure:
- Neurological system: cognitive impairment, personality change, asterixis
(motor disturbance that affects groups of muscles), seizures (rare).
- Gastrointestinal system: nausea, vomiting, food distaste (often described as
bland, metallic, "like cardboard").
- Blood-forming system: anemia due to Erythropoietin deficiency, easy bruising
and bleeding due to abnormal platelets.
- Pulmonary system: fluid in the lungs, with breathing difficulties.
- Cardiovascular system: chest pain due to inflammation of the sac surrounding
the heart (pericarditis) and pericardial effusion (fluid accumulation around the
heart).
- Skin: generalized itching.
(http://www.healthcommunities.com/chronic-renal-failure/symptoms.shtml). accessed
on 12/8/2015.

14
2.1.7 Diagnosis of chronic renal failure:
Diagnosis of ESRD typically requires the physician’s review of the patient’s medical
history as well as a physical examination. A patient with a history of chronic kidney
disease that has progressed may be suspected of having ESRD. The physical
examination includes tests to determine the advancement of the kidney disease and
will likely include a measurement of a patient’s blood pressure. Additional tests that
may be performed include the following:
- Blood tests: for serum creatinine, Blood Urea Nitrogen (BUN) and other waste
products indicate the filtration capacity and health of the kidneys.
- Glomerular filtration rate (GFR): An indirect measurement of kidney
filtering function. GFR traditionally requires an injection of a substance into
the patient’s body, followed by analysis of a 24-hour urine sample. However,
GFR may now be estimated based on the results of a blood test. ESRD is
indicated by GFR of less than 15 milliliters per minute.
- Microalbuminuria test: Urine test that detects small amounts of protein. This
test is used to detect early kidney disease.
- Urinalysis: Standard test that will detect larger amount of protein in the urine
(proteinuria), an indicator of severe kidney disease.
- Imaging tests: such as ultrasound, CT scan, CAT scan (computed axial
tomography), MRI (magnetic resonance imaging) or a type of x-ray called
Intravenous Pyelography (IVP) may be performed. This testing may be helpful
to identify any possible blockages in the urinary tract.
- Kidney biopsy: performed sometimes to examine the health of the kidney
tissue.
(Basheer K., 2011).
2.1.8 Treatment of chronic renal failure:
2.1.8.1 . Pharmacologic therapy:
Complications can be prevented or delayed by administering prescribed
Antihypertensive, erythropoietin (Epogen), iron supplements, phosphate-binding
agents, and calcium supplements. (Smeltzer S., et.al 2008).
2.1.8.2 . Nutritional therapy:
Dietary intervention is necessary with deterioration of renal function and includes
careful regulation of protein intake, fluid intake to balance fluid losses, sodium intake
to balance sodium losses, and some restriction of potassium. At the same time,
adequate caloric intake and vitamin supplementation must be ensured.

15
Protein is restricted because urea, uric acid, and organic acids—the breakdown
products of dietary and tissue proteins—accumulate rapidly in the blood when there is
impaired renal clearance. The allowed protein must be of high biologic value (dairy
products, eggs, meats). High-biologic-value proteins are those that are complete
proteins and supply the essential amino acids necessary for growth and cell repair.
Usually, the fluid allowance is 500 to 600 ml more than the previous day’s 24-hour
urine output. Calories are supplied by carbohydrates and fat to prevent wasting.
Vitamin supplementation is necessary because a protein-restricted diet does not
provide the necessary complement of vitamins. Additionally, the patient on dialysis
may lose water-soluble vitamins from the blood during the dialysis treatment.
(Smeltzer S., et.al 2008).
2.1.8.3 . Hemodialysis:
Hemodialysis cleans and filters blood using a machine to temporarily rid body of
harmful wastes, extra salt, and extra water. Hemodialysis helps control blood pressure
and helps body keep the proper balance of important chemicals such as potassium,
sodium, calcium, and bicarbonate.
Hemodialysis uses a special filter called a dialyzer that functions as an artificial
kidney to clean blood. The dialyzer is a canister connected to the hemodialysis
machine.
During treatment, blood travels through tubes into the dialyzer, which filters out
wastes, extra salt, and extra water. Then the cleaned blood flows through another set
of tubes back into body. The hemodialysis machine monitors blood flow and removes
wastes from the dialyzer.
Hemodialysis is usually done three times a week. Each treatment lasts from 3 to 5 or
more hours. (Owen W., and Swartz R.,2007).
2.1.8.4 . Peritoneal dialysis:
Peritoneal dialysis is another procedure that removes wastes, chemicals, and extra
water from body. This type of dialysis uses the lining of abdomen, or belly, to filter
blood. This lining is called the peritoneal membrane and acts as the artificial kidney.
A mixture of minerals and sugar dissolved in water, called dialysis solution, travels
through a catheter into belly. The sugar called dextrose, draws wastes, chemicals, and
extra water from the tiny blood vessels in peritoneal membrane into the dialysis
solution. After several hours, the used solution is drained from abdomen through the
tube, taking the wastes from blood with it. Then the abdomen is refilled with fresh
dialysis solution, and the cycle is repeated. The process of draining and refilling is
called an exchange. (Owen W., and Swartz R.,2007).
16
There are three types of peritoneal dialysis:
A. Continuous ambulatory peritoneal dialysis (CAPD):
CAPD requires no machine and can be done in any clean, well-lit place with CAPD,
the blood is always being cleaned. The dialysis solution passes from a plastic bag
through the catheter and into abdomen, where it stays for several hours with the
catheter sealed. The time period that dialysis solution is in abdomen is called the
dwell time. Next, drain the dialysis solution into an empty bag for disposal. Then
refill abdomen with fresh dialysis solution so the cleaning process can begin again.
With CAPD, the dialysis solution stays in abdomen for a dwell time of 4 to 6 hours,
or more. The process of draining the used dialysis solution and replacing it with fresh
solution takes about 30 to 40 minutes. Most people change the dialysis solution at
least four times a day and sleep with solution in their abdomens at night. With CAPD,
it’s not necessary to wake up and perform dialysis tasks during the night.
B. Continuous Cycler-assisted Peritoneal Dialysis (CCPD):
CCPD uses a machine called a cycler to fill and empty abdomen three to five times
during the night while the patent sleep. In the morning, the patient begin one
exchange with a dwell time that lasts the entire day. The patent may do an additional
exchange in the middle of the afternoon without the cycler to increase the amount of
waste removed and to reduce the amount of fluid left behind in body.
C. Combination of CAPD and CCPD:
If the patient weighs more than 175 pounds (about 80 kilograms) or if peritoneum
filters wastes slowly, the patient may need a combination of CAPD and CCPD to get
the right dialysis dose. For example, some people use a cycler at night but also
perform one exchange during the day. Others do four exchanges during the day and
use a minicycler to perform one or more exchanges during the night. (Owen W., and
Swartz R.,2007).
2.1.8.5 . Kidney Transplantation:
Kidney transplantation surgically places a healthy kidney from another person into
patient body. The donated kidney does enough of the work that patient's two failed
kidneys used to do to keep patient healthy and symptom free.
A surgeon places the new kidney inside lower abdomen and connects the artery and
vein of the new kidney to artery and vein. The patient blood flows through the
donated kidney. The new kidney may start working right away or may take up to a
few weeks to make urine. Unless kidneys are causing infection or high blood
pressure, they are left in place. (Owen W., and Swartz R.,2007).
17
2.1.9 Complications of chronic renal failure:
Chronic renal failure can affect almost every part of your body; potential
complications may include:
- Fluid retention, which could lead to swelling in arms and legs, high blood
pressure, or fluid in lungs (pulmonary edema).
- A sudden rise in potassium levels in blood (hyperkalemia), which could impair
heart's ability to function and may be life-threatening.
- Heart and blood vessel disease (cardiovascular disease(.
- Weak bones and an increased risk of bone fractures.
- Anemia.
- Decreased sex drive or impotence.
- Damage to central nervous system, which can cause difficulty concentrating,
personality changes or seizures.
- Decreased immune response, which lead to more vulnerable to infection.
- Pericarditis, an inflammation of the sac-like membrane that envelops heart
(pericardium).
- Pregnancy complications that carry risks for the mother and the developing
fetus.
(http://www.mayoclinic.org/diseases-conditions/kidney-disease/basics/complications).
accessed on 15/8/2015.
2.2 Incidence and prevalence of chronic renal failure:
2.2.1 Incidence and prevalence of chronic renal failure worldwide:
CKD is currently recognized as an important global population health problem. In
developed countries, the progressive increase in numbers of CKD patients and those
requiring renal replacement therapy (RRT) is reaching epidemic levels, growing by 5–
8% annually. Although data are scarce for developing countries, it is estimated that by
2030, 70% of patients with end stage renal disease (ESRD, stage 5 CKD), will be in
developing countries where such growing demand will outstrip the budgetary
capabilities of health care systems. Population-based epidemiological studies in
several countries have found high CKD prevalence in its different stages, estimated at
10.0%–16.0% of the adult population. Prevalence of chronic renal failure (CRF,
stages 3–5 CKD) in the adult population is 1.4%–6.3%. In central America and
southern Mexico, an increase in CKD has been reported in the past decade. Results of
epidemiological studies vary, referring to high prevalence in coastal areas in male
farmers, primarily aged <60 years, who are exposed to agrochemical products in
combination with presence of other risk factors. The 2004 Latin American dialysis
and kidney transplantation registry reported incidence and prevalence of RRT at 147
and 447 per million population (pmp) respectively, and increasing. However, due to

18
great social inequality in this region, only 5%–15% of patients needing dialysis
receive it. In 2008, El Salvador reported 3342 patients on RRT, 715 on continuous
ambulatory peritoneal dialysis, 745 on hemodialysis and 1413 on intermittent
peritoneal dialysis. By then, 469 live-donor kidney transplants had been performed. In
2009, the prevalence of CRF patients on RRT was 566 pmp. (Orantes C., et.al 2011).
In 1995, the incidence of new ESRF patients to general population was 120 p.m.p.
(per million population) with a clear north to south/west gradient (69 in Ireland, 131
in Italy and 163 in Germany). The incidence of ESRF deaths was 67 p.m.p. (from 35
in Ireland to 89 in Germany). The net increase of patients was therefore 53 p.m.p.
(from 13 in Greece to 74 in Germany). The point prevalence of treated ESRF patients
alive on 31 December 1995 was 644 p.m.p. (from 444 in Finland to 773 in Italy).
(Berthoux F., et.al. 1999).
During 1996,( 283,932) patients were treated for ESRD and (73,091) new patients
started ESRD treatment in the USA. Incidence and prevalence rates tend to increase
with age. The largest group of patients falls in the 45 to 64- year age group. The
disease was more common in men than women. Black race constituted 30% to 32% of
treated ESRD patients in contrast to 12.6% of the US population. In 1998, the
incidence of treated ESRD in Europe ranged from 110 pmp in the Netherlands to 192
pmp in Germany. Even higher incidence rates were recorded in the same year in
countries outside Europe, such as the USA (>300 pmp) and Japan (200 pmp).
In 1998, the prevalence of treated ESRD in Europe ranged from 498 pmp in the UK to
854 pmp in Italy. Again, Japan and the USA recorded higher rates than European
countries, with prevalences of >1400 pmp and almost 1200 pmp, respectively. The
reported annual incidence of patients with ESRD varies widely, from as low as (4)
person per million population in Bolivia. Higher numbers (254) person per million
population in Puerto Rico. Incidence rates of (52) person per million populations and
(200) persons per million population were reported in Turkey and Egypt, respectively.
In India, an estimated incidence of ESRD of (100) person per million population.
Approximately (100,000) patients develop ESRD each year. (Arıkan H., and Tuğlular
S., 2005).
Another study showed that between 2004 and 2005, the number of Hispanic in the
United States grew by 3.6 percent to reach a total of 42.7 million (representing nearly
15% of the total US population), making this the fastest growing segment of the
population in the country. A large increase has also occurred in the Hispanic end stage
renal disease (ESRD) population. According to United States Renal Data System
(USRDS), in 2005, there were 12,000 new cases of ESRD treated with dialysis or
transplant in Hispanics, representing an increase of 63% since 1996. Hispanics have
an incidence rate of ESRD which is 1.5 times greater than for non-Hispanics Whites.
This increase in ESRD cases not only translates into an increased burden to health
care system, but also emphasizes the importance of better understanding risk factors
for chronic kidney disease (CKD) in Hispanics. (Lora C., et.al, 2009).

19
Renal replacement therapy and kidney transplantation are increasing burden on health
systems. This condition is particularly serious in developing countries where health
resources are inadequate. Worldwide, the number of patients receiving renal
replacement therapy (RRT)is estimated at more than (1.4) million, with an annual
incident rate growing to 8%. (Schieppati A., and Remuzzi G., 2005).
Another study conducted in France, which showed that the prevalence of dialysis
patients was (513.1) person per million populations, and total of number of patients
treated with renal dialysis is 30,882. A total of 30,882 patients residing in France were
treated with renal dialysis. The unadjusted prevalence of dialysis was 513.1 patients
per million population (pmp); 498.2 pmp in metropolitan France and 1,035.7 pmp in
the overseas territories. (Macron F., et.al. 2005).
Renal failure became represents a difficult challenge for all countries in the world.
Reports showed that morbidity rate of chronic renal failure are high and there are (500
million) people in the world suffering from chronic renal failure until the year 2011.
(Medokh H., 2013).
2.2.2 Incidence and prevalence of chronic renal failure in Arab world:
The population of the Arab countries is (350) million, with a growth rate of (3%)
(range 2.3-4.7), this considered as one of the highest growing rates in the world.
Compared to world growth estimates with an average of (1.7%). [Basheer K, 2011
(Jammal A.2009)].
The incidence of ESRD ranged from (64) patients per million populations in Yemen,
(212) patients per million populations in Qatar, and the table (2.1) shows the
incidence of ESRD in the Arab world.
Table (2.1): Incidence of ESRD in the Arab world 2006. (Abboud O., 2006).
Country
ESRD Incidence
(per million population)
Qatar 212
Egypt 200
Lebanon 120
Saudi Arabia 120
Kuwait 72
Jordan 70
Yemen 64
In the light of these estimates it is expected to have nearly (20.000) new cases of
ESRD every year. (Abboud O., 2006).
21
In Jordan, the number patient with chronic renal failure in 2011 reached to about 3373
cases; and the number of deaths from 1992 to 2011 nearly 673 deaths. (Medokh H.,
2013).
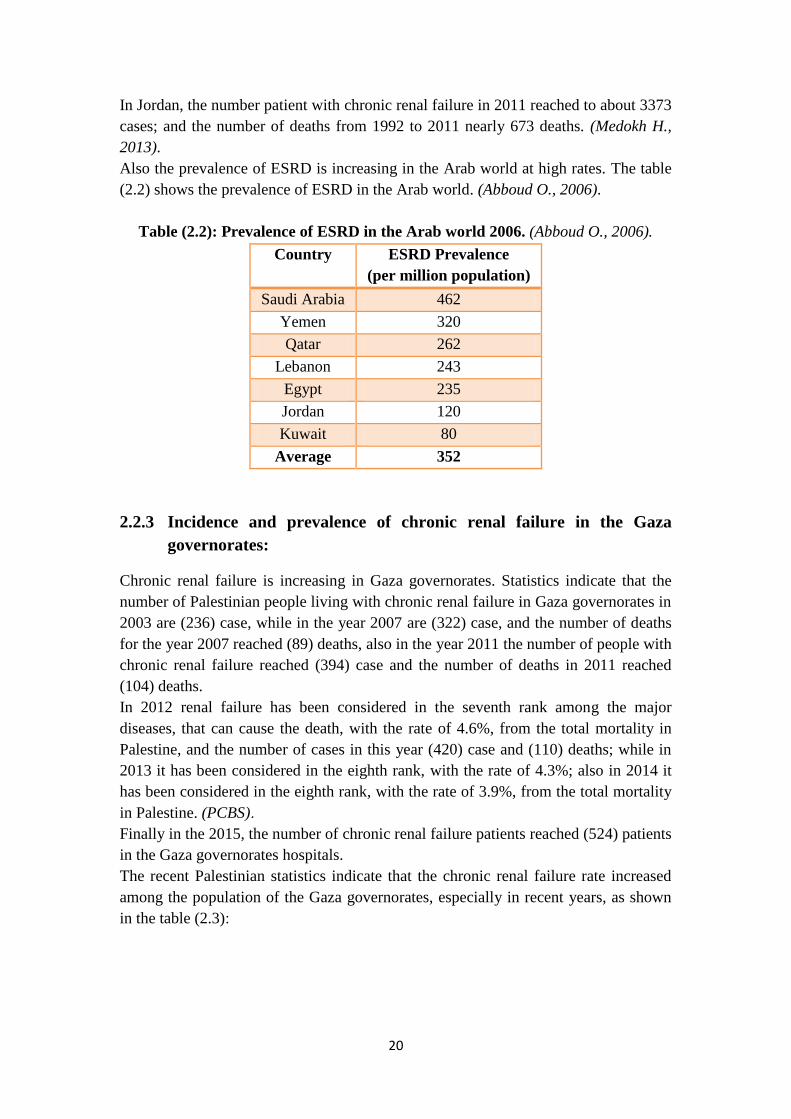
Also the prevalence of ESRD is increasing in the Arab world at high rates. The table
(2.2) shows the prevalence of ESRD in the Arab world. (Abboud O., 2006).
Table (2.2): Prevalence of ESRD in the Arab world 2006. (Abboud O., 2006).
Country
ESRD Prevalence
(per million population)
Saudi Arabia 462
Yemen 320
Qatar 262
Lebanon 243
Egypt 235
Jordan 120
Kuwait 80
Average 352
2.2.3 Incidence and prevalence of chronic renal failure in the Gaza
governorates:
Chronic renal failure is increasing in Gaza governorates. Statistics indicate that the
number of Palestinian people living with chronic renal failure in Gaza governorates in
2003 are (236) case, while in the year 2007 are (322) case, and the number of deaths
for the year 2007 reached (89) deaths, also in the year 2011 the number of people with
chronic renal failure reached (394) case and the number of deaths in 2011 reached
(104) deaths.
In 2012 renal failure has been considered in the seventh rank among the major
diseases, that can cause the death, with the rate of 4.6%, from the total mortality in
Palestine, and the number of cases in this year (420) case and (110) deaths; while in
2013 it has been considered in the eighth rank, with the rate of 4.3%; also in 2014 it
has been considered in the eighth rank, with the rate of 3.9%, from the total mortality
in Palestine. (PCBS).
Finally in the 2015, the number of chronic renal failure patients reached (524) patients
in the Gaza governorates hospitals.
The recent Palestinian statistics indicate that the chronic renal failure rate increased
among the population of the Gaza governorates, especially in recent years, as shown
in the table (2.3):

21
Table (2.3): Growing incidence and mortality for people with CRF patients in
Gaza governorates during the (2002-2015). (PCBS).
Number
of deaths
Number
of cases
Year
76 229 2002
95 263 2003
77 280 2004
74 294 2005
86 318 2006
89 322 2007
95 351 2008
90 356 2009
94 370 2010
104 394 2011
110 420 2012
- 524 2015
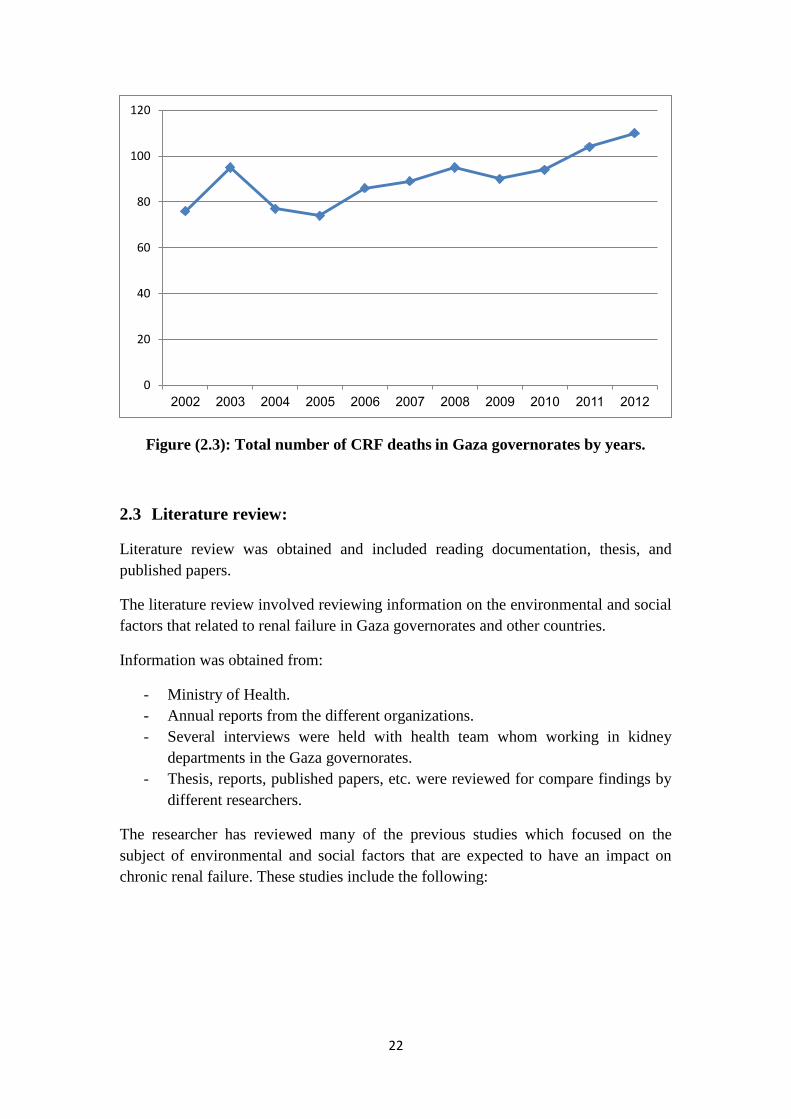
Also figure (2.2) show the total number of chronic renal failure cases in Gaza
governorates by years; as well as the figure (2.3) show the total number of chronic
renal failure deaths in Gaza governorates by years.
Figure (2.2): Total number of CRF cases in Gaza governorates by years.
0
100
200
300
400
500
600
2002 2003 2004 2005 2006 2007 2008 2009 2010 2011 2012 2015
22
Figure (2.3): Total number of CRF deaths in Gaza governorates by years.
2.3 Literature review:
Literature review was obtained and included reading documentation, thesis, and
published papers.
The literature review involved reviewing information on the environmental and social
factors that related to renal failure in Gaza governorates and other countries.
Information was obtained from:
- Ministry of Health.
- Annual reports from the different organizations.
- Several interviews were held with health team whom working in kidney
departments in the Gaza governorates.
- Thesis, reports, published papers, etc. were reviewed for compare findings by
different researchers.
The researcher has reviewed many of the previous studies which focused on the
subject of environmental and social factors that are expected to have an impact on
chronic renal failure. These studies include the following:
0
20
40
60
80
100
120
2002 2003 2004 2005 2006 2007 2008 2009 2010 2011 2012

23
A. Chronic renal failure patients in the Gaza strip "study in medical
geography".
The study was done by Hala Medokh, in 2013, it deals with the geographic
distribution of the kidney failure patients in Gaza governorates. The study also dealt
with showing and clarifying the development and increase of the patient's number and
deaths of the CRF patients in Gaza governorates during the period from (2000-2012).
The study also aimed to identify the chemical quality and the quality of the drinking
water. It dealt with the wells in the Gaza-Strip and the estimation of the percentage of
the patients who depend on the municipality water, filtered water and other sources. It
also tried to discover the relationship between the chemical pollution of water and
CRF as well as identifying the most chemically polluted area and analyzing the
reasons of the CRF. The study also dealt with the human variable such as the social
characteristics, economic characteristics and health characteristics. It also dealt with
the food chemical pollution, the chronic kidney failure disease and the relationship of
the chemical compounds of nicotine in cigarettes with the CRF, the role of the Israeli
occupation in increasing the environmental pollution and the attempt to connect the
natural environments (chemical pollution of water) and the human variables and CRF.
The study depended in determining the water chemical polluters on the chemical
analysis of water in the public health laboratory by testing the water wells for
chloride, nitrates and the total soluble salts as a determinant to water chemical
pollution .
The outcomes of the study showed existence of water chemical pollution in the Gaza
governorates. The study also showed the existence of relational relationship between
the social, economic and health characteristics and the food chemical polluters,
smoking and the chronic kidney failure disease.
B. Major risk factors that lead to onset end-stage renal disease in
Northern West Bank.
The study was conducted by Kazem Nazme Basheer, in 2011. This study aimed to
determine the major risk factors that lead to increase the onset of ESRD that requires
haemodialysis in Northern West Bank. A cross sectional study was conducted at four
dialysis centers in governmental hospitals in North West Bank, by using questionnaire
and direct interviewing with ESRD patients, in addition to using medical record. The
major risk factors that significantly associated with the onset of ESRD in this study
were diabetes mellitus, hypertension, cardiovascular disease, recurrent taken analgesic
drug and infection of urinary tract. While there were no significant effect for job,
gender, smoking, and BMI on onset of ESRD. About 15.5% of all cases developed
ESRD because of genetic disease. Polycystic kidney disease cause (11.2%) of ESRD
in Northern West Bank, bladder cancer and prostate cancer causes (4.7%), and
accidental can be causes (2%) of ESRD.
24
C. Salinity of drinking water and its association with renal failure in
Gaza strip, Palestine.
The study was done by Eman Abu-afash Mokhamer. In 2009. The overall aim of this
study was to determine salinity of drinking water and its association with renal failure
in the southern part in Gaza Strip. Another aim was to explore the relationship
between renal failure and socio-economic demographic variable.
The results showed that only 8% of the municipal wells meet the WHO drinking
standards in chloride level. Chloride, nitrate, TDS, fluoride and sodium concentration
exceed 2-9 times the WHO standards in 92% of the southern wells. The study
findings show that there was no association between chronic renal failure prevalence
and chloride level, sodium level, TDS level and nitrate level and showed only
association with fluoride level, with which there was strong and positive association.
D. Environmental factors incriminated in the development of end stage
renal disease in El-Minia governorate, upper Egypt.
This study conducted by Emad G. Kamel, and Osama El-Minshawy. In 2010. The aim
of this study is to investigate the possible causes of ESRD with an unknown etiology
in El-Minia governorate. A total number of 216 patients with an unknown etiology of
ESRD as well as 220 controls were interviewed using a structured questionnaire
including information about environmental factors predicted to cause ESRD such as
occupation, pesticide handling, and source of drinking water.
Distribution of patients by residence showed that most patients lived in rural areas
(76%), compared to 57% in controls. Drinking unsafe water was reported by 72% of
patients and 48% of controls. Family history of renal disease was found among 10%
of patients and 4% of controls. Exposure to pesticides and using herbs for the
treatment were more among patients than controls.
E. Race and kidney disease: Role of social and environmental factors.
The study was done by Chike M. Nzerue, Haliu Demissachew, and J. Kevin Tucker.
In 2002. It reviews the social, economic and environmental factors that impact on the
incidence of ESRD in minority groups. And discuss the impact of social and
environmental factors on racial disparities in kidney disease and the possible
implications for society, and suggest possible ways to correct these disparities.
Its demonstrate that the social and environmental factors that contribute to the racial
disparities seen in kidney disease include: (1) poverty and low household income; (2)
lack of health insurance; (3) educational attainment; (4) residence in the inner city or
'urban' location; (5) substance abuse; (6) diet; (7) obesity; (8) stress; and (9) cultural
and behavioral factors.

25
F. Chronic kidney disease associated with environmental toxins and
exposures.
The study was conducted by Peter Soderland, et.al; in 2010. In this study, the
researchers present environmental factors that are associated with CKD. And explain
that the people are exposed to various potentially toxic agents and conditions in their
natural and occupational environments. These agents may be physical or chemical,
may enter the human body through oral, inhalational, or transdermal routes, and may
exert effects on all organ systems. Several well-known as well as lesser known
associations exist between chronic kidney disease (CKD) and both environmental
agents and conditions, such as heavy metals, industrial chemicals, elevated ambient
temperatures, and infections. And it is suggested that the effects of these agents may
be modulated by genetic susceptibility and other comorbid conditions and may lead to
the development of acute and CKD.
This study summarized toxins and environmental exposures that have been associated
with CKD. Some of these exposures, such as industrial solvents, are more commonly
associated with acute kidney injury (AKI) from accidental exposure, also it include
the most common environmental factors that can causes the CKD.
G. Absence of association between organic solvent exposure and risk of
chronic renal failure: A nationwide population-based case-control
study.
The study was done by C. Michael Fored, et.al; in 2004. The researchers examined
the role of organic solvents in a population-based case-control study of early-stage
chronic renal failure (CRF). All native Swedish residents aged 18 to 74 year, living in
Sweden between May 1996 and May 1998, formed the source population .
The study showed that exposure to organic solvents was not associated with an
increased risk of CRF.
H. Aetiological factors of chronic kidney disease in the north central
province of Sri Lanka: A review of evidence to-date.
The study results showed that the disease mainly affects males from poor socio-
economic backgrounds who are involved in paddy farming. Mild proteinuria was
present but urinary sediments were normal. Renal biopsies were reported as interstitial
nephritis. Significant predictors of kidney disease in these patients included age,
history of smoking, being under treatment for hypertension and drinking well water in
the fields. Studies on heavy metal exposure have revealed conflicting results.

26
Fluoride content of well water in all these areas exceeded the WHO recommended
level of 0.6 mg/L. Water in all areas was alkaline which could facilitate mobilization
of fluoride from minerals indicating a fluoride mediated mechanism for renal damage.
I. Renal effects of environmental and occupational lead exposure.
environmental health.
It made by Mahmoud Adham, in Salt Lake city in United States, and showed that the
acute exposure to high concentrations of lead can result in proximal tubular damage
with characteristic histologic features and manifested by glycosuria and
aminoaciduria. Chronic occupational exposure to lead, or consumption of illicit
alcohol adulterated with lead, has also been linked to a high incidence of renal
dysfunction, which is characterized by glomerular and tubulointerstitial changes
resulting in chronic renal failure, hypertension, hyperuricemia, and gout. A high
incidence of nephropathy was reported during the early part of this century from
Queensland, Australia, in persons with a history of childhood lead poisoning.
27
Chapter 3 : Methodology
3.1. Study design:
The study design that used in this research is retrospective study, where the study in
which some phenomenon existing in the present is linked to other phenomena
occurring in the past. Which looks backward in time, usually using medical records
and interviews with patients who already known to have a disease.
3.2. Study population:
The population of the study are all adult patients (524 case) above 12 years with renal
failure, who are treated in hospitals in Gaza governorates.
3.3. Period of the study:
The study was started in April 2015, after approval from general administration of
manpower development (Annex 1), and general manager of hospitals was achieved.
The pilot study was conducted in April 2015. Data collection started in May 2015, to
July 2015. Data entry was conducted on July 2015. Also data analysis, reviewing of
literature and writing the study continued until August 2015.
3.4. Sitting of the study:
Samples have been chosen from the hospitals in Gaza governorates (Al Shefa
hospital, Shohdaa al Aqsa hospital, Nasser hospital and Abu Youssef al Najar
hospital).
3.5. Sample size:
Study sample are a systematic random sample to select one from every two patients. It
include 262 patients with chronic renal failure.
3.6. Response rate:
The study sample must be 262 patients, but there are 27 patients were not available
during the study.
Whereas the number of respondents patients is 235, which represents 100%.
28
3.7. Study instruments:
To achieve the objectives of the study, self-administered questionnaire was
implemented. (Annex 2)
3.8. Construction of questionnaire:
The researcher developed the questionnaire related to study by himself. Draft of
questionnaire was done by the researcher, then final modifications was done with
supervisors. The questionnaire was designed to be clear with no complex terms,
double parallel questions were avoided. It was translated into Arabic language where
it was filled to study subjects to facilitate understanding and to ensure credibility of
answers.
The questionnaire were sent to experts and a pilot sample was collected to do the
required modifications.
The researcher made one questionnaire for patient, which include the following parts
of questions:
- The first part included items related to personal information (Age, gender, and
civil status).
- The second part included items related to health history information (type of
chronic disease, age of renal failure incidence, causes and etiological variables
of renal failure, genetic and family history of the disease, residency of affected
relatives, disease level of severity, dialysis, and renal transplantation).
- The third part included items related to environmental factors (occupational
characteristic, work characteristic, exposure to industrial chemicals, exposure
to pesticides, environmental toxins, and drinking unsafe water).
- The fourth part included items related to social factors (marital status, husband
relative, heredity, poverty and income, level of education, diet, smoking and
substance abuse).
- The fifth part included items related to knowledge of the patient about chronic
renal failure.
29
3.9. Validity of questionnaire
3.9.1. Face validity:
It is important to make people more response to questionnaire, the researcher check
the face validity twice, the first during the pilot study as the participants were asked
about the structure of questions, it's shape, and typing clearance. The second check
was through expert persons who give their opinion in the face validity of
questionnaire.
3.9.2. Content validity:
Content validity is subjective estimation of measurement based on judgment rather
than statistical analysis. In order to validate the instrument used, it was done before
data collection, by sent the questionnaire with covering letter and paper contain
instruction about the study, over all aim, objective, field of the study, and other
relevant information to 12 experts from different backgrounds, they were asked to
estimate the questionnaire in relation to study, clarity, and completeness of each item.
Feedback was obtained from 8 experts and modification accordingly was done with
the researcher supervisors, their opinion was taken in consideration.
The questionnaire was written in Arabic by the researcher and assessed by Arabic
language expert who gave advice and modifications.
3.10. Pilot study:
A pilot study was done before data collection, and after experts evaluation done, pilot
sample provide the study with many purpose. It gives an idea about response rate, and
difficulty or vague questions. Also the pilot study help in determine the duration of
time required for data collection for each patient, and understanding and clarification
of data collection process.
Ten participant were included; they were all form different, age, gender, educational
level, and residency; and there response rate was 100%.
All of them were provided a clear explanation about the study and it objective before
application and after pilot an individual meeting done to ask the subjects about
difficulties and their opinion in questionnaire. It was found that more time is needed.
In addition, some questions in the questionnaire have been revised to make it more
easy and understandable by participants. Some changes done after that a face
questionnaire interview was administered for the pilot sample. The pilot
questionnaires were included in the study.

31
3.11. Data collection:
Data was collected by researcher only with some assistance and coordination. The
patient's questionnaire was face interviewed questionnaire. The interview was started
by giving the patient explanation about study and its objectives and their importance
in giving true answers, a face interviewed questionnaire was conducted by researcher
to the patient, because some of them were illiterate. They were given a complete
instruction about the study and how they included in it, their privacy and safety during
interview were maintained as the interview was done in the place of work, taking into
consideration not to interrupt the work, during the interview. Data collection last
about 53 working days. The researched apply all the old and new cases on excel sheet
and remove the repeated cases.
3.12. Data entry:
- The data was entered into the computer by using the Statistical Package for
Social Sciences (SPSS) programs.
- Excel software program and other software was used for data entry and
interpretation.
3.13. Data analysis:
- Data analysis was done by using SPSS program and Excel software.
- Frequency table for the study variable were conducted.
- Parametric and nonparametric tests were used to compare between means.
3.14. Inclusion and Exclusion criteria:
3.14.1. Inclusion criteria
- All adult patients with chronic renal failure, who are treated in hospitals in
Gaza governorates, living in Gaza strip, and available at the study period.
- The patients who were interviewed during the pilot study.
3.14.2. Exclusion criteria
- Patients none available at the time of data collection, having treatment
outside.
- Patients aged less than 12 years.

31
3.15. Ethical considerations:
- An official letter was obtained from the general administration of
manpower development, and general manager of hospitals.
- Explanatory letter was attached to the questionnaire and provided to
participants who were conducted to the study, which include the study
title, aim, objectives and other information needed to make clarification to
participants.
- In the face interview, questionnaire privacy were kept to the patients.
- The right to participate or not, confidentiality, anonymity was maintained
into the explanatory letter.
- No participant would have experienced a sense of coercion; a sense of fear
of not answering.
3.16. Limitation of the study:
- During reporting was major problem for the researcher to get data.
- Limited resource like, literature, books and magazine.
- Limited information, insufficient and inappropriate data registry, and
segmentation of data in many different stakeholder.
32
Chapter 4 : Results and Discussion:
A. Descriptive part:
A.4.1. Distribution of study participants by socio demographic characteristics:
The sample of the study consist of 235 participants; 153 (65.1%) were from Al Shifa
hospital, 31 (13.2%) from Shohada Al Aqsa hospital, 30 (12.8%) from Al Najar
hospital, and 21 (8.9%) from Nasser hospital. Age when sustained renal failure ranged
between 1 – 79 years (m= 41.65 ±17.40). Characteristics of study participants are
demonstrated below:
A.4.1.1. Distribution of study participants by gender:
Regarding to chronic renal failure patient's gender, the sample of the study consist of
235 participants; table (4.1) shows the distribution of the patients by gender as male
patients number is 133 patients, which represents 56.6%, while the female patients
number is 102 patients, which represents 43.4% from the total sample.
The study findings reveals that gender distribution reflects higher male prevalence
than female in Gaza governorates.
It correspond with the study made by Kazem Basheer, in West bank in north
Palestine, which included 293 patients, and consisted of 58.70% males, and 41.30%
females. (Basheer K., 2011).
A.4.1.2. Distribution of study participants by age group:
Regarding to patient's age, the patients distributed in table (4.1) according to their age
within five age groups; this groups are [(12-20), (21-30), (31-40), (41-50), and (more
than 50)] years. The lowest age group is (12-20) as it is only represents 8.5% of the
total subjects, and contain 20 patients, whereas the second age group is (21-30) which
contain 21 patients and represents 8.9%, then the third age group is (31-40) that
contain 38 patients and represents 16.2%, while the fourth age group is (41-50) that
contain 48 patients and represents 20.4%, and finally the fifth age group is (more than
50 years) which contain 108 patients and represents 46%, and considered the highest
age group.
This study is correlated with the study made by Yuka Noborisaka, et.al. which
considered a retrospective study and involved 3,964 men and 2,698 women aged 35–
64 years, who had been followed-up until 2003. And it showed that high-risk CKD
was found mostly in men, of were aged 55–64 years.(Noborisaka Y., et.al. 2013).
Also this study differ with the study made by Carlos M. Orantes, et.al.; in El Salvador,
which involved 375 families and 775 individuals (343 men, 432 women); and it was
showed that the group aged ≥ 60 years made up 13.3% of the study population.
(Orantes C., et.al 2011).
33
This difference between the two studies could be due to several factors such as poor
the quality of health care in Gaza governorates, and the high quality of health in El
Salvador and their ability to early detection of disease; the bad economic situation in
the Gaza governorates; the siege imposed on the Gaza governorates by Israeli
occupation and prevent patients from traveling for treatment and kidney transplant
and get rid of the disease.
While the study is correspond with Eman's Mokhamer study, which was made in
Khanyounis governorate in Palestine, and included 194 patients. It showed that age
group more than 60 years is considered the highest age group. (Mokhamer E., 2009).
A.4.1.3. Distribution of study participants by hospital which treated in it:
Table (4.1) shows the distribution of the patients by hospital which treated in it. These
hospitals are (Al Shifa, Shohada Al Aqsa, Nasser, and Abu Youssef Al Najar). The
number of patients who are treated in Al Shifa hospital is 153 which represent 65.1%
of total subjects; while the number of patients who are treated in Shohada Al Aqsa
hospital is 31 which represent 13.2%; were the number of patients who are treated in
Abu Youssef Al Najar hospital is 30 which represent 12.8%; and finally the number
of patients who are treated in Nasser hospital is 21 which represent 8.9%.
The study findings reveal that the number of patients who are treated in Al Shifa
hospital reflect highest number of chronic renal failure patients which treated in Gaza
governorates.
A.4.1.4. Distribution of study participants by marital status:
Regarding to patient's marital status, table (4.1) shows that about three-quarter of
subjects are married, and its number 174 patients of total subjects; while the number
of single patients is 38, which represent 16.2%; then the number of widow patients is
21, which represent 8.9%; finally the number of divorced patients is 2, and represent
0.9%, which considered the lowest marital status among participants.
The results of the study are correspond with the study that done by Hala Medokh, in
Gaza governorates in Palestine, which included 404 patients, and it showed that major
number of participants are married, and represented 73.8% from her study sample.
(Medokh H., 2013).
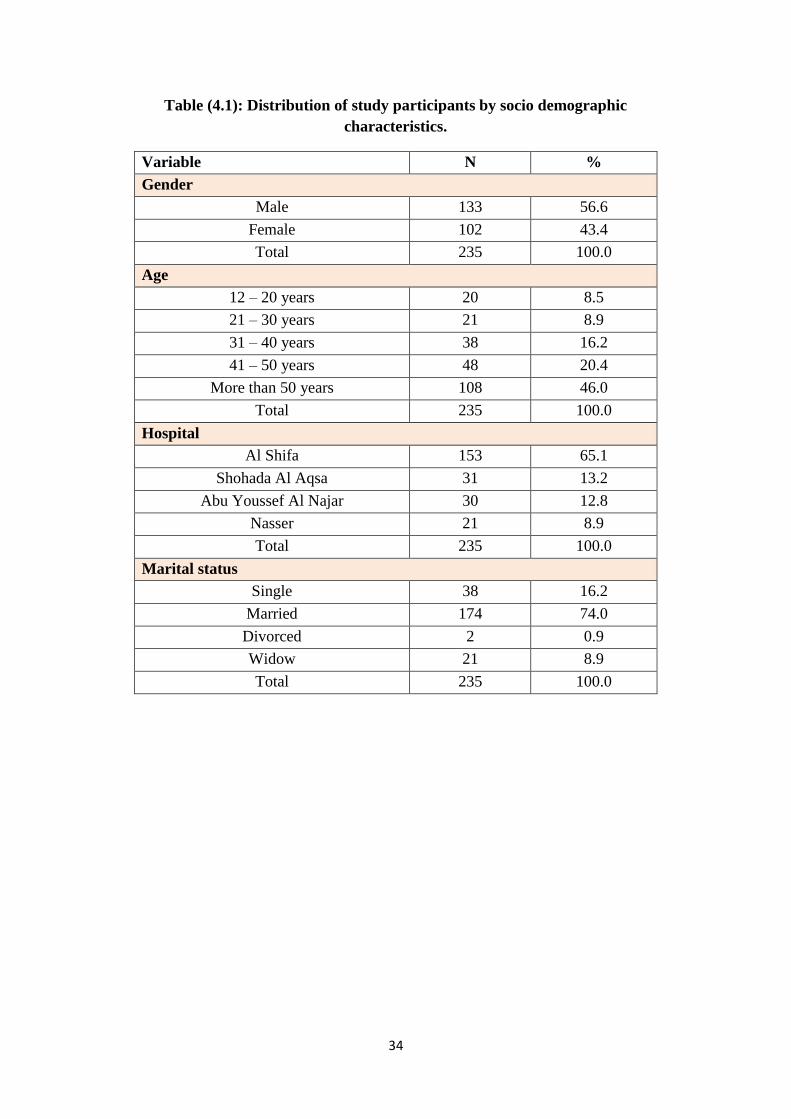
34
Table (4.1): Distribution of study participants by socio demographic
characteristics.
Variable N %
Gender
Male 133 56.6
Female 102 43.4
Total 235 100.0
Age
12 – 20 years 20 8.5
21 – 30 years 21 8.9
31 – 40 years 38 16.2
41 – 50 years 48 20.4
More than 50 years 108 46.0
Total 235 100.0
Hospital
Al Shifa 153 65.1
Shohada Al Aqsa 31 13.2
Abu Youssef Al Najar 30 12.8
Nasser 21 8.9
Total 235 100.0
Marital status
Single 38 16.2
Married 174 74.0
Divorced 2 0.9
Widow 21 8.9
Total 235 100.0

35
A.4.1.5. Distribution of study participants by level of education:
The levels of education are represent in the figure (4.1) which shows that more than
half of subjects, there education level is less than Tawjihi (12th
stage), and represents
68.5% from the total subjects; while the Tawjihi level represents 12.8%; then diploma
level represents 10.6%; finally the bachelor level represents 8.1%, which consider the
lowest educational level.
Also the figure (4.1) shows that there is an inverse relationship between the number of
patients with CRF and their level of education. Whereas the number of patients was
decreased when the level of education was increased.
The results of the study are correspond with the study was done by Hala Medokh, in
Gaza governorates in Palestine, which included 404 patients, and showed low levels
of education for patients with chronic renal failure in the Gaza governorates. (Medokh
H., 2013).
At the same way the study is correspond with the study conducted by Eman
Mokhamer, in Khanyounis governorate in Palestine, which included 194 patients, and
showed that 58.8%, from the total subjects, are less than tawjihi; while bachelor
degree represent 4.4%. (Mokhamer E., 2009).
Figure (4.1): Distribution of study participants by level of education.
68.5
12.8 10.6 8.1
0
10
20
30
40
50
60
70
80
90
100
less than Tawjihi Tawjihi (12th stage) Diploma Bahelor

36
A.4.2. Distribution of study participants by medical history characteristics:
A.4.2.1. Distribution of study participants by presence of chronic disease other
than CRF:
Regarding to the presence of chronic disease other than CRF; table (4.2) shows that
the majority of participants were having chronic disease other than CRF, and shows
that the number is 167 patients, and represented 71% from the total subjects; which
distributed among four hospitals within Gaza governorates, with different numbers
and percentage. The total number of patients who suffering from chronic disease other
than CRF is 111 patients in Al Shifa hospital, which represent 47.2% from the total
subjects; while in Shohada Al Aqsa hospital the number is 24 patients, and represent
10.2%; then the number of patients in Abu Youssef Al Najar hospital is 20 patients;
which represent 8.5%; finally the number in Nasser hospital is 12 patients, and
represent 5.1%, which considered the lowest hospital that include patients with
chronic disease other than CRF.
Also the table (4.2) shows that the types of disease other than CRF, and it is represent
a different percentages and frequency. It is include 167 patients who are suffering
from chronic disease other than CRF; and the table shows that the frequency of
patients that suffering from cardiac disease is 7, and represent 4.20%, from the total
subjects who are suffering from chronic disease other than CRF; the frequency of
patients that suffering from diabetes mellitus is 16, and represent 9.58%; the
frequency of patients that suffering from hypertension is 63, and represent 37.72%;
the frequency of patients that suffering from cardiac and hypertension is 9, and
represent 5.38%; the frequency of patients that suffering from diabetes and
hypertension is 38, and represent 22.75%; the frequency of patients that suffering
from cardiac, diabetes and hypertension disease is 24, and represent 14.37%; the
frequency of patients that suffering from respiratory disease is 2, and represent 1.20%;
the frequency of patients that suffering from heredity disease is 1, and represent
0.60%; finally the frequency of patients that suffering from others disease is 7, and
represent 4.20%.
The highest type of disease is hypertension, while the lowest type of disease is
heredity disease.
When comparing between presence of chronic diseases other than CRF, and hospitals
in Gaza governorates; there is no statistically significant variations between them (P
value is more than 0.05).
The study is correspond with many studies; the first study made by Miguel Almaguer,
et.al, which showed that main CKD causes reported in US pre-dialysis patients
include diabetes (49.1%), hypertension (28%) and glomerulonephritis (4.7%).
Diabetes is also the main cause of CKD (58%–60 )% in new renal replacement therapy
(RRT) patients in Malaysia, Morelos and Jalisco (Mexico), Thailand, New Zealand,
Hong Kong, Japan, USA and other countries. (Almaguer M., et.al. 2014).

37
While the second study made by Yuka Noborisaka, et.al, and it showed that high-risk
CKD was found mostly in men, of were aged 55–64 years, also it show that obesity,
hypertension, DM, smoking and some job types were related to the development and
progression of CKD. (Noborisaka Y., et.al. 2013).
Whereas it vary with the study made by Hala Medokh, which showed that more than
half of the participants (79.2%) didn’t have any type of chronic disease before chronic
renal failure. (Medokh H., 2013).
This difference between two studies may be due to differences in the patients
numbers; or because of Hala's study has been done before two years and half of done
this study, therefore it is possible to have changes in study characteristics, or disease
factors; or changes in the patients themselves.
Table (4.2): Presence of chronic disease (other than CRF).
Variable Al Shifa
Shohada
Al Aqsa Al Najar Nasser Chi
square
P
value N % N % N % N %
Yes 111 47.2 24 10.2 20 8.5 12 5.1
3.034 0.386 No 42 17.9 7 3.0 10 4.3 9 3.8
Total 153 65.1 31 13.2 30 12.8 21 8.9
Type of disease (N= 167) Frequency Percent
Cardiac 7 4.20
Diabetes mellitus 16 9.58
Hypertension 63 37.72
Cardiac + hypertension 9 5.38
Diabetes + hypertension 38 22.75
Cardiac + diabetes + hypertension 24 14.37
Respiratory 2 1.20
Heredity 1 0.60
Others 7 4.20
Total 167 100.0
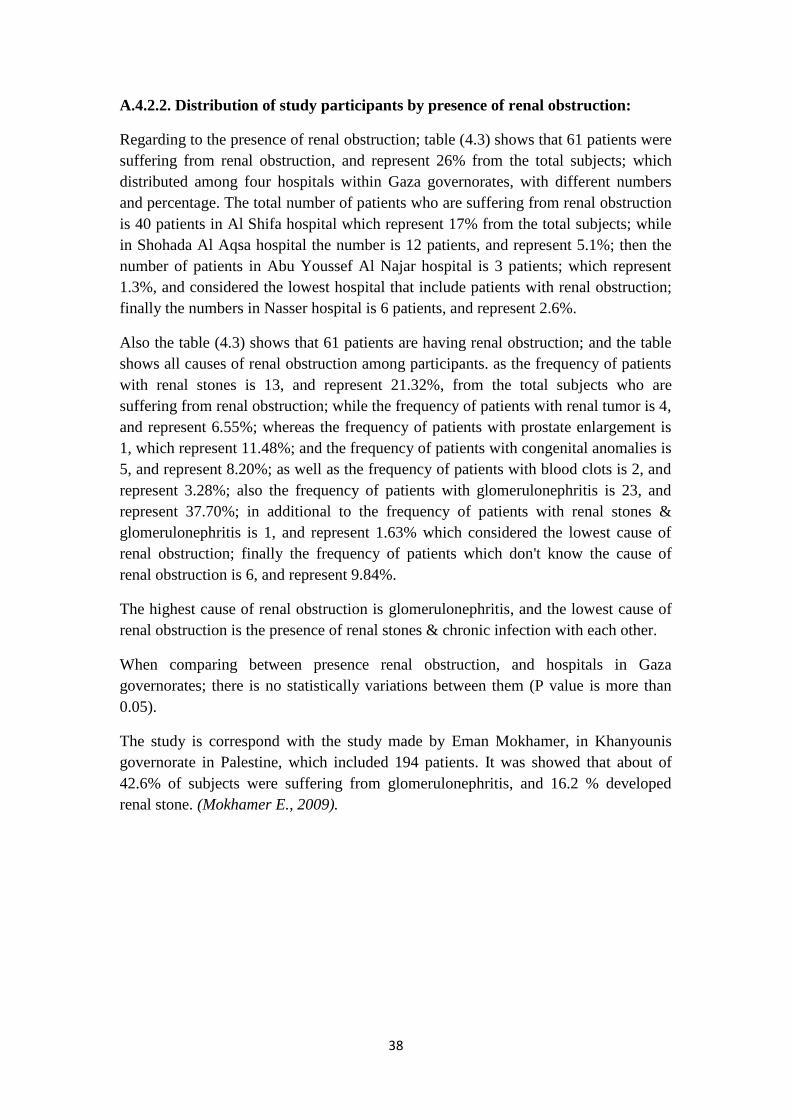
38
A.4.2.2. Distribution of study participants by presence of renal obstruction:
Regarding to the presence of renal obstruction; table (4.3) shows that 61 patients were
suffering from renal obstruction, and represent 26% from the total subjects; which
distributed among four hospitals within Gaza governorates, with different numbers
and percentage. The total number of patients who are suffering from renal obstruction
is 40 patients in Al Shifa hospital which represent 17% from the total subjects; while
in Shohada Al Aqsa hospital the number is 12 patients, and represent 5.1%; then the
number of patients in Abu Youssef Al Najar hospital is 3 patients; which represent
1.3%, and considered the lowest hospital that include patients with renal obstruction;
finally the numbers in Nasser hospital is 6 patients, and represent 2.6%.
Also the table (4.3) shows that 61 patients are having renal obstruction; and the table
shows all causes of renal obstruction among participants. as the frequency of patients
with renal stones is 13, and represent 21.32%, from the total subjects who are
suffering from renal obstruction; while the frequency of patients with renal tumor is 4,
and represent 6.55%; whereas the frequency of patients with prostate enlargement is
1, which represent 11.48%; and the frequency of patients with congenital anomalies is
5, and represent 8.20%; as well as the frequency of patients with blood clots is 2, and
represent 3.28%; also the frequency of patients with glomerulonephritis is 23, and
represent 37.70%; in additional to the frequency of patients with renal stones &
glomerulonephritis is 1, and represent 1.63% which considered the lowest cause of
renal obstruction; finally the frequency of patients which don't know the cause of
renal obstruction is 6, and represent 9.84%.
The highest cause of renal obstruction is glomerulonephritis, and the lowest cause of
renal obstruction is the presence of renal stones & chronic infection with each other.
When comparing between presence renal obstruction, and hospitals in Gaza
governorates; there is no statistically variations between them (P value is more than
0.05).
The study is correspond with the study made by Eman Mokhamer, in Khanyounis
governorate in Palestine, which included 194 patients. It was showed that about of
42.6% of subjects were suffering from glomerulonephritis, and 16.2 % developed
renal stone. (Mokhamer E., 2009).

39
Table (4.3): Presence of renal obstruction.
Variable Al Shifa
Shohada
Al Aqsa Al Najar Nasser
Chi
square
P
value
N % N % N % N %
6.675 0.083 Yes 40 17.0 12 5.1 3 1.3 6 2.6
No 113 48.1 19 8.1 27 11.5 15 6.4
Total 153 65.1 31 13.2 30 12.8 21 8.9
Cause of renal obstruction (N= 61) Frequency Percent
Renal stones 13 21.32
Renal tumor 4 6.55
Prostate enlargement 7 11.48
Congenital anomalies 5 8.20
Blood clots 2 3.28
Glomerulonephritis 23 37.70
Renal stones + chronic infection 1 1.63
Do not know the cause 6 9.84
Total 61 100.0
A.4.2.3. Distribution of study participants by presence of renal cysts:
The presence of renal cysts among patients with chronic renal failure was represented
in table (4.4) which shows that the total number of patients who have renal cysts is 38
patients and represent 16.2 % from the total subjects, also it shows that the tolal
number of patients who have the renal cysts is 27 patients in Al Shifa hospital which
represented 11.5% from the total subjects; while in Shohada Al Aqsa hospital the
number is 3 patients, which represented 1.3%; then the number of patients in Abu
Youssef Al Najar hospital is 3 patients; which represented 1.3%; finally the numbers
in Nasser hospital is 5 patients, and represented 2.1%.
The highest number of patients who have renal cysts was in Al Shifa hospital, while
in Shohada Al Aqsa and Nasser hospitals are having the same number and percentage,
and they are considered as the lowest hospitals that include patients with history of
renal cysts.
When comparing between presence of renal cysts, and hospitals in Gaza governorates;
there is no statistically significant variations between them (P value is more than
0.05).
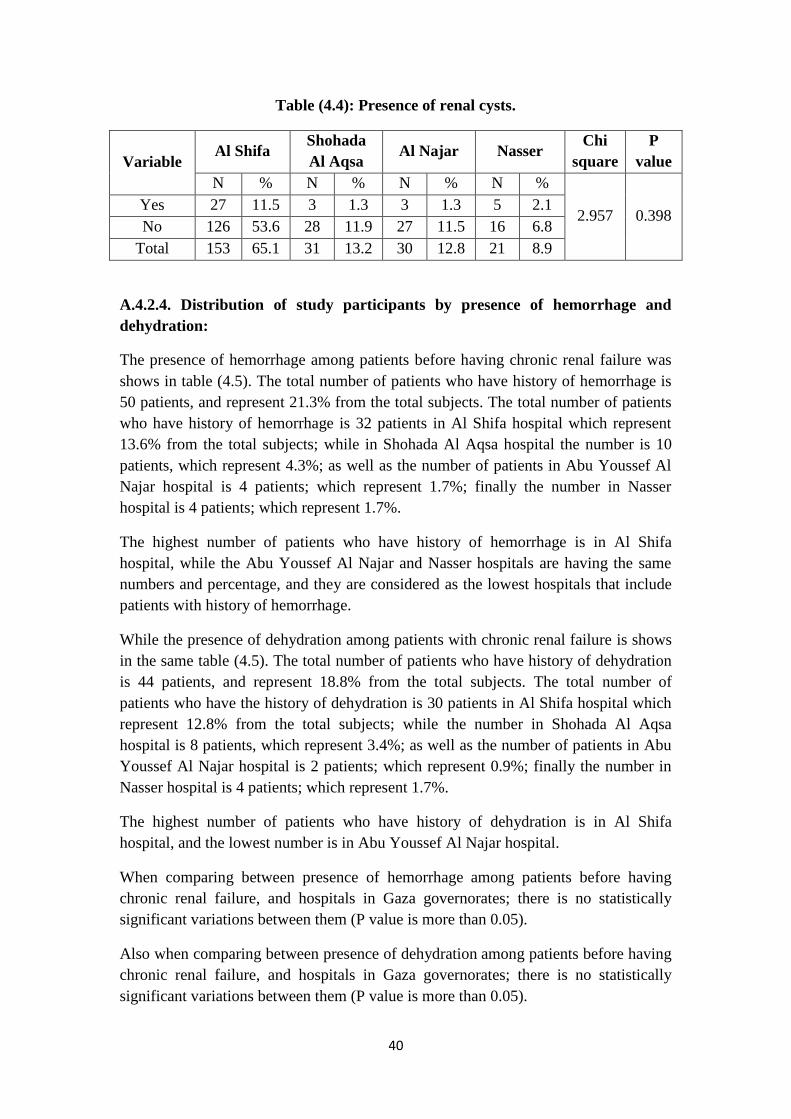
41
Table (4.4): Presence of renal cysts.
Variable Al Shifa
Shohada
Al Aqsa Al Najar Nasser
Chi
square
P
value
N % N % N % N %
2.957 0.398 Yes 27 11.5 3 1.3 3 1.3 5 2.1
No 126 53.6 28 11.9 27 11.5 16 6.8
Total 153 65.1 31 13.2 30 12.8 21 8.9
A.4.2.4. Distribution of study participants by presence of hemorrhage and
dehydration:
The presence of hemorrhage among patients before having chronic renal failure was
shows in table (4.5). The total number of patients who have history of hemorrhage is
50 patients, and represent 21.3% from the total subjects. The total number of patients
who have history of hemorrhage is 32 patients in Al Shifa hospital which represent
13.6% from the total subjects; while in Shohada Al Aqsa hospital the number is 10
patients, which represent 4.3%; as well as the number of patients in Abu Youssef Al
Najar hospital is 4 patients; which represent 1.7%; finally the number in Nasser
hospital is 4 patients; which represent 1.7%.
The highest number of patients who have history of hemorrhage is in Al Shifa
hospital, while the Abu Youssef Al Najar and Nasser hospitals are having the same
numbers and percentage, and they are considered as the lowest hospitals that include
patients with history of hemorrhage.
While the presence of dehydration among patients with chronic renal failure is shows
in the same table (4.5). The total number of patients who have history of dehydration
is 44 patients, and represent 18.8% from the total subjects. The total number of
patients who have the history of dehydration is 30 patients in Al Shifa hospital which
represent 12.8% from the total subjects; while the number in Shohada Al Aqsa
hospital is 8 patients, which represent 3.4%; as well as the number of patients in Abu
Youssef Al Najar hospital is 2 patients; which represent 0.9%; finally the number in
Nasser hospital is 4 patients; which represent 1.7%.
The highest number of patients who have history of dehydration is in Al Shifa
hospital, and the lowest number is in Abu Youssef Al Najar hospital.
When comparing between presence of hemorrhage among patients before having
chronic renal failure, and hospitals in Gaza governorates; there is no statistically
significant variations between them (P value is more than 0.05).
Also when comparing between presence of dehydration among patients before having
chronic renal failure, and hospitals in Gaza governorates; there is no statistically
significant variations between them (P value is more than 0.05).
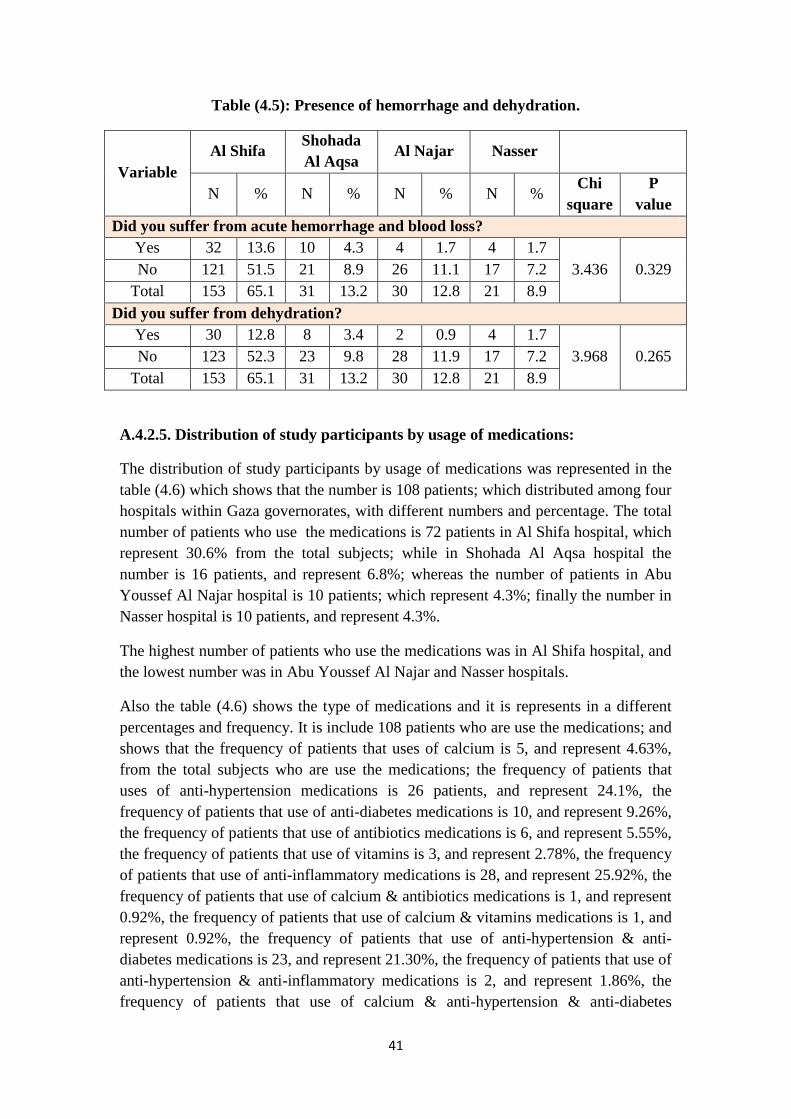
41
Table (4.5): Presence of hemorrhage and dehydration.
Variable
Al Shifa Shohada
Al Aqsa Al Najar Nasser
N % N % N % N % Chi
square
P
value
Did you suffer from acute hemorrhage and blood loss?
Yes 32 13.6 10 4.3 4 1.7 4 1.7
3.436 0.329 No 121 51.5 21 8.9 26 11.1 17 7.2
Total 153 65.1 31 13.2 30 12.8 21 8.9
Did you suffer from dehydration?
Yes 30 12.8 8 3.4 2 0.9 4 1.7
3.968 0.265 No 123 52.3 23 9.8 28 11.9 17 7.2
Total 153 65.1 31 13.2 30 12.8 21 8.9
A.4.2.5. Distribution of study participants by usage of medications:
The distribution of study participants by usage of medications was represented in the
table (4.6) which shows that the number is 108 patients; which distributed among four
hospitals within Gaza governorates, with different numbers and percentage. The total
number of patients who use the medications is 72 patients in Al Shifa hospital, which
represent 30.6% from the total subjects; while in Shohada Al Aqsa hospital the
number is 16 patients, and represent 6.8%; whereas the number of patients in Abu
Youssef Al Najar hospital is 10 patients; which represent 4.3%; finally the number in
Nasser hospital is 10 patients, and represent 4.3%.
The highest number of patients who use the medications was in Al Shifa hospital, and
the lowest number was in Abu Youssef Al Najar and Nasser hospitals.
Also the table (4.6) shows the type of medications and it is represents in a different
percentages and frequency. It is include 108 patients who are use the medications; and
shows that the frequency of patients that uses of calcium is 5, and represent 4.63%,
from the total subjects who are use the medications; the frequency of patients that
uses of anti-hypertension medications is 26 patients, and represent 24.1%, the
frequency of patients that use of anti-diabetes medications is 10, and represent 9.26%,
the frequency of patients that use of antibiotics medications is 6, and represent 5.55%,
the frequency of patients that use of vitamins is 3, and represent 2.78%, the frequency
of patients that use of anti-inflammatory medications is 28, and represent 25.92%, the
frequency of patients that use of calcium & antibiotics medications is 1, and represent
0.92%, the frequency of patients that use of calcium & vitamins medications is 1, and
represent 0.92%, the frequency of patients that use of anti-hypertension & anti-
diabetes medications is 23, and represent 21.30%, the frequency of patients that use of
anti-hypertension & anti-inflammatory medications is 2, and represent 1.86%, the
frequency of patients that use of calcium & anti-hypertension & anti-diabetes
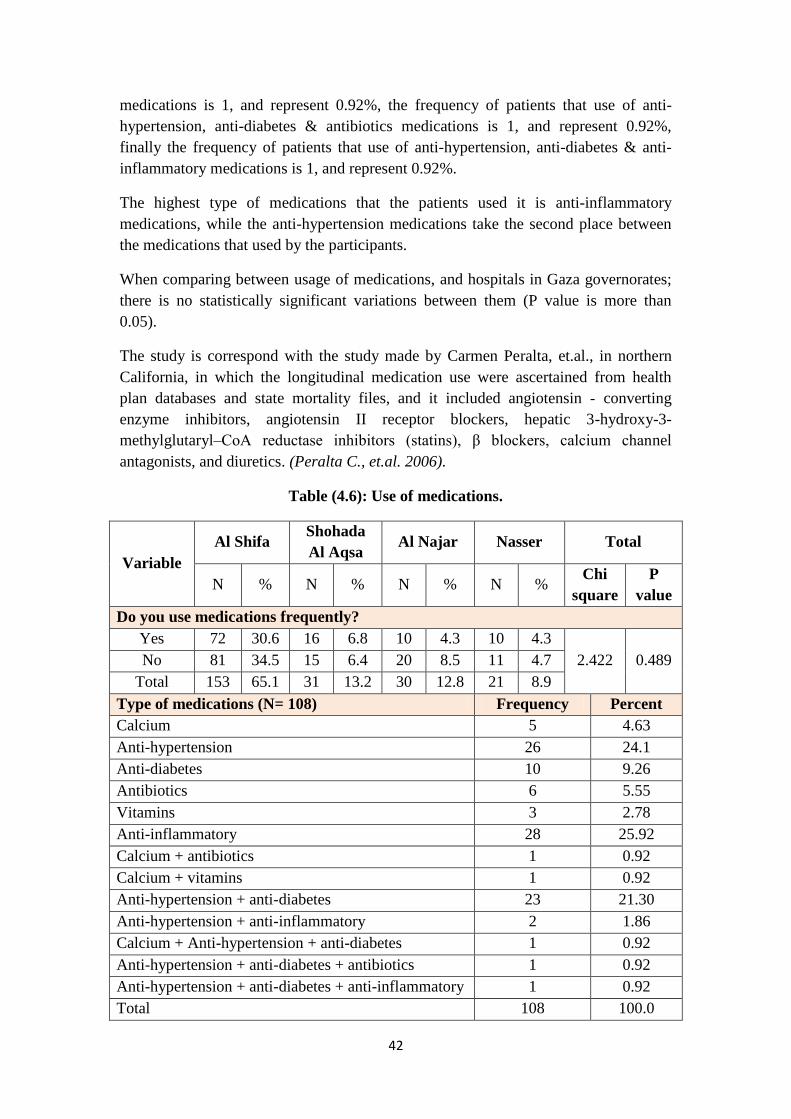
42
medications is 1, and represent 0.92%, the frequency of patients that use of anti-
hypertension, anti-diabetes & antibiotics medications is 1, and represent 0.92%,
finally the frequency of patients that use of anti-hypertension, anti-diabetes & anti-
inflammatory medications is 1, and represent 0.92%.
The highest type of medications that the patients used it is anti-inflammatory
medications, while the anti-hypertension medications take the second place between
the medications that used by the participants.
When comparing between usage of medications, and hospitals in Gaza governorates;
there is no statistically significant variations between them (P value is more than
0.05).
The study is correspond with the study made by Carmen Peralta, et.al., in northern
California, in which the longitudinal medication use were ascertained from health
plan databases and state mortality files, and it included angiotensin - converting
enzyme inhibitors, angiotensin II receptor blockers, hepatic 3-hydroxy-3-
methylglutaryl–CoA reductase inhibitors (statins), β blockers, calcium channel
antagonists, and diuretics. (Peralta C., et.al. 2006).
Table (4.6): Use of medications.
Variable
Al Shifa Shohada
Al Aqsa Al Najar Nasser Total
N % N % N % N % Chi
square
P
value
Do you use medications frequently?
Yes 72 30.6 16 6.8 10 4.3 10 4.3
2.422 0.489 No 81 34.5 15 6.4 20 8.5 11 4.7
Total 153 65.1 31 13.2 30 12.8 21 8.9
Type of medications (N= 108) Frequency Percent
Calcium 5 4.63
Anti-hypertension 26 24.1
Anti-diabetes 10 9.26
Antibiotics 6 5.55
Vitamins 3 2.78
Anti-inflammatory 28 25.92
Calcium + antibiotics 1 0.92
Calcium + vitamins 1 0.92
Anti-hypertension + anti-diabetes 23 21.30
Anti-hypertension + anti-inflammatory 2 1.86
Calcium + Anti-hypertension + anti-diabetes 1 0.92
Anti-hypertension + anti-diabetes + antibiotics 1 0.92
Anti-hypertension + anti-diabetes + anti-inflammatory 1 0.92
Total 108 100.0

43
A.4.2.6. Distribution of study participants by presence of blood disease:
Regarding to distribution of study participants by presence of blood disease; table
(4.7) shows that 23 patients were suffering from blood disease and distributed among
four hospitals within Gaza governorates, with different numbers and percentage.
The total number of patients that suffering from blood disease is 14 patients in Al
Shifa hospital, which represent 6.0% from the total subjects; while the number in
Shohada Al Aqsa hospital is 4 patients, and it is represent 1.7%; whereas the number
of patients in Abu Youssef Al Najar hospital is 1 patient; which represent 0.4%;
finally the number in Nasser hospital is 4 patients, and represent 1.7%.
The highest number of patients who suffering from blood disease was in Al Shifa
hospital, and the lowest number was in Abu Youssef Al Najar hospital.
Also the table (4.7) shows the types of blood disease and it is represent at different
percentages and frequency. It is include 23 patients who are suffering from blood
diseases; and the table shows that the frequency of patients that suffering from anemia
is 17, and represent 73.92%, from the total subjects who are suffering from blood
disease; the frequency of patients who are suffering from systemic lupus
erythematosus is 1, and represent 4.35%, the frequency of patients who are suffering
from hemophilia is 3, and represent 13.04%, and the frequency of patients who are
suffering from hepatitis is 2, and represent 8.69%.
Anemia is considered as the highest type of blood disease that the participants are
suffering from it. While systemic lupus erythematosus is considered as the lowest
type of blood disease that the participants are surfing from it.
When comparing between presence of blood disease, and hospitals in Gaza
governorates; there is no statistically significant variations between them (P value is
more than 0.05).
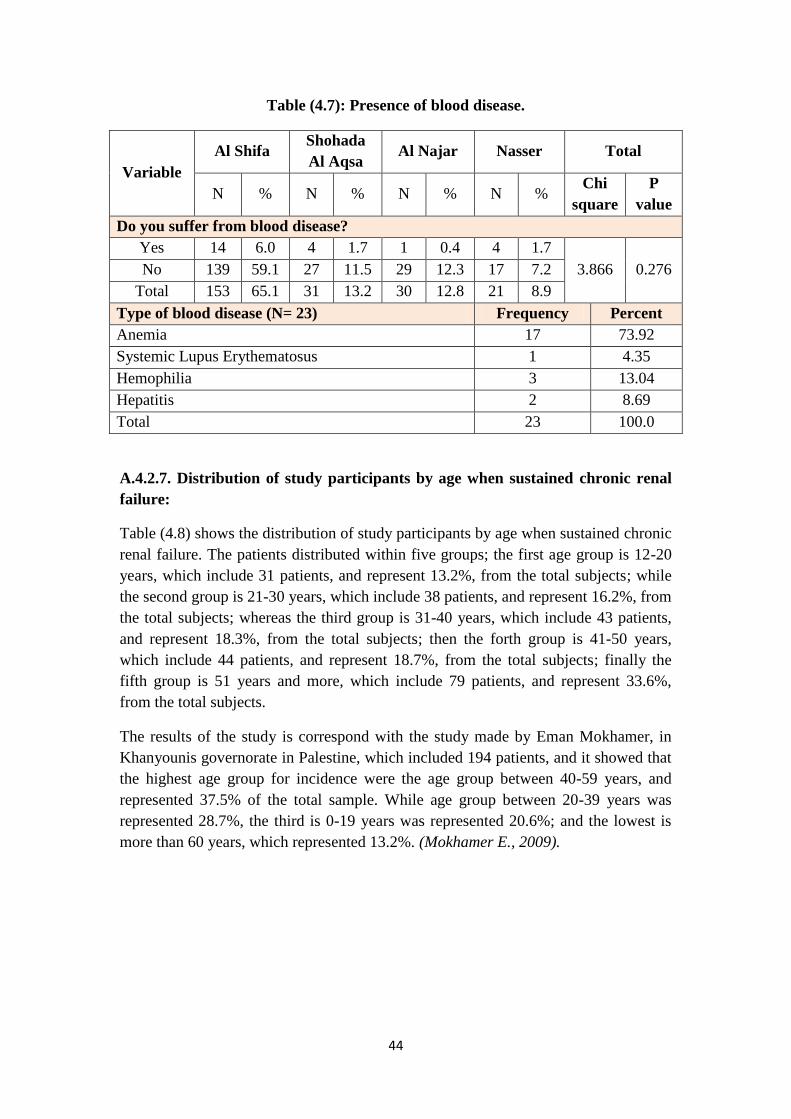
44
Table (4.7): Presence of blood disease.
Variable
Al Shifa Shohada
Al Aqsa Al Najar Nasser Total
N % N % N % N % Chi
square
P
value
Do you suffer from blood disease?
Yes 14 6.0 4 1.7 1 0.4 4 1.7
3.866 0.276 No 139 59.1 27 11.5 29 12.3 17 7.2
Total 153 65.1 31 13.2 30 12.8 21 8.9
Type of blood disease (N= 23) Frequency Percent
Anemia 17 73.92
Systemic Lupus Erythematosus 1 4.35
Hemophilia 3 13.04
Hepatitis 2 8.69
Total 23 100.0
A.4.2.7. Distribution of study participants by age when sustained chronic renal
failure:
Table (4.8) shows the distribution of study participants by age when sustained chronic
renal failure. The patients distributed within five groups; the first age group is 12-20
years, which include 31 patients, and represent 13.2%, from the total subjects; while
the second group is 21-30 years, which include 38 patients, and represent 16.2%, from
the total subjects; whereas the third group is 31-40 years, which include 43 patients,
and represent 18.3%, from the total subjects; then the forth group is 41-50 years,
which include 44 patients, and represent 18.7%, from the total subjects; finally the
fifth group is 51 years and more, which include 79 patients, and represent 33.6%,
from the total subjects.
The results of the study is correspond with the study made by Eman Mokhamer, in
Khanyounis governorate in Palestine, which included 194 patients, and it showed that
the highest age group for incidence were the age group between 40-59 years, and
represented 37.5% of the total sample. While age group between 20-39 years was
represented 28.7%, the third is 0-19 years was represented 20.6%; and the lowest is
more than 60 years, which represented 13.2%. (Mokhamer E., 2009).
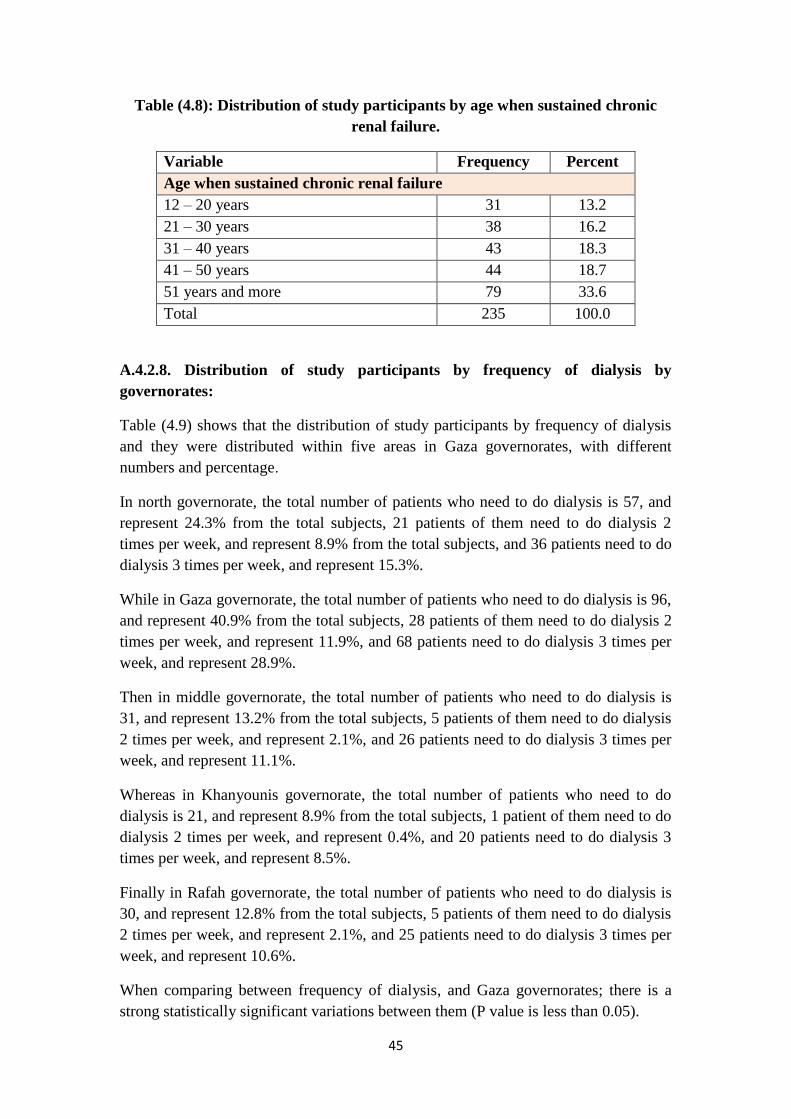
45
Table (4.8): Distribution of study participants by age when sustained chronic
renal failure.
Variable Frequency Percent
Age when sustained chronic renal failure
12 – 20 years 31 13.2
21 – 30 years 38 16.2
31 – 40 years 43 18.3
41 – 50 years 44 18.7
51 years and more 79 33.6
Total 235 100.0
A.4.2.8. Distribution of study participants by frequency of dialysis by
governorates:
Table (4.9) shows that the distribution of study participants by frequency of dialysis
and they were distributed within five areas in Gaza governorates, with different
numbers and percentage.
In north governorate, the total number of patients who need to do dialysis is 57, and
represent 24.3% from the total subjects, 21 patients of them need to do dialysis 2
times per week, and represent 8.9% from the total subjects, and 36 patients need to do
dialysis 3 times per week, and represent 15.3%.
While in Gaza governorate, the total number of patients who need to do dialysis is 96,
and represent 40.9% from the total subjects, 28 patients of them need to do dialysis 2
times per week, and represent 11.9%, and 68 patients need to do dialysis 3 times per
week, and represent 28.9%.
Then in middle governorate, the total number of patients who need to do dialysis is
31, and represent 13.2% from the total subjects, 5 patients of them need to do dialysis
2 times per week, and represent 2.1%, and 26 patients need to do dialysis 3 times per
week, and represent 11.1%.
Whereas in Khanyounis governorate, the total number of patients who need to do
dialysis is 21, and represent 8.9% from the total subjects, 1 patient of them need to do
dialysis 2 times per week, and represent 0.4%, and 20 patients need to do dialysis 3
times per week, and represent 8.5%.
Finally in Rafah governorate, the total number of patients who need to do dialysis is
30, and represent 12.8% from the total subjects, 5 patients of them need to do dialysis
2 times per week, and represent 2.1%, and 25 patients need to do dialysis 3 times per
week, and represent 10.6%.
When comparing between frequency of dialysis, and Gaza governorates; there is a
strong statistically significant variations between them (P value is less than 0.05).

46
Table (4.9): Distribution of frequency of dialysis by governorates.
Frequency
of dialysis
North Gaza Middle Khanyounis Rafah Chi
square
P
value
N % N % N % N % N %
11.984 0.018 2 times 21 8.9 28 11.9 5 2.1 1 0.4 5 2.1
3 times 36 15.3 68 28.9 26 11.1 20 8.5 25 10.6
Total 57 24.3 96 40.9 31 13.2 21 8.9 30 12.8
A.4.2.9. Distribution of study participants by presence of renal failure among
parents:
Regarding to the distribution of study participants by presence of renal failure among
parents, the table (4.10) shows that the total number of subjects doesn't have the
history of chronic renal failure among parents, and it is number 203, which represent
86.4%. While the number of subjects who have the history of chronic renal failure
among parents is 32, and represent 13.6%.
The study findings are correspond with the study made by Kazem Basheer, in the
West bank in north Palestine, and it was included 293 patients, which showed that
there is no association between family member’s medical history of chronic diseases
(diabetes, hypertension, cardiovascular disease, kidney disease, ESRD) and the onset
ESRD. The study results showed that 18.1% had a relative who were suffering from
ESRD, and 7.2% had a relative who were suffering from renal disease. (Basheer K.,
2011).
Table (4.10): presence of chronic renal failure among parents.
Presence of renal failure among parents Frequency Percent
Yes 32 13.6
No 203 86.4
Total 235 100.0
A.4.2.10. Distribution of study participants by presence of chronic renal failure
among relatives:
Table (4.11) shows that the majority of the subjects don't have relative history of
chronic renal failure. The number of subjects that have relative history of chronic
renal failure is 70 patients. And the majority of the subjects relatives is first degree
relationship which include 38 patients, and represented 54.3% from the total subjects
who have relative history of chronic renal failure, while the second degree include 23
patients and represented 32.9%, whereas the number subjects that have relatives with
first & second degree together is 6 patients, and represent 8.6%, but the number of
subjects that have other relative with chronic renal failure is 3, and represented 4.3%.

47
Regarding to their relative residency, 64.3% of their relatives were living in the same
area, and 35.7 were living in other demographic area.
The results of the study are correspond with the study made by Beverly Spray, et.al.,
in USA, it was showed that the risk of developing ESRD in a white American
individual was significantly increased when a family member (first, second or third
degree) with ESRD. And the results of this study indicate that a familial aggregation
of ESRD is present among white Americans when either a first, second, or third
degree relative was considered as a positive family history. In the sample population
of ESRD cases, 7.8% (8 of 103) had a first, 6.8% (7 of 103) a second, and 5.8% (6 of
103) a third-degree relative with ESRD. (Spray B., et.al., 1995).
Table (4.11): Presence of chronic renal failure among relatives (N = 70).
Variable
Type of relation
First
degree
Second
degree
First
and
second
degree
Others
relatives Total
N % N % N % N % N %
38 54.3 23 32.9 6 8.6 3 4.3 70 100.0
Does your relative live in
the same area?
Yes 45 64.3%
No 25 35.7%
Total 70 100.0%
A.4.2.11. Distribution of study participants by kidney transplantation:
Regarding to distribution of the study participants by kidney transplantation; table
(4.12) shows that the number of patients who have kidney transplantation is 13, and
represent 5.5% from the total participants. All patients who have kidney
transplantation done it for one time only, and there is no patient done it more than one
time. The majority of kidney transplantation numbers were done in Egypt which
include 11 patients and represent 84.6% from the total subjects who have kidney
transplantation, while in Iraq the number of patients is 1 patient and represent 7.7%,
as well as in Jordan the number is 1 patient and represent 7.7%.
The results of the study are vary with the study made by Shang Hwang, et.al., in
Taiwan, it showed that the domestic renal transplant patients from 1997–2007 were
2054 cases based on the data of the Bureau of National Health Insurance (BNHI).
However, it was estimated that another 50% of patients received off-shore renal
transplantation, mainly from China. (Hwang Sh., et.al.2010).

48
This variation between two studies may be due to the weakness of quality of health
care in Gaza governorates, lack of kidney donors in Gaza governorates in order to do
kidney transplantation to patients with renal failure, the bad economic status in Gaza
governorates, and the patients don't have the ability to pay the costs of kidney
transplants, and the imposed siege on Gaza governorates by Israeli occupation lead to
prevent patients from traveling for treatment and kidney transplant and get rid of the
disease.
Table (4.12): Distribution of study participants by kidney transplant.
Variable Frequency Percent
Did you have kidney transplant?
Yes 13 5.5
No 222 94.5
Total 235 100.0
Frequency of kidney transplant
One time 13 100.0
More than one time 0 0
Total 13 100.0
Place of having kidney transplant
Egypt 11 84.6
Iraq 1 7.7
Jordan 1 7.7
Total 13 100.0
A.4.3. Distribution of study participants by environmental factors characteristic:
A.4.3.1. Distribution of study participants by place of residency:
The distribution of the study participants by place of residency is shows in the table
(4.13), the total number of participants is living in Gaza governorate which includes
96 patients, which represent 40.9%, from the total subjects; while the north
governorate the number of participants is 57 patients and represent 24.3%; as well as
the number of participants in middle governorate is 31 patients and represent 13.2%;
whereas the number of participants in Khanyounis governorate is 21 patients and
represent 8.9%; finally the number of participants in Rafah governorate is 30 patients
and represent 12.8%.
The majority of subjects were living in city, which include 145 patients and represent
61.7% from the total subjects, as well as the number of participants who living in
camp is 47 patients and represent 20%; while the number of participants who living in
village is 16 patients and represent 6.8%; finally the number of participants who
living in border area is 27 patients and represent 11.5%.

49
The number of participants who living in crowded area is 121 patients and represent
51.5%, from the total subjects; while the number of participants who don’t living in
crowded area is 114 patients and represent 48.5%.
The results of the study are correspond with the study made by Hala Medokh, in Gaza
governorates in Palestine, which included 404 patients, and it was showed that the
major number of participants were living in Gaza governorate and they represent
(33.2%) from the total number of participants, while the number of participants who
were living in north governorate was represent (18.6%), whereas the number of
participants who were living in middle governorate was represent (13.2%), and the
number of participants who were living in Rafah governorate was represent (13%). In
other hand the study results are vary with this study, because it showed that the
number of participants who were living in Khanyounis governorate was represent
(20.3%). (Medokh H., 2013).
Also the results of the study are vary with the results of the study made by Kazem
Basheer, (2011) in West bank in north Palestine, which included 293 patients, and it
was showed that more than half (59.4%) of ESRD patients were living in villages.
While about one third (32.4%) of ESRD patients were living in cities, and only
(8.2%) were living in refugee camps. (Basheer K., 2011).
The differences between two studies may be due to the geographical nature of the
West Bank and the large number of villages in this area; while the number of villages
in the Gaza governorates is very limited.
Table (4.13): Place of residency.
Variable Frequency Percent
Governorate
North 57 24.3
Gaza 96 40.9
Middle 31 13.2
Khanyounis 21 8.9
Rafah 30 12.8
Total 235 100.0
Do you live in:
City 145 61.7
Camp 47 20.0
Village 16 6.8
Border area 27 11.5
Total 235 100.0
Do you live in a crowded area?
Yes 121 51.5
No 114 48.5
Total 235 100.0
51
A.4.3.2. Distribution of study participants by work conditions:
When the distribution of the study participants by work conditions, table (4.14)
describe the current work status and shows that the majority of subjects are
unemployed, which include 215 patients, and represent 91.5% from the total subjects;
while the number of employees participants is 20 patients, and represent 8.5%.
Regarding to the nature of current work for the employees participants, 12 patients are
working at governmental jobs, and represent 60%, from the total employees
participants; while 2 patients are working as engineer, and represent 10%, as well as 1
patient is working in health field, and represent 5%, and 3 patients are working in
trading, and represent 15%, finally 2 patients are working in agriculture, and represent
10%.
The number of participants who have jobs before sustaining chronic renal failure is
111 patients, and represent 47.2% from the total subjects. Regarding to the nature of
these jobs, the governmental jobs include 25 patients, and represent 22.5% from the
total participants who have jobs before sustaining chronic renal failure; the number of
car mechanic jobs is 5 patients, and represent 4.5%; the number of iron work jobs is 4
patients, and represent 3.6%; the number of ranching jobs is 4 patients, and represent
3.6%; the number of buildings jobs is 25 patients, and represent 22.5%; the number of
teaching jobs is 11 patients, and represent 9.9%; the number of fisherman jobs is 4
patients, and represent 3.6%; the number of trading jobs is 12 patients, and represent
10.9%; the number of information technology jobs is 1 patient, and represent 0.9%;
the number of agriculture jobs is 6 patients, and represent 5.4%; the number of driver
jobs is 10 patients, and represent 9%; and finally the number of dressmaker jobs is 4
patients, and represent 3.6%.
The distribution of the study participants by sitting for long hours in previous work,
was showed in the table (4.14); the majority of participants jobs don't require sitting
for long hours and it is number 191, which represent 81.3% from the total subjects;
while the number of participants work's that requires sitting for long hours is 44, and
represent 18.7%. whereas the sitting hours during work was classified into 4 groups,
the first group is 2-4 hours which include 8 patients, and represent 18.2% from the
total participants who required sitting for long hours at his work; the second group is
5-8 hours, which include 18 patients, and represent 40.9%, and considered the highest
group which include participants who required sitting for long hours at his work; the
third group is 9-2 hours, which include 12 patients, and represent 27.3%; finally the
fourth group is more than 12 hours, it include 6 patients, and represent 13.6%, which
considered the lowest group that include participants who required sitting for long
hours at his work.

51
The study is correspond with the study made by Eman Mokhamer, in Khanyounis
governorate in Palestine, which included 194 patients, and it showed that currently
about 89.7% are unemployed due to the political and economic situation in the
country, and only 10.3% are currently working. Out of the working percent,
agriculture represented 28.5% of the total workers, construction represented 14.2% of
the total workers, and all other jobs which include physicians, administrative workers,
nurses, managers, teachers, pharmacists, lab technicians, hair dressers, finance
professionals, and policemen comprise 57%. Each job represented a percentage of
about 7% of the total jobs. Agriculture and construction have the highest percentages,
as well as it showed that 63.9% were previously unemployed. Only 36.02 % were
previously employed, and out of the total employed 36.7% were in agriculture, 22.4%
were in construction , and 40.8% were in all other jobs that were previously
mentioned with percentages not exceeding 5% for each job. (Mokhamer E., 2009).
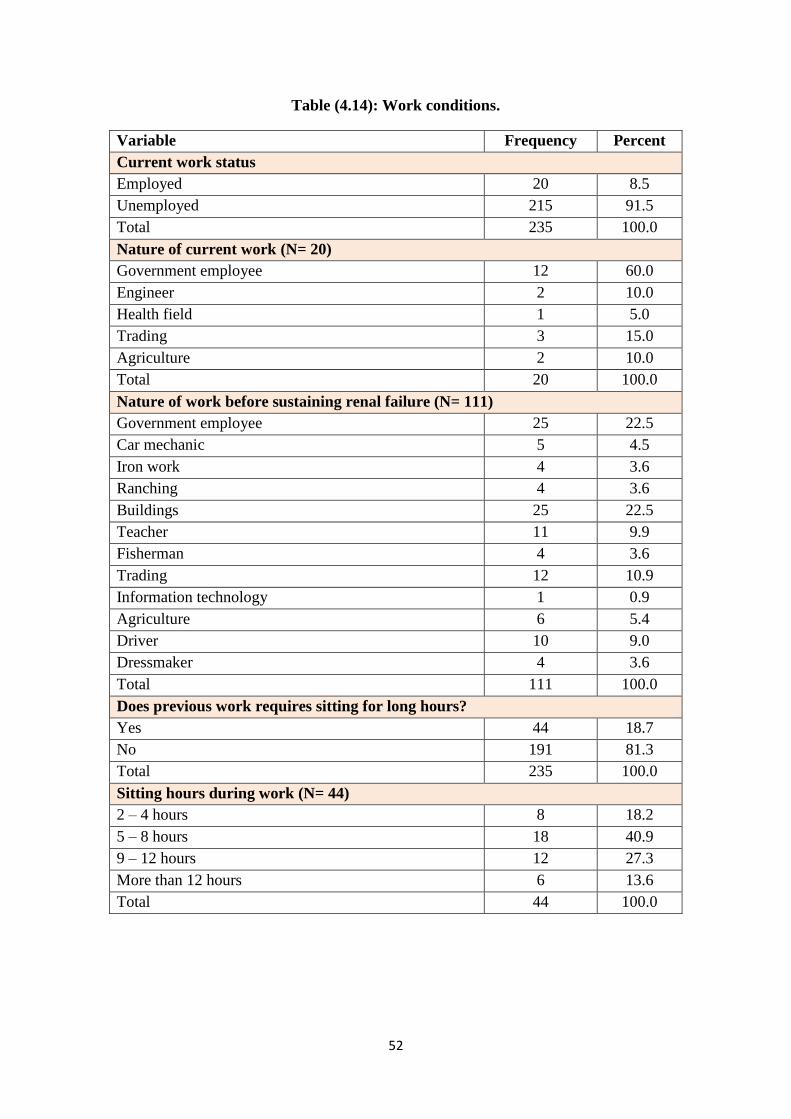
52
Table (4.14): Work conditions.
Variable Frequency Percent
Current work status
Employed 20 8.5
Unemployed 215 91.5
Total 235 100.0
Nature of current work (N= 20)
Government employee 12 60.0
Engineer 2 10.0
Health field 1 5.0
Trading 3 15.0
Agriculture 2 10.0
Total 20 100.0
Nature of work before sustaining renal failure (N= 111)
Government employee 25 22.5
Car mechanic 5 4.5
Iron work 4 3.6
Ranching 4 3.6
Buildings 25 22.5
Teacher 11 9.9
Fisherman 4 3.6
Trading 12 10.9
Information technology 1 0.9
Agriculture 6 5.4
Driver 10 9.0
Dressmaker 4 3.6
Total 111 100.0
Does previous work requires sitting for long hours?
Yes 44 18.7
No 191 81.3
Total 235 100.0
Sitting hours during work (N= 44)
2 – 4 hours 8 18.2
5 – 8 hours 18 40.9
9 – 12 hours 12 27.3
More than 12 hours 6 13.6
Total 44 100.0

53
A.4.3.3. Distribution of study participants by monthly income before sustain
chronic renal failure:
The monthly income before sustain chronic renal failure is represents in the figure
(4.2) which shows that more than half of subjects, there monthly salary less than 1000
NIS, and represents 59.6% from the total subjects which considered as the highest
level of monthly salary; while the monthly salary between 1000-2000 NIS was
represent 29.8%; as well as the monthly salary between 2100-3000 NIS was represent
6.8%; finally the monthly salary more than 3000 NIS was represent 3.8% and
considered as the lowest level of monthly salary.
Also the figure (4.2) shows that there is an inverse relationship between the number of
patients with CRF and their monthly income before sustain CRF. Whereas the number
of patients was decreased when monthly income was increased.
The study is correspond with the study made by Claudia Lora, et.al. which made in
United States, and interested in Hispanic end stage renal disease (ESRD) population.
It was showed that nearly two-thirds (65%) of working-age Hispanics with low
incomes were uninsured for all or part of the year in 2000. (Lora C., et.al, 2009).
But the study is vary with the study made by Paul Arora, et.al, in Canada, which
included 3689 adult participants. And it was showed that 47.9% of participants are
considered as the highest level of incomes, while 32.7% of participants are considered
as the upper middle level of incomes, as well as 14.4% of participants are considered
as the lower middle level of incomes, finally 5.1% of participants are considered as
the lowest level of incomes. (Arora P., et.al, 2013).
This variation are due to Gaza governorates are considered very poor area compared
to Canada; also Gaza governorates are a part of the state of occupied Palestine by
Israeli occupation, and exposed from time to time to many wars by the Israeli army,
Also Israeli occupation imposes suffocating siege on the Gaza governorates since
2007, which led to increase the level of poverty among most of the population of the
Gaza governorates, all of this are led to decrease the levels of income in Gaza
governorates.
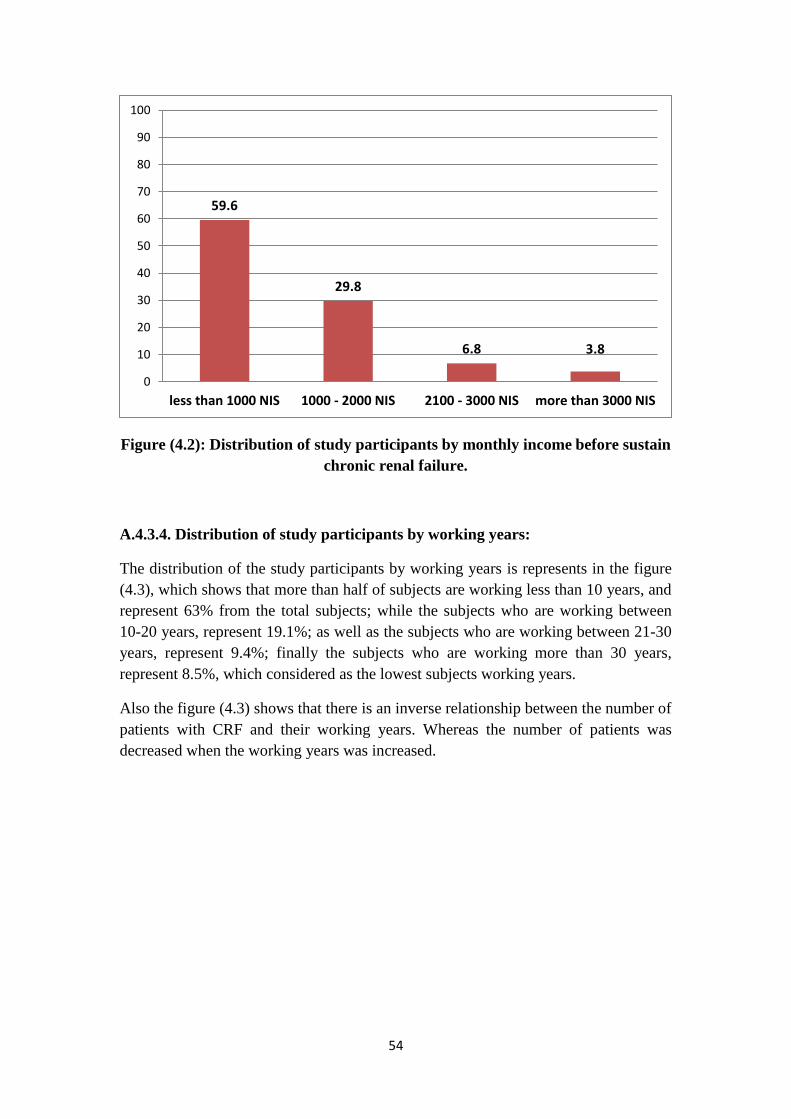
54
Figure (4.2): Distribution of study participants by monthly income before sustain
chronic renal failure.
A.4.3.4. Distribution of study participants by working years:
The distribution of the study participants by working years is represents in the figure
(4.3), which shows that more than half of subjects are working less than 10 years, and
represent 63% from the total subjects; while the subjects who are working between
10-20 years, represent 19.1%; as well as the subjects who are working between 21-30
years, represent 9.4%; finally the subjects who are working more than 30 years,
represent 8.5%, which considered as the lowest subjects working years.
Also the figure (4.3) shows that there is an inverse relationship between the number of
patients with CRF and their working years. Whereas the number of patients was
decreased when the working years was increased.
59.6
29.8
6.8 3.8
0
10
20
30
40
50
60
70
80
90
100
less than 1000 NIS 1000 - 2000 NIS 2100 - 3000 NIS more than 3000 NIS
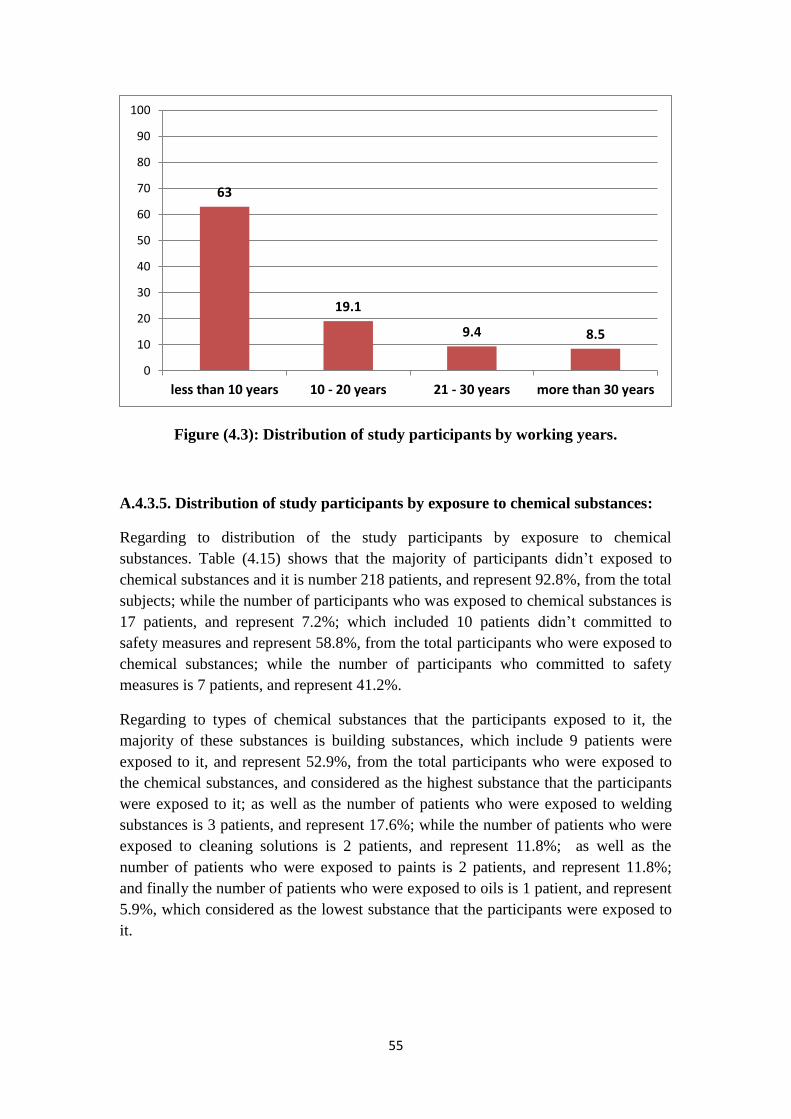
55
Figure (4.3): Distribution of study participants by working years.
A.4.3.5. Distribution of study participants by exposure to chemical substances:
Regarding to distribution of the study participants by exposure to chemical
substances. Table (4.15) shows that the majority of participants didn’t exposed to
chemical substances and it is number 218 patients, and represent 92.8%, from the total
subjects; while the number of participants who was exposed to chemical substances is
17 patients, and represent 7.2%; which included 10 patients didn’t committed to
safety measures and represent 58.8%, from the total participants who were exposed to
chemical substances; while the number of participants who committed to safety
measures is 7 patients, and represent 41.2%.
Regarding to types of chemical substances that the participants exposed to it, the
majority of these substances is building substances, which include 9 patients were
exposed to it, and represent 52.9%, from the total participants who were exposed to
the chemical substances, and considered as the highest substance that the participants
were exposed to it; as well as the number of patients who were exposed to welding
substances is 3 patients, and represent 17.6%; while the number of patients who were
exposed to cleaning solutions is 2 patients, and represent 11.8%; as well as the
number of patients who were exposed to paints is 2 patients, and represent 11.8%;
and finally the number of patients who were exposed to oils is 1 patient, and represent
5.9%, which considered as the lowest substance that the participants were exposed to
it.
63
19.1
9.4 8.5
0
10
20
30
40
50
60
70
80
90
100
less than 10 years 10 - 20 years 21 - 30 years more than 30 years
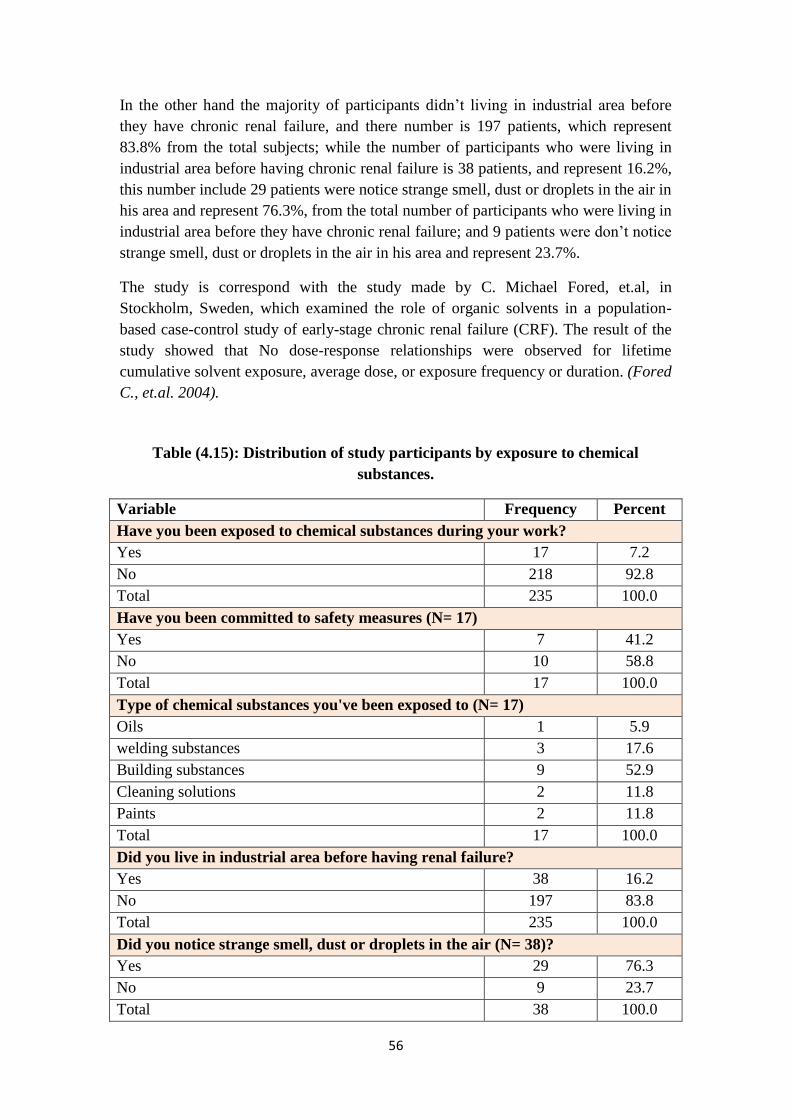
56
In the other hand the majority of participants didn’t living in industrial area before
they have chronic renal failure, and there number is 197 patients, which represent
83.8% from the total subjects; while the number of participants who were living in
industrial area before having chronic renal failure is 38 patients, and represent 16.2%,
this number include 29 patients were notice strange smell, dust or droplets in the air in
his area and represent 76.3%, from the total number of participants who were living in
industrial area before they have chronic renal failure; and 9 patients were don’t notice
strange smell, dust or droplets in the air in his area and represent 23.7%.
The study is correspond with the study made by C. Michael Fored, et.al, in
Stockholm, Sweden, which examined the role of organic solvents in a population-
based case-control study of early-stage chronic renal failure (CRF). The result of the
study showed that No dose-response relationships were observed for lifetime
cumulative solvent exposure, average dose, or exposure frequency or duration. (Fored
C., et.al. 2004).
Table (4.15): Distribution of study participants by exposure to chemical
substances.
Variable Frequency Percent
Have you been exposed to chemical substances during your work?
Yes 17 7.2
No 218 92.8
Total 235 100.0
Have you been committed to safety measures (N= 17)
Yes 7 41.2
No 10 58.8
Total 17 100.0
Type of chemical substances you've been exposed to (N= 17)
Oils 1 5.9
welding substances 3 17.6
Building substances 9 52.9
Cleaning solutions 2 11.8
Paints 2 11.8
Total 17 100.0
Did you live in industrial area before having renal failure?
Yes 38 16.2
No 197 83.8
Total 235 100.0
Did you notice strange smell, dust or droplets in the air (N= 38)?
Yes 29 76.3
No 9 23.7
Total 38 100.0

57
A.4.3.6. Distribution of study participants by exposure to pesticides / insecticides:
Table (4.16) shows the distribution of study participants by exposure to pesticides and
they were distributed with different numbers and percentage. The major number of
participants didn’t use the pesticides inside their homes, and it is reached 129 patients,
which represent 54.9% from the total subjects, while the number of participants who
was used pesticides inside their homes is 106 patients, and represent 45.1%. The
number of patients who had the harmful effects from pesticides to them or to their
families is 13 patients, and represent 12.3%, from the total participants who was used
pesticides inside their homes; while the number of patients who didn’t have the
harmful effects from pesticides to them or to their families is 93 patients, and
represent 87.7%.
The majority of participants didn’t work in jobs that may exposed them to pesticides,
and their number reached 199 patients, and represent 84.7% from the total subjects;
while the number of participants who were working in jobs that exposed them to
pesticides is 36 patients, and represent 15.3%.
In other hand the major number of participants are those who were washed the
vegetables and fruits well to get rid of pesticides, and it is number reached 206
patients, and represent 87.7%, from the total subjects; while the number of
participants who didn’t wash the vegetables and fruits well to get rid of pesticides is
29 patients, and represent 12.3%.
Also the table show that about three-quarter of participants didn’t live in agricultural
area, and it is number reached 172 patients, and represent 73.2% from the total
subjects; while the number of participants who living in agricultural area is 63
patients, and represent 26.8%.
This study is vary with the study made by Carlos M. Orantes, et.al, in Bajo Lempa
region of El Salvador and it involved a total of 375 families and 775 individuals (343
men, 432 women). were studied 88.3% of the total resident population in the region.
Elevated prevalence of chronic renal failure risk factors was observed agricultural
occupation 40.6% (80.6% in men); and contact with agrochemicals 50.3% (82.5% in
men). (Orantes C., et.al 2011).
As well as the results of the study are different with the study made Emad G. Kamel,
and Osama El-Minshawy, in El-Minia governorate, Egypt. And included 216 patients
with an unknown etiology of ESRD, as well as 220 patients (control) with unrelated
health problems from general hospitals. It was found that 51.9% of patients exposed
to pesticides during their work. (Kamel E., and El-Minshawy O., 2010).
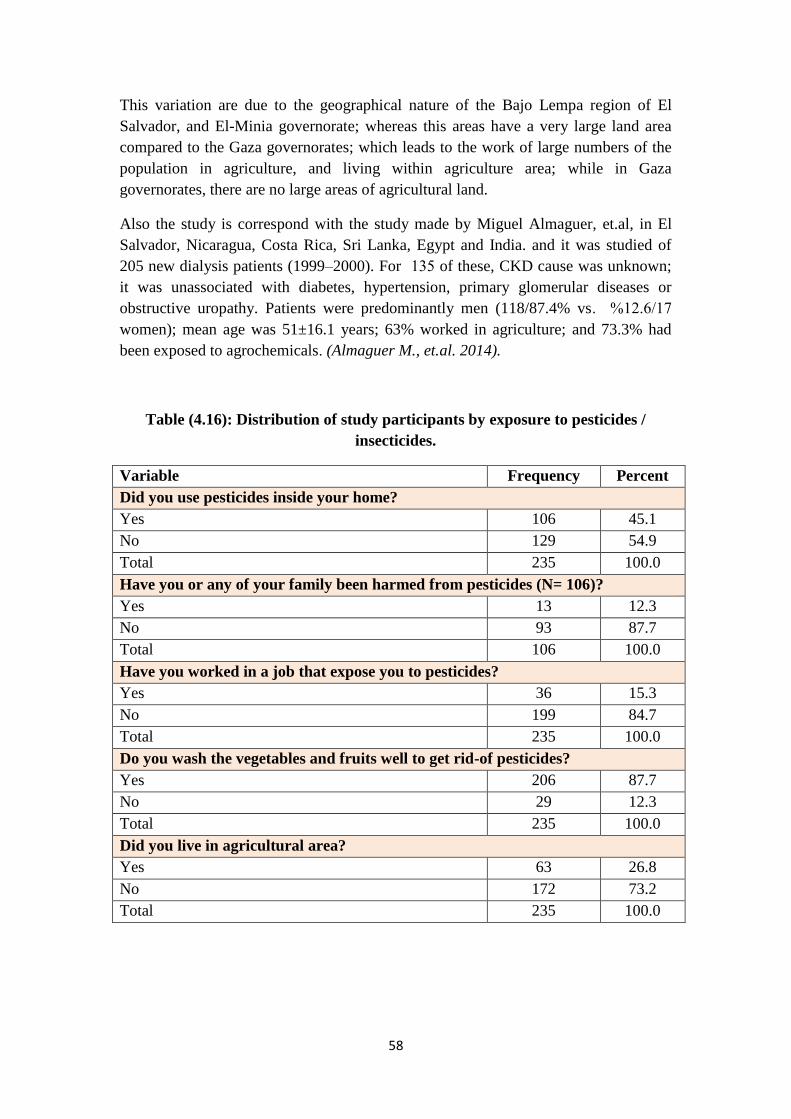
58
This variation are due to the geographical nature of the Bajo Lempa region of El
Salvador, and El-Minia governorate; whereas this areas have a very large land area
compared to the Gaza governorates; which leads to the work of large numbers of the
population in agriculture, and living within agriculture area; while in Gaza
governorates, there are no large areas of agricultural land.
Also the study is correspond with the study made by Miguel Almaguer, et.al, in El
Salvador, Nicaragua, Costa Rica, Sri Lanka, Egypt and India. and it was studied of
205 new dialysis patients (1999–2000). For 135 of these, CKD cause was unknown;
it was unassociated with diabetes, hypertension, primary glomerular diseases or
obstructive uropathy. Patients were predominantly men (118/87.4% vs. 17/12.6 %
women); mean age was 51±16.1 years; 63% worked in agriculture; and 73.3% had
been exposed to agrochemicals. (Almaguer M., et.al. 2014).
Table (4.16): Distribution of study participants by exposure to pesticides /
insecticides.
Variable Frequency Percent
Did you use pesticides inside your home?
Yes 106 45.1
No 129 54.9
Total 235 100.0
Have you or any of your family been harmed from pesticides (N= 106)?
Yes 13 12.3
No 93 87.7
Total 106 100.0
Have you worked in a job that expose you to pesticides?
Yes 36 15.3
No 199 84.7
Total 235 100.0
Do you wash the vegetables and fruits well to get rid-of pesticides?
Yes 206 87.7
No 29 12.3
Total 235 100.0
Did you live in agricultural area?
Yes 63 26.8
No 172 73.2
Total 235 100.0

59
A.4.3.7. Distribution of study participants by exposure to environmental poisons:
The distribution of study participants by exposure to the environmental poisons (such
as snake bit) is represents in figure (4.4), which shows that the majority of the
subjects didn’t exposed to environmental poisons and represent 92.8%, from the total
subjects, while the participants who were exposed to environmental poisons represent
7.2%.
The results of the study are correspond with the study made by Emad G. Kamel, and
Osama El-Minshawy, in El-Minia governorate, Egypt. It was found that 2.3% of
patients and 0.9% of controls were have history of environmental poisons (snake bit).
(Kamel E., and El-Minshawy O., 2010).
Figure (4.4): Distribution of study participants by exposure to environmental
poisons.
A.4.3.8. Distribution of study participants by drinking unsafe water:
Regarding to distribution of the study participants by drinking unsafe water, table
(4.17) shows that the majority of subjects are using a filtered water as a current source
of drinking water, and their number 201 patients, which represent 85.5% from the
total subjects; as well as the number of patients who are using municipality water is
17 patients, and represent 7.2%; also the number of patients who are using water from
private well is 15 patients, and represent 6.4%; finally the number of patients who are
using macarot water is 2, and represent 0.9% which considered as the lowest current
source of drinking water.
7.2
92.8
0
10
20
30
40
50
60
70
80
90
100
Yes No

61
Also the table (4.17) display the source of drinking water before having chronic renal
failure, and it shows that about half of subjects was used a municipality water as a
source of drinking water before having chronic renal failure, and their number 111
patients, and represent 47.2% from the total subjects; as well as the number of patients
who were used filtered water is 103 patients, and represent 43.8%; while the number
of patients who were used water from private well is 16 patients, and represent 6.8%;
finally the number of patients who were used macarot water is 5 patients, and
represent 2.1%, which considered as the lowest source of drinking water before
having chronic renal failure.
The distribution of study participants by the source of cooking water before having
chronic renal failure, the table (4.17), shows that about half of subjects was used a
municipality water as a source of cooking water before having chronic renal failure,
and their number 113 patients, which represent 48.1% from the total subjects; while
the number of patients who were used filtered water is 108 patients, and represent 46
%; as well as the number of patients who were used cooking water from the private
well is 13 patients, and represent 5.5%; finally the number of patients who were used
macarot water for cooking is 1 patient, and represent 0.4%, which considered as the
lowest source of cooking water before having chronic renal failure.
Table (4.17): Distribution of study participants by water source.
Variable Frequency Percent
Current source of drinking water
Municipality 17 7.2
Macarot 2 0.9
Filter 201 85.5
Private well 15 6.4
Total 235 100.0
Source of drinking water before renal failure
Municipality water 111 47.2
Macarot water 5 2.1
Filtered water 103 43.8
Water from Private well 16 6.8
Total 235 100.0
Source of cooking water before renal failure
Municipality 113 48.1
Macarot 1 0.4
Filter 108 46.0
Private well 13 5.5
Total 235 100.0

61
When study participants distributed by water characteristics, the majority of
participants told that their drinking water is clean and clear, and their number 207
patients, which represent 88.1%, from the total subjects; while the number of
participants who told that their drinking water doesn’t clean and clear is 28 patients,
and represent 11.9%.
The majority of participants didn’t notice changes in water characteristics and their
number reached 195 patients, and represent 83%, from the total subjects; while the
number of participants who notice changes in water characteristics is 40 patients, and
represent 17%.
Also the table (4.18) shows that about half of participants don’t use water filter at
home and their number reached 130 patients, and represent 55.3%, from the total
subjects; while the number of participants who use water filter at home is 105
patients, and represent 44.7%.
Table (4.18): Distribution of study participants by water characteristics.
Variable Frequency Percent
Does the drinking water clean and clear?
Yes 207 88.1
No 28 11.9
Total 235 100.0
Does the drinking water have changes in characteristics (smell or color)
Yes 40 17.0
No 195 83.0
Total 235 100.0
Do you use water filter at home?
Yes 105 44.7
No 130 55.3
Total 235 100.0
The distribution of the study participants by the amount of drinking water per day, is
represents in the figure (4.5), which shows that 63% of the subjects were drinking 2
litters and less per day; while the participants who were drinking between 3-5 litters
of water per day was represent 32.8%, finally the participants who were drinking 6
litters of water and more per day, represent 4.3%, and considered as the lowest
amount of drinking water per day.

62
Figure (4.5): Distribution of participants by amount of drinking water daily.
The results of the study are vary with the study conducted by Emad G. Kamel, and
Osama El-Minshawy, in El-Minia governorate, Egypt. In which the source of drinking
water at home or work was investigated in this study. It was found that 71.8% of cases
used to drink unsafe water (from stream or tube wells), while 47.5% of controls used
to drink the same kind of water. (Kamel E., and El-Minshawy O., 2010).
Also the results of the study are correspond with the study made by Eman Mokhamer,
in Khanyounis governorate in Palestine, which included 194 patients, and it was
showed that the subjects have access to domestic water through one of the four
suppliers in the governorate. The majority have municipal access (77.9% of the total
subjects), 13.2% have access to private well, 7.4% have makarout access and 1.5%
only have UNRWA access. There is a wide range of differences between previous and
current domestic water treatment before ten years. Only 2.9% of the total subjects
treated domestic water before using for drinking purpose, but recently only 7.4% of
the subjects didn’t treat domestic water before using it for drinking purposes. Many
didn't treat because they have access to mekarout water, which has WHO approval for
drinking water. Sometimes this water has a lesser chloride level than the WHO
standard, meaning that 92.6% of the total subjects didn't use domestic water without
treatment. This could be reflected by the Gaza governorates society as all have the
same access for the saline ground water with different level of salinity. The majority
of subjects (52.4%), buy this water from desalination stations, while 30% were using
home filter, and the rest take water from mekarout. Recently as they have access 75%
of the subjects treated their water after chronic renal failure incidence, while the other
25% only treated water before chronic renal failure incidence. Regarding the total
consumed drinking water by subjects, 75% of the total subjects consumed less than
three liters per day, 17.4% drink more than three liters, 7.4% didn’t know the total
daily amount, and none drink exactly three liters per day. Most of the subjects
(76.5%) used treated water for cooking, but 23.5% still use untreated domestic water
for cooking. (Mokhamer E., 2009).
63
32.8
4.3
0
10
20
30
40
50
60
70
2 litters and less 3 - 5 litters 6 litters and more
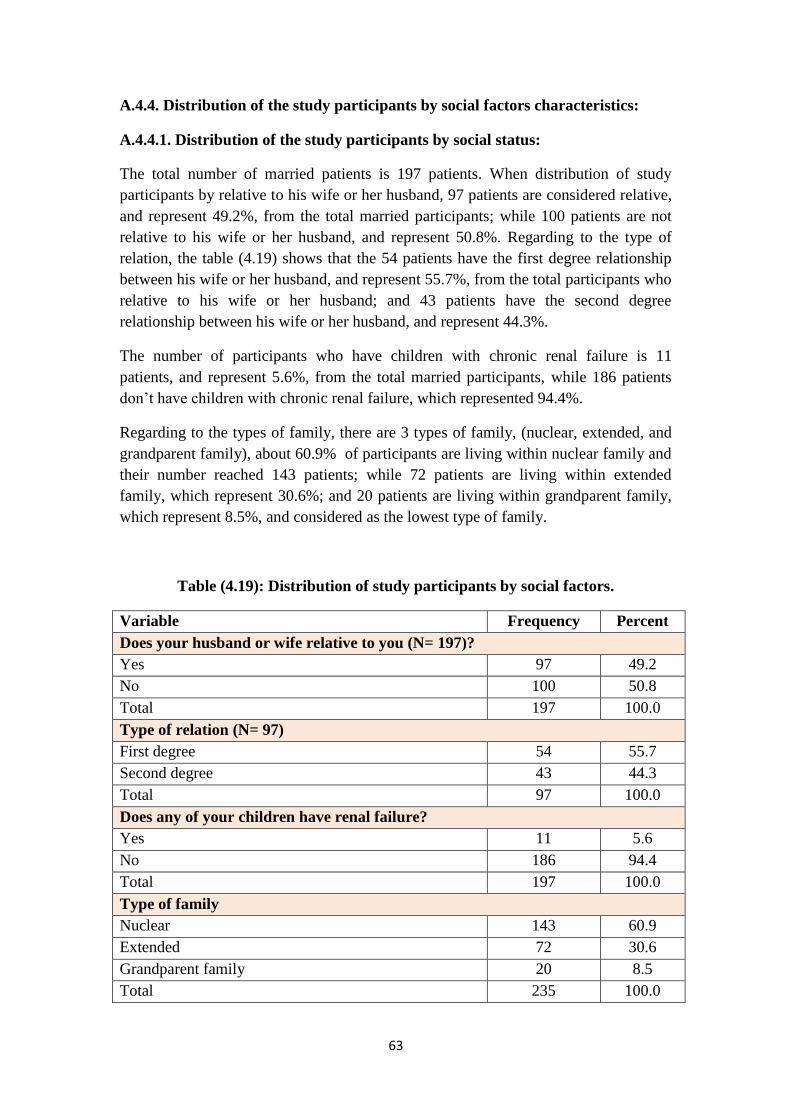
63
A.4.4. Distribution of the study participants by social factors characteristics:
A.4.4.1. Distribution of the study participants by social status:
The total number of married patients is 197 patients. When distribution of study
participants by relative to his wife or her husband, 97 patients are considered relative,
and represent 49.2%, from the total married participants; while 100 patients are not
relative to his wife or her husband, and represent 50.8%. Regarding to the type of
relation, the table (4.19) shows that the 54 patients have the first degree relationship
between his wife or her husband, and represent 55.7%, from the total participants who
relative to his wife or her husband; and 43 patients have the second degree
relationship between his wife or her husband, and represent 44.3%.
The number of participants who have children with chronic renal failure is 11
patients, and represent 5.6%, from the total married participants, while 186 patients
don’t have children with chronic renal failure, which represented 94.4%.
Regarding to the types of family, there are 3 types of family, (nuclear, extended, and
grandparent family), about 60.9% of participants are living within nuclear family and
their number reached 143 patients; while 72 patients are living within extended
family, which represent 30.6%; and 20 patients are living within grandparent family,
which represent 8.5%, and considered as the lowest type of family.
Table (4.19): Distribution of study participants by social factors.
Variable Frequency Percent
Does your husband or wife relative to you (N= 197)?
Yes 97 49.2
No 100 50.8
Total 197 100.0
Type of relation (N= 97)
First degree 54 55.7
Second degree 43 44.3
Total 97 100.0
Does any of your children have renal failure?
Yes 11 5.6
No 186 94.4
Total 197 100.0
Type of family
Nuclear 143 60.9
Extended 72 30.6
Grandparent family 20 8.5
Total 235 100.0
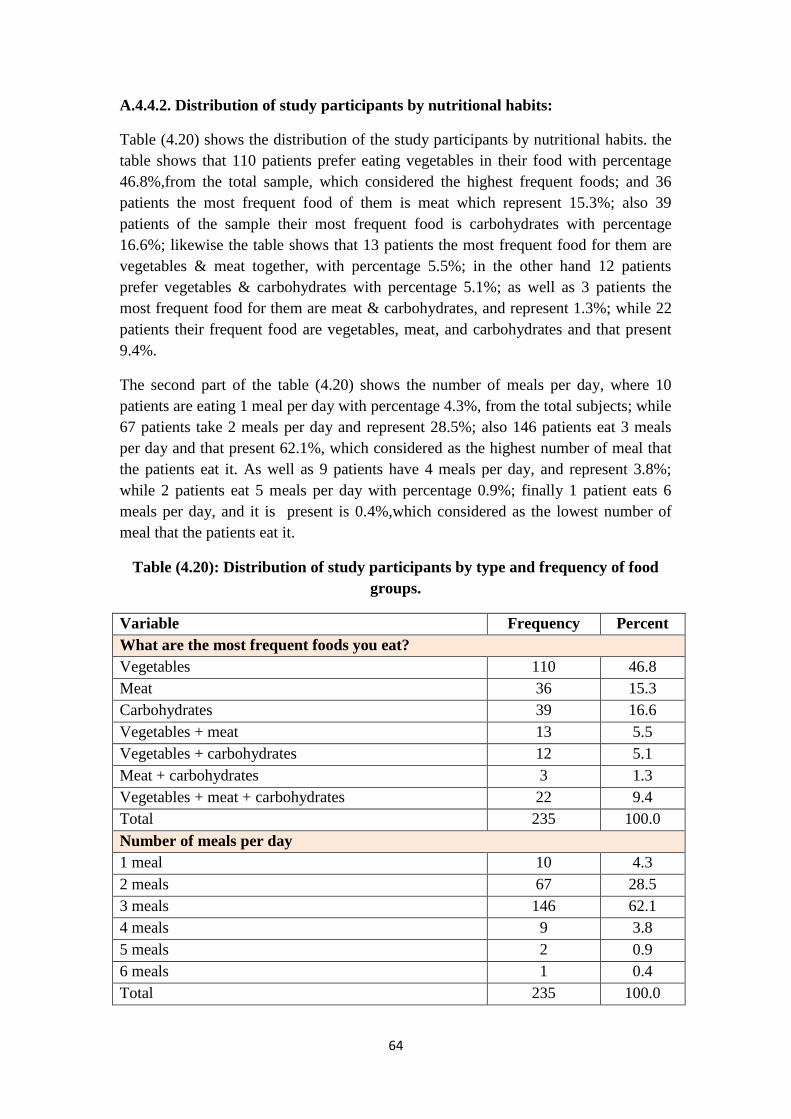
64
A.4.4.2. Distribution of study participants by nutritional habits:
Table (4.20) shows the distribution of the study participants by nutritional habits. the
table shows that 110 patients prefer eating vegetables in their food with percentage
46.8%,from the total sample, which considered the highest frequent foods; and 36
patients the most frequent food of them is meat which represent 15.3%; also 39
patients of the sample their most frequent food is carbohydrates with percentage
16.6%; likewise the table shows that 13 patients the most frequent food for them are
vegetables & meat together, with percentage 5.5%; in the other hand 12 patients
prefer vegetables & carbohydrates with percentage 5.1%; as well as 3 patients the
most frequent food for them are meat & carbohydrates, and represent 1.3%; while 22
patients their frequent food are vegetables, meat, and carbohydrates and that present
9.4%.
The second part of the table (4.20) shows the number of meals per day, where 10
patients are eating 1 meal per day with percentage 4.3%, from the total subjects; while
67 patients take 2 meals per day and represent 28.5%; also 146 patients eat 3 meals
per day and that present 62.1%, which considered as the highest number of meal that
the patients eat it. As well as 9 patients have 4 meals per day, and represent 3.8%;
while 2 patients eat 5 meals per day with percentage 0.9%; finally 1 patient eats 6
meals per day, and it is present is 0.4%,which considered as the lowest number of
meal that the patients eat it.
Table (4.20): Distribution of study participants by type and frequency of food
groups.
Variable Frequency Percent
What are the most frequent foods you eat?
Vegetables 110 46.8
Meat 36 15.3
Carbohydrates 39 16.6
Vegetables + meat 13 5.5
Vegetables + carbohydrates 12 5.1
Meat + carbohydrates 3 1.3
Vegetables + meat + carbohydrates 22 9.4
Total 235 100.0
Number of meals per day
1 meal 10 4.3
2 meals 67 28.5
3 meals 146 62.1
4 meals 9 3.8
5 meals 2 0.9
6 meals 1 0.4
Total 235 100.0

65
In the same way the table (4.21) shows that the distribution of study participants by
fast ready meals and poor nutrition. The first question ask about eating fast ready
meals, sweets and soft drinks. It show that 136 patients are eating fast ready meals,
sweets and soft drinks, and they represent 57.9%, from the total sample; while 99
patients said don’t eat fast ready meals, sweets and soft drinks, which represent
42.1%. While the second question asking about suffering from diseases which caused
by poor nutrition, the major number of participants were not suffering from diseases
that caused by poor nutrition and their number reached 207 patients, with percentage
88.1%, from the total subjects; while 28 patients were suffering from diseases that
caused by poor nutrition, which represent 11.9%. Whereas the third question asked
the patients if they drinking too much coffee and tea, 132 patients were drinking too
much coffee and tea, and represent 56.9%, from the total subjects; while 103 patients
were not drinking too much coffee and tea, which represent 43.8%. Finally the fourth
question about eating canned foods, 107 patients told that they were eating canned
foods, which represent 45.5%, from the total subjects; and 128 patients didn’t eat
canned foods, and represent 54.5%.
Table (4.21): Distribution of study participants by fast ready meals and poor
nutrition.
Variable Frequency Percent
Do you eat fast ready meals, sweets, and soft drinks
Yes 136 57.9
No 99 42.1
Total 235 100.0
Did you suffer from diseases caused by poor nutrition?
Yes 28 11.9
No 207 88.1
Total 235 100.0
Are you taking too much coffee and tea?
Yes 132 56.2
No 103 43.8
Total 235 100.0
Did you used to eat canned foods
Yes 107 45.5
No 128 54.5
Total 235 100.0
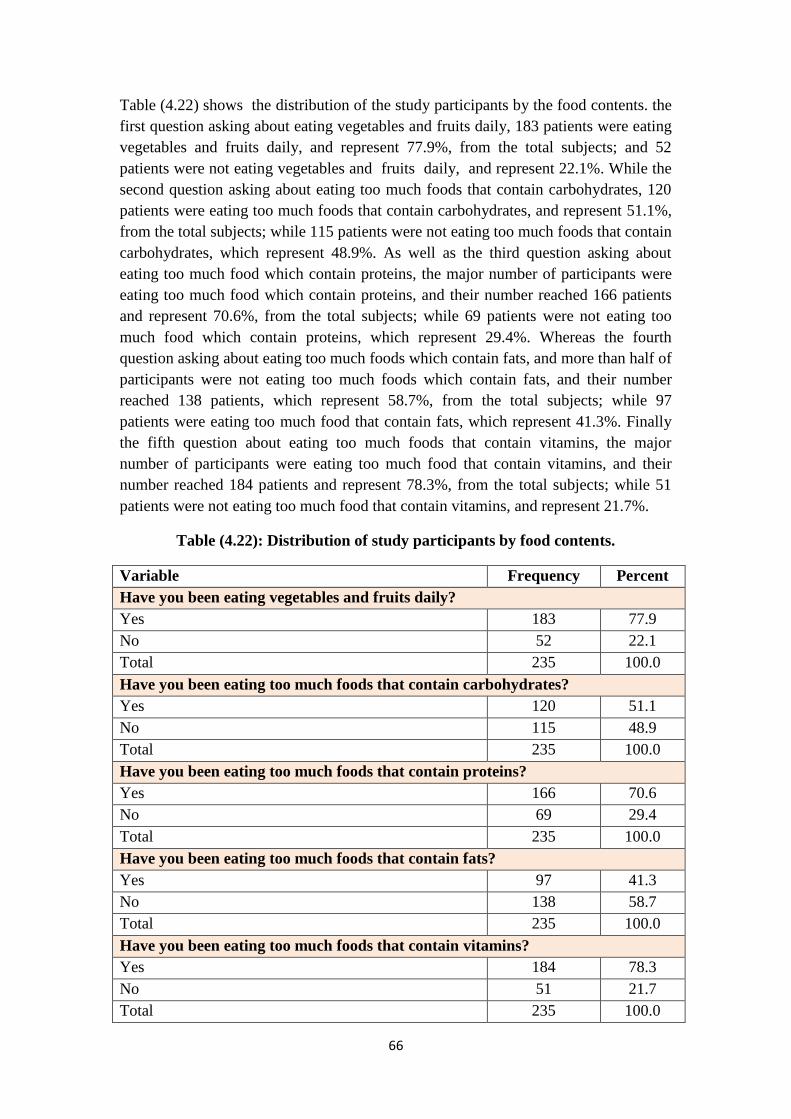
66
Table (4.22) shows the distribution of the study participants by the food contents. the
first question asking about eating vegetables and fruits daily, 183 patients were eating
vegetables and fruits daily, and represent 77.9%, from the total subjects; and 52
patients were not eating vegetables and fruits daily, and represent 22.1%. While the
second question asking about eating too much foods that contain carbohydrates, 120
patients were eating too much foods that contain carbohydrates, and represent 51.1%,
from the total subjects; while 115 patients were not eating too much foods that contain
carbohydrates, which represent 48.9%. As well as the third question asking about
eating too much food which contain proteins, the major number of participants were
eating too much food which contain proteins, and their number reached 166 patients
and represent 70.6%, from the total subjects; while 69 patients were not eating too
much food which contain proteins, which represent 29.4%. Whereas the fourth
question asking about eating too much foods which contain fats, and more than half of
participants were not eating too much foods which contain fats, and their number
reached 138 patients, which represent 58.7%, from the total subjects; while 97
patients were eating too much food that contain fats, which represent 41.3%. Finally
the fifth question about eating too much foods that contain vitamins, the major
number of participants were eating too much food that contain vitamins, and their
number reached 184 patients and represent 78.3%, from the total subjects; while 51
patients were not eating too much food that contain vitamins, and represent 21.7%.
Table (4.22): Distribution of study participants by food contents.
Variable Frequency Percent
Have you been eating vegetables and fruits daily?
Yes 183 77.9
No 52 22.1
Total 235 100.0
Have you been eating too much foods that contain carbohydrates?
Yes 120 51.1
No 115 48.9
Total 235 100.0
Have you been eating too much foods that contain proteins?
Yes 166 70.6
No 69 29.4
Total 235 100.0
Have you been eating too much foods that contain fats?
Yes 97 41.3
No 138 58.7
Total 235 100.0
Have you been eating too much foods that contain vitamins?
Yes 184 78.3
No 51 21.7
Total 235 100.0
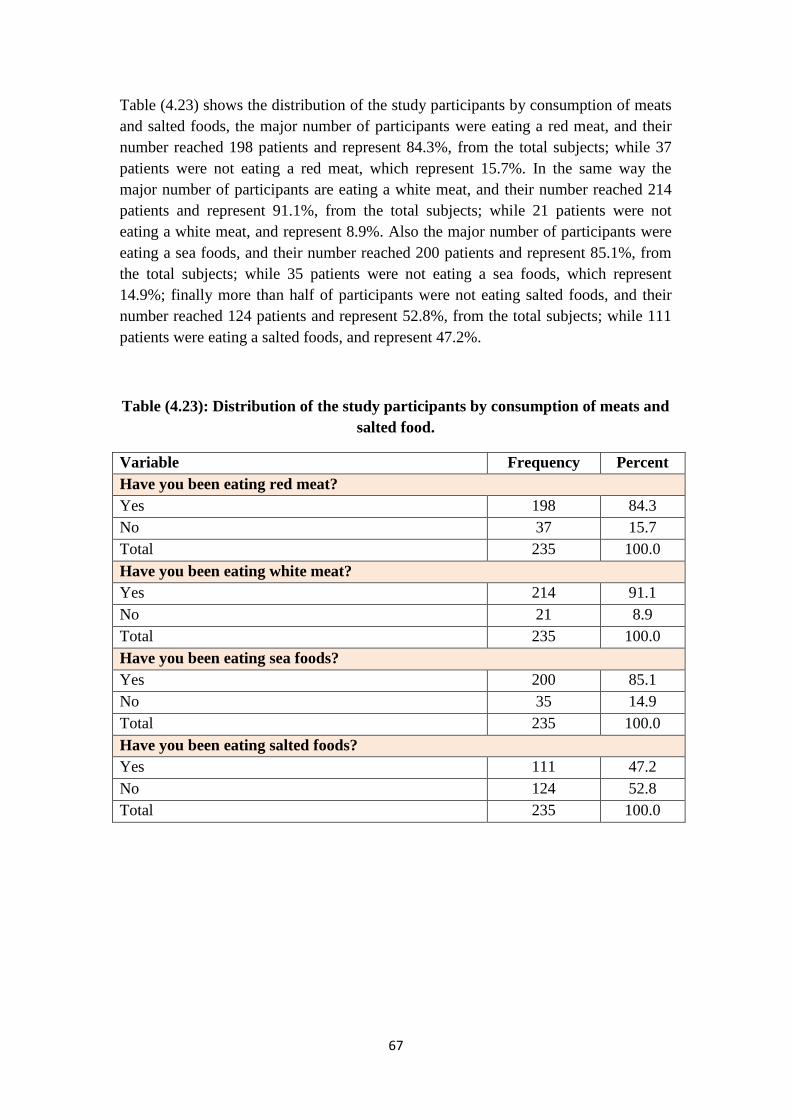
67
Table (4.23) shows the distribution of the study participants by consumption of meats
and salted foods, the major number of participants were eating a red meat, and their
number reached 198 patients and represent 84.3%, from the total subjects; while 37
patients were not eating a red meat, which represent 15.7%. In the same way the
major number of participants are eating a white meat, and their number reached 214
patients and represent 91.1%, from the total subjects; while 21 patients were not
eating a white meat, and represent 8.9%. Also the major number of participants were
eating a sea foods, and their number reached 200 patients and represent 85.1%, from
the total subjects; while 35 patients were not eating a sea foods, which represent
14.9%; finally more than half of participants were not eating salted foods, and their
number reached 124 patients and represent 52.8%, from the total subjects; while 111
patients were eating a salted foods, and represent 47.2%.
Table (4.23): Distribution of the study participants by consumption of meats and
salted food.
Variable Frequency Percent
Have you been eating red meat?
Yes 198 84.3
No 37 15.7
Total 235 100.0
Have you been eating white meat?
Yes 214 91.1
No 21 8.9
Total 235 100.0
Have you been eating sea foods?
Yes 200 85.1
No 35 14.9
Total 235 100.0
Have you been eating salted foods?
Yes 111 47.2
No 124 52.8
Total 235 100.0

68
Table (4.24) shows the distribution of the study participants by practicing exercise or
sports, the majority of participants didn’t practice an exercise or sports, and their
number reached 176 patients, and represent 74.9% from the total subjects; while the
number of participants who was practice the exercise or sports, is 59 patients, and
represented 25.1%.
Table (4.24): Distribution of the study participants by practicing exercise or
sports.
Variable Frequency Percent
Have you been practicing exercise / sports regularly?
Yes 59 25.1
No 176 74.9
Total 235 100.0
The results of the study are correspond with the study made by Hala Medokh, in Gaza
governorates in Palestine, which included 404 patients, and showed that the major
number of participants were eating salty foods, which represent 86.4% from the total
participants in her study.
While the results of the study are vary with Hala's study, because of her study showed
that the participants who didn’t eat salty foods was represent 13.6%. In other hand,
her study was showed that the major number of participants were taking soft drinks,
which represent 76.5% from the total participants; while the number of participants
who didn’t take soft drinks represent 23.5%. Also her study revealed that there was
241 patients who represent 60% from the total sample, those persons eating preserved
food before getting CRF. (for example: the canned, frozen food) which made by
depending on additives and preservatives to save it for longer time, that affect mainly
on the kidneys functions. While 163 patient didn’t eat the preserved foods and they
represent 40% form the total sample. (Medokh H., 2013).
69
A.4.4.3. Distribution of study participants by smoking and drug abuse:
Regarding to distribution of the study participants by smoking and drug abuse. Table
(4.25) shows that the majority of patients were non-smokers before having chronic
renal failure, and their number reached 165 patients, and represent 70.2%, from the
total subjects; while 70 patients were smokers before having chronic renal failure, and
represent 29.8%.
The number of smoked cigarettes are classified into 3 group, the first group is the
patients who smoked Less than 10 cigarettes per day, which include 6 patients, and
represent 8.6%, from the total smokers before having chronic renal failure; also the
second group is the patients who smoked 10 - 20 cigarettes per day, which include 20
patients, and represent 28.6%; and the third group is the patients who smoked more
than 20 cigarettes per day, which include 44 patients, and represent 62.8%.
At the same way the number of smoking years are classified into 3 group, the first
group is the patients who smoked Less than 10 years, which include 10 patients, and
represent 14.3%, from the total smokers before having chronic renal failure; also the
second group is the patients who smoked 10 - 20 years, which include 25 patients, and
represent 35.7%; and the third group is the patients who smoked more than 20 years,
which include 35 patients, and represent 50%.
In other hand more than half of participants are considered as passive smokers (they
have you been sitting beside smokers) and it is number reached 127 patients, and
represent 54%, from the total subjects; while 108 patients don’t considered as passive
smokers and it is number reached 108 patients, and represent 46%.
Regarding water pipe, 21 patients were smoked water pipe before having chronic
renal failure, and represent 8.9%, from the total subjects; as well as 214 patients
didn’t smoked water pipe before renal failure, and represent 91.1%.
Also 230 patients told that they didn’t addicted to any kind of opiates, which represent
97.9%, from the total subjects; while 5 patients told that they were addict to opiates,
and represent 2.1%.
The study findings are vary with the study made by Kazem Basheer, in the West bank
in north Palestine, which showed that more than the half (58.4%) of the ESRD males
patients were smokers while only one female was smoking. The majority of ESRD
patients (89%) started smoking at the age between 15-30 years old. The study results
show that 75% of ESRD smoking patients smoke 10-30 cigarettes per day, 17%
smoke 31-40 cigarettes per day, and 8% smoke 41-50 cigarettes per day. (Basheer K.,
2011).
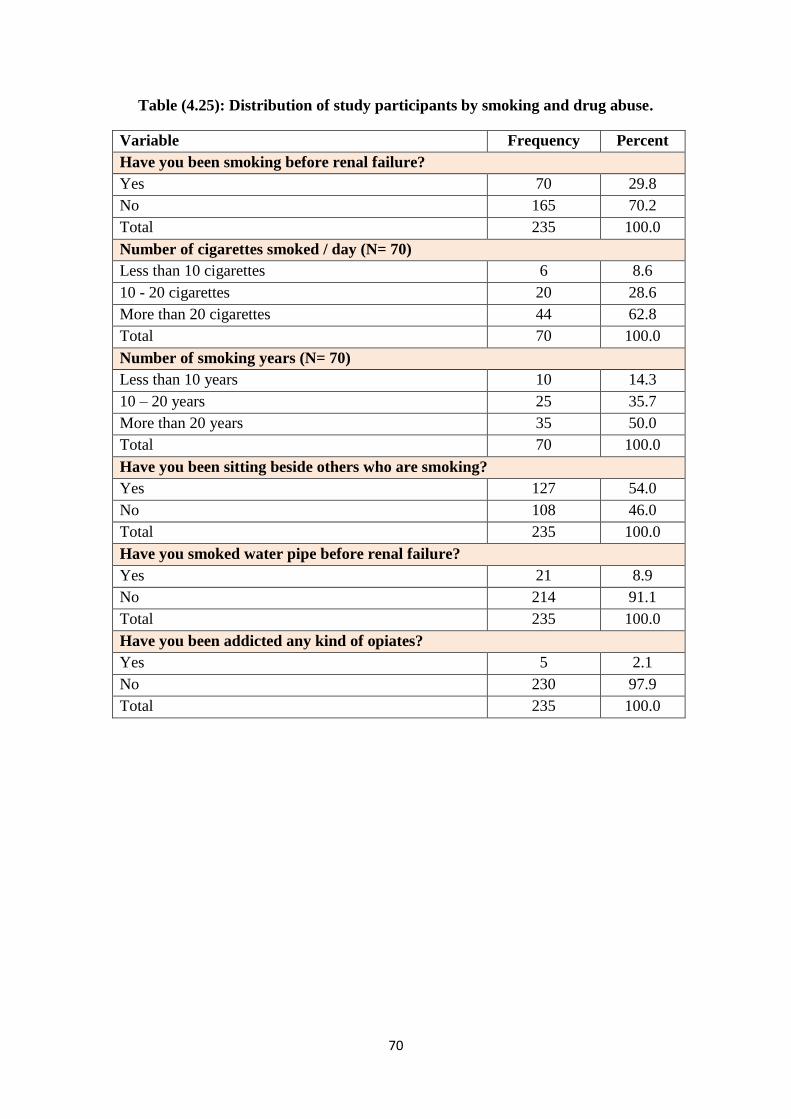
71
Table (4.25): Distribution of study participants by smoking and drug abuse.
Variable Frequency Percent
Have you been smoking before renal failure?
Yes 70 29.8
No 165 70.2
Total 235 100.0
Number of cigarettes smoked / day (N= 70)
Less than 10 cigarettes 6 8.6
10 - 20 cigarettes 20 28.6
More than 20 cigarettes 44 62.8
Total 70 100.0
Number of smoking years (N= 70)
Less than 10 years 10 14.3
10 – 20 years 25 35.7
More than 20 years 35 50.0
Total 70 100.0
Have you been sitting beside others who are smoking?
Yes 127 54.0
No 108 46.0
Total 235 100.0
Have you smoked water pipe before renal failure?
Yes 21 8.9
No 214 91.1
Total 235 100.0
Have you been addicted any kind of opiates?
Yes 5 2.1
No 230 97.9
Total 235 100.0
71
A.4.5. Distribution of study participants by knowledge characteristics:
A.4.5.1. Distribution of study participants by knowledge about chronic renal
failure:
Table (4.26) shows the distribution of the study participants by knowledge about
chronic renal failure, the questionnaire reveals that 174 patients have low knowledge
about chronic renal failure (before having chronic renal failure) with percentage
74.0%, from the total subjects; also 45 patients have good knowledge with percentage
19.1%; and 16 patients have excellent knowledge about chronic renal failure with
percentage 6.8%.
But after having chronic renal failure, 22 patients have low knowledge about chronic
renal failure with percentage 9.4%; while 130 patients have good knowledge with
percentage 55.3% ; and 83 patient have excellent knowledge with percentage 35.3%.
In addition to that results, the questionnaire ask the patients about attending health
education program, and the table (4.26) shows that the 34 patients were attended to
health education programs, and represent 14.5%, from the total subjects; while 201
patients didn’t attended to health education programs, and represent 85.5%.
Also the table (4.26) shows that 157 patients didn’t follow media programs about
health education which represent 66.8%, from the total subjects; while 78 patients,
were follow media programs about health education, and represent 33.2%.
On the other hand the questionnaire asked the patients if they search and read about
nutrition and health, the result shows that 95 of them don’t search and read about
nutrition and health, which represent 40.4%, from the total subjects; while 140
patients are search and read about nutrition and health, and represent 59.6%.
The study findings are correspond with the study made by Michael Flessner, et.al, in
United States, and interested in African Americans, which included 5302 patients, and
it was showed that a very small percentage (15.8%) of those with CKD were aware of
their disease, and there were no sex differences in awareness rates. Though awareness
was reasonably high among those in stage 4/5 (65.9%), it was still lower than overall
awareness of hypertension or diabetes. Among those with mild to moderate CKD,
awareness was minimal with only 17.6% of those in stage 3 aware of their condition.
(Flessner M., et.al., 2010).

72
Table (4.26): Distribution of study participants by knowledge about CRF.
Variable Frequency Percent
Level of knowledge about chronic renal failure (before having CRF)
Low 174 74.0
Good 45 19.1
Excellent 16 6.8
Total 235 100.0
Level of knowledge about chronic renal failure (after having CRF)
Low 22 9.4
Good 130 55.3
Excellent 83 35.3
Total 235 100.0
Have you attended health education programs?
Yes 34 14.5
No 201 85.5
Total 235 100.0
Do you follow media programs about health education?
Yes 78 33.2
No 157 66.8
Total 235 100.0
Do you search and read about nutrition and health?
Yes 95 40.4
No 140 59.6
Total 235 100.0
A.4.5.2. Distribution of study participants by health check-ups and health status:
Table (4.27) shows the distribution of study participants by health check-ups and
health status. The majority of participants were get physical health check-ups
regularly, and their number reached 195 patients, and represent 83%, from the total
subjects; while 40 patients don’t get physical health check-ups regularly, and their
number reached 40 patients, and represent 17%.
In the other hand, 134 patients are satisfied to their health status, which represent
57%, from the total subjects; while 101 patients don’t satisfied to their health status,
and represent 43%.
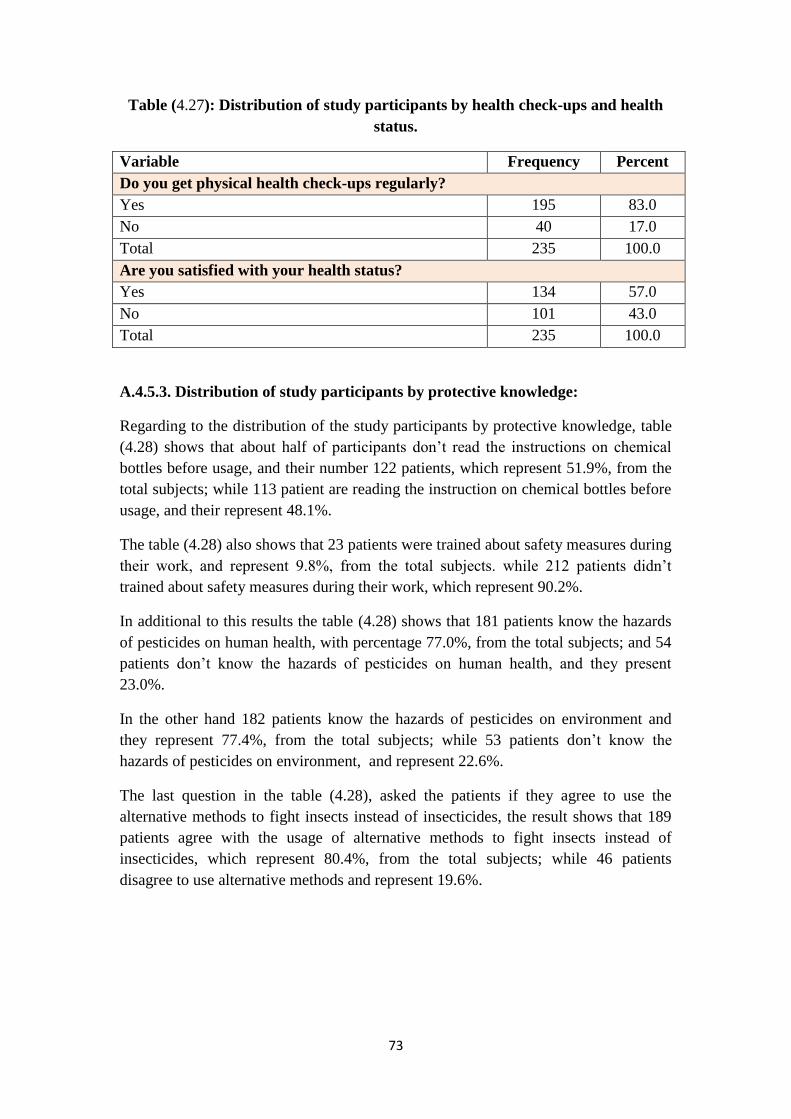
73
Table (4.27): Distribution of study participants by health check-ups and health
status.
Variable Frequency Percent
Do you get physical health check-ups regularly?
Yes 195 83.0
No 40 17.0
Total 235 100.0
Are you satisfied with your health status?
Yes 134 57.0
No 101 43.0
Total 235 100.0
A.4.5.3. Distribution of study participants by protective knowledge:
Regarding to the distribution of the study participants by protective knowledge, table
(4.28) shows that about half of participants don’t read the instructions on chemical
bottles before usage, and their number 122 patients, which represent 51.9%, from the
total subjects; while 113 patient are reading the instruction on chemical bottles before
usage, and their represent 48.1%.
The table (4.28) also shows that 23 patients were trained about safety measures during
their work, and represent 9.8%, from the total subjects. while 212 patients didn’t
trained about safety measures during their work, which represent 90.2%.
In additional to this results the table (4.28) shows that 181 patients know the hazards
of pesticides on human health, with percentage 77.0%, from the total subjects; and 54
patients don’t know the hazards of pesticides on human health, and they present
23.0%.
In the other hand 182 patients know the hazards of pesticides on environment and
they represent 77.4%, from the total subjects; while 53 patients don’t know the
hazards of pesticides on environment, and represent 22.6%.
The last question in the table (4.28), asked the patients if they agree to use the
alternative methods to fight insects instead of insecticides, the result shows that 189
patients agree with the usage of alternative methods to fight insects instead of
insecticides, which represent 80.4%, from the total subjects; while 46 patients
disagree to use alternative methods and represent 19.6%.
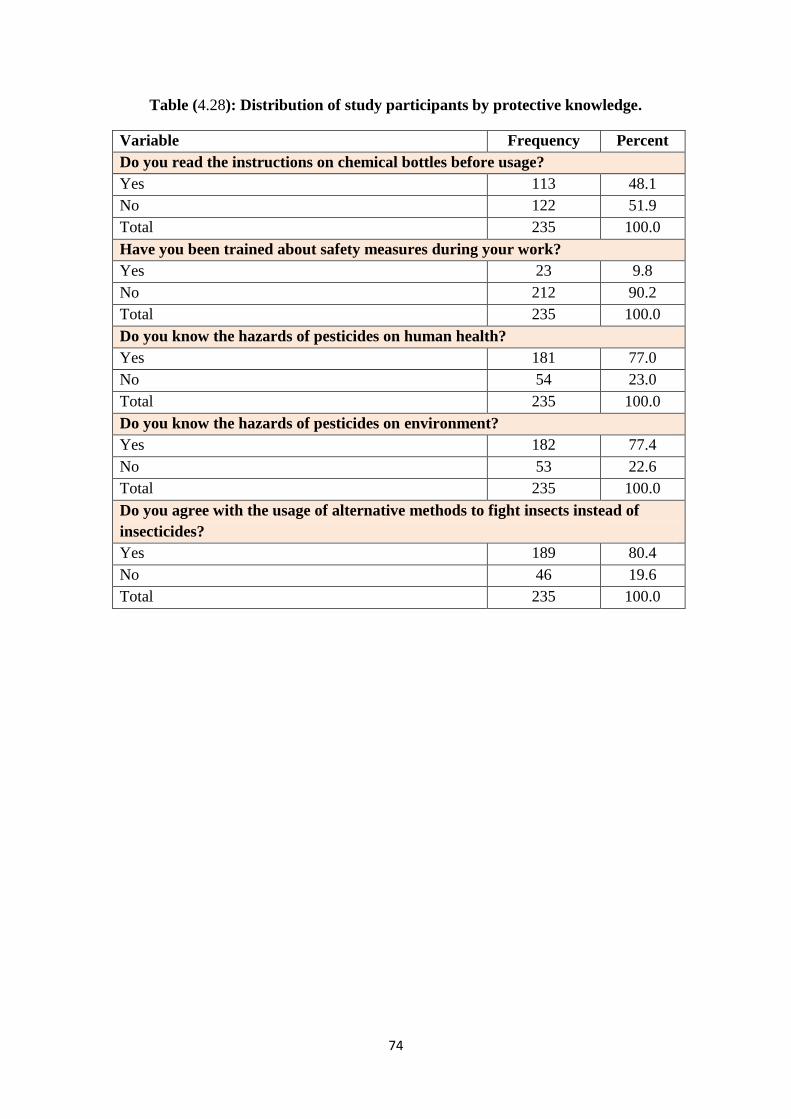
74
Table (4.28): Distribution of study participants by protective knowledge.
Variable Frequency Percent
Do you read the instructions on chemical bottles before usage?
Yes 113 48.1
No 122 51.9
Total 235 100.0
Have you been trained about safety measures during your work?
Yes 23 9.8
No 212 90.2
Total 235 100.0
Do you know the hazards of pesticides on human health?
Yes 181 77.0
No 54 23.0
Total 235 100.0
Do you know the hazards of pesticides on environment?
Yes 182 77.4
No 53 22.6
Total 235 100.0
Do you agree with the usage of alternative methods to fight insects instead of
insecticides?
Yes 189 80.4
No 46 19.6
Total 235 100.0
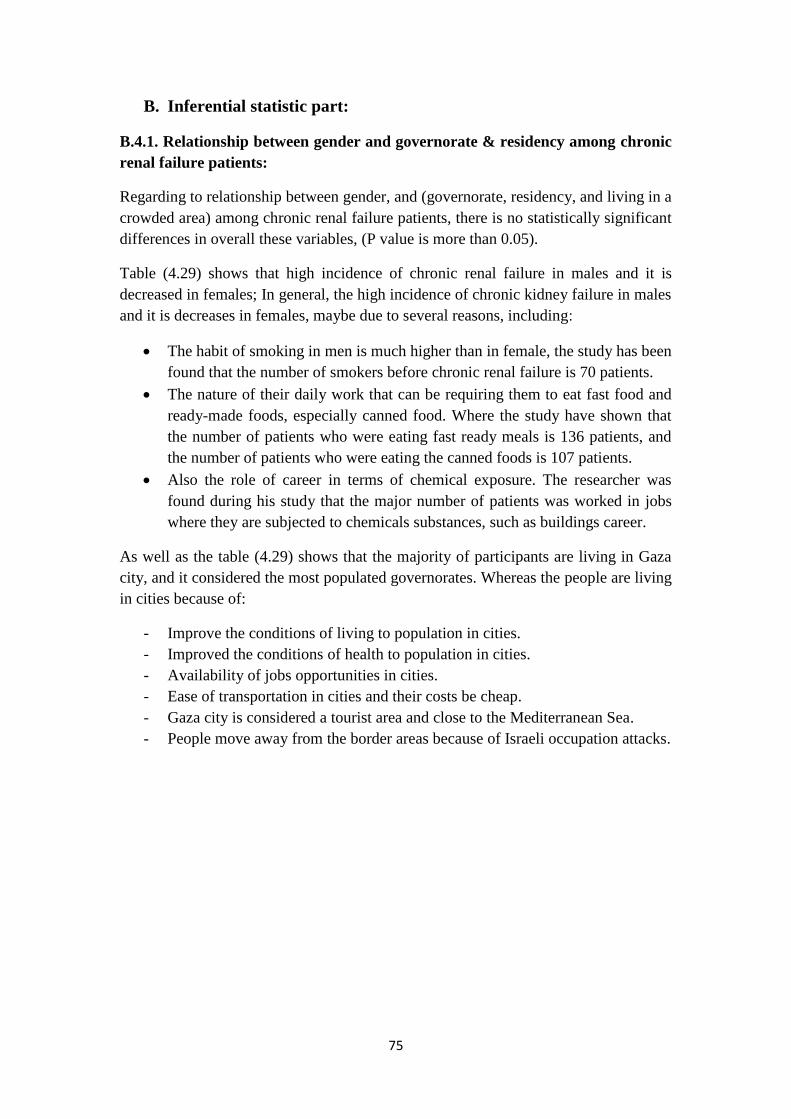
75
B. Inferential statistic part:
B.4.1. Relationship between gender and governorate & residency among chronic
renal failure patients:
Regarding to relationship between gender, and (governorate, residency, and living in a
crowded area) among chronic renal failure patients, there is no statistically significant
differences in overall these variables, (P value is more than 0.05).
Table (4.29) shows that high incidence of chronic renal failure in males and it is
decreased in females; In general, the high incidence of chronic kidney failure in males
and it is decreases in females, maybe due to several reasons, including:
The habit of smoking in men is much higher than in female, the study has been
found that the number of smokers before chronic renal failure is 70 patients.
The nature of their daily work that can be requiring them to eat fast food and
ready-made foods, especially canned food. Where the study have shown that
the number of patients who were eating fast ready meals is 136 patients, and
the number of patients who were eating the canned foods is 107 patients.
Also the role of career in terms of chemical exposure. The researcher was
found during his study that the major number of patients was worked in jobs
where they are subjected to chemicals substances, such as buildings career.
As well as the table (4.29) shows that the majority of participants are living in Gaza
city, and it considered the most populated governorates. Whereas the people are living
in cities because of:
- Improve the conditions of living to population in cities.
- Improved the conditions of health to population in cities.
- Availability of jobs opportunities in cities.
- Ease of transportation in cities and their costs be cheap.
- Gaza city is considered a tourist area and close to the Mediterranean Sea.
- People move away from the border areas because of Israeli occupation attacks.
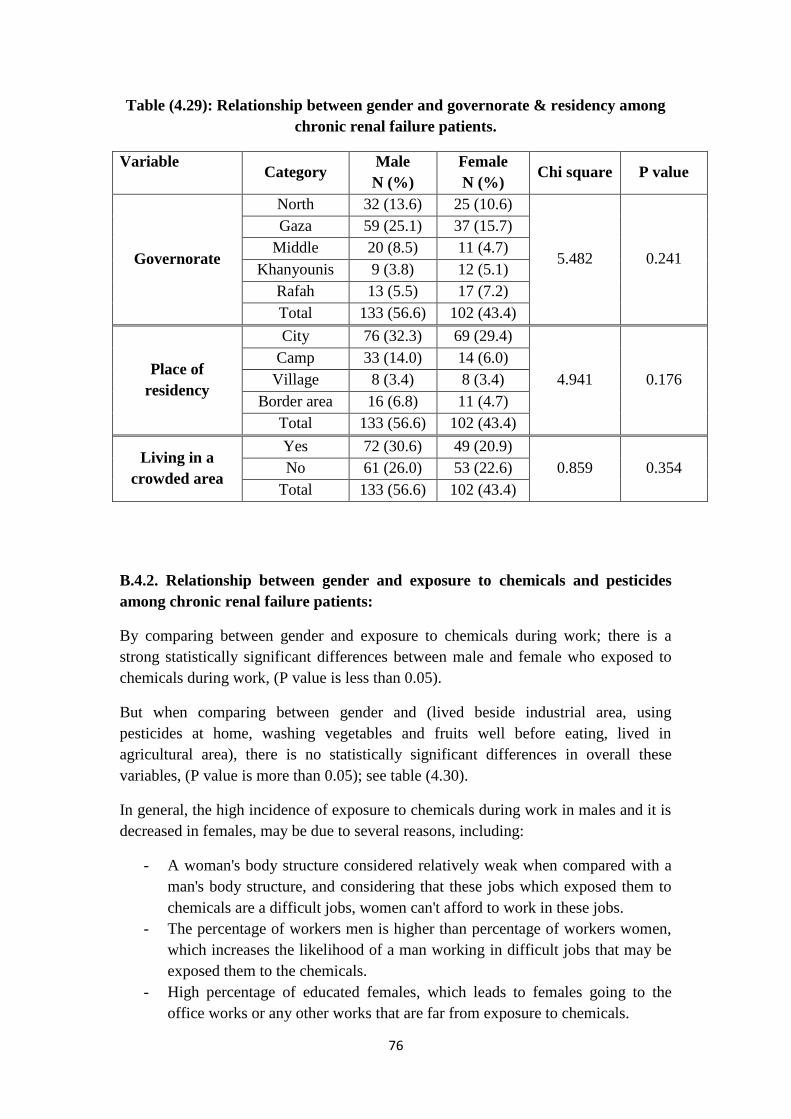
76
Table (4.29): Relationship between gender and governorate & residency among
chronic renal failure patients.
Variable Category
Male
N (%)
Female
N (%) Chi square P value
Governorate
North 32 (13.6) 25 (10.6)
5.482 0.241
Gaza 59 (25.1) 37 (15.7)
Middle 20 (8.5) 11 (4.7)
Khanyounis 9 (3.8) 12 (5.1)
Rafah 13 (5.5) 17 (7.2)
Total 133 (56.6) 102 (43.4)
Place of
residency
City 76 (32.3) 69 (29.4)
4.941 0.176
Camp 33 (14.0) 14 (6.0)
Village 8 (3.4) 8 (3.4)
Border area 16 (6.8) 11 (4.7)
Total 133 (56.6) 102 (43.4)
Living in a
crowded area
Yes 72 (30.6) 49 (20.9)
0.859 0.354 No 61 (26.0) 53 (22.6)
Total 133 (56.6) 102 (43.4)
B.4.2. Relationship between gender and exposure to chemicals and pesticides
among chronic renal failure patients:
By comparing between gender and exposure to chemicals during work; there is a
strong statistically significant differences between male and female who exposed to
chemicals during work, (P value is less than 0.05).
But when comparing between gender and (lived beside industrial area, using
pesticides at home, washing vegetables and fruits well before eating, lived in
agricultural area), there is no statistically significant differences in overall these
variables, (P value is more than 0.05); see table (4.30).
In general, the high incidence of exposure to chemicals during work in males and it is
decreased in females, may be due to several reasons, including:
- A woman's body structure considered relatively weak when compared with a
man's body structure, and considering that these jobs which exposed them to
chemicals are a difficult jobs, women can't afford to work in these jobs.
- The percentage of workers men is higher than percentage of workers women,
which increases the likelihood of a man working in difficult jobs that may be
exposed them to the chemicals.
- High percentage of educated females, which leads to females going to the
office works or any other works that are far from exposure to chemicals.
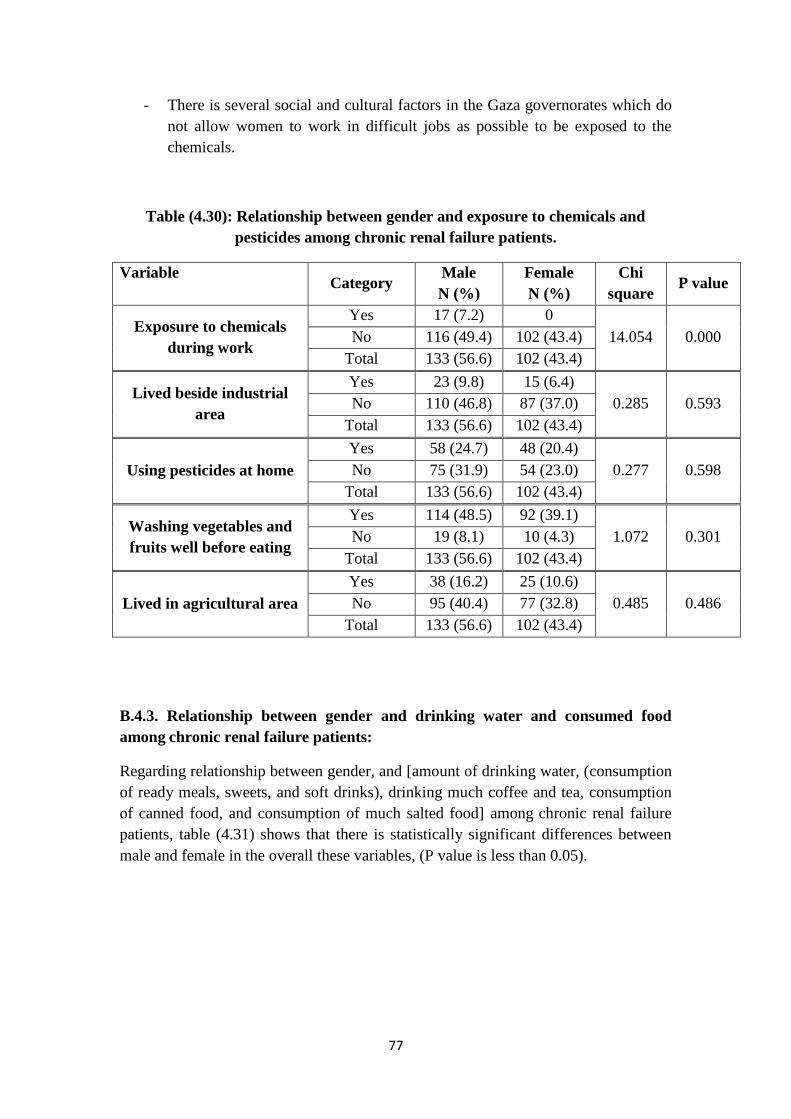
77
- There is several social and cultural factors in the Gaza governorates which do
not allow women to work in difficult jobs as possible to be exposed to the
chemicals.
Table (4.30): Relationship between gender and exposure to chemicals and
pesticides among chronic renal failure patients.
Variable Category
Male
N (%)
Female
N (%)
Chi
square P value
Exposure to chemicals
during work
Yes 17 (7.2) 0
14.054 0.000 No 116 (49.4) 102 (43.4)
Total 133 (56.6) 102 (43.4)
Lived beside industrial
area
Yes 23 (9.8) 15 (6.4)
0.285 0.593 No 110 (46.8) 87 (37.0)
Total 133 (56.6) 102 (43.4)
Using pesticides at home
Yes 58 (24.7) 48 (20.4)
0.277 0.598 No 75 (31.9) 54 (23.0)
Total 133 (56.6) 102 (43.4)
Washing vegetables and
fruits well before eating
Yes 114 (48.5) 92 (39.1)
1.072 0.301 No 19 (8.1) 10 (4.3)
Total 133 (56.6) 102 (43.4)
Lived in agricultural area
Yes 38 (16.2) 25 (10.6)
0.485 0.486 No 95 (40.4) 77 (32.8)
Total 133 (56.6) 102 (43.4)
B.4.3. Relationship between gender and drinking water and consumed food
among chronic renal failure patients:
Regarding relationship between gender, and [amount of drinking water, (consumption
of ready meals, sweets, and soft drinks), drinking much coffee and tea, consumption
of canned food, and consumption of much salted food] among chronic renal failure
patients, table (4.31) shows that there is statistically significant differences between
male and female in the overall these variables, (P value is less than 0.05).
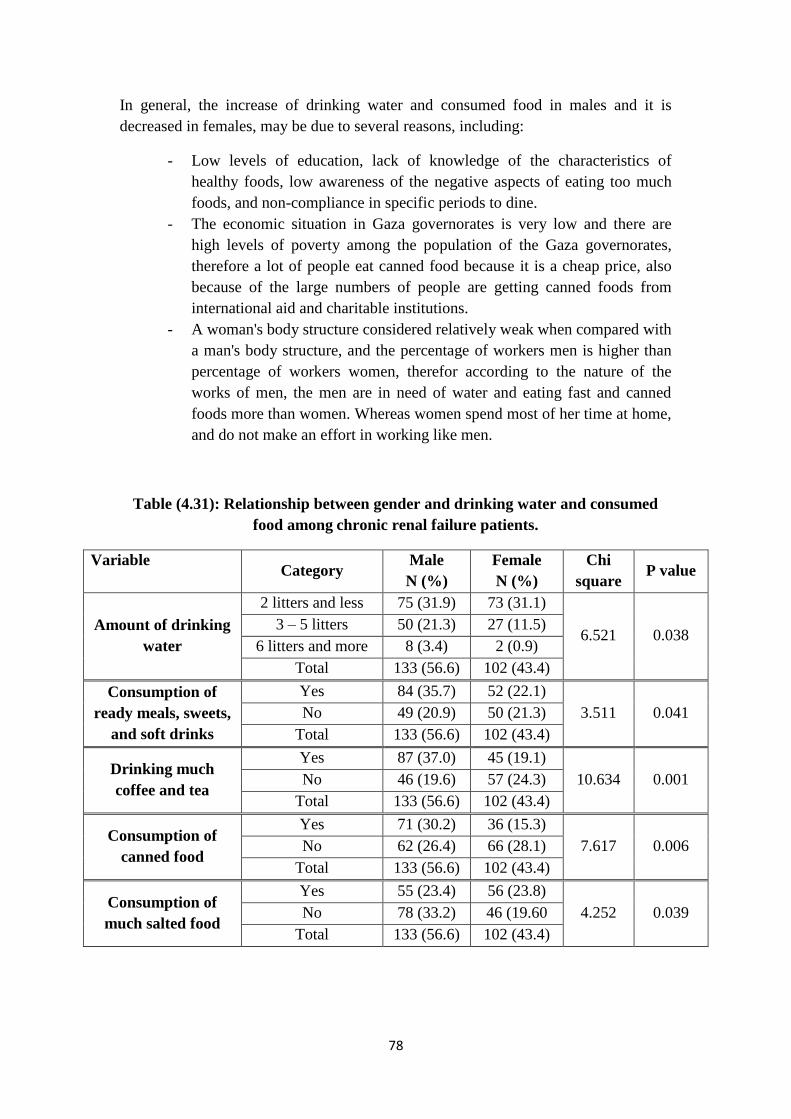
78
In general, the increase of drinking water and consumed food in males and it is
decreased in females, may be due to several reasons, including:
- Low levels of education, lack of knowledge of the characteristics of
healthy foods, low awareness of the negative aspects of eating too much
foods, and non-compliance in specific periods to dine.
- The economic situation in Gaza governorates is very low and there are
high levels of poverty among the population of the Gaza governorates,
therefore a lot of people eat canned food because it is a cheap price, also
because of the large numbers of people are getting canned foods from
international aid and charitable institutions.
- A woman's body structure considered relatively weak when compared with
a man's body structure, and the percentage of workers men is higher than
percentage of workers women, therefor according to the nature of the
works of men, the men are in need of water and eating fast and canned
foods more than women. Whereas women spend most of her time at home,
and do not make an effort in working like men.
Table (4.31): Relationship between gender and drinking water and consumed
food among chronic renal failure patients.
Variable Category
Male
N (%)
Female
N (%)
Chi
square P value
Amount of drinking
water
2 litters and less 75 (31.9) 73 (31.1)
6.521 0.038 3 – 5 litters 50 (21.3) 27 (11.5)
6 litters and more 8 (3.4) 2 (0.9)
Total 133 (56.6) 102 (43.4)
Consumption of
ready meals, sweets,
and soft drinks
Yes 84 (35.7) 52 (22.1)
3.511 0.041 No 49 (20.9) 50 (21.3)
Total 133 (56.6) 102 (43.4)
Drinking much
coffee and tea
Yes 87 (37.0) 45 (19.1)
10.634 0.001 No 46 (19.6) 57 (24.3)
Total 133 (56.6) 102 (43.4)
Consumption of
canned food
Yes 71 (30.2) 36 (15.3)
7.617 0.006 No 62 (26.4) 66 (28.1)
Total 133 (56.6) 102 (43.4)
Consumption of
much salted food
Yes 55 (23.4) 56 (23.8)
4.252 0.039 No 78 (33.2) 46 (19.60
Total 133 (56.6) 102 (43.4)

79
B.4.4. Relationship between gender and knowledge among chronic renal failure
patients:
Regarding relationship between gender, and (knowledge about CRF before disease,
knowledge about CRF after disease, attended health education programs, know the
risks of pesticides on human health, and know the risks of pesticides on environment),
table (4.32) shows that there is no statistically significant differences between male
and female in the overall these variables (P value is more than 0.05).
In general, no differences between gender and knowledge may be due to the Gaza
governorates are characterized by strong social relationships, also there is a strong and
great social communication between all members of society, so it is possible that the
information is shared and exchanged easily and conveniently, whether they are male
and female.
Table (4.32): Relationship between gender and knowledge among chronic renal
failure patients.
Variable Category
Male
N (%)
Female
N (%)
Chi
square P value
Knowledge about
RF before disease
Low 100 (42.6) 74 (31.5)
2.105 0.349 Good 22 (9.4) 23 (9.8)
Excellent 11 (4.7) 5 (2.1)
Total 133 (56.6) 102 (43.4)
Knowledge about
RF after disease
Low 10 (4.3) 12 (5.1)
2.558 0.278 Good 71 (30.2) 59 (25.1)
Excellent 52 (22.1) 31 (13.2)
Total 133 (56.6) 102 (43.4)
Attended health
education programs
Yes 20 (8.5) 14 (6.0)
0.080 0.777 No 113 (48.1) 88 (37.4)
Total 133 (56.6) 102 (43.4)
Know the risks of
pesticides on human
health
Yes 102 (43.4) 79 (33.6)
0.019 0.891 No 31 (13.2) 23 (9.8)
Total 133 (56.6) 102 (43.4)
Know the risks of
pesticides on
environment
Yes 101 (43.0) 81 (34.5)
0.398 0.528 No 32 (13.6) 21 (8.9)
Total 133 (56.6) 102 (43.4)

81
Chapter 5 : Conclusion and Recommendations:
5.1. Conclusion
In order to evaluate the effect of environmental and social factors on adult patients
with chronic renal failure in Gaza governorates, a retrospective study was conducted
at four hospitals in Gaza governorates where will examine the patients with CRF. The
sample of the study consisted of 235 participants. Questionnaire tools was used, and
hospital registry and files were reviewed. The response rate of the patients was 100%.
The study results might help to improve the current status of CRF patients, by giving
alert or warning for the current situation or in answering some questions.
The study findings showed that male participant and prevalence (56.6%)
higher than female participant and prevalence (43.4%).
The highest age group is more than 50 years, which represent 46%; also
65.1% of patients are treated in Al Shifa hospital. About 74% of subjects are
married; and 49.2% are considered relative to his wife or her husband, also
60.9% are living within nuclear family; and 68.5% their education level is less
than Tawjihi (12th
stage).
About 71% of participants are suffering from chronic disease other than CRF.
The highest type of disease other than CRF is hypertension (37.72%), and the
lowest type is heredity disease (0.60%).
The study showed that 26% of participants were suffering from renal
obstruction; the highest cause of renal obstruction is glomerulonephritis, and
the lowest cause of renal obstruction is the presence of renal stones & chronic
infection with each other.
About 46% from the total subjects, were using medications without prescribe;
the highest type of these medications is anti-inflammatory medications.
The study showed that 9.8% of participants were suffering from blood disease;
the highest type is anemia, and the lowest is systemic lupus erythematosus.
The highest age group when sustained CRF, is 51 years and more, which
represent 33.6%, from the total subjects. Also 86.4% of participants don't have
history of CRF among parents.
About 41% of participants are living in Gaza governorate. Also 61.7% of
subjects was living in cities. As well as 51.5% of participants are living in
crowded area.
91.5% of subjects are unemployed; while 111 participants were had jobs
before sustaining CRF; the majority of these jobs is governmental jobs and
buildings jobs. And 59.6% of subject's monthly income is less than 1000 NIS.
Also 63% of the subjects were worked less than 10 years.
Regarding to the exposure to chemical substances, 92.8% didn’t exposed to
chemical substances. Whereas 45.1% of participants were used pesticides
inside their home.
81
84.7% of participants didn’t work in jobs that may be expose them to
pesticides. Also 92.8% of subjects didn’t exposed to environmental poisons.
The majority of subjects (85.5%) are use a filtered water as a current source of
drinking water, while 48.1% of subjects were used a municipality water as a
source of cooking water before CRF. As well as 63% of subjects were
drinking 2 litters and less per day.
The study shows that 46.8% of subjects prefer eating vegetables in their food.
And 57.9% were eating fast ready meals, sweets and soft drinks. Also 88.1%
of participants were not suffering from diseases which caused by poor
nutrition. As well as 56.9% of subjects were taking too much coffee and tea.
And 45.5% were eating canned foods. Also about 80% of subjects were eating
vegetables and fruits daily. While 51.1% of patients were eating too much
foods that contain carbohydrates, as well as 70.6% were eating too much food
that contain proteins, whereas 41.3% were eating too much foods which
contain fats. And 78.3% of participants were eating too much food that contain
vitamins. While 84.3% were eating a red meat. In the same 91.1% were eating
a white meat. Also 85.1% of participants were eating a sea foods; and 47.2%
of participants were eating a salted foods.
70.2% of patients were non-smokers before having CRF. In other hand 54% of
participants were considered as a passive smokers. Regarding water pipe 8.9%
of patients were smoked water pipe before CRF. Also 97.9% of participants
told that they didn’t addicted to any kind of opiates.
The results reveals that 74% of patients have low knowledge about CRF
before having it. But after having CRF 9.4% have low knowledge about CRF;
while 55.3% have a good knowledge; and 35.3% have excellent knowledge.
Also the results shows that 14.5% of patients were attended to health
education programs. As well as 33.2% were follow the media programs about
health education; also it shows that 59.6% of subjects are search and read
about nutrition and health.
The majority of participants (83%) were get physical health check-ups
regularly, In the other hand, 57% are satisfied to their health status. While
about 52% don’t read the instructions on chemical bottles before usage. And
90.2% of patients didn’t trained about safety measures during their work. In
additional to this results 77% of patients know the hazards of pesticides on
human health; and 77.4% know the hazards of pesticides on environment.
Also the result shows that 80.4% of patients agree with the usage of alternative
methods to fight insects instead of insecticides.
There is no statistically significant variations between gender and
(governorate, residency, living in a crowded area, lived beside industrial area,
using pesticides, lived in agricultural area, and knowledge about CRF). Also
the results showed that there is statistically significant differences between
gender and [exposure to chemicals during work, amount of drinking water,
(Consumption of ready meals, sweets, and soft drinks), drinking much coffee
and tea, consumption of canned food, and consumption of much salted food].

82
5.2. Recommendations:
On the light of the study findings, the researcher recommend the following
recommendations:
1. Avoid excessive eating of salted foods, and decrees intake the animal and
plant proteins; also avoid eating too much of fast ready meals, or preserved
foods as all the kinds of canned food, and food that contain dye and material
that gives taste and smell.
2. Avoid drinking fizzy drinks, coffee and tea as possible; as well as avoid uses
of municipality water as a source of cooking and drinking water.
3. Mitigate the use of pesticides in homes.
4. The necessity of increasing public awareness, and implementation of health
education programs about chronic renal failure.
5. The necessity of conducting and improving national programs of kidney
transplantation in Palestine, and to increase community awareness about
kidney donors.
6. The necessity of initiating preventive health programs especially among high
risk group such as patients with diabetes mellitus, hypertension,
cardiovascular diseases.
7. The necessity of increasing public awareness about taking medications
without doctor prescription, and highlight the importance of monitoring
pharmacies. Also increase public awareness about the importance of exercise,
such as walking, swimming, etc.
8. Increase the number of dialysis devices in dialysis department to be close from
the international average, which present (3) patients for each dialysis device,
and increasing the number of qualified staff .
9. Increase the size of some dialysis department to give the patients a chance to
receive health services in appropriate way out of the effects of crowding.
10. Concern of making a complete database inside the centers of dialysis for each
patient, and recording everything related to spatial dimensions in addition to
the social, economic and health characteristics, to be a source for the
researchers, to make studies about the diseases.
11. The necessity of conducting other researches in the field of renal failure and
it's risk factors.

83
References:
Abboud O., 2006-Incidence, prevalence, and treatment of end-stage renal disease in
the Middle East. Ethnicity & Disease, Volume 16.
Adham M.,1997-Renal effects of environmental and occupational lead exposure.
environmental health perspectives, Volume 105, Number 9, P1.
Almaguer M., Herrera R., and Orantes C., 2014-Chronic kidney disease of unknown
etiology in agricultural communities. MEDICC, April, Vol. 16, No 2.
Arıkan H., and Tuğlular S., 2005-The growing global burden of End Stage Renal
Disease (ESRD). Marmara Medical Journal, 2005, Vol.18, No 3, P143-150.
Arora P., Vasa P., Brenner D., Iglar K., McFarlane Ph., Morrison H., and Badawi A.,
2013-Prevalence estimates of chronic kidney disease in Canada: results of a
nationally representative survey. Canadian Medical Association journal, June, Vol. 9,
P185.
Basheer K., 2011-Major risk factors that lead to onset End-Stage Renal Disease in
Northern West Bank, Al-Najah National university, Palestine, MSC thesis.
Berthoux F., Jones E., Gellert R., Mendel S., Saker L., and Briggs D.,1999-
Epidemiological data of treated ESRF in the European Union (EU) during the year
1955: report of European renal association registry and the national registries,
European Union, Nephrol Dial Transplant, Oct,14(10):2332-42.
Bruce M., Beech B., Sims M., Brown T., Wyatt Sh., Taylor H., Williams D., and
Crook E.,2009-Social environmental stressors, Psychological factors, and kidney
disease. Journal of Investigative Medicine, April, Vol. 57, Number 4.
Chronic kidney disease information - life options/rehabilitation resource center:
http://www.lifeoptions.org. accessed on 12/8/2015.
Complications of chronic renal failure: http://www.mayoclinic.org/diseases-
conditions/kidney-disease/basics/complications. accessed on 15/8/2015.
Environmental Quality Authority,2008- Environmental health in Gaza strip.
Flessner M., Wyatt Sh., Akylbekova E., Coady S., Fulop T., Lee F., Taylor H., and
Crook E.,2010-Prevalence and awareness of CKD among African Americans: the
Jackson heart study. American Journal of Kidney Diseases, February, Vol. 53, NO 2,
P 238–247.
84
Fored C., Nise G., Ejerblad E., Fryzek J., Lindblad P., Mclaughlin J., Elinder C., and
Nyren O.,2004-Absence of association between organic solvent exposure and risk of
chronic renal failure: a nationwide population-based case-control study. Journal of
the American Society of Nephrology, Vol. 15, P 180–186.
Hwang Sh., Tsai J., and Chen H.,2010-Epidemiology, impact and preventive care of
chronic kidney disease in Taiwan. Journal compilation Asian Pacific Society of
Nephrology, Vol. 15, P3–9.
Johnson S., Misra S., Sahu R., and Saxena P.,2012-Environmental contamination
and its association with chronic kidney disease of unknown etiology in north
central region of Sri Lanka, center for science and environment.
Kamel E., and El-Minshawy O.,2010-Environmental factors incriminated in the
development of End Stage Renal Disease in El-Minia governorate, upper Egypt.
International Journal of Nephrology & Urology, Vol. 2, No. 3, P431-437.
Living conditions of the Palestinian resident population:2015- Palestinian Central
Bureau of Statistics, Palestine: http://www.pcbs.gov.ps. accessed on 10/8/2015.
Lora C., Daviglus M., Kusek J., Porter A., Ricardo A., Alan G., and Lash J.,2009-
Chronic kidney disease in united states Hispanics: A growing public health
problem, NIH Public Access, Ethnicity & Disease, Vol. 19, No. 4, P 466–472.
Macron F., Vernay M., Ekong E., Thiard B., Salanave B., Fender P., and Allemand
H., 2005-The prevalence of ESRD treated with renal dialysis in France in 2003.
American Journal of Kidney Diseases. Vol.46, No 2, P 309-15.
Marieb E.,2003-Essentials of human anatomy and physiology. Benjamin Cummings,
seventh edition, Page 480 and 481.
Medokh H.,2013-Chronic renal failure patients in the Gaza Strip "Study in medical
geography". Islamic university of Gaza, Palestine, MSC thesis.
Mokhamer E., 2009-Salinity of drinking water and its association with renal failure
in the southern part in Gaza Strip. AL Quds university, Palestine, MSC thesis.
Noborisaka Y., Ishizaki M., Yamada Y., Honda R., Yokoyama H., Miyao M., and
Tabata M.,2013-Distribution of and factors contributing to chronic kidney disease
in a middle-aged working population. Environmental Health and Preventive
Medicine, June, Vol. 18, P. 466–476.
Nzerue C., Demissachew H., and Tucker J.,2002-Race and kidney disease: Role of
social and environmental factors. Journal of the National Medical Association,
August, Vol. 94, No. 8.
85
Orantes C., Herrera R., Almaguer M., Brizuela E., Hernández C., Bayarre H., Amaya
J., Calero D., Orellana P., Colindres R., Velázquez M., Núñez S., Contreras V., and
Castro B.,2011-Chronic kidney disease and associated risk factors in the Bajo
Lempa region of El Salvador: Nefrolempa study, Original Research, October, Vol.
13, Number 4.
Owen W., and Swartz R.,2007-Kidney failure – choosing a treatment that's right for
you. National Institute of Diabetes and Digestive and Kidney Diseases, NIH
Publication, November, No. 08–2412.
Peralta C., Shlipak M., Fan D., Ordonez J., Lash J., Chertow G., and Alan G.,2006-
Risks for End-Stage Renal Disease, cardiovascular Events, and death in Hispanic
versus Non-Hispanic white adults with chronic kidney disease. Journal of the
American Society of Nephrology, Vol. 17, P 2892–2899.
Schieppati A., and Remuzzi G.,2005-Chronic renal diseases as a public health
problem : Epidemiology, social, and economic implications. Kidney International,
Vol. 68, Supplement 98.
Signs & symptoms of chronic renal failure: http://www.healthcommunities.com/chronic-
renal-failure/symptoms.shtml. accessed on 12/8/2015.
Smeltzer S., bare B., Hinkle J., and Cheever K.,2008-Textbook of medical-surgical
nursing. Lippincott Williams and Wilkins, eleventh edition, Page 1330,1335, 1337,
and 1338.
Soderland P., Lovekar Sh., Weiner D., Brooks D., and Kaufman J.,2010-Chronic
kidney disease associated with environmental toxins and exposures. Advances in
chronic kidney disease, May, Vol. 17, No. 3, P 254-264.
Spray B., Atassi N., Tuttle A., and Freedman B.,1995-Familial risk, age at onset, and
cause of End-Stage Renal Disease in white Americans. Journal of the American
Society of Nephrology, Vol. 5, Number 10.
Thomas R., Kanso A., and Sedor J.,2008-Chronic kidney disease and its
complications. Prim Care Journal, Vol. 35, No. 2, P 329–vii.
Wanigasuriya K.,2012-Aetiological factors of chronic kidney disease in the north
central province of Sri Lanka: A review of evidence to-date. Journal of the College
of Community Physicians of Sri Lanka, June, Vol. 17, No. 1.
86
Annex 1 :
87
Annex 2 :
بسم الله الرحمن الرحيم
ػض٠ض اشبسن/ح :
الاعلاخ ف اجبؼخ / صحخ اجئخ ،سض واجئخلغ ػى الأ، أدسط ثىخ اؼى فبد فب٠ض اع١أب اطبت
ثغضح
ألى ثاػذاد ثحث ثؼىا "رم رأثش اؼىا اجئخ والاجزبػخ ػ شظ افش اىى اض ف
.غضح" لطبع حبفظبد
طبثمزه ششوغ اؼخ .ػ ثبػزجبس زطت زخشج واحصىي ػ دسجخ ابجغزش، ور اخزبسن ثبء
لطبع جزبػخ ػ شظ افش اىى اض ف حبفظبد اؼىا اجئخ والا رم رأثش ئرهذف اذساعخ
غضح وؼشفخ اؼىا اجئخ والاجزبػخ از هب ػلالخ ثشض افش اىى ووزبثخ ازىصبد حذ
صبثخ ثهزا اشض .الإ
خلاي ا اذساعخ ه شبسوزه ف هز اذساعخ ثبلإجبثخ ػ أعئخ أشىش امبثخ رغزغشق مبثخ، غ اؼ أ
دلمخ رمشجب 20أوثش اىػذ غش بعت اشجبء رحذذ ىػذ آخش بعجى . ، وف حبي أ
ػىى سفط الإجبثخ و ،شبسوزى غىػخ أ أ عإاي، وأسغت أ اؼىبد از رزوشوهب ؤوذ ى أ
اؼ وثذو روش أعبء، زا أسجى أ رىى الإجبثبد دلمخ . عزىى عشخ وعزغزخذ فمػ غشض اجحث
لج اجذء ف امبثخ ، ه رىد/ الاعزفغبس حىي أ شء ػ اذساعخ وه اى أ جذأ امبثخ ؟
) ( ؼ
) ( لا
ازل١غ :
..............................
ى حغ رؼبى شىش

88
اعزجــــبـــخ
شض افش اى ف ػ حي رم١١ رؤث١ش اؼا اج١ئ١خ الاجزبػ١خ
غضح لطبع حبفظبد
............................................. سل ابرف : ............................... اع اغزشف :
اج١ببد اشخظ١خ:
روش ) ( ، أث ) ( . اجظ :
(.50( ، )أوثش 50 - 41( ، )40 - 31( ، )30 - 21( ، )20 - 12) افئخ اؼش٠خ :
ازؤس٠خ اطج:
ؼ ) ( ، لا ) ( . رؼب أشاع ضخ أخش )غ١ش افش اى( :وذ
( ، عىش ) ( ، ظغػ اذ ) ( ، أشاض لت ) جبثخ ؼ حذد/ ؟ إرا وبذ الإ
..........................................خشي ..................................أ شاض صذسخ ) ( ، وساثخ ) ( ، أ
ؼ ) ( ، لا ) ( . ؟ اج١خ اغبه لاغذاد رؼشضذ
– اجشوعزبرب غذح رعخ – اجىي جشي ف أوسا – ثىخ حصىاد) الاغذاد . أروش عجت ؼ الاجبثخ وبذ ئرا
مخ ػىة (.أػ لا - ضخ ازهبثبد – اجىي جشي ف دىخ رجؼبد – خ
ؼ ) ( ، لا ) ( . ؟ اى رى١ظ شع رؼشضذ
ؼ ) ( ، لا ) ( . ؟ اذبء اىث١ش فمذا حبد ض٠ف حبخ رؼشضذ
ؼ ) ( ، لا ) ( . جفبف ؟ حبخ رؼشضذ
ؼ ) ( ، لا ) ( . ؟ الأد٠خ أاع أحذ اعزخذا رىثش وذ
...................................................................................... اذواء اع أروش ؼ . الاجبثخ وبذ ئرا
ؼ ) ( ، لا ) ( . ؟ اذ أشاع رؼب وذ
........................................................................................ اشض اع أروش ؼ الإجبثخ وبذ ئرا
........ عخػذ ػش ............. ز أطجذ ثشع افش اى ؟
............................................................................................ : ػذد شاد غغ اى أعجػ١ب
ؼ ) ( ، لا ) ( . ٠ؼب أحذ اذ٠ه شع افش اى ؟
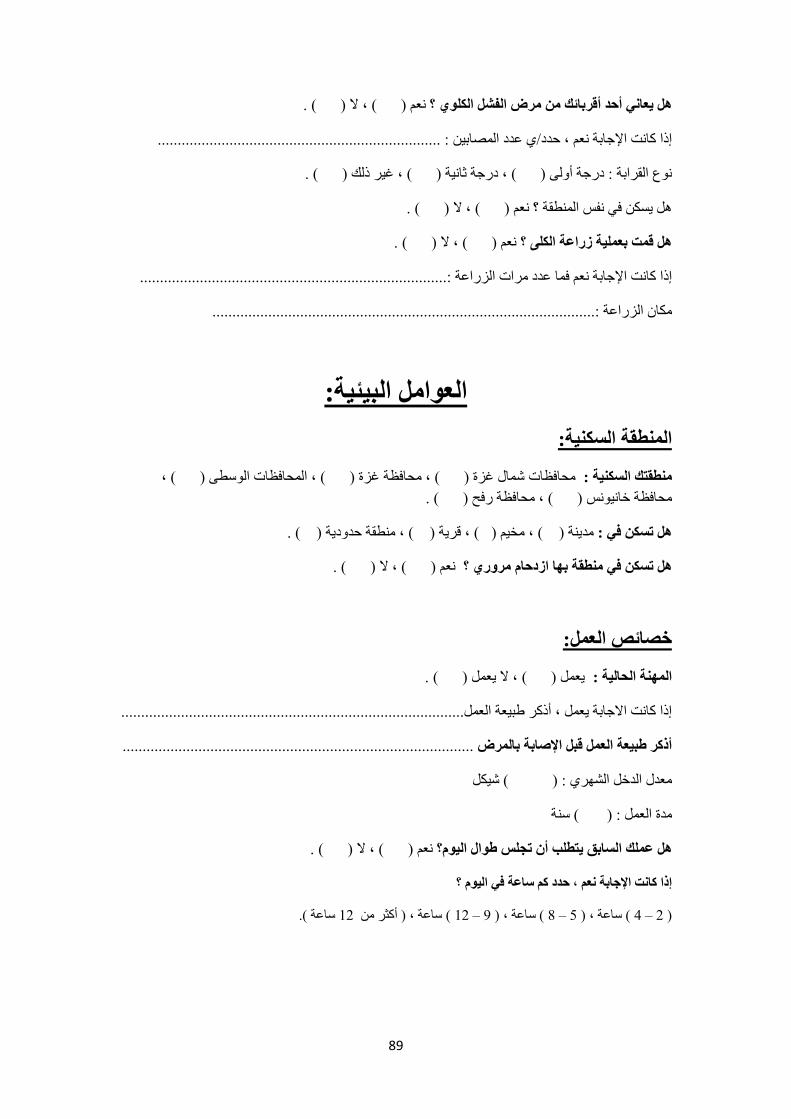
89
( ، لا ) ( . ؼ ) لشثبئه شع افش اى ؟أ ٠ؼب أحذ
...........................................................جبثخ ؼ ، حذد/ ػذد اصبث : ............ئرا وبذ الإ
ىع امشاثخ : دسجخ أو ) ( ، دسجخ ثبخ ) ( ، غش ره ) ( .
لا ) ( .ه غى ف فظ اطمخ ؟ ؼ ) ( ،
ؼ ) ( ، لا ) ( . لذ ثؼ١خ صساػخ اى ؟
.............................................................................:جبثخ ؼ فب ػذد شاد اضساػخ ئرا وبذ الإ
..............................................ىب اضساػخ :..................................................
:اؼا اج١ئ١خ
اطمخ اغى١خ:
غضح ) ( ، احبفظبد اىعط ) ( ، حبفظخحبفظبد شبي غضح ) ( ، طمزه اغى١خ :
. ، حبفظخ سفح ) ( ) ( حبفظخ خبىظ
خ ) ( ، لشخ ) ( ، طمخ حذودخ ) ( .ذخ ) ( ، : رغى ف
ؼ ) ( ، لا ) ( . ؟ ثب اصدحب شس طمخ ف رغى
خظبئض اؼ:
ؼ ) ( ، لا ؼ ) ( . : اخ احب١خ
.........................................................................ئرا وبذ الاجبثخ ؼ ، أروش غجؼخ اؼ.............
........................................................................................أروش طج١ؼخ اؼ لج الإطبثخ ثبشع
) ( شىؼذي اذخ اشهش :
ذح اؼ : ) ( عخ
ؼ ) ( ، لا ) ( . رجظ طاي ا١؟أ٠زطت اغبثك ػه
إرا وبذ الإجبثخ ؼ ، حذد و عبػخ ف ا١ ؟
عبػخ (. 12) أوثش ، عبػخ( 12 – 9 )، عبػخ( 8 – 5 )( عبػخ ، 4 – 2)
91
ازؼشع اد اى١١بئ١خ:
ؼ ) ( ، لا ) ( . ؟ و١١بئ١خ اد ف١ب رزؼشع لذ طبػ١خ خ ف ػذ أ عجك
امفبصاد أو الأحزخ أو اىبخ ث) اؼ ف اصحخ اىلبخ ثؼبش رزض وذ ه، ؼ الإجبثخ وبذ ئرا
؟(وغشهب اخصصخ
ؼ ) ( ، لا ) ( .
ااد؟ ز ظذس ب اششوخ، رغزخذب از اخب ااد ب
..دح اخب ........................................................ صذسهب ....................................................اب
.................دح اخب ........................................................ صذسهب .....................................اب
..دح اخب ........................................................ صذسهب ....................................................اب
؟ طبػ١خ شآد لش٠جخ أ طبػ١خ طمخ ف رؼ١ش وذ ثبشع الإطبثخ لج
ؼ ) ( ، لا ) ( .
؟ اهىاء ف( سرار) عبئخ لطشاد أو غجبس أو اجؼبثبد أو سوائح لاحظخ رذ ه، ؼ الإجبثخ وبذ رائ
ؼ ) ( ، لا ) ( .
ازؼشع ج١ذاد احشش٠خ:
ؼ ) ( ، لا ) ( . ضه؟ ف احششاد ىبفحخ اج١ذاد احشش٠خ رغزخذ وذ
ؼ ) ( ، لا ) ( . اج١ذاد؟ لاعزخذا ز١جخ أفشاد أعشره أحذ أ ذأ طح١ب رضشسد
اىث١ش ثبزؼب لذ أ( ، اضساػخ ث) ف١ب احشش٠خ ج١ذاد رزؼشع لذ حشفخ أ ف ػذ أ عجك
ؼ ) ( ، لا ) ( . ؟ احشش٠خ اج١ذاد غ
ؼ ) ( ، لا ) (. ػ١ب؟ ازجم اج١ذاد أثش زخض ج١ذا فاوا اخضشاد ثغغ رم وذ
ؼ ) ( ، لا ) (. ؟ صساػ١خ طمخ ف رؼ١ش وذ
:اج١ئ١خ اغ
ؼ ) ( ، لا ) ( . ؟( ؼ١خ حششاد أ أفؼ )لشطخ: ث١ئ١خ، ثل غ رؼشضذ عجك
....................................................: ..................... وثبزفص اغ ىع ، وظح ؼ جبثخالا وبذ ئرا
..........................................................................................................................................
91
: آخ غ١ش ١ب ششة
) ( ، ثئش حلاحثذخ ) ( ، ششوخ بوشود الاعشائخ ) ( ، ب ب ظذس ١ب اششة احب :
خبص ) ( .
ثذخ ) ( ، ششوخ بوشود الاعشائخ ) (، ب طبثخ ثبشع :ب ظذس ١ب اششة لج الإ
ش خبص ) ( .) (، ثئ حلاح
(، ) الاعشائخ بوشود ششوخ) (، ثذخ: لج الاطبثخ ثبشع ب ظذس ا١ب اغزؼخ ف اطجخ
) ( خبص ثئش) (، حلاح ب
: ............................ زش رششثب ١٠ب وذ ا١ب ازو١خ ب زعظ
؟ ؼ ) ( ، لا ) ( . م١خ شفبفخ ١ب اششة
: ؼ ) ( ، لا ) ( . ١ب اششة اض١خ طفبد زغ١شح )اشائحخ(
؟ ؼ ) ( ، لا ) ( . رغزؼ عبئ رم١خ ١ب ف اضي
الاجزبػ١خ: اؼا
) ( ، طك ) ( ، أس ) ( . أػضة ) ( ، زضوجاحبخ الاجزبػ١خ :
ؼ ) ( ، لا ) ( .ف حبي وه رضجذ : رجذ طخ لشاثخ ث١ه ث١ اضجخ ؟
ىع امشاثخ : دسجخ أو ) ( ، دسجخ ثبخ ) ( ، غش ره ) ( .
ؼ ) ( ، لا ) ( . أحذ أثبءن ٠ؼب الاطبثخ ثشع افش اى؟
أل رىجه ) ( ، رىجه ) ( ، دثى ) ( ، ثىبىسىط ) ( ، آخش شبدح حظذ ػ١ب :
بجغزش ) ( ، دوزىسا ) ( .
( . ػبئخ ىوخ ) (، ػبئخ زذح ) (، حىخ )ع اؼبئخ از رؼ١ش ف١ب :
لاحظخ :
اؼبئخ اىوخ رزىى اضوج واضوجخ وأثبئه -
اؼبئخ ازذح رزىى الأة والأ والأخىح والأخىاد واجذ واجذح والأثبء والأحفبد -
شزشوخ صبح رشثطه ػبئلاد ػذح ظ ػبئخاؼبئخ احىخ ػجبسح ػ -
92
: ازغز٠خ
........................................... ش٠بد ( ؟ ،ح ، غزائ١خ از رزبب )خضشاد ب أوثش الأاع ا
............................................. و ججخ رزبي ف ا١ ؟
ؼ ) ( ، لا ) ( . ربسط اش٠بضخ ثبزظب ؟ وذ
ؼ ) ( ، لا ) ( . اغىش٠بد اششثبد اغبص٠خ ثىثشح ؟ رزبي اججبد اغش٠ؼخ وذ
ؼ ) (، لا ) ( . رؼب أشاع ثغجت عء ازغز٠خ ؟
ؼ ) ( ، لا ) ( . رزبي اخضشاد افاو ١٠ب ؟ وذ
) ( ، لا ) ( . ؼ اشب ( ؟ ،رغشف ف ربي اجبد ) امح وذ
ؼ ) ( ، لا ) ( .؟ اىشث١ذساد رىثش ربي الأطؼخ از رحز ػ وذ
ؼ ) ( ، لا ) ( . ؟اجشر١بد رىثش ربي الأطؼخ از رحز ػ وذ
) ( ، لا ) ( .ؼ؟ اذ رىثش ربي الأطؼخ از رحز ػ وذ
ؼ ) ( ، لا ) ( . ؟اف١زب١بد رىثش ربي الأطؼخ از رحز ػ وذ
ؼ ) ( ، لا ) ( . رزبي الأطؼخ اغش٠ؼخ أ اؼجخ از رحز اد حبفظخ ؟ وذ
) ( .ؼ ) ( ، لا؟ رزبي اح احشاء وذ
) ( . لا) ( ، ؼ ؟ اج١ضبء اح رزبي وذ
ؼ ) ( ، لا ) ( .؟ رزبي اؤولاد اجحش٠خ وذ
ؼ ) ( ، لا ) ( . طؼخ ابحخ ثىثشح ؟رؤو الأ وذ
: ازذخ١ ادب ااد اخذسح
ؼ ) ( ، لا ) ( . ؟خ ثبشعلج الاطبث رذخوذ
( 20وثش أ - 10وثش أ - 5 ) أوثشو ع١جبس ف ا١؟
) ( عخ ػذد عاد ازذخ١ ؟
) ( . لا) ( ، ؼ رجظ ثىثشح ثجبت شخض ذخ )ث : صج/ح أ ص١ ػ( ؟ وذ
ؼ ) ( ، لا ) ( . ؟لج الاطبثخ ثبشع اشج١خ )اش١شخ( رذخوذ
ؼ ) ( ، لا ) ( . ااد اخذسح ؟أاع اؼمبل١ش أذ ػ أ ع وذ

93
:اؼشفخ
(ظؼفخ، جذح، زبصح)ب ذ ؼبره اظح١خ احب١خ ػ شع افش اى لج الإطبثخ ثبشع :
(ظؼفخ ، جذح ، زبصح)طبثخ ثبشع : ؼبره اظح١خ ػ شع افش اى ثؼذ الإب ذ
ؼ ) ( ، لا ) ( . حبضشاد رثم١ف طح ؟ أ حضشد دساد
لا ) ( . ؼ ) ( ، رزبثغ ااد الإػل١خ از رزبي ازثم١ف اظح ؟
ؼ ) ( ، لا ) ( .طلع ػ ػب ازغز٠خ اظحخ ؟ رحشص ػ اجحث الا
ؼ ) ( ، لا ) ( . رجش فحض طج دس ؟
ؼ ) ( ، لا ) ( . ػ غزان اظح ؟ أذ ساع
( ، لا ) ( . ؼ ) ؟ أثبء اؼ ؼب ازؼب لج اى١١بئ١خ اد اظبحجخ ازؼ١بد رمشأ
ؼ ) ( ، لا ) ( . احب٠خ؟ طشق عج رؼ١ ف رذس٠جبد أ دساد ػ حظذ
ؼ ) ( ، لا ) ( . الإغب؟ طحخ ػ اج١ذاد احشش٠خ أضشاس رؼشف
ؼ ) ( ، لا ) ( . اج١ئخ؟ ػ اج١ذاد أضشاس رؼشف
ؼ ) ( ، لا ) ( . اج١ذاد؟ ثذلا ا٢فبد ىبفحخ ثذ٠خ طشق اعزخذا ؤ٠ذر
شىشا زؼبى