Islamic University of Gaza Electrical Engineering Department.
Islamic University of Gaza Faculty of Science
INSTRUMENTAL ANALYSIS
LAB MANUAL
Selected Experiments
Chemistry Department
2008

2
Table of Contents
General Information and Instructions….……………………………………....….…. 3 Chapter one: Ultraviolet-Visible Spectroscopy…………….………………….……… 7 Experiment 1: Determination of Iron in Aqueous Samples..………….……….….….. 17 Experiment 2: Determination of the Mole Ratio of Iron : 1,10- Phenanthrolin in the Complex ...………………………………………………………………………...19 Experiment 3: Determination Binary Mixture (Chromate and Permanganate)……..…21 Chapter two: Atomic Spectroscopy ………………………………………………...…24 Experiment 4: Flame Photometric Determination of sodium, Potassium, and Lithium………………………………………………………..…….…..29
Experiment 5: Analysis of Iron by Atomic Absorption Spectroscopy………....31 Experiment 6: Determination of Water Hardness by Atomic Absorption Spectrophotometry…………………………………………………..……....34 Chapter Three: Molecular Fluorescence Spectroscopy…………………………...…35 Experiment 7: The Fluorometric Determination of Acetylsalicylic Acid in an Aspirin Tablet………………………………………………………………….…..42 Chapter Four: Refractive Index……………………………………………...………..46 Experiment 8: A. Determining the Refractive Index of Substances……………………50 Chapter Five: High Performance Liquid Chromatography….……….…………..... 54 Experiment 9: A Study of Chromatographic Variables……………………………...…60 Experiment 10: HPLC Determination of Saccharin, Benzoic Acid, and Caffeine …....62 Chapter Six Potentiometric Methods………………………………………………….64 Experiment 11: Potentiometric Derivation of Acid-Base Titration Curve……………..71 Chapter Seven Conductometric Methods……………..………………….………….. 73 Experiment 12: Conductometric Titration of a Mixture of Acetic and Hydrochloric Acids…………………………………………………..……....76 Chapter Eight: Nitrogen Determination by Kjeldahl………………………….…….78 Experiment 13: Nitrogen and Crude Protein Determination by Kjeldahl…………....…80

3
General Information and Instructions
Instrumental Analysis Lab Manual Text: Principles of Instrumental Analysis; Skoog, Holler, and Nieman, 5th Edition Goals:
Obtain hands on experience on a variety of instrumental methods for chemical analysis.
Work effectively in groups: All experiments will be conducted in groups. Learning to work as a team is very important in industrial and academic setting.
Coming to lab well prepared for a given task. Critical evaluation of results: You will prepare written reports documenting your
work. These reports will teach you how to organize your data into concise manner and to
critically evaluate your results. Attendance: Attendance is expected and tardiness is not tolerated. You will be working in groups on each lab experiment, and it is important you do NOT let down your partner(s) by showing up late. If you miss a lab period (unless excused by instructor) you will automatically receive a zero for that experiment. Experiments: This semester is divided into different rounds of experiments. This rotation will allow groups to gain exposure to a variety of different instrumentation over the course of the semester. Quizzes: You will be evaluated on your preparation for different experiments with pre-lab evaluations. Quizzes may be written or based on interviews given during the lab period. Performance: Part of your lab grade will be based on participation and performance. You are working on experiments as a team. Cooperation and contribution from everyone in the group is expected. Lab Reports: There will lab reports in this course. Late lab reports will not be accepted (unless excused by instructor) and will result in a grade of zero. Lab Reports = 70% Lab Quizzes = 20% Lab Performance = 10% Grading: There will be 70 points for the twelve experiments, 20 points for the lab quizzes and oral presentation, and 10 points for instructor’s evaluation. Lab grades are calculated as follows: Your grade will depend on: a) your results and b) how well they are presented in your final formal laboratory report. Multiple factors such as accuracy of your determination,

4
neatness and completeness of your written report and a strong indication of your understanding of the experiment will contribute towards your grade. LABORATORY PROCEDURE A necessary prerequisite for adequate performance in the laboratory is your preparation prior to the laboratory period. Students must be well acquainted with the instructions for the experiment to be carried out. You only have 3 hours to complete the experiments! Therefore, make sure you have read the procedures and the instrument operating instructions before coming to class. Also come to class with an outline of exactly how you intend to prepare your standard solutions and run your experiments. Be prepared, have a lined-up plan, do not procrastinate! If you are unable to attend a scheduled laboratory period due to a University valid excuse, the instructor should be notified immediately, before the lab period starts, so that suitable alternative arrangements can be made. Please keep in mind that lab make up is normally not allowed because of the Instruments and lab space limitations. All students will work in groups on a given experiment during each laboratory. It is extremely important to be as efficient as possible during each and every lab period. In general you will finish all preparations for the experiment during the first period (prepare stock solutions, sample solutions etc.), and conduct the instrumental analysis during the second period. Please come to class on time. In many cases, the experiments will take the entire 3 hours allocated! Your partner will not be allowed to work alone so be responsible with his/her time. You will not be allowed to work if you come to the laboratory 30 min late. All experimental data will be recorded, as it is obtained, on a lab notebook. Upon completion of the day’s lab work, the instructor will validate your work by placing his/her initials in your lab-book even if the experiment has not been completed. The original data sheets (or a photocopy) must be included in your formal report and will be part of your grade. SAFETY. Remember: "SAFETY IS ALWAYS THE NUMBER ONE PRIORITY" Should any problem arise inform the instructor immediately. Do not put yourself in danger. If you think something is unsafe STOP and consult the instructor before continuing. IMPORTANT RULES 1. Please remember that we share the lab with many classes and therefore do not leave
anything out after the lab session is finished. 2. Always return all chemicals to their original place immediately after use. 3. Keep your work area always clean, in particular when working with instruments or in
the balance room. Your work area must be clean. Point deductions will be taken off your experiment grade if this conduct is persistent.
4. Do not leave standard solutions in volumetric flasks. Once you are done with the preparation, transfer the solution to a labeled vial for storage. Include the Group number and other important information in the labels; a lot of people may be doing the same experiment at the same time. Rinse the volumetric flasks thoroughly before returning them to the cabinet.

5
5. You must have a lab notebook and you must write everything in black or blue ink (no pencils). When correcting something do not white-out, scratch the error with a single line and write the correction above or below.
6. Remember to record the unknown sample number for each experiment. 7. Always wear a lab coat and safety glasses and please, no sandals! 8. Read the operating instructions for every instrument before you use it. If you have any
questions about anything stop and ask! 9. Be aware of the due dates for each experiment (you will be penalized for late
submissions), If you can’t make it for any reason notify the instructor in advance, not after the fact.
10. Working in groups requires sharing of the responsibilities so do not drag your feet, talk to your partner. If problems arise don't wait until it's too late, talk to the instructor about it.
11. PLAGIARIZE (play-jâ-riz). to take and use another person’s ideas, writings or inventions as one’s own.
Note that plagiarism is illegal, unethical, and you can be expelled from the University for it. Plagiarizing old laboratory reports will not be tolerated! Any evidence of such activities will result in no points for that exercise. Further disciplinary actions will be taken at the discretion of the instructor.
REPORT WRITING A Lab report is required for each one of the experiments. Reports are due at the beginning of the next lab period after you finish an experiment. There will be a 10% grade deduction on all late submissions and no report will be accepted after two weeks of the experiment completion have passed. Your final report should be neatly typed or handwritten (in ink) on 8 ½ x 11 paper. Graphs should be plotted on the same size paper and should be scaled so that the data occupies the majority of the plotting area. All graphs in the final report, with the exception of your raw data, must be computer generated. All axes should be labeled and the proper units displayed. When logarithmic scales are used please make sure the data is accurately represented in your plot. When reporting tables of data please check your significant figures, they are important. All statistical treatment of the data must be done using a computer. Your final report must consist of the following sections: I. Cover Page: Title of the experiment, course name and number, your name and the date. II. Introduction: Presents a description of the parameters to be measured and the general approach to the problem. Should also include a detailed description of the analytical technique involved showing a thorough knowledge of the concepts involved. This section should also state the objectives of the experiment. III. Experimental Section:

6
1. Analytical procedure: This section should include a description of how the experiment was conducted and the equipment was used. Do not copy the procedure section from the lab manual. Write in your own words to describe how you performed the experiment. Be sure to include any modifications or deviations from the suggested protocols. 2. Raw Data: Record all experimental data as it is obtained. Include the original data sheet with your report (remember an initialized copy of the data has been submitted to the instructor). IV. Results: Present your data in tables and graphs. Calculations and error analysis must be shown and explained. Use SI units only. If difficulties were encountered include a narrative description of the problem. All graphs, tables and sections must have a title/caption and should be referenced in your text. V. Discussion and Conclusions: Discuss your findings; make comparisons with known values if available. Elaborate on possible sources of errors, selectivity and sensitivity of the technique, detection limits, matrix effects, interferences, accuracy, precision, applicability, etc. Suggest any possible improvements in the experiment and present your summary conclusion. VI. References: Include references using the ACS format used in the journal Analytical Chemistry; i.e.: Number all references consecutively in parentheses and include them at the end of your report in a section called "References". i.e.: (1) Cai, Y.; Alzaga, R.; Bayona, J.M. Anal. Chem. 1994, 66, 1161-1167. Since your final grade greatly depend on these reports please work hard on them.
Checklist for Lab Report Grades Max Points Grade Cover page to include title, names, and date 1 Introduction Description of technique/Principles/Equations/Reactions
1.5
Objectives 1 Experimental Section Analytical Procedure Results Tables of data/observations/Calculations Graphs fits/equations/error/axes/Units/SD's Analytical Result*
4
Discussion/Questions/Definitions 2 References 0.5 Total grade 10

7
CHAPTER ONE
ULTRAVIOLET - VISIBLE SPECTROSCOPY
UV-Vis spectroscopy is one of the most important quantitative
spectroscopic techniques. The wavelength range extends from about 190 nm to 750 nm which corresponds to electronic transitions of different origins. The energy level diagram can simply be represented as shown in Figure 1.
σ
σ
n
π
π
E
*
*
Figure 1: Energy level diagram representing electronic transitions. Four transitions are shown in the figure, which correspond to: a. σ − σ* Transitions This type of transition requires large energy which may result in
breakdown of chemical bonds. It is not important from the analytical point of view for reasons to be discussed later. The radiation wavelength which should be used to enforce this type of transition is below 190 nm .
b. π − π* Transitions This is the most analytically useful type of transitions where
radiation of certain wavelength cause electrons present in the π bonds to be excited to the higher energy π* state. The energy required is moderate and can be obtained from sources operating in the UV-Vis range.
c. n - π* and n - σ* Transitions

8
Molecules which contain lone pair(s) of electrons exhibit some special characteristics. Electrons which do not participate in chemical bonds can absorb energy and are excited either to the π* (if the molecule has π bonds) or to the σ* state. Energy required for a n - π* transition is small while a n - σ* transition requires more energy. Factors to be mentioned later eliminate the use of these transitions in analytical work.
Beer's Law It is logical that the amount of energy absorbed by molecules
depends on the number of the absorbing species and, therefore, on concentration. A quantitative relationship was derived by Beer, Lambert and Bouger separately. Therefore, the relationship can be referred to as Beer's, lambert or Bouger law or some combination of these names.
The law states that: A = εbC, where A is the absorbance. b is the cell length in cm ε is the molar absorptivity in L cm-1 mol-1
C is the concentration in mol/L Away from mathematical derivation, the law can be simply derived as
follows. It is logical to assume that A α C since as C increases, the number of
absorbing species increases and thus A increases. Also A α b since as b increases more molecules are encountered by
radiation and therefore possibility of absorbance increases. This can yield the relation A α bC or A = εbC, where ε is a proportionality constant and is called molar
absorptivity. Old conventions used the expression “extinction coefficient” or “optical density” for the molar absorptivity. However, the last expression is the internationally accepted one.
In Beer's law, ε is the most important sensitivity indicator. When b is
1 cm and A is plotted as a function of the concentration, a straight line relationship is obtained as in Figure 2.

9
C
A
∆A
∆C ε =
Figure 2: A straight line relationship between absorbance (A) and
concentration (C). Molar absorptivity is the slope when b equals 1 cm.
When the concentration is expressed in mol/L and is plotted on the
X-axis, ε is the slope and its value is an indication of the sensitivity of the method.
Deviations from Beer's Law Beer's law suggests direct proportionality between Absorbance and
concentration and that a straight line relationship should be obtained. However, some factors can lead to different behavior.
1. Dilute Solutions It is observed that only solutions that are less than 0.01 M can
result is successful application of Beer's law. High concentrations of solute lead to interactions between neighboring molecules resulting in a change in the absorbance characteristics of molecules.
2. Monochromatic Light As the energy between any two energy levels is constant, one can
roughly say that the wavelength of the radiation that can cause an electronic transition from one energy level to the other should be exact. Therefore, Beer's law is valid only when a monochromatic light is used. This can be validated through a simple mathematical treatment where only when the molar absorptivities of the two wavelengths are equal that beer's law holds, a condition which will never be attained.

10
3. Stray Radiation In some cases, instrumental artifacts can lead to considerable
amount of stray radiation (Radiation reaching the detector without passing through the sample).
Po + Ps A = log _______ P + Ps At high concentrations, P is small and absorbance is affected
strongly by the value of Ps resulting in a nonlinear relationship between absorbance and concentration.
4. Refractive Index The application of Beer's law requires the measurement of the
absorbance of different concentrations. Since ε is dependent on refractive index, it is expected that solutions for which the refractive index changes a lot with concentration will show a deviation from Beer's law.
5. Chemical Reactions or Transformations If an analyte reacts with any species or dissociates forming species
of different absorption characteristics, the absorbance may not necessarily be as predicted by Beer's law.
The Molar Absorptivity From the above argument, it is clear that ε is an important element
in Beer's law expression. It is an indicator of sensitivity which means that the value of ε is very important in characterizing a system for quantitative capacity. As ε increases, it becomes easier to determine lower concentrations of analytes.
The molar absorptivity has large values for π − π∗ transitions ranging from 1000 to 10000 L cm-1 mol-1. For n - π* transitions, ε ranges from 10 - 100 L cm-1 mol-1. This means that the most important trasition in UV-Vis is the π − π* transition and, therefore, will be subjected to further studies in different solvents.
Effects of Solvent Polarity on π − π∗ Transition Solvent polarity is an important factor in the definition of the
energy required to cause a π − π∗ transition. Figure 3 shows the effect of polar solvents on the energy of this transition

11
π
π
π
π
*
*
Nonpolar solvent Polar solvent Figure 3 : Effect of Solvent Polarity on π − π∗ Transitions. π* is more polar than π and is stabilized more than π in polar solvents.
The energy required for π − π* transition in polar solvents is thus reduced and the wavelength of incident radiation increases. This is referred to as bathochromic shift or red shift.
A n - π* transition is affected in an opposite way since the n electrons
are stabilized more than the π* leading to increased energy and shorter wavelength. This is referred to as hypsochromic shift or blue shift.
Qualitative Versus Quantitative Analysis UV-Vis is mainly used in quantitative analysis due to the fact that
spectra obtained from this type of spectroscopic technique are almost featureless. It is very difficult to assign a spectrum for a specific species since a spectrum has no definite characteristics associated with a species. However, Beer's law can be efficiently applied for quantitative determination of any species which absorbs in the UV-Vis region. Therefore, UV-Vis spectroscopy is mainly a quantitative technique and is marginally used in qualitative analysis.
Additivity of Absorbances When two absorbing species are present in solution, the
absorbance value measured will represent both species A = A1 + A2 However, measuring absorbance at two different wavelengths can
yeild the exact concentration of each component A1 = ε1 b C1 + ε2
' b C2 at λ1 A2 = ε1
' b C1 + ε2 b C2 at λ2
12
ε1 , ε2 , ε1
' , and ε2' are constants and can be determined
experimentally. Only C1 and C2 are not known which can be determined by solving
the two equations. Determination of a Ligand to Metal ratio UV-Vis spectroscopy is very useful in determining the ratio
between a ligand and a metal.
Mn+ + m L = (MLm)n+
Usually, complexation of ligands with metals result in different spectroscopic characteristics for both. The most pronounced situation is the formation of a colored complex. Two widely used experimental methods will be discussed:
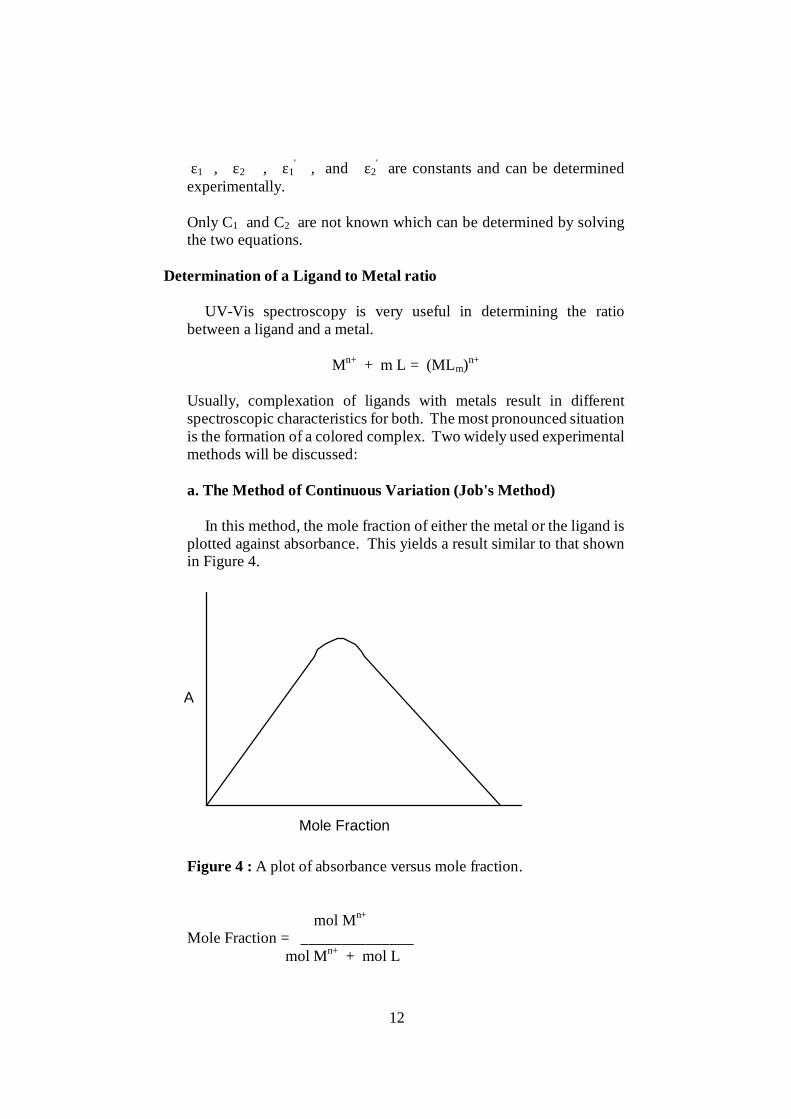
a. The Method of Continuous Variation (Job's Method) In this method, the mole fraction of either the metal or the ligand is
plotted against absorbance. This yields a result similar to that shown in Figure 4.
A
Mole Fraction Figure 4 : A plot of absorbance versus mole fraction. mol Mn+
Mole Fraction = ______________ mol Mn+ + mol L

13
Tangents are drawn on both side of the maximum obtained and a
perpendicular line is drawn to the axis representing the mole fraction. This gives the mole fraction of the metal. If the value is 0.5 then it is a 1:1 complex and if it is 0.33 then it is a 1:2 complex, etc.
The method of continuous variation is excellent for complexes that are 1:1 but if the ratio is more than 1:2 there will be some considerable uncertainty and the mole ratio method is preferred.
b. Mole Ratio method The concentration of the metal ion is usually kept constant and a
variable amount of the complexing agent is added. The mole ratio of the metal ion to the ligand is plotted versus absorbance and a result as shown in Figure 5 is obtained
A
mol L/mol Mn+
Figure 5: A plot of absorbance versus mole ratio. Tangents are drawn and a perpendicular line is drawn to the mole
ratio axis showing the exact ratio. Instrumentation. In this section, only a brief description of instrumental features will
be mentioned. This is important since you may be required to perform some experiments in UV-Vis spectroscopy without enough background.
Two types of instruments are available according to the wavelength selector used.

14
a. Filter Photometer This uses filters for the selection of working wavelengths.
Photometers are cheap machines that are widely used in most primitive analytical laboratories. The optical system and instrumental components can be represented by Figure 6.
Source
Slit
Filter
Sample CellDetector
Figure 6: Schematic diagram of a photometer As can be seen from the figure, light is emitted from the source
passing through a suitable filter for wavelength selection. Part of the light at the selected wavelength is absorbed by the sample and the transmitted light hits the phototube detector resulting in a signal that is displayed by the instrument as absorbance.
b. Dispersive Spectrophotometers These use either prisms or gratings for wavelength selection.
Prisms and gratings are excellent wavelength selectors where a very narrow band of light at specific wavelength can be chosen especially with good gratings. Dispersive instruments are divided into two types:
1. Single Beam Spectrophotometers This is similar to the photometer design but the wavelength
selector is either a prism or grating instead of the filter. Usually, single beam instruments are of moderate price and require adjustment to zero using a blank before sample measurement. As the instrument is kept in the operational mode, multiple zero adjustments should be undertaken because there is always some drift in response with time.
2. Double Beam Spectrophotometers These incorporate places for two cells one for the blank and the
other for the sample. The instrument automatically subtracts the

15
absorbance of the blank or reference from that of the sample. The different optical components of the instrument can be seen in Figure 7 .
L G M M
MC S
R
D
Figure 7: Schematic diagram of a double beam spectrophotometer:
L,source; G, grating; M, mirror; C, chopper; S, sample; R, reference; and D, detector.
The chopper (C) splits the incident beam into two halves, one
passes through the sample and the other passes through the reference. The detector automatically records the difference which is displayed as absorbance.
Sources The most commonly used sources are deuterium lamps in the
ultraviolet region and tungsten - halogen lamps in the visible region. Make sure not to look at the deuterium lamp while in the operational mode since UV light is damaging to your eyes.
Cells Remember that glass absorbs UV light, therefore make sure to use
quartz cells when working in the UV region. Glass cells are adequate for measurement of absorbance in the visible region while quartz cells are adequate through the whole UV-Vis range.
Routine Methodology in Spectrophotometric Analysis The first step of an analytical procedure in UV-Vis spectroscopy is
to find the wavelength that yeilds maximum absorbance. This is done by scanning through the UV or Vis range, depending on the characteristics of the absorbing species. The spectrum is plotted with absorbance on the Y-axis and the wavelength on the X-axis. Then the

16
wavelength that yeilds maximum absorbance is chosen for further work. This also gives maximum molar absorptivity.
When the problem involves the determination of an unknown analyte concentration, standard analyte is used to construct a calibration curve at the preselected wavelength and the unknown absorbance is measured which can be correlated with concentration from the curve.

17
Experiment 1: Determination of Iron in Aqueous Samples. Background Iron present in aqueous samples can be determined
spectrophotometrically by complexation with a suitable complexing agent. The absorbance of the metal-ligand complex is usually measured in the visible region and is related to metal ion concentration.
Colorimetric determination of iron can be done using several known complexing agents. Among the routinely used is 1,10-phenanthroline (phen) which reacts with Fe2+ to form an orange-red complex in the pH range from 2-9. . Therefore, the first step involves the reduction of any Fe3+ present to Fe2+ using hydroxylamine hydrochloride.
The procedure depends on the construction of a calibration curve from standard Fe2+, followed by measurement of the unknown Fe2+ concentration from the curve.
The first step of an analytical spectrophotometric procedure for quantitative determination of analytes is to find the wavelength at which the analyte complex has maximum absorption. At this wavelength, the molar absorptivity is a maximum and precision is greater. This allows for more precise and sensitive determinations The absorption spectrum of the iron-phen colored complex is to be determined firstly.
Reactions
n Fe2+ + m phen = Fen (phen)m2+
Apparatus 1. A photometer or spectrophotometer. 2. Sample cells. 3. pH Meter.
Chemicals and Reagents a. Provided 1. Stock phen solution (from previous experiment). 2. 0.5 M Hydroxylamine hydrochloride.
18
3. 0.1 M Acetate buffer, pH 4.0. 4. Standard Fe2+ solution (from previous experiment. b. Need Preparation None, except 1 and 4 if you do not have them ready. Procedure for
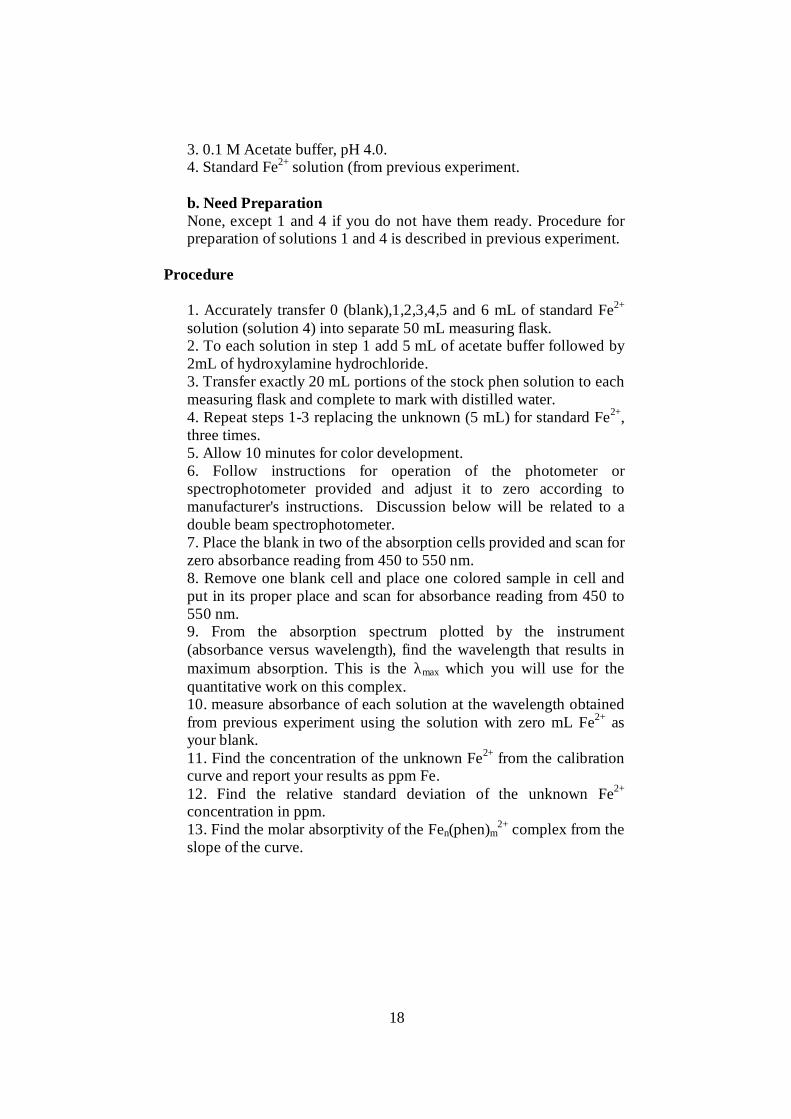
preparation of solutions 1 and 4 is described in previous experiment. Procedure 1. Accurately transfer 0 (blank),1,2,3,4,5 and 6 mL of standard Fe2+
solution (solution 4) into separate 50 mL measuring flask. 2. To each solution in step 1 add 5 mL of acetate buffer followed by
2mL of hydroxylamine hydrochloride. 3. Transfer exactly 20 mL portions of the stock phen solution to each
measuring flask and complete to mark with distilled water. 4. Repeat steps 1-3 replacing the unknown (5 mL) for standard Fe2+,
three times. 5. Allow 10 minutes for color development.
6. Follow instructions for operation of the photometer or spectrophotometer provided and adjust it to zero according to manufacturer's instructions. Discussion below will be related to a double beam spectrophotometer.
7. Place the blank in two of the absorption cells provided and scan for zero absorbance reading from 450 to 550 nm.
8. Remove one blank cell and place one colored sample in cell and put in its proper place and scan for absorbance reading from 450 to 550 nm.
9. From the absorption spectrum plotted by the instrument (absorbance versus wavelength), find the wavelength that results in maximum absorption. This is the λmax which you will use for the quantitative work on this complex. 10. measure absorbance of each solution at the wavelength obtained from previous experiment using the solution with zero mL Fe2+ as your blank.
11. Find the concentration of the unknown Fe2+ from the calibration curve and report your results as ppm Fe.
12. Find the relative standard deviation of the unknown Fe2+ concentration in ppm.
13. Find the molar absorptivity of the Fen(phen)m2+ complex from the
slope of the curve.

19
Experiment 2: Determination of the Mole Ratio of Iron : 1,10- Phenanthroline in the Complex
Background The mole ratio of a metal to a ligand in a metal-ligand complex can
be determined. In the complex, Fen(phen)m2+, the coefficients n and m
can be calculated by several methods. Two very important, simple methods, will be applied in this experiment. The method of continuous variation and the mole ratio methods are widely used with advantage of the first if the ratio is 1:1 . The second method is excellent and better than the first when the mole ratio is greater than 1:2.
Reactions
n Fe2+ + m phen = Fen (phen)m2+
Chemicals and Reagents a. Provided 1. 0.1 M Acetate buffer, pH4.0. 2. 0.5 M Hydroxylamine hydrochloride. 3. Predried and desiccated 1,10-phenanthroline. 4. Predried and desiccated Fe(NH4)2 (SO4)2 .6H2O b. Need Preparation 1. 5x10⁻⁴ M 1,10-phenanthroline solution. 2. 5x10⁻⁴ M Fe2+ solution. Note: Use solutions saved from previous experiments. Procedure I. Application of the Method of Continuous Variation 1. Accurately transfer 0,1,2,3,4,5,6,7,8,9,and 10 mL of the Fe2+
solution into mL measuring flasks and mark each flask. 2. To each flask add 5 mL of the acetate buffer provided followed by
2 mL of hydroxylamine hydrochloride. 3. Pipette 10,9,8,7,6,5,4,3,2,1,and 0 mL of the phen solution into the
flasks in step 1, respectively. Each flask should now contain 17 mL of the mixture.

20
4. Dilute to the mark using distilled water and allow the solutions to stand for 10 min.
5. Record the absorbance of each solution using water as a reference. 6. Plot the absorbance of the solutions versus mole fraction of Fe2+
and find the stoichiometry of the reaction. II. Application of the Mole-Ratio Method This involves addition of fixed amounts of the metal ion to each
solution and changing the number of moles of the complexing agent. 1. Accurately transfer 4 mL of the standard Fe2+ solution into nine 50
mL volumetric flasks and mark your flasks. 2. To each flask add 5 mL of the acetate buffer followed by 2 mL of
the hydroxylamine solution. 3. Pipet exactly 1,3,6,8,10,12,14, 17 and 20 mL of the phen solution
and complete to the mark with distilled water. 4. Allow 10 min before measurement of absorbance at λmax. 5. Plot the absorbance of the different solutions versus the mole ratio
of phen to Fe2+ and identify the stoichiometry of the complex from the resulting curve.
Remarks It is hoped that, by now, you will have an appreciation of some basic
uses of UV-Vis spectroscopy. You should be able to find λmax, concentration of an unknown from a calibration plot, the molar absorptivity as well as the stoichiometry of any colored metal-ligand reaction.
To have a comprehensive appreciation you should study the different
variables that affect the reaction system , like pH, reactants concentration, temperature, ...etc.

21
Experiment 3: Determination Binary Mixture (Chromate and Permanganate).
Permanganate and dichromate ion both absorb visible light though their absorbance maxima are fairly well separated. By measuring the absorbance at two different wavelengths of a solution containing both ions, it is possible to simultaneously determine the concentration of each ion in the solution. In simultaneous determinations of two species it is necessary to generate two equations in order to determine the two unknown concentrations. The most convenient way to construct two equations is to measure the total absorbance of the solution at two different wavelengths. The wavelengths chosen must be those at which the molar absorptivities, ε, of the individual species are either known or can be experimentally determined.
a. Provided 1. 0.2 M potassium permanganate (KMnO4).
2. 0.2 M potassium dichromate (K2Cr2O7). 2. 1.0 M H2SO4.solution.
3. Different unknown mixtures of permanganate and dichromate . b. Need Preparation 1. 5x10⁻⁴ M 1,10-phenanthroline solution. 2. 5x10⁻⁴ M Fe2+ solution. Note: Use solutions saved from previous experiments Procedure 1. Prepare 100 mL of 0.003 M potassium permanganate (KMnO4)
solution from the 0.2 M stock solution of KMnO4 by dilution with distilled water.
2. Prepare 500 mL of 0.03 M sulphuric acid (H2SO4) from the 1.0 M stock sulphuric acid solution by dilution with distilled water.
3. Prepare 100 mL ml of 0.01 M potassium dichromate (K2Cr2O7) solution from 0.2 M stock solution potassium dichromate (K2Cr2O7) by the dilution with the 0.03 M sulphuric acid solution.
4. Prepare 50 ml standard solutions of the concentrations given below for both permanganate and dichromate ions. Dilute permanganate solutions by distilled water and dichromate solutions by the sulphuric acid solution prepared.
a)Blank b)1x10⁻⁴ M c)2x10⁻⁴ M d)3x10⁻⁴ M e)4x10⁻⁴ M

22
5. Turn on the instrument and allow for 10 minutes. 6. Fill both sample cells with distilled water, place in the instrument and
perform baseline correction. 7. Fill the sample cell with the solution containing 3x10⁻⁴ M MnO4
- and scan the range from 250 nm to 750 nm. Then repeat with 3x10⁻⁴ M Cr2O7
2- solution. Print the spectra together by choosing overlay printing.
8. Locate the absorption maxima for the two compounds and choose the wavelengths for the following measurements.
9. Measure the absorbance of the standards and the unknown at the chosen wavelengths. As the reference, use distilled water for MnO4
- solutions and the unknown, and 0.03 M H2SO4 solution for Cr2O7
2- solutions.
10. Draw the calibration curves for each ion at each wavelength. 11. Calculate the composition of the unknown solution.
GRAPHS AND CALCULATION:
In this experiment, the measurements should be made at wavelengths where both permanganate and dichromate ions absorb. The wavelengths were chosen so that each wavelength is absorption maximum for one of the components, and also the absorptivity of the other component does not change very much. Each of these ions has a different value at each wavelength. That is, we have
A1 = ε11.b.c1 + ε21.b.c2 A2 = ε12.b.c1 + ε22.b.c2
Were c1 concentration of permanganate and c2 concentration of dichromate.
Each of these absorptivities has to be found. For this purpose, four standards should prepared for each component (KMnO4 and K2Cr2O7) and their absorptivities should recorded.
Concentration (M)
Absorbance at λ1 = nm Absorbance at λ2 = nm KMnO4 K2Cr2O7 KMnO4 K2Cr2O7
1.10-4 2.10-4 3.10-4 4.10-4
When the absorbance of a species is plotted versus the concentration of that species, according to Beer’s law, a straight line with a slope equal to b.ε will

23
be obtained. This will be used for the calibration curve construction to find the molar absorptivities.
The path length of the cells used was 1 cm. So the molar absorptivity of permanganate and dichronmate ions at each wavelength can be determined. Then for the unknown, the absorbances are measured. Then the concentrations of the ions in the unknown can be calculated. The absorbances depend on the concentration. You have two independent equations with two unknowns. By solving these two equations together, you can get c1 and c2.

24
CHAPTER TWO ATOMIC SPECTROSCOPY
In previous sections, examples of molecular absorption
spectroscopy were introduced. These give broad band spectral peaks due to presence of vibrational and rotational levels associated with each electronic level. On the contrary, atomic spectra are composed of separate lines due to transitions between different electronic levels. Atoms do not contain vibrational and rotational levels associated with electronic levels, thus leading to line spectra (Figure 1).
Atomic spectroscopy is divided into three types which are
absorption, emission, and luminescence spectroscopy, All yielding line spectra.
3 p
3 d
4 p 5 s
3 s
589 nm
616 nm 586 nm
E
Figure 1: Energy level diagram for atomic sodium
(Only few lines are shown) FLAME PHOTOMETRY Flame photometry is an atomic emission technique which may be
regarded as the simplest of atomic spectroscopic methods and is very similar to the flame test which is applied for detection of alkali metals. Flame photometry is good only for elements that are easily excited and do not require very high temperatures (Na, K, Li, Ca are the most widely determined atoms by this technique).
Instrumentation

25
A flame photometer instrument is extremely simple where the sample in solution is aspirated through an aspirator or nebulizer into the flame which is usually a propane / air fuel or, even, a purified natural gas/air mixture. The sample matrix evaporates followed by atomization of the sample. Atoms present in the high temperature zone of the flame are excited to higher energy levels by absorbing energy from the flame. As excited atoms return to the ground state they emit radiation in definite wavelength depending on the energy level from which each atom drop. This gives rise to a line spectrum. However, in flame photometry a pre-selected filter (depending on the atom in question) is used and it is the intensity of the emission line that is practically measured and is related to the original concentration of the sample in solution. The detector is usually a phototube or a photomultiphier tube depending on the quality of the instrument. A schematic diagram of a simple flame photometer is shown is shown in Figure 2.
Air
Fuel
Liquid sample from aspirator
Filter
DetectorFlame
Figure 2: A schematic of a simple flame photometer instrument. Filters can be changed or selected to suit the determination of the
element in question. Commercial instruments are usually equipped with capabilities to
analyze for Na, K, L, and sometimes Ca. Qualitative Versus Quantitative

26
Atomic emission based on flame photometry is used for quantitative determinations only. This is because quantitative analysis using atomic emission requires advanced equipments and measurement of exact location of each emission line followed by comparison with standard line sheets. However, it is possible to use the machine for the qualitative and quantitative determination of the elements of the first and second groups of the periodic table, since these elements exhibit good emission and very intense and few emission lines, using regular flames usually utilized in flame photometry.
Preparation of a Calibration Curve A calibration curve should be constructed using standard solutions
prepared from the finest grade available. Concentrations covering the regions around the expected analyte signal should be used. It is not wise to try to interpolate or extrapolate a calibration curve of this type since the relationship between the signal and concentration may not be exactly linear, as different factors affect the shape of the calibration plot.

27
ATOMIC ABSORPTION SPECTROSCOPY (AAS)
Introduction
Atomic-absorption (AA) spectroscopy uses the absorption of light to measure the concentration of gas-phase atoms. Since samples are usually liquids or solids, the analyte atoms or ions must be vaporized in a flame or graphite furnace. The atoms absorb ultraviolet or visible light and make transitions to higher electronic energy levels. The analyte concentration is determined from the amount of absorption. Applying the Beer-Lambert law directly in AA spectroscopy is difficult due to variations in the atomization efficiency from the sample matrix, and non-uniformity of concentration and path length of analyte atoms (in graphite furnace AA). Concentration measurements are usually determined from a working curve after calibrating the instrument with standards of known concentration.
Instrumentation
A schematic diagram of schematic of an atomic-absorption instrument is shown is shown in Figure 3.
Figure 3: A schematic of an atomic-absorption instrument
Light source.
The light source is usually a hollow-cathode lamp of the element that is being measured. Lasers are also used in research instruments. Since lasers are intense enough to excite atoms to higher energy levels, they allow AA and atomic fluorescence measurements in a single instrument. The disadvantage of these narrow-band light sources is that only one element is measurable at a time.
Atomizer.

28
AA spectroscopy requires that the analyte atoms be in the gas phase. Ions or atoms in a sample must undergo desolvation and vaporization in a high-temperature source such as a flame or graphite furnace. Flame AA can only analyze solutions, while graphite furnace AA can accept solutions, slurries, or solid samples.
Flame AA uses a slot type burner to increase the path length, and therefore to increase the total absorbance (Beer-Lambert law). Sample solutions are usually aspirated with the gas flow into a nebulizing/mixing chamber to form small droplets before entering the flame.
The graphite furnace has several advantages over a flame. It is a much more efficient atomizer than a flame and it can directly accept very small absolute quantities of sample. It also provides a reducing environment for easily oxidized elements. Samples are placed directly in the graphite furnace and the furnace is electrically heated in several steps to dry the sample, ash organic matter, and vaporize the analyte atoms.
Light separation and detection
AA spectrometers use monochromators and detectors for uv and visible light. The main purpose of the monochromator is to isolate the absorption line from background light due to interferences. Simple dedicated AA instruments often replace the monochromator with a bandpass interference filter. Photomultiplier tubes are the most common detectors for AA spectroscopy.

29
Applications Experiment 4: Flame Photometric Determination of sodium,
Potassium, and Lithium Background Analytical methods for the determination of sodium, potassium,
and lithium are limited except those techniques based on atomic spectroscopy. The simplest versions of atomic spectroscopic methods are emission methods based on flames, using filters for wavelength selection. This is termed flame photometry and is widely used for routine analysis of samples containing species like Na, K, Li, and Ca. Emission signal at a specific wavelength is proportional to the concentration of analyte which emits at that wavelength.
Chemicals and Reagents a. Provided 1. Standard Na, K, and Li solutions (1000 ppm each). 2. Sample of unknown concentrations of Na, K, and Li. b. Need Preparation 1. Prepare standard Na, K, and Li solutions that are 1, 5, 10 ,20 ,30
,40 ,50 ,60, 70, 80, 90, and 100 ppm of each metal ion. Apparatus Flame photometer equipped with Na, K, and Li filters. Procedure 1. Follow instructions for the correct operation of the flame
photometer available. 2. Adjust the signal, using the Na filter, to zero using distilled
deionized water. 3. Read the signal for the Na set of standards and then that of the
unknown sample. 4. If the signal obtained for the sample is out of range, dilute a portion
of the sample properly till a signal within the range is obtained. 5. Construct a calibration curve for Na in the sample and report your
results in ppm.

30
6. Repeat steps 2-5 for K and finally for Li and find the concentration of each species in the sample. Results should also be reported in ppm analyte.
Note: The sample unknown can be a sample of any drinking supply.
Therefore, each student is asked to bring his own sample and the class is asked to report an overview of water quality in the different areas of the city as compared to accepted values.

31
Experiment 5: Analysis of Iron by Atomic Absorption Spectroscopy.
Background
Anemia is most often due to an iron deficiency and occurs most frequently in women of child bearing age, people in developing countries, and children of low socioeconomic background. Such people with anemia will have a general weakness due to the below normal levels of hemoglobin. Too much iron can also cause problems as excesses of large amounts of ingested iron can lead to cirrhosis of the liver. For people with known deficiencies (absorption is less than the loss), the taking of tablets with iron can be beneficial. Today's experiment is designed to measure the iron content of such a tablet using atomic absorption spectroscopy.
Standard Calibration Curve
The absorbance of several standard solutions in which the iron concentration is accurately known will be measured using the atomic absorption spectrometer. The values of absorbance will be plotted vs. the values of the Fe2+ concentration in mg Fe/liter. A smooth line drawn through the points on the graph can then be used to determine the iron concentration of a solution from the absorbance of this solution.
Chemicals and Reagents a. Provided 1. Standard Fe2+ (1000 ppm). 2. Vitamin tablet containing iron.
3. Solution of 6 N HCl. b. Need Preparation
1. Standard solutions of Fe. 2. Solution of Fe tablet
Apparatus Atomic Absorption Spectrophotometer.
Procedure:
Check out four 100-mL vol. flasks and 10, 5, 2, and 1-mL pipets. Each group of students will prepare a set of standard solutions and establish a standard curve for analysis of a vitamin tablet. The calibration curve will be used to determine the concentration of iron in the solution prepared from the vitamin tablet.

32
Taking into account the dilutions in the preparation of the sample, the number of mg of iron in the tablet will be calculated.
Preparation of Standard Iron Solutions
1- Prepare a stock solution of 50 ppm. 2- Using the previous stock solution to prepare five standard solutions of
0.05, 0.1, 0.5, 1.0, 1.5 and 2 ppm of Fe.
In order to achieve the necessary accuracy you will need to measure volumes with pipet and volumetric flasks.
Sample Determination and Preparation
The iron containing tablet will be dissolved and serial dilutions be made, as illustrated in Figure 4, to make a solution with a low enough Fe2+ concentration to be read in the atomic absorption spectrophotometer.
Figure 4: preparation of iron tablet solution
1. Dissolving the tablet.
One tablet of the brand vitamin to be analyzed is placed in a 100 mL beaker covered by a watch glass and heated to a slow boil with 25 mL of 6 N HCl for 15 minutes on a hot plate in a hood. The mixture is then diluted slightly with water, and filtered while hot, through #40 filter paper directly into a 100-mL volumetric flask. After washing the residue with hot deionized water the filtrate is allowed to cool to room temperature and diluted to the mark with room temperature deionized water.
2. First dilution of tablet solution.
Using a 5-mL pipet remove a 5.00 mL aliquot of the tablet solution and transfer it to a 100-mL volumetric flask. Add water to dilute to 100 mL.

33
3. Second dilution of tablet solution.
A 10.00 mL aliquot of the solution prepared in part 2 is pipetted into a 100-mL volumetric flask, and the solution is diluted to the mark with water. Determine the absorbances of the standards and the diluted vitamin solution.
Calculations
1. a) Make a standard curve by plotting iron concentration in ppm (mg/L) versus absorbance for the three standard solutions and the blank.
b) Using the absorbance value for your vitamin pill solution and your standard curve determine the concentration of iron in this unknown solution.
3. Determine the Fe conc. mg/liter in the original tablet solution using the dilution factors.
2. Determine the number of mg of iron per tablet from your concentration (mg/Fe per liter of solution).

34
Experiment 6: Determination of Water Hardness by Atomic Absorption Spectrophotometry.
Background
Water hardness is defined as the total concentration of alkaline earth
metal ions in water. Because the concentrations of Ca2+ and Mg2+ are usually much higher than those of other alkaline earth ions, hardness can be equated to [Ca2+] + [Mg2+]. Individual hardness refers to the individual concentration of each alkaline earth ion. Hardness is commonly expressed as the equivalent number of milligrams of CaCO3 per liter.
Thus, if [Ca2+] + [Mg2+] = 1 mM, we would say that the hardness is 100 mg CaCO3 per liter (because 1 mmol CaCO3 = 100 mg CaCO3). Water whose hardness is more than 60 mg per liter is considered to be "hard". Sometimes, hard water is considered "bad". For example, it causes the formation of scale in a water boiler or heater, and it consumes soap that would otherwise be useful for cleaning. However, it is not believed that "hard" water is unhealthy.
Hardness can be determined by many methods such as EDTA titration, and atomic absorption and emission spectrophotometry.
In this experiment, you will use flame atomic absorption spectrophotometry (AAS) to determine the concentrations of Ca2+
and Mg2+ in both cold and hot tap water, and in three .unknown. samples. You can bring your tap water from home or use the stuff in the lab, bathroom, or drinking fountain.
Chemicals and Reagents a. Provided 1. Standard Ca and Mg solutions (100 ppm each). 2. Different Tap water samples. b. Need Preparation Standard solutions of both Ca and Mg,. Apparatus
Atomic absorption Spectrophotometer Procedure

35
1. Prepare seven 50 mL Ca standard solutions of 0.1, 0.2, 0.5, 1, 1.5 , 3 and 5 ppm by dilution of the 100 ppm Ca stock solution by using deionized water.
2. Set up the spectrophotometer as described in the operating instructions.
Measure the absorbance of the standards. Measure the cold and hot tap water and the unknown samples. Properly dilute any sample(s) if the measured absorbance is too large.
3. Prepare seven 50 mL Mg standard solutions of 0.1, 0.2, 0.5, 1, 1.5 , 3 and 5
ppm by dilution of the 100 ppm Mg stock solution by using deionized water.
4. Set up the spectrophotometer as described in the operating instructions.
Measure the absorbance of the standards. Measure the cold and hot tap water and the unknown samples. Properly dilute any sample(s) if the measured absorbance is too large.
Additional measurement:
It would be interesting to determine the concentrations of calcium and magnesium in mineral water. Usually, mineral water contains high concentrations of Ca and probably Mg. Again, dilute the sample if the absorbance is too high. Ten extra points will be awarded if this measurement is performed and the results are discussed.
Calculations: 1- Tabulate and plot the absorbance vs. concentration for both calcium
and magnesium measurements. 2- Calculate the concentrations of calcium and magnesium in the tap
water and the unknown samples. 3- Calculate the hardness of the water samples and find out whether they are
"soft" or "hard". Discuss the difference in hardness between the cold and hot tap water if any is observed.

36
CHAPTER THREE MOLECULAR FLUORESCENCE SPECTROSCOPY
Fluorescence is important due to its inherent sensitivity which can be several orders of magnitude more sensitive than absorption methods. Another reason which adds to its importance is the specificity of fluorescence methods since, relatively, small margin of molecules fluoresce.
Origin of Fluorescence When radiation of an appropriate wavelength is used to irradiate
molecules in a sample, certain electronic transitions take place. As excited molecules return to the ground state they emit radiation of longer wavelength. The emitted radiation is referred to as fluorescence. Figure 1 shows a description of absorption and emission phenomena and energy levels associated with these electronic transitions.
S
S
ST
T1
2
o
1
2
ISC
P
FE
RD
VR
Figure 1: Description of fluorescence origin. F, fluorescence; P,
phosphorescence; S, singlet; T, triplet; RD, radiationless deactivation; VR, vibrational relaxation; ISC, intersystem crossing; and E, energy.
Electrons in the ground state (So) absorb energy from incident
radiation and are excited to S1 or S2 excited states. Vibrational relaxation (VR) results in the placement of the electron at the S1, main electronic level. Vibrational relaxation is a radiationless deactivation process where excess energy is consumed as kinetic energy or heat. A second collisional deactivation process can take place and the electron returns to the ground state by a radiationless deactivation

37
(RD) process to So. The other possibility involves direct transition of the electron from the S1 excited state to So ground state and excess energy is emitted as photons at specific wavelengths called fluorescence.
Electrons in the excited state can follow a third approach by
changing their spin and transferring to the triplet state through a process known as intersystem crossing. The path of the excited electron depends on several factors which will be mentioned shortly. An electron in the triplet state will surely exhibit a vibrational relaxation to the main triplet energy level. A second flip in spin is necessary for such an electron to transfer to the ground state by one of two mechanisms. The first involves emitting a photon at a specific wavelength (phosphorescence) or radiationless deactivation.
Some molecules show a different behavior where an electron in the triplet state can experience a flip in spin and return to the first excited singlet state followed by vibrational relaxation then either radiationless deactivation or fluorescence. Fluorescence of this type can be observed after some time and is referred to as delayed fluorescence. It should be noticed that the life time of an electron in the excited state is about 10-9 second which is the time needed to observe fluorescence. Phosphorescence or delayed fluorescence can be observed after some time, usually exceeding 10-4 second. As all processes of deactivation and phosphorescence are possible, precautions should be considered in order to inforce circumstances that prefer fluorescence route.
Effect of Light Intensity and Concentration The first step in a fluorescence process is the absorption of incident
radiation in order for electrons to transfer to the excited singlet state. Therefore, it can be assumed that fluorescence is proportional to amount of incident beam absorbed, or
F = K (Po - P) (1) where F is fluorescence intensity. Po and P are intensities of
incident and transmitted beams. From beer's law P/Po = 10-A or P = Po X10-A (2) By substitution in equation 1 F = KPo (1 - 10-A) (3)

38
By expanding the exponential term and assuming that A < 0.05 F = K1 Po εbC (4) At constant Po, ε and b F = K" C (5) This means that fluorescence intensity is directly proportional to
concentration. Another important result can be implied from equation 4 where fluorescence is shown to be directly proportional to the intensity of the incident beam. This suggests that a very intense light source is necessary for fluorescence instrumentation. Also substances of large ε are potential fluorescent molecules and should be sough for better results.
Excitation and Emission Spectra It can easily be understood that fluorescence will always occur at
wavelengths longer than excitation wavelength. This can be seen from Figure 1 as the energy of the emitted photon is less than that of the absorbed photon. Another observation which should be mentioned here is that since the emission of radiation is just the reverse of absorption (excitation) it is expected that the emission spectrum should be a mirror image of the excitation spectrum. This is theoretically correct but it is seldom the case due to instrumental artifacts. Figure 2 shows relative locations of an excitation and emission spectra
I
Wavelength
Excitation
Fluorescence
Phosphorescence
Figure 2: Relative locations of excitation, emission (Fluorescence
and phosphorescence) spectra.

39
The most important transition that contribute to good fluorescence characteristics is the π − π* transition since ε for this transition is the largest. The n − π* transition is damaging to fluorescence because it facilitate and increase the possibility of intersystem crossing.
Instrumentation A schematic of a typical fluorometer is shown in Figure 3 .
L
F
F
S
D
1
2
M
Figure 3: A schematic diagram of a typical filter fluorometer. L,
source; F1, F2 are excitation and emission filters, respectively; S, sample cell; D, detector; and M, mirror.
This type of fluorometer is a cheap one. In more expensive
instruments, gratings can be used instead of filters which give an excellent spectrofluorometer. The first wavelength selector (F1) transmits the excitation wavelength while the second (F2) transmits the emitted fluorescence at the emission wavelength.
It should also be noted that the emitted radiation is measured at 90o
from the incident beam. This is because it is necessary to exclude all incident radiation since only emitted radiation is important. Another reason is that minimum noise will be encountered when measurement is done at 90o in order to decrease scattering, which is minimum at this configuration.
Quantum Efficiency The Quantum efficiency (φ) is defined as the ratio of the number of
fluorescing molecules to the number of excited molecules.

40
Kf
φ = ___________________ Kf + Kisc + KVR + Kx Where Kf, Kisc, KVR and Kx are rate constants for fluorescence,
intersystem crossing, vibrational relaxation, and any other deactivation process, respectively. As φ becomes close to 1, the system is considered an efficient fluorescing system. Conditions should be adjusted to increase the quantum efficiency.
Factors Affecting Fluorescence Efficiency There are several factors that contribute to fluorescence efficiency.
Some of these factors can be controlled and optimized by the analyst while others are inherent and can be used to explain emission behavior. The most important factors are summarized below:
1. π System As ε for π − π* transition is maximum, it is advantageous that a
fluorescer contain π system and preferably an aromatic ring (s). 2. Structural Rigidity Collisional deactivation is a major fluorescence quenching
mechanism. Therefore, molecules possessing rigid structures are better fluorescers than others which lack rigidity. This explains why fluorene is an excellent fluorescer while biphenyl is a weak one.
3. Solvent Polarity Polar solvents increase fluorescence efficiency since the energy for
π − π* transition is lowered and may become less than n − π* transition leading to increased absorption, and thus emission.
4. Temperature As temperature is increased, the translational, rotational and
vibrational motions of molecules increase. This increases the possibilities of collisions and lead to collisional deactivation and quenching of fluorescence. Therefore, it is always wise to conduct fluorometric measurements at low temperatures.
5. Nonbonding Electrons

41
Molecules that contain lone electron pairs (nonbonding electrons) tend to be weaker fluorescers. This is because n electrons increase intersystem crossing and thus decrease fluorescence.
6. Dissolved Oxygen and Heavy Metals Molecular oxygen is paramagnetic which increases intersystem
crossing through triplet - triplet interaction. Oxygen is thus a good fluorescence quencher and is sometimes determined by its quenching characteristics.
Heavy metals also increase intersystem crossing leading to decreased fluorescence. This is most obvious with paramagnetic heavy metals.
7. Viscosity Collisional deactivation can significantly be decreased in viscous
systems which result in better quantum efficiencies. Therefore, it is a good practice to add some viscosity modifiers, especially chemical surfactants. Excellent fluorescence efficiencies were obtained when appropriate concentrations of surfactants were used.
8. pH Usually, fluorescers that contain either acidic or basic moieties have
fluorescence quantum yields dependent on pH. The pH of these substances should be adjusted so that maximum fluorescence is obtained.
Performing a Measurement The first pieces of information necessary are the excitation and
emission wavelengths. The excitation and emission wavelength selectors should be adjusted to these wavelengths before running a measurement. If they are unknown the following procedure should be followed:
a. Excitation Wavelength Selection Adjust the emission monochromotor to some certain wavelength and
scan the excitation monochromator. This gives the excitation spectrum. Choose the wavelength that yield maximum signal and use as the excitation wavelength.
b. Emission Wavelength Selection

42
Adjust the excitation monochromator to the wavelength that gives maximum signal (obtained in a) and scan the emission wavelength. The resulting spectrum is the emission spectrum and the emission monochromator should be adjusted to the wavelength that yields maximum signal. This is the emission wavelength.
Chemiluminescence
Some reactions yield luminescence without external light excitation, instead chemical energy is utilized for the excitation of the luminescent compounds. As the excited compound returns to ground state, it emits radiation that can be measured using a sensitive photomultiplier tube. Chemiluminescence is one of the most sensitive spectroscopic analytical methods. Reports show that detection limits in the nano M levels are routine while femto molar concentrations are possible. Measurements are also performed against zero background which adds to the good features of this technique. However, cautious work and addition of exact volumes of reagents are vital.

43
Experiment 7: The Fluorometric Determination of Acetylsalicylic Acid in an Aspirin Tablet. Background
Acetylsalicylic acid is the analgesic (pain reliever) which is found in aspirin tablets. In addition to acetylsalicylic acid, some aspirin tablets contain other ingredients such as binders and buffering agents. In the experiment, a portion of an aspirin tablet is dissolved in water and converted to salicylate ions by the addition of sodium hydroxide.
The salicylate ion strongly fluoresces at about 400 nm after it has been excited at about 310 nm. A series of standard solutions of the salicylate ion are prepared; the fluorescence of the standards and the samples are measured; and the working curve method is used to determine the concentration of salicylate ion in the sample solutions. The concentration is used to calculate the percentage of acetylsalicylic acid in the aspirin. Chemicals and Reagents a. Provided
1- Aspirin tablet. 2- 100 ppm stock solution of salicylic acid. 3- Sodium hydroxide solution (1 M).
Apparatus
1. Fluorometer or Spectrofluorometer. 2. Quartz cells (standard 1 cm path length)
Procedure:

44
1. Obtain an aspirin tablet from the instructor.
2. Place the tablet in a clean, dry mortar. Use a clean pestle to grind the tablet
into a powder. Weigh 0.005 g of the powder to the nearest 0.001 mg into a
100-mL beaker dissolve sample in hot water (80 0C).
3. Fold a piece of filter paper and place it in a glass funnel. Place the funnel in
the top of a 100 mL volumetric flask. Allow the solution which flows through the
funnel to drain into the volumetric flask.
4. Dilute the solution to the mark with room-temperature distilled water.
5. Take 1 ml of the previous solution and put into a 100 mL volumetric flask then
dilute to the mark using distilled water.
6. Prepare exactly 1 ppm solution of salicylic acid from a stock solution provided
from the instructor.
7. Respectively label nine, 50-mL volumetric flasks with B, U1, U2, U3, 1, 2, 3, 4,
and 5.
8. Use a pipet to deliver 2 mL of 1 M sodium hydroxide solution to each of the
nine flasks. Use pipets to add 1, 2, 3, 4, and 5 mL, respectively, of the
salicylic acid stock solution to the 50-mL volumetric flasks which are labeled
1, 2, 3, 4, and 5.
9. Use a pipet to place 5 mL of the 100mL dilute tablet solution (unknown) into
each of the flasks which are labeled U1, U2, and U3. Fill each flask to the
mark with distilled or deionized water.
10. If a spectrofluorometer is to be used for the fluorimetric measurements,
adjust the monochromator which controls the excitation wavelength to 310
nm and adjust the monochromator which controls the emission wavelength to
400 nm.
11. Fill a cuvette with the well-stirred solution in one of the nine, 100-mL
volumetric flasks. Place the cuvette in the fluorometer. Measure and record
the relative fluorescence of the solution. The instructor will provide the
operating instructions for the flourometer.
12. Similarly measure and record the relative fluorescence of each of the
remaining eight solutions. Measure the blank solution at least three separate
times so that you may calculate a standard deviation for the blank.
Calculations:

45
1. Use the volumes of the stock solutions which were added to the 50-mL
volumetric flasks to calculate the concentrations in ppm of salicylate ion
which are in flasks 1, 2, 3, 4, and 5.
2. Prepare a working curve by plotting the relative fluorescence of the solutions
which are in flasks B, 1, 2, 3, 4, and 5 (y axis) as a function of the
concentration of salicylate ion in each flask.
3. From the working curve determine the concentration of salicylate ion which is
in flasks U1, U2, and U3.
4. Use the dilution factors (10 x 100) to calculate three values for the mg of acetylsalicylic acid in the 50 mL unknown solutions (U1, U2, and U3) as follows:
- mg salicylate ion = Reading (mg salicylate ion/1000 ml ) x 50 ml x (10 x 100). - mg acetylsalicylic acid = mg salicylate ion x (180.16/138.13).
5. Use the three acetylsalicylic acid concentrations and the mass of the tablet
which was used to prepare the solution to calculate three values of the
percentage of acetylsalicylic acid in the tablet as follows:
(mg acetylsalicylic acid/ mg aspirin sample) x 100.
6. Determine the mean and standard deviation of the results.

46
CHAPTER FOUR REFRACTIVE INDEX
Theory.
The speed of light in a vacuum is always the same, but when light moves through any other medium it travels more slowly since it is constantly being absorbed and reemitted by the atoms in the material. The ratio of the speed of light in a vacuum to the speed of light in another substance is defined as the index of refraction (refractive index or n) for the substance.
Refractive index of substance = Speed of light in vacuum/Speed of light in substance
Whenever light changes speed as it crosses a boundary from one medium into another its direction of travel also changes, i.e., it is refracted (Figure 1).
Figure 1. Light crossing from any transparent medium into another in which it has a different speed, is refracted, i.e., bent from its original path (except when the direction of travel is perpendicular to the boundary). In the case shown, the speed of light in medium A is greater than the speed of light in medium B.
(In the special case of the light traveling perpendicular to the boundary there is no change in direction upon entering the new medium.). The relationship between light's speed in the two mediums (vA and vB), the angles of incidence (θA) and refraction (θB) and the refractive indexes of the two mediums (nA and nB) is shown below:

47
A
B
B
A
B
A
nn
SinSin
VV
==θθ
Thus, it is not necessary to measure the speed of light in a sample in order to determine its index of refraction. Instead, by measuring the angle of refraction, and knowing the index of refraction of the layer that is in contact with the sample, it is possible to determine the refractive index of the sample quite accurately. Nearly all refractometers utilize this principle, but may differ in their optical design.
In the Abbe' refractometer the liquid sample is sandwiched into a thin layer between an illuminating prism and a refracting prism (Figure 2). The refracting prism is made of a glass with a high refractive index (e.g., 1.75) and the refractometer is designed to be used with samples having a refractive index smaller than that of the refracting prism. A light source is projected through the illuminating prism, the bottom surface of which is ground (i.e., roughened like a ground-glass joint), so each point on this surface can be thought of as generating light rays traveling in all directions. Inspection of Figure 2 shows that light traveling from point A to point B will have the largest angle of incidence (αmax) and hence the largest possible angle of refraction (βmax) for that sample. All other rays of light entering the refracting prism will have smaller α and hence lie to the left of point C. Thus, a detector placed on the back side of the refracting prism would show a light region to the left and a dark region to the right.
Figure 2. Cross section of part of the optical path of an Abbe refractometer. The sample thickness has been exaggerated for clarity.
Samples with different refractive indexes will produce different angles of refraction (see

48
the previous Equation and recall that the angle of incidence and the refractive index of the prism are fixed) and this will be reflected in a change in the position of the borderline between the light and dark regions. By appropriately calibrating the scale, the position of the borderline can be used to determine the refractive index of any sample. In an actual Abbe' refractometer there is not a detector on the back of the refracting prism, and there are additional optics, but this is the essential principle.
In most liquids and solids the speed of light, and hence the index of refraction, varies significantly with wavelength. (This variation is referred to as dispersion, and it is what causes white light moving through a prism to be refracted into a rainbow. Shorter wavelengths are normally refracted more than longer ones.) Thus, for the most accurate measurements it is necessary to use monochromatic light. The most widely used wavelength of light for refractometry is the sodium D line at 589 nm.
If white light were used in the simple Abbe' refractometer optics shown in Figure 2, dispersion would result in the light and dark borderline being in different places for different wavelengths of light. The resulting "fuzziness" of the borderline would make precise work impossible. However, many Abbe' refractometers are able to operate satisfactorily with white light by introducing a set of "compensating prisms" into the optical path after the refracting prism. These compensating prisms are designed so that they can be adjusted to correct (i.e., compensate for) the dispersion of the sample in such a way that they reproduce the refractive index that would be obtained with monochromatic light of 589 nm, the sodium D line.
As mentioned earlier, the speed of light in a substance is slower than in a vacuum since the light is being absorbed and reemitted by the atoms in the sample. Since the density of a liquid usually decreases with temperature, it is not surprising that the speed of light in a liquid will normally increase as the temperature increases. Thus, the index of refraction normally decreases as the temperature increases for a liquid. For many organic liquids the index of refraction decreases by approximately 0.0005 for every 1°C increase in temperature. However for water the variation is only about -0.0001/°C.
Many refractometers are equipped with a thermometer and a means of circulating water through the refractometer to maintain a given temperature. Most of the refractive index measurements reported in the literature are determined at 20 or 25 °C.
A refractometer measures the extent to which light is bent (i.e. refracted) when it moves from air into a sample and is typically used to determine the index of refraction (refractive index or n) of a liquid sample. The simple readout from the scale of refractometer then provides the refractive index directly, or it can be readily determined using a conversion table.

49
The refractive index is a unitless number, between 1.3000 and 1.7000 for most compounds, and is normally determined to five digit precision. Since the index of refraction depends on both the temperature of the sample and the wavelength of light used these are both indicated when reporting the refractive index:
The italicized n denotes refractive index, the superscript indicates the temperature in degrees Celsius, and the subscript denotes the wavelength of light (in this case the D indicates the sodium D line at 589 nm).
The refractive index is commonly determined as part of the characterization of liquid samples, in much the same way that melting points are routinely obtained to characterize solid compounds. It is also commonly used to:
• Help identify or confirm the identity of a sample by comparing its refractive index to known values.
• Assess the purity of a sample by comparing its refractive index to the value for the pure substance.
• Determine the concentration of a solute in a solution by comparing the solution's refractive index to a standard curve.
Typical Range of Values for Organic Liquids: 1.3400 - 1.5600

50
Applications:
Experiment 8: A. Determining the Refractive Index of Substances. Background
This experiment demonstrates the procedures for determining the refractive index of a liquid compound. This physical measurement can be used as an aid in the identification of a substance and as an indication of its purity. The experiment teaches the operation of the Abbé refractometer.
Chemicals and Reagents a. Provided
Different known and unknown liquids.
Apparatus Abbé refractometers Procedure
1. Use the Abbé refractometer at the designated stations in the laboratory. Follow the
instructions to operate the instrument. Before and after using the refractometer, carefully clean the prisms by wiping with a tissue or a filter paper moistened with methanol. Be very careful not to scratch the prisms.
2. Measure the refractive index of the known compound and write the data directly in
your notebook while you are using the refractometer. Be sure to record the refractive index with the proper precision. Three decimal places can be read, the fourth place is estimated. See Figure 3. If you can’t find the dark/light field demarcation, put a known substance on the prism and set the refractometer readout to match approximately that of the substance. You should then see the field and you can make chromatic and focusing adjustments.

51
1.510 1.520
Figure 3: Example of the refractive index scale from the Abbé refractometer
The refractive index reading at the vertical line is 1.5128. The last digit is estimated, and is “uncertain” .
3. Record the room temperature at which the readings were obtained. The refractive
index varies linearly and inversely with temperature. The temperature correction factor given in textbooks is the average of many such linear analyses. Comment on the correspondence of your measurement, after temperature correction, with the refractive index(es) for the substance from the literature.
NOTE: The thermometers in the lab are very likely to be inaccurate. Your instructor
will determine and post the room temperature in the laboratory using an accurate thermometer. Use this temperature as the temperature at which you determined the refractive index of your sample.
4. Obtain an unknown liquid sample from the instructor. Write the unknown’s label
number in your notebook. Determine the refractive index of the unknown. Identify your unknown from the list of possibilities in Table 1.
Temperature correction factor for the refractive index. Index of Refraction (nD
20) decreases with increasing temperature, i.e., velocity of light in medium increases as density decreases. Measured values of (nD
20) are adjusted to 20 oC. For temp > 20 oC (∆t is positive), i.e., add correction factor. For temp < 20oC (∆t is negative), i.e., subtract correction factor. Temp Correction Factor = ∆t * 0.00045 = (Room Temp – 20) * 0.00045. The following equation automatically accounts for temp correction: nD
20 = nD Rm Temp + (Rm Temp – 20) * 0.00045
Ex: For an observed value of 1.5523 at 16oC, the correction is: nD
20 = 1.5523 + (16 – 20) * 0.00045 = 1.5523 + (-4) * 0.00045 = 1.5505 Note: Instrument can be read to “4” decimal places
Table 1: Possible compounds for refractive index unknowns* Compound
Approximate nD
20 Compound
Approximate nD
20 acetonitrile 1.3436 cyclohexanone 1.4500 propionaldehyde 1.3650 p-xylene 1.4954 acetic acid 1.3719 toluene 1.4963

52
hexane 1.3749 o-xylene 1.5048 dioxane 1.4206 anisole 1.516 cyclohexane 1.4255 chlorobenzene 1.5236 cyclohexene 1.4465 Water 1.33283 Ethanol 1.3614
B) The determination of the refractive index of a methanol-ethanol solution.
The task consists of the determination of the refractive index of methanol (CH3OH), ethanol (CH3CH2OH) and their mixtures described by the volumetric percentage of methanol (V% CH3OH). The measurement results into calibration curve (refractive index as a function of (V% CH3OH). This curve will be then used to determine the composition of an unknown mixture of methanol and ethanol. a. Provided 1. Different mixtures of methanol and ethanol at known compositions 0%, 10%, 30%, 50 %, 70%, and 100 % (as V % CH3OH). 2. Mixtures of methanol and ethanol at an unknown compositions.
b. Appartus:
Abbe's refractometer. Procedure: 1. Turn on the light source. 2. Open the double-prism of the refractometer, clean both glass surfaces with a filter
paper, and close the double-prism. 3. Use a pipet to fill the space between the two prisms with methanol. 4. Turn the refractometer scale knob to get a clear interface between the illuminated and
dark regions. 5. Use the micrometric screw for the additional refinement of the scale, until the clear
interface appears. 6. Read out the integer value from the rough scale and decimal number from the refined
scale. Determine the index of refraction . 7. Open the double-prism and dry out glass surfaces using the filter paper. Repeat the
measurement for all methanol/ethanol mixtures of known and unknown compositions. 8. Use MS Excels to create a calibration curve (i.e. dependence n = f (v% CH3OH)). Fit
the experimental points with a straight line and write down its coefficients. 9. Determine the composition of an unknown solution using its refractive index and the
calibration curve. C. Determination of oBrix Value

53
°Brix is the measurement in percentage by weight of sucrose in pure water solution. This designation of °Brix is only valid for pure sucrose solutions. Pure sucrose is extract from sugar-cane or sugar-beet. High Fructose Corn Syrup (HFCS) is a liquid sweetener that is extracted from cornstarch containing mainly Fructose and D-Glucose. HFCS is used to replace sucrose in the beverage and food industries. HFCS is available in three different fructose levels HFCS 42%, 55% and 90% weight percent. For samples containing sucrose or HFCS, the measurement of °Brix is done to obtain the solid component of sugar. °Brix is defined as grams sucrose per 100 grams of a pure sucrose-water solution. For sugars other than sucrose, it is called the "apparent °Brix" and is always a relative value. a. Provided 1. Different unknown solution containing sugar including some soft drinks.
b. Appartus:
Abbe's refractometer. Procedure.
1. Follow the previous instructions to operate the refractomtere. 2. Use one drop of the unknown solution and get a clear interface between the dark
and light regions. 3. The lower scale is designed to give the oBrix value directly.

54
CHAPTER FIVE
HIGH PERFORMANCE LIQUID CHROMATOGRAPHY It was a long history before real high performance liquid
chromatography (HPLC) had evolved. The very first indication of a chromatographic separation was introduced in 1903 by the Russian botanist M. S. Tswett on the separation of plant pigments using powdered calcium carbonate. However, it was not before 1965 that modern HPLC was developed. The main reason was a technological one were high pressure pumps, well packed columns and sensitive detectors with extremely low volume flow cells were necessary.
Chromatography versus Extraction It is a common practice to start with simple extraction process as
an introduction to chromatography. When a solute is distributed between an organic phase and an aqueous
phase, the distribution constant (K) can be defined as: Co K = ____ (1) Caq Where Co is the concentration of solute in the organic phase and Caq is
its concentration in the aqueous phase. It is clear that in order to decrease the concentration of solute in the
aqueous phase to zero, multiple extractions with new fresh organic phase should be conducted.
Another constant can be defined which is known as capacity
factor. This factor gives the ratio between the amounts of solute in the organic phase to that in the aqueous phase
Co * Vo K' = _________ (2) Caq * Vaq K' is the capacity factor. Vo and Vaq are volumes of the organic and
aqueous phases, respectively. Note that C * V give the number of moles. From equation 1 and 2 it can be shown that

55
K' = K Vo/ Vaq or K' = KVr (3) Where Vr is the phase volume ratio. A third separation constant can now be defined which is known as the
selectivity factor. Assume that two solutes are present in solution, the selectivity factor ( α ) can be written as
α = K1 / K2 = K1'/ K2
'
There will be no possible separation if α = 1. As α is different from 1 it is possible to separate the two solutes by extraction, and thus by chromatography.
Chromatography is very similar to situations mentioned above, i.e.
the presence of the two phases. However, in chromatography one phase is fixed and called the stationary phase and the other is moving and called the mobile phase. Since one phase is fixed and the other is moving, the separation process in chromatography is a dynamic one. Solutes interact with both phases which is the main reason for selective separation because different solutes interact differently.
Chromatographic Methods Depending on the nature of the stationary and mobile phases,
several types of chromatography can be described. Only the very important ones will be briefly discussed.
1. Liquid - Solid Chromatography (LSC) The stationary phase is a solid usually silica or alumina or some
modification of either one. These contain polar groups like - OH groups. The mobile phase is a liquid, usually of low to moderate polarity. Depending on the adsorption characteristics of solutes on the stationary phase, chromatographic separations can take place. It should be emphasized that stationary phases should have high surface area to allow for good separations.
2. Liquid - Liquid Chromatography (LLC) In this type of chromatography, both phases are liquids. The
stationary phase is physically coated on a solid support (inert support). Partitioning of solutes between the two immiscible phases

56
is the basis of separation. This is very similar to extraction except for the dynamic nature of chromatography. You should be able to guess that bleeding of the liquid stationary phase will definitely be a major problem.
3. Ion - Exchange Chromatography (IEC) The stationary phase in IEC is a solid that contains ionic sites.
Ions are adsorbed to these ionic sites and are retained in the column differently, depending on the adsorption strength. IEC is used for the separation of ionic compounds.
4. Size Exclusion Chromatography (SEC) This chromatographic technique is used for the separation of
solutes according to their molecular size. The stationary phase is an inert solid which contains pores in the particles of the packing. Usually, large molecules elute first while smaller solutes tend to go through the pores and require more time to leave the column.
5. Bonded - Phase Chromatography (BPC) In this type of chromatography, the stationary phase is chemically
bonded to the solid support. The most widely used stationary phase is a linear chain C18 moiety. Other forms like C8 are also available. The mobile phase is, of course, always a liquid that can be more polar or less polar than the stationary phase. Sometimes, the stationary phase may be modified so as to include side chain - NH2 or - CN group. Two techniques can be mentioned according to polarity of the mobile phase:
a. Reversed-Phase Liquid Chromatography (RPLC) The mobile phase, in this case, is more polar than the stationary
phase. This mode of chromatographic separations is the most important and the most widely used. Detailed theoretical background of chromatographic separation concepts will be developed for this type of separation techniques.
b. Normal-Phase Liquid Chromatography (NPLC) The mobile phase, in this case, is less polar than the stationary
phase. It is not widely used although excellent for some types of separations.
Retention in Chromatography

57
Differential migration of solutes through the chromatographic
column is the basis of separation. Solutes tend to migrate in different rates through the column due to different distribution constants. It is always a good practice to relate migration to affinity of a solute towards stationary or mobile phase. When a specific solute has higher affinity towards the stationary phase than the mobile phase, the solute will be retained in the column for a longer time than a solute of lower affinity towards the stationary phase. Figure 1 shows a chromatogram of one solute
t R
t o
Retention time
Sig
nal
Figure 1: Retention time Retention time = tR - to (5) tR is the retention time of solute at the peak maximum and to is the
retention time of unretained solute and is called dead or void time. Retention Volume (VR) This parameter is a measure of the volume of mobile phase
required for the elution of a specific solute. When the flow rate of the mobile phase is expressed in mL/min and the retention time of a solute is tR, then
VR = tR * X (6) Where X represents the flow rate The void volume can be written as Vo = to * X (7)

58
And the net retention volume is VR (net) = X (tR - to) (8) Instrumentation Description of HPLC instrumentation is very simple. A good high
pressure pump equipped with good pulse dampers is used for mobile phase delivery. A loop valve injector is used for sample introduction into the chromatographic column (the heart of HPLC system) where separation takes place. The effluents pass through a microflow cell placed inside a suitable detector. Detectors can be UV, Vis, fluorescence, electrochemical, refractive index, or a specially designed mass spectrometer. Figure 4 shows a schematic of a typical HPLC system.
P I C
D Waste
Figure 4: A schematic of a typical HPLC system. p, Pump ; I, injector, C, column ; D, detector. A schematic of a loop valve injector is shown in Figure 5. Refractive index (RI) detectors find excellent applications. The
most widely used indicators are UV and RI detectors while analytical columns that are 5, 10, 15 and 25 cm long and 4.6 mm in

59
diameter are the most frequently used dimensions with the 15 and 25 cm long being the most widely used in analytical applications. Other dimensions are also available but of limited advantages and are used for some specific applications.
Inject
Pump
To Column
Inject
WasteWaste
Pump
To Column
(a) (b) Figure 5: A schematic of a loop valve injector. (a) Loading the
sample into the column, (b) Filling the loop valve with sample. Qualitative and Quantitative Analysis Qualitative analysis is possible by injection of standards and
comparison of the retention times obtained. Usually, the components of a sample are known but separation of these components from each other and determination of their quantity is the most likely required information. Quantitative determination of a particular component can be achieved by several methods ranging from manual to digital integration procedures. Peak height or area is the most widely used factors for comparison with standards in order to determine the amount of an unknown component concentration. Peak area can be determined by multiplication of peak height times half the peak width at the base line or peak height times peak width at half height. Usually, precision exceeding 5% are achieved using any of the methods mentioned above. However, precisions better than 1% can be obtained when electronic digital integrators are used for calculation of peak area.

60
Applications Experiment 9 : A Study of Chromatographic Variables. Background There are some factors that can be altered in a chromatographic
experiment in order to achieve better separations. Apart from the extreme thinking of changing the stationary phase (i.e. column type), a good selection of some easily controlled parameters can serve the same purpose. Definitely, flow rate is one parameter and, in many cases, of more importance is the composition of the mobile phase and its strength. Temperature plays a significant role and its effects may be investigated. Gradient elution (changing the strength of the mobile phase in the course of the separation) can be an excellent alternative in many situations where chromatograms of excellent shapes may be achieved.
Chemicals and Reagents a. Provided 1. Acetonitrile, HPLC grade. 2. Benzene derivatives (standards and unknown). b. Need Preparation 1. Standards of the benzene derivatives provided (50 mg /mL) in the
mobile phase. 2. 30:70 Acetonitrile:water mobile phase. Apparatus 1. Two HPLC pumps with suitable injector. 2. C18 HPLC Column. 3. UV Detector. 4. 1/16" Tubing and fittings 5. Chart recorder or integrator. 6. HPLC syringe (0 - 50 µL). Procedure 1. Assemble the HPLC apparatus as directed by your instructor, fix
the sample loop, and assure leakage free status. 2. Flush the system with the mobile phase at 2 mL/min for about 15
min then adjust the flow rate at 1 mL/min.

61
3. Inject the sample (as directed by your instructor) and record the chromatogram at 254 nm.
4. Inject each standard separately, in a time, using the same conditions and identify your sample, from the retention time data obtained.
5. Repeat step 3 but use flow rates of 0.25, 0.50, 0.75, 1.25, 1.50, and 2.00 mL/min. the pressure should not exceed 2000 psi in all cases.
6. Fix the flow rate at 1 mL/min and change the composition of the mobile phase as 0, 5, 10, 20, 40, and 80 % acetonitrile and record the resulting chromatograms.
7. Using information obtained in step 6 and, select a gradient of acetonitrile and water mixture so as to obtain the best possible separation.
8. Report your observations from steps 5-7. What are your conclusions?
9. Repeat step 3 with the column thermostatted at 40 oC and 50 oC in addition to room temperature. Always allow about 20 min for equilibration temperature to be reached.

62
Experiment 10: HPLC Determination of Saccharin, Benzoic Acid, and Caffeine
Background Soft drinks usually contain appreciable amounts of saccharin
(artificial sweetener), benzoic acid (preservative), and caffeine. Determination of all these species is possible by HPLC separation on a C18 column and UV detection at about 250 nm. The method is relatively fast, simple, and produces excellent results.
Chemicals and Reagents a. Provided 1. Glacial acetic acid. 2. Methanol. 3. Saccharin. 4. Benzoic acid. 5. Caffeine. b. Need Preparation 1. Acetic acid in water, 5 % (V/V). 2. Methanol in water, 50 % (V/V). 3. 50 mg/mL of saccharin, benzoic acid, and caffeine. Apparatus 1. HPLC pump and injector. 2. C18 Column. 3. UV Detector. 4. 1/16" Tubing and fittings. 5. Chart recorder or integrator. 6. HPLC syringe (0 - 50 µL). Procedure 1. Assemble the HPLC system as directed by your instructor and fix
the sample loop. 2. Flush the column for about 15 min at 2 mL / min with the 5 %
acetic acid solution till a stable base line is obtained. 3. Inject your sample and record the resulting chromatogram at 250
nm. 4. Inject your standards, one in a time, and record the resulting
chromatograms. All settings should be kept the same as in step 3.

63
5. Compare your chromatograms of the standards and sample and determine which is which.
6. Determine the concentration of each component from the corresponding peak area.
7. When you are done, flush the column with the 50 % methanol solution for 20 min (2 mL/min ), and turn the system off.
8. Report your results as ppm of each analyte in the original sample.

64
CHAPTER SIX
POTENTIOMETRIC METHODS Potentiometric methods are concerned with the measurement of
potential as a function of analyte activity or concentration. The basic principles of potentiometry will be discussed later through the text in details but some introductory information may be necessary at this point.
Oxidation - Reduction Reactions Look at a zinc electrode immersed in a solution of zinc sulfate.
Zinc will tend to dissolve forming more Zn2+ in solution Zn (s) = Zn2+ + 2 e (1) Electrons will be accommodated within the metallic bond of the
zinc metal and the zinc electrode will acquire a negative potential. In equation 1, the oxidation number of zinc has increased and the
process is termed an oxidation process. The reverse of the behavior described above is observed when a
copper electrode is immersed in a solution of copper (II) sulfate. Cu2+
ions tend to deposit on the copper electrode as solid copper atoms, by gaining 2e each as in equation 2
Cu2+ + 2e = Cu (s) (2) This is a reduction reaction since the oxidation number on Cu2+ has
decreased to zero in Cu (s). The copper electrode will increase in weight and acquire a positive potential.
Electrochemical Cells There are two types of electrochemical cells in the concept whether the cell generates potential (called a galvanic cell) or consumes potential (called an electrolytic cell). A cell is simply constructed from two electrodes immersed in solution. The electrode at which reduction occurs is called the cathode (-) while that at which oxidation occurs is called the anode (+).

65
Figure 1: A schematic representation of an electrochemical cell (Zinc is the cathode and copper is the anode) The cells we will study in this chapter are of the first type where electrons generated by one half reaction will be consumed by the other half reaction forcing the current to flow.
Calculating the Cell Potential The process of calculating the cell potential is simple and involves calculation of the potential of each electrode separately, then the overall cell potential can be determined from the simple equation:
Ecell = Ecathode - Eanode (3)
Ecell = EZn 2+/Zn (s) - ECu2+/Cu (s) (4) Sometimes, this relation is written as: Ecell = Eright – Eleft This is true since the convention is to place the cathode to the right of the cell while the anode is placed to the left of the cell. If the Ecell is a positive value, the reaction is spontaneous and if the value is negative, the reaction is nonspontaneous in the direction written and will be spontaneous in the reverse direction. Note that electrode potentials are always written as reductions.
Electrode Potentials It should be clear that the cell mentioned above can be looked at as
two separate half cells. The first half cell is the Cu2+/Cu (s) (anode)
VVVVoltmeter
(-) Cathode Anode
(+)
Semipermeable barrier

66
and the other is the Zn(s)/Zn2+(cathode). For comparative purposes, all reduction potentials are written for the reduction process.
Separate electrode potentials can be found by comparison with a
reference standard hydrogen electrode (SHE) that is given an arbitrary zero value. The unknown half cell is made as the anode and is placed to the right of the SHE half cell which is placed to the left as in Figure 2.
Voltmeter
(a=1.0 M)
(a=1.0 M)
H
1 atm2
H+
Mn+
M
Pt
Figure 2: Diagrammatic cell for measurement of standard electrode
potential. Since the standard electrode potential for the SHE is zero, the
potential displayed by the potentiometer is a direct measure of the standard electrode potential (Es).
Cell Representation and Spontaneity For the purpose of saving time and effort, a simple method is used
to represent potentiometric cells where the representation starts with the cathode and end up with the anode, passing through the different solutions and the salt bridge. The cell in Figure 1 can be written as
Zn (s) / Zn2+(a = 1.0 M) // Cu2+(a = 1.0 M) / Cu (s) Where the single vertical line represents a phase boundary and
double parallel lines represents the salt bridge. In some cases, a semipermeable barrier is used rather than a salt bridge; this is represented by a dashed vertical line.

67
The cell in Figure 2 can be represented as Pt/ H2 (1 atm), H+(a = 1.0 M)// Mn+(a = 1.0 M)/M (s) The reaction will occur spontaneously when Es (cell) is positive while
it will proceed in the reverse direction when Es (cell) is negative according to the equation for the standard free energy, ∆Gs
∆Gs = - nFEs Negative Gs Values indicate a spontaneous reaction while positive
values indicate reactions in reverse direction. Liquid Junction Potential When a semipermeable membrane or barrier separates two
solutions of different concentrations, the more concentrated solution tends to diffuse through the barrier occording to Le Chatelier principle.
If it is the case where mobilities of the positive ions are different from those of the negative ions; then a potential difference between the two solutions is developed. Figure 3 shows an example for this behavior using more concentrated HCl solution to the left of the semipermeable barrier.
Cl- I H+
Cl- I H+
Cl- I H+
Cl- I H+
------->
Figure 3: Development of liquid junction potential. Since H+ ions have much higher mobilities than Cl- ions, more H+
ions will cross the barrier than Cl- ions in a certain time which results in the development of the liquid junction potential. This type of potential is most encountered when the system involves H+ ions. It is for the sake of decreasing liquid junction potential that KCl is used in salt bridges. K+ ion have comparable mobilities to Cl- ions.
The Nernst Equation Standard electrode potentials are measured when the activity of the
oxidized form equals 1.00 M. If the activity of the oxidized form is different from 1.00, an electrode acquires a different potential. This potential can be determined from the very useful Nernst equation.

68
2.303RT a red E = Es - _______ Log _____ (5) nF aox Where ared and aox are activities of the reduced and oxidized forms,
respectively. R is the gas censtant (8.314 J K-1 mol-1), T is the temperature
expressed in Kelvin, F is the Faraday constant (9.6484 x10⁴ C mol-1), and n is the charge on the ion of interest.
For example, when Zn(s) is immersed in a Zn2+ solution that is 0.01
M, the potential can be calculated as 2.303 RT a(Zn (s)) E = Es(Zn2+/Zn(s)) - __________ log _________ 2 F a(Zn2+) 2.303 RT 1 E = - 0.763 - ____________ log ______ 2 F 10-2
2 x 2.303 RT E = - 0.763 - ________________ 2F Depending on temperature, the value of the electrode potential can
be determined at an activity of 0.01 M Zn2+. Note that the activity of any substance present at its standard state is given the value of 1. Also, note that when the activity of Zn2+ is 1.0 M then the value of the electrode potential becomes the same as the value of the standard electrode potential because the log term becomes zero.
The Nernst equation can be used for the calculation of the potential
of each half cell. Combination of the two half cell potentials yields the overall cell potential. This is the point of interest in doing potentiometry because simple effort and manipulation of the various conditions will lead to very valuable quantitative data, as will be discussed below.
Consider the conventional cell which was referred to in previous
sections: Zn (s) / Zn2+ (a = x) // Cu2+(a = y) / Cu (s)

69
The Nernst equation for each half cell can be written 2.303 RT 1 EZn
2+/Zn = Es(Zn2+/Zn) - _________ log ___ (6) 2F X 2.303 RT 1 ECu
2+/Cu = Es(Cu2+/Cu) - _________ log ___ (7) 2F Y Equations 6†and 7 can be combined yeilding equation 8 since Ecell = Eright - Eleft 2.303RT Ecell = Es(Cu2+/Cu) + _________ log Y - EZn
2+/Zn (8) 2 F The idea of potentiometric methods rely on fixing the potential of one
half cell (by fixing the activity) and measuring the activity of the ion in question. Therefore, if the activity of Zn2+ is kept constant, EZn
2+/Zn will be constant. Combination of Es (Cu2+/Cu) and EZn
2+/Zn into one constant E' allows for the determination of the Cu2+ activity (Y) as shown in equation 9.
2.303 RT Ecell = E' + _________ log Y (9) 2 F Only Y (Cu2+ activity) is the factor that affects the value of Ecell.
At least two measurements of Ecell at different Y values are required to determine Y. However, it is a routine work to construct a calibration plot and then determine the unknown activity from the curve rather than direct calculation using two points only.
Ion - selective electrodes are based on this principle where a
general equation for the calculation of the activity of ions can be written as:
2.303 RT Ecell = E' + _________ log ai (10) n F Where ai is the activity of ion i. The pre log term can be written as 0.0591/n at 25 oC (298K). If Ecell
is plotted versus log ai, a straight line is obtained, the slope of which is 0.0591/n. Therefore, electrodes which yield comparable slopes to

70
this value are said to have Nernstian response while others which give slopes below 0.054/n are said to have either sub-Nernstian response or unaccepted performance.
The Glass pH Electrodes Several types of ion-selective electrodes (ISE) had been developed.
Among these is the very famous glass pH electrode which responds to H+ concentration. The glass pH electrode is composed of two reference electrodes one called the internal reference electrode which is usually an Ag/Agcl electrode. This is placed in a glass tube the bottom of which is a thin glass bulb containing 1M HCl. The second reference electrode can also be an Ag/AgCl electrode dipped in a saturated KCl solution and is called the external reference electrode. This type of configuration is the combined pH electrode. However, the external reference can be completely separated from the glass electrode in a different configuration where a calomel reference electrode can be used. Almost all glass pH electrodes in current use are combined pH electrodes.
2.303 RT Ecell = E* + ________ log aH+ (15) F At 25 oC the pH can be calculated as E* - Ecell pH = __________ (16) 0.0591 E* contains all contributing potentials like liquid junction potential,
asymmetry potential, reference electrode potential and others.

71
Applications: Experiment 11: Potentiometric Derivation of Acid-Base Titration
Curve. Background Titration of weak acids with strong bases, and vice versa, is
routinely conducted using potentiometry. The pH is measured through the course of the titration by a pH meter. The number of acidic protons in the acid can be determined from the amount of acid and volume of base consumed in the titration process. The molecular weight and ionization constant(s) may also be determined from results of such an experiment.
Chemicals and Reagents a. Provided 1. Predried and desiccated acid unknown. 2. Approximately 5 M NaOH solution. 3. Approximately 2 M HCl solution. 4. Predried and desiccated potassium hydrogenphthalate (KHP). 5. Calibration buffer solutions (pH = 4.00 and 7.00). b. Need Preparation 1. 250 mL of standard NaOH that is about 0.1 M. Dilute the stock
NaOH solution provided and standardize against KHP. Method: Transfer approximately 0.6 g of the predried and desiccated
KHP (accurate weight) into a 250 mL conical flask, dissolve in about 50 mL of distilled water and titrate against dilute NaOH solution to the phenolphthalein end point.
2. Dissolve about 1.5 g of the unknown (accurate weight) in distilled water, transfer into a 250 mL volumetric flask and adjust to volume using distilled water.
Apparatus and Materials 1. pH Meter. 2. Combined pH electrode. 3. Magnetic stirrer. 4. Stirring magnet.

72
Caution: Glasss electrodes are fragile, therefore do not jam the electrode into the bottom of the beaker and allow no possibility for the stirring bar to hit it.
Procedure 1. Follow instructions from your supervisor on the procedure for the
correct operation and calibration of the pH meter available in the laboratory.
2. Transfer, exactly, 50 mL of the unknown weak acid sample into a 250 mL beaker, dilute to about 100 mL, drop a stirring bar and place the beaker on the magnetic stirrer.
3. Immerse the combined glass electrode into the solution and start the magnetic stirrer at a suitable rate. Record the initial pH.
4. Start addition of the NaOH standardized solution from the buret and record the pH after each addition of 1 mL increments of the base.
5. When the pH starts to increase significantly with NaOH addition, allow dropwise addition of NaOH and record the pH after each addition.
6. After the rate of change in pH with NaOH addition becomes small again, record the pH values as in step 4.
7. Continue addition of NaOH till the pH meter reads a value of about 12.
8. Report your results and plot the titration curve between pH and volume of NaOH added. Calculate the ionization constant(s) of the acid at 25%, 50%, and 75% of the end point as well as the molecular weight of the acid.

73
CHAPTER SEVEN
CONDUCTOMETRIC METHODS
Solutions that contain ionic species conduct electricity. Positive and negative ions migrate in certain speeds towards electrodes of opposite charges. The conductance is a function in the rate of movement of these ions or the mobilities of both ions, the number of ions present, and the charge on each ion.
Conductance can be defined as the reciprocal of resistance which
means that the conductance of an electrolytic solution is simply the reciprocal of its electrical resistance. Usually, conductance is given the symbol G and given the units of ohm-1 or, in SI units, the siemens (S).
The ability of a solute to conduct electricity is called molar
conductance which is defined in the equation: K Λ = ____ (1) C Where Λ is the molar conductance of 1mde of the solute present in a
cell the electrodes of which are 1 cm apart, C is the concentration in moles per L and K is the specific conductance which is defined from the relation:
A G = K ____ (2) L Where A and L are the cross section area of the electrodes and the
spacing between them, respectively. The specific conductance is constant for a specific cell configuration
and is measured in order to substitute in equation 1 so as to calculate the molar conductance.
Molar Conductance at Infinite Dilution The infinite dilution concept is the situation where the
concentration of a solute becomes infinitely small and the molar conductance is independent on concentration.

74
Two opposing forces act on an ion present in a conductance cell,
the electrical force and the frictional force. Electrical forces tend to force the movement of an ion to the oppositely charged electrode while this is partially hindered by the frictional forces exerted by the solvent molecules which retard ionic mobilities.
Two other forces are especially important at finite solute
concentrations. The first is the electrophoretic force which results from the retardation of the ionic atmosphere by the viscosity of the solvent. The second force is a relaxation force where charged ions surround each ion of opposite charge. When an electric force is applied, the central ion tends to leave the ionic atmosphere and move towards the oppositely charged electrode. At the same time, the counter ions tend to either migrate to the other electrode or to move with the central ion. This results in the distortion of the ionic sphere which is said to relax.
Molar Ionic Conductance The molar conductance of a solute can be broken into two
components: Λ λ λ Where λand λ are the molar ionic conductance of the positive ions
and negative ions,respectively. Since the conductance is dependent on concentration, equivalent
ionic conductance of the different ions is reported at infinite dilution. An equivalent ionic conductance of an ion is defined as its molar conductance divided by the charge on the ion (positive or negative).
Conductometric Titrations The most important uses of conductance in analytical chemistry
are related to conductometric titrations which exhibit excellent features. Instrumentation required are simple where a low cost conductance apparatus is adequate.
Titration of weak acids and bases that are otherwise impossible to
titrate or acid-base system for which no suitable indicators are available are well suited to conductometric titrations. Conductance will be minimal at the equivalence point while high values before and after titrations or at either extreme allow easy location of the equivalence point.

75
Another example of the importance of conductometric titrations are the precipitation and complexometric titrations. Since the conductance of a sparingly soluble compound is minimal, the equivalence point can be easily located. This is significantly important for precipitation titrations of some systems that have no suitable indicators, or complex forming reactions. Conductometric titrations can also be used for mixture analysis where a separate end point is obtained for each component.

76
Applications
Experiment 12: Conductometric Titration of a Mixture of Acetic and
Hydrochloric Acids Background Strong acids, like HCl, are completely dissociated in water and
their conductance decreases as neutralization proceeds. This is because hydronium ions have greater mobilities in solution. However, weak acids show an increase in conductance when titrated with NaOH due to release of ions of greater mobilities. Therefore, titration of a mixture of HCl and acetic acid should be possible by measurement of the relative conductance in the course of the titration.
Reactions
HCl + NaOH = H2O + NaCl CH3COOH + NaOH = CH3COONa + H2O
Chemicals and Reagents a. Provided 1. NaOH solution, approximately 2 M. 2. Predried and dessiccated potassium hydrogenphtalate (KHP). 3. Unknown mixture of HCl and CH3COOH. 4. Phenolphthalein indicator. 5. HCl solution, approximately 2 M. b. Need Preparation 1. 500 mL of standard NaOH that is about 0.1 M. Dilute the stock
NaOH solution provided and standardize against KHP. Method: Transfer approximately 0.6 g of the predried and desiccated
KHP (accurate weight) into a 250 mL conical flask, dissolve in about 50 mL of distilled water and titrate against dilute NaOH solution to the phenolphthalein end point.
2. 250 mL of 0.1 M HCl solution. Dilute the stock HCl provided and titrate against standardized NaOH to the phenolphthalein end point.
Apparatus and Materials

77
1. Electrical conductivity meter. 2. Magnetic stirrer. 3. stirring bar. Procedure 1. Transfer, accurately, 25 mL of the mixture into a 250 mL beaker
and dilute to about 100 mL using doubly distilled water. 2. Drop a stirring bar into the beaker and insert the conductivity cell
into the solution. 3. Start the magnetic stirrer and adjust the rate at a suitable speed.
Record the conductance value. 4. Start addition of the NaOH titrant and record the conductance value
after each addition of 0.5 mL increments till about 30 mL of the base are added.
5. Repeat steps 1 through 4 and record your results. 6. To a fresh 25 mL of the mixture add 40 mL of standard NaOH
(accurate) and dilute to about 100 mL using doubly distilled water. Drop the stirring bar, insert the conductivity cell, and start the magnetic stirrer at a suitable rate. Record the conductance value.
7. Titrate against standard HCl and record the conductance value after each addition of 1 mL increments of the acid.
8. Repeat steps 6 and 7 and record your results. 9. Plot graphs of results obtained from the direct and indirect
titrations, and find the concentration of HCl and CH3COOH in the original mixture.
10. Report your results as g acid/100 mL.

78
CHAPTER EIGHT
NITROGEN DETERMINATION BY KJELDAHL
Basic Principle.
The Kjeldahl method is the standard method of nitrogen determination dating back to its development in the late 1800's. The method consists of three basic steps:
1) digestion of the sample in sulfuric acid with a catalyst, which results in conversion of nitrogen to ammonia;
2) distillation of the ammonia into a trapping solution; and
3) quantification of the ammonia by titration with a standard solution.
The nitrogen of protein and other compounds are transferred into ammonium sulfate by acid digestion with boiling sulfuric acid, the acid digest is cooled, diluted with water, and made strongly basic with sodium hydroxide, the ammonia is released and distilled into a boric acid solution, the ammonia in the boric acid solution is titrated with standardized hydrochloric acid. The steps proceed as follow: 1- N-organic compounds + concentrated H2SO4 → (NH4)2SO4. 2- (NH4)2SO4 + 2NaOH → 2NH3 + Na2SO4 + 2H2O.
H3BO4 → NH4H2BO3 + H2O. 3- NH4OH + 4- NH4H2BO3 + HCl → NH4Cl + H3BO3.
Safety Precautions:
• Handle acid safely: use acid resistant fumehood. Always add acid to water unless otherwise directed in method. Wear face shield and heavy gloves to protect against splashes. If acids are spilled on skin, immediately wash with large amounts of water.
• Sulfuric acid and sodium hydroxide can burn skin, eyes and respiratory tract severely. Wear heavy rubber gloves and face shield to protect against concentrated acid or alkali. Use effective fume removal device to protect against acid fumes or alkali dusts or vapors. Always add concentrated sulfuric acid or sodium hydroxide pellets to water, not vice versa. Concentrated sodium hydroxide can quickly and easily cause blindness. If splashed on skin or in eyes, flush with copious amounts of water and seek medical attention.
• Keep baking soda and vinegar handy in case of chemical spills. • The sulfur oxide fumes produced during digestion are hazardous to breathe. Do not
inhale.

79
• Digests must be cool before dilution water is added to avoid a violent reaction during which the acid can shoot out of the flask. Likewise, the diluted digest must be cool before sodium hydroxide is added to avoid a similarly violent reaction.
Comments:
• Reagent proportions, heat input and digestion time are critical factors - do not change. • Ratio of salt to acid (wt:vol) should be 1:1 at end of digestion for proper temperature
control. Digestion may be incomplete at lower ratio; nitrogen may be lost at higher ratio. Each gram of fat consumes 10 mL sulfuric acid and each gram of carbohydrate consumes 4 mL sulfuric acid during digestion.
• Catalyst mixtures are commercially available in powdered or tablet form. Dispensers are available for convenient delivery of powdered catalyst mixtures.
• Check with local authorities for proper disposal procedures of copper containing waste solution.
• Include a reagent blank and at least one sample of high purity lysine hydrochloride in each day's run as check of correctness of digestion parameters. If digestion is not complete, make appropriate adjustments. A standard, such as NIST Standard Reference Material No. 194, ammonium phosphate (NH4H2PO4), certified 12.15%N should also be included.
Following is a list of acceptable standards available to include in Kjeldahl runs:
Theoretical Yield Standard % nitrogen Ammonium p-toluenesulfonate (Hach 22779-24) 7.402 Glycine p-toluenesulfonate (Hach 22780-24) 5.665 Nicotinic acid p-toluenesulfonate (Hach 22781-24) 4.743 Lysine monohydrochloride (Sigma L-5626 or Aldrich Gold Label) 15.34 Various ammonium salts Diammonium hydrogen phosphate (100% assay) 21.21 Ammonium chloride (100% assay) 26.18 Ammonium sulfate (100% assay) 21.20 Ammonium dihydrogen phosphate (NIST SRM 194) 12.15 Citrus leaves (NIST SRM 1572) 2.86 Urea (NIST SRM 2141) 46.63
The ammonium salts and glycine p-toluenesulfonate serve primarily as a check on distillation efficiency and accuracy in titration steps because they are digested very readily. Lysine and nicotinic acid are difficult to digest, therefore serve as a check on digestion efficiency.
Calculation: Percent Crude Protein (CP). CP (DM basis) = % N (DM basis) X F
• F = 6.25 for all forages and feeds except wheat grains • F = 5.70 for wheat grains.

80
Experiment 13: Nitrogen and Crude Protein Determination by Kjeldahl.
Chemicals and Reagents Provided Kjeldahl flask 100ml, Erlenmeyer flask 100ml, burette 50ml, food (ground plant material), concentrated sulfuric acid, catalyst mixture (80g K2SO4 + 20g CuSO4.5H2O + 0.34g Selenium), 2% boric acid solution, tashiro’s indicator (0.25g methylene blue and 0.375g methyl red in 300ml 95% ethanol alcohol), 50% NaOH solution, Standard HCl solution (0.01N). Apparatus. Micro Kjeldahl apparatus (digestion and distillation units). Procedure. A- Digestion: 1- Weigh 100-150mg of the sample in a cigarette paper using analytical balance. 2- Roll it into a ball and drop into a dry 100ml Kjeldahl flask (run sample and blank). 3- To each flask add 1.5g of the catalyst mixture and 3ml concentrated H2SO4. 4-Heat the flasks on the digestion rack to remove the water, and increase the heat, after
complete clearing, continue heating for 15 minutes. 6- Carefully add 25 ml of water to each of the flasks. B- Distillation: 1- To two 100 ml erlenmeyer flasks put 10ml of 2% boric acid solution. 2- Set these underneath the condenser of the distillation units (the glass delivery tube is
below the surface of the boric acid. 3- To each of the cool Kjeldahl flasks add 15ml of 50% NaOH solution by flowing it
down the wall of the inclined flasks and immediately attach the flasks to distillation setup and turn on the heater.
4- Distillate until about half of the content of the flask has distilled over into the boric acid solution.
5- Lower the platform holding the Erlenmeyer flasks so that the delivery tube is outs of the solution and allow distillation to continue for a minute.
6- Remove the Erlenmeyer flasks after rinsing the outside of the tube with stream 0f distilled water.
C- Titration and calculation: Titrate the ammonia in the boric acid solution with standard 0.01N HCl using 2 drops of tashero’s indicator (the color turns from green to purple through gray).
SampleWtxxxxHClMxVVprotein bS
100010025.614)()(% −
=
Calculate the percentage of crude protein in the air dried sample and on the dry basis.

81