
The Institution of Engineers (India) · The Institution of Engineers (India ... community through...
67
Transcript of The Institution of Engineers (India) · The Institution of Engineers (India ... community through...

The Institution of Engineers (India)8 Gokhale Road, Kolkata 700 020
Phone : +91 (033) 2223-8311/14/15/16, 2223-8333/34
Fax : +91 (033) 2223-8345
Websit : http://www.ieindia.org
e-mail : [email protected]
CHEMICAL ENGINEERING DIVISION BOARD
The Institution of Engineers (India) has established Chemical Engineering Division in the year1961. This Division consists of quite a large number of corporate members from Government,Public, Private sectors, Academia and R&D Organizations.
Various types of technical activities organized by the Chemical Engineering Division include AllIndia Seminars, All India Workshops, Lectures, Panel Discussions etc., which are held atvarious State/Local Centres of the Institution. Apart from these, National Convention ofChemical Engineers, an Apex activity of this Division is also organized each year on aparticular theme approved by the Council of the Institution. In the National Convention,several technical sessions are arranged on the basis of different sub-themes along with aMemorial Lecture in the memory of “Acharya Prafulla Chandra Ray”, the renownedProfessor of Chemistry, which is delivered by the experts in this f ield.In order to promote the research and developmental work taking place in the field ofchemical engineering, the Institution also publishes Chemical Engineering Division Journaltwice in a year, where mainly the researches and its findings are focused.
Due to multi-level activities related to this engineering discipline, this division encompassesthe following emerging and thrust areas:
In order to promote the research and developmental work in the field of ChemicalEngineering, the Institution also publishes Journal of The Institution of Engineers (India):Series E in collaboration with M/S Springer which is an internationally peer reviewed journal.The journal is published twice in a year and serves the national and international engineeringcommunity through dissemination of scientific knowledge on practical engineering and designmethodologies pertaining to chemical and textile engineering.
About the Division Board
Bio-fuels like Ethanol and Bio-diesel towards Energy Security and Environmental Protection, Development of Green Fuels, Clean Coal Technology, Advances in Fuel Cell Technology, Security and Safety of Process Plant Installations and Facilities, Chemical and Bio-sensors, Food Safety and Bio- security, Clean Development Mechanism, Drug Delivery System, Automated Rigorous Monitoring of Process Plants, Bio-degradable Material and Bio-technology for Environmental Protection for Chemical Industry, Chemical Warfare and Preparedness to Face it,Security of Chemical Insulations,Biotechnology applied to Chemical Processes, Advances in Material Sciences: Bio-materials, Use of Nanotechnology in Chemical Engineering Applications,Safety Culture in Chemical Industry,Biomass gasification,Lab on a Chip (Biochemical area),Biosynthesis of Chemicals,Bioinformatics

EditorialI am indeed happy to present the first Annual Technical Volume of the Chemical Engineering Division Board (CHDB) of The Institution of Engineers (India). This is a collection of best papers from our all India seminars, national convention, and other technical evens of topical interest in the discipline organized at the difference centers of the Institution at various locations and depict the status and current trend of development in select sectors of this branch of engineering and technology.
The purpose of bringing out this volume is twofold. The first is to collate the best technical papers emanating from IEI technical events in each of the disciplines to encourage and motivate scientists and engineers through sharing of the knowledge about their work. The second purpose is that the annual technical volume brings out a perspective on the broad fields of research and practice of chemical engineering. It addresses advances in select sectors, with a focus on concepts, old and new materials, and/or processes incorporating interdisciplinary inputs from diverse subjects as biology, physics, and engineering, with development of chemical products and processes as the unifying theme.
This volume has ten selected papers and most of which are from emerging sectors and frontiers in chemical engineering. I am confident that the contents of this volume shall serve as a reference text to researchers, institutions and libraries.
The Division Board acknowledge the valuable contributions of the authors, manuscript reviewers and our editors at the IEI Headquarters to whom and we are grateful to the assistance rendered for so meticulously bringing out of this volume.
Dr MP Sukumaran Nair, FIEChairman, CHDB, IEI
Message from Editor-in-Chief
It is heartening to learn that the Chemical Engineering Division Board of the Institution is successfully bringing out its first Annual Technical Volume as per decision of 126th CATE/682nd Council Meetings held at Pachmarhi, Madhya Pradesh during June, 2014. This volume is a collection of the best papers submitted in various All India Seminars and National Convention organised by different Centres of the Institution in the year 2014.
I congratulate the Chairman and the Members of the Chemical Engineering Division Board for their sincere effort to bring out this fine collection of papers. The volume is devoted to gamut of contemporary Chemical Engineering topics, which include nanomaterials, biomarkers, artificial neural network, fuel cells and separation technology.
I believe that this compiled volume will be helpful for the academicians and professionals and will stimulate further research into these emerging fields of technology.
Dr K Venkatasubbaiah, FIEChairman, CATE, IEI

PresidentDr L V Muralikrishna Reddy, FIE
Secretary and Director GeneralMr B B Reddy, FIE
Chief EditorDr K Venkatasubbaiah, FIE,
Chairman, CATE
Consulting EditorDr M P Sukumaran Nair, FIE,
Chiarman, CHDB
Members of the Editorial Board
Dr L V Muralikrishna Reddy, FIE, President, IEI & Member, CHDB
Mr N B Vasoya, FIE, Member, CHDBDr G Madhu, FIE, Member, CHDB
Dr R Bhima Rao, FIE, Member, CHDBDr J K Gehlawat, FIE, Member, CHDBMr P P Agarwal, FIE, Member, CHDB
Publishers
Mr B B Reddy, FIE, Secretary & Director General
for The Institution of Engineers
(India), 8 Gokhale Road, Kolkata 700020
Publication Office
8 Gokhale Road, Kolkata 700020Ph : 2223-8311/14-16/33-34,
Fax : (033) 2223-8345E-mail : [email protected],
web : www.ieindia.org
The Institution of Engineers (India), 8 Gokhale Road, Kolkata 700020, as a body accepts no re-sponsibility for the statments made by individuals in the paper and contents of papers published herein.
The Institution of Engineers (In-dia) subscribes to the Fair Copying Declaration of the Royal Society. Reprints of any portion of the pub-lication may be made provided that reference thereto be quoted.
As per Bye-Law 119, copyright of each paper published in Institution Journals or Proceedings in full or in abstract at its Centres shall lie with the Institution.
Printed at Florence Offset Process Pvt. Limited, 6A, S N Banerjee Road, Kolkata 700013
ContentsAdvancement in Air Separation Technology : Vacuum Pressure Swing AdsorptionJ Barot, S Thakore, T N Shah 5Artificial Neural Network based Predition of Boiling Incipience in a Natural Circulation Vertical Thermosiphon ReboilerMd Kamil, M A Hakeem 11Biomarkers and Human BiomonitoringR Dixit, R Bathri, V Gujar, P Bose 19Bottomless Refinery Concept : Operation and Control of IGCCM B Pipaliya, R P Bhatt, P B Patel 26Heat Transfer in Nuclear ReactorsA K Saxena 35Horizontal Distillation ColumnN Parmar, H Parmar, C Akbari 42Occupational Hazards of ArsenicS V Ranga, H N Pandya, K R Shah 45Process Safety Management in Chemical Industries and Application of Safety Integrity Level (SIL) Concept to Improve Functional SafetyP Shah, R Padiyar 49Prospects of Fuel Cell Technology in IndiaS Basumallick 55Toxic Effects of Nanomaterials on Human HealthJ Kumar, S Gangil, R Jha, L Malviya, B Modhera 60
Annual Technical Volume of Chemical Engineering Division Board, Vol I, 2015

Annual Technical Volume :: CHDB 5
Advancement in Air Separation Technology: Vacuum Pressure Swing AdsorptionJ Barot, S Thakore, T N Shah Department of Chemical Engineering, L.D. College of Engineering, Ahmedabad 380015e-mail : [email protected], [email protected], [email protected]
Abstract : In refinery, air separation unit is used in conjunction with Integrated Gasification Combined Cycle (IGCC) unit, where mainly rich oxygen stream is used for combustion of heavy petroleum residue to produce syngas. In existing refinery most of air separation unit technology is based on cryogenic distillation to separate air into basic components. As cryogenic air separation unit has some advantages like high purity products, higher recovery of all major components of air and single unit gives multiple products. Against that it requires higher fixed capital investment and operating cost. Cryogenic air separation unit is proposed to be replaced with Vacuum Pressure Swing Adsorption (VPSA). Later requires very low fixed capital investment and energy consumption as compare to Conventional cryogenic unit. Lower pressure adsorption(in range of 1 to 6 bar g) in the VPSA system eliminate the need for a medium to high pressure air feed compressor same used in cryogenic air separation unit, which translates into lower power consumption for VPSA systems. In VPSA, turbo blower (rather than low pressure compressor) is used. In VPSA no dryer or cooler is required for the pretreatment of air. And also insulation is not required. VPSA working principle is based on Moderate pressure (somewhat higher pressure than atmosphere) adsorption and desorption or regeneration at lower pressure than atmosphere (as in vacuum).For both feed air pressurization and vacuuming regeneration same reversible turbo blower is used. As adsorption is carried out in zeolite molecular sieve bed final product stream is of enriched oxygen (with purity 90 to 95%, along with argon) and nitrogen is being adsorbed. In desorption or regeneration step gas mixture contains mainly Nitrogen with impurities of water vapor and carbon dioxide is obtained. If further purification of nitrogen is required then VPSA followed by Pressure Swing Adsorption (PSA) is suggestive option, as basic working principle of both processes are same. This paper describes working principle and pros and cons of VPSA in detail.
Keywords : Gasification, Cryogenic, Distillation, Adsorption.
Introduction
For a refinery, there are two primary concerns, one is steady fuel supply and second is to comply with stringent environmental situation, especially those related to climate change. To fulfill these requirement, development and implementation of IGCC technology which can supply clean and efficient power and steam, has become necessary. At the end of the refining process, residuals like as vacuum residue, petroleum coke, asphaltenes, visbreaker tar and other petroleum residues are left. ‘Gasification’ of these carbon-based feedstock, is a flexible and efficient process that produces mixtures of hydrogen and carbon monoxide (synthesis gas or syngas). In addition, IGCC unit offer extremely low levels of environmental pollution and is capable of firing ‘dirty fuels’ too. Demand for batter quality of light fuels has forced industries to go for heavy investment for conversion of heavy products to light products with batter quality, as to satisfy the environmental constrains. Due to this challenge, ‘Conversion technology’ has been developed and improved over the years. However, the zero residue production still remains an impossible target. Conversion, even in its most advanced form leaves complex residues as bottom product. Though its volume reduced but more contaminated with sulphur and metals, hence more difficult to dispose. IGCC technology is a promising answer to this problem. It is a proven technology for combined production of hydrogen, to satisfy its increasing demand along with production of electric power. A gasifier based on IGCC technology turn carbon based fuels into synthesis gas (syngas) in presence of oxygen and steam. Syngas is then purified and combusted in gas turbine for power generation. Some pollutants, such as sulphur, can be converted into re-usable products whereby assuring lower emissions of sulphur dioxide. IGCC comprises these sections: (i) air separation unit, (ii) gasifier with internal radiant syngas cooler, (iii) external convective syngas cooler, (iv) amine scrubbing section, (v) COS hydrolysis section, (vi) acid gas removal section, (vii) gas turbine and (viii) final heat recovery unit. With additional water-gas shift reactor, the CO in the syngas reacts with steam producing hydrogen along

Annual Technical Volume :: CHDB 6
with Carbon dioxide mixed with other gases as by-product. CO2 is separated and collected for other use. Excess heat is recovered from ‘syngas’ generation process in gasifier and syngas firing at gas turbine unit. The recovered heat is then used for steam generation, for For combustion of this carbon based fuel, oxygen is required. If direct air is used for this purpose, undesirable reaction takes place forming compound NOx in considerable amount, deteriorating properties of syngas mixture. Combustion of NOx mixed syngas creates corrosion as well as serious pollution problem. Hence, need is arise for NOx removal from syngas and its conversion to harmless and usable compound. A complex reaction and post treatment may become necessary and might consume huge amount of valuable energy. Usage of Concentrated oxygen stream is a good remedy to over-come this troublesome situation. To obtain rich oxygen mixture in large quantum, air separation technique is the ultimate choice. Air Separation Unit (ASU) is an integral part of IGCC system to obtain oxygen rich gaseous mixture. Integration of the ASU with gasifier and Gas Turbine (GT) provide significant potential for enhancing the overall plant efficiency. At present refineries and other quantum users, by and large use cryogenic distillation technology for air separation process.
Cryogenic Distillation Technology
Cryogenic distillation refers to the process of separating the components from mixture, based on their boiling points, using very low temperature and high pressure. The cryogenic air separation process starts with suction of air from atmosphere passing through a filter, to remove any type of debris[1-3]. Next step is pressurizing the air in range of five to nine bar pressure by centrifugal compressor with inter cooling. Due to compression air gets heated and so it is cooled by passing through heat exchanger, before it goes to pre-treatment or purification stage. This section removes impurities like water vapor, carbon dioxide and hydrocarbons. Removal of these components ensure continuous operation as it prevent vapor condensation and cause problem of liquid vapor solidification and CO2 condensation within the heat exchanger of cryogenic unit. In purification step, air is passed through ‘molecular sieve adsorber’ and ‘two sets of brazed aluminum “reversing” heat exchanger’, to remove air impurities[4]. Final purified air goes to cryogenic distillation unit. Here cryogenic temperature is achieved by throttling process or say as sudden expansion of high pressure air, in expander.
After purification, air containing considerable proportion of oxygen, nitrogen and argon, is send to coldbox, which is equipped with cryogenic heat exchangers, distillation columns and associated valves and piping[4,5]. Because parts of this system are extremely cold, all components are mounted inside the coldbox, encased in insulation of perlite[3]. Separation of air into its components is done in a two-column rectification system comprising a high-pressure and a low-pressure column. Initially air is cooled to very low temperatures (about 185OC) and then is introduced into fractionation column. The high pressure rectification column delivers crude oxygen rich liquid at bottom and gaseous nitrogen from top outlet. The crude oxygen stream contains minute proportion of nitrogen and argon. To achieve pure oxygen, this stream is then transferred to another low pressure rectification column
Table 1 Components of air and their properties
Gas Molar mass Volume, % Boiling point, K
Nitrogen 28.01 78.084 77.35
Oxygen 32.00 20.946 90.19
Argon 39.95 0.934 87.27
Hydrogen 1.01 0.00005 20.27
Neon 20.18 0.001921 27.09
Helium 4.00 0.0005239 4.22
Krypton 83.80 0.0001139 119.81
Xenon 131.29 0.0000087 165.04
CO2 44.01 0.02-0.04 194.68
Annual Technical Volume :: CHDB 7
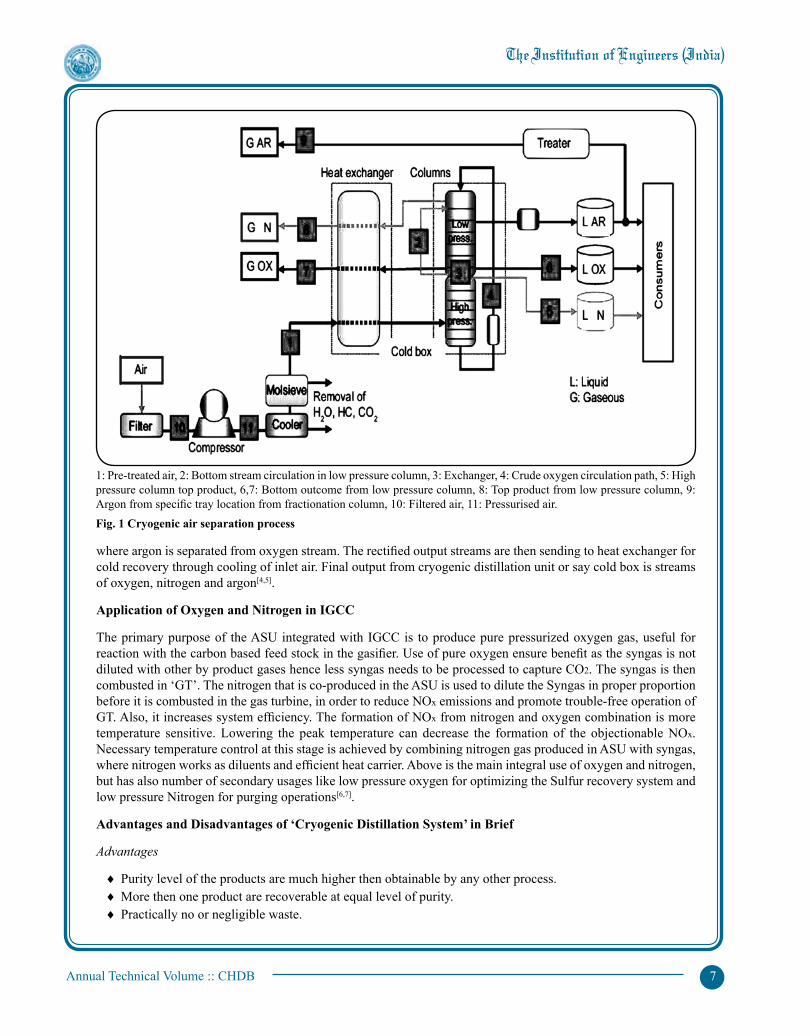
where argon is separated from oxygen stream. The rectified output streams are then sending to heat exchanger for cold recovery through cooling of inlet air. Final output from cryogenic distillation unit or say cold box is streams of oxygen, nitrogen and argon[4,5].
Application of Oxygen and Nitrogen in IGCC
The primary purpose of the ASU integrated with IGCC is to produce pure pressurized oxygen gas, useful for reaction with the carbon based feed stock in the gasifier. Use of pure oxygen ensure benefit as the syngas is not diluted with other by product gases hence less syngas needs to be processed to capture CO2. The syngas is then combusted in ‘GT’. The nitrogen that is co-produced in the ASU is used to dilute the Syngas in proper proportion before it is combusted in the gas turbine, in order to reduce NOx emissions and promote trouble-free operation of GT. Also, it increases system efficiency. The formation of NOx from nitrogen and oxygen combination is more temperature sensitive. Lowering the peak temperature can decrease the formation of the objectionable NOx. Necessary temperature control at this stage is achieved by combining nitrogen gas produced in ASU with syngas, where nitrogen works as diluents and efficient heat carrier. Above is the main integral use of oxygen and nitrogen, but has also number of secondary usages like low pressure oxygen for optimizing the Sulfur recovery system and low pressure Nitrogen for purging operations[6,7].
Advantages and Disadvantages of ‘Cryogenic Distillation System’ in Brief
Advantages
♦ Purity level of the products are much higher then obtainable by any other process.♦ More then one product are recoverable at equal level of purity.♦ Practically no or negligible waste.
Fig. 1 Cryogenic air separation process
1: Pre-treated air, 2: Bottom stream circulation in low pressure column, 3: Exchanger, 4: Crude oxygen circulation path, 5: High pressure column top product, 6,7: Bottom outcome from low pressure column, 8: Top product from low pressure column, 9: Argon from specific tray location from fractionation column, 10: Filtered air, 11: Pressurised air.

Annual Technical Volume :: CHDB 8
Drawbacks
♦ Very high energy consumption.♦ Difficulties with temperature control at ‘cryogenic temp’.♦ Critical insulation technique required.♦ Longer time required to restart, in the case of ‘shut- down’.♦ Heavy capital cost and huge set-up.
Present time compel to search for remedial technology to overcome the problems defined in drawbacks for cryogenic distillation, especially no.1, 4 and 5, if need for purity is compromise able to some extant.
Remedy
Adsorption is the present day technology offering good answer for above described drawbacks. Atom, Molecule or Ion in any physical state, adhering on the ‘surface’ of a substrate by attraction of ‘weaker force’ known as Van der Waals forces, is adsorption[8,9]. There are two types of adsorption, namely physical adsorption and chemical adsorption. Lower energy contain is related with the former phenomena, while the later is relatively more stable but associated with higher energy level[9,10]. Due to lower energy state, physical adsorption phenomena is normally selected for separation of gaseous components. For gaseous separation three technologies have been invented so far, namely (i) PSA, (ii) VSA and (iii) VPSA. Each of these three has their own advantages and drawbacks. For generation of oxygen rich stream.
Vaccum Pressure Swing Adsorption
The attractive forces of surface (Van der Waals forces) are weaker and less specific. As a result we can regenerate adsorbent surface after use. Adsorbents are natural or synthetic materials of microcrystalline structure, whose internal pore surfaces are accessible for selective combination of solid and solute[2,8,9].
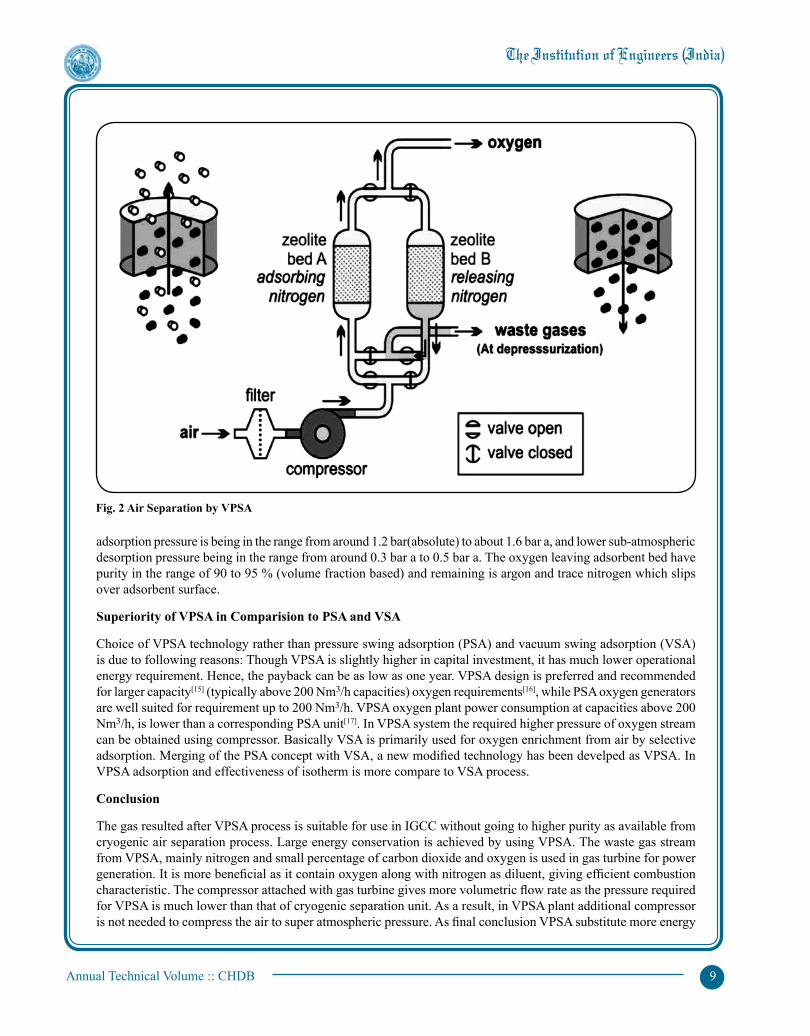
The principle behind the VPSA is of adsorption at somewhat higher atmosphere pressure and regeneration of surface for new cycle by vacuum (pressure bellow atmosphere). In simple, VPSA is a technology used to separate some gas species from a gaseous mixture under pressure according to the species molecular characteristics and affinity for an adsorbent material. It operates at near-ambient temperatures. A single unit named ‘rotary-turbo blower’ can be used both for pressurization and vacuuming. Adsorption of nitrogen rather than oxygen is done in this process i.e. when air flows through bed of adsorbent material, nitrogen, carbon dioxide and water vapour are adsorbed and oxygen and argon are collected as product outcome. This is due to selective adsorption characteristic of components.
The VPSA processing sequences are operated in one or more bed with cyclic basis as[11-13]:
Initially pressurization is done in adsorbent column using pressurised feed air from intermediate pressure level to aspecified super-atmospheric pressure. Selective adsorption of nitrogen, CO2 and water vapour take place, leaving oxygen with traces of argon at output. Supply of pressurised feed air is continued till slip of nitrogen is observed in outcome oxygen stream. This is due to saturation of adsorbent bed. Counter action should be done to regenerate the bed for new cycle. The saturated column is pressurised at this stage. It is connected in counter current mode with a regenerated evacuated column where by dropping its pressure by natural draft. Further counter current of inner gases is established using mechanical power, where by depressurization up to sub atmospheric pressure is achieved. The discharged gas mainly contains nitrogen with small amount of carbon dioxide and water vapour. Due to evacuation by mechanical vacuum system adsorbed gaseous molecules leave-off the weaker bond between gas molecules and adsorbent, resulting in regeneration of bed which becomes ready for next cycle.
The evacuated regenerated bed is pressurised to intermediate pressure by equalising with other saturated bed. For large volume of oxygen production multibed systems are preferred. The adsorbent material generally used at present is metal-zeolite (metal may be sodium or calcium or lithium)[1,2,10,14]. In VPSA system super-atmospheric
Annual Technical Volume :: CHDB 9
adsorption pressure is being in the range from around 1.2 bar(absolute) to about 1.6 bar a, and lower sub-atmospheric desorption pressure being in the range from around 0.3 bar a to 0.5 bar a. The oxygen leaving adsorbent bed have purity in the range of 90 to 95 % (volume fraction based) and remaining is argon and trace nitrogen which slips over adsorbent surface.
Superiority of VPSA in Comparision to PSA and VSA
Choice of VPSA technology rather than pressure swing adsorption (PSA) and vacuum swing adsorption (VSA) is due to following reasons: Though VPSA is slightly higher in capital investment, it has much lower operational energy requirement. Hence, the payback can be as low as one year. VPSA design is preferred and recommended for larger capacity[15] (typically above 200 Nm3/h capacities) oxygen requirements[16], while PSA oxygen generators are well suited for requirement up to 200 Nm3/h. VPSA oxygen plant power consumption at capacities above 200 Nm3/h, is lower than a corresponding PSA unit[17]. In VPSA system the required higher pressure of oxygen stream can be obtained using compressor. Basically VSA is primarily used for oxygen enrichment from air by selective adsorption. Merging of the PSA concept with VSA, a new modified technology has been develped as VPSA. In VPSA adsorption and effectiveness of isotherm is more compare to VSA process.
Conclusion
The gas resulted after VPSA process is suitable for use in IGCC without going to higher purity as available from cryogenic air separation process. Large energy conservation is achieved by using VPSA. The waste gas stream from VPSA, mainly nitrogen and small percentage of carbon dioxide and oxygen is used in gas turbine for power generation. It is more beneficial as it contain oxygen along with nitrogen as diluent, giving efficient combustion characteristic. The compressor attached with gas turbine gives more volumetric flow rate as the pressure required for VPSA is much lower than that of cryogenic separation unit. As a result, in VPSA plant additional compressor is not needed to compress the air to super atmospheric pressure. As final conclusion VPSA substitute more energy
Fig. 2 Air Separation by VPSA
Annual Technical Volume :: CHDB 10
incentive process like cryogenic air separation. Also additional primary treatment for air like washing, molecular sieve adsorption and refrigeration to remove carbon dioxide is not required. If air contains more water vapor concentration (humidity), simple silica bed adsorber is employed to remove it. Insulation for equipments, piping and enclosure body is also not required. For installation of cryogenic plant huge capital investment is required while for VPSA it is lower in comparison. It is experimentally observed that trace of impurity with oxygen feed to gasifier, improve overall efficiency of IGCC plant by about 0.5%. More over the discharge Nitrogen stream have around 82% to 85% Nitrogen concentration which is very much suitable with the requirement for most efficient combustion in gas turbine.
Drawbacks
The purity of product stream can not be achieved beyond specific level. The small portion of argon coming with oxygen stream absorbs heat energy, which is produced by combustion in gasifier, become waste. If the gasifier require, high pressure oxygen supply than provision for compressor after vacuuming system can be made. Nitrogen in trace amount coming with oxygen flow is making small amount of NOx formation in gasifier. The automatic mechanism for VPSA operation is complex.
The conclusion can be made in favor of VPSA as it is promising answer for air separation unit rather than go to higher energy consuming cryogenic technology integrated with pretreatment equipments.
References
1. R H Pherry, C H Chilton, Chemical Engineers’ Handbook, 5th, International Student Edition: McGraw-Hill, Kogakusha Ltd.
2. Ullmann’s Encyclopedia of Industrial Chemistry, Fifth, Completely Revised Edition, volume B3: Unit Operation II, VCH publishers.
3. G Claude, Liquid Air, Oxygen and Nitrogen, P Blakiston Son & Co., Philadelphia, Pa., 1913.4. Cryogenic Air Separation and Liquefier Systems, Universal Industrial Gases, Inc., 20145. Basic Air Separation Unit Description, Ranch Cryogenics, Inc., http://www.ranchcryogenics.com/about/basic-air-separation-
unit-description/, 20146. Integrated Gasification Combined Cycle, Siemens, http://www.energy.siemens.com/co/en/fossil-power-generation/power
- plants/integrated-gasification-combined-cycle/integrated-gasification- combined-cycle.htm, 20147. IGCC Config, netl.doe.gov., igcc config | netl.doe.gov. http://www.netl.doe.gov/research/coal/energy-systems/gasification/
gasifipedia/igcc-config., 2014. 8. D M Ruthven, Principles of Adsorption and Adsorption Processes, J. Wiley & Sons, New York 1984.9. D M Young, A D Crowell, Physical Adsorption Processes, Butterworths, London 1962.10. D. Tondeur, P C Wankat, Gas Purification by Pressure Swing Adsorption, Sep. Purif. Methods 14, no. 2, 157-212, 198511. F W Leavitt, Vacuum Pressure Swing Adsorption Process. Praxair Technology, Inc., Assignee. Patent US5415683 A. 16
May 1995.12. S Sircar, T R White, Vacuum Swing Adsorption for Air Fractionation. Air Products and Chemicals, Inc., Assignee. Patent
US4264340 A. 28 April. 1981.13. J H Fassbaugh, M K Rogan, H R Schaub, J Smolarek, Vacuum Pressure Swing Adsorption System and Method, Praxair
Technology, Inc., assignee. Patent US6010555 A. 4 Jan. 2000.14. H Lee, D E Stahl, Oxygen Rich Gas from Air by Pressure Swing Adsorption Processes, AIChE Symp Ser. 134, no.69, 1-8.,
197315. Adsorption Solutions > Air Liquide Global E&C Solutions, http://www.engineering-solutions.airliquide.com/en/about-us-
global-engineering-and-construction-solutions/technologies-air-liquide-lurgi-cryo-zimmer/adsorption-solutions.html, 201416. MVS VPSA Oxygen Generator, VPSA Oxygen Plant, Vacuum Swing Oxygen Generator, http://www.mvsengg.com/products/
oxygen/vpsaoxygen/, 201417. K Kolmetz, ed, KLM Technology Group. Rep. N.P., Jan. 2013. Web.
The Institution of Engineers (India)
Annual Technical Volume :: CHDB 11
Artificial Neural Network based Predition of Boiling Incipience in a Natural Circulation Vertical Thermosiphon ReboilerMd Kamil M A HakeemDepartment of Petroleum Studies Department of Chemical Engineering Aligarh Muslim University, Aligarh Muslim UniversityAligarh 202002 Aligarh 202002 e-mail : [email protected] e-mail : [email protected]
Abstract : Artificial Neural Networks (ANN) are developed for the prediction of wall superheat as a function of heat flux, thermo-physical properties and submergence in a vertical thermosiphon reboiler. The experimental data were used for training of feed forward artificial neural network with error back propagation technique. Gradient descent methods of optimization have been applied for training the network. The predictability of the network is extremely good if the training data are chosen appropriately. It was observed that the wall superheat predicted was very close to the actual experimental data. The suitability of the network was also established yielding very less error in comparison to the prediction made by empirical correlation.
Keywords : Artificial neural networks, Wall superheat, Thermosiphon reboiler, Boiling incipience, Surface tension
Notations and Abbreviations
hf Latent heat of vaporization, J/kg
k Thermal conductivity, W/m K
L Total heated length, m
q Heat flux, W/m2
rmax Maximum cavity radius, m
rtan Cavity radius based on the tangency criterion for incipience, m
S Submergence, %
T Temperature, °C/K
∆Ts Degree of superheat, (Tw -Ts), °C/K
Z Distance along the test section, m
υ Kinematics viscosity, m2/s
σ Surface tension, N/m
Introduction
In the natural circulation systems, the flow is thermally induced where the working fluid may remain as a single phase liquid or change phase to boil, depending upon the heating conditions. The buoyancy induced flow, occurs in atmospheric and geophysical processes and is made use of in the cooling of electronic equipments and nuclear reactor-fuel elements during shut off periods. They may also be useful in solar heating and ventilating applications for domestic purposes. The boiling heat transfer, on the other hand, plays an important role in the design of vaporizers, evaporators, re-boilers and similar equipments employed in process industry, power plants, nuclear reactors, refrigeration systems and many others. In refrigeration engineering, tubular and tube in shell evaporators are used.In most of the applications, a sub-cooled liquid entering the tubes gets heated by single-phase convection and moves upwards. Depending upon wall temperature conditions, sub cooled boiling may set

The Institution of Engineers (India)
Annual Technical Volume :: CHDB 12
in at the surface. When the liquid temperature attains saturation value, saturated boiling begins with the existence of net vapor, which increases resulting in bubbly to mist flow. Thus the heat transfer to liquids in the reboiler tube generates a changing two-phase flow with various flow regimes spread along the tube length. The point at which the two phase begins is known as Incipient Point of Boiling (IPB), which corresponds to the conditions of minimum degree of wall superheat or heat flux required for the formation and detachment of the first vapor bubble from the heated surface. Since IPB divides the tube into two distinct regions, non-boiling single phase and boiling two phase with entirely different modes and rate of heat transfer. Thus the prediction of IPB is important in the design of various two-phase flow heat transfer equipments. Incipience in forced convection systems has been studied extensively by a number of investigators[1-9] among others. The predicted incipience is either based on the point of tangency between the liquid temperature profile in the vicinity of the heated surface and the superheat temperature profile required for mechanical equilibrium of a vapor bubble growing at a surface cavity or based on the maximum cavity radius available for nucleation on the heated surface. Marsh and Mudawar[10] performed experimental study to develop a fundamental understanding of boiling incipience in wavy free-falling turbulent liquid films. Kamil[11] and Kamil et al.[12,13] experimentally obtained the boiling and non-boiling zones for heating surface and superheat for incipient boiling in a vertical tube thermosiphon reboiler with wide ranges of submergence. A dimensionless correlation relating the values of heat flux, inlet liquid subcooling and submergence was proposed for predicting ZOB/L and wall superheat relating the heat flux with thermophysical properties of test liquids. Zürcher et al.[14] developed a model to predict the ONB to differentiate purely convective evaporation from mixed nucleate and convective boiling during evaporation of natural refrigerant ammonia in horizontal flow boiling. The analysis during evaporation with different heat flux ranges showed very accurate predictions in terms of the local heat transfer coefficient using this new onset of nucleate boiling criterion. Again, these predictions agreed well in magnitude and trend with experimental data. Hapke et at.[15] investigated the ONB and heat transfer characteristics during flow boiling in a minichannel by using the thermographic method. Shamsuzzoha, Kamil, and Alam[16] and Kamil et al.[17] investigated the effect of liquid submergence on incipience of nucleate boiling in a vertical thermosiphon reboiler. There are two different criteria for the incipient point of boiling, one is rtan, and other is rmax. The incipience in forced convection systems was studied extensively by a number of workers as given in detail by Kamil et al.[17] among others. The validity of this criterion was proven in many practical applications. Incipience based on rtan criteria for natural convection system was studied by a number of workers[8,9,11-13]. They predicted incipience based on the maximum cavity radius (rmax) available for nucleation on the heated surface.
Artificial Neural Network
ANN is an information processing paradigm that is inspired by the way the biological nervous systems such as the brain processes the information. It is composed of large number of highly interconnected processing elements (neurons) working in unison to solve specific problem. Computation through neural networks is one of the recently growing areas of artificial intelligence. Neural networks are promising due to their ability to learn highly non-linear relationship. The most common for Chemical Engineering applications is Multilayer Perception (MLP), which is a feed forward neural network. It consist of multi layer hierarchical structure, which has at least one layer of processing units between them apart from input and out put layer. There are three fundamentally different classes of networks: single layer feed forward networks, multilayer feed forward networks and recurrent networks. Single layer feed forward network comprises of two layers, namely the input layer and the output layer. The input layer neurons receive the input signals and the output layer neurons give the output. The synaptic links carrying the weights connect every input neuron to the output neuron but not vice-versa. Such a network is said to be feed forward in type or acyclic in nature. Despite the two layers, the network is termed single layer since it is the output layer, alone which performs computation. The input layer merely transmits the signals to the output layer. Multilayer feed forward network is made up of multiple layers. Thus, architecture of this class besides input and an output layer also has one or more intermediate layers called hidden layers. The computational units of the hidden layer are known as the hidden neurons or hidden units. The hidden layer aids in performing useful intermediary computations before directing the input to the output layer. The input layer neurons are linked to the hidden layer neurons and the weights on these links are referred to as input-hidden layer weights. Again, the hidden layer neurons are linked to the output layer neurons and the corresponding weights are referred to as hidden-output layer weights. Recurrent networks differ from feed forward network architectures in the sense that there is at least one feedback loop.
The Institution of Engineers (India)
Annual Technical Volume :: CHDB 13
Thus, in these networks, for example, there could exist one layer with feedback connections. There could also be neurons with self-feedback links i.e. the output of a neuron is fed back into itself as input. Various applications of ANN are, design of fuel additives[18], correlation for prediction of overall gas hold up in bubble column reactors[19], inferential property predictors [20], optimization of industrial chemical processes[21], controller tuning with steady state input-output data for a heat exchanger[22], adsorption breakthrough times determination[23], modeling of heat exchanger[24] and modeling of packed column[25,26] among others[27-33].
In the present work, ANN are developed for modeling of vertical thermosiphon reboiler for prediction of wall superheat as a function of heat Flux, thermo-physical properties and submergence. The data required for training of these networks has been generated with distilled water and acetone to identify the boiling incipience conditions in a reboiler tube. The trained networks were then used for prediction of wall superheat and comparison has been carried out between actual and predicated values.
Experimental Procedure
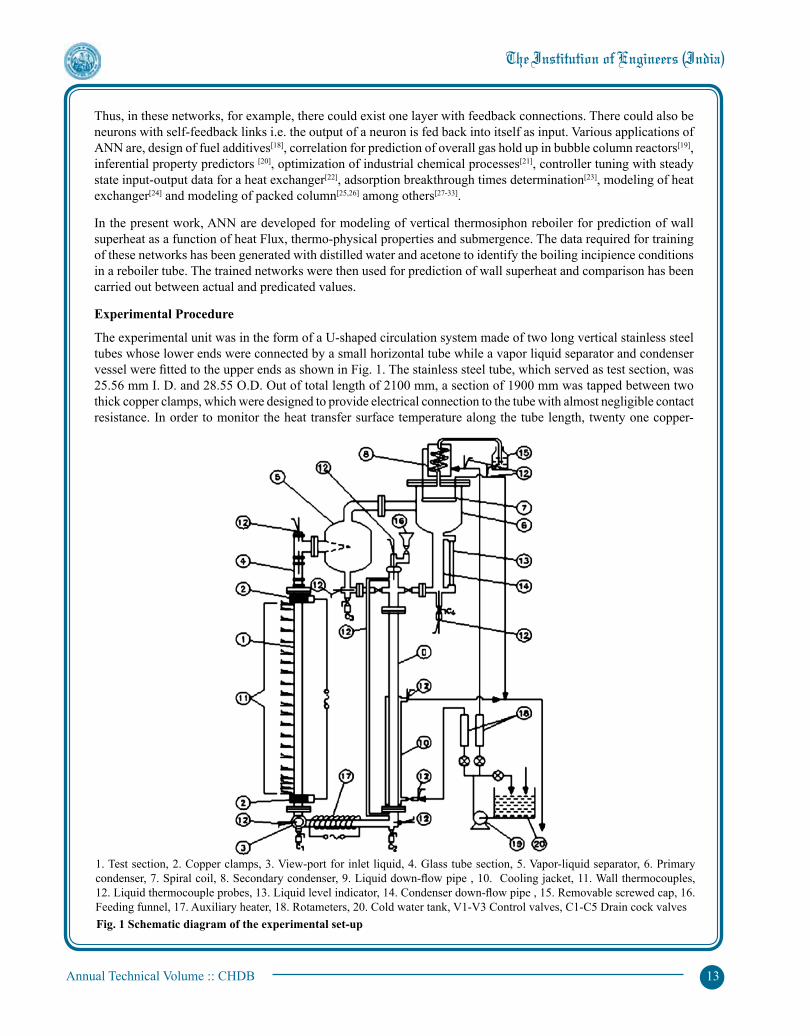
The experimental unit was in the form of a U-shaped circulation system made of two long vertical stainless steel tubes whose lower ends were connected by a small horizontal tube while a vapor liquid separator and condenser vessel were fitted to the upper ends as shown in Fig. 1. The stainless steel tube, which served as test section, was 25.56 mm I. D. and 28.55 O.D. Out of total length of 2100 mm, a section of 1900 mm was tapped between two thick copper clamps, which were designed to provide electrical connection to the tube with almost negligible contact resistance. In order to monitor the heat transfer surface temperature along the tube length, twenty one copper-
Fig. 1 Schematic diagram of the experimental set-up
1. Test section, 2. Copper clamps, 3. View-port for inlet liquid, 4. Glass tube section, 5. Vapor-liquid separator, 6. Primary condenser, 7. Spiral coil, 8. Secondary condenser, 9. Liquid down-flow pipe , 10. Cooling jacket, 11. Wall thermocouples, 12. Liquid thermocouple probes, 13. Liquid level indicator, 14. Condenser down-flow pipe , 15. Removable screwed cap, 16. Feeding funnel, 17. Auxiliary heater, 18. Rotameters, 20. Cold water tank, V1-V3 Control valves, C1-C5 Drain cock valves

The Institution of Engineers (India)
Annual Technical Volume :: CHDB 14
constantan thermocouples were spot welded on the outer surface of the tube at intervals of 50 mm up to a length of 200 mm from the bottom end and 100 mm intervals over the remaining length. A copper-constantan thermocouple probe was in the view port to measure the inlet liquid temperature. The temperature of the boiling liquid, before entry to the vapor liquid separator, was measured by another traversing thermocouple probe. The entire set-up was thoroughly lagged to make the heat losses negligible, which were less than ±2.5%. The experimental data were generated at four different levels of liquid submergence and various heat fluxes for distilled water. The maximum liquid head used in the present study corresponded to the liquid level equal to the top end of the reboiler tube. This condition has been termed as 100% submergence. The experimental data were generated for four different levels of submergence and various heat fluxes. Other details of reboiler and cooling system along with its operating procedure are described in detail elsewhere in literature[11,12].
Results and Discussion
From the wall and liquid temperature distributions as discussed earlier[11], it is observed that there exist a point at which the bubbles start appearing at surface though the liquid is still below its saturation value. This may be onset of subcooled / surface boiling and its effect is exhibited in deviation of wall temperature curves from straight line behavior, characteristics of single phase convection. In fact the nucleation of bubbles must have started on attainment of the required minimum superheat even before the point mentioned above has been reached. As the liquid moves upward, its temperature rises and boiling process becomes increasingly effective with additional turbulence at the wall. The wall temperature increases with diminished rate which eventually becomes zero, showing a maximum wall superheat followed by a severe fall in its value. This is observed to happen when the liquid temperature has attained its saturation value enabling the bubble growth to the maximum size. This marks the Onset of saturated Boiling (OB). Recently Kamil, et al.[31] proposed a semi-empirical correlation for the onset of boiling including the effect of submergence for a vertical thermosiphon reboiler. The following equation was used to predict the wall superheat[34]. (1)
Table 1 depicts the training data for water and acetone. The network results are shown in Table 2. Fig.2 shows
Table 1 Training data for water and acetone
Water Acetone Input Output Input Output Q S Tw-Ts,
oC Q S Tw-Ts,oC
5730 100 2.8 3801 100 11.2 17463 100 6.1 8738 100 17.5 25241 100 6.7 11443 100 22.8 38074 100 7.6 15115 100 24.35 43373 100 9.9 5999 75 11.9 5730 75 6.7 11443 75 24.2 14441 75 8.1 15115 75 10.8 29516 75 15.2 5999 50 8.3 39795 75 17 11443 50 12.4 5760 50 4.3 15115 50 15 14441 50 8 11443 30 8.5 25241 50 12.8 15115 30 10.5 42915 50 15 5730 30 2.9 14441 30 5.4 25241 30 6.7 38074 30 9.5

The Institution of Engineers (India)
Annual Technical Volume :: CHDB 15
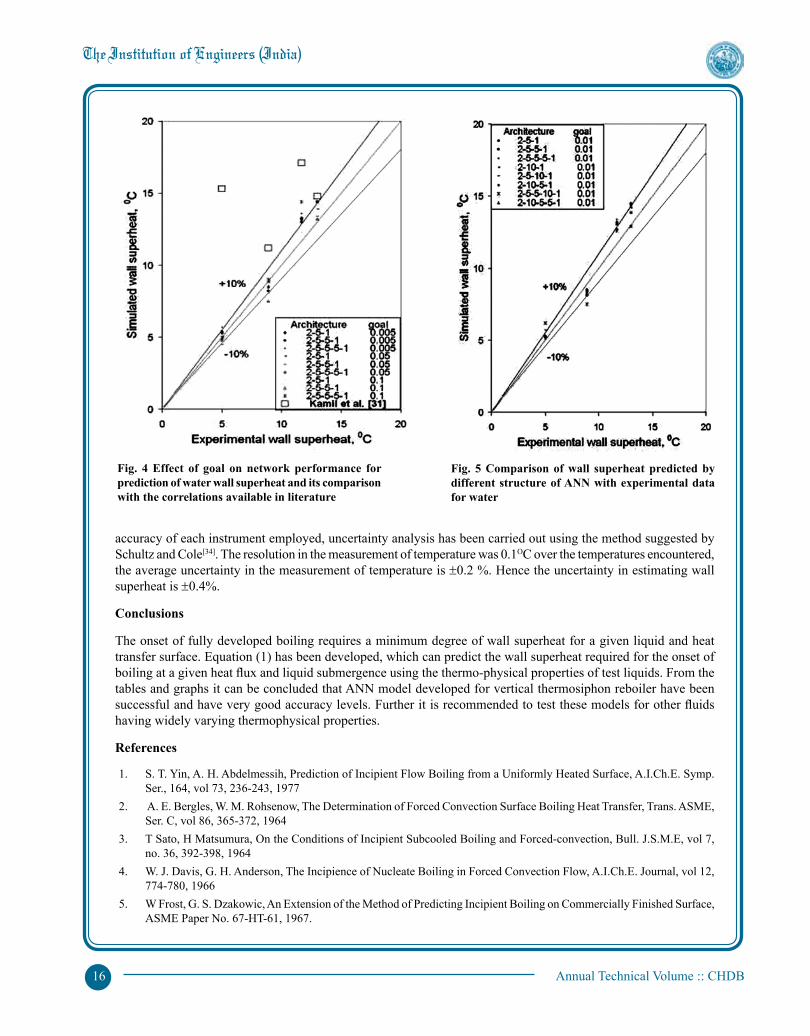
the simulated result for acetone having different network configuration. The prediction made by the network is very good and almost all the data lie within ±10% error band. Similar prediction have been shown in Figs. 3-5 for other systems. Figs 2-4 show the comparison of wall superheat predicted by ANN and correlation from the literature[27,28,31] with experimental values for all the systems. Further it has been established that the performance of the network is fairly well in comparison to that of empirical correlation proposed by Kamil et al.[27,28,31]. Thus the present approach may be used to predict the boiling incipience for other systems with significantly less error.
Table 2 shows the values of wall superheat for all the systems along with the predicted values from the correlation and neural network.
Experimental Uncertainty
In the present investigation the measured variables are the wall and liquid temperatures, electrical input to the test section. The measurements involved include voltage, current, temperatures and tube dimensions. The measured values are subjected to some uncertainties due to the error of measurement. Taking into account the least count and
Table 2 ANN structure 2-5-1 and goal 0.1 and correlation predicted wall superheat
ANN Experimental Correlation Input Output, Tw-Ts, °C Tw-Ts,°C
Q S Tw-Ts,°C Kamil et al. [31]
Acetone 5999 100 14 13.5 9.3 8738 75 18 17.9 9.4 8738 50 14 11.2 7.3 Water 14441 100 4.8 5 15.3 25241 75 12.3 11.7 17.1 30747 50 13.2 13 14.8 32717 30 8.1 8.9 11.2
Fig.2 Simulated against experimental wall superheat for acetone with single hidden layer
Fig. 3 Simulated against experimental wall superheat for acetone with different ANN architecture
The Institution of Engineers (India)
Annual Technical Volume :: CHDB 16
Fig. 4 Effect of goal on network performance for prediction of water wall superheat and its comparison with the correlations available in literature
Fig. 5 Comparison of wall superheat predicted by different structure of ANN with experimental data for water
accuracy of each instrument employed, uncertainty analysis has been carried out using the method suggested by Schultz and Cole[34]. The resolution in the measurement of temperature was 0.1OC over the temperatures encountered, the average uncertainty in the measurement of temperature is ±0.2 %. Hence the uncertainty in estimating wall superheat is ±0.4%.
Conclusions
The onset of fully developed boiling requires a minimum degree of wall superheat for a given liquid and heat transfer surface. Equation (1) has been developed, which can predict the wall superheat required for the onset of boiling at a given heat flux and liquid submergence using the thermo-physical properties of test liquids. From the tables and graphs it can be concluded that ANN model developed for vertical thermosiphon reboiler have been successful and have very good accuracy levels. Further it is recommended to test these models for other fluids having widely varying thermophysical properties.
References
1. S. T. Yin, A. H. Abdelmessih, Prediction of Incipient Flow Boiling from a Uniformly Heated Surface, A.I.Ch.E. Symp. Ser., 164, vol 73, 236-243, 1977
2. A. E. Bergles, W. M. Rohsenow, The Determination of Forced Convection Surface Boiling Heat Transfer, Trans. ASME, Ser. C, vol 86, 365-372, 1964
3. T Sato, H Matsumura, On the Conditions of Incipient Subcooled Boiling and Forced-convection, Bull. J.S.M.E, vol 7, no. 36, 392-398, 1964
4. W. J. Davis, G. H. Anderson, The Incipience of Nucleate Boiling in Forced Convection Flow, A.I.Ch.E. Journal, vol 12, 774-780, 1966
5. W Frost, G. S. Dzakowic, An Extension of the Method of Predicting Incipient Boiling on Commercially Finished Surface, ASME Paper No. 67-HT-61, 1967.

The Institution of Engineers (India)
Annual Technical Volume :: CHDB 17
6. H. C. Unal, Fraction Void, Incipient Point of Boiling during the Subcooled Nucleate Flow Boiling of Water, Int. J. Heat Mass Transfer, vol 20, 409-419, 1977
7. S. T. Yin, A. H. Abdelmessih, Measurements of Liquid Superheat, Hysteresis Effects and Incipient Boiling Oscillations of Freon-11 in Forced Convection Vertical Flow, University of Toronto, Mech. Eng. Tech. Pub. Ser, TP-7401, 1974.
8. Y Sudo, K Miyata, H Ikawa, M Kaminaga, Experimental Study of Incipient Nucleate Boiling in Narrow Vertical Rectangular Channel Simulating Subchannel of Upgraded JRR-3, Journal of Nucl. Sci. Technology, vol 23, 73-82, 1986
9. R Hino, T Ueda, Studies on Heat Transfer and Flow Characteristics in Subcooled Flow Boiling-Part 1 Boiling Characteristics, Int. J. Multiphase Flow, vol 11, 269-281, 1985
10. W J Marsh, I Mudawar, Predicting the Onset of Nucleate Boiling in Wavy Free-falling Turbulent Liquid Films, Int. J. Heat Mass Transfer, vol 32, no. 2, 361-378, 1989
11. M Kamil, Studies on a Vertical Tube Thermosiphon Reboiler, Ph.D. Thesis, Aligarh Muslim University, Aligarh, 1992.12. M. Kamil, H. Ali, S. S. Alam, Predicting the Onset of Nucleate Boiling in a Vertical Tube Reboiler, Experimental Heat
Transfer, Fluid Mechanics and Thermodynamics, Elsevier Sciences Publishers, M.D. Kelleher et al, eds, vol. 2, B.V., New York, 1232-2139, 1993
13. Shamsuzzoha, M Kamil, S. S. Alam, Boiling Incipience Analysis in a Vertical Thermosiphon Reboiler, Proceeding of 2nd International Conference on Heat Transfer, Fluid Mechanics and Thermodynamics, Victoria Falls, Zambia, Paper No. SM1, June 2003.
14. I Hapke, I. H. Boye, J Schmidt, Onset of Nucleate Boiling in Minichannels, International Journal of Thermal Sciences, vol. 39, no 4, 505, 2000.
15. O Zurcher, J R Thome, D Favrat, An Onset of Nucleate Boiling Criterion for Horizontal Flow Boiling, International Journal of Thermal Sciences, vol 39, no 9, 909, 2000.
16. M Shamsuzzoha, M. Kamil and S. S. Alam, Conditions of Onset of Boiling in a Vertical Thermosiphon Reboiler, Journal of Thermophysics and Heat Transfer, vol. 18, 4, 448, 2004.
17. M Kamil, M. A. Hakeem, Artificial Neural Network based Prediction of Wall Superheat in a Vertical Thermosiphon Reboiler”, Proc. of ECI International Conference on Boiling Heat Transfer, [CD-ROM], Paper No. 26, Spoleto, Italy, May 7-12, 2006.
18. S. Anantha, G. Prasanjeet, M.C. James and Venkatasubramaniam, Design of Fuel Additives using Neural Networks and Evolutionary Algorithms, American Institute of Chemical Engineering Journal, vol 47, 6, 1387-1405, 2001.
19. S. Ashfaq, Al-Dahhan Muthanna, Development of an Artificial Neural Network Correlation for Prediction of Overall Gas hold up in Bubble Column Reactors”, Chemical Engineering and Processing Journal, vol. 42, 2003, pp. 599-610.
20. A. Barsamian and J. Macias, “Inferential Property Predictors using Neural Networks”, Hydrocarbon Processing Journal, 1998, pp 107-116.
21. A.O.N. Cladio, G. Reinaldo and G. Robert, “Neural Network based Approach for Optimization of Industrial Chemical Processes”, Computers and Chemical Engineering Journal, 24(9-10), 2000, pp 2303-2314.
22. M. S. Dasgupta, G. B. Menon and R. K. Gupta, “ANN Controller Trained with Steady State Input-output Data for a Heat Exchanger, Indian Journal of Chemical Technology, 8, 227-234, 2001
23. A. K. Ghoshal, T. Bhatt and T. S.V. Venkatesan, Adsorption Breakthrough Times Determination using Artificial Neural Network (ANN)”, Indian Chemical Engineering Journal, A, vol 44, no 2, 89-93, 2002
24. Nihaluddin, Heat Transfer to Boiling Liquids in a Vertical Tube Thermosiphon Reboiler, M.E. Thesis, Department of Chemical Engineering., A.M.U. Aligarh, India, 1991.
25. S. L. Pandharipande, M. A. Siddiqui, A. Dubey, S. A. Mandavgane, Optimising ANN Architecture for Shell and Tube Heat Exchanger Modelling”, Indian Journal of Chemical Technology, 11, 804-810, 2004
26. S. L. Pandharipande, S. A. Mandavgane, Modelling of Packed Column using Artificial Neural Networks, Indian Journal of Chemical Technology, 11, 820-824, 2004
27. M. Kamil, M. A. Hakeem, Superheated Layer Thickness and Onset of Nucleate Boiling Analysis of Binaries in a Vertical Thermosiphon Reboiler, Proc. of 18th National and 7th ISHMT-ASME Heat & Mass Transfer Conference, CD-ROM, I.I.T. Guwahati, Jan 4-6, 1230-1237,2006
28. M. A. Hakeem, M. Kamil, Onset of Nucleate Boiling of Binaries in a Vertical Thermosiphon Reboiler, Trans IChemE, Part A, Chemical Engineering Research and Design, vol. 85(A12), 1670-1677, 2007
29. M. A. Hakeem, M. Kamil, I. Arman, Prediction of Temperature Profiles in a Thermosiphon Reboiler using Artificial Neural Networks, Applied Thermal Engineering Journal, vol. 28, 1572- 1579, 2008

The Institution of Engineers (India)
Annual Technical Volume :: CHDB 18
30. M. A. Hakeem, M. Kamil, Circulation Rate for a Vertical Thermosiphon Reboiler using Artificial Neural Network”, 19th National and 8th ISHMT-ASME Heat & Mass Transfer Conference, JNTU Hyderabad, Jan 3-5, 2008.
31. M. Kamil, M. Shamsuzzoha, S. S. Alam, Effect of Submergence on Boiling Incipience in a Vertical Thermosiphon Reboiler, International Journal of Thermal Sciences, 44, 75, 2005.
32. M. A. Hakeem, M. Kamil, Studies on Heat Transfer in a Vertical Thermosiphon Reboiler using Artificial Neural Network”, Proceedings of Indian Chemical Engineering Congress (CHEMCON 2008), Paper no. S5, Chandigarh, Punjab, 2008.
33. H. Parhizgar, M. R. Dehghani, A. Khazaei, M. Dalirian, Application of Neural Networks in the Prediction of Surface Tensions of Binary Mixtures, Ind. Eng. Chem. Res., 51, 2775-2781, 2012
34. R. R. Schultz, R. Cole, Uncertainty Analysis in Boiling Nucleation, AIChE Symp. Ser, 75, 32-39, 1979
Annual Technical Volume :: CHDB 19
Biomarkers and Human BiomonitoringR Dixit R Bathri, V Gujar, P BoseBanasthali Vidhyapith, Bhopal Memorial Hospital & Research Centre, Rajasthan 304022 Bhopal, Madhya Pradesh 462038
Abstract : Human Bio Monitoring (HBM) of dose and biochemical effect nowadays has tremendous utility providing an efficient and cost effective means of measuring human exposure to chemical substances. HBM considers all routes of uptake and all sources which are relevant making it an ideal instrument for risk assessment and risk management. HBM can identify new chemical exposures, trends and changes in exposure, establish distribution of exposure among the general population, identify vulnerable groups and populations with higher exposures and identify environmental risks at specific contaminated sites with relatively low expenditure. The sensitivity of HBM methods moreover enables the elucidation of human metabolism and toxic mechanisms of the pollutants. So, HBM is a tool for scientists as well as for policy makers. Blood and urine are by far the most approved matrices. HBM can be done for most chemical substances which are in the focus of the worldwide discussion of environmental medicine. This especially applies for metals, PAH, phthalates, dioxins, pesticides, as well as for aromatic amines, per fluorinated chemicals, environmental tobacco smoke and volatile organic compounds. There are several different categories of biomarkers that measure exposure, effect and susceptibility each is useful for answering different questions. In this review we are most concerned with biomarkers of exposure. This review will help us to understand how biomarkers are used to assess environmental exposures and when and why biomarkers may be appropriate tools for specific situations. Also this article will discuss the advantages, limitations and challenges of bio monitoring and will help to understand how bio monitoring has been used effectively to improve environmental public health policy.
Keywords: HBM, Biomarkers, Biomonitoring, Matrix, Environmental illness
Introduction
Biomarker
A chemical, its metabolite, or the product of an interaction between a chemical and some target molecule or cell that is measured in the human body[1]. Environmental monitoring: the measurement of a contaminant’s concentration in a medium (e.g., air, soil, water, or food)[2].
Human Biomonitoring
The direct measurement of people’s exposure to toxic substances in the environment by measuring the substances or their metabolites in human specimens, such as, blood or urine[3].
While this review concentrates on biomarkers and human biomonitoring, it is notable that it is also common to biomonitor other species – for example measuring methyl mercury in fish is also biomonitoring as is measuring atrazine in frogs. Measuring contamination in other species can assist in developing both exposure risks for humans and information on toxicities.
The advantage of biomonitoring – the measurement of a chemical or its metabolite in the body – is that it represents an actual measure of integrated exposures via all routes of exposure which is not susceptible to assumptions or models.
Biomarkers are useful because they have the potential to measure the actual, integrated internal dose from all routes of exposure. There are several different categories of biomarkers that measure exposure, effect and susceptibility each is useful for answering different questions. In this review we are most concerned with biomarkers of exposure. In fact, they can overlap as the chemical makes its way down the metabolic cascade and into the body systems.
A Biomarker of Exposure
A chemical, its metabolite, or the product of an interaction between a chemical and some target molecule or cell that is measured in the human body (e.g. cotinine in blood or urine for second-hand tobacco smoke, benzene metabolites in urine for traffic related pollution).
Annual Technical Volume :: CHDB 20
A Biomarker of Effect
A measurable biochemical, physiologic, behavioral, or other alteration in an organism that, depending on the magnitude, can be recognized as associated with an established or possible health impairment or disease (e.g. DNA adducts).
A Biomarker of Susceptibility
An indicator of an inherent or acquired ability of an organism to respond to the challenge of exposure to a specific chemical substance (e.g. G6PD deficiency)[4].
Environmental Illness
Understanding environmental illness requires knowledge of the entire cascade of events from the release of an environmental contaminant through absorption, actions and damage within the body and the development of disease. Defining the extent and impact of exposure is a central element of understanding environmental disease. In simple terms, there can be no harm without exposure, but exposure alone is not enough to prove or ensure harm[5].
This communication will briefly describe biomarkers and environmental monitoring and exposure modeling,but is mostly concerned with the increasingly important tool of biomonitoring for understanding exposures. The main portion is the realm of environmental monitoring is the measurement of pollutants and their breakdown products in various environmental media such as air, water, food, soil, and manmade objects.
The last portion is the realm of biomonitoring – the direct measurement of contaminants in the body.In the middle, bioavailability modifies exposure routes or pathways – that is some contaminants are so tightly bound to their environmental medium that they are not available to be absorbed into the system by specific routes of exposure, which brings us finally to exposure leading to absorption which is the key step which is often one of the most difficult to characterize[6].
Environmental monitoring, also known as ambient monitoring, is the measurement of chemical substances in media (or matrices) like indoor and outdoor air, water, food, soil, dust, consumer products, building materials, etc. This is critical to understanding the sources of exposure, but is incomplete without information about exposure pathways. In order to predict internal dose, complex exposure models are constructed which involve applying sets of standardized assumptions about activity levels, dietary choices, behavior, etc. What is of physiological importance is the internal dose of the environmental chemical. That is the amount of drug absorbed via ingestion, inhalation, and dermal routes. Once inside the body, the chemical moves through the metabolic pathways of the body, is transformed and either stored or eliminated. There are various compartments that a xenobiotic (foreign chemical) may traverse. Implied are the various transformations that a chemical undergoes when subjected to the metabolic pathways of the body. In order to interpret a biomarker, it is necessary to know where in this process the measured biomarker comes from – that is whether it is a biomarker of exposure, susceptibility or effect[1].
Why use Biomarkers ?
Based on, the committee on Human Biomonitoring for Environmental Chemicals, 2006, there are a variety of uses for biomarkers that are outlined in this paragraph. Biomarkers may be particularly useful when they provide linkage to important exposure, but must be measured in the correct matrix for exposure route/source of interest, and there must be analytic technology available, reliable, reproducible. Without proper study design, biomonitoring can be confusing at best and dangerous at worst.
Choice of the appropriate ‘matrix,’ the body fluid or tissue to be tested, requires understanding the absorption and metabolism of the chemical of interest. Standardized collection, storage, processing and analytical protocols are critical for meaningful results. Blood, urine, breast milk and expelled air are used most commonly. Some matrices, such as, hair and nails, are easily contaminated and difficult to collect in a standardized way. Therefore, results from
Annual Technical Volume :: CHDB 21
lesser used matrices should be scrutinized carefully to ensure they are valid measures of the exposure under study, collected properly and analyzed by a certified lab. Finally, many biomarkers are not used or useful clinically at the individual patient level, but only for research purposes. One important reason for this is that for most environmental chemicals there are no ‘standard ranges’ or ‘safe ranges’ established for biomarkers.
This is one of the many reasons that before ordering or interpreting a biomarker at the individual patient level, it is important to consult with experts in the field to be advised on the best way to assess environmental exposures or possible environmental illnesses in the individual patient. Increasingly there are environmental health specialists in many regions of the world who are excellent resources along with the global network of poison control centers.
Human Biomonitoring is a scientific technique for assessing human exposures to environmental agents and their effects, based on sampling and analysis of an individual’s tissues and fluids. While blood, urine, breast milk and expelled air are most commonly measured, hair, nails, fat, bone and other tissues may also be sampled. This technique takes advantage of the knowledge that environmental agents that have entered the human body leave markers reflecting this exposure. The marker may be the agent itself or a breakdown product, but it may also be some change in the body resulting from the interaction of the agent or its breakdown product(s) with the individual, such as alterations in the levels of certain enzymes or other proteins which may lead to modifications of normal body processes.[7]
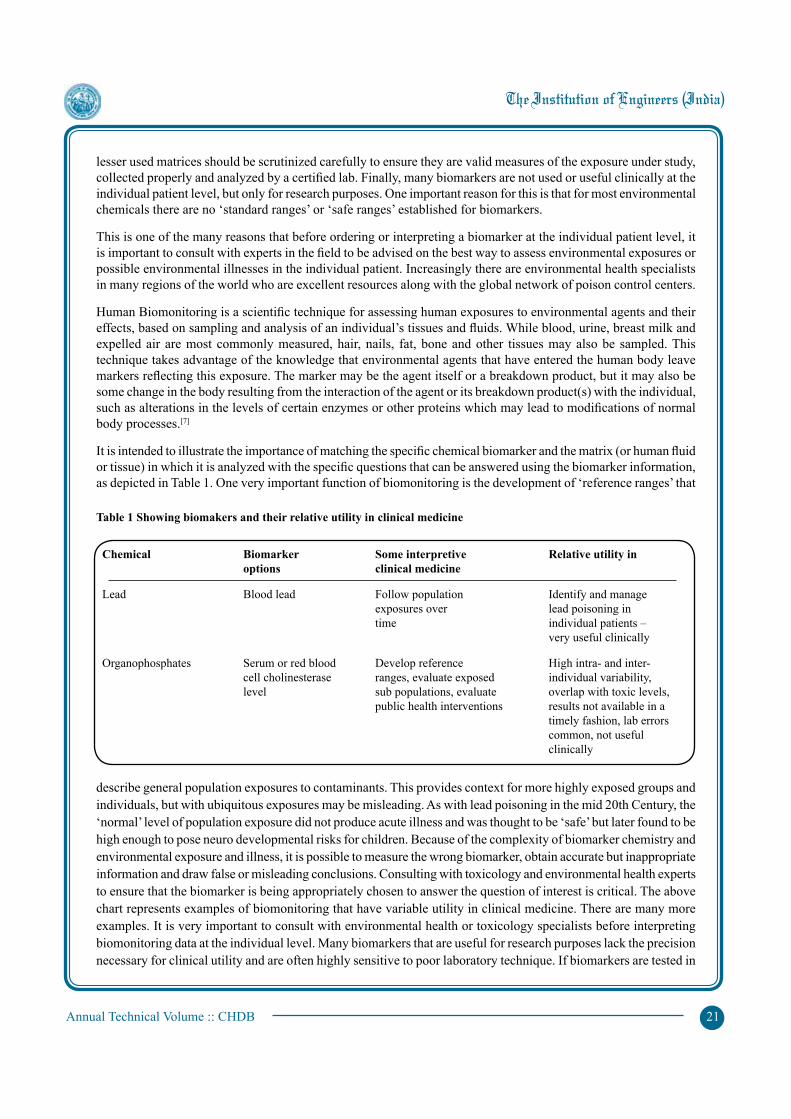
It is intended to illustrate the importance of matching the specific chemical biomarker and the matrix (or human fluid or tissue) in which it is analyzed with the specific questions that can be answered using the biomarker information, as depicted in Table 1. One very important function of biomonitoring is the development of ‘reference ranges’ that
describe general population exposures to contaminants. This provides context for more highly exposed groups and individuals, but with ubiquitous exposures may be misleading. As with lead poisoning in the mid 20th Century, the ‘normal’ level of population exposure did not produce acute illness and was thought to be ‘safe’ but later found to be high enough to pose neuro developmental risks for children. Because of the complexity of biomarker chemistry and environmental exposure and illness, it is possible to measure the wrong biomarker, obtain accurate but inappropriate information and draw false or misleading conclusions. Consulting with toxicology and environmental health experts to ensure that the biomarker is being appropriately chosen to answer the question of interest is critical. The above chart represents examples of biomonitoring that have variable utility in clinical medicine. There are many more examples. It is very important to consult with environmental health or toxicology specialists before interpreting biomonitoring data at the individual level. Many biomarkers that are useful for research purposes lack the precision necessary for clinical utility and are often highly sensitive to poor laboratory technique. If biomarkers are tested in
Table 1 Showing biomakers and their relative utility in clinical medicine
Chemical Biomarker Some interpretive Relative utility in options clinical medicine
Lead Blood lead Follow population Identify and manage exposures over lead poisoning in time individual patients – very useful clinically
Organophosphates Serum or red blood Develop reference High intra- and inter- cell cholinesterase ranges, evaluate exposed individual variability, level sub populations, evaluate overlap with toxic levels, public health interventions results not available in a timely fashion, lab errors common, not useful clinically

Annual Technical Volume :: CHDB 22
non-specialty laboratories without knowledge of population reference ranges or toxic levels, or proper analytical and quality assurance techniques, they can be incorrectly interpreted and lead to medical management errors and ultimately patient harm.
The source of the environmental contaminant is important to understand, along with themeans of transport and exposure-dose relationship. This aids in understanding the early biologic effect that alters the structure and function and ultimately leads to disease[8].
Advantages of Biomarkers
♦ Confirms absorption into human body. Measures integrated exposure from all routes and all sources not dependent upon models or assumptions.
♦ Very low level exposures detectable because analytical techniques have become exquisitely sensitive over the past several decades.
♦ Help to test and validate exposure models when the results of modeling predictions are compared to internal doses actually measured in exposed individuals.
♦ Help to follow exposure trends when individuals or representative samples of groups are followed with serial biomarker testing over time.
♦ Help to evaluate public health interventions, that is if chemicals are withdrawn, restricted or products are reformulated, follow up biomonitoring can determine if exposure has actually decreased.
Limitations of Biomarkers
♦ Does not define sources or pathways of exposure – because it is a snap-shot and an integrated measure, it tells us nothing about where the chemical came from or how it got into the body.
♦ Cannot define toxic dose – unless toxicology and epidemiology studies have defined toxicity and the dose response curve, the simple presence of a chemical in an individual may be difficult to interpret.
♦ Susceptible to inferior or unscrupulous analytical laboratories – because by definition environmental chemicals and pollutants tend to be ubiquitous, and many chemicals of interest are used in every day products including laboratory equipment, it is possible that samples will be contaminated during collection and processing. Proper procedures are imperative to ensure interpretable results. Unqualified commercial laboratories may not only have poor techniques, they may also test for the wrong things in the wrong kinds of samples.
♦ Lack of meaningful reference levels – for many pollutants population reference levels are not known. If the exposure is ubiquitous, average population level exposure may above the toxic limit, but be considered ‘normal’ (as in the case of blood lead levels in the middle of the 20th Century).
♦ Lack of toxicological and epidemiological information about the vast majority of environmental chemicals – of the 80,000 - 90,000 manmade chemicals in the world today, less than half have ever been tested for toxicity of even the most simple kind. There is a tremendous information gap which makes it often impossible to know if exposures measured by biomarkers are ‘dangerous’ or ‘safe’.
Methodological Issues
As discussed previously the choice and handling of the specific specimen type and biomarker to be measured is highly complex. Some of the important considerations are listed here – all of these issues must be thoroughly addressed for a project to be maximally effective and useful
♦ Analytical technique.

Annual Technical Volume :: CHDB 23
♦ Environmental contaminants and controls.
♦ Laboratory contamination and quality assurance.
♦ Correct choice of biomarker for study design and question.
♦ Rationale for selecting environmental chemicals of interest.
♦ Coordination with related research – epidemiology, toxicology, pharmacokinetic modeling, exposure assessment[9].
Interpretation of Data : Do collection protocols matter?
Biomonitoring (i.e., measurement of environmental chemicals, their metabolites, or specific reaction products in human biological specimens) to assess internal exposure (i.e., body burden) has increased considerably in the last two decades[6]. Biological matrices are complex; some may be difficult to obtain and available only in small amounts. Moreover, environmental chemicals are normally present in the biological matrix at trace levels.
Therefore, highly sensitive, specific, and selective multianalyte methods for the extraction, separation, and quantification of these chemicals must be developed[10]. Undoubtedly, the adequacy of biomonitoring data depends strongly on reliable analytical measurements[11].
Even when the best techniques are used, they guarantee accurate and precise measures of the biomarkers levels only in any given specimen. However, if the integrity of the specimen was compromised before its analysis, the analytical measures, although valid, could lead to erroneous interpretations. Sampling, storage, and processing conditions have long been appreciated as potential sources of contamination in trace analyses for metals and volatile organic compounds[12-14]. Unfortunately, adequacy of sampling and processing methods, albeit critical for the evaluation of all biomonitoring data, has not received as much attention as the analytical techniques, especially for semivolatile organic chemicals.
Risk Communication Issues
For the vast majority of environmental chemicals found in the human body, little or no toxicology/epidemiology is available with which to interpret the meaning, which presents tremendous ethical and communications challenges! Non-scientists often do not understand that our ability to measure a chemical in the body at very low levels very often outstrips our knowledge about what that actually means. Because of this large knowledge gap, excellent risk communication becomes critical. Similarly, being able to measure even a known toxicant in the body, usually does not tell us where it came from or the specific route of exposure. Rarely a specific isotope or chemical signature will identify a specific source but this is the exception rather than the usual condition. The context of the exposure must be fully defined before risk can be assessed.
While that context is being developed there is a tremendous need to communicate frankly with screened populations. When biomonitoring is being conducted in a ‘high risk’ population, there may be expectations that the results of the study will generate definitive action that will improve that specific communities public health risk. It is critical to work with such communities to develop mutually acceptable understanding of what the likely outcomes will be and to facilitate communication with policy makers and local public health officials as much as possible[15].
Community Expectations
Research using biomarkers is carried out to learn about what a particular biomarker can tell the researchers about environmental exposures, susceptibility, or risks for adverse health outcomes from those exposures. Thus, such research is generally undertaken in exposed communities, which may raise expectations within the community that the study will per se improve the situation in the community[16].
Annual Technical Volume :: CHDB 24
However, the reality is that, in many cases, the risks are poorly understood and the primary purpose of conducting the study is to clarify the associations between exposures and health consequences and the role of biomarkers in understanding these associations. Understanding the community expectations and developing a communication strategy before starting the research is an important part of biomarker research[13]. These issues are highlighted in two case reports outlining studies in children exposed to pesticides [Children’s Environmental Exposure Research Study (CHEERS)] or lead (Kennedy Krieger), These cases provide valuable lessons for conducting environmental health research in a community[12].
Ethical Issues
A variety of ethical issues arise when dealing with biological sampling, particularly when children are being sampled. Some of these issues are similar to general issues of research involving children such as gaining informed consent through surrogates (parents or caregivers). Others are more unique to biomonitoring. For example, most research protocols now demand that samples be anonymized to protect the privacy of research subjects, but this can be a problem if dangerous exposure levels are found. Biomonitoring often involves getting genetic material and banking it long term - so questions arise as to how this should be handled when samples are from minors. In addition, many biomonitoring studies are conducted by researchers from outside of the study population’s country giving rise to conflicting basic standards and values[15].
The study of biomarkers in children raises a number of special ethical considerations related to the collection and storage of specimens, consent, and how to convey information about risk, especially where the level of scientific knowledge is inadequate to quantify that risk[13]. Many of these issues are similar to those involving adults[17-20] but other issues may be unique to children[21].
References
1. Environmental Health Criteria 237. Principles for Evaluating Health Risks in Children Associated with Exposure to Chemicals. WHO, 2006.
2. Agency for Toxic Substances and Disease Registry. Case Studies in Environmental Medicine. Pediatric Environmental Health, Appendix F: 83, 2002
3. Center for Disease Control and Prevention. National Biomonitoring Program, CDC.
4. Committee on Human Biomonitoring for Environmental Toxicants. National Research Council, Human Biomonitoring for Environmental Chemicals, National Academies Press, 2006.
5. Agency for Toxic Substances and Disease Registry. Exposure-disease Model. Case Studies in Environmental Medicine, Pediatric Environmental Health, Appendix A, 2002
6. L L Needham, A M Calafat, D B Barr, Uses and Issues of Biomonitoring. Int.J. Hyg. Environ. Health 210, 229–238.0:229-238, 2007
7. European Human Biomonitoring. WHO, World Directory of Poisons Centres.
8. www.epa.gov/ncer/childrenscenters/washington.html – accessed March 2011
9. A M Calafat, L L Needham, What Additional Factors beyond State-of-the-art Analytical Methods are Needed for Optimal Generation and Interpretation of Biomonitoring Data? Environmental Health Perspectives, 117, no 10, 1481, 2009
10. L L Needham, D G Patterson, D B Barr, J Grainger, A M Calafat. Uses of Speciation Techniques in Biomonitoring for Assessing Human Exposure to Organic Environmental Chemicals. Analytical and Bioanalytical Chemistry, vol 381, no 2, 397-404, 2005.
11. J Angerer, U Ewers, M Wilhelm. Human Biomonitoring : State-of-the-art. International Journal of Hygiene and Environmental Health, vol 210, nos 3-4, 201–228, 2007.
12. D L Ashley, M A Bonin, F L Cardinali. Determining Volatile Organic Compounds in Human Blood from a Large Sample Population by using Purge and Trap Gas Chromatography / Mass Spectrometry. Anal Chem, 64, 1021–9, 1992.

Annual Technical Volume :: CHDB 25
13. B J Bolann, R Rahil-Khazen, H Henriksen, R Isrenn, R J Ulvik. Evaluation of Methods for Trace-element Determination with Emphasis on their Usability in the Clinical Routine Laboratory. Scand J Clin Lab Invest, vol 67, 353-366, 2007.
14. A Pineau, O Guillard, P Chappuis, J Arnaud, R Zawislak. Sampling Conditions for Biological Fluids for Trace Elements Monitoring in Hospital Patients : a Critical Approach. Crit Rev Clin Lab Sci, vol 30, 203-222, 1993.
15. P D Sly, B Eskenazi, J Pronczuk, R Šrám, F D Barriga, D G Machin, D Carpenter, S Surdu, E M Meslin. Ethical Issues in Measuring Biomarkers in Children’s Environmental Health. Environmental Health Perspectives, vol 117, no 8, 1187, 2009.
16. A Bradman, B Eskenazi, D B Barr, R Bravo, R Castorina, J Chevrier, K Kogut, M E Harnly, T E McKone. Organophosphate Urinary Metabolite Levels during Pregnancy and after Delivery in Women Living in an Agricultural Community. Environ Health Perspect, vol 113, no 12, 1802-7, Dec 2005.
17. J Caulfield, R Brown, M Meslin. Challenging a Well Established Consent Norm? One Time Consent for Biobank Research. J Int Biotechnol Law, vol 4, no 2, 69–74, 2007.
18. B J Evans, E M Meslin. Encouraging Translational Research through Harmonization of FDA and Common Rule Informed Consent Requirements for Research Will Banked Specimens. J Leg Med, vol 27, no 2, 119-166, 2006.
19. P R Helft, V L Champion, R Eckles, C S Johnson, E M Meslin. Cancer Patients’ Attitudes toward Future Research Uses of Stored Human Biological Materials. J Empir Res HumRes Ethics, vol 2, no 3, 15-22, 2007.
20. D Malkin. Predictive Genetic Testing for Childhood Cancer : Taking the Road Less Traveled. J Pediatr Hematol Oncol, vol 26, no 9, 546-548, 2004.
21. A B Neidich, J W Joseph, C Ober, L F Ross. Empirical Data about Women’s Attitudes towards a Hypothetical Pediatric Biobank. Am J Med Genet A, vol 46, no 3, 297-304, 2008.

Annual Technical Volume :: CHDB 26
Bottomless Refinery Concept : Operation and Control of IGCCM B Pipaliya, R P Bhatt, P B PatelChemical Engineering DepartmentL D College of Engineering,Ahmedabad 3800015e-mail : [email protected], [email protected], [email protected]
Abstract This paper presents an overview of the technologies and science of Integrated Gasification Combined Cycle (IGCC) plant. The IGCC is a power generation system that integrates a gasification process with a combined cycle. Coal or other hydrocarbon fuel such as petroleum coke, biomass is converted into syngas through the gasification system. The syngas consists mainly of Hydrogen (H2) and Carbon Monoxide (CO). After cleaning, the syngas is used as fuel in the combine cycle to produce electricity generation. The combined cycle is more efficient than conventional power-generating systems for it re-using waste heat to produce more electricity. IGCC plants can use any high hydrocarbon fuel, such as low and high-sulfur coal, anthracite, and biomass. IGCC plant is inherently lower emission of SOx, NOx than conventional coal based power plants; the desulfurization rate is 99%, nitrogen oxide emission is 15 to 20 % of that of the conventional power plants, the sulfur dioxide emission of current coal-based IGCC plant in between 10 and 140 mg/Nm3. Next generation IGCC plants with CO2 capture technology will be expected to have higher thermal efficiency and to hold the cost down because of simplified systems compared to conventional IGCC. IGCC plants with CO2 capture gained increased interest in recent years. However, until now there have no applications of CO2 capture at an electric power plant at a large scale (eg 100 MW or more), and no IGCC in operation with CO2 capture. Recent studies on IGCC plant with CO2 capture focus on the cost and performance which based on technical and economic assumptions. These results could provide useful references for the future operation of CO2 capture with IGCC plant.
Keywords : IGCC, Syngas, Hydrolysis, DeCO2, Claus process
Notations and Abbreviations
ASU Air Separation UnitDeCO2 Decreasing CO2 UnitDEA DiethanolamineELCA Exergetic Life Cycle AssessmentER Equivalence RatioGT Gas TurbineHE Heat ExchangerHHV High Heating ValueHP High PressureHRSG Heat Recovery Steam GeneratorIGCC Integrated Gasification Combined CycleLCA Life Cycle AssessmentLHV Low Heating ValueLP Low PressureMDEA MethyldiethanolamineMHE Multiple Heat ExchangersPVC PolyvinylchlorideST Steam Turbine

Annual Technical Volume :: CHDB 27
Introduction
IGCC is a combination of two leading technologies. The first technology is called coal gasification, which uses coal to create a clean-burning gas (syngas). The second technology is called combined-cycle, which is the most efficient method of producing electricity commercially available today. The objective of this work is to overview the technology development of IGCC power plant, included the advantages and disadvantages of the IGCC power plant. Then point out the research for currently main challenges for IGCC plant, the management of CO2 capture and the integration of the units. Research about IGCC plant technology started from the 1970s, coal-based IGCC plants are not completely commercial until now. The gasification capacity is predicted to grow by more than 70% by 2015 around the world; about 80% of the predicted growth will be in Asia, in which China is anticipated to increase most. Indian state-owned power generating utility NTPC Limited plans to develop an eco-friendly, 100-megawatt (MW) power plant based on IGCC technology. Other IGCC initiatives in the country include a 1000-MW petcoke-fired power plant proposed in January 2007 by Reliance Industries Limited for its refinery in Jamnagar, Gujarat.
IGCC is a technology that uses a gasifier to turn coal and other carbon based fuels into gas-synthesis gas (syngas). It then removes impurities from the syngas before it is combusted. Some of these pollutants, such as sulfur, can be turned into reusable byproducts. This results in lower emissions of sulfur dioxide, particulates, and mercury. With additional process equipment, the carbon in the syngas can be shifted to hydrogen via the water-gas shift reaction, resulting in nearly carbon free fuel. The resulting carbon dioxide from the shift reaction can be compressed and stored. Excess heat from the primary combustion and syngas fired generation is then passed to a steam cycle, similar to a combined cycle gas turbine. This results in improved efficiency compared to conventional pulverized coal.
Description of the Process
The IGCC is a power generation system that integrates a gasification process with a combined cycle. Coal (or other hydrocarbon fuel such as petroleum coke, biomass) is converted into syngas through the gasification system. The syngas consists mainly of H2 and CO. After cleaning, the syngas is used as fuel in the combine cycle to produce electricity generation. The combined cycle is more efficient than conventional power-generating systems for it re-using waste heat to produce more electricity. The basic scheme is an IGCC, reflecting the present technology of coal gasification systems, including particulate and H2S removal systems, coupled to a gas turbine combined cycle. With respect to this scheme two basic units have been added: a shift reaction section and a CO2 chemical absorption process, both working on the syngas stream before its combustion. For this reason, this cycle scheme will be referred to in the following as IGCC with DeCO2. In the gasifier, the coal is converted with the gasifying mediums oxygen and steam to a CO and H2 rich gas. This raw syngas contains several pollutants, especially carbonyl-sulphide (COS), hydrogen sulphide (H2S), CO and CO2 which need to be removed. First the COS, if present, is converted into H2S and carbon dioxide by means of COS-hydrolysis water gas reaction. In this way the COS sulphur content is converted in H2S which is more easily removable. The schematic diagram of the process is shown in Fig. 1.
Then H2S removal takes place, followed by a catalytic shift reaction. Here, CO reacts with water to produce CO2 and H2. This stage is required to obtain a hydrogen rich syngas from the carbon-monoxide-rich raw syngas; moreover, the obtained stream has a relevant CO2 content, which can be conveniently removed through a subsequent chemical absorption process. The clean hydrogen rich syngas leaves this section in pressurized conditions and is finally delivered to the combined cycle.
The choice of two separated systems for CO2 and H2S removal was imposed by the necessity of obtaining two separate streams, almost pure in CO2 and H2S respectively. In fact, while CO2 is sent to a disposal treatment, H2S is typically further processed to obtain valuable by products by the Claus process. For the removal of CO2 and H2S, chemical absorption with aqueous amines solutions has been selected; this is a well assessed process for H2S removal, and also the most developed CO2 removal technique. The gasification media are pure oxygen at ambient
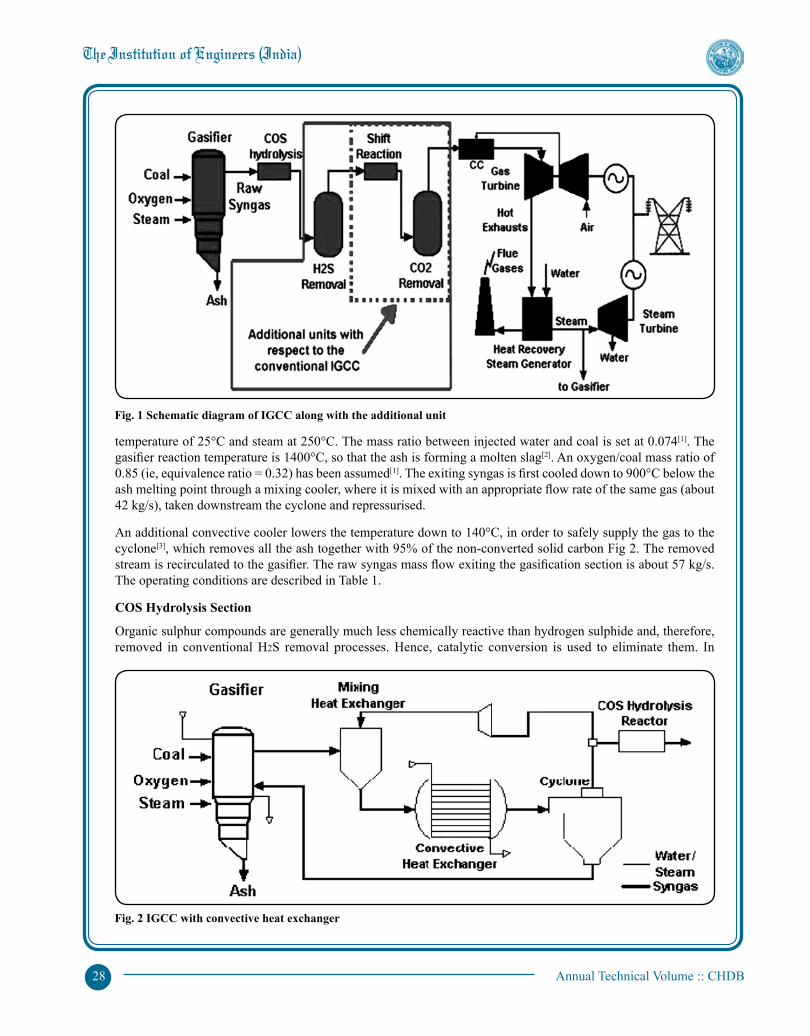
Annual Technical Volume :: CHDB 28
temperature of 25°C and steam at 250°C. The mass ratio between injected water and coal is set at 0.074[1]. The gasifier reaction temperature is 1400°C, so that the ash is forming a molten slag[2]. An oxygen/coal mass ratio of 0.85 (ie, equivalence ratio = 0.32) has been assumed[1]. The exiting syngas is first cooled down to 900°C below the ash melting point through a mixing cooler, where it is mixed with an appropriate flow rate of the same gas (about 42 kg/s), taken downstream the cyclone and repressurised.
An additional convective cooler lowers the temperature down to 140°C, in order to safely supply the gas to the cyclone[3], which removes all the ash together with 95% of the non-converted solid carbon Fig 2. The removed stream is recirculated to the gasifier. The raw syngas mass flow exiting the gasification section is about 57 kg/s. The operating conditions are described in Table 1.
COS Hydrolysis Section
Organic sulphur compounds are generally much less chemically reactive than hydrogen sulphide and, therefore, removed in conventional H2S removal processes. Hence, catalytic conversion is used to eliminate them. In
Fig. 1 Schematic diagram of IGCC along with the additional unit
Fig. 2 IGCC with convective heat exchanger
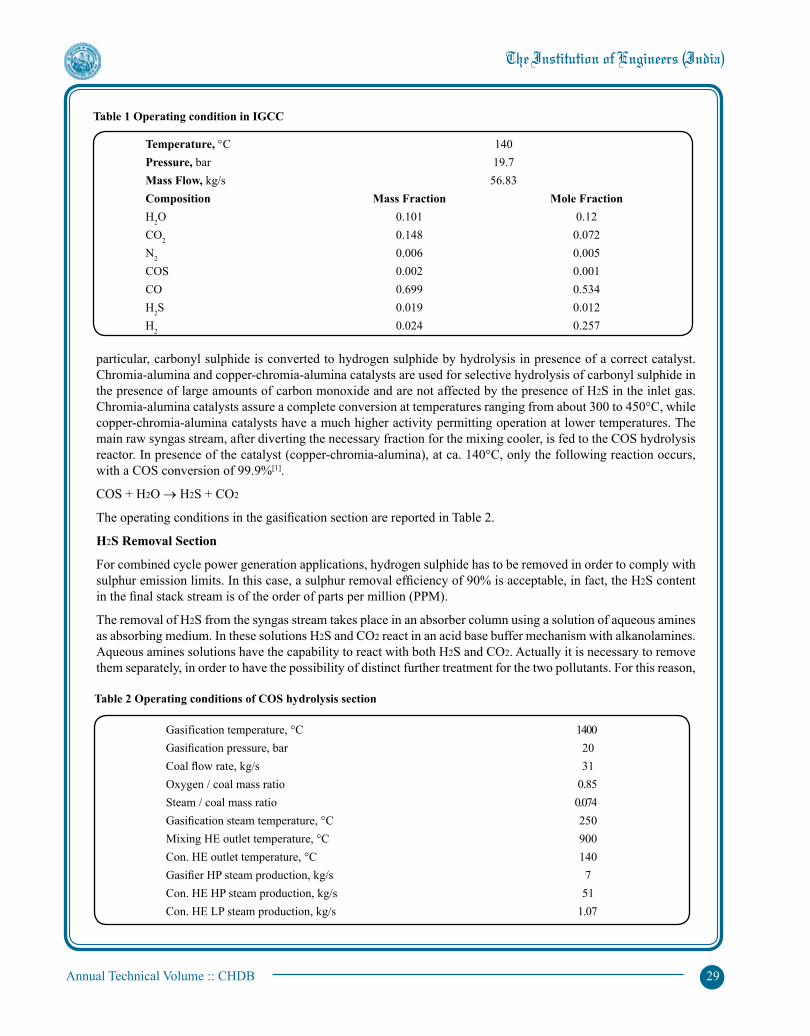
Annual Technical Volume :: CHDB 29
particular, carbonyl sulphide is converted to hydrogen sulphide by hydrolysis in presence of a correct catalyst. Chromia-alumina and copper-chromia-alumina catalysts are used for selective hydrolysis of carbonyl sulphide in the presence of large amounts of carbon monoxide and are not affected by the presence of H2S in the inlet gas. Chromia-alumina catalysts assure a complete conversion at temperatures ranging from about 300 to 450°C, while copper-chromia-alumina catalysts have a much higher activity permitting operation at lower temperatures. The main raw syngas stream, after diverting the necessary fraction for the mixing cooler, is fed to the COS hydrolysis reactor. In presence of the catalyst (copper-chromia-alumina), at ca. 140°C, only the following reaction occurs, with a COS conversion of 99.9%[1].
COS + H2O → H2S + CO2
The operating conditions in the gasification section are reported in Table 2.
H2S Removal Section
For combined cycle power generation applications, hydrogen sulphide has to be removed in order to comply with sulphur emission limits. In this case, a sulphur removal efficiency of 90% is acceptable, in fact, the H2S content in the final stack stream is of the order of parts per million (PPM).
The removal of H2S from the syngas stream takes place in an absorber column using a solution of aqueous amines as absorbing medium. In these solutions H2S and CO2 react in an acid base buffer mechanism with alkanolamines. Aqueous amines solutions have the capability to react with both H2S and CO2. Actually it is necessary to remove them separately, in order to have the possibility of distinct further treatment for the two pollutants. For this reason,
Gasification temperature, °C 1400 Gasification pressure, bar 20 Coal flow rate, kg/s 31 Oxygen / coal mass ratio 0.85 Steam / coal mass ratio 0.074 Gasification steam temperature, °C 250 Mixing HE outlet temperature, °C 900 Con. HE outlet temperature, °C 140 Gasifier HP steam production, kg/s 7 Con. HE HP steam production, kg/s 51 Con. HE LP steam production, kg/s 1.07
Table 2 Operating conditions of COS hydrolysis section
Temperature, °C 140 Pressure, bar 19.7 Mass Flow, kg/s 56.83 Composition Mass Fraction Mole Fraction H2O 0.101 0.12 CO2 0.148 0.072 N2 0.006 0.005 COS 0.002 0.001 CO 0.699 0.534 H2S 0.019 0.012 H2 0.024 0.257
Table 1 Operating condition in IGCC

Annual Technical Volume :: CHDB 30
the tertiary amine methyldiethanolamine (MDEA) has been chosen, which has capability of reacting selectively with H2S, differently from primary and secondary aminesmonoethanolamine (MEA) and diethanolamine (DEA). The H2S load solution needs to be thermally regenerated in a second column, working with an externally heated reboiler, before being recirculated back to the absorber. The absorber is working necessarily at pressurised conditions (about 18 bar), in order to preserve the syngas pressure level obtained in the gasifier. Since the solubility of H2S in the absorbing medium decreases with decreasing pressure[4], then it is useful to depressurise the H2S rich solution down to ambient pressure before entering the stripper. Before recirculation of the H2S lean solution into the absorber, the stream passes through a regenerative heat exchanger, heating up the load solution entering the stripping column (Fig 3). The lean solution has to be further cooled down to 30°C and then repressurised at the absorber inlet condition level. H2S removal section working conditions are summarised in Table 3.
CO2 Removal Section : DeCO2 Unit
The 92.3% of CO2 removal takes place in an absorbing column by chemical absorption with an amines aqueous solution. A blend of 50 % water, 25 % MDEA and 25 % DEA (mass basis) has been chosen, which was found to be a composition effectively reducing the energy demand for its regeneration. In order to reach a 92.3% carbon dioxide removal, a solution mass flow of 17 kg solution per kg of coal (526 kg/s) has been selected. Such a high degree of removal is required to obtain a global removal efficiency of 85% referred to the CO2 content in the exhausts of a standard IGCC, ie, without shift and CO2 removal sections. The CO2 load solution is first depressurised down
Absorber working pressure, bar 18.9 Absorber inlet syngas temperature, °C 40 Absorber outlet syngas temperature, °C 36.4 Absorber inlet solution temperature, °C 30.5 Absorber outlet solution temperature, °C 47.7 Stripper working pressure, bar 1 Stripper inlet solution temperature, °C 79.4 Stripper outlet solution temperature, °C 99.5 Stripper outlet gas temperature, °C 81 MDEA make up, kg/s 0.001 Water make up, kg/s 0.512
Table 3 Operating condition in H2S removal section
Solution GasRefrigerating water
Syngasfrom COShydrolysis
CO2 load solution from CO2 removal
H2S free syngas to shift section
Absorber
Valve
Load solution
Condensingwater
Pump
HE
RHE
MDEA Water
H2S rich gasto claus process
Stripper
Leansolution
1
Fig. 3 Schematic diagram of H2S removal section
1
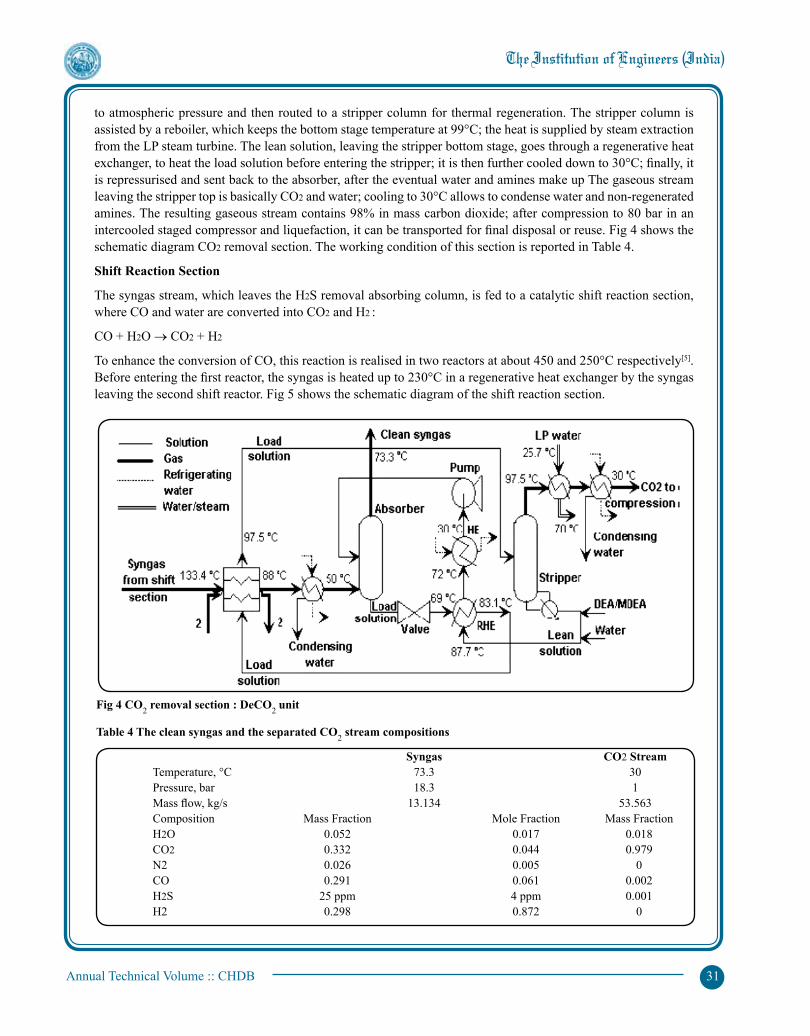
Annual Technical Volume :: CHDB 31
to atmospheric pressure and then routed to a stripper column for thermal regeneration. The stripper column is assisted by a reboiler, which keeps the bottom stage temperature at 99°C; the heat is supplied by steam extraction from the LP steam turbine. The lean solution, leaving the stripper bottom stage, goes through a regenerative heat exchanger, to heat the load solution before entering the stripper; it is then further cooled down to 30°C; finally, it is repressurised and sent back to the absorber, after the eventual water and amines make up The gaseous stream leaving the stripper top is basically CO2 and water; cooling to 30°C allows to condense water and non-regenerated amines. The resulting gaseous stream contains 98% in mass carbon dioxide; after compression to 80 bar in an intercooled staged compressor and liquefaction, it can be transported for final disposal or reuse. Fig 4 shows the schematic diagram CO2 removal section. The working condition of this section is reported in Table 4.
Shift Reaction Section
The syngas stream, which leaves the H2S removal absorbing column, is fed to a catalytic shift reaction section, where CO and water are converted into CO2 and H2 :
CO + H2O → CO2 + H2
To enhance the conversion of CO, this reaction is realised in two reactors at about 450 and 250°C respectively[5]. Before entering the first reactor, the syngas is heated up to 230°C in a regenerative heat exchanger by the syngas leaving the second shift reactor. Fig 5 shows the schematic diagram of the shift reaction section.
Fig 4 CO2 removal section : DeCO2 unit
Syngas CO2 Stream Temperature, °C 73.3 30 Pressure, bar 18.3 1 Mass flow, kg/s 13.134 53.563 Composition Mass Fraction Mole Fraction Mass Fraction H2O 0.052 0.017 0.018 CO2 0.332 0.044 0.979 N2 0.026 0.005 0 CO 0.291 0.061 0.002 H2S 25 ppm 4 ppm 0.001 H2 0.298 0.872 0
Table 4 The clean syngas and the separated CO2 stream compositions

Annual Technical Volume :: CHDB 32
In the first reactor, steam at 230 °C and 18.6 bar is supplied for the reaction to take place in the ratio of 1.5 moles of water per mole of CO (37.91 kg/s)[5]. This steam comes from an extraction from the steam turbine.
The first reactor outlet stream (450°C) is cooled down to 230°C, in an intermediate shift heat exchanger, and fed to the second reactor.
At the exit of the reactors, the CO conversion is 90 % in the presence of the catalysts. The CO2 mass fraction passes from 0.156 to 0.729 and to 0.868 after the water condensation. The composition of the syngas leaving the shift section is reported in Table 5.
Claus Process Section
The claus process section contains two reactors. The third part of the H2S rich gas enters the first reactor, where it is burnt to sulphur dioxide at 1100°C.
2H2S + 3O2 ↔ 2SO2 + 2H2O
The gas exiting from this reactor is mixed with the rest of the H2S rich gas in the second reactor to produce elemental sulphur over a bauxite or alumina catalyst at about 200°C[2].
2H2S +SO2 ↔ 3 S + 2H2O
Table 5 Composition of syngas leaving shift section
Temperature, °C 50 Pressure, bar 18.3 Mass flow, kg/s 65.439 Composition Mass Fraction Mole Fraction H2O 0.006 0.006 CO2 0.868 0.378 N2 0.005 0.004 CO 0.06 0.041 H2S 0.001 0 H2 0.06 0.57
HP steam 440°C to be further superheated in the gasification section
LP steam 188°C to be further superheated in the gasification section
Steam 1st shift reactor
SyngasWater steam
Syngas from H2S removal
2nd shift reactor180°C
324.5°C
IntermediateHE
RHE
25 °C1.013 bar
27.4 °C120 bar
Syngas toCO2 removal
150°C
Condensed water
LP water 70°C preheated in the CO2 removal section
Fig 5 Shift reaction section
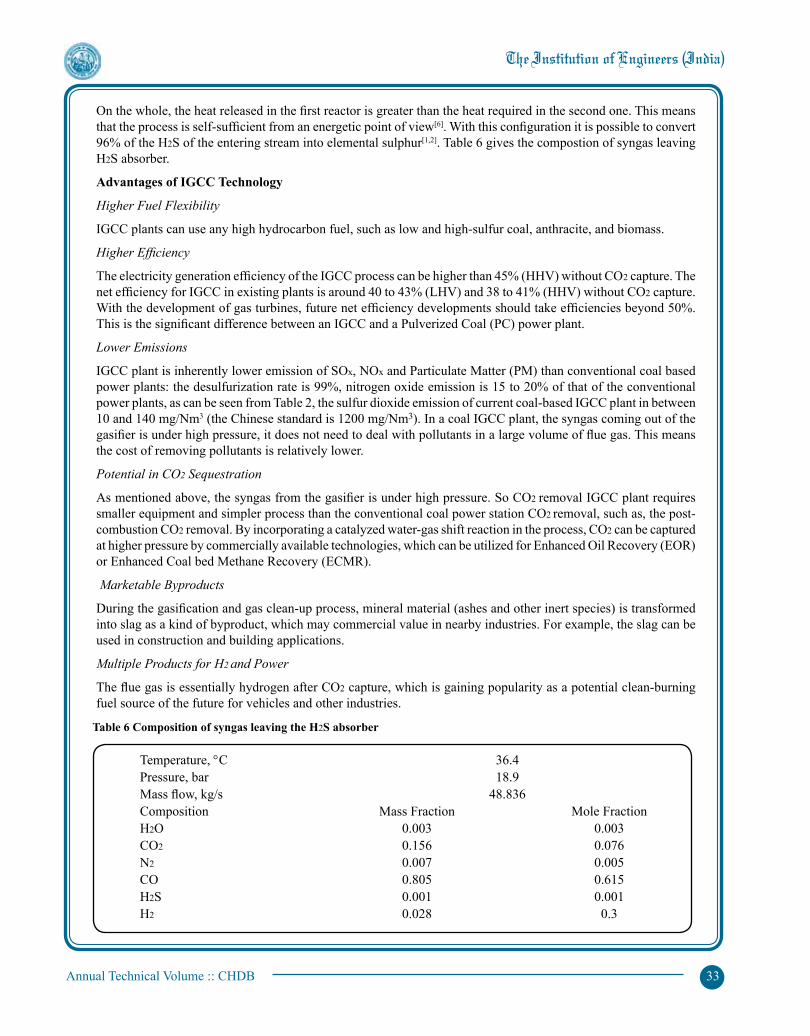
Annual Technical Volume :: CHDB 33
On the whole, the heat released in the first reactor is greater than the heat required in the second one. This means that the process is self-sufficient from an energetic point of view[6]. With this configuration it is possible to convert 96% of the H2S of the entering stream into elemental sulphur[1,2]. Table 6 gives the compostion of syngas leaving H2S absorber.
Advantages of IGCC Technology
Higher Fuel Flexibility
IGCC plants can use any high hydrocarbon fuel, such as low and high-sulfur coal, anthracite, and biomass.
Higher Efficiency
The electricity generation efficiency of the IGCC process can be higher than 45% (HHV) without CO2 capture. The net efficiency for IGCC in existing plants is around 40 to 43% (LHV) and 38 to 41% (HHV) without CO2 capture. With the development of gas turbines, future net efficiency developments should take efficiencies beyond 50%.This is the significant difference between an IGCC and a Pulverized Coal (PC) power plant.
Lower Emissions
IGCC plant is inherently lower emission of SOx, NOx and Particulate Matter (PM) than conventional coal based power plants: the desulfurization rate is 99%, nitrogen oxide emission is 15 to 20% of that of the conventional power plants, as can be seen from Table 2, the sulfur dioxide emission of current coal-based IGCC plant in between 10 and 140 mg/Nm3 (the Chinese standard is 1200 mg/Nm3). In a coal IGCC plant, the syngas coming out of the gasifier is under high pressure, it does not need to deal with pollutants in a large volume of flue gas. This means the cost of removing pollutants is relatively lower.
Potential in CO2 Sequestration
As mentioned above, the syngas from the gasifier is under high pressure. So CO2 removal IGCC plant requires smaller equipment and simpler process than the conventional coal power station CO2 removal, such as, the post-combustion CO2 removal. By incorporating a catalyzed water-gas shift reaction in the process, CO2 can be captured at higher pressure by commercially available technologies, which can be utilized for Enhanced Oil Recovery (EOR) or Enhanced Coal bed Methane Recovery (ECMR).
Marketable Byproducts
During the gasification and gas clean-up process, mineral material (ashes and other inert species) is transformed into slag as a kind of byproduct, which may commercial value in nearby industries. For example, the slag can be used in construction and building applications.
Multiple Products for H2 and Power
The flue gas is essentially hydrogen after CO2 capture, which is gaining popularity as a potential clean-burning fuel source of the future for vehicles and other industries.
Temperature, °C 36.4 Pressure, bar 18.9 Mass flow, kg/s 48.836 Composition Mass Fraction Mole Fraction H2O 0.003 0.003 CO2 0.156 0.076 N2 0.007 0.005 CO 0.805 0.615 H2S 0.001 0.001 H2 0.028 0.3
Table 6 Composition of syngas leaving the H2S absorber
Annual Technical Volume :: CHDB 34
Disadvantages of IGCC Technology
Despite there are a lot of advantages about IGCC plant technology, there are some risk that needed to overcome, M.Pe´rez-Fortes present the current challenges in IGCC plants are capital cost and technology availability/ reliability.
Higher Investment
Compared to an ultra-supercritical PC plant, an IGCC system required 6 to 10% more capital investment.
Lower Reliability
Although in recent years the availability of IGCC plant technology has increased significantly, it is only about 80%, which is still lagging behind PC plant technology. The reliability is still being considered as one of the most important obstacles. Of course the long construction period and little operating experiences are also the shorting comings of IGCC plant technology.
Conclusion
For bottomless refinery concept, the entire bottom residue have to be utilised as the useful product and for that the bottom residue from refinery was used as a feedstock for the gasifier. Gasifier converted these bottom residues into useful gases which produced electricity by the use of turbine and also provided useful heat for steam generation. Besides the reduction the cost of IGCC plant, the enhancement of the efficiency of the site and the improvement of reliability, CO2 management is also the main targets to improve the commercialization and competitiveness of IGCC plant technology. Recent studies on IGCC plant with CO2 capture focus on the cost and performance which based on technical and economic assumptions. These results could provide useful references for the future operation of CO2 capture with IGCC plant. Various separation technologies for CO2 capture should be investigated since the improvements of CO2 capture technology could make IGCC plant more competitive compared to other types of power plant. Substituting CO2 for N2 as a coal transport gas in dry-feed gasifier could improve hydrogen production from the gasifier.
References :1. R Kloster, Thermodynamische Analyse und Optimierung von Gas-/Dampfturbinen-Kombi-Kraftwerkenmit integrierter
Kohlevergasung. Fortschritt-Berichte, VDI Reihe 6, Nr. 409, Duesseldorf: VDI Verlag.
2. D Merrick, Coal Combustion and Conversion Technology. Higher and Further Education Division, MacMillan Publishers Ltd, London and Basingstoke, Hong Kong.
3. E Weber, W Brocke, Apparate undVerfahrenderindustriellen asreinigung. Band1: Feststoffabscheidung Oldenburgverlag GmbH, Muenchen.
4. D M Austgen, G T Rochelle, C Xiao, C Peng,. Model of Vapor-Liquid Equilibria for Aqueous Acid Gas-Alkanolamine Systems using the Electrolyte-NRTL Equation Ind. Eng. Chem. Res.28, 1060-1073.
5. P Chiesa, S Consonni, Shift Reactors and Physical Absorption for Low CO2 Emission IGCCs. 43rd ASME Gas Turbine and Aeroengine Congress, Stockholm, June 2-5.
6. D Fiaschi, L Lombardi, Università degli Studi di Firenze via Santa Marta 3, 50139 Firenze-Italy.

Annual Technical Volume :: CHDB 35
Heat Transfer in Nuclear ReactorsA K SaxenaC23, First Floor, First Flat, Palm Beach CHS, Sector 4, Nerul (W), New Mumbai 400706e-mail : [email protected]
Abstract : Heat transfer in Nuclear Reactors stands out among the heat transfers in other fields mainly due to the requirement of removal of significantly large quantity of heat from a relatively small size heat source (nuclear fuel). The proposed paper will highlight the salient features of the heat transfer including problem areas. The heat transfer is classified into two sections: (i) during normal reactor operations and (ii) during accidental condition(s). Thermal hydraulics in both sections are quite different. Boiling is of importance in nuclear reactor systems as it provides (a) high heat transfer rates from fuel to coolant and (b) generation of steam. Referring to section (i), correct flow and heat transfer regimes are selected to achieve high heat transfer coefficient during normal reactor operation. Referring to section (ii), adequate coolant flow rate under conditions of specific temperature and wet front velocity (commonly called rewetting velocity) to avoid Loss of Coolant Accident (LOCA), is to be established. The concept of rewetting and its application will be explained. Experimental and theoretical methods to calculate rewetting velocity will be discussed in detail. Application of rewetting velocity to mitigate consequences of LOCA will be brought in emphatically.
Keywords : LOCA, Rewetting velocity, Wet front, ECCS, Softening.
Notations and Abbreviationsc Specific heat of water, kWh/kgK dr Radial mesh size, mh Heat transfer coefficient, W/m2Ki Radial directionj Axial directionk Thermal conductivity, kW/mK lpm Litre per minuteL Height of fuel and clad, mp Circumference of clad outer surface, m Q Maximum linear power from fuel, kW/m r Radius, mT Temperature, Kw Mass flow rate of water, kg/hz Axial coordinateSubscript
1 For radius of fuel2 Inner radius of clad3 Outer radius of clad c Clad conductivityci Water inlet temperaturef Fuel temperature with T, conductivity with k, with dr for radial mesh size g gap conductivity
Introduction
Nuclear reactors generally use rod clusters housed in a channel as fuel. The coolant flows in between the fuel rods. They are designed for safety not only during normal operation, but also during abnormal and accident conditions. Most of the nuclear fission energy in a reactor appears as heat, which is generally utilised to produce steam for
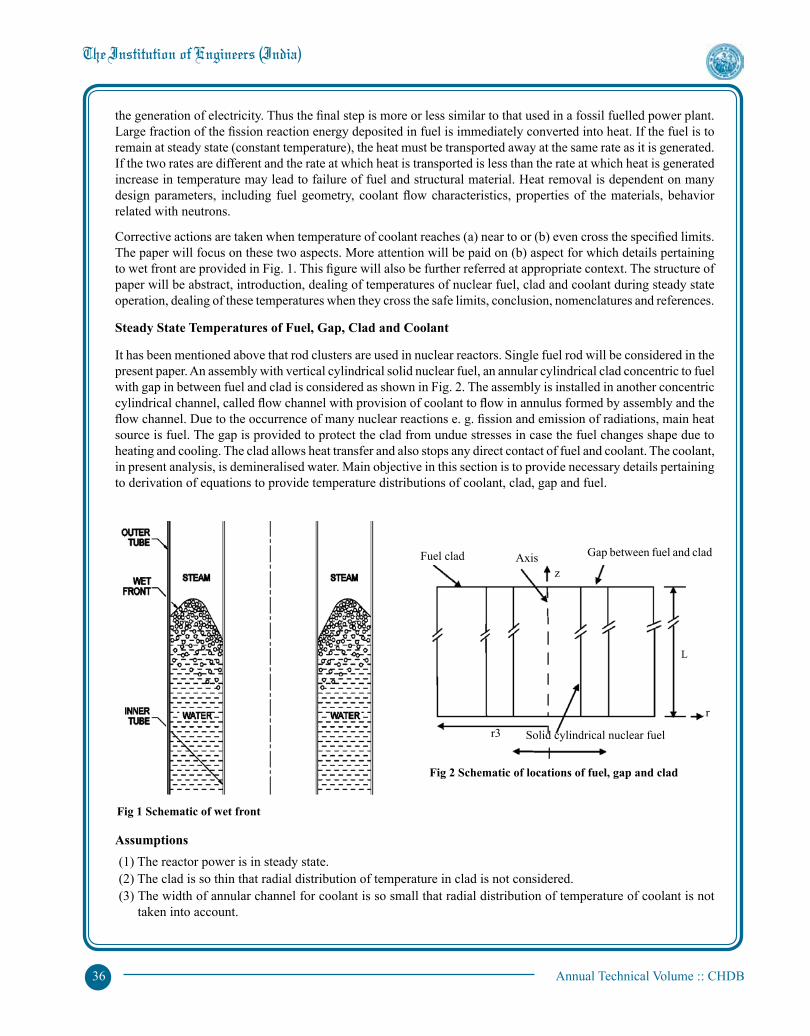
Annual Technical Volume :: CHDB 36
the generation of electricity. Thus the final step is more or less similar to that used in a fossil fuelled power plant. Large fraction of the fission reaction energy deposited in fuel is immediately converted into heat. If the fuel is to remain at steady state (constant temperature), the heat must be transported away at the same rate as it is generated. If the two rates are different and the rate at which heat is transported is less than the rate at which heat is generated increase in temperature may lead to failure of fuel and structural material. Heat removal is dependent on many design parameters, including fuel geometry, coolant flow characteristics, properties of the materials, behavior related with neutrons.
Corrective actions are taken when temperature of coolant reaches (a) near to or (b) even cross the specified limits. The paper will focus on these two aspects. More attention will be paid on (b) aspect for which details pertaining to wet front are provided in Fig. 1. This figure will also be further referred at appropriate context. The structure of paper will be abstract, introduction, dealing of temperatures of nuclear fuel, clad and coolant during steady state operation, dealing of these temperatures when they cross the safe limits, conclusion, nomenclatures and references.
Steady State Temperatures of Fuel, Gap, Clad and Coolant
It has been mentioned above that rod clusters are used in nuclear reactors. Single fuel rod will be considered in the present paper. An assembly with vertical cylindrical solid nuclear fuel, an annular cylindrical clad concentric to fuel with gap in between fuel and clad is considered as shown in Fig. 2. The assembly is installed in another concentric cylindrical channel, called flow channel with provision of coolant to flow in annulus formed by assembly and the flow channel. Due to the occurrence of many nuclear reactions e. g. fission and emission of radiations, main heat source is fuel. The gap is provided to protect the clad from undue stresses in case the fuel changes shape due to heating and cooling. The clad allows heat transfer and also stops any direct contact of fuel and coolant. The coolant, in present analysis, is demineralised water. Main objective in this section is to provide necessary details pertaining to derivation of equations to provide temperature distributions of coolant, clad, gap and fuel.
Assumptions(1) The reactor power is in steady state.(2) The clad is so thin that radial distribution of temperature in clad is not considered.(3) The width of annular channel for coolant is so small that radial distribution of temperature of coolant is not
taken into account.
Fig 1 Schematic of wet front
Fig 2 Schematic of locations of fuel, gap and clad
Solid cylindrical nuclear fuel
Gap between fuel and clad
zFuel clad Axis
r3
r
L

Annual Technical Volume :: CHDB 37
(4) The heat loss at ends from assembly is zero.(5) The heat loss from flow channel to outside is zero.(6) The linear power in fuel follows cosine distribution.
Description of Equation
Separate equations are derived for the calculation of temperatures of coolant, clad, gap and fuel. The basics given in [1, 2] provides good foundation to proceed further in present work[1,2]. Detailed derivation, which is lengthy and involves several steps, is out of scope of this paper. In the beginning of derivation of equations first coolant is considered. The differential equation using heat balance over the control volume is obtained. The integration of the differential equation using appropriate boundary conditions leads to equation for calculation of coolant temperature at the height for which heat output is considered. Similar steps are followed for deriving equation for clad using earlier derived equation for coolant. Procedure is followed for the derivation of equation for gap and then for fuel. Fuel has been divided into radial and axial nodes respectively presented by i and j . The final form of equation for temperature of fuel is given as Eq. (1).
(1)
where (2)
and (3)
Results
A computer program was developed and equations were solved. Important results are provided and discussed as follows:
Axialnode Temperatures(forfirstradial Temperatures(forlast numbers node no. 1 located at axis), K radial node no. 5), K 1 417.0 417.0 2 710.6 661.2 3 1009.8 930.0 4 1124.7 1040.8 5 1200.5 1120.7 6 1209.3 1160.1 7 1033.3 1033.5
Table 2 Axial temperatures at various nodes in fuel
Variable name Unit Values Heat transfer coefficient (h) W/m2K 206 Height of fuel, gap, clad and coolant channel (L) m 1.304 Maximum linear power from fuel (Q) kW/m 4.33 Fuel radius (r1) m 0.0113 Clad inner radius (r2) m 0.0115
Table 1 Values of important variables for arriving results

Annual Technical Volume :: CHDB 38
Discussions
It is clear from Fig. 3 that the maximum temperature of fuel is reached in the region which is top half of the fuel height. This is applicable for both cases (i) fuel axis and (ii) away from fuel axis. This may be noted that the knowledge of maximum fuel temperature is important from the aspect of melting of fuel. The fuel is of many varieties such as metallic uranium, uranium dioxide. The nuclear reactor is required to be operated such that the maximum temperature of fuel remains lower than fuel melting temperature by reasonable margin.
Radial node Temperatures (for node no 4 Temperatures (for node no. 6 numbers located at axis), K located at axis), K 1 1124.7 1209.3 2 1120.6 1206.9 3 1108.2 1199.6 4 1087.4 1087.4 5 1040.8 1160.1
Table 3 Radial temperatures at axial nodes (nos 4 and 6) in fuel
Fig 3 Variation of axial temperatures with node numbers (node no. 1 at bottom and no. 7 at top of fuel)
Fig 4 Variation of temperatures with radial node numbers
Annual Technical Volume :: CHDB 39
Knowledge of the location of maximum temperature of fuel is also important to understand the region where maximum fuel expansion is likely to take place. When irradiated fuel rod is taken out of the reactor core with all radiation safety precautions, close observation on clad/flow tube is made in the region of maximum fuel temperature. This helps the user to forecast the likely split or rupture of fuel clad. It is clear from Fig. 4 that axial node 6 cools at slower rate as compared to axial node 4. This observation is in line with observation made in Fig. 3.
Conclusions
(1) Eq. (1) is strictly applicable for cylindrical geometry. Separate equations are required to be developed for other geometries.
(2) Large number of radial and axial nodes will provide more accurate values of fuel temperatures and their locations.
Unsteady State and Loss of Coolant Accident, Consequences and Mitigation
This section will cover the scenarios developed when heat is transported at a rate less than the rate at which heat is generated in the fuel rod. A number of Postulated Initiating Events (PIEs), which could result in abnormal /accident conditions, are considered at the design stage itself. The accident scenarios considered in the design are called Design Basis Accidents (DBAs). LOCA which involves a failure in the pressure boundary of the Primary Coolant System (PCS) is one such DBA. Even though the probability of occurrence of a LOCA is extremely small, adequate Engineered Safety Features (ESFs) are provided to mitigate the consequences of a LOCA and to ensure safety.
Following a rupture in the primary pressure boundary of the PCS, the coolant which is at high pressure and high enthalpy escapes from the system in a very short time. Thus the reactor core is voided rapidly due to this blowdown and heat removal rate from the fuel is drastically reduced. Even after the reactor is shutdown, considerable heat generation in the fuel continues due to the decay of fission products. In addition, the energy which is stored in the fuel under normal operating conditions is also considerable. In the absence of adequate heat removal, this stored heat and heat due to decay of fission products causes a rise in the temperature of the fuel clad. If this temperature is high enough, metal water reaction, which is exothermic, could take place, thus resulting in another source of heat. This reaction also results in clad oxidation and Hydrogen/Deuterium generation. To provide cooling to the fuel and mitigate the consequences following a LOCA, the Emergency Core Cooling System (ECCS) is provided as an Electro Structured Fluid (ESF).
Nuclear reactors also have fuel with vertical orientation. The thermal hydraulic behaviour of hot vertical channels during emergency core cooling conditions is of great interest in the context of LOCA. It may also be noted that the heat transfer mechanisms encountered in a vertical channel could be direction-dependent, i.e. whether the flow of coolant is from bottom to top or from top to bottom. Following the blowdown phase of LOCA, the clad temperature may quickly rise to a value high enough, so that the injected emergency coolant will not wet the clad immediately on coming into contact. The re-establishment of liquid contact with the surface, resulting in substantially higher heat transfer coefficient, is called rewetting. Rewetting of clad is essential for effective heat removal by the emergency coolant. When clad temperature exceeds rewetting temperature and cooling water is introduced in the annulus from bottom, after gradual cooling at the inlet end wet front is formed. As the coolant introduction is continued the wet front moves up. Wet front location is shown somewhere in the middle of channel in Fig. 1. Reaching of wet front at a particular location at specific time is very important to ensure that clad temperature does not rise to unsafe value at that location. Therefore the phenomenon of rewetting of hot surfaces is of great interest in the context of cooling of nuclear reactor fuel by the injected emergency coolant, following a LOCA. It may be noted that this phenomenon is also of interest in many other industries involving quenching of hot solids.
Rewetting temperature is taken as 473.16 K [3]. Experimental work for the determination of rewetting velocity and the computer program to calculate the same are available in earlier works [4, 5, 6] and therefore are not included in this paper.
Assumptions
(1) Nuclear reactor with vertical fuel orientation has operated at steady power for sufficient duration such that coolant has attained steady inlet and outlet temperatures.

Annual Technical Volume :: CHDB 40
(2) There is double ended guillotine rupture in coolant inlet header.(3) It is assumed that stoppage of coolant to reactor is so rapid that the coolant pressure at inlet as well as outlet
suddenly drops to atmospheric pressure and clad temperature exceeds rewetting temperature.(4) Wet front is formed at inlet of clad after its gradual cooling and present analysis assumes three regions on
clad surface. First region is from inlet end to beginning of wet front region. Second region includes wet front region and third region is downstream to wet front region.
(5) Wet front region is assumed located in central region of clad. Diameter of clad is so small as compared to length of clad that relative to wet front region, locations of inlet and outlet ends are described at –∞ and +∞ respectively.
Results
(i) Only CladThe comparison is shown in Fig. 5.
Fig 5 Comparison of experimental rewetting velocities with rewetting velocities by program
Table 4 Comparison of experimental rewetting velocities with rewetting velocities using computer program, length of fuel pin simulator = 3030 mm
Initial temperature of S S Clad Experimental rewetting Rewetting velocity perwaterflowrate, K/lpm velocity, mm/s [4, 5] using program, mm/s 473.16/3.0 294.0 295.0 473.16/5.2 500.0 510.3 673.16/6.2 123.8 123.6 673.16/7.3 130.1 128 773.16/2.8 76.2 73.8 773.16/4.1 90.0 78.6
Annual Technical Volume :: CHDB 41
Discussions
It is clear from Table 4 and Fig. 5 that the experimental rewetting velocities are reasonably close to the rewetting velocities obtained by program. The same observations are made from data given in Table 5. Therefore the rewetting velocities can be used to predict the location of wet front on the clad. This will ensure that the location at which wet front has reached has been sufficiently cooled and there is no chance of softening of clad.
Conclusions
(1) As reaching of clad to softening temperature is unsafe for the nuclear reactor the results are very useful to avoid any split or rupture of clad.
(2) Data pertaining to rewetting velocities are reliable and can be used for the design of ECCS.
References
1. S Glasstone, A Sesonske, Nuclear Reactor Engineering, CBS Publishers and Distributors Pvt. Ltd., Fourth Edition, vol. 1 & 2, 2004.
2. K S Ram, R Ramanna, Basic Nuclear Engineering, Wiley Eastern Limited, 1977.
3. V Venkat Raj, Studies on the Rewetting of Hot Horizontal Surfaces, Ph.D. Thesis, I I T. Bombay, 1985.
4. A K Saxena, V Venkat Raj, V Govardhana Rao , Experimental Studies on Rewetting of Hot Vertical Annular Channel, Nuclear Engineering and Design, 208, 283-303, 2001.
5. A K Saxena, Studies on the Rewetting of Hot Vertical Annular Channel, Ph.D. Thesis, IIT Bombay, 1998.
6. A K Saxena, Arresting the Accidental Discharge of Nuclear Wastes by Modeling the Fuel and Clad, Energy Procedia, 7, 512-517, 2011
7. B D G Piggott, R B Duffey, The Quenching of Irradiated Fuel Pins, Nuclear Engineering and Design, 32, 182, 1975.
8. J J Carbajo, Parametric Study on Rewetting Velocities obtained with a Two-dimensional Heat Conduction Code, Nuclear Engineering and Design, 92, 69-87, 1986
Lengthoffuelpinsimulator Waterflowrate,lpm/ Rewettingvelocityby (withfuel/filler),mm/ initialtemperatureofclad presentwork,mm/s materialofclad/(fuel/filler) (fuel/filler),K 500/Zircaloy/ MgO2 (Sintered) 0.6/973.16/973.16 18.8; 11.8[7]
3030/ Zircaloy/UO2 3.5/477.16/1123.16 15.0; 12.0[8]
Table5Comparisonofrewettingvelocitiesusingprogramandotherresearcher’swork
(ii) Fuel with Clad
Annual Technical Volume :: CHDB 42
Horizontal Distillation ColumnN Parmar, H Parmar, C Akbari V. V. P. Engineering CollegeRajkot 360005e-mail : [email protected], [email protected], [email protected]
Abstract : Distillation is the method of separating a substance that is in solution from its solvent or of separating a liquid from a mixture of liquids having different boiling points. In refineries distillation process is generally carried out in distillation columns, which are generally tall vertical towers. One of the biggest drawbacks of these columns is excessive thickness of column due to wind loads and higher maintenance cost. One of the alternatives to this issue is the use of horizontal column. The basic construction of the horizontal column contains a horizontal cylindrical shell with jacketed heaters. The shell has an inlet for the feed, an outlet for the non-volatile heavy components and an outlet for lighter volatile components. An ejector is placed at the end of the condensation equipments. All volatile component gets vaporized and non-volatile components separates out through the outlet. The vapours of volatile components get sucked by the means of steam ejector. This mixture is passed through the series of condensers which are maintained at different temperatures, where vapours condenses according to their dew point. Hence components gets separated. The proposed equipment is advantageous in the way that maintenance and fixed cost are reduced. Never the less these merits are at the cost of longer space and capital investment.
Keywords : Horizontal distillation column, Jacketed heaters, Ejector, Dew point.
Introduction
Distillation is a process of physically separating a mixture of two or more components having different boiling points, by preferentially boiling the more volatile components out of the mixture. When a liquid mixture of two or more volatile components is heated, the vapour that comes off will have a higher concentration of the more volatile components than the liquid mixture from which it has evolved. Conversely, if a vapour mixture is cooled, the less volatile components in that vapour will condense in a greater proportion than the more volatile components.
Distillation column is the most important apparatus which is being used in the refineries. Conventional distillation columns are used to separate components in multi-component vapour. The vapour is fed up a column which is cooled primarily at the top by a condenser. The least volatile compounds in the vapour will condense out on the trays or packing of the column obeying Raoult’s law, Dalton’s law and the preservation of mass balance. The more volatile compounds will condense in the column at the higher level vapour rises in the column. The distillation process involves both stripping and rectifying. As the liquid condenses in the column, it will flow downwards and as it does, it will contact and rectify or cause to condense the less volatile compounds in the rising vapour. At the same time, the rising vapour will preferentially strip the more volatile compounds from the downward flowing liquid.
The thermodynamic efficiency of a distillation tower may be enhanced by providing intercondensors and/or inter-reboilers along the distillation tower. The problem is again that of expense and complexity of design.
The prior art distillation columns are used in such industrial processes as refining crude oil and chemical processes to produce various useful end products. These columns are usually elaborate, reach large heights, require large capital expenditures to construct and large ongoing expenses of operation and maintenance. Often, the columns must be different diameters in different sections of the column to avoid flooding the column or column dry-out, both of which are recognized difficulties in the industry. The changes in diameter exacerbate the expense and complexity of prior art columns.
Therefore, there is a need in the art for a relatively efficient distillation system which is inexpensive and conveniently simple to design and build. Hence, horizontal distillation column is an alternative of the conventional columns.

Annual Technical Volume :: CHDB 43
Principle
The basic principle for the separation of volatile components through the horizontal column is boiling points followed by dew point of the substances.
Construction
The construction of horizontal distillation column would consist of a feed inlet which would be connected to a horizontally placed shell. The shell is covered by a jacketed heater. It has an outlet for the less volatile components and another outlet for the mixture of volatile components. The set up of horizontal distillation column is shown in Fig 1.
The material of construction of shell must have high melting point. It should be non-corrosive, chemically inert and should withstand pressure.
The outlet for the more volatile components will be connected with the series of condensers. The material of construction of condensers should withstand pressure, it should be chemically inert. The slippery or frictionless inside surface of condensers will be desirable. The vacuum pump will be placed after the series of condensers.
Method
The feed, which would be a mixture of more volatile as well as less volatile components, would enter from the feed inlet into the horizontal shell. Let us suppose that the feed consists of four components A, B, C and D which are to be separated. Component D is least volatile. A, B and C are more volatile components which are to be separated. After entering the shell the mixture would be heated up with the help of jackets around the shell. The shell should be provided heating in such a way that the temperature does not exit the boiling point of the non desirable less volatile residue. Hence, the more volatile components would get vapourized up and the less volatile component D can be removed from the outlet.
Fig. 1 Horizontal distillation colulmn
Annual Technical Volume :: CHDB 44
The vapour mixture from the shell containing our desired components A, B, and C would then enter into a series of condensers. A vacuum pump can be used for the effective and efficient transfer of the vapours from shell to condensers. The condensers should be maintained at different temperatures based upon the dew points of the components in the vapour mixture. Coolants like water, ammonia, propylene, ethylene, etc can be helpful in maintaining different temperature range of the condensers. The mixture of vapours would then get separated out based upon the different dew points. The component, say A has a dew point greater then B which in turn has dew point greater then C, then A would get condensed into the first condenser. The vapours containing of component B and C would then pass on to the next condenser where B would get condensed and then at last C. The condensed components will be taken out from their individual condensers with the help of an outlet underneath the condenser. A stripper may be used to improve the purity of the components.
Advantages of Horizontal Distillation Column
Using a horizontal column for distillation instead of vertical would result in reduction in height. This would ultimately result in solution to the problem that vertical columns cannot be constructed near airports and air force. Also at more height, the air exerts high pressure upon the vertical columns. Therefore, the material of construction of vertical columns should be strong enough to withstand that pressure. This problem can be solved by using horizontal column.
Also horizontal column would provide better ease during shut down. It would also provide better safety as compared to vertical. There would be reduction in maintenances.
Limitations of Horizontal Distillaion Column
However, there are certain limitations of horizontal distillation column which includes large requirement of surface area. Also the components which are to be separated by this method should not have nearer dew points. Nearer dew points may result in condensation of more than one component in the same condenser which would further result in liquid mixture.
Conclusion
Thus, a horizontal distillation apparatus is the best alternative for the reduction in height of the distillation column.

Annual Technical Volume :: CHDB 45
Occupational Hazards of ArsenicS V Ranga, H N Pandya, K R ShahDepartment of Chemical Engineering L D College of Engineering, Ahmedabad 3800015e-mail : [email protected], [email protected], [email protected]
Abstract : Arsenic a metalloid, is notoriously hazardous to human health. It is found in all forms of environment finding its way through natural sources or via man made sources like smelter, insecticide, pesticide wood preservative units etc. Arsenic exist in both organic and inorganic form, out of which inorganic form with trivalent arsenic is potentially hazardous. Prolonged vulnerability to arsenic can lead to chronic effects such as lung, skin, bladder cancer and skin lesions. The paper reviews the health hazards associated with arsenic exposure at work place and remedial measure taken.
Keywords : Arsenic, Anthropogenic activity, Metabolism, Carcinogenic effect, DMA, MMA
Introduction
Arsenic is a metalloid belonging to Nitrogen family and notoriously hazardous to human health. It is found in all forms of environment like soils, groundwater, surface water, air, and some foods[1, 2] in varying concentration. For many years it has been used in agriculture, industries and medicinal fields[3, 4] and at the same time has long been associated with criminal and notorious activities. Acute overdose and chronic occupational exposure to arsenic causes arsenic poisoning. Looking at its notorious nature, Arsenic raises great concern from environmental and health hazard point of view.
Chemistry of Arsenic
In nature Arsenic is mostly found in compound form (either in +3 or +5 or -3 form) and rarely in elemental form. Arsenic compounds exist in both organic and inorganic form, out of which inorganic form with trivalent arsenic is potentially hazardous[5,6] and toxic than organic. The most common inorganic compounds in water, soil and food are arsenites(+3) and arsenates(+4) and rarely arsenides(-3). A number of studies indicate that arsenites are generally more toxic, but the differences in toxicity are usually small. The most common inorganic trivalent arsenic compounds are arsenic trioxide, sodium arsenite, arsenic trichloride and arsene gas. Pentavalent inorganic compounds are arsenic pentaoxide, arsenic acid, and arsenates such as lead and calcium arsenate. Inorganic arsenic compounds are used in metal alloy manufacturing, electronics manufacturing etc. Arsenic trioxide, the hazardous inorganic arsenic is produced naturally due to volcanic eruption or commercially as a byproduct of copper smelting[7]. Arsine (AsH3) is a reactive gaseous hydride manufactured in small quantities for use in the semiconductor industry. Arsenic can combine with organic compounds in nature to form organic arseno-compounds like trimethyl arsenic oxide, arsenocholine etc.
Sources of Exposure
Arsenic is abundant in environment through natural sources or by some some natural and anthropogenic activities. Natural activities includes dissolution of arsenic rich minerals (particularly into ground water), leaching out of arsenic from some arsenic rich rocks, and volcanic eruption etc. Anthropogenic activities includes mining, metal smelting, combustion of fossil fuels, agricultural pesticide production and use, and wood treatment with preservatives. High arsenic levels in air can be found in the working environment as well as the general environment in some non ferrous smelter where arsenic trioxide, a potential health hazard is formed and in coal burning power plants where low grade coal is used[8]. Smelter workers, who have an elevated risk of developing lung cancer due to arsenic exposure, further increase their risk by smoking due to natural arsenic content of tobacco[7,9]. This content is increased where tobacco plants have been treated with lead arsenate insecticide. Research shows that the quantity of arsenic released by human activities exceeds amounts released from natural sources at least three fold.

Annual Technical Volume :: CHDB 46
Following table shows the probable occupational exposure sources of arsenic. As clear from the table, health hazards due to arsenic exposure occurs from various industries namely refining or smelting of metal ores, microelectronics, wood preservation, battery manufacturing, and working in power plants that burn arsenic rich coal. The major sources of arsenic release to the environment are arsenic treated lumber discarded in landfills, and coal fired power plants. Organic arsenic reaches to us via sea food prepared in the high arsenic content water but are less hazardous[10]. In addition, water and soil concentrations are far higher in areas where arsenic mineral deposits have been mined. Groundwater may also contain elevated concentrations of arsenic due to contamination from arsenical pesticide runoff. In some part of world inorganic arsenic is naturally present in ground water like west Bengal in India and Bangladesh where half of the population is at the risk of drinking arsenic rich water through tube wells. The WHO guidelines for arsenic in drinking water is 10 microgram per litre. The exposure to arsenic is through Inhalation, Ingestion and dermal exposure to inorganic and organic arsenic compounds.
Metabolism of Arsenic in Body
Inorganic arsenic is well absorbed from the gastrointestinal tract and absorbed to a lesser degree through inhalation, but is poorly absorbed dermally (WHO, 2001). After absorption, inorganic arsenic is widely distributed within the body. Arsenate is reduced in the body to arsenite (oxidation state +3), though some reduction may occur in the gut prior to absorption. Arsenite then undergo oxidative methylatation to the monomethylarsinic acid (MMA) and dimethylarsinic acid (DMA) with subsequent excretion primarily in the urine. Recent studies have revealed that reduced form of MMA(+3) shows greater toxicity than arsenite itself[11,12]. Direct exposure to DMA and MMA may result from use of the two pesticides, cacodylic acid and monosodium methyl arsenate. On the basis of sufficient evidence of cancer in experimental animals and because monomethylarsonic acid is extensively metabolized to dimethylarsinic acid, both compounds are classified as possibly carcinogenic to humans (Group 2B). There is a dose response relationship given in literature between ratio of MMA/DMA in urine and risk for skin/lung cancer.
Occupational Exposures to Arsenic
Arsine Gas Inorganic Arsenic Organic Arsenic Battery manufacturing X Camera, watch and musical instrument repair X Coal-fired power plant X X Electrical and electronic technicians X X Electronics manufacturing (semiconductors, X X X solar cells, space research) Furnace, kiln, and oven operators X Glass manufacturing (decolorizer, fining agent) X Grinding /abrading /polishing machine operators X X Industrial truck and tractor equipment operators X Mechanical engineers X Metal plating X Pesticide manufacturing / application X X Painting and paint spraying machine operators X X paint manufacturing Smelting / refining non-ferrous metals X X Soldering / brazing X X Use / manufacture of arsenic-treated wood X
This is not a complete list of exposure sources. The above information was compiled from CDC, 1983; ATSDR, 2007.

Annual Technical Volume :: CHDB 47
Health Hazards of Arsenic
Arsenic exposure poses hazards to human health in both ways i.e. short and long term health effects. Short or acute effects can occur within hours or days of exposure. Long or chronic effects occur over many years. Long term exposure to arsenic has been linked to cancer of the skin, bladder and lungs, but there is limited evidence that it may also cause cancers of the kidney, liver and prostate[10].Short term exposure to high doses of arsenic can cause other adverse health effects, but such effects are likely to occur from water supplies that are not in compliance with the arsenic standard.
Carcinogenic Effects of Chronic Arsenic Exposure
The International Agency for Research on Cancer (IARC) has given a long lists of agents found in the workplace recognized as cancer causing agent and classified, 29 chemicals or physical agents, groups of agents or mixtures, to which exposure is mainly occupational and 15 industrial processes or occupations, as human carcinogens. IARC has classified arsenic and arsenic compounds as carcinogenic to humans (Group 1), which means that there is sufficient evidence for their carcinogenicity in humans[12]. Earlier research reported that arsenite enhance UV-induced skin cancers. Epidemiological evidence also indicates that arsenic is related with cancers of skin as well as internal organs.There was report of an elevated risk of bladder cancer in smokers when exposed to arsenic in drinking water 200 µg/l which points out that arsenic is synergistic with smoking. It has been reported that latent period of arsenic exposure inducing bladder cancer can be more than 40 years and death rate due to lung cancer increased with increasing arsenic ingestion. Arsenic exposure and cigarette smoke are synergistic which increase the chance of lung cancer. In a study conducted in Taiwan in a residential area with arseniasis endemic reports increased risk of lung cancer. Urinary arsenic level has been accepted as a good biomarker of arsenic dose[6]. Several studies have shown that urinary arsenic levels are in correlation with air levels of arsenic fume and dust at higher occupational inhalational exposures.
Recommendations
A number of actions on regular basis are required to reduce exposure to arsenic from smelters, mining and refining, combustion of low-grade coal, pesticide use and timber treatment. In particular, action is needed to reduce the intake of arsenic from drinking water and food in areas with naturally high levels in the groundwater. For this regular monitoring, arranging awareness campaigns about hazardous nature of arsenic, testing water for arsenic level and development of affordable arsenic removal systems are required. It poses a big challenge amongst us to develop cost effective arsenic removal system for ground water as well maintain low level of occupational exposure of arsenic, in order to minimize its hazardous effects.
Fig. 1 In vivo metabolism of arsenic
Annual Technical Volume :: CHDB 48
References
1. D Mondal, M Banerjee, M Kundu, N Banerjee, et al, Comparison of Drinking Water, Raw Rice and Cooking of Rice as Arsenic Exposure Routes in Tthree Contrasting Areas of West Bengal, India, Environmental Geochemistry andHealth, 32(6), 463-477, 2010.
2. S Paul, N Das, M Bhattacharjee, J K Das, et al, Arsenic-induced Toxicity and Carcinogenicity : a Two-wave Cross Sectional Study in Arsenicosis Individuals in West Bengal, India, J Expo Sci Environ Epidemiol, 23(2), 156-162, 2013
3. Z X Shen, G Q Chen, J H Ni, et al, Use of Arsenic Trioxide (As2O3 ) in the Treatment of Acute Promyelocytic Leukemia (APL) : II. Clinical Efficacy and Pharmacokinetics in Relapsed Patients Blood, 89, 3354-60, 1997
4. P Fenaux, C Chomienne, L Degos, Treatment of Acute Promyelocytic Leukaemia, Clin Haematol, 14, 153-74, 2001
5. National Research Council (NRC), Arsenic in Drinking Water-2001 update, National Academy Press, Washington (DC), 2001.
6. World Health Organization (WHO), Arsenic and Arsenic Compounds. 2nd ed, Environmental Health Criteria, Geneva, 224, 2001
7. WHO, Arsenic. In: Air Quality Guidelines for Europe, 2nd ed., World Health Organization Regional Office for Europe, Copenhagen, 125-128, 2000
8. IPCS, Arsine : Human Health Aspects. Geneva, World Health Organization, International Programme on Chemical Safety” (Concise International Chemical Assessment Document No. 47, 2002
9. IARC, Summaries and Evaluations: Arsenic and Arsenic Compounds (Group 1). Lyon, International Agency for Research on Cancer”, (IARC Monographs on the Evaluation of Carcinogenic Risks to Humans, Supplement 7, 100, 1987
10. IPCS, Arsenic and Arsenic Compounds, 2nd ed, World Health Organization, International Programme on Chemical Safety (Environmental Health Criteria 224), 2001
11. S M Cohen, L L Arnold, M Eldan, A S Lewis, B D Beck, Methylated Arsenicals : the Implications of Metabolism and Carcinogenicity Studies in Rodents to Human Risk Assessment, Crit Rev Toxicol, 36(2), 99-133, 2006
12. T G Bredfeldt, B Jagadish, K E Eblin, E A Mash, A J Gandolfi, Monomethylarsonous Acid Induces Transformation of Human Bladder Cells, Toxicol Appl Pharmacol, 216(1), 69-79, 2006
13. K Straif, et al, A Review of Human Carcinogens-Part C: Metals, Arsenic, Dusts, and Fibres, The Lancet Oncology, 10, 453-454, 2009

Annual Technical Volume :: CHDB 49
Process Safety Management in Chemical Industries and Application of Safety Integrity Level (SIL) Concept to Improve Functional SafetyP Shah, R Padiyar Department of Chemical Engineering Institute of Technology, Nirma University, Ahmedabad 382 481 e-mail: [email protected], [email protected] Abstract : Process Safety Management (PSM) program describes the management system for protecting people, property, and the environment from catastrophic releases of highly hazardous chemicals in the workplace. PSM is accomplished by systematically evaluating the process (or processes) using approaches to assess the effectiveness of the process design, technology, operations, maintenance, non-routine activities, procedures, emergency preparedness, training, and other process elements. For this, the Occupational Safety and Health Administration (OSHA) PSM standard (29 CFR 1910.119) was published in the Federal Register on Monday, February 24, 1992. The PSM program describes how employees are involved in the programs, how process hazard analyses are conducted, and preparation of operating procedures and practices, training, contractors, pre-startup safety, mechanical integrity, managing change, incident investigation, emergency preparedness, and compliance audits. Each element has its own importance to be accomplished. An on-going mechanical integrity program is used to ensure safe process operation. This includes the check for the instrumentation components in the entire plant. To ensure that failure of the instrumentation does not take place due to its mechanical integrity, its Functional Safety has to be established. Allocation of safety functions to specific protection layers for the purpose of prevention, control, or mitigation of hazards from the accelerator and its associated equipment is necessary to maintain safety integrity. Safety Integrity Level (SIL) is a criterion that judges the reliability of the safe-guards. It specifies or assigns the required safety integrity level to the scenario to identify the level of risk involved in the scenario. International Electro-technical Commission (IEC) 61511 has published different methods for the determination of SIL in chemical process industries. This paper gives a brief introduction to all the elements of PSM through a PSM Gap Audit methodology; functional safety and methods to conduct SIL.
Keywords : Hazard operability, Process safety management, Quantitative risk assessment, Safety instrumented function, Safety instrumented system, Safety integrity level.
Introduction
On a global scale, the risk from hazardous and toxic chemical agents in the environment is considerably large. Unexpected releases of toxic, reactive, or flammable liquids and gases in processes involving highly hazardous chemicals have been reported for many years. Incidents continue to occur in various industries that use highly hazardous chemicals which may be toxic, reactive, flammable, or explosive, or may exhibit a combination of these properties[1]. Major disasters in the world include Bhopal Gas Tradedy in 1984 in India; Phillips Petroleum Company disaster in October, 1989 in Pasadena, Texas and BASF, Chemical Plant Explosion in July, 1990 in Cincinnati, Ohio[2].
Release of hazardous chemical pose a significant threat to employees and provide impetus, internationally and nationally, for authorities to develop or consider developing legislation and regulations to eliminate or minimize the potential for such events. On July 17, 1990, OSHA published in the Federal Register (55 FR 29150) a proposed standard, ‘Process Safety Management of Highly Hazardous Chemicals’ containing requirements for the management of hazards associated with processes using highly hazardous chemicals to help assure safe and healthful work places.
The nature of PSM can be understood by examining its component words.
Annual Technical Volume :: CHDB 50
Process
PSM is concerned with process issues, such as, fires, explosions and the release of toxic gases caused by process oriented issues such as runaway chemical reactions, corrosion and the inadvertent mixing of hazardous chemicals.
Safety
The initial driving force for most PSM programs is the need to meet a safety regulation, and to reduce safety incidents related to process upsets and hazardous materials releases.
Management
In this context the Manager is considered to be anyone who has some degree of control over the process, including operators, engineers and maintenance workers.
Objective of PSM
The major objective of this PSM program is to prevent unwanted releases of hazardous chemicals into locations. The PSM program involves evaluating the entire process, including the design, technology, operation,
maintenance, procedures; emergency plans, training programs, and other pertinent process elements. The necessary expertise, experience, judgment, and proactive initiative is provided within the line organization
or obtained from outside resources as needed to assure an effective PSM program. Alternative avenues of decreasing the risks associated with highly hazardous chemicals in the workplace are
considered. The PSM program describes how employees are involved in the programs, how process hazard analyses are
conducted, and preparation of operating procedures and practices, training, contractors, pre-startup safety, mechanical integrity, managing change, incident investigation, emergency preparedness, and compliance audits[1].
Benefits of PSM
Proactive management system, focuses on avoiding incidents Safer workplace for employees Reduced risk of adverse environment impact Compliance with industry codes, standards and practices Reduces downtime and losses Reduces risk to nearby communities Integrates with existing quality, environmental and safety management systems Total employee involvement in implementation of system makes the system sustainable.
Elements of PSM
Process Safety Management involves the integration of three broad dimensions:
Facilities to manufacture and handle hazardous materials Technology of the process Personnel who operate, maintain and support the process
There are 14 key elements included in OSHA’s process safety management, which has been mentioned in the Fig 1[3].
Application of PSM in Chemical Industries
The PSM Gap Audit has to be carried out based on OSHA regulation for PSM and other relevant Process Safety standards and regulations.
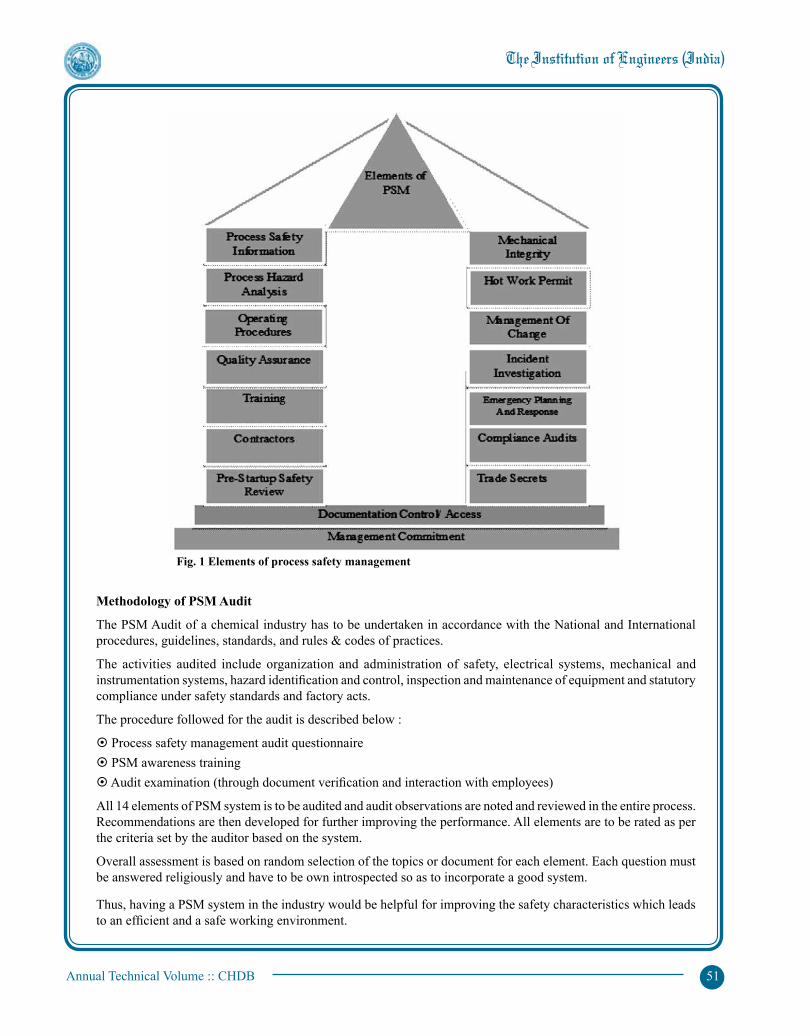
Annual Technical Volume :: CHDB 51
Methodology of PSM Audit
The PSM Audit of a chemical industry has to be undertaken in accordance with the National and International procedures, guidelines, standards, and rules & codes of practices.
The activities audited include organization and administration of safety, electrical systems, mechanical and instrumentation systems, hazard identification and control, inspection and maintenance of equipment and statutory compliance under safety standards and factory acts.
The procedure followed for the audit is described below :
Process safety management audit questionnaire PSM awareness training Audit examination (through document verification and interaction with employees)
All 14 elements of PSM system is to be audited and audit observations are noted and reviewed in the entire process. Recommendations are then developed for further improving the performance. All elements are to be rated as per the criteria set by the auditor based on the system.
Overall assessment is based on random selection of the topics or document for each element. Each question must be answered religiously and have to be own introspected so as to incorporate a good system.
Thus, having a PSM system in the industry would be helpful for improving the safety characteristics which leads to an efficient and a safe working environment.
Fig. 1 Elements of process safety management

Annual Technical Volume :: CHDB 52
Safety Integrity Level
The confidence that the safety function will perform is called upon the Safety Integrity Level of a system.
More precisely, the safety integrity of a system can be defined as ‘the probability (likelihood) of a safety-related system performing the required safety function under all the stated conditions within a stated period of time.’
Thus the specification of the safety function includes both the actions to be taken in response to the existence of particular conditions and also the time for that response to take place. The SIL is a measure of the reliability of the safety function performing to specification.
A SIL is attributed to a safety function, which includes different function blocks describing systems (such as, sensors, logic systems (logic solvers) and actuators)[4].
Methods for Determining SIL
BS EN 61508 offers three methods of determining SIL requirements :
Quantitative method Risk graph, described in the standard as a qualitative method Hazardous event severity matrix, also described as a qualitative method
BS IEC 61511 offers :
Semi-quantitative method
Safety layer matrix method, described as a semi-qualitative method
Calibrated risk graph, described in the standard as a semi-qualitative method, but by some practitioners as a semi-quantitative method
Risk graph, described as a qualitative method
Layer of Protection Analysis (LOPA) (Although the standard does not assign this method a position on the qualitative / quantitative scale, it is weighted toward the quantitative end.)[5]
Risk graphs and LOPA are popular methods for determining SIL requirements, particularly in the process industry sector. The paper consists of a case study to explain the LOPA method to determine SIL in detail.
Layer of Protection Analysis (LOPA)
LOPA, a semi quantitative Process Hazard Analysis (PHA) is found to be the effective tool in hazard evaluation and risk assessment. It is a simple tool and identifies the protection layer to be considered for risk assessment and risk reduction.
LOPA Process/Methodology
LOPA method consist number of steps as given below:
1. Selection of LOPA scenarios
2. Identification of all initiating events and their frequencies
3. Identification of all independent protection layers, IPLs
4. Associated PFD (Probability of Failure on Demand) of all IPLS
5. Quantify the total frequency of consequence
6. Set up consequence screening criteria
7. Define risk criteria as per standards
(a) Risk evaluation based on 1st and 2nd defined criteria(b) Risk acceptance (if in acceptable go for other scenarios in same line, if not in acceptable range than consider
option to reduce risk)
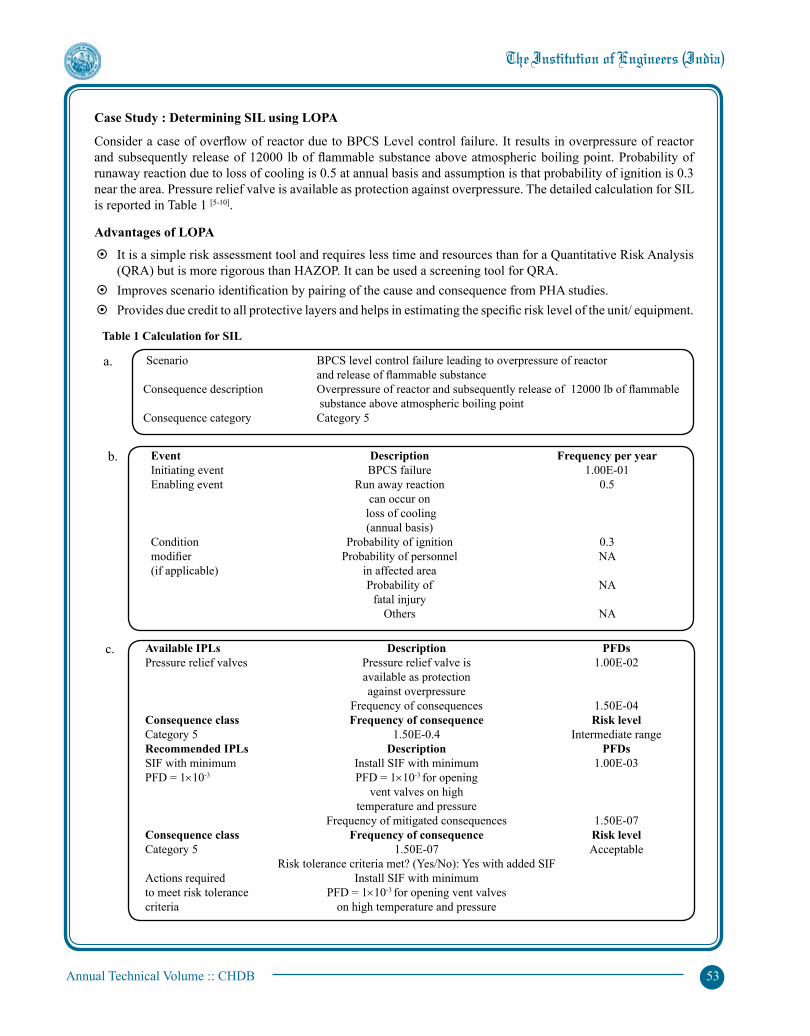
Annual Technical Volume :: CHDB 53
Case Study : Determining SIL using LOPA
Consider a case of overflow of reactor due to BPCS Level control failure. It results in overpressure of reactor and subsequently release of 12000 lb of flammable substance above atmospheric boiling point. Probability of runaway reaction due to loss of cooling is 0.5 at annual basis and assumption is that probability of ignition is 0.3 near the area. Pressure relief valve is available as protection against overpressure. The detailed calculation for SIL is reported in Table 1 [5-10].
Advantages of LOPA
It is a simple risk assessment tool and requires less time and resources than for a Quantitative Risk Analysis (QRA) but is more rigorous than HAZOP. It can be used a screening tool for QRA.
Improves scenario identification by pairing of the cause and consequence from PHA studies. Provides due credit to all protective layers and helps in estimating the specific risk level of the unit/ equipment.
Available IPLs Description PFDs Pressure relief valves Pressure relief valve is 1.00E-02 available as protection against overpressure Frequency of consequences 1.50E-04 Consequence class Frequency of consequence Risk level Category 5 1.50E-0.4 Intermediate range Recommended IPLs Description PFDs SIF with minimum Install SIF with minimum 1.00E-03 PFD = 1×10⁻³ PFD = 1×10⁻³ for opening vent valves on high temperature and pressure Frequency of mitigated consequences 1.50E-07 Consequence class Frequency of consequence Risk level Category 5 1.50E-07 Acceptable Risk tolerance criteria met? (Yes/No): Yes with added SIF Actions required Install SIF with minimum to meet risk tolerance PFD = 1×10⁻³ for opening vent valves criteria on high temperature and pressure
Event Description Frequency per year Initiating event BPCS failure 1.00E-01 Enabling event Run away reaction 0.5 can occur on loss of cooling (annual basis) Condition Probability of ignition 0.3 modifier Probability of personnel NA (if applicable) in affected area Probability of NA fatal injury Others NA
Scenario BPCS level control failure leading to overpressure of reactor and release of flammable substance Consequence description Overpressure of reactor and subsequently release of 12000 lb of flammable substance above atmospheric boiling point Consequence category Category 5
Table 1 Calculation for SIL
a.
b.
c.

Annual Technical Volume :: CHDB 54
Identifies operations, practices, systems and processes that do not have adequate safeguards and helps in deciding the layers of protection required.
Can be used as a tool in place of QRA for substances for which standard damage distances or effects are not known. In such cases it helps decide if the risk is As Low As Reasonably Possible (ALARP) for compliance to regulatory requirements or standards.
Limitations of LOPA
Risk tolerance criteria must be established for LOPA exercise before the process starts. For countries where such criteria have not been specified by statutes it will be difficult to decide which standards are to be adopted.
LOPA offers flexibility to the user in the areas of selecting IPLs and PFDs associated with the IPLs though the general industry data is available for the purpose. This brings in subjectivity in the assessment process and depends on the expertise of the user.
Conclusion
Facilities with a process using a highly hazardous chemical in an amount exceeding the threshold quantity must develop, document and implement:
Written hazard information, process analysis, operating procedures, emergency procedures and employee/contractor training.
Maintenance procedures, inspections, incident evaluations.
Re-evaluation of PSM information, procedures, compliance audits of processes and related equipment, and refresher training every three years.
PHA must be updated and revalidated every 5 years.
Conducting LOPA study for SIL determination ultimately allows the industries to check whether necessary safeguards provided will alter the unwanted events when needed. If during the study the safeguards provided are not adequate or safeguards provided are not strong enough to alter the event, new safeguards are included to protect the industry. This is the basic ideology of LOPA study for SIL determination. Hence it can be concluded that LOPA can be considered to be a reliable method for SIL determination.
References1. Process Safety Management, Cleveland Integrity Services Inc., Master Safety & Health Program2. OSHA standard 29 CFR 1910.119, Process Safety Management Standard3. Process Safety Management, U.S. Department of Labor Occupational Safety and Health Administration OSHA 3132, 20004. Dr A Hildebrandt, Safety Integrity Level Manual, Andy Ingrey, Patrick Lereverend5. International Electrotechnical Commission, IEC Standard 61511.6. Layer of Protection Analysis - Simplified Process Risk Assessment, AIChE CCPS, 2001. 7. C S Chip, Layer of Protection Analysis, A Semi-quantitative Method between Hazard Identification and Quantitative Risk
Assessment.8. Functional Safety of Electrical/ Electronic/ Programmable Electronics Safety-related Systems, Parts 1-7, International
Electro Technical Commission, IEC, IEC 61508, Geneva, 1998. 9. G G Young, G Glenn, Crowe Articles on LOPA.10. R Gowland, LOPA Rules and Data Limits, European Process Safety Centre.
55
Prospects of Fuel Cell Technology in IndiaS BasumallickDepartment of Chemistry, National Institute of Technology AgartalaAgartala 799046e-mail : [email protected]
Abstract : Present paper reports recent trends in the development of alcohol fuel cells including photo reduction process of carbon dioxide to obtain alcohols. Disadvantages of coal based power plants in terms of non-renewable sources; Carnot’s efficiency limit and above all CO2 emission have been discussed. Hydrogen fuel cell is a zero emission cell but considering its transport hazard, development of alcohol fuel cells has been given priority. Alcohols particularly ethanol can be easily obtained from biomaterials like starch using an age old technology. Very recently, photoreduction of CO2 using copperoxide based catalysts to obtain methanol has gained an exciting feature in this direction. A brief presentation of our work on synthesis ofcopper-oxide based catalysts and their characterization for electro-reduction and photoreduction of CO2 will be discussed. Finally, the promise of the technology for conversion of CO2, a greenhouse gas to alcohol and development of alcohol fuel cells is discussed.
Keywords : Carnot’s efficiency, Greenhouse gas, Alcohol fuel cell, AFM, TEM
Introduction
Disadvantages of coal based power plants are well known particularly non-renewable nature of the fuel source, efficiency loss due to Carnot’s limitation and above all CO2 emissions. These are overcome in fuel cells [1-5] where simple fuels like H2, methanol, ethanol are electro-chemicallyburn to produce electricity avoiding heat to mechanical energy conversion process in thermal power plants. Carnot’s efficiency principle is not applicable to fuel cells. Hydrogen and methanol fuel cells have been commercialised. But these systems are not cost effective as fuel oxidation requires costly Pt as catalyst. With Direct Alcohol Fuel Cells (DAFCs), fuels are easily available from renewable sources like starch, potato, rice etc, they have low-toxicity and higher energy density. But major problems in developing electro catalysts for alcohol oxidation are high cost of noble metals, slow reaction kinetics, poor selectivity and catalyst poisoning by CO[1,2]. The transition-metal-based catalysts (Pt, Ru, Mo, Sn etc) are often phone to poisoning because of their metal carbonyl forming propensity[1]. Use of nano-catalysts has been recommended for the improvement of the activity of the catalyst and to minimize the cost. It has been reported[1] bimetallic catalysts like Pt + Ru minimize catalyst poisoning. Deposition of Pt catalysts onto partially reduced Graphene Oxide (rGO) are also known to improve catalytic efficiency.
Although alcohols can be obtained from agricultural products but very recently, R&D on alcohol from photo/ electroreduction has gained a momentum. During the recent past there is an increasing interest[6-10] in the development of photo-catalysts and electro-catalysts for CO2 reduction. Carbon dioxide is a greenhouse gas and a major contributor of global warming. Natural photosynthetic pathway or carbon pathway[6] is not capable of restoring the ecological CO2 balance because of rapidly increasing global carbon emission. Thus, CO2 utilization through its photo-chemical or electro-chemical reduction[6-10] is an additional effective path in restoring CO2 balance. But major bottleneck of CO2 reduction reaction is that it is an uphill reaction and kinetically difficult because of requirement of high activation energy. In natural photosynthetic dark reaction , free energy of cleavage of phosphate bond of ATP and reducing molecule NADPH are used to fix and reduce CO2 to carbohydrate. The enzyme Ribulose Bisphosphate Carboxylase (RuBPCO) acts as catalyst. In laboratory experiments with CO2 reduction using sun light or electrical energy, it is known oxides of copper[6-7], particularly Cu2O is an efficient catalyst for such reduction. This is because of its unique crystalline structures where CO2 molecules get easily adsorbed and calculated values of heat of adsorption show favourable interactions with CO2 molecules. In this paper we report our work on preparation of copperoxides nanoparticles and their applications in photo reduction of CO2.
56
Experimental Procedure
Materials
Low molecular weight Chitosan was purchased from Sigma Aldrich (Saint Louis, Missouri, USA) and used without further purificationt. CuSO4.5H2O, (technical grade) was purchased from CQ concepts INC (Ringwood, Illinois, USA). NaOH (ACS grade, Amresco Solon, Ohio, USA) and HCl (technical grade, Fisher Scientific.) were used as supplied. Hydrothermal reaction was carried out in a hard glass bomb keeping in a temperature controlled oven (Thermo Electron Corporation, Lundeberg/Blue M). A Mettler Toledo, Delta 320 pH meter was used to adjust pH of the solution after calibrating it using HACH pH calibration solutions. Barnsted nano pure Diamond Deionized (DI) water system was used to obtain DI water of resistivity 17.9MΩ-cm. Fisher scientific digital vortex mixer was used to mix reagents for reaction.
Preparation of Chitosan Coated Copperoxide Nanoparticles by Hydrothermal Method
In this preparation of CS coated Cu2O/CuO, we have used tartaric acid as depolymerizer, ionic cross linker and complex forming agent. 300 mg of chitosan and 300 mg of tartaric acid are taken in a hydrothermal bomb to which 30 ml of DI water is added, shaken well and kept at 1500 C under hydrothermal condition for 1.5 h, after the reaction the solution was cooled to room temperature and 25 ml of (1% w/v) CuSO4 solution was added to the hydrothermally depolymerized solution and kept under vortex for one hour followed by addition of 1N NaOH drop wise to adjust its pH to 7.4. Then, 5ml of this solution was added to 25 ml DI water and kept under hydrothermal at 150 ºC for one hour to convert remaining Cu (OH)2 completely to Cu2O/CuO. The final dispersed solution was dialysed centrifuged and dried under vacuum for further studies.
Characterization
Fourier Transform Infra-red Spectroscopy (FTIR): FTIR technique was used to characterize functional groups present in these four samples. FTIR spectra were recorded on Perkin Elmer Spectrum 100 ATR FTIR Spectrometer.
Atomic Force Microscopy (AFM) Images: Silicon wafer (boron doped) was purchased from Nova electronic materials water dispersed sample was spin coated and dried in vacuum. AFM images were recorded on a Veeco Manifold multimode V model (tapping mode) using silicon nitride tip (radius B 50 nm) attached to a cantilever (spring constant = 0.032 Nm, oscillating frequency 0-600 k Hz). AFM images were recorded at room temperature.
Transmission Electron Microscopy (TEM) Images: FEI Tecnai TEM with resolution 0.20 nm point to point, 0.102 nm per line was used. The machine was equipped with SEG with hot and cold stages and High Angle Annular Dark Field (HAADF) detector using Gatan Image Filter (GIF). The lyophilized catalyst powder was dispersed in ethanol. Au grid with carbon mass was directly dipped in to the solution and after absorption was dried under vacuum for 24 hr to remove any solvent.
X-Ray Photoelectron Spectroscopy (XPS) Images : XPS was performed on a Physical Electronics 5400 ESCA spectrometer equipped with a monochromatic Al Ka source operating at 300 W. Vision software provided by the manufacturer was used for data analysis and quantification. A shirley background was used for quantification and curve fitting of Cu2p, C1s, N1s and O1s spectra. All the spectra were charge referenced to the aliphatic carbon at 285 eV. For curve-fits, 70% Gaussian/30% Lorentzian line shape was used.
Fabrication of catalyst coated Si-wafer and photo reduction set up: 1cm2 silicon wafers was cut and cleaned with dilute HCl, water and ethanol followed by air drying. Chitosan coated copper nano particles disperser in water was spin coated at exact same condition as the AFM samples were prepared. In a 250 ml conical flask measured amount of Na2CO3 was taken. Silicon wafers were drop casted with catalyst and were placed in 20 ml glass vial. The whole 20 ml vial open vials were then placed gently in the conical flask so that Na2CO3surround it without tilting. HCl was injected for full neutralization of Na2CO3 inside. The whole set up was kept for 3 h for CO2 to effervesce and react in presence of catalyst and sun light.
For the solution phase reaction catalyst suspension was purged with CO2 and kept in sunlight with silicon wafer inside it.

57
Results and Discussions
FTIR of CS coated copper oxides is shown in Fig.1. Presence of chitosan as coating material (2922 cm-1 from characteristic C-H stretching from chitosan coating) is indicated. The OH stretching frequency is reduced at 3380 cm-1 may be due to binding of -OH groups to the metal ions. Again there is a blue shift in the chitosan amide (I) 1659 cm-1 and amide (II) at 1503 cm-1 indicating -NH ligand binding to copper nano particles.
The XPS spectra (Figs 2 and 3) show presence of different mixed valent copper both Cu+ and Cu++copper oxide samples. The presence of small 934 ev peak is characteristic to Cu (I) where as the peak at 936 ev together with shake up peaks indicates presence of Cu(II) peak as well as chitosan coated nanoparticle.
The AFM image (Fig 4) clearly shows mono dispersed nano formation. Also these perfectly water soluble copper nano particles remain de-agglomerate because of electrostatic repulsion of NH3+groups present in chitosan coating at DI water pH (~6.3) as well as hydration layer above chitosan coating. The particle size varied from 400 to 500 nm which is basically chitosan polymer with copper QDs embedded in the film like structure vertical distance
Fig. 1 Schematic diagram of experimental setup used to study photo reduction of O2 to methanol
Fig 2 FTIR of CS coated Cu-oxides (black) and CS (red) Fig 3 XPS of CS coated Cu-oxides
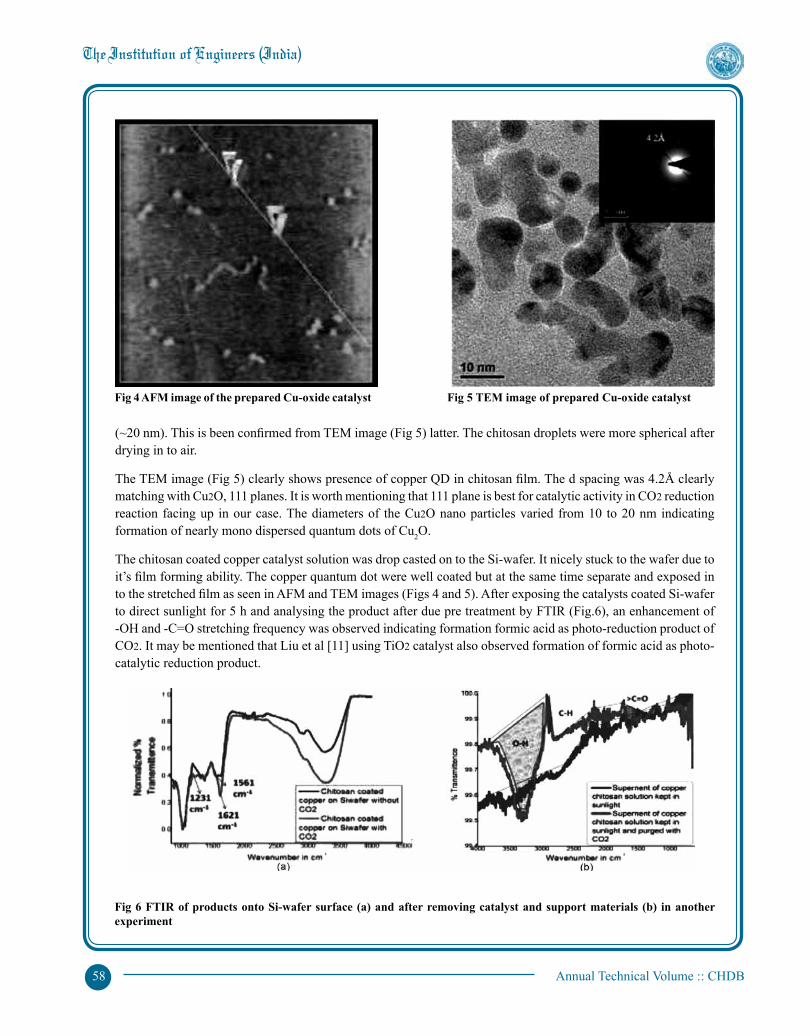
58
(~20 nm). This is been confirmed from TEM image (Fig 5) latter. The chitosan droplets were more spherical after drying in to air.
The TEM image (Fig 5) clearly shows presence of copper QD in chitosan film. The d spacing was 4.2Å clearly matching with Cu2O, 111 planes. It is worth mentioning that 111 plane is best for catalytic activity in CO2 reduction reaction facing up in our case. The diameters of the Cu2O nano particles varied from 10 to 20 nm indicating formation of nearly mono dispersed quantum dots of Cu2O.
The chitosan coated copper catalyst solution was drop casted on to the Si-wafer. It nicely stuck to the wafer due to it’s film forming ability. The copper quantum dot were well coated but at the same time separate and exposed in to the stretched film as seen in AFM and TEM images (Figs 4 and 5). After exposing the catalysts coated Si-wafer to direct sunlight for 5 h and analysing the product after due pre treatment by FTIR (Fig.6), an enhancement of -OH and -C=O stretching frequency was observed indicating formation formic acid as photo-reduction product of CO2. It may be mentioned that Liu et al [11] using TiO2 catalyst also observed formation of formic acid as photo-catalytic reduction product.
Fig 4 AFM image of the prepared Cu-oxide catalyst Fig 5 TEM image of prepared Cu-oxide catalyst
Fig 6 FTIR of products onto Si-wafer surface (a) and after removing catalyst and support materials (b) in another experiment

59
Admittedly, the quantum yield of such conversion is extremely small but the formic acid so formed may be used in fuel cells for generating electricity.
References
1. M Chatterjee, A Chatterjee, S Ghosh, I Basumallick, Electrochimica Acta, 54, 7299, 2009.
2. G Eda, G Fanchini, M Chhowalla, Nature Nanotechnology, 3, 270, 2008.
3. Y Zhu, S Murali, W Cai, X Li, J W Suk, J R Potts, R S Ruoff, Adv Mater, 22, 3906, 2010.
4. W Ye, X Zhang, Y Chen, Y Du, F Zhou, C Wang, Int J Electrochem Sci, 8, 2122, 2013.
5. S S Lai, S F Kleyn, V Rosca, M M Koper, J Phys Chem, C 112, 19080, 2008.
6. C Costentin, M Robert, J M Save´ant, Chem. Soc. Rev, 42, 2423, 2013.
7. H Takeda, O Ishitani, Coord, Chem. Rev, 254, 346, 2010.
8. D Windle, R N Perutz, Coord. Chem. Rev 256, 2562, 2012.
9. J A Keith, E A Carter, J. Am. Chem. Soc, 134, 7580, 2012.
10. Y Hori, K Kikuchi, S Suzuki , Chem. Lett, 1695, 1985.
11. S H Liu, Z H Zhao, Z Z Wang, Photochem. Photobiol. Sci, 6, 695, 2007.

Annual Technical Volume :: CHDB 60
Toxic Effects of Nanomaterials on Human Health
J Kumar, S Gangil, R Jha, L Malviya, B ModheraDepartment of Chemical Engineering,Maulana Azad National Institute of Technology, Bhopal 462003e-mail : [email protected], [email protected], [email protected], [email protected]
Abstract : Nanotechnology is a sharply growing science of producing and utilizing nano-sized particles that measure in nanometers. These materials are already having an impact on health care. Now days we are using nanoproducts in various fields. of these silver nanoparticle are playing a major role in the field of nanotechnology and nanomedicine. Nanoparticle have high surface to volume ratio i.e they containa high number of atoms per unit volume. As the size reduces, the proportion of atoms found at the surface increases reactivity of material at nano level. The nanoparticles are morereactive and hence adverse effect caused by them at lower dose level is greater than their nanoparticles were present in earlier days also, but up to limited extent. The prevailing use of nano particles now days, to serve almost every sector of human life, would result in to increased concentration of nano particles in the environment; eventually to term them as a pollutant. Metal absorption in human body is a very complicated.
Keywords Nanotechnology, Nanoparticles, Toxic nano-material silver
Introduction
‘Nano’ has become a very favorite term for academia, industry or research institutes, who use it frequently during routine conversations. Nano particles have high surface to volume ratio i.e. they contain high number of atoms per unit volume. As the size reduces, the proportion of atoms found at the surface increases relative to the proportion inside its volume. This increases reactivity of material at nano level. The nano particles are more reactive and hence adverse effect caused by them at lower dose level is greater than their fine counterparts[1-2].
Common Elements Present in Animal and Human Body
Animals and humans have similar evolutionary backgrounds. Specific elements play critical roles in the structures of proteins and the activities of enzymes. The purpose of this page is to outline some of the uses of elements in the structure of animals and humans and to illustrate why these elements are essential in the body and for optimal health.
Macro Elements and their Functions
Calcium (Ca) : Structure of bone and teeth.
Phosphorous (Ph) : Structure of bone and teeth. required for ATP, the energy carrier in animals.
Magnesium (Mg) : Important in bone structure, deficiency results in tetany (muscle spasms) and can lead to a calcium deficiency.
Sodium (Na) : Major electrolyte of blood and extracellular fluid, required for maintenance of pH and osmotic balance.
Potassium (K) : Major electrolyte of blood and intracellular fluid, required for maintenance of pH and osmotic balance.
Chlorine (Cl) : Major electrolyte of blood and extracellular and intracellular fluid, required for maintenance of pH and osmotic balance.
Sulfur (S) : Element of the essential amino acids methionine and cysteine, contained in the vitamins thiamin and biotin.

Annual Technical Volume :: CHDB 61
Micro Elements and their Functions
Iron (Fe) : Contained in hemoglobin and myoglobin which are required for oxygen transport in the body. Part of the cytochrome p450 family of enzymes. Anemia is the primary consequence of iron deficiency. Excess iron levels can enlarge the liver, may provoke diabetes and cardiac falurer. The genetic disease hemochromatosis results from excess iron absorption. Similar symptoms can be produced through excessive transfusions required for the treatment of other diseases.
Copper (Cu) : A structural element of ferroxidase enzymes (ceruloplasmin) which regulates iron transport and facilitates release from storage.
Manganese (Mn) : Major component of the mitochondrial antioxidant enzyme is manganese superoxide dismutase. A manganese deficiency can lead to improper bone formation and reproductive disorders. An excess of manganese can lead to poor iron absorption.
Iodine (I) : Required for production of thyroxine which plays an important role in metabolic rate. Deficient or excessive iodine intake can cause goiter (an enlarged thyroid gland).
Zinc (Zn) : Important for reproductive function due to its use in Follicle Stimulating Hormone (FSH) and Leutinizing Hormone (LH), required for DNA binding of zinc finger proteins which regulate a variety of activities.
Fluorine (Fl) : It can be derived from water, tea and fish. Constituent of bones and teeth, important for tooth development and prevention of dental caries.
Cobolt (Co) : Contained in vitamin B12, an excess may cause cardiac failure.
Molybdenum (Mo) : Contained in the enzyme xanthine oxidase, required for the excretion of nitrogen in uric acid in birds, an excess can cause diarrhea and growth reduction.
Chromium (Cr) : A cofactor in the regulation of sugar levels, its deficiency may cause hyperglycemia (elevated blood sugar) and glucosuria (glucose in the urine)
Other Elements
Rats have been shown to have improved growth on diets which contain other micro nutrients.
These include:
Lead (Pb)Nickel (Ni)Silicon (Si)Vanadium (Vn)
These elements are all toxic at high levels.
Entry of Metals to Human Body
Digestive system : Entry of these metals and the nano materials to human body can take place through digestive system. Titanium Dioxide is used in cosmetics and vitamins and other drugs as a filler to construct tablets. But it is also used in skimmed milk, cheeses, yogurts, mayonnaise, chocolate marshmallows, manufactured fast foods, tomato ketchup. It is fed to animals that humans eat. Titanium is used as food additive in European countries as a food coloring, it has E number E171. Human digestive system starts with mouth and ends with anus (Fig 1). In mouth mechanical disintegration of food takes place. Then it entersesophagus and liver then stomach. Along the way the necessary elements are absorbed.
The constant concentration of necessary metals in human body is maintained by the mechanism of homeostasis. eg, iron absorption (Fig.2).
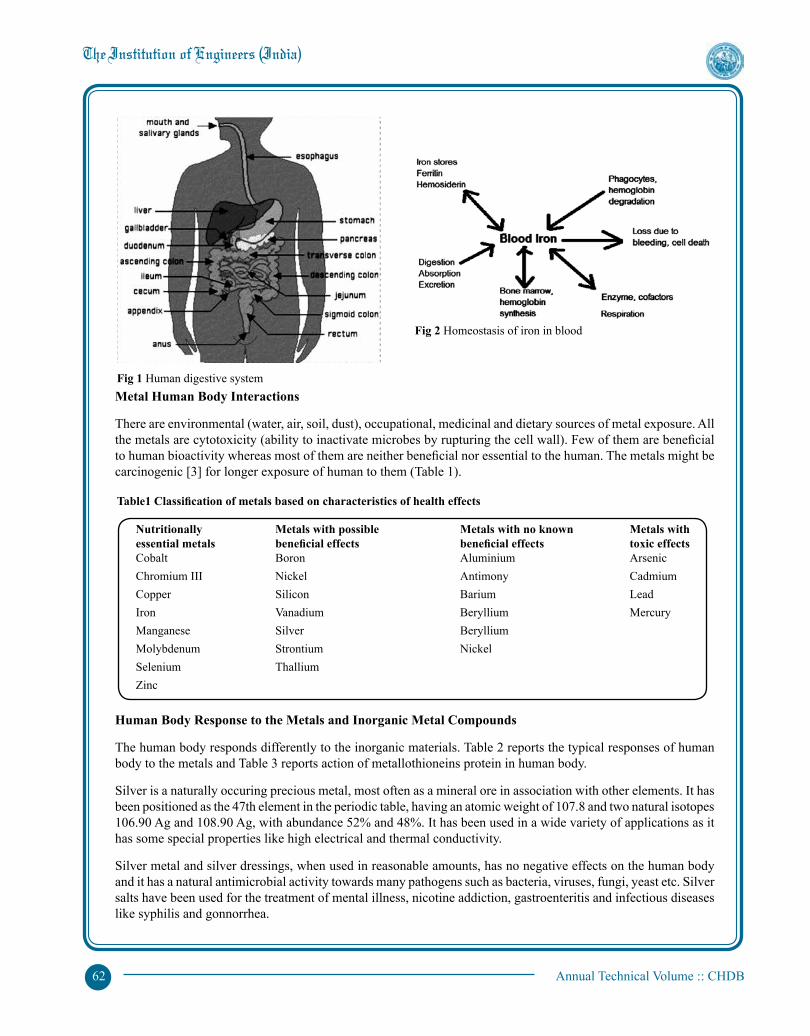
Annual Technical Volume :: CHDB 62
Metal Human Body Interactions
There are environmental (water, air, soil, dust), occupational, medicinal and dietary sources of metal exposure. All the metals are cytotoxicity (ability to inactivate microbes by rupturing the cell wall). Few of them are beneficial to human bioactivity whereas most of them are neither beneficial nor essential to the human. The metals might be carcinogenic [3] for longer exposure of human to them (Table 1).
Human Body Response to the Metals and Inorganic Metal Compounds
The human body responds differently to the inorganic materials. Table 2 reports the typical responses of human body to the metals and Table 3 reports action of metallothioneins protein in human body.
Silver is a naturally occuring precious metal, most often as a mineral ore in association with other elements. It has been positioned as the 47th element in the periodic table, having an atomic weight of 107.8 and two natural isotopes 106.90 Ag and 108.90 Ag, with abundance 52% and 48%. It has been used in a wide variety of applications as it has some special properties like high electrical and thermal conductivity.
Silver metal and silver dressings, when used in reasonable amounts, has no negative effects on the human body and it has a natural antimicrobial activity towards many pathogens such as bacteria, viruses, fungi, yeast etc. Silver salts have been used for the treatment of mental illness, nicotine addiction, gastroenteritis and infectious diseases like syphilis and gonnorrhea.
Fig 1 Human digestive system
Fig 2 Homeostasis of iron in blood
Nutritionally Metals with possible Metals with no known Metals with essentialmetals beneficialeffects beneficialeffects toxiceffects Cobalt Boron Aluminium Arsenic Chromium III Nickel Antimony Cadmium Copper Silicon Barium Lead Iron Vanadium Beryllium Mercury Manganese Silver Beryllium Molybdenum Strontium Nickel Selenium Thallium Zinc
Table1Classificationofmetalsbasedoncharacteristicsofhealtheffects
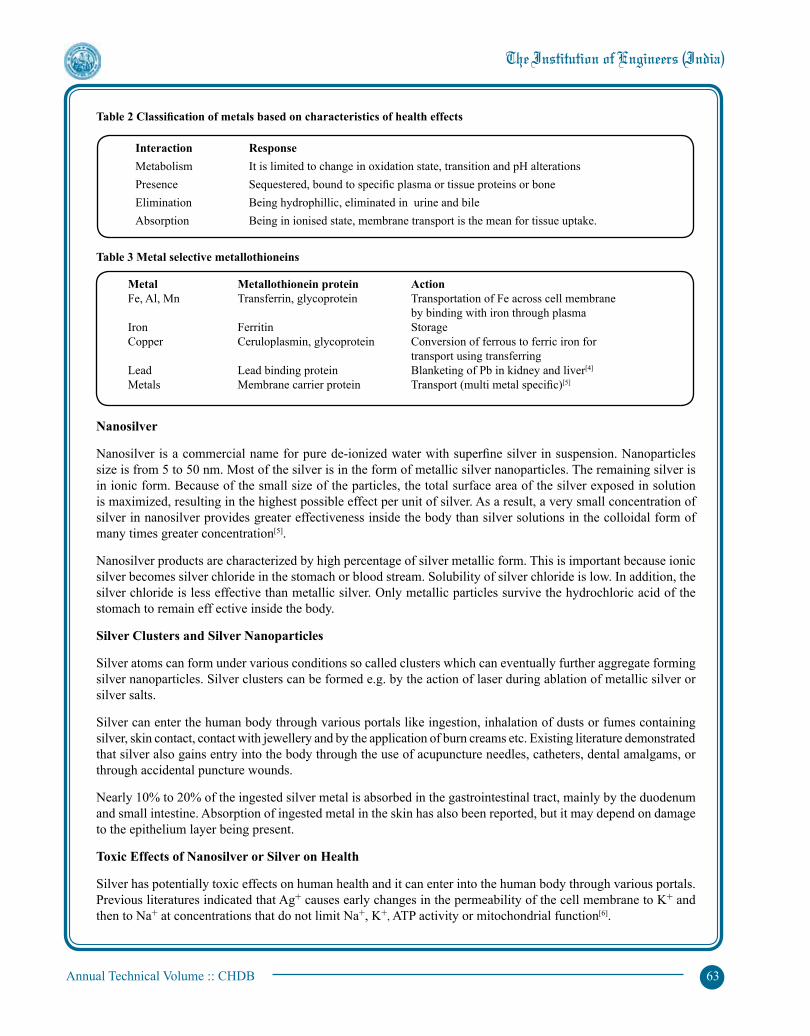
Annual Technical Volume :: CHDB 63
Nanosilver
Nanosilver is a commercial name for pure de-ionized water with superfine silver in suspension. Nanoparticles size is from 5 to 50 nm. Most of the silver is in the form of metallic silver nanoparticles. The remaining silver is in ionic form. Because of the small size of the particles, the total surface area of the silver exposed in solution is maximized, resulting in the highest possible effect per unit of silver. As a result, a very small concentration of silver in nanosilver provides greater effectiveness inside the body than silver solutions in the colloidal form of many times greater concentration[5].
Nanosilver products are characterized by high percentage of silver metallic form. This is important because ionic silver becomes silver chloride in the stomach or blood stream. Solubility of silver chloride is low. In addition, the silver chloride is less effective than metallic silver. Only metallic particles survive the hydrochloric acid of the stomach to remain eff ective inside the body.
Silver Clusters and Silver Nanoparticles
Silver atoms can form under various conditions so called clusters which can eventually further aggregate forming silver nanoparticles. Silver clusters can be formed e.g. by the action of laser during ablation of metallic silver or silver salts.
Silver can enter the human body through various portals like ingestion, inhalation of dusts or fumes containing silver, skin contact, contact with jewellery and by the application of burn creams etc. Existing literature demonstrated that silver also gains entry into the body through the use of acupuncture needles, catheters, dental amalgams, or through accidental puncture wounds.
Nearly 10% to 20% of the ingested silver metal is absorbed in the gastrointestinal tract, mainly by the duodenum and small intestine. Absorption of ingested metal in the skin has also been reported, but it may depend on damage to the epithelium layer being present.
Toxic Effects of Nanosilver or Silver on Health
Silver has potentially toxic effects on human health and it can enter into the human body through various portals. Previous literatures indicated that Ag+ causes early changes in the permeability of the cell membrane to K+ and then to Na+ at concentrations that do not limit Na+, K+, ATP activity or mitochondrial function[6].
Interaction Response Metabolism It is limited to change in oxidation state, transition and pH alterations Presence Sequestered, bound to specific plasma or tissue proteins or bone Elimination Being hydrophillic, eliminated in urine and bile Absorption Being in ionised state, membrane transport is the mean for tissue uptake.
Table2Classificationofmetalsbasedoncharacteristicsofhealtheffects
Metal Metallothionein protein Action Fe, Al, Mn Transferrin, glycoprotein Transportation of Fe across cell membrane by binding with iron through plasma Iron Ferritin Storage Copper Ceruloplasmin, glycoprotein Conversion of ferrous to ferric iron for transport using transferring Lead Lead binding protein Blanketing of Pb in kidney and liver[4]
Metals Membrane carrier protein Transport (multi metal specific)[5]
Table 3 Metal selective metallothioneins

Annual Technical Volume :: CHDB 64
Conclusion
As mentioned in the introductory section of this paper, nano particles are highly reactive species with subatomic sizes, ie, easy to enter through breathing and along with food. Like skin, the gastro intestinal track and the lungs are in direct contact with the environment. Nanoparticles like Ti or Zn oxides are used in sunscreen lotions. Carbon Nanotubes (CNTs) and fullerence are the members of electronic industries. Nanoparticles from hair dye (pigments) accumulate around the hair roots. After reviewing the literature one fact is noticeable. Over the past decades, the usage of silver containing medications has become more prevailing because of their potential antimicrobial and bactericidal activity and people are choosing silver containing medicines as an alternative health supplement. Earlier, it was mentioned that silver has a natural antimicrobial activity towards many pathogens such as bacteria, viruses, fungi, yeast etc.
References
1. Z Chen, H Meng, G Xing, C Chen, Y Zhao, G Jia, T Wang, H Yuan, C Ye, F Zhao, Z Chai, C Zhu, X Fang, B Ma, L Wan, Acute Toxicological Effects of Copper Nanoparticles in vivo, Toxicology Letters, vol 163, pt 2, 109-120, May 2006
2. W G Kreyling, M Semmler, F Erbe, P Mayer, S Takenaka, H Schultz., Translocation of Ultrafine Insoluble Iridium Particles from Lungs Epithelium to Extrapulmonary Organs in Size Dependent but Very Low. J Tox Environ Health, 65 (20), 1513-1530, 2002
3. Y P Patil, S H Pawar, S Jadhav, J S Kadu, Biochemistry of Metal Absorption in Human Body. I. Journal of Scientific and Research Publications, vol 3, pt 4, 1-5, April 2013
4. J H R Kagi, Y Kogima, eds, Chemistry and Biochemistry of Metallothionein. Boston, Birkhauser, 25–61.
5. R A Goyer, T M Clarkson, Toxic Effects of Metals. Chapter 23. In: C D Klaassen, ed, Casserett and Doull’s Toxicology, McGraw Hill, New York, 811–868.
6. N R Panyala1, E M Peña-Méndez, J Havel , Silver or Silver Nanoparticles : a Hazardous Threat to the Environment and Human Health, J. Appl. Biomed, 6, 117–129, 2008
Dr G Madhu, FIE
Members for the Session 2014-2015
Dr M P Sukumaran Nair, FIEChairman
Mr P P Agarwal, FIE
Dr R Bhima Rao, FIE
Dr L V Muralikrishna Reddy, FIEPresident, IEI
Dr J K Gehlawat, FIE
Mr N B Vasoya, FIE