THE IMPACT OF WATERSHED HYDROLOGY ON THE ...
24
THE IMPACT OF WATERSHED HYDROLOGY ON THE LANDSCAPE DEVELOPMENT NAIM SHAUQI BIN MOHD NOOR Thesis submitted in fulfillment of the requirements for the award of the degree of B.Eng (Hons) Civil Engineering Faculty of Civil Engineering & Earth Resources UNIVERSITI MALAYSIA PAHANG JAN 2015
Transcript of THE IMPACT OF WATERSHED HYDROLOGY ON THE ...

THE IMPACT OF WATERSHED HYDROLOGY ON THE LANDSCAPE
DEVELOPMENT
NAIM SHAUQI BIN MOHD NOOR
Thesis submitted in fulfillment of the requirements for the award of the degree of
B.Eng (Hons) Civil Engineering
Faculty of Civil Engineering & Earth Resources
UNIVERSITI MALAYSIA PAHANG
JAN 2015

ABSTRACT
Nowadays, numbers of study have been made to the soil or the impact of geomorphology
on the hydrological process of stream flow such as sea, river and others, but much less
concentration that have given to the opposite which is the impact and effect of hydrological
process on the evolution of stream flow topography. Therefore, the study of changes of
geomorphology is important to the development of our country. The problem is rises when
the landscape development analysis and modeling Is neglected when there are extremely
natural disasters happen but in silent the impact or effect on the deposition on the river bed
can be important particularly when threshold are involved in the development. To
determine the process of runoff, the area of sediment should be analyze so that the area of
watershed and flow rate is suitable and does not give effect to the surrounding. The main
objective of this study was to validate the changes of sediment or river bed is according to
the flow rate of the stream flow. The specific objectives as follows; To establish the time
series of river changes maps using Arc GIS, and to analyse the relationship of hydrological
process (i.e. flow of stream) to the river changes. In this study, the stream and sediments
location of the study area for the last four years were obtained from Google Earth image.
The flow rate of stream flow of study area (Sungai Kuantan, Bukit Kenau, Kuantan,
Pahang) obtained from the Jabatan Pengairan dan Saliran Malaysia (JPS). The flow rate
were analysed based on the minimum, maximum and mean of flow rate of the year. The
sediment area values changes derived from the Arc GIS show a relationship to the
maximum, minimum and mean of the flow rate. From this relationship, arithmetic equation
could be derived as 0.0000789Q for the relation between the flow rate and the changes of
the sediment area values which is the Q is the flow rate of the stream flow. Therefore, the
flow rate could affect the changes in the area of sediment.
VII

ABSTRAK
Pada masa kini, pelbagai kajian telah dibuat ke atas tanah atau kesan geomortölogi kepada
proses hidrologi aliran seperti laut, sungai dan lain-lain, tetapi kurang tumpuan yang telah
diberikan kepada yang bertentangan yang menjadi impak dan kesan proses hidrologi pada
topografi evolusi aliran. Oleh itu, kajian tentang perubahan geomorfologi adalah penting
kepada pembangunan negara kita. Masalah mi meningkat apabila analisis pembangunan
landskap dan pemodelan diabaikan apabila terdapat bencana alam berlaku tetapi dalam
senyap memberi kesan atau impak pada pemendapan di dasar sungai boleh menjadi penting
terutamanya apabila had yang terlibat dalam pembangunan. Menentukan proses air larian,
kawasan sedimen perlu menganalisis supaya kawasan tadahan air dan kadar alir adalah
sesuai dan tidak memberi kesan kepada sekitar. Objektif utama kajian mi adalah untuk
mengesabkan perubahan sedimen atau dasar sungai adalah mengikut kadar aliran aliran
sungai itu. Objektif khusus seperti berikut; Mewujudkan siri masa bagi perubahan peta
sungai menggunakan Arc GIS, dan untuk menganalisis hubungan proses hidrologi (iaitu
aliran sungai) kepada perubahan sungai. Dalam kajian mi, lokasi sungai dan sedimen di
kawasan kajian untuk empat tahun yang lalu telah diperolehi dari imej "Google Earth".
Kadar aliran aliran sungai di kawasan kajian (Sungai Kuantan, Bukit Kenau, Kuantan,
Pahang) diperolehi daripada Jabatan Pengairan dan Saliran Malaysia (JPS). Kadar aliran
dianalisis berdasarkan minimum, maksimum dan purata kadar aliran tahunan yang
diperolehi. Perubahan nilai kawasan sedimen diperolehi daripada Arc GIS menunjukkan
hubungan di antara kedua-dua makiumat untuk maksimum, minimum dan purata kadar
aliran. Dasi hubungan mi, persamaan aritmetik boleh diperoleh sebagai 0.0000789Q untuk
hubungan antara kadar aliran serta perubahan nilai luas kawasan sedimen dan Q merupakan
kadar alir aliran sungai itu. Oleh itu, kadar aliran yang boleh memberi kesan kepada
perubahan dalam perubahan luas kawasan sedimen.
VIII

Ix
TABLE OF CONTENT
SUPERVISOR'S DECLARATION iii
STUDENT'S DECLARATION iv
DEDICATION v
ACKNOWLEDGEMENT vi
ABSTRACT vii
ABSTRAK viii
TABLE OF CONTENT ix
CHAPTER 1 1
INTRODUCTION 1
1.1 INTRODUCTION 1
1.2 PROBLEM STATEMENT 4
1.3 OBJECTIVE OF STUDY 4
1.4 SCOPE OF STUDY 5
1.5 THESIS STRUCTURE 5
CHAPTER 2 6
LITERATURE REVIEW 6
2.1 INTRODUCTION TO HYDROLOGICAL CYCLE 6
2.2 INTRODUCTION TO SEDIMENT 8
2.3 CHARACTERISTICS OF SEDIMENT 9
2.4 CHARACTERISTIC OF WATER TRANSPORTING MEDIUM 10
2.5 CONCLUSION 11
CHAPTER 3 12
RESEARCH METHODOLOGY 12
3.1 INTRODUCTION 12
3.2 DATA COLLECTING 14
3.3 PRE-PROCESSING 19
3.4 PROCESSING 24
3.5 CONCLUSION 28

x
CHAPTER 4 29
RESULT AND DISCUSSION 29
4.1 INTRODUCTION 29
4.2 RESULT AND DISCUSSION 29
CHAPTER 35
CONCLUSION AND RECOMMENDATION 35
5.1 INTRODUCTION 35
5.2 CONCLUSION 35
5.3 RECOMMENDATION 36
REFERENCES 37
LIST OF TABLES
Table 2-1 Fall Velocity for Day 1 9
Table 2-2: Fall Velocity for Day 2 10
Table 3-1 : The Area of Shade Region (Sediment), 2010 20
Table 3-2: The Area of Shade Region (Sediment), 2011 21
Table 3-3 : The Area of Shaded Region (Sediment), 2013 22
Table 3-4: The Area of Shade Region (Sediment), 2014 23
Table 3-5 : The Area of Sediment That Generate By Arc GIS 24
Table 3-6: The Area of Sediment That Generate By Arc GIS (Continue) 25
Table 3-7: The Different of Area Year By Year 25
Table 3-8 The Different Sediment Area Between Year 26
Table 3-9: Relationship Between Flow rate and Sediment 26
Table 3-10 Relationship Between Data Flow Rate Per Month With The Changes of
Sediment 27
Table 4-1 Data Correlation of Flow Rate and Sediment (Minimum) 30
Table 4-2 Data Correlation of Flow Rate and Sediment (Mean) 31
Table 4-3 Data Correlation of Flow Rate and Sediment (Maximum) 33

Xi
LIST OF FIGURES
Figure 1-1 : Kuantan River (2010) 2
Figure 1-2 Kuantan River 2011 2
Figure 1-3 : Kuantan River (2013) 3
Figure 1-4 Lembing River 2011 3
Figure 2-1 Hydrological Cycle 7
Figure 2-2 : Fluvial Diagram (Sediment Process and Losses) 9
Figure 2-3 : River Basin of Peninsular Malaysia 11
Figure 3-1 : Methodology Flow Chat 13
Figure 3-2 : Flow Rate Data ( JPS) 14
Figure 3-3 : The Map of Study Area for Year 2010 15
Figure 3-4: The Map od Study Area for Year 2011 16
Figure 3-5 : The Map of Study Area for Year 2013 17
Figure 3-6: The Map of Study Area of Year 2014 18
Figure 3-7 The Area of Sediment 2010 19
Figure 3-8 : The Area of Sediment 2011 21
Figure 3-9: The Area of Sediment 2013 22
Figure 3-10 : The Area of Sediment 2014 23
Figure 4-1 : Graph Correlation of Flow Rate and Sediment (Minimum) 30
Figure 4-2: Correlation of Flow Rate and Sediment (Mean) 32
Figure 4-3 : Graph Correlation of Flow Rate and Sediment (Maximum) 34
CHAPTER 1
INTRODUCTION
1.1 INTRODUCTION
Each year Peninsular Malaysia was rocked by natural aisasters that occur in every
corner of the country including Kelantan, Terengganu, Pahang and other states. Among the
natural disasters that frequently occur are floods, landslides and storms. The cause of this
disaster are all blamed by the development that has been developing in these states. Natural
disasters such as floods has often happened and the Ministry of Home Affairs and the
National Safety Department has taken steps to be ready for natural disasters each year,
usually in the month of December until January. Cause of loss this disaster has touched
thousands of dollars and sometimes up to millions of dollars for repairs and reconstruction
operations. But after a long time this natural disaster occurs many parties have blamed the
cause of development as a key factor to flooding and river water route changes of this
development and the major cause of the most obvious. Various studies by experts have
been created by changes in the earth or the flow of this river stems from the development
but only a few are able to assess and identify the contrary that changes the face of the earth
is the source of a river or stream to change the face of the earth.
1

2
Changes in stream flow that occurs in these rivers can be seen from year to year and
will visibly change that occurs at the same time revealing how this changed the earth's
surface caused by this change. Among the evidence of this change can be seen on the
analysis of ihe diagram illustrated below by way of rivers in the State of Pahang.
Figure 1-1 : Kuantan River (2010)
Sources: Google Earth (March, 23 2010)
Figure 1-2: Kuantan River 2011
Sources Google Earth ( May, 19 2011)

3
Figure 1-3 : Kuantan River (2013)
Sources: Google Earth (June, 05 2013)
Figure 1-4: Lembing River 2011
Sources : Google Earth ( June, 05 2011)

4
Through an overview of changes in the soil deposits from year to year the above, we
can say that change is not only caused by the construction but also due to the hydrological
cycle. Then the study should b'e conducted to identify the changes that occur to avoid things
that can lead to problems such as natural disasters, floods, and significant changes in the
earth.
1.2 PROBLEM STATEMENT
The flow rates of stream values vary according to the situation are the earth surface.
The higher the level of stream, the more flow rate of stream will produce and more changes
of the river bed will occur. Therefore, the high level of stream flow will cause the higher
changes of river bed.
At present, the cause of the changes of the geomorphology is just depending on the
research of the development and not the changes cause by the hydrological process.
The main objective of this study was to validate the changes of sediment or river
bed is according to the flow rate of the stream flow. The specific objectives as follows; to
establish the time series of river changes maps using Arc GIS, and to analyse the
relationship of hydrological process (i.e. flow of stream) to the river changes.
1.3 OBJECTIVE OF STUDY
I. To establish the time series of river changes maps
H. To analysis the relationship of hydrology process (i.e. flow of stream) to the river
changes.

S
1.4 SCOPE OF STUDY
I. Sungai Kuantan changes due to sediment losses.
II. The correlation flow-rate to changes.
1.5 THESIS STRUCTURE
This research consists of five chapters. Chapter one comprises the introduction
section. It states the study background, problem statement, objectives of study and lastly
scope of study. For chapter two, describe the key term in- purpose of these research and
comprises the literature review that related and suitable for these research. Chapter three
explains the research methodology that used for planning research type of data collected
and the method of data analysis to be employed. For chapter -four present the result that
obtained from the study area and year of study and discussed the result from analysis.
Finally, chapter five comprises the conclusion from the overall chapter and relates some
recommendation for future work on research field.

CHAPTER 2
LITERATURE REVIEW
2.1 INTRODUCTION TO HYDROLOGICAL CYCLE
The water cycle, also known as the hydrologic cycle or the H20 cycle, describes the
continuous movement of water on, above and below the surface of the Earth. The mass of
water on Earth remains fairly constant over time but the partitioning of the water into the
major reservoirs of ice, fresh water, saline water and atmospheric water is variable
depending on a wide range of climatic variables. The water moves from one reservoir to
another, such as from river to ocean, or from the ocean to the atmosphere, by the physical
processes ofevaporation, condensation, precipitation, infiltration, runoff, and subsurface
flow. In so doing, the water goes through different phases: liquid, solid (ice), and gas
(vapor).
The water cycle involves the exchange of energy, which leads to temperature
changes. For instance, when water evaporates, it takes up energy from its surroundings and
cools the envjrom-ent When it condenses, it releases energy and warms the environment.
These heat exchanges influence climate.
6

7
The evaporative phase of the cycle purifies water which then replenishes the land
with freshwater. The flow of liquid water and ice transports minerals across the globe. It is
also involved in reshaping the geological features of the Earth, through processes
including erosion and sedimentation. The water cycle is also essential for the maintenance
of most life and ecosystems on the planet.
The variety of ways by which water moves across the land. This includes both
surface runoff and channel runoff. As it flows, the water may seep into the ground,
evaporate into the air, become stored in lakes or reservoirs, or be extracted for agricultural
or other human uses.
MEN
Th _ V -
V.-
Condensation I ..• S,blin.tio.,
Oceans
Figure 2-1 : Hydrological Cycle
Sources: water.usgs.gov (March 18,2014)

8
2.2 INTRODUCTION TO SEDIMENT
Sediment is a naturalty occurring material that is broken down by processes
of weathering and erosion, and is subsequently transported by the action of wind, water, or
ice, and/or by the force of gravity acting on the particles. For example, silt falls out
of suspension via sedimentation and forms soil (some of which may eventually
become sedimentary rock). Sediments are most often transported by water (fluvial
processes), wind (Aeolian) and glaciers. Beach sands andriver channel deposits are
examples of fluvial transport and deposition, though sediment also often settles out of slow-
moving or standing water in lakes and oceans. Fluvial is a term used
in geographyandgeologyto refer to the processes associated with riversandstreams and
thedepositsandlandformscreated by them. Erosion by moving water can happen in two
ways. Firstly, the movement of water across the bed exerts a shear stress directly onto the
bed. If the cohesive strength of the substrate is lower than the shear exerted, or the bed is
composed of loose sediment which can be mobilized by such stresses, then the bed will be
lowered purely by clear water flow. However, if the river carries significant quantities of
sediment, this material can act as tools to enhance wear of the bed (abrasion). At the same
time the fragments themselves are ground down, becoming smaller and more rounded
(attrition). Figure 2.1 show the process of the sediment occur and losses at the river.

9
Figure 2-2 : Fluvial Diagram (Sediment Process and Losses)
Sources petroleumsys.blogspot.com (Sept 27,20 10)
Z.i LIIAI(ACTE1USTICS OF SEDIMENT
Sediment characteristics can influence the rate and the pattern of the river condition.
There have some natural factors may affect the condition of the river such as particle size,
chemical composition, fall velocity and many more. The size of sediment, fall velocity and
the sediment density has been choice to determine the characteristics of sediment. (A.A.G,
N.Adilah, 2013). The table 1 and table 2 show the relationship between the fall velocity and
mean size of sediment.
Table 2-1 : Fall Velocity for Day 1
Sources sciencedirect.com (March 30, 2013)
fsbk 1. Fait veiocity foe Day l
Sion Mt-an Siz.(mm) Efl Ve1odt (m's) S1-S2 "94 8.0
S2-S3 0683 042
S3-S4 018 0.547
S4-S5 0.67 0A031

10
Table 2-2 : Fall Velocity for Day 2
Sources : sciencedirect.com (March 30, 2013)
Table 2. Fall velocity foe Day 2
Station Meni Sj,(tnm) Fall elocity (i&s) SIS2 2.63 6,222
S2-S3 0.746 030
53-S4 3.029 825
S4S5 0.505 023
2.4 CHARACTERISTIC OF WATER TRANSPORTING MEDIUM
The interrelated characteristics of water that govern its ability to entrain and move
sedimentary particles are density, viscosity, and acidity. Density is the ratio of mass to
volume. Increasing the temperature of water increases its volume and decreases its density.
With an increase in temperature from 40 to 100 0 C (104 to 212 0 F), water will expand to
1.04 times its original volume. In working with large volumes of moving water, the slight
variations in density that result from temperature chahge are usually ignored. Viscosity is
the cohesive force between particles of a fluid that causes the fluid to resist a relative
sliding motion of particles. Under ordinary pressure, viscosity varies only with temperature.
A decrease in water temperature from 26.7 to 4.4°C (80 to 40 °F) increases viscosity
about 80 percent. Changes in viscosity affect the fall velocity of suspended sediment and
thereby its vertical distribution in turbulent flow (Colby and Scott 1995). Increasing the
viscosity lowers the fall velocity of particles, particularly very fine sands and silts. A
substantial decrease in water temperature and the consequent increase in viscosity smooth
the bed configuration, lower the Manning 'In" roughness coefficient, and increase the
velocity over a sand bed (U.S. Department of the Army 1968).
The pH value is the negative logarithm (base 10) of the hydrogen-ion concentration.
Neutral water has a pH value of 7.0. Acid water has a pH value lower than 7.0; alkaline

11
water has a pH value higher than 7.0. In acid waters sediment deposition may be promoted
by the formation of colloidal masses of very fine sediments (flocculation) that settle faster
than their component fine particles.
Pevbs
• t,
PT
'
Perm •-' l - ____ -L_.,
Kliing Byn Lep...... •
J.jawl '
RJa H}tam Deralik
Beinarn _o Tengl
'' . 9ebarMechng Klang .......-4
pang ---Z
ZOOM Mau Linggi . tMring
- POdeu
Sighdy PHu ed A Ba!o,_L.. z;_c:L:clI, Clean -
''
- -.--.--- ----.-----
Figure 2-3 : River Basin of Peninsular Malaysia
Sources : Environment Quality Report 2006
2.5 CONCLUSION
As the conclusion, the research of the sediment at area of stream flow is neglected
by the impact of development to the hydrological cycle. So as the movement for new era,
the impact of the hydrological cycle to the landscape changes should on the first place of
research on the impact of environment.
P.nØiatanchrpa
•-y— SeduHui
Maian rn— tandas/M.ith*ng 4— Oun
Keteh - 4—
l(enanw
l4iantan

CHAPTER 3
RESEARCH METHODOLOGY
3.1 INTRODUCTION
This chapter describes the phases involved in achieving the study objectives. There
were FOUR (4) phases, namely; i) data collecting, ii) pre-processing, iii) processing, and
iv) results and analysis (Figure 8). Data collecting, pre-processing and the processing will
be explained in the following sections in this chapter. While the results and analyses are
described in Chapter 4.
The research will be starting with collecting in-situ flow rate data from the Jabatan
Pengairan dan Saliran Malaysia (JPS). Then, the satellite base-map was captured from the
google-earth map at the area of study. After that the process will through the process of the
conversion into GIS software to calculate and identify the relationship and correlation of
the river bed and flow rate. Lastly the product from the GIS conversion will outcome the
different ant the data which is will show the reality on site.
12

13
h1tj taJP/)CBase-Map
/Minimum, Mean, N\
( Maximum Flow ConvertGlS
Rate J
Mean Flow Rate
and River Bed
CAnalyzeYC low Rate
iver Bed
Min Flow Rate
and River Bed
_
che area of sediment losses could be
calculate by the arithmetic equation/
Figure 3-1 : Methodology Flow Chat

14
3.2 DATA COLLECTING
The, data collected is the flow rate that obtained from the study or collection of data
from the Department of Irrigation and Drainage (JPS) Pahang annual report flow rate for
the location in SungaiKuantan, Bukit Kenau. That the instrument used to measure the data
of stream flow is called Global Water Flow Probe. Data is typically collected from stations
that had been set for detecting and measuring stream flow and water levels.
Figure 3-2 Flow Rate Data ( JPS)
Sources :JabatanPengairandanSaliran Pahang (1975 - 2011)
MONTH MIN MAX MEAN
JAN 5.1 117.8 51.7
FEB 2.6 119.6 31.1
MAR 2.2 167.4 33.9
APR 5.8 86.2 29.6
MAY 5.8 94.1 28.8
JUNE 8.5 66 23.6
JULY 5.2 67.8 20.1
AUG 4.1 37.3 19.5
SEPT 4.1 37.3 19.5
OCT
-
13.3 87.7 77.7
NOV 19.9 422 116.8
DEC 5.4 451.4 33.1

The satellite data of the based image of the area of the river bed is also captured from the Google Earth. Image below show
the shade area is the river bed according to the year of recorded. The year was chosen by the determination of the cloud in the image
and the weather on that time of year.
Figure 3-3 : The Map of Study Area for Year 2010
Source: Google Earth (May 30, 2010)

Figure 3-4: The Map od Study Area for Year 2011
Source Google Earth (June 25, 2011)
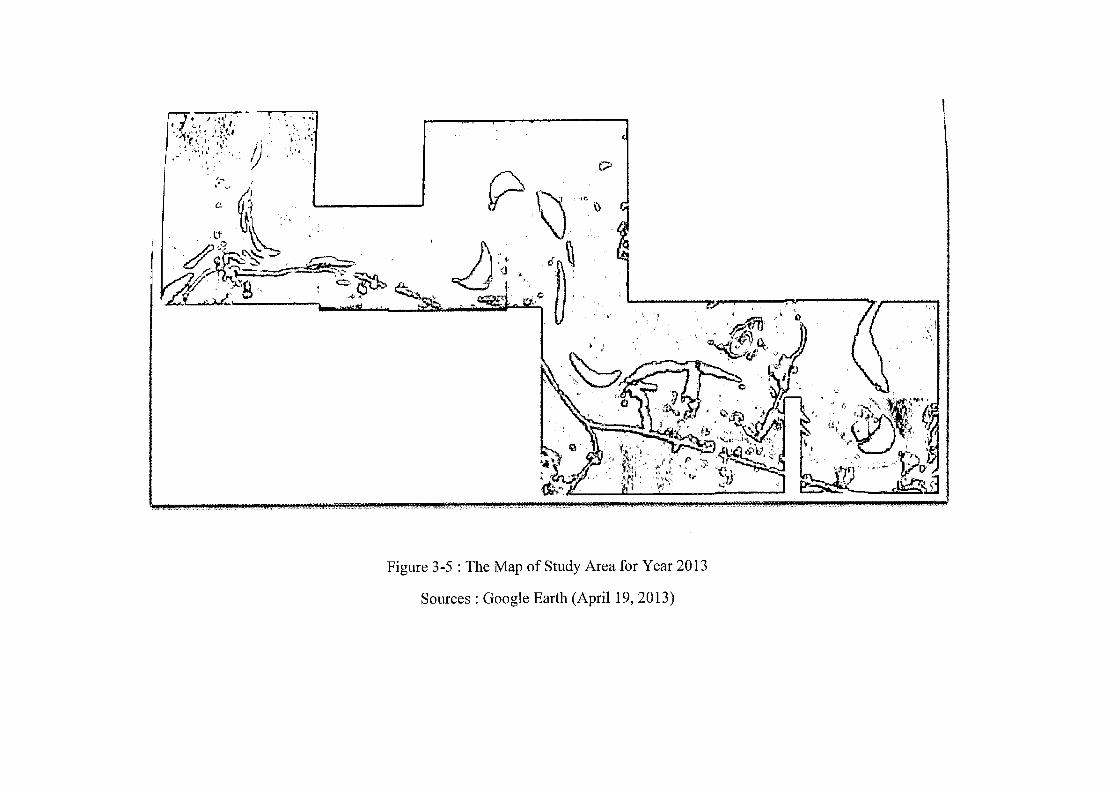
Figure 3-5 : The Map of Study Area for Year 2013
Sources : Google Earth (April 19, 2013)

-i 7^, : -}
.
• I
I "'s.'- '•
-I-4I •,•
F,. -
- I
7a ̂ "Ill^
c....., s!j •- .. -. .
\
b.
Figure 3-6: The Map of Study Area of Year 2014
Sources :.Google Earth (Feb 30, 2014)