HYDROLOGY OF FOREST ECOSYSTEMS IN THE HONOULIULI WATERSHED
191
HYDROLOGY OF FOREST ECOSYSTEMS IN THE HONOULIULI PRESERVE: IMPLICATIONS FOR GROUNDWATER RECHARGE AND WATERSHED RESTORATION. A DISSERTATION SUBMITTED TO THE GRADUATE DIVISION OF THE UNIVERSITY OF HAWAI'I IN PARTIAL FULFILLMENT OF THE REQUIREMENTS FOR THE DEGREE OF DOCTOR OF PHILOSOPHY IN BOTANICAL SCIENCES (BOTANY - ECOLOGY, EVOLUTION AND CONSERVATION BIOLOGY) DECEMBER 2004 By Teresa G. Restom Gaskill Dissertation Committee: Guillermo Goldstein, Chairperson K. W. Bridges John Ewel Frederick Meinzer Thomas Giambelluca
Transcript of HYDROLOGY OF FOREST ECOSYSTEMS IN THE HONOULIULI WATERSHED

HYDROLOGY OF FOREST ECOSYSTEMS IN THE HONOULIULI
PRESERVE: IMPLICATIONS FOR GROUNDWATER RECHARGE AND
WATERSHED RESTORATION.
A DISSERTATION SUBMITTED TO THE GRADUATE DIVISION OF THEUNIVERSITY OF HAWAI'I IN PARTIAL FULFILLMENT OF THE
REQUIREMENTS FOR THE DEGREE OF
DOCTOR OF PHILOSOPHY
IN
BOTANICAL SCIENCES(BOTANY - ECOLOGY, EVOLUTION AND CONSERVATION BIOLOGY)
DECEMBER 2004
ByTeresa G. Restom Gaskill
Dissertation Committee:
Guillermo Goldstein, ChairpersonK. W. Bridges
John EwelFrederick Meinzer
Thomas Giambelluca

111
To Doug and Sofiafor their love and support

Acknowledgements
This project was supported by the USDA Forest Service through Agreement No.
PSW-97-0017CA to G. Goldstein, by the Ecology, Evolution and Conservation
Biology Program (EECB), the College ofNatural Sciences of the University of
Hawaii at Manoa, and the Dai Ho Chun Dissertation Completion Scholarship. I also
received support from the Postl Endowed Scholarship and the Mildred Towle
Scholarship for International Students.
I would like to thank the US Forest Service, the UH Agricultural Engineering
Department, Rick Meinzer, Tom Giambelluca and Michael Constantinides for
lending several pieces of equipment, and the Botany Department at the University of
Hawaii and the US Forest Service for letting me use their four-wheel drive vehicles. I
would also like to thank Robin Harrington, Jack Ewel, Jennifer Garrison, and The
Nature Conservancy of Hawaii - Oahu for their help in choosing sites and during
several stages of the research.
Randy Amiscaray contributed greatly in the design and application of the rainfall,
stemflow and throughfall collectors. David Fujii, Ted Schmidt, Heidi Masuko, Doug
Restom Gaskill and others gave valuable contributions in collecting data. Thanks also
to Shannon Peters for the soil identification, to Michael Clearwater and Shelley James
for their help and training in the construction of the sapflow probes, and to Leone!
Sternberg and Doug Restom Gaskill for their help in data analyses.
IV

Abstract
The main objectives of this study were (1) to quantify and explain differences
in the components of the water cycle among forest stands dominated by non-native
tree species and (2) to estimate the potential of these stands to recharge groundwater.
These forest stands were planted in the 1900s to repair the hydrological impacts that
deforestation had caused on the watersheds in Hawaii in the 1800s. Rainfall
interception and leaf area index (LAI) were measured in stands dominated by each of
four species (Casuarina glauca, Fraxinus uhdei, Eucalyptus robusta and Grevillea
robusta). Transpiration, patterns of water uptake and soil moisture dynamics were
measured in one stand each dominated by the first three species. The data collected
were used to assess the potential of some of the stands to recharge groundwater from
May 2001 to April 2002.
A long period of drought was observed between January 2000 and October
200 I. The Fraxinus stand exhibited deep water uptake and recovered LAI promptly
after the end of the drought. The Eucalyptus stand had relatively deep water uptake
but had a very slow recovery of LAI in relation to the other stands. The Casuarina
stand had shallow water uptake but it was still able to recover LAI relatively quickly.
Transpiration, relative to tree basal area, was similar among the three species after the
end of the drought.
Interception ranged from 4 to 29% of rainfall for the year of 1999 and there
were no significant differences in interception among stands dominated by different
species. Evapotranspiration (ET) rates were 90, 94 and 65% of rainfall for Fraxinus,
v

Eucalyptus and Casuarina, respectively. Thirty two percent of rainfall was lost as
surface runoff in the Casuarina stand.
No groundwater recharge was observed in these stands during the period
studied. The results suggest that the species chosen for reforestation in Honouliuli
were not ideal for restoring and protecting the groundwater resource. It would have
been more desirable to use species that are conservative water users instead of fast
growing trees which are able to reduce erosion in a short term but which exhibit
relatively high ET rates even after 80 years.
VI

Table of Contents
Acknowledgements iv
Abstract v
List of Figures xi
List of Abbreviations and Symbols xiii
1. Introduction 1
1.1. Overview 1
1.2. Restoration of ecosystem processes by tree plantations 1
1.3. Hydrological cycle in forest ecosystems 4
1.4. Groundwater use and recharge on Oahu 8
1.5. Objectives and hypotheses 9
1.6. Dissertation outline 11
1.7. Methods 12
1.7.1. The study site 12
1.7.2. Species studied 13
1.7.3. Field measurements 17
1.8. Summary 22
1.9. References 22
2. Patterns of water uptake and transpiration in Eucalyptus robusta,Fraxinus uhdei and Casuarina glauca growing in plantations in Honouliuli,Hawaii 34
2.1. Abstract 34
2.2. Introduction 35
2.3. Methods 37
2.3.1. The study site 37
2.3.2. Field measurements 38
2.4. Results 41
2.4.1. Rainfall pattern and soil moisture dynamics 41
2.4.2. Vertical pattern of water uptake by roots 42
2.4.3. Leaf area dynamics 43
2.4.4. Transpiration 44
VB

2.5. Discussion 46
2.6. Conclusions 52
2.7. References 53
3. Effects of Species Composition on the Rainfall Interception, Stemflow andThroughfall of Mesic Forest Plantations of Hawai'i 72
3.1. Abstract 72
3.2. Introduction 73
3.3. Methods 75
3.3.1. The study site 75
3.3.2. Species studied 75
3.3.3. Field measurements 76
3.3.4. Statistical Analyses 78
3.4. Results 79
3.4.1. Rainfall 79
3.4.2. Leaf area index 80
3.4.3. Throughfall 80
3.4.4. Stemflow 82
3.4.5. Interception 82
3.5. Discussion 83
3.5.1. Throughfall 83
3.5.2. Stemflow 85
3.5.3. Interception 87
3.5.4. Effect of forest structure on throughfall and stemflow 88
3.6. Conclusion 89
3.7. References 90
4. Evapotranspiration and Groundwater Recharge by Tree Plantations in theHonouliuli Preserve, Hawaii 108
4.1. Abstract 108
4.2. Introduction 109
4.3. Methods 111
4.3.1. The study site 111
4.3.2. Field measurements 112
Vlll
4.3.3. Micrometeorological data 112
4.3.4. Potential evapotranspiration 113
4.3.5. Water balance method 114
4.3.6. Temperature variance method (TVAR) 118
4.3.7. Sap flow method 120
4.4. Results 121
4.4.1. Potential evapotranspiration (PE) 121
4.4.2. Water balance method 122
4.4.3. Temperature variance method (TVAR) 123
4.4.4. Sap flow method 123
4.4.5. Interception vs. evapotranspiration 124
4.5. Discussion 124
4.5.1. Effect of species composition on evapotranspiration 124
4.5.2. Evapotranspiration vs. potential evapotranspiration 127
4.5.3. Groundwater recharge and runoff 128
4.5.4. The methods 129
4.5.5. Implications of reforestation on groundwater 131
4.6. Conclusion 133
4.7. References 134
5. Conclusions and implications for groundwater recharge and watershedrestoration projects in Hawaii. 153
5.1. Are there differences in the components of the water cycle of forests dominated
by different species? 153
5.2. How do direct measurements of evapotranspiration compare to previous
estimates? 156
5.3. Do forests dominated by different species differ in their potential to recharge
groundwater? 157
5.4. Implications of this research for groundwater recharge and watershed
restoration in Hawai'i 159
5.5. References 161
6. Literature cited 163
IX

List of Tables
Table 1.1 - Characteristics of the stands studied at the Honouliuli Preserve, Oahu,Hawaii 31Table 2.1 - Characteristics of the stands studied at the southern section of theHonouliuli Preserve, Oahu, Hawaii, as of 1998 57Table 2.2 - Number of water samples collected from trees and from the soil pits 57Table 2.3 - Depth of sapwood and of the sap flow sensors installed in trees inHonouliuli 58Table 2.4 - Sap flow for the trees studied 58Table 2.5 - Equations obtained from multiple regression comparing transpiration withair saturation deficit and volumetric water content in different cumulative depths ofthe soil for F. uhdei trees 59Table 2.6 - Equations obtained from multiple regression comparing transpiration withair saturation deficit and volumetric water content in different cumulative depths ofthe soil for C. glauca trees 60Table 2.7 - Equations obtained from multiple regression comparing transpiration withair saturation deficit and volumetric water content in different cumulative depths ofthe soil for Eucalyptus trees 61Table 3.1 - Comparison of manually collected throughfall among stands dominatedby different species 95Table 3.2 - Results from the one-way analyses of variance comparing throughfall as aproportion of rainfall in an event basis 96Table 3.3 - Throughfall as a proportion of rainfall during periods of high and low leafarea index in the stands of the southern section of the Honouliuli Preserve 96Table 3.4 - Regression equations between rainfall and stemflow obtained for treesthroughout the stands studied 97Table 3.5 - Throughfall, stemflow, and interception based on manual measurementson stands dominated by different species 98Table 3.6 - Rainfall, throughfall, stemflow, and interception on stands dominated bydifferent species in the Honouliuli Preserve from January to December 1999 98Table 4.1 - Terms in the water balance model. 141Table 4.2 - Final curve numbers used to estimate runoff in the forest stands studied inthe Honouliuli Preserve between May 2001 and April 2002 141Table 4.3 - Precipitation and estimated values of runoff, evapotranspiration andgroundwater recharge in the forest stands from May 5, 2001, to April 27, 2002..... 142
x

List of Figures
Figure 1.1 - Location ofthe Honouliuli Preserve on the Island of Oahu, Hawaii ...... 32Figure 1.2 - Location of the stands studied, weather stations and additional rainfallcollectors in the Honouliuli Preserve on the island of Oahu, Hawaii 33Figure 2.1 - Monthly rainfall from August 1998 to March 2002 near the standsstudied 62Figure 2.2 - Soil moisture of the three stands studied between May 19,2001 and April7, 2002 63Figure 2.3 - Soil volumetric water content in the dry season and in the wet season forstands dominated by Fraxinus uhdei, Eucalyptus robusta and Casuarina glauca in theHonouliuli Preserve 64Figure 2.4 - Patterns of water uptake by roots of Fraxinus uhdei, Eucalyptus robustaand Casuarina glauca as indicated by the hydrogen isotope ratio (8D) 65Figure 2.5 - Rainfall, leaf area index, volumetric water content of the top 15 cm ofthesoil profile, and sap flux density of trees in stands dominated by Casuarina glauca,Fraxinus uhdei or Eucalyptus robusta in Honouliuli 66Figure 2.6 - Sapwood area in trees of different DBH of the three species studied inHonouliuli 67Figure 2.7 - Diurnal patterns of air saturation deficit and sap flow in different depthsof the sapwood for 15 January 2002 68Figure 2.8 - Sap flux density in the sapwood profile for one tree each of Casuarinaglauca, Fraxinus uhdei, and Eucalyptus robusta for February and March 2002........ 69Figure 2.9 - Daily total sap flow plotted against basal area for Casuarina glauca,Fraxinus uhdei, and Eucalyptus robusta for the period between January and March2002 70Figure 2.10 - Total daily sap flow as a function of mean daily air saturation deficit atthe beginning and at the peak of the drought for representative trees of Casuarinaglauca, Fraxinus uhdei, and Eucalyptus robusta 71Figure 3.2 - Rainfall distribution in three sections of the Honouliuli Preserve 100Figure 3.3 - Monthly rainfall in the three sections of the Honouliuli Preserve betweenMarch 1998 and February 2002 101Figure 3.4 - Leaf area index on stands dominated by Casuarina glauca, Eucalyptusrobusta, Fraxinus uhdei, and Grevillea robusta from June 1999 to July 2000 102Figure 3.5 - Leaf area index in the forest stands of the southern section of theHonouliuli Preserve between June 2001 and March 2002 103Figure 3.6 - Throughfall, as a proportion of rainfall, for events < 3 mm, as a functionof leaf area index for the three stands in the southern section of the HonouliuliPreserve 104Figure 3.7 - Stemflow as a function of rainfall in stands dominated by Eucalyptusrobusta, Fraxinus uhdei, Casuarina glauca, or Grevillea robusta in the northern,middle and southern sections of the Honouliuli Preserve 105Figure 3.8 - Throughfall as a function of various stand characteristics and of rainfallfor the period between January and December 1999 106
Xl

Figure 3.9 - Stemflow as a function of various stand characteristics and of rainfall forthe period between January and December 1999 107Figure 4.1 - Relationship between half-hourly measurements of soil heat flux and netradiation in the Brazilian Cerrado from August 29 to October 16, 2001.. 143Figure 4.2 - Comparison of mean daily potential evapotranspiration per monthestimated with the Penman equation from May 2001 to April 2002, above the canopyof three forest plantations, and the estimated by Giambelluca (1983) for the years1946 through 1975, adjusted for dry forest cover. 144Figure 4.3 - Water balance model calibration curves comparing estimated andmeasured soil volumetric water content for the forest stands, before includingestimates of runoff 145Figure 4.4 - Water balance model calibration curves comparing estimated andmeasured soil volumetric water content, including runoff estimates, for the foreststands 146Figure 4.5 - Evapotranspiration estimated by the water balance method in standsdominated by Casuarina glauca, Eucalyptus robusta and Fraxinus uhdei betweenMay 5, 2001 and April 28, 2002 147Figure 4.6 - Comparison of half-hourly estimates between potentialevapotranspiration and canopy evaporation during daytime periods with no rain forstands dominated by Casuarina glauca and Fraxinus uhdei, between June andNovember 2001 148Figure 4.7 - Daily evapotranspiration estimated by the sap flow method in standsdominated by Casuarina glauca, Eucalyptus robusta, or Fraxinus uhdei in March2002 149Figure 4.8 - Comparison of evapotranspiration estimated by the water balance and bythe sap flow methods, in three forest stands in the Honouliuli Preserve dominated byCasuarina glauca, Eucalyptus robusta or Fraxinus uhdei 150Figure 4.9 - Daily evapotranspiration in the Eucalyptus robusta stand estimated bythe water balance and the sap flow methods in May 2001 151Figure 4.10 - Precipitation and estimated potential evapotranspiration,evapotranspiration, and interception in the forest sites studied from May 5,2001 toApril 28, 2002 152
Xll

List of Abbreviations and Symbols
A - downward longwave radiation, in W m-2
As - sapwood area, in m2
ASD - air saturation deficit, in kPa
Cp - heat of air at constant pressure, in J kg-l K-1
d - zero-plane displacement, in m
~D - relative abundance of deuterium, in %0
DBH - diameter at 1.3 m, in cm
11SM - soil moisture variation in the root zone, in mm
E: - emissivity of the surface
Ei - interception evaporation, in mm
Et - dry canopy evaporation, in mm
ET - evapotranspiration, in rom
g - acceleration due to gravity, in m S-2
G - soil heat flux, in W m-2
H - sensible heat flux, in W m-2
HOF - Horton overland flow, in mm
k - von Kannan constant (0.4)
Kd - downward shortwave radiation, in W m-2
Ku - reflected shortwave radiation, in W m-2
A- latent heat of vaporization
LAI- Leaf area index, in m2 m-2
Xlll

p - air density, in kg m-3
P - precipitation, in mm
PE - potential evapotranspiration, in mm
R - groundwater recharge, in mm
r a - aerodynamic resistance, in s m-1
Rnet - net radiation, in W m-2
(J - Stephan-Boltzmann constant (5.67 x 10⁻⁸ W m-2 K 4)
(JT - standard deviation of the temperature
SFD - sap flux density, in g m2S-l
To - surface temperature, in K
Ta - air temperature, in K
U - wind speed, in m S-l
VWC - soil volumetric water content, in %
Zo - roughness height for momentum transfer, in m
zo' - roughness height for heat transfer, in m
XIV

1. Introduction
1.1. Overview
The planting of alien trees has been used as a tool to repair deforestation
impacts both in temperate and tropical areas. In Hawaii, alien tree plantations were
introduced in the first half of the 20th century to ameliorate the hydrological impacts
that intensive sandalwood extraction and cattle ranching had caused on the
watersheds in the 1800s. Since their introduction, the impact of these tree plantations
on the hydrological cycle, including groundwater recharge, has not been evaluated.
The present study has the objectives of quantifying, for the first time in
Hawaii, the components of the water cycle in forest plantations dominated by
different alien tree species thereby estimating the potential of these stands to recharge
groundwater. These objectives were achieved through a four-year field study in the
Honouliuli Preserve, on the Waianae Mountains of the Island of Oahu, Hawaii.
Native tree plantations or remnants of native vegetation are not included in this study
due to their absence in mid-elevation sites on the Waianae Mountains, but the data
obtained on the alien tree plantations may provide grounds for future watershed
restoration projects and management decisions in Hawaii.
1.2. Restoration of ecosystem processes by tree plantations
Tree plantations have been widely established to rehabilitate degraded lands.
In Hawaii, both primary and secondary successions operate at a very slow rate (e.g.,
Drake 1993). When native forest species have very low growth rates the recovery of
1

degraded or denuded land by fast-growing introduced plants can be done
alternatively. In continental tropical regions, growth of secondary vegetation can be
very fast after slash and bum practices because of the high species diversity and the
proximity to the seed source, and therefore rehabilitation of deforested areas may not
require introduction of fast-growing species. In isolated islands, such as Hawaii,
intervention on the secondary succession may be required to speed the rate of
restoration. Studies in Puerto Rico (Lugo 1988, Parrota 1992, 1993, 1995) have
shown that forest plantations established on degraded sites long devoid of native
forests can act as facilitators of the recovery of ecosystem functions, providing better
climatic conditions and safe sites for the establishment of seedlings of native species.
The ability of forest plantations to provide conditions for colonization by native
Hawaiian plants has been observed in forest plantations in Hawaii (Harrington and
Ewe11997, Woodcock et al. 1999). The invasion of native as well as non-native
plants in forest plantations can be explained by the inability of some planted species
to efficiently utilize the resources available for growth (Haggar and Ewel 1997).
Ecosystem structure and function is expected to differ among plantations of
different species. For example, Eucalyptus robusta plantations in Puerto Rico
(Parrota 1995) and Hawaii (Garrison 2003) exhibit higher density and richness of
seedlings in the understory than Casuarina plantations. These differences can be
attributed to structural differences between the plantations such as litter depth
(Parrota 1995). The choice of species for reforestation thus appears to be a very
important step towards the recovery of forest ecosystems.
2

In the Honouliuli Preserve in Hawaii (Fig. 1.1), non-native trees were planted
to restore and protect watersheds (Asner et al. 1993). In 1815, sandalwood extraction
initiated large changes in the vegetation of the Waianae Mountains and was followed
by cattle ranching until 1877. By 1855, over 20,000 animals could be found grazing
throughout the preserve including cattle, horses and sheep (Asner et al. 1993). There
were no fences to limit animal movement and the remnant forests were severely
damaged during this period. During the sugarcane production, several non-native tree
species were planted on Oahu in an effort to reduce erosion and to restore the
watersheds (Asner et al. 1993). By 1960, 4,200 ha ofplantations of species such as
Eucalyptus spp., Casuarina spp., Fraxinus uhdei, Grevillea robusta, and Melaleuca
quinquenervia covered nearly half of the 9,120-hectare Honouliuli Preserve (Nelson
et al. 1968).
The species planted in Honouliuli are representative of the trees used for
reforestation throughout the tropics. Some Eucalyptus and Casuarina species, for
example, are used for reforestation to regulate the depth of water table and salinity in
wetlands of Australia (e.g., Morris et al. 1998, Cramer et al. 1999). Eucalyptus spp
are by far the most studied of the trees used for reforestation in the tropics. Studies
on this genus have shown its importance in the water cycle of forests (e.g., Vertessy
et al. 1997, Calder 1998). Observations that some forest plantations exhibit high
transpiration rates have changed the traditional notion that forests increase the water
yield when compared to short crops (Calder 1998, 2000).
Alien tree plantations in Honouliuli exhibit very low density and richness of
native plants and very high density and richness of invasive plants in their understory
3

(Garrison 2003). Ares and Fownes (1999) found evidence that F uhdei might be
competing with the native Acacia koa for water, and J. B. Friday and colleagues
(pers. comm.) have measured a decrease in the basal area of native species in stands
mixed with F uhdei. However, native plants do grow in the understory of F uhdei
plantations (Harrington and Ewel1997). Nonetheless, the ability of tree plantations
to foster seed recruitment also favors the establishment of invasive plants. As some
invasive plants grow faster than native Hawaiian plants (e.g., Walker and Vitousek
1991, Pattison et al. 1998), their influence and spread threatens the rehabilitation of
Hawaiian forests. Because they have characteristics that may result in higher rates of
water utilization (Pattison et al. 1998, Stratton et al. 2000, Baruch and Goldstein
1999), these invasive non-native plants may change the hydrological functioning of
forests considerably.
1.3. Hydrological cycle in forest ecosystems
Forests are responsible for recycling most of the fresh water available in the
continents. When forests are cut down, increased soil compaction and reduced
transpiration cause more water to flow faster to rivers and oceans (Salati and Nobre
1991, Nepstad et a11994, Jipp et al. 1998). Forests affect the water cycle mainly by
returning the precipitated water back to the atmosphere through evapotranspiration,
and by providing high infiltration (Dunne and Leopold 1978). Changes in land use in
continental regions with extensive forested areas can affect hydrological processes,
such as evapotranspiration, and, consequently, affect regional or even global climate
(Shukla and Mintz 1982, Lean and Warrilow 1989, Shukla et al. 1990, Salati and
Nobre 1991). Development of secondary vegetation reduces the impact of
4

deforestation on the hydrological cycle (Giambelluca et al. 1996, HOlscher et al.
1997, Jipp et al. 1998); however, in some cases, natural regeneration ofthe forest is
very slow. As a result, a faster process of reforestation of watersheds is needed in
order to decrease the impacts of changes in land cover. Although reforestation can
reduce erosion and runoff, it does not always restore the hydrological processes to the
levels found before deforestation (see reviews by Bruijnzeel1996, 1997). In Hawaii,
the main concern in relation to deforestation is the possible reduction in groundwater
recharge, and reforestation with alien trees was done in order to increase this
component of the water cycle. Understanding the water cycle in reforested areas may
provide tools to improve land management programs that affect water resources in
Hawaii and other tropical islands.
The main input of water in a tropical forest is usually through rainfall. Fog
interception may be an important source of water and nutrients in certain high
elevation forests in Hawaii (e.g., Heath and Huebert 1999), but it is not an important
input of water in the mid-elevation forests ofHonouliuli (personal observation).
After reaching the forest canopy, the water follows three main pathways: interception
by the canopy and eventual evaporation, dripping from the leaves and branches or
falling directly to the ground (throughfall), or reaching the ground by flowing down
tree stems (stemflow). Before reaching the mineral soil, some of the water is
intercepted by the litter and eventually evaporated. Part of the water that enters the
soil returns to the atmosphere through the plant by transpiration, and another part
seeps to the water table. Evaporation directly from the soil is usually negligible in
forests (e.g., Jordan and Heuveldop 1981). The water that is not transpired or held by
5

the soil may move by surface runoff to the streams, or vertically to recharge
groundwater. Although the effects of different cover types (e.g., grasses and forests)
on the hydrological cycle have been well studied (e.g., Bultot et al. 1990, Hodnett et
al. 1996, Calder 1998, Jipp et al. 1998), the effects of different forest types on the
magnitude of the water cycle components are still unclear.
Stand structure and tree species may affect forest hydrology by influencing
each of the components of the water cycle cited above, changing the rate and amount
of groundwater recharge. Interception and throughfall, for example, are directly
related to the stand basal area, cover and tree density (Rogerson 1967); the higher the
level of each of these characteristics, the higher the amount of water intercepted by
the canopy (Rogerson 1967). In continental areas, interception amounts to 11 to 39%
of rainfall in hardwood forests (Raich 1983, Pandit et al. 1991, Bruijnzeel1997) and
7 to 28% in softwood plantations (Bruijnzeel 1997), and represent 10 to 34% of
evapotranspiration (Jordan and Heuveldop 1981; Leopoldo et al. 1982, 1995; Moreira
et al. 1997). However, Aboal et al. (1999) found interception loss rates between 30
and 41 % of rainfall on a laurel forest in the Canary Islands, and attributed these rates
partly to the high storage capacity of the canopy. Interception values between 14%
and 22% of gross precipitation found for lower montane rainforests in Jamaica
(Hafkenscheid 2000) and Puerto Rico (Schellekens 2000) were similar to continental
sites but interception was estimated to comprise between 41 and 74% of
evapotranspiration. These observations have led to an increased interest in expanding
direct measurements of interception on tropical island ecosystems (Schllekens et al.
6

1999, Bruijnzeel 2000), but there is still very little information on island forests ofdry
to mesic climate (Bruijnzeel 2000, Schllekens et al. 2000).
Helvey and Patrie (1965) proposed general equations to calculate throughfall
and stemflow that can be applied to hardwood forests of the eastern United States.
However, later studies showed differences among species in relation to these two
hydrological components (e.g., Cape et al. 1991, Sood et al. 1993, Bruiijnzeel1997,
HOlscher et al. 1998), indicating that species composition may influence the forest
water cycle. Canopy density and deciduousness (Cape et al. 1991), bark texture
(Sood et al. 1993), and leaf and branch angles (van Elewijck 1989, Holscher et al.
1998) are species characteristics that may influence throughfall and stemflow.
Throughfall and stemflow in young stands (::=; 12 years old) of different Eucalyptus
species were found to vary from 81 to 94% and 1 to 8% of precipitation, respectively
(reviews by Poore and Fries 1985, and BruijnzeeI1997). Waterloo (1994) found
stemflow to be 1.4% ofprecipitation in a Pinus caribaea plantation in Fiji, but high
values of stemflow, 13 to 18% of precipitation, were reported for lower montane rain
forests in Jamaica (Hafkenscheid 2000) and the extreme value of 41 % was observed
in a secondary forest of eastern Amazonia dominated by Phenakospermum
guyannense (Holscher et al. 1998).
Transpiration rates depend on net radiation, air saturation deficit, wind
conditions, soil moisture availability, leaf area, and stomatal and boundary layer
conductances. Differences in transpiration among species have been widely observed
(Granier et al. 1996, Goldstein et al. 1998, Hunt and Beadle 1998, Restom and
Nepstad 2001), but comparisons among studies are difficult due to the strong effect
7

that climatic factors have on transpiration (Granier et al. 1996). In a stand or
ecosystem level, transpiration rates have been estimated to be similar among forests
dominated by different species. Roberts and Rosier (1994) estimated annual
transpiration rates from one stand ofFraxinus excelsior and one of Fagus sylvatica of
407 and 393 mm, respectively.
Evapotranspiration rates in tropical forests located at continental edges or
islands may be higher than in continental forests. In forests ofPuerto Rico
(Schellekens 2000) and Fiji (Waterloo et aI1999), rainfall interception was greater
than the values predicted by energy balance equations, indicating that other sources of
energy, besides solar radiation, are controlling interception (BruijnzeeI2000). If this
occurs on Oahu, it is possible that previous studies underestimated evapotranspiration
on the island and, consequently, overestimated groundwater recharge.
1.4. Groundwater use and recharge on Oahu
Many problems in maintaining good water quality and a sufficient amount of
water for domestic and industrial consumption arise on islands. Human consumption
is the largest pressure on this resource. For example, human populations on islands
that rely on surface water suffer during periods of extended drought (Shade et al.
1992). Demand on groundwater then increases as an alternative to the less
dependable surface water resource. An extremely serious impact of groundwater
exploitation in oceanic islands is salinization of the water. Groundwater in Hawaii
occurs mainly as basal water, a lens of freshwater floating on and displacing saltwater
at or below sea level (Robins and Lawrence 2000). High levels of pumping from
8

coastal wells, lowering the water levels, cause a rise in the level of the freshwater
saltwater boundary below the well.
The Island of Oahu relies on groundwater, which provided 86% of the
freshwater consumed on the island in 1995 (DLNR 1995). The groundwater in the
Pearl Harbor area, which is part of the southern Oahu groundwater flow system, is the
most developed of the island. The water table in this area have lowered at a rate of
about 30 cm i l from 1910 to 1977, when pumpage increased from 4.5 m3S·l to 10.5
m3S·l (Anthony 1997), and is estimated to have lowered from 10m above sea level
(asl) near Honouliuli before development to lower than 6 m asl in 1984 (Nichols et al.
1996). In 1980, over 60% of groundwater used on the island was pumped from the
southern Oahu area alone (Nakahara 1980).
Estimates of groundwater recharge for the Island of Oahu were based on
estimates of evapotranspiration based on an uncalibrated water balance model
(Giambelluca 1983, Shade and Nichols 1996), and thus might have been
overestimated (see section 1.3). Direct measurements of evapotranspiration are
necessary to improve these estimates.
1.5. Objectives and hypotheses
The main objectives of this study were (1) to quantify and explain differences
in the components of the water cycle among stands dominated by different species
and (2) to estimate the potential of these stands to recharge groundwater.
In this research, stands of Eucalyptus robusta, Fraxinus uhdei, Casuarina
glauca and Grevillea robusta, planted in the Honouliuli Preserve between 1930 and
9

1950, were studied to observe their patterns of water utilization. The species differ in
several aspects, such as size, leaf shape and size, phenology and rooting depth.
Differences in depth of water uptake, and canopy cover and phenology were
considered as stand characteristics that directly affect water use. The data collected
were used to assess the potential of each stand to recharge groundwater.
The questions and hypotheses of this study are summarized below:
1. Are there differences in the components ofthe water cycle offorestplantations
dominated by different species?
HI. There are differences in the components of the water cycle among forests
dominated by different species.
Prediction: The water cycle components will vary according to stand's
characteristics that are a result of species composition such as leaf area index, tree
density, canopy phenology, and rooting depth. I expect that stands dominated by
evergreen species, and with high leaf area index, high tree density and deep water
uptake to have low throughfall and high rates of stemflow, interception, transpiration
and evapotranspiration. On the other end of the spectrum, stands dominated by
deciduous species, and with low leaf area index, low tree density and shallow water
uptake will have high throughfall and low rates of stemflow, interception,
transpiration and evapotranspiration.
10

2. How do measurements ofevapotranspiration compare to values obtained
previously?
H2: Evapotranspiration rates in the forests of Honouliuli, estimated by direct
measurements of sensible heat flux, are higher than previously estimated values based
on an uncalibrated water balance model (Giambelluca 1983).
3. Do forests dominated by different species differ in their potential to recharge
groundwater?
H3: The potential to recharge groundwater will differ among stands
dominated by different species.
Prediction: Based on the prediction of hypothesis 1 (HI) and considering
surface runoff negligible, the stands with higher evapotranspiration rates will have
lower potential to recharge groundwater and the stands with low evapotranspiration
rates will have higher potential to recharge groundwater.
1.6. Dissertation outline
The hypotheses above are addressed in this dissertation as outlined below:
In Chapter 2, I discuss the patterns of water utilization, particularly
transpiration and soil water uptake, of three stands each dominated by a different tree
species, addressing part of hypothesis HI.
In Chapter 3, I discuss the differences in rainfall interception among stands
dominated by different species, addressing another part of hypothesis HI.
11

In Chapter 4, I discuss the differences in evapotranspiration among three of
the stands studied and their potential to recharge groundwater, addressing part of
hypothesis HI, and hypotheses H2 and H3.
Finally, in Chapter 5 I conclude this dissertation by discussing the
implications of the data obtained in this study for watershed restoration.
1.7. Methods
The study was conducted from April 1998 to April 2002 in the Honouliuli
Preserve. Interception was measured in twelve forest stands, three stands dominated
by each of four species: Casuarina glauca, Eucalyptus robusta, Fraxinus uhdei and
Grevillea robusta. The other components of the water cycle were measured or
estimated in one stand each dominated by the first three species.
1. 7.1. The study site
A reserve was established in Honouliuli (59°46'42" E, 23°68'634" N) at the
end of the 1920s by Campbell Estate and was adopted by The Nature Conservancy as
a preserve in 1990. Honouliuli Preserve contains a high occurrence of rare native
Hawaiian plant and animal species. It is located in the Honouliuli land division of
Oahu, on the eastern slope of the southern Waianae Mountain Range, on the Southern
Oahu groundwater flow-system (Nichols et al. 1996). Mean annual rainfall in this
area ranges from 540 to 750 mm (Giambelluca et al. 1986). The native forest was
largely devastated by sandalwood extraction and ranching. Native forest remnants
are now concentrated on the summit areas where cattle could not access them, but
12

representatives of the native vegetation, individually or in small patches, are found at
lower elevations.
The soils at Honouliuli are an association of Tropohumults-Dystrandepts. The
northern part of the preserve is dominated by Ultisol Tropohumults soils while the
southern part of the preserve is dominated by Inceptisol Dystrandepts soils (S. Peters,
Soil Sciences Department, University of Hawaii). However, the Eucalyptus robusta
stand in the northern part of the preserve is on the soil series mahana, an Inceptisol,
and the Eucalyptus and Fraxinus stands in the middle part of the preserve are on the
soil series kemoo, an Alfisol (Nagel 2003). Soil depth varies between approximately
20 and 130 cm in the southern part of the preserve (personal observation).
1. 7.2. Species studied
Out of almost 17,000 ha of forest trees planted before 1950 on the island of
Oahu, Eucalyptus robusta, Casuarina spp., Fraxinus uhdei and Grevillea robusta
account for 48% (Nelson et al. 1968).
Eucalyptus robusta Sm. - Myrtaceae. Eucalyptus robusta (swamp-mahogany
eucalypt), the most common Eucalyptus planted in Hawaii, is originally from swamp
areas of coastal southeastern Australia. Over 4,000 ha of E. robusta were planted on
Oahu before 1950 (Nelson et al. 1968). These trees can attain heights of over 30 m
and diameters of over 1 m. The trunk is usually straight with a red-brown, thick,
rough and very fibrous bark. Other species ofEucalyptus were found to have
maximum rooting depths from 2.7 m (E. regnans) to 40 m (E. marginata) (review by
Canadell et al. 1996). Eucalyptus regnans has been shown to have high transpiration
13

rates, from 75 to 285 kg dai l in trees of 56 to 89 cm DBH (Vertessy et al. 1997).
However, significant differences in leaf water use efficiency among some species of
Eucalyptus have not been detected (Hatton et al. 1998). In Honouliuli, stands ofE.
robusta usually exhibit a thick layer of coarse litter and little developed understory.
The trees in the stands studied reached 30 to 43 m heights and their basal area was
relatively high when compared to stands dominated by the other species of this study
(Table 1.1).
Casuarina glauca Sieber ex Spreng - Casuarinaceae. Casuarina spp.
(ironwood) were some ofthe most planted trees on Oahu with almost 3,000 ha
planted before 1950 (Nelson et al. 1968). Originally from Australia, Casuarina
glauca is now the most common species of Casuarina in the forest reserves ofHawaii
(Little and Skolmen 1989). Shrubs from this genus were observed to have maximum
rooting depths from 2.0 m (c. muelleriana) to 2.4 m (c. pusilla) (review by Canadell
et al. 1996). Species of Casuarina may produce allelopathic chemicals in low levels
(Suresh and Rai 1988, Barritt and Facelli 2001), which, together with the high
accumulation of litter mass (Suresh and Rai 1988), decreases understory colonization
(Parrota 1995, Barritt and Facelli 2001). Although Casuarina spp. fix nitrogen, the
characteristics cited above make these species unsuitable for catalyzing the
restoration of native flora. In Honouliuli, stands dominated by Casuarina are
remarkable by the lack of understory plants and the presence of a very thick layer of
litter and roots at the soil surface. The trees found in these stands are smaller in
height and diameter than in the stands dominated by the other species of this study.
14

Fraxinus uhdei (Wenzig) Lingelsh. - Oleaceae. Fraxinus uhdei (tropical ash)
is originally from Mexico. Since 1920, over 700,000 trees have been planted on all
islands in Hawaii for watershed cover (Little and Skomen 1989), but until 1950 less
than 40 ha were planted on Oahu (Nelson et al. 1968). Of these, at least 20 ha were
planted in Honouliuli. Fraxinus uhdei is deciduous, losing all of its foliage for one
month between November and January in Hawaii (Harrington and EweI1997). In
temperate deciduous forests, another species of this genus, Fjaponica, may have
roots down to 2 m depth (review by Canadell 1996), but, in this study, the roots of F
uhdei as well as the roots of the other species, are probably limited by the shallow soil
(personal observation). Fraxinus stands in Honouliuli usually exhibit a dense
understory, with 94% of seedlings and saplings being of the same dominant canopy
species (Garrison 2003). The litter layer is very thin suggesting that decomposition of
the leaves is relatively fast in these stands.
Grevillea robusta A. Cunn. (Proteaceae) is a large tree, reaching 12 to 30 m in
height, with rough, thick bark. This species is the second most commonly planted
tree in Hawaii (Little and Skolmen 1989). In Honouliuli, Grevillea forms stands with
tall sparse trees and higher percent ground cover than stands dominated by Casuarina
glauca or Eucalyptus robusta (Garrison 2003). The stands of Grevillea in Honouliuli
are starting to show signs of senescence and the ones located in the drier areas have
their understory dominated by the invasive shrub Schinus terebinthifolius. Due to the
physiological constraints that the trees in these dying stands may be experiencing, this
species was only included in part of the study.
15

The stands used in this study are still dominated by the original planted
species but most of them have been invaded by several other trees and shrubs. When
the density of these other species was high, they were also included in the
measurements. The species included were Psidium cattleianum and Schinus
terebinthifolius.
Psidium cattleianum Sabine - Myrtaceae. Originally from southern Brazil, P.
cattleianum (strawberry guava) is a small evergreen tree that can reach heights of 6 to
15 m. It was introduced into Hawaii in 1825 for its edible fruit (Little and Skolmen
1989) and now occurs up to 1,300-m elevation across a broad range ofprecipitation
(Jacobi and Warshauer 1992). A high density ofthis species can be found invading
forest plantations such as Eucalyptus saligna (Harrington and Ewel 1997). The bark
ofP. cattleianum trees is smooth resulting in large amounts of stemflow (personal
observation). The edible fruits attract animals that help to disperse the seeds. This
characteristic, associated with their clonal growth, turns this species into one of the
most aggressive invasive species in Hawaii (Huenneke and Vitousek 1990).
Schinus terebinthifolius Raddi - Anacardiaceae. Schinus terebinthifolius
(Christmas berry, Brazilian pepper, wilelaiki) is an evergreen shrub or small tree that
can reach a height of 8 m. It is originally from South America and was introduced
into Hawaii before 1911 as an ornamental due to its attractive red berries (Little and
Skolmen 1989). The bark of mature plants is furrowed and slightly scaly (Lemke
1992). Schinus terebinthifolius shows a very high plasticity in water utilization when
compared to native Hawaiian plants in dry forest (Stratton et al. 2000), giving it a
competitive advantage in dry environments.
16

1. 7.3. Field measurements
For the purpose ofthis study, the Honouliuli Preserve was subdivided in three
sections: south, middle, and north. This subdivision was done to account for
topographic and climatic differences in the study area. In each of these sections, one
stand dominated by each ofthe planted species was studied (Fig. 1.2). A summary of
the characteristics of each stand can be found in Table 1.1.
Interception and leaf area index were measured in all 12 stands. Complete
sets of measurements were obtained in three stands (Casuarina, Eucalyptus and
Fraxinus) in the southern section, each dominated by a different species, including
rainfall above the canopy, interception, soil moisture, and transpiration. The data of
these three stands were applied to a water balance equation to estimate the water
available to recharge groundwater. Meteorological data and rainfall were collected
for each section of the preserve from three weather stations (Fig. 1.2).
All the data were collected for eight months (July 2001 to March 2002) in the
three stands of the southern section. Interception was measured for three years (from
April 1998 to March 2001) in the northern section and for two years (from April 1999
to March 2001) in the middle and southern sections. Leaf area index was measured in
all stands for one year (from August 1999 to July 2000) and in the three southern
stands for an additional eight months (from July 2001 to April 2002).
Stand characterization
Depth of water uptake was estimated for one stand of each forest type using
the natural abundance of the stable isotopes hydrogen and deuterium in the soil and
tree sapwood water (White et al. 1985). Water was collected at different depths in the
17

soil down to 90 cm in three soil profiles per stand and analyzed for the relative
abundance of these isotopes in each layer. Water was also obtained from sapwood
samples of four to five plants near where the soil samples were taken. Both the soil
and xylem samples were vacuum-distilled. The extracted water was analyzed for
stable isotope ratios of hydrogen/deuterium using mass-spectrometry (Mountain Mass
Spectrometry, Evergreen, CO, USA). The depth of water uptake was determined by
comparison between the plant sample and the soil profile.
Leaf area index (LAl) was estimated with a LAl-2000 Plant Canopy Analyzer
(LiCor, Lincoln, NE, USA) at 12 to 20 points along two or more transects in each
stand every two months for one year, and additionally every month for eight months
in the stands of the southern section. The points were at 10m intervals along
transects set 15 m apart. The number of points varied in each stand in order to get a
standard error:S 5%. This method bases on the light extinction through the canopy to
estimate cover and compares the measurements done under the canopy with
measurements done in an open area. Simultaneous measurements below the canopy
and in the open were done with the use of two LAl-2000 units. LAl estimated with
the LAl-2000 was tested by Lopez-Serrano et al. (2000) and was shown to give
similar results as other methods.
Components ofthe water cycle
Rainfall was measured above the canopy and in open areas close to the stands
with tipping bucket rain gauges (Texas Electronics, Dallas, TX). The gauges were
connected to dataloggers (21 X or CRI0, Campbell Sci., Logan, UT; or Hobo Event,
Onset, Pocasset, MA) to measure intensity and duration of each event.
18

Interception was estimated by subtracting the sum of throughfall and stemflow
from the rainfall value for a certain period.
Throughfall collectors were composed of a set of three troughs attached to a
bucket. Each set had a collection area of 0.2 m2. Three to nine sets (depending on
data variation) were installed under the canopy in each stand. The water collected in
the buckets was measured every other week in each stand for the first three years of
the study (1998 - 2000) and additionally every week for six months in 2001 in the
stands on the southern section. For the 2001 measurements, approximately half ofthe
collectors were automated with tipping buckets connected to dataloggers (Hobo
Event, Onset, Pocasset, MA), collecting data for a total of eight months.
Stemflow was measured with spiral collars fitted to tree stems channeling
water into 4- to 30-liter collection bottles, or to a tipping bucket connected to a
datalogger (Hobo Event, Onset, Pocasset, MA). These collectors were installed in
four to eight trees in each stand. The water collected in the bottles was measured
every two weeks in each stand for the first three years of the study and additionally
every week for six months, or eight months for the automated collectors, in the stands
on the southern section. Regressions were done between rainfall and stemflow
amount for trees in different diameter classes to permit scaling up tree measurements
to the stand in units of water depth, based on a vegetation survey.
Soil moisture, in terms of volumetric water content, was measured weekly
from May 2001 to April 2002 in three stands on the southern section with time
domain reflectometry (TDR, MP-917, E.S.!. Environmental Sensors, Inc., BC,
Canada). Three electrically segmented profiling probes (Type F, E.S.I.
19

Environmental Sensors, Inc., BC, Canada) were installed vertically in the soil at three
random locations in each stand for measuring soil moisture at five depths: 0-15, 15
30,30-45,45-60, and 60-90 em. Measurements were obtained manually with a
viewing instrument (MP-917, Environmental Sensors, Inc.) specially designed to
interrogate the probes.
Transpiration was measured with the heat dissipation technique (Granier
1985). One to six pairs (depending on tree size) of thermocouple probes of variable
lengths were inserted in each tree 1.5 m above the ground, in different depths of the
sapwood to measure sap flow. Measurements are based on the heat dissipation
method (Granier 1985, 1987) with probes made in our laboratory following the
procedure of James et al. (2002), and data were collected by a datalogger (21X or
CRlO plus a AM416 multiplexer, Campbell Sci., Logan, UT, USA). Total tree
transpiration was calculated based on sapwood area, which was determined by
injecting dye into the sapwood. Sap flow measurements were taken simultaneously
when possible in the three stands of the southern section between July 2001 and
March 2002.
Potential evapotranspiration (PE) was estimated based on the equation
proposed by Penman (1948) as described in Chapters 3 and 4.
Dry canopy evapotranspiration (the evapotranspiration occurring between
rainfall events) was estimated based on the temperature variance (TVAR) method
(Vugts et al. 1993). The TVAR method is based on the variation of temperature
measured with fast-response thermocouples above the canopy during dry canopy
conditions (Schellekens 2000). Chapter 4 gives more details on this method.
20

Data analysis of the components of the water cycle was done using Analysis
of Variance (ANOVA), Repeated Measures ANOVA or Analysis of Covariance to
determine differences among the species.
Micrometeorology
Micrometeorological data were collected from three weather stations installed
throughout the preserve, one in each section, and from infrared transducers
(4000AZL, Everest Interscience, Inc., Tucson, AZ, USA) measuring the canopy
temperature of three stands in the southern section. The stations measured solar
radiation (LI-200SZ, LiCor, Lincoln, Nebraska, USA), air temperature and relative
humidity (HMP45C, Vaisala, Inc., Sunnyvale, CA, USA), wind speed (OI4A,
MetOne Instruments, Rowlett, TX, USA), and precipitation. Upon completion ofthe
first three years of data collection, the weather station on the southern section was
moved to a new location to collect data above the canopy of short Schinus
terebinthifolius vegetation. This station was used as a reference, and was equipped
additionally with one net radiometer (Q7.1_L50, Radiation Energy Balance Systems/
Campbell Scientific, Logan, UT, USA), one infrared transducer measuring canopy
temperature, and one pyranometer positioned upside down to measure reflected
shortwave radiation.
Groundwater recharge
Evapotranspiration and groundwater recharge were estimated using a water
balance model calibrated for the study sites based on field measurements of soil
moisture. The water balance method used was the bookkeeping procedure
(Thornthwaite 1948, Thornthwaite and Mather 1955) modified by Giambelluca
21

(1983, 1986) and is described in more detail in Chapter 4. Groundwater recharge was
estimated from May 2001 to April 2002 in three stands on the southern section each
dominated by Casuarina, Eucalyptus or Fraxinus.
1.8. Summary
By measuring directly the components of the water cycle in non-native forest
plantations in the Honouliuli Preserve, this project aims to increase the understanding
of the hydrology of forests on oceanic islands and to contribute with data on
groundwater recharge, providing important tools to improve watershed management
and conservation. These direct measurements may be used to calibrate estimates of
evapotranspiration based on models created for continental areas, thus providing a
more accurate estimate of groundwater recharge for part of the Island of Oahu.
1.9. References
Aboal, J.R., M.S. Jimenez, D. Morales, and J.M. Hernandez. 1999. Rainfall
interception in laurel forest in the Canary Islands. Agricultural and Forest
Meteorology 97:73-86.
Anthony, S.S. 1997. Evaluation of the US Geological Survey Ground-Water Data
Collection Program in Hawaii, 1992. United States Geological Survey, Water
Resources Investigations Report 97-4232.
Ares, A., and 1. Fownes. 1999. Water supply regulates structure, productivity, and
water use efficiency ofAcacia koa forest in Hawaii. Oecologia 121: 458-466.
Asner, G., W. Garnett, and B.F. Morgan. 1993. Biological Inventory Report
Honouliuli Preserve.
Barritt, A.R., and J.M. Facelli. 2001. Effects of Casuarina pauper litter and grove soil
on emergence and growth of understorey species in arid lands of South Australia.
Journal of Arid Environments 49: 569-579.
22

Baruch, Z., and G. Goldstein. 1999. Leaf construction cost, nutrient concentration,
and net CO2 assimilation of native and invasive species in Hawaii. Oecologia 121:
183-192.
Bruijnzeel, L.A. 1996. Predicting the hydrological impacts of land cover
transformation in the humid tropics: the need for integrated research. In:
Amazonian Deforestation and Climate (1. Gash, C. Nobre, J. Roberts, R. Victoria,
eds), John Wiley & Sons: 15-55.
Bruijnzeel, L.A. 1997. Hydrology of forest plantations in the tropics. In: Management
of Soil, Nutrients and Water in Tropical Plantation Forests (E. K. S. Nambiar, A.
G. Brown, eds), ACIAR, CSIRO (Australia) and CIFOR (Indonesia): 125-167.
Bruijnzeel, L.A. 2000. Forest Hydrology. In: J. Evans (ed.) The Forests Handbook.
Blackwell Scientific, Oxford: 301-343 (Chapter 12).
Bultot, F., G.L. Dupriez, and D. Gellens. 1990. Simulation ofland use changes and
impacts on the water balance: A case study for Belgium. Journal of Hydrology
114: 327-348.
Calder,1.R. 1998. Water use by forests, limits and controls. Tree Physiology 18: 625
631.
Calder, 1.R. 2000. Land use impacts on water resources. Land-Water Linkages in
Rural Watersheds Electronic Workshop, 18 September - 27 October 2000, Food
and Agriculture Organization of the United Nations, Rome, Italy, 26 pp.
Canadell, J., R.B. Jackson, J.R. Ehleringer, H.A. Mooney, O.E. Sala, and E.-D.
Schulze. 1996. Maximum root depth of vegetation types at the global scale.
Oecologia 108: 583-595.
Cape, J.N., A.H.F. Brown, S.M.C. Robertson, G. Howson, and 1.S. Paterson. 1991.
Interspecies comparisons of throughfall and stemflow at three sites in northern
Britain. Forest Ecology and Management 46: 165-177.
Cramer, V.A., P.J. Thorburn, and G.W. Fraser. 1999. Transpiration and groundwater
uptake from farm forest plots of Casuarina glauca and Eucalyptus camaldulensis
in saline areas of southeast Queensland, Australia. Agricultural Water
Management 39: 187-204.
23
DLNR. 1995. http://www.state.hi.us/dlnr/cwrm/dataJdb052201.pdf Data complied by
the u.s. Geological Survey and provided by the Hawaii State Department of Land
and Natural Resources, Commission on Water Resource Management.
Drake, D.R. 1993. Population ecology ofMetrosideros polymorpha and some
associated plants of Hawaiian volcanoes. Ph.D. dissertation, Department of
Botany, University of Hawaii at Manoa, 200 pp.
Dunne, T. and L.B. Leopold. 1978. Water in Environmental Planning. W.H. Freeman
and Company, New York, 818pp.
van Elewijck, L. 1989. Influence of leaf and branch slope on stemflow amount.
Catena 16: 525-533.
Garrison, J. 2003. The role of alien tree plantations and avian seed-dispersers in
native dry forest restoration in Hawai'i. Ph.D. dissertation, University ofHawaii
at Manoa, USA, 370 pp.
Giambelluca, T.W. 1983. Water Balance ofthe Pearl Harbor-Honolulu Basin,
Hawaii, 1946-1975. Water Resources Research Center Technical Report 151,
151p.
Giambelluca, T.W., M.A Nullet, and T.A. Schroeder. 1986. Rainfall Atlas of Hawaii.
Report R76, Department of Land and Natural Resources, Honolulu, 267 pp.
Giambelluca, T.W., L.T. Tran, AD. Ziegler, T.P. Menard, and M.A Nullet. 1996.
Soil-vegetation-atmosphere processes: Simulation and field measurements for
deforested sites in northern Thailand. Journal of Geophysical Research 101 (D20):
25,867-25,885.
Goldstein, G., J.L. Andrade, F.C. Meinzer, N.M. Holbrook, J. Cavelier, P. Jackson,
and A Celis. 1998. Stern water storage and diurnal patterns of water use in
tropical forest canopy trees. Plant, Cell and Environment 21: 397-406.
Granier, A. 1985. Une nouvell methode pour la mesure du flus de seve brute dans Ie
tronc des arbres. Annales des Sciences Forestieres 42: 193-200.
Granier, A. 1987. Evaluation of transpiration in a Douglas-fir stand by means of sap
flow measurements. Tree Physiology 3: 309-320.
24

Granier, A, R Hue, and ST. Barigah. 1996. Transpiration of natural rain forest and
its dependence on climatic factors. Agricultural and Forest Meteorology 78: 19
29.
Hafkenscheid, R. 2000. Hydrology and biogeochemistry of tropical montane rain
forests of contrasting stature in the Blue Mountains, Jamaica. Ph. D. dissertation.
Haggar, J. P., and 1. 1. Ewel. 1997. Primary productivity and resource partitioning in
model tropical ecosystems. Ecology 78(4): 1211-1221.
Harrington, R.A, and J.1. Ewel. 1997. Invasibility of tree plantations by native and
non-indigenous plant species in Hawaii. Forest Ecology and Management 99:
153-162.
Hatton, T., P. Reece, P. Taylor, and K. McEvan. 1998. Does leaf water efficiency
vary among eucalypts in water-limited environments? Tree Physiology 18: 529
536.
Heath, J.A, and BJ. Huebert. 1999. Cloudwater deposition as a source of fixed
nitrogen in a Hawaiian montane forest. Biogeochemistry 44: 119-134.
Helvey, J.D., and J.H. Patric. 1965. Canopy and litter interception of rainfall by
hardwoods of eastern United States. Water Resources Research 1(2): 193-206
Hodnett, M.G., J. Tomasella, Ade O. Marques Filho, and M.D. Oyama. 1996. Deep
soil water uptake by forest and pasture in central Amazonia: Predictions from
long-term daily rainfall data using a simple water balance model. In: Amazonian
. Deforestation and Climate (J. Gash, C. Nobre, J. Roberts, R Victoria, eds), John
Wiley & Sons: 79-99.
Holscher, D., T.D. de A Sa, T.X. Bastos, M. Denich, and H. FOIster. 1997.
Evaporation from young secondary vegetation in eastern Amazonia. Journal of
Hydrology 193(1/4): 293.
Holscher, D., T.D. de A Sa, RF. Moller, M. Denich, and H. FOIster. 1998. Rainfall
partitioning and related hydrochemical fluxes in a diverse and in a mono specific
(Phenakospermum guyannense) secondary vegetation stand in eastern Amazonia.
Oecologia 114: 251-257.
25
Huenneke, L.F., and P.M. Vitousek. 1990. Seedling and clonal recruitment of the
invasive tree Psidium cattleianum: Implications for management of native
Hawaiian forests. Biological Conservation 53: 199-211.
Hunt, M.A., and C.L. Beadle. 1998. Whole-tree transpiration and water-use
partitioning between Eucalyptus nitens and Acacia dealbata weeds in a short
rotation plantation in northeastern Tasmania. Tree Physiology 18: 557-563.
Jacobi, J.D., and F.R. Warshauer. 1992. Distribution of six alien plant species in
upland habitats on the Island of Hawaii. In: C.P. Stone and J.T. Tunison (eds.)
Alien Plant Invasions in Native Ecosystems ofHawaii: Management and
Research. University of Hawaii Cooperative National Park Resources Studies
Unit, 155-188.
James, S.A., M.J. Clearwater, F.C. Meinzer, and G. Goldstein. 2002. Heat dissipation
sensors of variable length for the measurement of sap flow in tree with deep
sapwood. Tree Physiology 22: 277-283.
Jipp, P.H., D.C. Nepstad, D.K. Cassel, and C.R. de Carvalho. 1998. Deep soil
moisture storage and transpiration in forests and pastures of seasonally-dry
Amazonia. Climatic Change 39: 395-412.
Jordan, C.F., and J. Heuveldop. 1981. The water budget of an Amazonian rain forest.
Acta Amazonica 11(1): 87-92.
Lean, J., and D.A. Warrilow. 1989. Simulation of the regional climatic impact of
Amazon deforestation. Nature 342: 411-413.
Lemke, D.E. 1992. Schinus terebinthifolius (Anacardiaceae) in Texas. Phytologia 72:
42-44.
Leopoldo, P.R., W.K. Franken, E. Matsui, and E. Salati. 1982. Estimativa de
evapotranspirayao de floresta amaz6nica de terra firme. Supl. Acta Amazonica 12:
23-28.
Leopoldo, P.R., W.K. Franken, and N.A. Villa Nova. 1995. Real evapotranspiration
and transpiration through a tropical rain forest in central Amazonia as estimated
by the water balance method. Forest Ecology and Management 73: 185-195.
26

Little, E.L., and RG. Skolmen. 1989. Common Forest Trees of Hawaii (Native and
Introduced), United States Department of Agriculture, Forest Service, Agriculture
Handbook No. 679, 321 pp.
Lopez-Serrano, F.R., T. Landete-Castillejos, J. Martinez-MilUm, and A. del Cerro
Barja. 2000. LAI estimation of natural pine forest using a non-standard sampling
technique. Agricultural and Forest Meteorology 101: 95-111.
Lugo, A. E. 1988. The future ofthe forest: Ecosystem rehabilitation in the tropics.
Environment 30(7): 17-20,41-45.
Moreira, M.Z., L. Sternberg, L. Martinelly, R Victoria, E. Barbosa, L. Bonates, and
D. Nepstad. 1997. Contribution of transpiration to forest ambient vapor based on
isotopic measurements. Global Change Biology 3: 438-450.
Morris, J., L. Mann, and J. Collopy. 1998. Transpiration and canopy conductance in
eucalypt plantation using shallow saline groundwater. Tree Physiology 18: 547
555.
Nagel, J. 2003. The influence of non-native, monotypic forest plantations on soil
hydrologic properties within the Honouliuli Preserve, Oahu, Hawaii. Master
thesis, University of Hawaii, USA.
Nakahara, R.H. 1980. Water use in Hawaii 1980. State of Hawaii, Department of
Land and Natural Resources Report R71, 26p
Nelson, RE., W.RC. Wong, Jr., RL. Wick. 1968. Plantation timber on the Island of
Oahu - 1966. United States Department of Agriculture, Forest Service, Resource
Bulletin PSW-I0, 52 pp.
Nepstad, D.C., C. de Carvalho, E. Davidson, P. Jipp, P. Lefebvre, G. Negreiros, E. da
Silva, T. Stone, S. Trumbore, and S. Vieira. 1994. The role of deep roots in the
hydrological and carbon cycles of Amazonian forests and pastures. Nature 372:
666-669.
Nichols, W, P. Shade and C. Hunt, Jr. 1996. Summary of the Oahu, Hawaii, Regional
Aquifer-System Analysis. United States Geological Survey Professional Paper
1412-A,61pp.
27

Pandit, B.R., S.R.K. Chava, and V.V.S.V. Rao. 1991. Interrelationship of rainfall,
throughfall and stemflow in teak forest. Indian Journal of Forestry 14(4): 287
289.
Parrota, J.A. 1992. The role of plantation forests in rehabilitating degraded tropical
ecosystems. Agriculture, Ecosystems and Environment 41: 115-133.
Parrota, J.A. 1993. Secondary forest regeneration on degraded tropical lands: The role
ofplantations as "foster ecosystems". In: H. Lieth and M. Lohmann (eds.)
Restoration of Tropical Forest Ecosystems. Kluwer Academic Publishers, The
Netherlands, 63-73.
Parrota, J. A. 1995. Influence of overstory composition on understory colonization by
native species in plantations on a degraded tropical site. Journal of Vegetation
Sciences 6: 627-636.
Pattison, R., G. Goldstein, and A. Ares. 1998. Growth, biomass allocation and
photosynthesis of invasive and native Hawaiian rainforest species. Oecologia 117:
449-459.
Penman, H.L. 1948. Natural evaporation from open water, bare soils, and grass.
Proceedings of the Royal Society of London Series A, 193: 120-145.
Poore, M.E.D., and C. Fries. 1985. The Ecological Effects ofEucalyptus. Food and
Agriculture Organization of the United Nations, FAO Forestry Paper 59,88 pp.
Raich, J.W. 1983. Throughfall and stem flow in mature and year-old wet tropical
forest. Tropical Ecology 24(2): 234-243.
Restom, T.G., and D.C. Nepstad. 2001. Contribution of vines to the
evapotranspiration of a secondary forest in eastern Amazon. Plant and Soil
236(2): 155-163.
Roberts, J. and P.T.W. Rosier. 1994. Comparative estimates of transpiration of ash
and beech forest at a chalk site in southern Britain. Journal ofHydrology 162:
229-245.
Robins, N.S., and A. R. Lawrence. 2000. Some hydrogeological problems peculiar to
various types of small islands. Journal of the Chartered Institution of Water and
Environmental Management 14: 341-346.
28

Rogerson, T.L. 1967. Throughfall in pOle-sized loblolly pine as affected by stand
density. In: International Symposium on Forest Hydrology (W. Sopper, H. Lull,
eds), Pergamon Press: 187-190.
Salati, J., and c.A. Nobre. 1991. Possible climatic impacts oftropical deforestation.
Climatic Change 19:177-196.
Schellekens, J., F.N. Scatena, L.A. Bruijnzeel, and AJ. Wickel. 1999. Modelling
rainfall interception by a lowland tropical rain forest in northeastern Puerto Rico.
Journal of Hydrology 225:168-184.
Schellekens, J.L. 2000. Hydrological processes in a humid tropical rain forest: A
combined experimental and modeling approach. Ph. D. dissertation, Vrije
Universiteit, Amsterdam, The Netherlands, 156 pp.
Schellekens, J., L.A. Bruijnzeel, F.N. Scatena, N.J. Bink, and F. Holwerda. 2000.
Evaporation from a tropical rain forest, Luquillo Ezperimental Forest, eastern
Puerto Rico. Water Resources Research 36(8): 2183-2196.
Shade, P., S.S. Anthony, and K. Takasaki. 1992. Ground-Water Resources
Reconnaissance of the Yap Main Islands, Federated States of Micronesia. United
States Geological Survey, Water-Resources Investigations Report 90-4074.
Shade, P., and W.D. Nichols. 1996. Water Budget and the Effects of Land-Use
Changes on Ground-Water Recharge, Oahu, Hawaii. Regional Aquifer-System
Analysis, United States Geological Survey Professional Paper 1412-C, 38p.
Shukla, J., and Y. Mintz. 1982. Influence ofland-surface evapotranspiration on the
Earth's climate. Science 215: 1498-1500.
Shukla, J., C. Nobre, and P. Sellers. 1990. Amazon deforestation and climate change.
Science 247: 1322-1325.
Sood, V.K., R. Singh, and M. Bhatia. 1993. Throughfall, stemflow and canoopy
interception in three hardwood tree species around Shimla, Himachal Pradesh.
Indian Journal of Forestry 16(1): 39-44.
Stratton, L.C., G. Goldstein, and F.C. Meinzer. 2000. Temporal and spatial
partitioning of water resources among eight woody species in a Hawaiian dry
forest. Oecologia 124: 309-317.
29

Suresh, K.K., and R.S.V. Rai. 1988. Allelopathic exclusion of understorey by a few
multi-purpose trees. The International Tree Crops Journal 5: 143-151.
Thornthwaite, C.W. 1948. An approach toward a rational classification of climate.
Geographical Review 38(1):55-94.
Thornthwaite, C.W. and J.R Mather. 1955. The water balance. Publications in
Climatology 8(1): 104 p.
Vertessy, RA., T.J. Hatton, P. Reece, S.K. O'Sullivan, and RG. Benyon. 1997.
Estimating stand water use of large mountain ash trees and validation of the sap
flow measurement technique. Tree Physiology 17: 747-756.
Vugts, H.F., M.J. Waterloo, F.J. Beekman, K.F.A. Frumau, and L.A. Bruijnzeel.
1993. The temperature variance method: A powerful tool in the estimation of
actual evaporation rates. Hydrology of Warm Humid Regions (Proceedings of the
Yokohama Symposium, July 1993), IAHS Publication No. 216.
Walker, L.R, and P.M. Vitousek. 1991. An invader alters germination and growth of
a native dominant tree in Hawai'i. Ecology 72(4): 1449-1455.
Waterloo, M.l. 1994. Water and Nutrient Dynamics ofPinus caribaea plantation
Forests on Former Grassland Soils in Southwest Viti Levu, Fiji. Ph.D.
Dissertation, University of Amsterdam, Netherlands.
Waterloo, M.J., L.A. Bruijnzeel, H.F. Vugts, and T.T. Rawaqa. 1999. Evaporation
from Pinus caribaea plantations on former grassland soil under maritime tropical
conditions. Water Resources Research 35:2133-2144.
White, J.W.C., E.R Cook, J.R Lawrence and W.S. Broecker. 1985. The D/H ratios
of sap in trees: implications for water sources and tree ring DIH ratios.
Geochimica et Cosmochimica Acta 49: 237-246.
Woodcock, D.W., J.L. Perry, and T.W. Giambelluca. 1999. Occurrence of indigenous
plant species in a middle-elevation Melaleuca plantation on Oahu (Hawaiian
Islands). Pacific Science 53(2): 159-167.
30
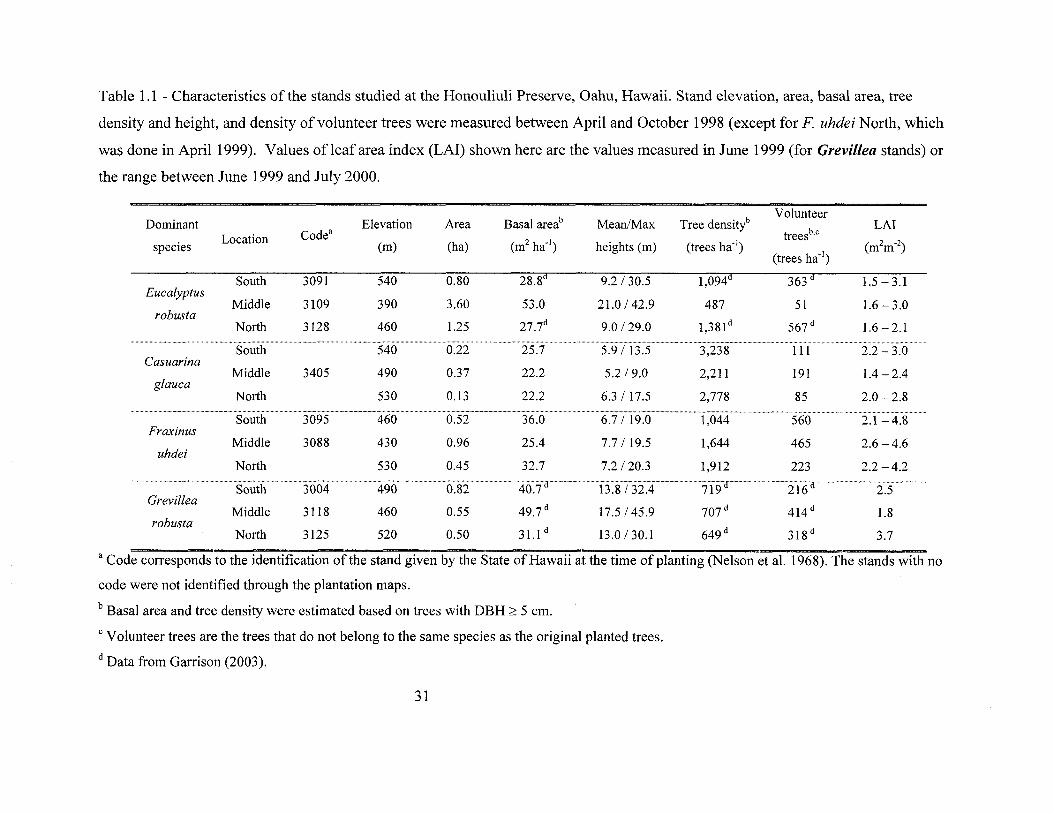
Table 1.1 - Characteristics of the stands studied at the Honouliuli Preserve, Oahu, Hawaii. Stand elevation, area, basal area, tree
density and height, and density of volunteer trees were measured between April and October 1998 (except for F uhdei North, which
was done in April 1999). Values of leaf area index (LAI) shown here are the values measured in June 1999 (for Grevillea stands) or
the range between June 1999 and July 2000.
Basal areab Tree densitlVolunteer
Dominant Elevation Area Mean/Maxtreesb,e
LAILocation Code"
(m2ha'l) (trees ha'l) (m2m'2)species (m) (ha) heights (m)(trees ha'l)
South 3091 540 0.80 28.8d 9.2 / 30.5 1,094d 363 d 1.5-3.1Eucalyptus
Middle 3109 390 3.60 53.0 21.0/42.9 487 51 1.6 - 3.0robusta
27.7d 1,381 d 567 dNorth 3128 460 1.25 9.0/29.0 1.6-2.1
South 540 25.7 5.9 13.5 3,238 III 2.2 - 3.0Casuarina
Middle 3405 490 0.37 22.2 5.2 / 9.0 2,211 191 1.4-2.4glauca
North 530 0.13 22.2 6.3/17.5 2,778 85 2.0-2.8
South 3095 460 0.52 36.0 6.7/ 19.0 1,044 560 2.1-4.8Fraxinus
Middle 3088 430 0.96 25.4 7.7/19.5 1,644 465 2.6 -4.6uhdei
North 530 0.45 32.7 7.2 /20.3 1,912 223 2.2 -4.2
3004 490 40.7 13.8/32.4 719 216 2.5Grevillea
49.7 d 707 d 414 dMiddle 3118 460 0.55 17.5/45.9 1.8robusta
31.1 d 649 d 318 dNorth 3125 520 0.50 13.0/30.1 3.7
a Code corresponds to the identification of the stand given by the State ofHawaii at the time of planting (Nelson et al. 1968). The stands with no
code were not identified through the plantation maps.
b Basal area and tree density were estimated based on trees with DBH:;::: 5 em.
e Volunteer trees are the trees that do not belong to the same species as the original planted trees.
d Data from Garrison (2003).
31

,- ,..
I
·....
• -.>':fa
.."
..
.'

nONOUUUUPRJ!SERVE
, <J Kaql OAHU
Nil..... ~ ~MoIoItIi
La.. 0 bMIUJ..THE "-01
HAWAIIANISVJIIDS
Figun 1:
Honouliuli Preserve(3,692 acres)
D..., ...L-__~'~ 1- H
ca-.; _ \000 Fe,,'
Figure 1.1 - Location of the Honouliuli Preserve on the Island ofOahu, Hawaii (map
from The Nature Conservancy of Hawaii).
32

Figure 1.2 - Location of the stands studied, weather stations and additional rainfall
collectors in the Honouliuli Preserve on the island of Oahu, Hawaii. Map was
modified from original map created by The Nature Conservancy of Hawaii - Oahu.
33

2. Patterns of water uptake and transpiration in Eucalyptus
robusta, Fraxinus uhdei and Casuarina glauca growing in plantations
in Honouliuli, Hawaii.
2.1. Abstract
This study focuses on the patterns of water uptake, and on transpiration, leaf
area and soil moisture dynamics of three non-native tree species widely planted in
Hawaii: Eucalyptus robusta, Fraxinus uhdei, and Casuarina glauca. The objective
was to assess differences in water uptake and transpiration among these species and
stands dominated by them. Data were collected in one stand dominated by each
species from August 1998 to March 2002. The vertical pattern of water uptake by
roots was determined using the natural abundance of stable hydrogen isotopes; leaf
area index (LAI) was measured monthly with a plant canopy analyzer; volumetric
water content was measured weekly using time domain reflectometry; and tree sap
flow was measured with heat dissipation probes. A long drought occurred from
January 2000 to October 2001. Three months after the end of the drought,
transpiration in Eucalyptus and Fraxinus trees was two to five times higher than in
Casuarina trees of similar diameter. However, the relationship between transpiration
and basal area was not significantly different among the three species, possibly due to
a lack of large Casuarina trees in the stand studied. It is suggested that species
composition and thus stand structural characteristics influence the speed and
magnitude of decline and recovery of tree transpiration. The stand dominated by
Fraxinus possibly takes water from at least 75 cm deep, has high soil moisture, and
34

recovered LAI promptly after the end of the drought. The Eucalyptus stand takes
water from approximately 45 cm deep soil and had high soil moisture, but had a very
slow recovery of LAI in relation to the other stands. The Casuarina stand takes water
from soil shallower than 40 cm, has very low soil moisture, but it was still able to
recover LAI relatively fast.
2.2. Introduction
Forest plantations on Oahu, Hawaii, occupy an area of 17,000 ha, which is
more than 11% of the island's area. These plantations were established during the
first half of the 1900s in order to increase groundwater recharge, which was thought
to have been reduced after a large part of the island's mountains were deforested by
sandalwood extraction and cattle grazing in the 1800s. Since their establishment, no
studies have been done to directly measure the water utilization of these forests and
their importance in the water yield of the watersheds. In this chapter I present results
from part of a larger study that aims to estimate the potential of these plantations to
recharge groundwater in the mesic watershed of Honouliuli, Island of Oahu, Hawaii.
This study focuses on the rates and patterns of transpiration, patterns of water uptake
by roots, and leaf area and soil moisture dynamics of forests dominated by three non
native tree species.
Forest stands dominated by one or very few species usually exhibit a certain
structure determined by the dominant species' characteristics (Wolf 1998, Galindo
Jaimes et al. 2002). The structure of the stand can be quantified by measuring
variables such as leaf area index, basal area, tree density, ground cover and species
35

richness. These variables may influence transpiration of individual trees in different
ways (e.g., Meinzer et al. 1996 for tree density, Calder 1998 for tree size, Oren et al.
1999 for leaf area index) resulting in differences in whole-stand transpiration when
comparing stands dominated by different species.
For accurate comparisons of water use among stands dominated by different
species, simultaneous measurements are required, or transpiration rates must be
normalized by relevant climatic driving variables, such as the air saturation deficit or
potential evapotranspiration. This is not always possible due to the high cost of
acquiring climatological equipment or the large number of sap flow sensors necessary
for adequate scaling of measurements on individual trees to the stand level. Recent
improvements in techniques for measuring sap flow have tried to address the problem
of scaling up the measurements from the probes to the tree (Clearwater et al. 1999,
James et al. 2002, Nadezhdina et a12002, Ford et al. 2004) and from the tree to the
stand (e.g., Hatton et al. 1995, Hunt and Beadle 1998) by reducing the errors in
estimating whole-tree transpiration rates. These improvements involve measuring sap
flow in different depths of the sapwood and increasing the number of probes per tree
to account for a larger part of the radial and axial sap flow variation within a tree. By
measuring sap flow in different depths of the sapwood, some authors have observed
radial differences in sap flow patterns among different species (James et al. 2002,
Nadezhdina et al. 2002, Ford et al. 2004).
I report data collected on stands of Eucalyptus robusta, Fraxinus uhdei, and
C;asuarina glauca that were planted in the Honouliuli Preserve between 1930 and
1950. I studied these stands to assess differences in water uptake and transpiration of
36

different species and their possible effect on whole-stand water use. I hypothesize
that water uptake and transpiration will differ among stands dominated by different
species due to differences in rooting depth, sapwood area, and leaf area dynamics.
This chapter focuses on transpiration at the tree level. Stand transpiration is analyzed
in Chapter 4.
2.3. Methods
2.3.1. The study site
The Nature Conservancy's Honouliuli Preserve is located on the eastern slope
of the southern Waianae Mountain Range, on the Island of Oahu, Hawaii. Mean
annual rainfall in this area ranges from 540 to 750 mm (Giambelluca et al. 1986).
The southern part of Honouliuli, where this study was conducted, is dominated by 20
to 130-cm-deep Dystrandepts (identification by S. Peters, Soil Sciences Department,
University of Hawaii at Manoa).
The native forest in Honouliuli was largely devastated by sandalwood
extraction and grazing during the 1800s. Native forest remnants are now
concentrated on the summit areas where cattle could not access them, but small
patches ofnative vegetation are still found at lower elevations. Between the 1920s
and late 1940s, several non-native fast-growing tree species were planted in this area,
in mono-specific stands, in order to reduce erosion and to facilitate groundwater
recharge.
37

2.3.2. Field measurements
From June 2000 to March 2002, sap flow, soil moisture, patterns of water
uptake, and leaf area index were measured in three forest stands dominated by each of
three species: Eucalyptus robusta, Casuarina glauca and Fraxinus uhdei (Section
1.7.2, Table 2.1). One micrometeorological station measuring rainfall, net and
incoming solar radiation, albedo, wind speed, air temperature, and relative humidity
was placed near the stands.
Vertical patterns of water uptake by roots were observed in July 2001, after at
least 36 days with no rainfall event larger than 1 mm, using the natural abundance of
the stable isotopes hydrogen and deuterium in the soil and xylem water (White et al.
1985). Water was collected at different depths in the soil down to 90 cm, where
possible, in three soil profiles per stand (Table 2.2) and analyzed for the relative
abundance of deuterium (oD) in each layer. Water was also obtained from sapwood
samples of five to fourteen plants near where the soil samples were taken. Samples
were collected on July 12,2001, in the Fraxinus and Eucalyptus stands, and on July
25,2001, in the Casuarina stand. There were three rainfall events smaller than 0.5
mm each between these dates, the last on July 18. Both the soil and xylem samples
were vacuum-distilled, and the extracted water was analyzed for stable isotope ratios
ofhydrogenldeuterium using mass-spectrometry (Mountain Mass Spectrometry,
Evergreen, CO, USA). Analysis of variance and Tukey's pairwise comparisons
between the plant samples and the samples taken at different layers ofthe soil profile
were used to determine the depth of water uptake in each stand.
38

Leaf area index (LAI) was estimated with a LAI-2000 Plant Canopy Analyzer
(LiCor, Lincoln, NE) in 15 to 20 points along two or more transects in each stand
every month from June 2001 to March 2002. The points were at 10 m intervals along
transects set 15 m apart. The number of points varied in each stand in order to get a
standard error :S 5%. This method bases on the light extinction through the canopy to
estimate cover and compares the measurements done under the canopy with
measurements done in an open area. Simultaneous measurements below the canopy
and in the open were done in this study with the use of two LAI-2000 units. LAI
measured with the LAI-2000 was tested by Lopez-Serrano et al. (2000) and was
shown to give similar results as other methods.
Rainfall was measured at a weather station located between the Fraxinus and
Eucalyptus stands, and in an open area close to the Casuarina stand. Rainfall was
measured at 1 min intervals using tipping bucket rain gauges (Texas Electronics,
Dallas, TX) connected to a datalogger (21 X, Campbell Sci., Logan, UT; or Hobo
Event, Onset Computer Corp., Pocasset, MA).
Soil volumetric water content (VWC) was measured weekly from May 2001
to April 2002 in the three stands using time-domain reflectometry (Topp et al. 1980,
Topp and Davis 1985). Three electrically segmented profiling probes (Type F, E.S.!.
Environmental Sensors, Inc., BC, Canada) were installed vertically in the soil at three
random locations in each stand for measuring soil moisture at five depths: 0-15, 15
30,30-45,45-60, and 60-90 cm. Measurements were obtained manually with a
viewing instrument (MP-917, Environmental Sensors, Inc.) specially designed to
interrogate the probes.
39

Sap flow was measured with the heat dissipation technique (Granier 1985,
1987). One to six pairs (depending on tree size) of thermocouple probes of variable
lengths, each with a I-em measuring tip, were inserted in each tree in different depths
of the sapwood. The probes were made in our laboratory, following the procedure of
James et al. (2002), and the data were recorded by a datalogger (21X or CR10 plus
AM416 multiplexer, Campbell Sci., Logan, UT, USA) every ten minutes. The
sensors were inserted in pairs at approximately 1.5 m above the ground, forming a
spiral with the probes at successive depths, in four to six trees per stand. Each sensor
was separated vertically from its pair by 10 em, and circumferentially from the next
pair of probes by 5 em. Ideally, each tree was to be measured in at least two depths in
two sides of the trunk. However, the sensors were very delicate and several of them
broke either during installation or shortly after. This reduced the number oftrees
measured, the number of probes per tree, and the number of replicates per depth. The
probes that worked for a considerable number of days and were used for the analyses
are listed in Table 2.3.
Sap flow measurements were taken in June 2000 in the Casuarina stand, in
September 2000 in the E. robusta stand, and in the three stands between July 2001
and March 2002. Commercially available heat-dissipation probes (TDP 30 mm,
Dynamax, Houston, Texas, USA) were used in a few trees (Table 2.3). Total tree
transpiration was calculated based on sapwood area, determined at the end of the
study by inserting a 1% Safranin solution into a hole in the sapwood and collecting a
core above the hole two to three hours later. Sap flow was scaled up from the probe
to the tree by assigning each probe's measurement to the sapwood ring surrounding
40

the probe beginning halfway from the shallower probe tip and ending halfway to the
next, deeper, probe tip (James et al. 2002).
To test the null hypothesis that sap flow is similar in the three species, a
comparison of the regression curves between basal area and sap flow from January to
March 2002 for each species was made using analysis of covariance, having basal
area as the covariate.
An additional method to determine the preferential depth of water uptake
involved comparing the sap flow data to the soil moisture at different cumulative
depths. The VWC for each layer of the soil was averaged to obtain mean VWC in
cumulative depths of 0-15, 0-30, 0-45, 0-60, and 0-90 cm and to compare the
moisture at these layers to the sap flow of each tree measured. Mean daily tree
transpiration was used as the independent variable, and air saturation deficit (ASD)
and VWC in each layer were used as independent variables in a multiple regression
analysis to estimate depth of water uptake. Each depth was analyzed separately with
ASD against transpiration and the relationships that yielded the p values :S 0.05 were
considered to indicate the preferential depth of water uptake.
2.4. Results
2.4.1. Rainfallpattern and soil moisture dynamics
A long drought occurred in the study area between January 2000 and
November 2001, during which rainfall did not exceed 60 mm in any month (Fig. 2.1).
The normal winter rainfall pattern (based on Giambelluca et al. 1986) resumed in
November 2001, but February 2002 was drier than usual for February. Consequently,
41

soil moisture was very low until mid-November 2001 in all stands (Fig. 2.2), with an
average of 14.5% for the Fraxinus and Eucalyptus stands and of 12% for the
Casuarina stand. On average, the Fraxinus stand exhibited higher soil moisture
recharge after the rain restarted than the other stands, whereas soil at the Casuarina
stand was drier than at the other two sites (Fig. 2.2). The difference in soil water
content between the dry and wet seasons within the stands dominated by Fraxinus or
Eucalyptus is large, whereas within the Casuarina stand the difference is not as
dramatic (Fig. 2.3). Soil volumetric water content in the Casuarina stand remained
low even four months after the start of heavier rains (Fig. 2.2).
2.4.2. Vertical pattern ofwater uptake by roots
The soil 3D profile was very similar in the Casuarina and Eucalyptus stands,
with the most superficial layer (5-20 cm and 5-10 cm, respectively) having 3D values
around -30%0 and decreasing steadily with depth (Fig. 2.4). There were no significant
differences in 3D among the three layers of the soil sampled in the Fraxinus stand,
but most samples taken in the deepest layer exhibited more negative 3D values than
the shallower ones. The 3D measurements of the xylem water indicated that water
uptake might be deeper in stands dominated by Fraxinus than in the other two stands.
The 3D value in the sapwood water in Eucalyptus trees was similar to the values of
all soil layers sampled between 5 and 40 cm, but different from the 45-90 cm depth (F
= 6.25, p = 0.001). The 3D value in the sapwood water in Casuarina trees was
similar to the values in the 5-40 cm layers and different from the values in the layers
below that (F = 13.6, P < 0.001). In the Fraxinus stand, the water 3D value of the
42

sapwood was similar to the values of all layers, but barely significant for the two
more superficial layers (F = 3.49, p = 0.037). These results suggest that whereas
Eucalyptus and Casuarina might be drawing water from the profile down to 40 cm,
Fraxinus trees might be drawing water from as deep as 75 cm (Fig. 2.4). A more
accurate estimate of the depth of water uptake for the Fraxinus stand was not possible
because only one out of three soil pits had soil deeper than 30 cm. It is possible that
this species might be drawing water from the weathered basaltic substrate as indicated
by the more negative 8D values found in Fraxinus trees when compared to the soil
8D values. No correlation between plant size and xylem water 8D was detected for
the Casuarina trees. With the exception of one tree (DBH = 9.5 cm), the Casuarina
trees measured seem to consistently tap water from shallow soil. Diameter of the
sampled trees was not measured in the other stands.
2.4.3. Leafarea dynamics
Fraxinus stands had higher LAI than Eucalyptus or Casuarina stands before
the drought (Chapter 3). The LAI of the stands reached their lowest values from
September to December 2001 (Fig. 2.5, second panel). Eucalyptus appeared to have
been affected the most by the drought, dropping to LAI values < I, and recovering
very slowly after the rainfall increased, from November 2001 on (Fig. 2.5, second
panel). On the other hand, Fraxinus exhibited a relatively fast recovery of LAI after
the rain restarted.
43

2.4.4. Transpiration
The entire radial profile of Fraxinus and Casuarina trees consisted of active
sapwood but this was not the case in the Eucalyptus trees (Fig. 2.6). A similar
relationship between DBH and sapwood area was observed for Fraxinus and
Casuarina, which fit the same relationship observed by Meinzer et al. (2001). In
contrast, the DBH (in cm) and sapwood area (As, in m2) relationship for Eucalyptus is
described (r2 = 0.89, p = 0.005, n = 6) by the following equation (Fig. 2.6):
AsE.robusta = 0.0263 In(DBHE.robusta) - 0.0532 (eq.2.1)
Differences in sap flow were observed in the measurements made with probes
at the same depth within a tree. In some instances sap flow differed by 100%
between different sides of the same tree (Fig. 2.7). Radial differences within trees
were also observed among probes installed at different depths. Sap flux density
(SFD) was highest near the bark and decreased towards the center of the trunk in
Fraxinus and Eucalyptus. The decrease in SFD was steeper in Eucalyptus than in
Fraxinus as Eucalyptus tends to have shallower hydro-active xylem than Fraxinus.
In contrast, SFD remained the same throughout the Casuarina sapwood profile in
February and March 2002 (Fig. 2.8). These SFD profiles were used to estimate tree
transpiration in the trees that had no shallow probes (Table 2.3). The hypothesis that
sap flow as a function of basal area was the same in all three species tested with the
analysis of covariance could not be rejected (F = 0.59, p> 0.25). Some sampling bias
may have contributed to this result. The trees in the Casuarina stand are much
smaller in diameter than the trees in the other stands, and only three trees were
44

measured in the Fraxinus stand. A regression curve combining all three species
indicates that basal area explained 50% of the variation in the sap flow (Fig. 2.9).
The daily average SFD of all trees measured in each stand was very low
during the drought (Fig. 2.5, bottom panel). An increase in SFD after the drought
was observed in Eucalyptus and Fraxinus trees, but not in Casuarina trees, with the
exception of one Casuarina tree in November 2001 (Fig. 2.5, bottom panel). Sap
flow in Casuarina trees four months after the beginning of the drought was relatively
high, at an average of 100 kg d-1• Sap flow in the largest Casuarina tree decreased
drastically from 99 kg d-1 in June 2000 to 7 kg d-1 by the end ofthe drought. Even
after the end of the drought, sap flow in Casuarina trees continued to decrease to an
average ofless than 2 kg d-1 (Table 2.4). The earliest sap flow measurements in
Eucalyptus trees were done on September 2000, seven months after the beginning of
the drought. By this time, the mean sap flow of the trees measured was less than 10
kg d-1 (Table 2.4). In September 2000, two of the Eucalyptus trees had mean sap flow
of 7 kg d-1• By the end of the drought, sap flow on these same trees averaged 1 kg d-1
and increased to an average of4.3 kg d-1 after the end of the drought. Sap flow
measurements in Fraxinus trees began 18 months after the beginning of the drought.
Sap flow remained low in one Fraxinus tree from July to December 2001, at around 3
kg d- 1, then increased to around 17 kg d-1 after the end ofthe drought (Table 2.4).
Eucalyptus trees responded to the first rains after the drought faster than Fraxinus or
Casuarina trees, exhibiting an increase in sap flow as early as November and
December 2001 (Table 2.4).
45

The influence of the atmospheric demand on transpiration in dry and wet
periods for each stand is shown in Figure 2.10. There was an atmospheric regulation
of transpiration during the dry months (Fig. 2.10) and practically no relationship
between air saturation deficit (ASD) and sap flow during the wet months for all
stands (not shown).
The sap flow in the 45 cm DBH Fraxinus tree was significantly correlated to
VWC in the 0-30, 0-45, 0-60, and 0-90 cm soil depths, indicating that this tree may be
drawing water from at least 90 cm deep (Table 2.5). Sap flow was not significantly
correlated to VWC over any depth in the other two Fraxinus trees (Table 2.5). No
significant relationship was found between the sap flow in the Casuarina trees
examined and ASD and VWC at any depth (Table 2.6). Ofthe five Eucalyptus trees
examined, only one exhibited significant relationships, with soil moisture from 0-30
cm (Table 2.7).
2.5. Discussion
The differences in water use among the trees studied became apparent as the
drought ended. Sap flow was equally low in all three species by the end of the
drought, and it was not significantly different, as a function of basal area, after the
drought ended. However, the three species differed in the way they responded to the
return of the rain with Eucalyptus and Fraxinus showing faster responses than
Casuarina.
Although Eucalyptus had the fastest response of the three species in terms of
sap flow, its LAI took long to respond. This implies that Eucalyptus was able to
sustain high transpiration rates at low leaf area, caused possibly by increased stomatal
46

opening in response to increased leaf-specific hydraulic conductivity (Gt) following
increases in soil moisture. If Gt is inversely proportional to the leaf area:sapwood
area ratio (LA/SA) in Eucalyptus, as observed for several species by Andrade et al.
(1998), then assuming that sapwood area does not vary much, the loss in leaf area in
this species would result in higher Gt • The weak relationship found between sap flow
and ASD in the peak of the drought could be a consequence of both reduced leaf area
and stomatal responses to humidity. Bucci et al. (in press) observed that species with
larger decreases in LA/SA from the wet to the dry season in the Brazilian Cerrado
tended to exhibit smaller declines in stomatal conductance during the dry season.
Leaf-specific hydraulic conductivity in these species seems to be particularly
sensitive to fluctuations in leaf area (Bucci et aI., in press). Morris et ai. (1998) found
no relationship between stomatal conductance and vapor pressure deficit in
Eucalyptus grandis and E. camaldulensis. However, strong stomatal control was
found in E. globulus in a plantation in Portugal (David et ai. 1997). Hatton et ai.
(1998) provided evidence that different Eucalyptus species balance stomatal
conductance and LAI in order to maintain similar leaf efficiencies when growing in a
similar environment.
In Fraxinus, recovery of LAI and sap flow was relatively rapid shortly after
the end of the drought. This suggests that this species is well adapted to dry periods
and, like Eucalyptus, it controls transpiration by losing leaves, and, to a lesser extent,
by closing its stomata. However, unlike Eucalyptus, Fraxinus trees may have access
to soil moisture at greater depths and thus be able to restore leaf area faster. Even
though Fraxinus might have access to deeper water sources than the other two
47

species, as shown by the hydrogen isotope analyses, on average, SFD in Fraxinus was
not higher than in Eucalyptus or Casuarina. These results contrast with those of
Jackson et al. (1999), who found that plants with access to deeper, more dependable,
water sources tended to have higher rates of water use in the Brazilian Cerrado.
However, similar to this study, they found that deciduous species tended to tap deeper
water from the soil profile than evergreen species.
The response of Casuarina to the drought was unexpected. Even though
VWC and SFD were low, LAI increased relatively quickly in the Casuarina stand
after the end of the drought. There is a chance that the long-term monitoring of sap
flow in Casuarina could have resulted in a wound around the probe, damaging the
xylem. However, sap flow probes installed in January 2002, after the end of the
drought, measured low sap flow, consistent with the probes inserted earlier. It is also
possible that tree sap flow was drastically reduced during the drought through the
formation of embolisms in the xylem vessels. The combination of wound, embolism,
and the small number of probes used likely underestimated tree transpiration in
Casuarina. After the drought, soil moisture was much lower in the Casuarina stand
than in the other two stands. This may be an indication that the soil under the
Casuarina canopy is hydrophobic and/or that surface runoff occurs during a large
percentage of the rainfall events, as was shown to happen in stands dominated by
Eucalyptus robusta and Acacia confusa in Honouliuli, and in an area dominated by
the grass Tricachne insularis bordering the preserve (Nagel 2003). In support of this
hypothesis, high runoff was estimated in the Casuarina stand using a water balance
model (Chapter 4). Another possibility is that interception of throughfall by the litter
48

layer is significant, but ET estimates for this stand (Chapter 4) were very low,
suggesting that runoff is a stronger factor influencing soil moisture than ET. Poor
water penetration in soils under Casuarina could explain the preferential use by this
species of shallow water for transpiration as indicated by the isotope and VWC data.
The advantages of detecting the vertical patterns of water uptake using the
natural abundance of isotopes in xylem and soil water during a dry period are that in
this extreme situation (1) it is more likely to show a difference in oD values between
surface and deeper layers of the soil, and (2) plants are likely to be taking water from
the deepest moist layers of soil that their roots reach. During a long dry period,
preferential evaporation oflighter hydrogen causes an enrichment of deuterium at the
soil surface (Barnes and Allison 1984, Jackson et al. 1995), resulting in a steep
gradient between shallower and deeper soil layers such as the isotopic profiles
obtained for the Eucalyptus and Casuarina stands. In contrast, the profile of oD in
the soil of the Fraxinus stand did not follow this pattern. The lack of a steep isotopic
gradient in the soil of the Fraxinus stand may be explained by low evaporation at the
soil surface due to the dense understory and high LAI, or by a possible redistribution
of water between shallow and deep soil layers by the plants. The redistribution of
water among soil layers with different water potentials (Caldwell and Richards 1989,
Burgess et al. 2001) may create a mixing of the isotopic signature of the water in the
soil (Burgess et al. 2000).
Based on the natural abundance of hydrogen isotopes in the xylem and soil
water, depth of water uptake in the Eucalyptus and Casuarina stands was estimated as
between 0 and 40 cm, whereas in the Fraxinus stand it was estimated as deeper than
49

75 cm. Actually, VWC was lowest at a depth of 30-45 cm in the Eucalyptus stand
both in the wet and in the dry seasons (Fig. 2.3), and the comparison with moisture in
different soil depths did not yield very clear information, with one tree probably
drawing water from 0-30 cm and the others possibly from soil deeper than 90 cm
(Table 2.7). As the sapwood in Eucalyptus tends to be narrow, it is possible that the
samples taken for the isotope analyses included part of the heartwood. If heartwood
oD values were similar to sapwood values (as found by Thombum et al. 1993), the
mixture would not affect the estimate of depth of water uptake. However, if
heartwood oD values were less negative than sapwood values, as observed by White
et al. (1985) in a dry site in New York, USA, then the mixture of the two would cause
an underestimation of the depth of water uptake. So, it is possible that Eucalyptus
was drawing water from deeper layers of the soil (down to 60 cm) than the isotope
measurements indicated.
It is important to note that soil water potential was not measured in the sites
studied, thus soil water content may not be the same as soil water availability.
Because of the lack of these data, comparisons across sites and across depths within a
site should be done with caution. In the Fraxinus stand, VWC was apparently highest
in the deepest soil layer measured (60-90 cm). Trees that can tap water from that
layer have access to more moisture than is available at the surface during the dry
season (Fig. 2.3). By accessing a deeper soil profile, Fraxinus may have more access
to water during the dry season than the other two species. The deciduousness of
Fraxinus is probably not related to drought as this species usually loses its leaves
during wet months (November - January) in Hawaii (Chapter 3, Harrington and Ewel
50

1997). However, Fraxinus trees lost their leaves by the end of the long dry period
observed and started recovering LAI when rainfall resumed. Valentini et al. (1992)
found that deciduous species in Mediterranean climate tended to access deeper water
and be less water-use efficient than evergreen species. In contrast, Jackson et al.
(1995) found that deciduous species had shallower roots than evergreen species in a
lowland tropical forest of seasonal rainfall regime, and that water use efficiency was
not correlated to root depth. Fraxinus was shown to draw water from deep soil but
did not exhibit higher water use than the other species in this study. Because the soil
in Honouliuli is generally shallow, it may be possible that Fraxinus trees were
drawing water from the regolith. This happens especially in forests lying over thin
soils (e.g., Rose et al. 2003). It is likely that the soil moisture probes penetrated into
the regolith during installation, as the basaltic substrate consists of very porous, easily
penetrated rocks.
The isotope data indicated that Casuarina trees could be drawing water from
between 0 and 40 cm. However, the moisture gradient in the soil profile (Fig. 2.2)
and the lack of correlation between sap flow and VWC suggest that most trees might
be drawing water from very close to the surface. This agrees with field observations
that Casuarina trees form a thick root mat on top of the soil. In contrast with the
findings ofMeinzer et al. (1999), the variation found in the 8D values among
Casuarina trees was not due to plant size. The trees measured for xylem water 8D
ranged from 6 to 23 cm DBH, which are smaller than the trees studied by Meinzer et
al. (1999), but reflects the range of most of Casuarina trees in the stand (up to 36 cm
51

DBH). With the exception of one tree (DBH = 9.5 cm), the Casuarina trees
measured seem to consistently tap water from shallow soil.
2.6. Conclusions
The long drought resulted in a large reduction in soil moisture and LAI in all
three forest stands studied. These reductions caused a drastic decrease in
transpiration, approaching zero, in all three species. After rainfall resumed, Fraxinus
and Eucalyptus trees increased transpiration levels, but Casuarina did not. Sap flow
after the end of the drought, as a function of basal area, was not significantly different
among the species studied. However, the small diameter of Casuarina trees resulted
in very low transpiration rates of this species, and probably of the stand. Specific
stand characteristics contributed to the speed and magnitude of the decline and
recovery of transpiration. The Fraxinus stand had deep roots and high soil moisture,
and recovered LAI promptly after the end of the drought. The Eucalyptus stand had
relatively deep roots and high soil moisture, but had a very slow recovery of LAI in
relation to the other stands. The Casuarina stand, on the other hand, exhibited
shallow roots and very low soil moisture, but its LAI recovered relatively fast. High
radial sap flow variation was observed and might have resulted in a large error of the
transpiration estimates due to the small number of probes per tree and of trees
measured.
52

2.7. References
Andrade, J.L., F.C. Meinzer, G. Goldstein, N.M. Holbrook, J. Cavelier, P. Jackson,
and K. Silvera. 1998. Regulation of water flux through trunks, branches, and
leaves in trees of a lowland tropical forest. Oecologia. 115: 463-471.
Barnes, C.J. and G.B. Allison. 1984. The distribution of deuterium and 180 in dry
soils. 3. Theory for non-isothermal water movement. Journal ofHydrology 74:
119-135.
Bucci, S.1., G. Goldstein, F.C. Meinzer, A. Franco, P. Campanello, and F. Scholz. In
press. Mechanisms contributing to seasonal homeostasis of minimum leaf water
potential and predawn disequilibrium between soil and plant water potential in
Neotropical savanna trees. Trees.
Burgess, S.S.O., M.A. Adams, N.C. Turner, and B. Ward. 2000. Characterisation of
hydrogen isotope profiles in an agroforestry system: implications for tracing water
sources of trees. Agricultural Water Management 45(3):229-241.
Burgess, S.S.O., Adams M.A., Turner N.C., White, D.A., and Ong, C.K. 2001. Tree
roots: conduits for deep recharge of soil. Oecologia 126, 158-165.
Calder, LR. 1998. Water use by forests, limits and controls. Tree Physiology 18: 625
631.
Caldwell, M.M., and Richards, IH. 1989. Hydraulic lift: water efflux from upper
roots improves effectiveness of water uptake by deep roots. Oecologia 79: 1-5.
Clearwater, M.J., F.C. Meinzer, J.L. Andrade, G. Goldstein, and N. M. Holbrook.
1999. Potential errors in measurement of non-uniform sap flow using heat
dissipation probes. Tree Physiology 19(10): 681.
David, T.S., M.L Ferreira, 1.S. David, and 1.S. Pereira. 1997. Transpiration from a
mature Eucalyptus globules plantation in Portugal during a spring-summer period
of progressively higher water deficit. Oecologia 110: 153-159.
Ford, C.R., M.A. McGuire, R.J. Mitchell, and R.O. Teskey. 2004. Assessing variation
in the radial profile of sap flux density in Pinus species and its effect on daily
water use. Tree Physiology 24: 241-249.
53

Galindo-Jaimes, L., M. Gonzalez-Espinosa, P. Quintana-Ascencio, and L. Garcia
Barrios. 2002. Tree composition and structure in disturbed stands with varying
dominance by Pinus spp. in the highlands ofChiapas, Mexico. Plant Ecology 162:
259-272.
Giambelluca, T.W., M.A. Nullet, and T.A. Schroeder. 1986. Rainfall Atlas of Hawaii.
Report R76, Department of Land and Natural Resources, Honolulu, 267 pp.
Granier, A. 1985. Dne nouvell methode pour la mesure du flus de seve brute dans Ie
tronc des arbres. Annales des Sciences Forestieres 42: 193-200.
Granier, A. 1987. Evaluation of transpiration in a Douglas-fir stand by means of sap
flow measurements. Tree Physiology 3: 309-320.
Harrington, R.A., and JJ. Ewel. 1997. Invasibility of tree plantations by native and
non-indigenous plant species in Hawaii. Forest Ecology and Management 99:
153-162.
Hatton, TJ., SJ. Moore, and P. H. Reece. 1995. Estimating stand transpiration in a
Eucalyptus polpunea woodland with the heat pulse method: measurement errors
and sampling strategies. Tree Physiology 15: 219-227.
Hatton, T., P. Reece, P. Taylor, and K. McEwan. 1998. Does leaf water efficiency
vary among eucalypts in water-limited environments? Tree Physiology 18: 529
536.
Hunt, M.A. and C.L. Beadle. 1998. Whole-tree transpiration and water-use
partitioning between Eucalyptus nitens and Acacia dealbata weeds in a short
rotation plantation in northeastern Tasmania. Tree Physiology 18: 557-563.
Jackson, P.C., J. Cavelier, G. Goldstein, F.C. Meinzer, and N.M. Holbrook. 1995.
Partitioning of water resources among plants of a lowland tropical forest.
Oecologia 101: 197-203.
Jackson, P.C., F.C. Meinzer, M. Bustamante, G. Goldstein, A. Franco, P.W. Rundel,
L. Caldas, E. Igler, and F. Causin. 1999. Partitioning of soil water among tree
species in a Brazilian Cerrado ecosystem. Tree Physiology 19: 717-724.
54

James, S. A., M. J. Clearwater, F.C. Meinzer, and G. Goldstein. 2002. Heat
dissipation sensors of variable length for the measurement of sap flow in tree with
deep sapwood. Tree Physiology 22: 277-283.
Lopez-Serrano, F. R., T. Landete-Castillejos, J. Martinez-Millan, and A. del Cerro
Barja. 2000. LAI estimation of natural pine forest using a non-standard sampling
technique. Agricultural and Forest Meteorology 101: 95-111.
Meinzer, F. c., J. H. Fownes, and R. A. Harrington. 1996. Growth indices and
stomatal control of transpiration in Acacia koa stands planted at different
densities. Tree Physiology 16: 607-615.
Meinzer, F.C., J.L. Andrade, G. Goldstein, N.M. Holbrook, J. Cavelier, and S.J.
Wright. 1999. Partitioning of soil water among canopy trees in a seasonally dry
tropical forest. Oecologia 121: 293-301.
Meinzer, F.C., G. Goldstein, and J.L. Andrade. 2001. Regulation of water flux
through tropical forest canopy trees: Do universal rules apply? Tree Physiology
21: 19-26.
Morris, J., L. Mann, and J. Collopy. 1998. Transpiration and canopy conductance in a
eucalypt plantation using shallow saline groundwater. Tree Physiology 18: 547
555.
Nadezhdina, N., J. Cermak, and R. Ceulemans. 2002. Radial patterns of sap flow in
woody stems of dominant and understory species: scaling errors associated with
positioning of sensors. Tree Physiology 22: 907-918.
Nagel, J. 2003. The influence of non-native, monotypic forest plantations on soil
hydrologic properties within the Honouliuli Preserve, Oahu, Hawaii. Master's
thesis, University of Hawaii, USA.
Oren, R., N. Phillips, B. E. Ewers, D. E. Pataki, and J. P. Megonigal. 1999. Sap flux
scaled transpiration responses to light, vapor pressure deficit, and leaf area
reduction in a flooded Taxodium distichum forest. Tree Physiology 19(6): 337
347.
55

Rose, K. L., R C. Graham, and D. R Parker. 2003. Water source utilization by Pinus
jeffreyi and Arctostaphylos patula on thin soils over bedrock. Oecologia 134: 46
54.
Thombum, PJ., G.R. Walker, and J.P. BruneI. 1993. Extraction of water from
Eucalyptus trees for analysis of deuterium and oxygen-I 8: laboratory and field
techniques. Plant, Cell and Environment 16: 269-277.
Topp, G.C., J.L. Davis, and A.P. Annan. 1980. Electromagnetic determination of soil
water content: measurement in coaxial transmission lines. Water Resources
Research 16(3): 574-582.
Topp, G. C., and J. L. Davis. 1985. Measurement of soil water content using Time
Domain Reflectometry (TDR): A field evaluation. Soil Science Society of
America Journal 49: 19-24.
Valentini, R, G.E. Scarascia Mugnozza, and J.R Ehleringer. 1992. Hydrogen and
carbon isotope ratios of selected species of a Mediterranean macchia ecosystem.
Functional Ecology 6: 627-631.
White, J.W.c., E.R Cook, J.R Lawrence and W.S. Broecker. 1985. The D/H ratios
of sap in trees: implications for water sources and tree ring D/H ratios.
Geochimica et Cosmochimica Acta 49: 237-246.
Wolf, J. 1998. Species composition and structure of the woody vegetation of the
Middle Casamance region (Senegal). Forest Ecology and Management 111: 249
264.
56

Table 2.1 - Characteristics of the stands studied at the southern section of the
Honouliuli Preserve, Oahu, Hawaii, as of 1998.
Dominant species
Eucalyptus robusta
Code"
3091
Elevation Area
(m) (ha)
540 0.80
Basal areab
(m2 ha-I)
Tree densityb
(trees ha-I)
Volunteer treesb,c
(trees ha- I)
363
Casuarina glauca
Fraxinus uhdei
540 25.7 3,238 III........................................................... . ~ . .
3095 460 0.52 36.0 1,044 560
corresponds to the identification of the stand given by the State of Hawaii at the time of
planting. The C. glauca stand was not identified through the plantation maps.
b Basal area and tree density were estimated based on trees with diameter at 1.3 m (DBH) z 5 cm (all
species combined).
C Volunteer trees are the trees that do not belong to the same species as the original planted trees.
d Data from Garrison (2003).
Table 2.2 - Number of water samples collected from trees and from each of three soil
pits (SI, S2, S3) in stands dominated by Casuarina glauca, Eucalyptus robusta or
Fraxinus uhdei.
Soil depth (cm) SI 82 S3
5-20 4 3 4
C. glauca stand 21-40 2 3 2
14 trees 55-81 2 2 1
100-125 3
5-10 2 2 2
E. robusta stand 15-20 2 1 2
11 trees 21-40 2 3 2
45-90 1 5 1
5-10 2 2 2F. uhdei stand
15-30 2 3 25 trees
40-75 4
57
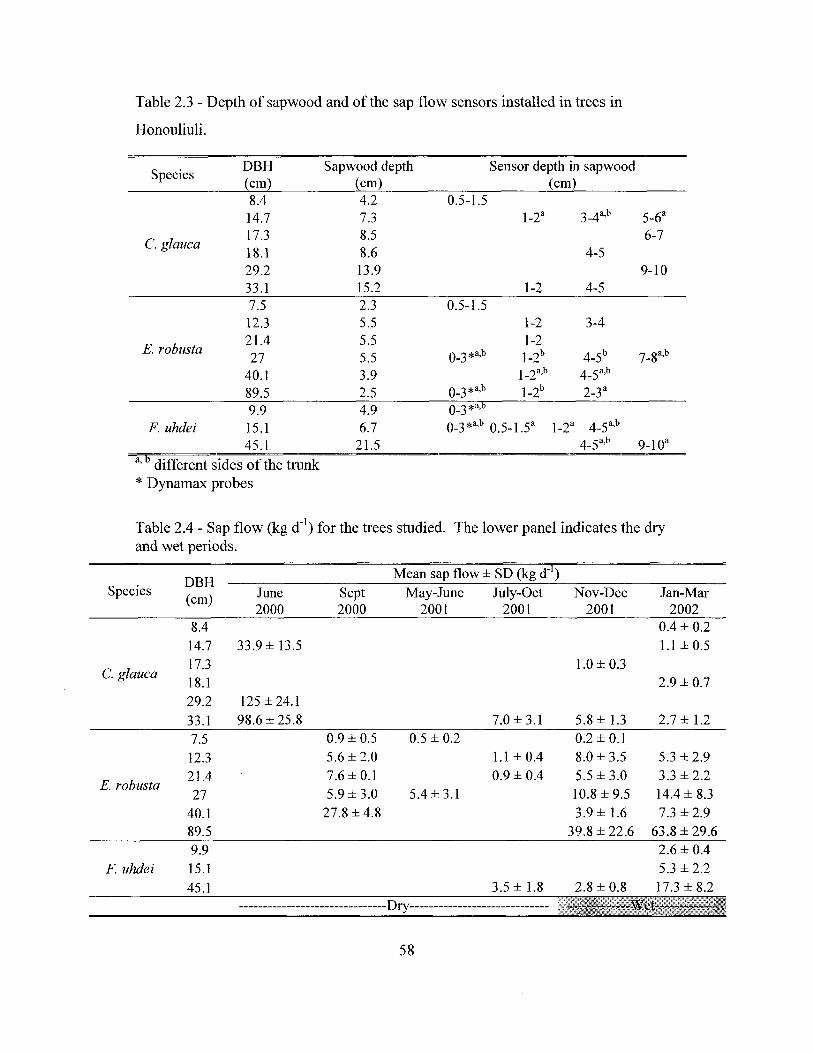
Table 2.3 - Depth of sapwood and of the sap flow sensors installed in trees in
Honouliuli.
SpeciesOBH Sapwood depth Sensor depth in sapwood(em) (em) (em)8.4 4.2 0.5-1.514.7 7.3 1_2a 3_4a,b 5_6a
C. glauca17.3 8.5 6-718.1 8.6 4-529.2 13.9 9-1033.1 15.2 1-2 4-57.5 2.3 0.5-1.512.3 5.5 1-2 3-4
E. robusta21.4 5.5 1-227 5.5 0_3*a,b 1_2b 4_5b 7_8a,b
40.1 3.9 1_2a,b 4_5a,b
89.5 2.5 0_3*a,b 1_2b 2_3a
9.9 4.9 0_3*a,b
F. uhdei 15.1 6.7 0_3*a,b 0.5-1.5a 1_2a 4_5a,b
45.1 21.5 4_5a,b 9_10a
a, b different sides of the trunk* Dynamax probes
Table 2.4 - Sap flow (kg d-1) for the trees studied. The lower panel indicates the dry
and wet periods.
Species
C. glauca
E. robusta
F uhdei
OBH(em)
8.414.717.318.129.2
33.17.512.321.427
40.189.59.915.1
45.1
June2000
33.9 ± 13.5
125±24.1
98.6 ± 25.8
Sept2000
0.9 ± 0.55.6± 2.07.6 ± 0.15.9± 3.0
27.8 ± 4.8
Mean sap flow ± SO (kg d- I)
May-June July-Oct2001 2001
7.0 ± 3.1
0.5 ± 0.21.1 ± 0.40.9 ± 0.4
5.4 ± 3.1
3.5 ± 1.8
Nov-Dec2001
1.0 ± 0.3
5.8 ± 1.30.2 ± 0.18.0 ± 3.5
5.5 ± 3.010.8±9.5
3.9 ± 1.639.8 ± 22.6
2.8 ± 0.8
Jan-Mar2002
0.4 ± 0.2
1.1±0.5
2.9± 0.7
2.7 ± 1.2
5.3 ± 2.93.3 ± 2.214.4 ± 8.3
7.3 ± 2.963.8 ± 29.6
2.6 ± 0.45.3 ± 2.2
17.3 ± 8.2
-------------------------------Ory-----------------------------
58
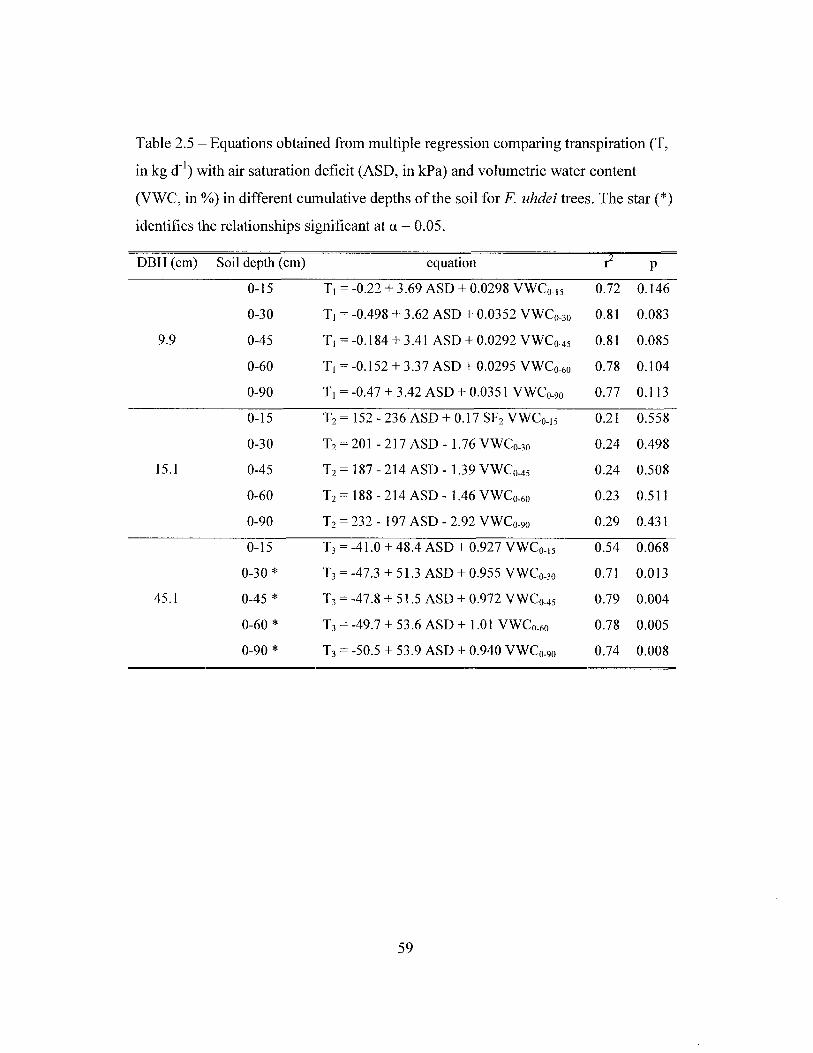
Table 2.5 - Equations obtained from multiple regression comparing transpiration (T,
in kg d-1) with air saturation deficit (ASD, in kPa) and volumetric water content
(VWC, in %) in different cumulative depths of the soil for F. uhdei trees. The star (*)
identifies the relationships significant at a = 0.05.
DBH (em) Soil depth (em) equation r2 p
0-15 TI = -0.22 + 3.69 ASD + 0.0298 VWCO_15 0.72 0.146
0-30 T I = -0.498 + 3.62 ASD + 0.0352 VWCO_30 0.81 0.083
9.9 0-45 TI = -0.184 + 3.41 ASD + 0.0292 VWCO-45 0.81 0.085
0-60 TI = -0.152 + 3.37 ASD + 0.0295 VWCO_60 0.78 0.104
0-90 TI = -0.47 + 3.42 ASD + 0.0351 VWCO-90 0.77 0.113
0-15 T2 = 152 - 236 ASD + 0.17 SF2 VWCO_15 0.21 0.558
0-30 T2 = 201 - 217 ASD - 1.76 VWCO-30 0.24 0.498
15.1 0-45 T2 = 187 - 214 ASD - 1.39 VWCO_45 0.24 0.508
0-60 T2 = 188 - 214 ASD - 1.46 VWCO_60 0.23 0.511
0-90 T2 = 232 - 197 ASD - 2.92 VWCO_90 0.29 0.431
0-15 T3 = -41.0 + 48.4 ASD + 0.927 VWCO_15 0.54 0.068
0-30 * T3 = -47.3 + 51.3 ASD + 0.955 VWCO_30 0.71 0.013
45.1 0-45 * T3 = -47.8 + 51.5 ASD + 0.972 VWCO_45 0.79 0.004
0-60 * T3 = -49.7 + 53.6 ASD + 1.01 VWCO_60 0.78 0.005
0-90 * T3 = -50.5 + 53.9 ASD + 0.940 VWCO_90 0.74 0.008
59
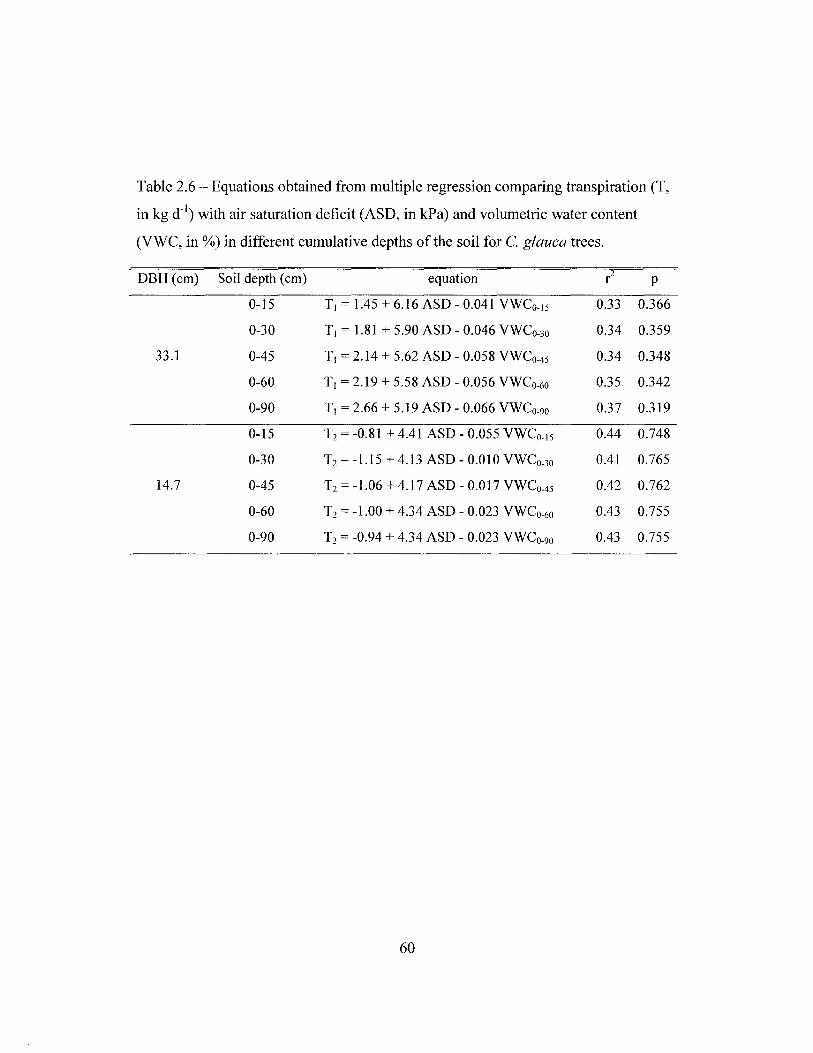
Table 2.6 - Equations obtained from multiple regression comparing transpiration (T,
in kg d- l) with air saturation deficit (ASD, in kPa) and volumetric water content
(VWC, in %) in different cumulative depths ofthe soil for C. glauca trees.
DBH(em) Soil depth (em) equation [2 p
0-15 T1 = 1.45 + 6.16 ASD - 0.041 VWCO_J5 0.33 0.366
0-30 TJ = 1.81 + 5.90 ASD - 0.046 VWCO-30 0.34 0.359
33.1 0-45 T1 = 2.14 + 5.62 ASD - 0.058 VWCO-45 0.34 0.348
0-60 T1 = 2.19 + 5.58 ASD - 0.056 VWCO-60 0.35 0.342
0-90 T1 = 2.66 + 5.19 ASD - 0.066 VWCO_90 0.37 0.319
0-15 T2 = -0.81 + 4.41 ASD - 0.055 VWCO_15 0.44 0.748
0-30 T2 = -l.l5 + 4.13 ASD - 0.010 VWCO_30 0.41 0.765
14.7 0-45 T2 = -1.06 + 4.17 ASD - 0.017 VWCO_45 0.42 0.762
0-60 T2 = -1.00 + 4.34 ASD - 0.023 VWCO_60 0.43 0.755
0-90 T2 = -0.94 + 4.34 ASD - 0.023 VWCO_90 0.43 0.755
60

Table 2.7 - Equations obtained from multiple regression comparing transpiration (T,
in kg dol) with air saturation deficit (ASD, in kPa) and volumetric water content
(VWC, in %) in different cumulative depths of the soil for Eucalyptus trees. The star
(*) identifies the relationships significant at a = 0.05.
DBH(cm) Soil depth (em) equation r2 p
0-15 T2 = 29.9 - 26.5 ASD - 0.347 VWCO-15 0.42 0.253
0-30 T2 = 29.9 - 25.8 ASD - 0.350 VWCO-30 0.3 0.409
12.3 0-45 T2 = 31.9 - 28.6 ASD - 0.395 VWCO-45 0.28 0.441
0-60 T2 = 30.2 - 26.6 ASD - 0.370 VWCO_60 0.22 0.530
0-90 T2 = 29.9 - 26.4 ASD - 0.362 VWCO-90 0.2 0.566
0-15 * T3 = 12.0 - 3.25 ASD - 0.253 VWCO_15 0.82 0.014
0-30 * T3 = 11.5 - 2.2 ASD - 0.249 VWCO-30 0.71 0.04421.4
0-45 T3 = 11.5 - 2.3 ASD - 0.264 VWCO-45 0.69 0.055
0-60 T3 = 10.5 - 1.1 ASD - 0.250 VWCO-60 0.65 0.073
0-90 T3 = 10.4 - 1.0 ASD - 0.246 VWCO-90 0.63 0.083
0-15 T4 = 9.8 + 3.6 ASD - 0.027 VWCO_15 0 0.987
0-30 T4 = 2.2 + 13.0 ASD + 0.073 VWCO-30 0 0.97827
0-45 T4 = -7.5 + 25.2 ASD + 0.211 VWCO-45 0.02 0.916
0-60 T4 = -14.5 + 34.0 ASD + 0.308 VWCO-60 0.05 0.839
0-90 T4 = -16.7 + 36.8 ASD + 0.335 VWCO_90 0.06 0.818
0-15 Ts = 10.7 - 13.3 ASD + 0.085 VWCO_15 0.42 0.255
0-30 Ts = 5.3 - 6.7 ASD + 0.155 VWCO-30 0.51 0.16440.1
0-45 Ts = 3.6 - 4.6 ASD + 0.186 VWCO_45 0.54 0.140
0-60 Ts = 2.4 - 3.0 ASD + 0.204 VWCO_60 0.58 0.117
0-90 T5 = 1.3 - 1.5 ASD + 0.216 VWCO-90 0.6 0.103
0-15 T6 = 134 - 123 ASD - 0.68 VWCO_1S 0.07 0.837
0-30 T6 = 78 - 52 ASD + 0.03 VWCO_30 0.03 0.935
89.5 0-45 T6 = 59 - 29 ASD + 0.28 VWCO_45 0.03 0.924
0-60 T6 = 40 - 4 ASD + 0.55 VWCO_60 0.04 0.893
0-90 T6 = 27 + 12 ASD + 0.71 VWCO_90 0.06 0.867
61

20012000
- .. - near C. glauca,-----r--------.,.---1 near F. uhdei and E. robusta !----r----;180
160 1999
140
-120E5100
~ 80com
60....
40
20
0
A 0 0 F A J A 0 0 F A J A 0 0 F A J A 0 0 F
Figure 2.1 - Monthly rainfall from August 1998 to March 2002 near the stands
studied.
62

Casuarina glauca
·15
E-3G-00
~
.c 45-a.Gl ~o0
-75
-905956
Eucalyptus robusta 53504744
413835
a. 32Gl0 29
26232017
Fraxinus uhdei 141185
30-May-01 7-Sep-01 16-Dec-01 26-Mar-01
Figure 2.2 - Soil moisture of the three stands studied between May 19,2001 and April
7,2002. The volumetric moisture content ranged from 5% (white) to 60% (black).
63

0
F. uhdei10
20
30
40
50
60
70
0
E. robusta10
,..... 20E~ 30.c:......a. 40 -0-- dry season(])
-- wet season"050
'0(/) 60
70
0
C. glauca10
20
30
40
50
60
70
800 10 20 30 40 50 60
VWC (%)
Figure 2.3 - Soil volumetric water content (VWC, in %) in the dry season (Mean
VWC of August to October 2001) and in the wet season (mean VWC of January and
February 2002) for stands dominated by Fraxinus uhdei (top), Eucalyptus robusta
(middle) and Casuarina glauca (bottom) in the Honouliuli Preserve. Bars represent
standard errors. Error bars are smaller than the symbols in the dry season.
64

0
- -20E(.) -40.......-
..c...... -60a.(J)
"'0 -80
-100
& && && & ~& && & ~AU.'"
I • :I • If---e--I
~f---e--j
~ I-e-I
•~ ~
• soil water • soil water • soil water& F. uhdei & E. robusta & C. glauca
•-120-70 -60 -50 -40 -30 -20 -10 o -60 -50 -40 -30 -20 -10
80 (%0)
o -60 -50 -40 -30 -20 -1 0 o
Figure 2.4 - Patterns of water uptake by roots of Fraxinus uhdei (left), Eucalyptus robusta (center) and Casuarina glauca (right) as
indicated by the hydrogen isotope ratio (oD). The triangles above the line of the surface are the values found in trees (n = 5 to 14 per
stand). Bars represent standard errors of the mean of up to three soil profiles.
65

160
140
120
E 100.s]! 80
c 60.~
40
20
0
3
NE
N 2.s«...J
• near C. gJauca stand- --A- - near F. uhdei and E. robusta stands
/'
/
0 ->-- C. gJauca stand---{}- F. uhdei stand
40---.- E. robusta stand
;R 30~
0
~ 20
10
0
h, 10N
E..9
~ 5(f)
->-- C. gJauca---{}- F. uhdei---.- E. robusta
O-'------~-'---..-----==='---,---=~----'-~--"---~-~---'
01-Apr-01 01-Jun-01 01-Aug-01 01-0ct-01 01-Dec-01 01-Feb-02 01-Apr-02
Figure 2.5 - Rainfall, leaf area index (LAI), volumetric water content (VWC) ofthe
top 15 cm of the soil profile, and sap flux density (SFD) of trees in stands dominated
by Casuarina glauca, Fraxinus uhdei or Eucalyptus robusta in Honouliuli.
66

<> C. glaucao F. uhdei... E. robusta-- Meinzer et al. 2001
0.16
0.14
0.12
0.10.--..
N
E 0.08'-"'
<{til
0.06
0.04
0.02
0.00
0 20 40 60 80 100 120 140
DBH (em)
Figure 2.6 - Sapwood area (As) in trees of different DBH ofthe three species studied
in Honouliuli. The curve shows the relationship obtained by Meinzer et al. (2001) for
forest canopy tree species in Panama.
67

1.5 r.============::;-------~
me..~......;g 1.0Q)
"0Co~
~ 0.5~
ml/)
- January 15, 2002- March 22, 2002
-1-2em........ 3-4em
---5-6em
0.0
E. robusta -- 1 - 2 em (a)25 1- 2 em (b)
--- 4 - 5 em (b)
20
15
-~'l/) 10
'i"E 5-9:;: 00
'+= F. uhdei - 0.5-1.5em0- 25m .... 1-2eml/)
---4-5em20
15
10-~'l/)
5N
E-9 0
:;: 25C. glauca
0'+=0-m 20l/)
15
10
5
o 300 600 900 1200 1500 1800 2100 2400
time
Figure 2.7 - Diurnal patterns of air saturation deficit (ASD) and sap flow in different
depths of the sapwood for 15 January 2002 (Eucalyptus Tobusta, DBH = 40.1 em)
and 22 March 2002 (Fraxinus uhdei and Casuarina glauca, DBH = 15.1 and 14.7 em,
respectively). Letters a and b represent different sides of the trunk.
68
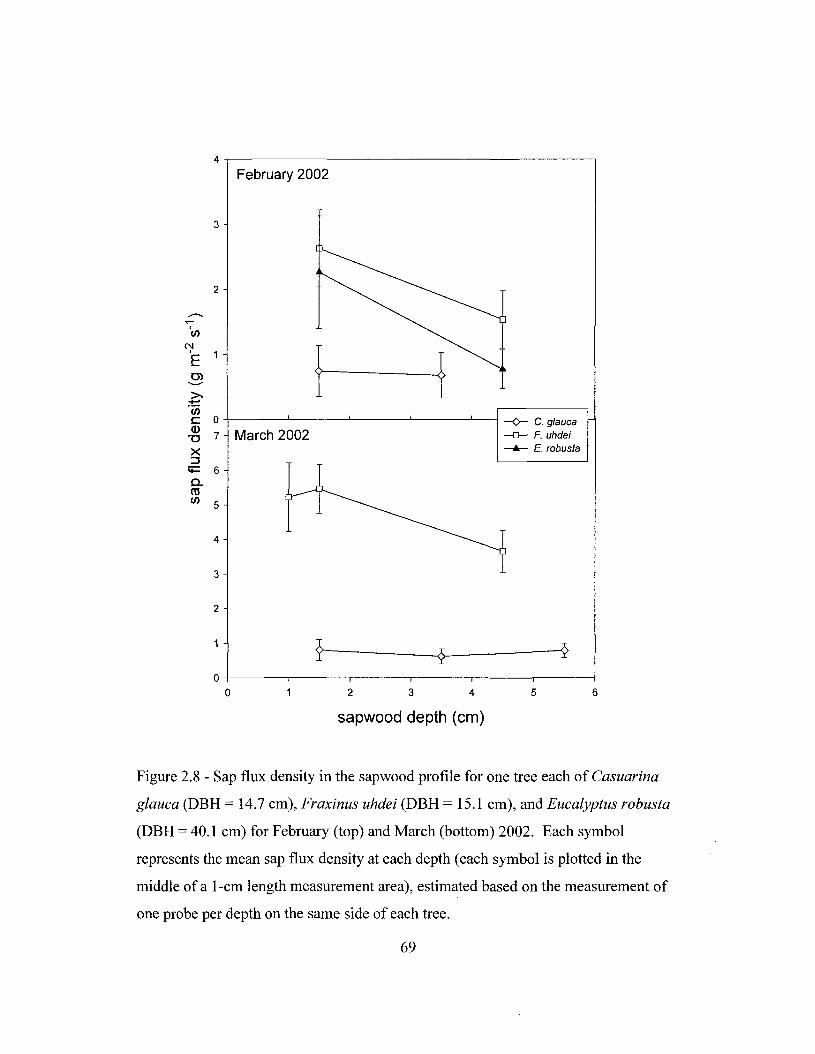
4,------------------------,
February 2002
3
5 6
--<>- C. glauca--0-- F. uhdei~ E. robusta
......------§
2
..-...-
I(/)
N
fI 1E0>---->-.......'00C 0a.>
7 March 2002"'0x::J
i:i= 60-m(/)
5
4
3
2
} -10
0 2 3 4
sapwood depth (em)
Figure 2.8 - Sap flux density in the sapwood profile for one tree each of Casuarina
glauca (DBH = 14.7 cm), Fraxinus uhdei (DBH = 15.1 cm), and Eucalyptus robusta
(DBH = 40.1 cm) for February (top) and March (bottom) 2002. Each symbol
represents the mean sap flux density at each depth (each symbol is plotted in the
middle ofa l-cm length measurement area), estimated based on the measurement of
one probe per depth on the same side of each tree.
69

30
0 C. glauca 1= 2.03 + 73.1x2
25 ... E. robusta =0.5 P < 0.016
0 F. uhdei
20...--
~0> 15~.......,3:0
ti= 100..co(/)
5
<> ~0
0.00 0.05 0.10 0.15
basal area (m2)
Figure 2.9 - Daily total sap flow plotted against basal area for Casuarina glauca,
Fraxinus uhdei, and Eucalyptus robusta for the period between January and March
2002. The large E. robusta tree (DBH = 89.5 cm) was much larger than the largest
tree plotted in this graph (DBH = 45.1 cm) and thus excluded from this analysis in
order not to bias the regression curve (done for all trees together).
70

16 180
June 00 R2 =0.75C. glauca
0 160I>. July-Sep 01 R2 =0.34 I>.
b 0 140 bOJ
12 OJ
6 1206
N 00 00 100 0
";l 0 N8 0 3:~ 0
0 80 00 I>. 0::
N 0 a.60 III
3: en0 4 I>.0:: 40a. I>. 0III I>.en 20
0 0F. uhdei
I July-Aug 01 R2 =0.65 II>.
12
8I>.
I>.
..--.. I>...... 4 I>.
I
"0 I>.
0> IYP~'-"
5 00 E. robusta
ii= 0 Sep 00 R2 =0.930- I>. I>. May 01 R2 =0.21<U(/) 12
0I>.
8 0/"Dol>.0
01>.1>. I>.4 0
I>. I>.
0 I>.
1.21.00.80.60.40.2
0+---,-----,------,------,------,---------10.0
ASD (kPa)
Figure 2.10 - Total daily sap flow as a function of mean daily air saturation deficit
(ASD) at the beginning (circles) and at the peak (triangles) of the drought for
representative trees of Casuarina glauca (DBH = 33.1 cm), Fraxinus uhdei (DBH =
45.1 cm), and Eucalyptus robusta (DBH = 27.0 cm).
71
3. Effects of Species Composition on the Rainfall Interception,
Stemflow and Throughfall of Mesic Forest Plantations of Hawai'i.
3.1. Abstract
Throughfall (TF) and stemflow (SF) were measured in three stands each of
four species (Eucalyptus robusta, Fraxinus uhdei, Casuarina glauca and Grevillea
robusta) for estimates of rainfall interception (E j) in the Honouliuli Preserve in
Hawaii. The objectives of this study were to quantify Ej, and to analyze the effect of
species composition on E j , TF, and SF in forest plantations. The data collected were
compared to variables describing forest structure to identify characteristics that might
be most useful in predicting changes in TF and SF, and, consequently, E j • Data on
rainfall, SF, TF, and leaf area index (LAI) were collected between August 1998 and
April 2002. Forest structure, characterized by tree density and basal area, was also
studied. Throughfall ranged between 70 and 91 %, SF between 0.6 and 4%, and Ej
between 4 and 29% of rainfall for the year of 1999. In general, TF and E j did not
differ among stands of different species composition. However, different TF patterns
were found between manual (7- to 14-day intervals) and automated (per event) data
collection. Stemflow was significantly higher in Fraxinus stands (mean of 3% of
rainfall) than in stands dominated by Grevillea (mean of 0.8% of rainfall). No single
forest characteristic seemed to regulate TF and SF variation. The characteristic that
most influenced TF and SF was tree density. With the exception of two Fraxinus
stands, the interaction between rainfall and tree density significantly influenced
stemflow variation across stands. Contrary to expectations, variation in LAI did not
72

result in direct responses of TF or SF across the forest stands. The results indicate
that SF is affected by forest composition and tree density. However, E j is not affected
by forest composition in the Honouliuli Preserve.
3.2. Introduction
The water cycle is a relatively well-studied ecosystem process in forests.
However, the underlying mechanisms that control water movement within
ecosystems are still understudied. Studies of rainfall interception (Ej), for example,
have moved from simple quantification to more process-based analyses (e.g., Rutter
et al. 1975), but later studies suggest that Ej models generated in temperate forests are
not always applicable to tropical forests (Shuttleworth 1988, Bruijnzeel 2000).
Variations in Ej - the component of the water cycle that, together with rainfall,
determines the amount of water reaching the soil - have been explained by differences
in forest structural characteristics such as basal area, cover, tree density (Rogerson
1967), and leaf area index (Zimmermann et al. 1999, van Dijk and Bruijnzeel 2001).
The higher the level of each of these characteristics, the higher the amount of water
intercepted by the canopy (Rogerson 1967), and consequently, the lower the amount
of water that reaches the ground.
Interception is calculated indirectly as rainfall minus the sum of throughfall
(rainfall under the canopy) and stemflow (water that flows down the stems).
Interception in continental areas has been reported to range between 11 and 39% of
rainfall in hardwood forests (Raich 1983, Pandit et al. 1991, Bruijnzeell997) and
from 7 to 28% in softwood plantations (Bruijnzeel 1997). Aboal et al. (1999) found
73

higher E j rates (30 to 41 % of rainfall) in a laurel forest on the Canary Islands.
Similarly, Ej in continental sites ranges from 10 to 34% of evapotranspiration (Jordan
and Heuveldop 1981; Leopoldo et al. 1982, 1995; Moreira et al. 1997), while
Hatkenscheid (2000) estimated that Ej contributes between 41 and 57% of the
evapotranspiration rates in forests in Jamaica, and Schellekens (2000) estimated
between 62 and 74% for forests in Puerto Rico. These observations have led to an
increased interest in expanding direct measurements of E j on tropical island
ecosystems (Schllekens et al. 1999, BruijnzeeI2000), but there is still very little
information on island forests with dry to mesic climate (Bruijnzeel 2000, Schllekens
et al. 2000).
The influence of species composition on Ej in forests has been assumed to be
minimal or non-significant (Helvey and Patrick 1965). However, more recent studies
indicate that throughfall and stemflow differ among species (e.g., Cape et al. 1991,
Sood et al. 1993, Crockford et al. 1996a, Bruiijnzeel1997, Holscher et al. 1998).
Canopy density and deciduousness (Cape et al. 1991), bark texture (Sood et al. 1993),
and leaf and branch slopes (van Elewijck 1989, Holscher et al. 1998) are species
characteristics that may influence throughfall and stemflow. Nonetheless, very few
studies (e.g., Cape et al. 1991) have compared E j among forests dominated by
different species in a replicated design.
In this chapter I quantify Ej in twelve tree plantations in Hawaii, analyze the
effect of species composition on E j , throughfall, and stemflow, and give evidence that
structural characteristics of the stands may not cause a direct response on throughfall
or stemflow in plantations of different species composition.
74

3.3. Methods
3.3.1. The study site
The Honouliuli Preserve (Fig. 1.1) is located on the eastern slope of the
southern Waianae Mountain Range on the island of Oahu, Hawaii. Mean annual
rainfall in this area ranges from 540 to 750 mm (Giambelluca et al. 1986). The native
forest was largely devastated by sandalwood extraction, fire, and grazing during the
19th century. During the first half of the 20th century, several non-native tree species
were planted in an effort to reduce erosion and to restore the watersheds to supply
water for agriculture (Asner et al. 1993). By 1960,4,200 ha of tree plantations
composed of stands of different species such as Eucalyptus spp., Casuarina spp.,
Fraxinus uhdei, Grevillea robusta, and Melaleuca quinquenervia covered nearly half
of the 9,120-hectare preserve (Nelson et al. 1968).
3.3.2. Species studied
I investigated the stemflow, throughfall, and interception in plantations
dominated by each of four species: Eucalyptus robusta, Casuarina glauca, Fraxinus
uhdei, and Grevillea robusta. The area planted with these species, plus other species
ofEucalyptus and Casuarina, account for 48% of the total area planted for
reforestation on Oahu before 1950. A description of these species plus of the
common volunteer species in these stands, Schinus terebinthifolius and Psidium
cattleianum, is in Section 1.7.2.
75

3.3.3. Field measurements
For the purpose of this research, the Honouliuli Preserve was subdivided into
three study sections, south, middle, and north, due to a North-South gradient in
rainfall. In each of these sections, one stand dominated by each of the planted species
was studied (Fig. 3.1). These stands were planted between 1927 and 1945. Data
were collected between August 1998 and April 2002. The stands dominated by
Grevillea were excluded from the study in September 1999 because several Grevillea
individuals in one of them showed symptoms of senescence. Table 1.1 summarizes
the characteristics of each stand.
Rainfall, stemflow, throughfall, and leaf area index (LAI) were measured in
each stand. Stemflow and throughfall were measured during 19 months in the
northern section (October 1998 to May 2000), 17 months in the middle section
(December 1998 to May 2000) and for almost three years in the southern section
(August 1998 to April 2000, and May 2001 to April 2002). Leaf area index was
measured in all stands for one year (June 1999 to July 2000) and in the three southern
stands for an additional ten months (June 2001 to March 2002).
Leaf area index (the ratio of leaf area per unit of ground area) was measured
with a LAI-2000 Plant Canopy Analyzer (LiCor, Lincoln, NE, USA) at 15 to 20
points along two or more transects every two months for one year in all stands, and
additionally every month for ten months in the stands of the southern section. The
points were 10m apart along transects set 15 m apart. The number of sample points
varied in each stand in order to get a standard error :s 5%. Measurements were taken
at approximately 50 cm from the ground (just above the height of the throughfall
76

collectors). Different methods to measure LAI were tested by Lopez-Serrano et al.
(2000), and the LAI-2000 was shown to give results similar to other methods.
Rainfall data were collected from three weather stations, one in each section,
and from two automated rainfall collectors near stands located further than 800 m
from a weather station (Fig. 3.1). The distance between the rainfall collectors and
each stemflow or throughfall collector within the forest canopies was approximately
between 100 and 500 m. Rainfall was measured with tipping bucket rain gauges
(Texas Electronics, Dallas, TX, USA) connected to dataloggers (21 X or CRlO,
Campbell Sci., Logan, UT, USA; or Hobo Event, Onset, MA, USA) recording data
each minute or whenever there was a tip. Events were arbitrarily separated by 3-hour
periods with no rain to allow for complete drying of the canopy.
Throughfall collectors consisted of a set of three troughs (each with projected
dimensions of 129.2 x 5.5 cm), which directed the water into a covered bucket. Each
set had a collection area of 0.2 m2 and stood 50 cm above the ground. Depending on
variation of preliminary data, three to nine collectors were placed randomly under the
canopy in each stand. The water collected in the buckets was measured every other
week for the first two years of the study (1998 - 2000) and additionally every week
for six months in 2001 in the stands on the southern section. For the 2001
measurements, approximately half of the collectors were automated with tipping
bucket gauges connected to dataloggers (Hobo Event, Onset, Pocasset, MA, USA),
collecting data for a total of eight months.
Stemflow was measured with spiral collars tightly fitted to the tree trunk that
channel water into a 4- to 30-liter collection bottle, or to a tipping bucket connected to
77

a datalogger (Hobo Event, Onset, Pocasset, MA, USA). Each collar was assembled
in the field by attaching one piece of Trimtex plastic archway L-bead to the tree trunk
with one nail at each extremity of the spiral and forming a canal by overlapping
another archway L-bead with the first one. The two L-beads were secured to each
other with metal twist ties. The archway L-bead is very flexible and can be adjusted
to make very good contact with the tree; caulking was also used to ensure complete
contact between the collar and the tree trunk. The canal was then covered with
aluminum tape (Shurtape #AF973, Hickory, NC, USA) to provide a smooth surface
for the water to flow down. These collectors were installed in four to eight trees in
each stand spanning the range of diameters found in a vegetation survey of trees ~ 5
cm DBH (diameter at 1.3 m height). The water collected in the bottles was measured
every two weeks in each stand for the first two years of the study and additionally
every week for six months. Sixteen stemflow collectors were automated for the last
eight months of the study in the stands of Eucalyptus, Casuarina and Fraxinus in the
southern section.
Interception was derived from measurements of rainfall, throughfall and
stemflow by subtracting the sum of throughfall and stemflow from rainfall for a given
period.
3.3.4. Statistical Analyses
Repeated measures ANOVA was used to assess differences in the throughfall
collected manually among stands within each section. As stands dominated by
Grevillea did not have data collected throughout the entire study period, the analyses
78

were divided in periods when all four species were measured and periods when data
were available for only three species. Automated data were analyzed using a one
way ANOVA, based on the average of the water collected in the buckets per stand for
each event. Missing automated data were replaced by estimates based on regression
curves relating existing data to rainfall for each bucket.
Regressions were done between rainfall and stemflow amount for trees in
different diameter classes. The regression per size classes permitted the scaling up of
the stemflow measured in each tree size class to the stand, and the conversion of
volume units to depth units for stemflow, based on the total area occupied by each
stand. All curves were forced through the origin.
A one-way ANOVA test was applied to the total throughfall, stemflow depth,
or interception of each stand in a one-year period for comparison among stands
dominated by different species.
Multiple regressions were used to identify the effect of stand basal area, tree
density, LAI, and rainfall (independent variables) on throughfall, stemflow, or
interception (dependent variables).
3.4. Results
3.4.1. Rainfall
In 1999, total rainfall was 690, 768, and 673 mm in the northern, middle, and
southern sections of the preserve, respectively. The distribution of the rainfall events,
both in terms of frequency and amount, was very similar among the three sections.
79

Events smaller than 0.6 mm constituted over 50% of all events within a year but
contributed less than 8% of the total volume of water, whereas the three largest events
alone contributed almost 30% ofthe total amount of rainfall (Fig. 3.2). A long
drought occurred in the southern section ofthe preserve between January 2000 and
November 2001, during which rainfall did not exceed 60 mm in any month (Fig.3.3).
3.4.2. Leafarea index
Fraxinus stands had higher LAI and larger seasonal changes than Eucalyptus or
Casuarina stands during the period between June 1999 and July 2000 (Fig. 3.4). Leaf
area index measurements were resumed in June 2001 for the stands on the southern
section of the preserve and continued until March 2002 (Fig. 3.5). In these stands,
pre-drought LAI values ranged from 2.4 to 3 for Casuarina, 3.1 to 4.8 for Fraxinus,
and 1.5 to 3.1 for Eucalyptus. Leaf area index reached its lowest values between
September and December 2001 (Fig. 3.5), the end of the long drought (Fig. 3.3).
Eucalyptus appears to have been affected the most by the drought, reaching LAI
values lower than 1, and having a slow recovery after rainfall increased, in November
2001. The LAI of the Fraxinus stands exhibited the fastest LAI increase after rainfall
restarted by increasing from 1 in October 2001 to 3.5 in March 2002 (Fig. 3.5).
3.4.3. Throughfall
Results for manually collected throughfall were compared using repeated
measures ANOVA to detect potential differences among stands dominated by
different species within each section of the preserve (Table 3.1). It was expected that
Fraxinus stands would have lower throughfall values due to higher LAI than the other
80

stands. However, the stand of Fraxinus had higher throughfall values than
Eucalyptus and Casuarina stands in the North section of the preserve and was not
significantly different in the other sections (Table 3.1). Throughfall was not different
between stands of Fraxinus and Grevillea in any instance.
The automated, or per-event, throughfall data were compared using one-way
ANOVA for the stands on the southern section (Table 3.2). Data from all buckets
were averaged per event in each stand. The stand dominated by Fraxinus exhibited
lower throughfall than the other stands for rainfall events :s 3 mm and for all events
analyzed together (Table 3.2). In these per-event analyses, Fraxinus had lower
throughfall than the other two stands in periods of high LAI and lower throughfall
than Eucalyptus in periods oflow LAI (Table 3.3). Throughfall was negatively
correlated with LAI within the stand dominated by Fraxinus, but not in the other
stands (Table 3.3). However, the relationship between LAI and throughfall was very
weak for the stands of the southern section, even for Fraxinus (Fig. 3.6).
Storage capacity (S) was calculated for each stand by plotting throughfall
collected in each bucket against rainfall for events 2: 2 mm, similar to the method
employed by Aboal et al. (1999). The estimated S was 0.7, 0.6, and 0 mm for stands
dominated by Eucalyptus, Fraxinus, and Casuarina, respectively. The S of the stand
dominated by Eucalyptus was significantly larger than the S of the stand dominated
by Casuarina (F = 5.69, P = 0.034).
81

3.4.4. Stemjlow
Stemflow was regressed against rainfall for each species, independent of the
stand where they were located, per class of diameter (5-10, 10-30, 30-50, and 50-80
cm DBH). The equations obtained from these regressions (Table 3.4) were applied to
all trees on the stand based on rainfall measured in the same period as throughfall.
Stemflow, as a function of rainfall, was higher for Fraxinus and Psidium cattleianum
(small tree present in the understory of Grevillea and Fraxinus plantations) trees than
for Eucalyptus, Casuarina, or Grevillea in any diameter class. Fraxinus stands had
higher stemflow than Grevillea stands in all sections (Fig. 3.7).
3.4.5. Interception
Interception derived from the throughfall and stemflow measurements ranged
from 4% of rainfall in the northern stand of Fraxinus to 32% in the southern stand of
Grevillea (Table 3.5). In 1999, throughfall ranged between 70 and 91% ofrainfall,
stemflow ranged between 0.7 and 3.9% of rainfall, and interception ranged between
32 and 197 mm, or 4 and 29% of rainfall (Table 3.6). No differences among stands
dominated by different species were detected in throughfall or interception. Stands
dominated by Fraxinus generated significantly more stemflow than stands dominated
by Grevillea (means of3.0 and 0.8% of rainfall, respectively, F = 4.39, p = 0.042).
No single variable, nor the interaction among them, explained throughfall
(Fig. 3.8) or interception in all stands. Trends can be observed within species, but no
conclusions can be drawn, as there are data for only three stands per species.
However, throughfall in Eucalyptus appears to be negatively correlated with tree
82

density and rainfall (Fig. 3.8a and 3.8d), and in Fraxinus positively correlated with
tree density (Fig. 3.9a).
Similarly, no single variable explained stemflow in all stands together (Fig.
3.9). When the Fraxinus stands in the middle and northern sections are excluded
from a multiple regression analysis, the interaction between rainfall and tree density
explains variations in stemflow across all other stands (stemflow = - 0.30 + 0.0006
density + 0.0012 rainfall, F = 10.34, P = 0.008).
3.5. Discussion
3.5.1. Through/all
Throughfall varied between 70 and 91 % of rainfall in the stands studied, in
the upper end of the range of results from other hardwood plantations in the tropics
and subtropics (57 to 90%; Bruijnzeel 1997). The values ofthroughfall for the
Eucalyptus robusta stands (76 to 86% of rainfall) were a little lower than those
reported for other Eucalyptus stands:s 12 years old (Lima 1976, Poore and Fries
1985, Bruijnzeel 1997), which ranged from 81 to 94% ofprecipitation.
Holscher et al. (1998) found that a 10-year old secondary forest dominated by
Phenakospermum guyanensis (an understory herb) had significantly lower throughfall
than a younger, more diverse secondary forest. Stemflow, on the other hand, was
substantial in both forests (38 and 23% of rainfall, respectively). In this study,
species composition did not account for among-stand differences in throughfall,
similar to the findings of Huber and Iroume (2001) for 29 research plots in Chile.
However, Fraxinus had significantly higher throughfall than the other stands in the
83

northern section of the preserve during manual data collection and lower throughfall
in the southern section during the automated measurements. These differences
between the manual and the automated data may be explained either by problems
involved in the manual collection or by the different scales of observation. Whereas
manual collections provide a reliable total amount of throughfall generated over
intervals, the mixing of events of different amounts and intensities in the same sample
collection may mask the relationship between throughfall and rainfall in each event.
Differences among stands are more obvious during small rainfall events, which
represent most of the events in a year. However, the large amount of water falling
during larger events may hide these differences. Annual variation in rainfall
distribution could also cause a change in the throughfall responses of stands
dominated by different species. Cape et al. (1991) found differences in throughfall
among stands ofPinus sylvestris and stands ofLarix decidua, Quercus petrea or
Alnus glutinosa in Britain, but some of these differences did not persist in multiple
years.
The differences between the manual and the automated data may have been
caused by the reduction in LAI following the drought that occurred in the southern
section of the Honouliuli Preserve. After the drought, when the stand dominated by
Eucalyptus had the lowest LAI values, throughfall was higher than in the other
stands. However, LAI did not explain throughfall variation within this stand (Table
3.3). The expected lower throughfall in Fraxinus stands, due to their higher LAI, was
only found in the data collected on an event basis. This might have also been caused
by a proportional increase in the number of small events during the drought, when
84

Fraxinus shows significantly lower throughfall than Eucalyptus or Casuarina (Table
3.2). Leaf area index was also shown to be an important factor in the throughfall
generated within stands of Fraxinus (Table 3.3).
The storage capacity (S) values obtained in the Eucalyptus and Fraxinus
stands are within the range of S values for other tree plantations (0.2 - 2 mm, Lima
1993). The differences found in the S values between the Eucalyptus and Casuarina
stands did not result in significant differences in throughfall. The low S found in
Casuarina may be explained by the shape and angle of its leaves. This species has
needle-like twigs, vertically oriented, which do not offer a large horizontal surface
area for water storage.
3.5.2. Stemjlow
With the exception of two stands ofFraxinus, my stemflow data were similar to
those found for lowland tropical forests where stemflow is commonly under 2% of
rainfall (Levia, Jr. and Frost 2003). However, stemflow in the Eucalyptus robusta
stands of Honouliuli (0.6 to 2.3% of rainfall) was lower than the values found for
other Eucalyptus plantations (4.2 to 8% ofrainfall, Lima 1976, Bruijnzeel 1997) or
for natural Eucalyptus forests (3.4 to 5.9% of rainfall, Crockford et al. 1996b). The
bark of Eucalyptus robusta is thicker and more absorbent than that of most other
species of Eucalyptus, probably contributing to the low stemflow found in this study.
Even though stemflow variability is usually higher than throughfall variability
(Zamoch et al. 2002), I was able to detect differences in stemflow among stands
dominated by different species more clearly than differences in throughfall. Stands
85

dominated by Fraxinus generated at least twice as much stemflow as stands
dominated by Grevillea. This could be explained not only by lower stemflow
generated by trees of similar diameter but also by the very low tree density in the
Grevillea stands compared to the Fraxinus stands. Huber and Iroume (2001) found
significant differences in stemflow between conifer and broadleaved forests in Chile,
however, they found lower stemflow in stands oflower tree density. In contrast with
their findings, neither throughfall nor stemflow in this study were positively
correlated with rainfall across stands, with the exception of stemflow in stands
dominated by Eucalyptus.
Even though stemflow does not seem to contribute much to the hydrological
cycle in most forests (Lima 1976, Crockford et al. 1996b, Bruijnzeel 1997, Levia, Jr.
and Frost 2003), in dry forests such as the ones in Honouliuli, this 1 to 5% of rainfall
water added to the system in a non-random fashion may allow species to compete
differently for water. Since the concentration of nutrients is higher in stemflow water
than in throughfall (Crockford et al. 1996a, 1996b), trees that produce higher
stemflow may be at an advantage both in terms of water and of nutrients. Stemflow
not only causes a spatial redistribution of water to the soil but also a heterogeneous
distribution of nutrients and pH, which may affect understory species composition
and distribution (Falkengren-Grerup 1989, Andersson 1990). Forest species
composition seems to affect the level at which this heterogeneity occurs due to the
differences in stemflow volume produced by different species (Mahendrappa 1990).
The high stemflow generated by P. cattleianum in Honouliuli, for example, may
86

cause a change in the hydrological and nutrient cycles of forests invaded by this
specIes.
3.5.3. Interception
The 1999 values for interception found in this study represent less than 10%
of the PE estimated by Giambelluca (1983) for the same area. With the exception of
the extremely low interception value found for the Fraxinus stand in the northern
section of the preserve, the interception rates found in this study are comparable to
the rates found in other plantations in the tropics and subtropics (Bruijnzeel 1997).
The interception rates between 13 and 22% in 1999 obtained for the Eucalyptus
stands are within the rates found for mature natural forests dominated by other
Eucalyptus species (10-24%, Lima 1993). There were no significant differences in
interception among stands dominated by different species. In this study, forest
diversity (based on the density of volunteer trees, Table 1.1) did not seem to affect
interception, in contrast with observations of Zhou et al. (2002) and Dunisch et al.
(2003). The low interception found for Fraxinus in the northern section of the
preserve seems to be explained by its high tree density, although the reason is not
clear. Interception in other Eucalyptus plantations has been reported to change with
age, varying from 12% of rainfall at six-year old plantations in India and Brazil
(BruijnzeeI1997) to a peak of between 23 and 38% of rainfall at 30 years old,
declining to between 21 to 35% at age of80, to between 15 and 27% at age of240
years old in natural forests (Haydon et al. 1996). The interception values found in
this study for Eucalyptus stands, approximately 70 years old, ranged from 13 to 22%
87

of rainfall, a little lower than modeled by Haydon et al. (1996) for natural eucalypt
forests.
Possible errors involved in the measurements may account for the patterns
seen in throughfall, stemflow, and, consequently, interception. Rainfall, for example,
was measured outside the stands. Even though the rainfall collectors were not at
large distances from the throughfall and stemflow collectors, the differences in the
topographic exposure between the stands and the rainfall collectors have probably an
effect on the rainfall catch by the canopy.
3.5.4. Effect offorest structure on throughfall and stemjlow
Even though no significant differences were found in throughfall and
interception among stands dominated by different species, Figures 3.8 and 3.9 show
that stands dominated by the same species showed consistent relationships between
throughfall or stemflow and some of their structural characteristics. Tree density, for
example, is the variable that best explained variations in throughfall and stemflow
among stands dominated by Eucalyptus and by Fraxinus. However, in Eucalyptus
throughfall decreased with increasing tree density, whereas it increased with
increasing tree density in Fraxinus. The differences in the aspect of the terrain of the
stands may have caused these contrasting responses. Rainfall was an important
variable in explaining variation in throughfall only in stands dominated by
Eucalyptus. Variations in stemflow also showed distinct relationships with structural
characteristics in the different stands studied. Stemflow was positively associated
with the interaction of rainfall and tree density for most stands (except for Fraxinus in
88

the middle and northern sections). Similarly, Huber and Iroume (2001) found a
strong influence of rainfall and tree density on stemflow; however, they found that
stemflow was negatively associated with tree density.
The comparison among stands dominated by the same species in this study
provides a different perspective on the previous evidence that certain forest structural
characteristics have universal effects on the components of rainfall interception (e.g.,
Hanchi and Rapp 1997, Park and Hattori 2002). Whereas throughfall and stemflow
in some species are related to structural characteristics of the stands, I found no single
variable that explained either throughfall or stemflow across all species. The variable
that best explained variation in stemflow among stands in almost all species was tree
density and this should be investigated further with a larger number of broad-leaved
species.
Leaf area index is one stand characteristic that has been suggested to influence
interception positively (e.g., Zimmermann et al. 1999, van Dijk and Bruijnzeel2001).
In this study, LAI influenced throughfall within a stand ofFraxinus, but it did not
explain the variations in throughfall among stands. LAI was not a good predictor of
interception for forests dominated by any of the species studied.
3.6. Conclusion
Based on the data collected in this study, throughfall and interception do not
seem to be affected consistently by forest species composition. However, stemflow
was significantly higher in forests dominated by Fraxinus than in forests dominated
by Grevillea, suggesting that changes in forest composition may have an effect on
this small but important input of water.
89

Throughfall and stemflow data from Honouliuli strongly indicate that no
forest characteristic alone governs these components of the water cycle. The
characteristic that most influenced throughfall and stemflow was tree density but only
for stemflow did it cause a significant response across almost all stands. On the other
hand, leaf area index, which is generally considered to influence throughfall and
stemflow positively, did not produce consistent responses from the stands. It was
also observed that the throughfall patterns in the stands studied varied according to
the temporal scale of measurements. Analysis of throughfall collected weekly- to 15
day intervals showed no differences among stands dominated by different species in
the southern section of the preserve. On the other hand, analyses on the data
collected in an event basis showed that throughfall was significantly lower in a stand
dominated by Fraxinus than in stands dominated by Casuarina or Eucalyptus. These
discrepancies suggest that the temporal scale of measurements is an important factor
to take into consideration in studies of rainfall partitioning in forests.
3.7. References
Aboal, J.R., M.S. Jimenez, D. Morales, and J.M. Hernandez. 1999. Rainfall
interception in laurel forest in the Canary Islands. Agricultural and Forest
Meteorology 97: 73-86.
Andersson, T. 1990. Influence of stemflow and throughfall from common oak
(Quercus robur) on soil chemistry and vegetation patterns. Canadian Journal of
Forest Research 21: 917-924.
Asner, G., W. Garnett, and B.F. Morgan. 1993. Biological Inventory Report
Honouliuli Preserve, The Nature Conservancy of Hawaii, Honolulu, HI, USA.
Bruijnzeel, L.A. 1997. Hydrology of forest plantations in the tropics. In:
Management of Soil, Nutrients and Water in Tropical Plantation Forests (E. K. S.
90

Nambiar, A. G. Brown, eds), ACIAR, CSIRO (Australia) and CIFOR
(Indonesia): 125-167.
Bruijnzeel, L.A. 2000. Forest Hydrology. In: J. Evans (ed.) The Forests Handbook.
Blackwell Scientific, Oxford: 301-343 (Chapter 12).
Cape, J.N., A.H.F. Brown, S.M.C. Robertson, G. Howson, and 1.S. Paterson. 1991.
Interspecies comparisons of throughfall and stemflow at three sites in northern
Britain. Forest Ecology and Management 46: 165-177.
Crockford, R.H., D.P. Richardson, and R. Sageman. 1996a. Chemistry of rainfall,
throughfall and stemflow in a eucalypt forest and a pine plantation in south
eastern Australia: 2. Throughfall. Hydrological Processes 10: 13-24.
Crockford, R.ll., D.P. Richardson, and R. Sageman. 1996b. Chemistry of rainfall,
throughfall and stemflow in a eucalypt forest and a pine plantation in south
eastern Australia: 3. Stemflow and total inputs. Hydrological Processes 10: 25
42.
van Dijk, A.I.J.M., and L.A. Bruijnzeel. 2001. Modelling rainfall interception by
vegetation of variable density using an adapted analytical model. Part 1. Model
description. Journal of Hydrology 247: 230-238.
Diinisch, 0., M. Erbreich, and T. Eilers. 2003. Water balance and water potentials of
a monoculture and an enrichment plantation of Carapa guianensis Aubl. In the
Central Amazon. Forest Ecology and Management 172: 355-367.
van Elewijck, L. 1989. Influence ofleaf and branch slope on stemflow amount.
Catena 16:525-533.
Falkengren-Grerup, U. 1989. Effect of stemflow on beech fores soils and vegetation
in southern Sweden. Journal of Applied Ecology 26: 341-352.
Giambelluca, T.W. 1983. Water balance of the Pearl Harbor-Honolulu basin,
Hawai'i, 1946-1975. Water Resources Research Center, Technical Report No.
151, University of Hawaii at Manoa, Honolulu. HI, USA.
Giambelluca, T.W., M.A. Nullet, and T.A. Schroeder. 1986. Rainfall Atlas of Hawaii.
Report R76, Department of Land and Natural Resources, Honolulu, 267 pp.
91

Hafkenscheid, R 2000. Hydrology and biogeochemistry of tropical montane rain
forests of contrasting stature in the Blue Mountains, Jamaica. Ph. D. dissertation,
Vrije Universiteit, The Netherlands, 302 pp.
Hanchi, A and M. Rapp. 1997. Stemflow determination in forest stands. Forest
Ecology and Management 97: 231-235.
Haydon, S.R, R.G. Benyon, and R. Lewis. 1996. Variation in sapwood area and
throughfall with forest age in mountain ash (Eucalyptus regnans F.Muell.).
Journal of Hydrology 187: 351-366.
Helvey, J.D., and J.H. Patric. 1965. Canopy and litter interception of rainfall by
hardwoods of eastern United States. Water Resources Research 1(2): 193-206
Holscher, D., T.D. Sa, RF. Moller, M. Denich, and H. FoIster. 1998. Rainfall
partitioning and related hydrochemical fluxes in a diverse and in a mono specific
(Phenakospermum guyannense) secondary vegetation stand in eastern Amazonia.
Oecologia 114: 251-257.
Huber, A, and A Iroume. 2001. Variability of annual rainfall partitioning for
different sites and forest covers in Chile. Journal of Hydrology 248: 78-92.
Jordan, C.F., and J. Heuveldop. 1981. The water budget of an Amazonian rain forest.
Acta Amazonica 11(1): 87-92.
Leopoldo, P.R., W.K. Franken, E. Matsui, and E. Salati. 1982. Estimativa de
evapotranspirac;ao de floresta amazonica de terra firme. Sup!. Acta Amazonica
12: 23-28.
Leopoldo, P.R, W.K. Franken, and N.A Villa Nova. 1995. Real evapotranspiration
and transpiration through a tropical rain forest in central Amazonia as estimated
by the water balance method. Forest Ecology and Management 73: 185-195.
Levia, Jr., D.F., and E.E. Frost. 2003. A review and evaluation of stemflow literature
in the hydrologic and biogeochemical cycles of forested and agricultural
ecosystems. Journal of Hydrology 274: 1-29.
Lima, W.P. 1976. Interceptac;ao da chuva em povoamentos de eucalipto e de pinheiro.
IPEF, Piracicaba 13:75-90.
92

Lima, W.P. 1993. Impacto Ambiental do Eucalipto. Editora da Universidade de Sao
Paulo, 301 pp.
Lopez-Serrano, F.R., T. Landete-Castillejos, J. Martinez-Millan, and A. del Cerro
Barja. 2000. LAI estimation of natural pine forest using a non-standard sampling
technique. Agricultural and Forest Meteorology 101: 95-111.
Mahendrappa, M.K. 1990. Partitioning of rainwater and chemicals into throughfall
and stemflow in different forest stands. Forest Ecology and Management 30:65
72.
Moreira, M.Z., L. Sternberg, L. Martinelly, R. Victoria, E. Barbosa, L. Bonates, and
D. Nepstad. 1997. Contribution of transpiration to forest ambient vapor based on
isotopic measurements. Global Change Biology 3: 438-450.
Nelson, R.E., W.H.C. Wong, Jr., H.L. Wick. 1968. Plantation timber on the Island of
Oahu - 1966. United States Department of Agriculture, Forest Service, Resource
Bulletin PSW-lO, 52 pp.
Pandit, B.R., S.R.K. Chava, and V.V.S.V. Rao. 1991. Interrelationship of rainfall,
throughfall and stemflow in teak forest. Indian Journal ofForestry 14(4): 287
289.
Park, H-T. and S. Hattori. 2002. Applicability of stand structural characteristics to
stemflow modeling. Journal of Forest Research 7: 91-98.
Poore, M.E.D., and C. Fries. 1985. The Ecological Effects of Eucalyptus. Food and
Agriculture Organization of the United Nations, FAO Forestry Paper 59,88 pp.
Raich, J.W. 1983. Throughfall and stem flow in mature and year-old wet tropical
forest. Tropical Ecology 24(2): 234-243.
Rogerson, T.L. 1967. Throughfall in pOle-sized loblolly pine as affected by stand
density. In: International Symposium on Forest Hydrology (W. Sopper, H. Lull,
eds), Pergamon Press: 187-190.
Rutter A.J., A.J. Morton, and P.C. Robins. 1975. A predictive model of rainfall
interception in forests. II. Generalization of the model and comparison with
observations in some coniferous and hardwood stands. Journal of Applied
Ecology 12: 367-380.
93

Schellekens, J. 2000. Hydrological processes in a humid tropical rain forest: A
combined experimental and modeling approach. PhD. Dissertation, Vrije
Universiteit, The Netherlands, 158 pp.
Schellekens, J., L.A. Bruijnzeel, F.N. Scatena, N.J. Bink, and F. Holwerda. 2000.
Evaporation from a tropical rain forest, Luquillo Ezperimental Forest, eastern
Puerto Rico. Water Resources Research 36(8):2183-2196.
Shuttleworth, W.1. 1988. Evaporation from Amazonian rain forest. Proceedings of the
Royal Society of London, Series B 233: 321-346.
Sood, V.K., R. Singh, and M. Bhatia. 1993. Throughfall, stemflow and canopy
interception in three hardwood tree species around Shimla, Himachal Pradesh.
Indian Journal of Forestry 16(1): 39-44.
Zarnoch, S.1., D.A. Abrahamson, and P.M. Dougherty. 2002. Sampling throughfall
and stemflow in young loblolly pine plantations. US Department of Agriculture
Forest Service, Research Paper SRS-27.
Zhou, G.Y., J.D. Morris, J.H. Yan, Z.Y. Yu, and S.L. Pengo 2002. Hydrological
impacts of reafforestation with eucalypts and indigenous species: a case study in
southern China. Forest Ecology and Management 167:209-222.
Zimmermann, L., C. Frtihauf, and Ch. Bernhofer. 1999. The role of interception in
the water budget of spruce stands in the Eastern Ore Mountains/Germany. Phys.
Chern. Earth (B) 24 (7): 809-812.
94

Table 3.1 - Comparison of manually collected throughfall among stands dominated
by different species between November 1998 and May 2000 for the North and South
sections, and between January 1999 and May 2000 for the Middle section. Repeated
measures ANOVA was used to compare throughfall among the stands in two
different analyses: one including all four species (4 spp) and another excluding
Grevillea (3 spp), which did not have any throughfall data after September 1999.
Median throughfall (in ml) of each stand is shown for comparison. Different letters
identify significantly different values (p < 0.05) in throughfall among columns of the
same row. (N = number of collection days, F = ratio of the variance in the sample,
and p = probability of F being larger than estimated)
Throughfall (ml)
Casuarina Eucalyptus Fraxinus Grevillea N F P
3 spp 1280a 1377a 2052b 44 9.36 0.014North
4 spp 1424a 1820a 2633b 2802b 25 6.11 0.018
3 spp 977 709 1250 32 4.54 0.063Middle
4spp 1803 1578 2243 2124 15 1.97 0.197
3 spp 815 934 848 40 1.90 0.230South
4 spp 935 1168 1038 1319 11 1.80 0.243
95

Table 3.2 - Results from the one-way analyses of variance comparing throughfall as a
proportion of rainfall in an event basis. Different letters (by row) indicate significant
differences among stands; no letter indicates that the values in the row are similar.
Data from all buckets were averaged per event in each stand. Storage capacity (S)
was estimated as 0.7,0.6, and 0 mm for the Eucalyptus, Fraxinus and Casuarina
stands, respectively.
Rainfall size Throughfall / Rainfall
(mm) Eucalyptus Fraxinus Casuarina F p
S-3 0.51 a 00406 0.52a 5.94 0.003
3.1 - 6 0.58 0.50 0.56 0.66 0.525
>6 0.62 0.56 0.65 1.61 0.208
all events 0.55a OA8b 0.56a,b 3.65 0.027
Table 3.3 - Throughfall as a proportion of rainfall during periods of high and low leaf
area index (LAI) in the stands of the southern section of the Honouliuli Preserve.
Values were compared using Student's two-sample t-test. Different letters in same
row indicate significant differences (p < 0.05) within stand.
High LAI LowLAI T p
Eucalyptus 0.53 0.59 -1.39 0.083
Fraxinus 0.34 a OA6 b -3.01 0.002
Casuarina 0.50 0.56 -0.84 0.200
96

Table 3.4 - Regression equations between rainfall (P, in mm) and stemflow (sf, in ml)
obtained for trees throughout the stands studied. Psidium cattleianum and Schinus
terebinthifolius are invasive trees in the understory of the tree plantations (N =
number of sampled intervals).
Species# Diameter
Regression equation N r2trees (cm)
p
2 5 -10 sf= -63 P + 3.4 p2 41 0.71 < 0.0001
Eucalyptus6 10-30 sf= 14.376 P + 6.4793 p2 _0.046 p3 123 0.62 < 0.0001
5 30- 50 sf= 101.2 P 74 0.32 < 0.0001
4 50- 80 sf= - 109.2 P + 10.532 p2 _0.0728 p3 87 0.49 < 0.0001
4 5 -10 sf= 191.9 P 88 0.58 < 0.0001
Fraxinus6 10 -30 sf= 255.4 P 135 0.44 < 0.0001
3 30-50 sf= 357.4 P 58 0.57 < 0.0001
2 50- 80 sf = - 46 P + 13.1 p2 23 0.59 0.0001
Casuarina6 5 -10 sf= 38.1 P 168 0.37 < 0.0001
11 10-30 sf= 183.8 P 312 0.67 < 0.0001
7 10 -30 sf= 81.522 P - 3.2996 p2 + 0.0456 p3 99 0.56 < 0.0001
Grevillea 6 30-50 sf= 0.2103 P + 2.6242 p2 _0.0147 p3 85 0.43 < 0.0001
2 50- 80 sf= 33.103 P - 2.1256 p2 + 0.0755 p3 28 0.99 < 0.0001
4 5 -10 sf= 129.9 P 82 0.73 < 0.0001Psidium
2 10 -30 sf= 236.1 P 24 0.45 0.0003
Schinus 3 10-30 sf= 69.6 P - 0.3 p2 57 0.57 < 0.0001
97

Table 3.5 - Throughfall (TF), stemflow (SF), and interception (ED, all shown as
percentage of rainfall, based on manual measurements on stands dominated by
different species.
measurement Rainfall Eucalyptus Casuarina Fraxinus Grevillea
period (mm)TF SF E; TF SF E; TF SF E; TF SF Ej
Aug 98 to Apr 00 879 78.1 1.2 20.7 79.4 2.4 18.2 75.6 1.5 22.9 70.0 0.7 29.3South
May to Dec 01 217 71.4 1.1 27.5 78.3 2.4 19.3 69.7 1.2 29.1 67.0 0.7 32.3
Middle Dec 98 to May 00 841 83.6 0.5 15.9 82.2 2.0 15.8 80.6 3.5 15.9 76.2 0.9 22.9
North Oct 98 to May 00 1047 77.5 2.1 20.4 76.5 1.9 21.6 92.2 3.9 3.9 88.1 0.7 11.2
Table 3.6 - Rainfall (P), throughfall (TF), stemflow (SF), and interception (Ej) on
stands dominated by different species in the Honouliuli Preserve from January to
December 1999. Mean standard error (SE) found for throughfall events in 1999 are
shown as percentage of throughfall for each stand.
TFP(mm) SF (% P) Ej (% P)
(%P) SE (% TF)
South 680 78.4 9.0 1.3 20.3
Eucalyptus Middle 628 85.6 9.0 0.6 13.8
North 753 76.1 7.7 2.2 21.7
South 583 82.5 10.6 2.4 15.2
Casuarina Middle 770 80.1 8.0 2.0 17.9
North 753 76.5 17.4 1.9 21.6
South 680 77.5 13.0 1.5 21.0
Fraxinus Middle 770 82.0 17.5 3.5 14.5
North 753 91.4 12.0 4.0 4.3
South 680 70.3 14.6 0.7 29.0
Grevillea Middle 770 77.4 12.8 0.9 21.7
North 753 87.6 15.0 0.8 11.6
98
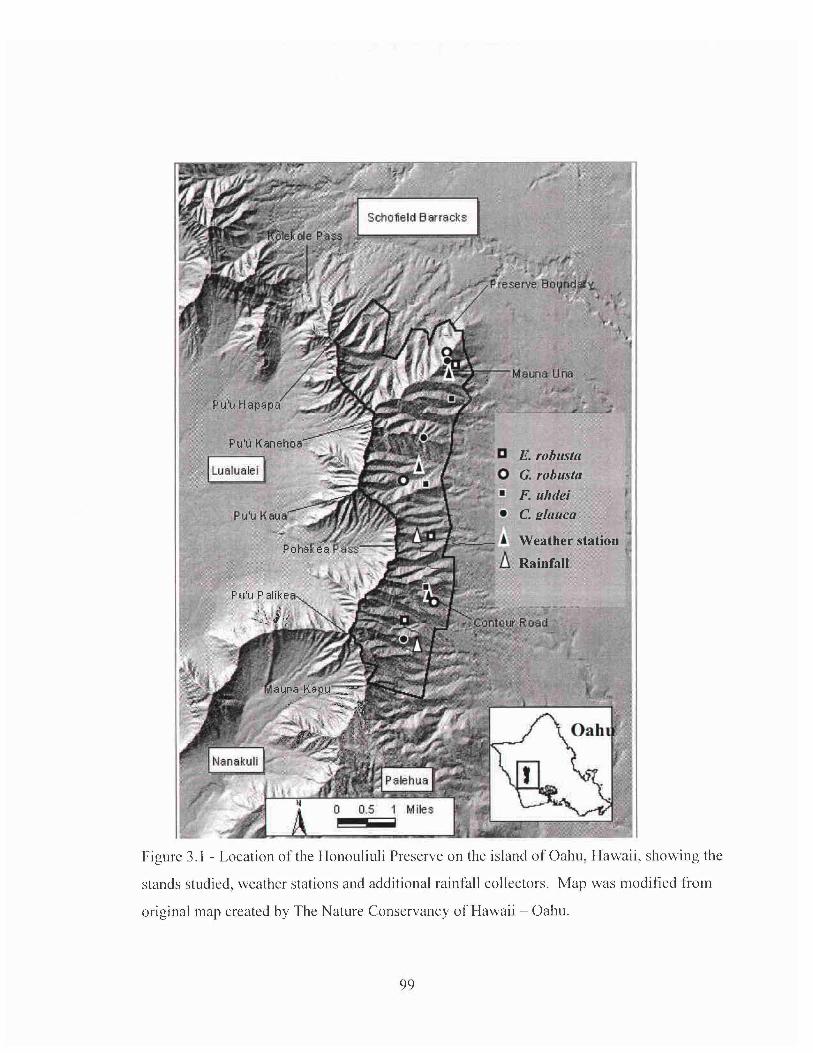
E. robustaG. robusta
• F. uhdei
,t;~~~~':. c. elauca~ Weather station
Rainfall
7------
Figure 3.1 - Location of the Honouliuli Preserve on the island of Oahu, Hawaii, showing the
stands studied weather stations and additional rainfall collectors. Map was modified from
original map created by The Nature Conservancy of Hawaii - Oahu.
99

14 ~
12 :::::c
10 58 E
al
North268 events
616mm
South235 events
549mm
Middle247 events
652mm
-,-------------------.--------------------,- 20
18
16
6
4
2
f--ULLI.l..LLIJll.LlllL1lll;.u:LC-eo..=.J::l.=- -f...ILl..Ll..Lll..ud.J..Ll.lllLLUJ..l.Lll..1.L1lll-l.-_-----l.l.tl_.-ll{o
18
16
14 ~
12 :::::c
10 ::l
~8 al
6
4
2
Ll,-u.,u,J.I,.LJ.,.U!,'LY-'-r'-'fl-'i'-Ye....,.u;i"-'T'-~""T_1,_,_...........""'i"_'II"_T_.,....J.--y..yL..t,J-!,r'-'fIJY-'r'..r,.u.,r'-'flJy..y..r,.u.,.u,.uL,L,-...,.......,--.-.,...y_¥..,-,---LO
14 _
12 ~10 C
::l
8 ~6 al
4
2
+-'"'UA.L.1.LJ..I.iLLJ..Llll..l..U'-'--.......c:u::L ~-l-LJ.J.JU_ll_'_L..IJLil.J_'....l.L_'_L..IJLLUJ...!.L.LLIJLl..Ll_ __U..____I.I___'_J.......+O
18
16
60
50
- 40
*'-I/)30-C
~Q) 20
10
0
50
- 40~0-I/)
30-CQ)
a; 20
10
0
SO
~40
0-I/)30-CQ)
>Q) 20
10
0
event size (mm)
Figure 3.2 - Rainfall distribution in three sections of the Honouliuli Preserve: north
(top two graphs), middle (middle graphs), and south (lower graphs). The data are
presented in terms ofoccurrence ofevents in each category and proportional amount
over the total rainfall in the period between Mar h 19 1999 and Mar h 18 2000.
100

2001
--South
,······Middle
- - North200019991998
40
20
0+-r--,--,-r-,-r::~---r-4-,-,--,-.,.--r_r_T"-,--,r-r.,__+_r_T"-,-,r_r_.,......,....,......,._,__,_l_.,_,_..,.....,._,_r_r_.,......,.....,__,__+_,._i
180.--------r------..-;------I
160
140
_ 120E.§. 100
~ 80c'f! 60
MMJSNJMMJSNJMMJSNJMMJSNJ
Figure 3.3 - Monthly rainfall in the three sections of the Honouliuli Preserve between
March 1998 and February 2002.
101

5-.-------------------------------.
4
3
2
--- C. glauca-0-- E. robusta-T- F. uhdei----'\1- G. robusta
O..L-------r---,--------,---,-----,---r----,-----'
Jun-99 Aug-99 Nov-99 Jan-OO Mar-OO May-OO Jul-OO
Figure 3.4 - Leaf area index (LAI, m2 of leaf area per m2 of ground) on stands
dominated by Casuarina glauca, Eucalyptus robusta, Fraxinus uhdei, and Grevillea
robusta from June 1999 to July 2000. Bars represent standard errors of three stands
per species. LAI in F. uhdei was significantly higher than Casuarina glauca and
Eucalyptus robusta for the period measured (Repeated Measures ANOVA F = 8.95, P
< 0.0001).
102

5
--<>- C. glauca
4 -0-- F. uhdei
---.- E. robusta
3
«...J
2
O-\---r------,,.----,.----,..---,---...,...---,----,---.,....----j
Figure 3.5 - Leaf area index (LAI, in m2 m-2) in the forest stands of the southern
section of the Honouliuli Preserve between June 2001 and March 2002. Bars
represent standard errors.
103

2-.----------------------------,
•
• Casuarina glaucao Eucalyptus robusta.., Fraxinus uhdei
-- R2 =0.11, P < 0.0001
..,
..,
,..,..,
••
•..,o
o
o
oo
o
o
J§c.~-ocoto0..
2 10..rotJ)
-e
432
O+------,-------,-------,-----------jo
LAI
Figure 3.6 - Throughfall, as a proportion of rainfall, for events < 3 mm, as a function
of leaf area index (LAI, m2 m-2) for the three stands in the southern section of the
Honouliuli Preserve.
104
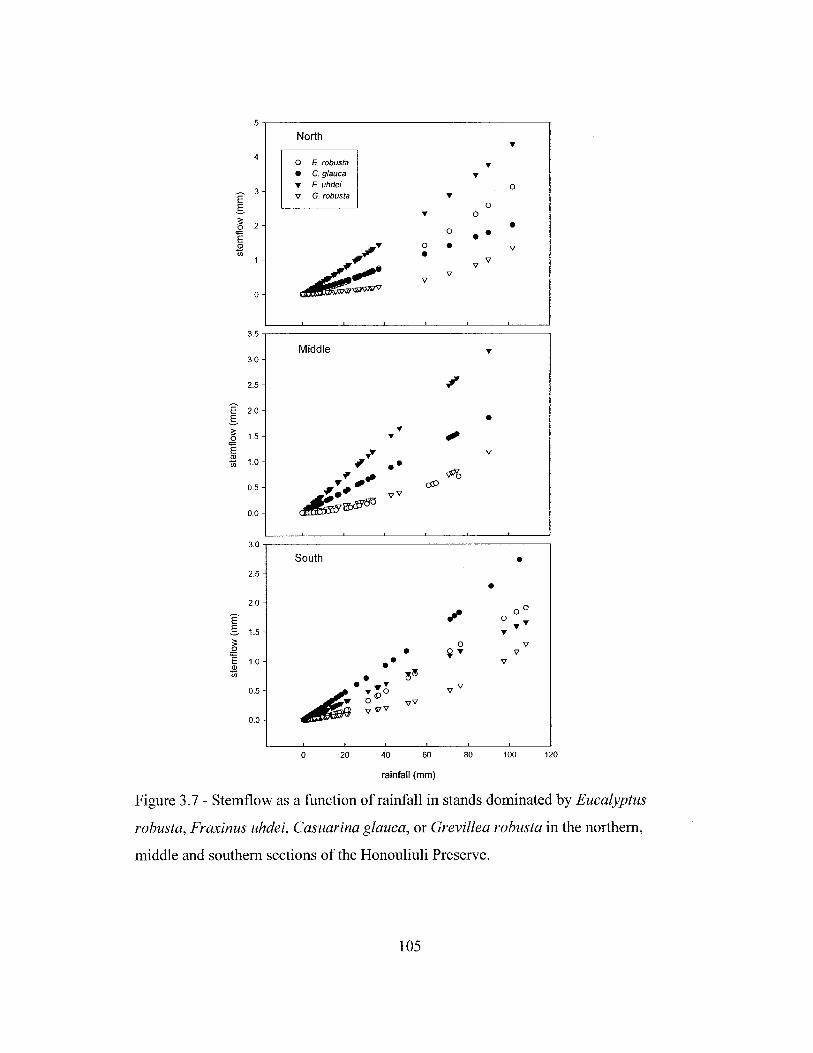
5~-------------------~
North
4
E 3
-S~ 2
E2V>
o
o E. robusta• C. glauca.., F. uhdei
v G. robusta
o
o ••
oo
• •
o
•
3.5.,----------------------,
Middle3.0
2.5
E 2.0-S~ 1.5""E* 1.0
0.5
0.0
•
3.0,--------------------,
2.5
2.0
E-S 1.5
~E 1.0
"*0.5
0.0
South
•••
...o
~..,
••
00o ..,.., ..,
o 20 40 60 80 100 120
rainfall (mm)
Figure 3.7 - Stemflow as a function of rainfall in stands dominated by Eucalyptus
robusta, Fraxinus uhdei, Casuarina glauca, or Grevillea robusta in the northern,
middle and southern sections of the Honouliuli Preserve.
105

A B... ...v v
0 0
... • ~
• •0 0v ... • ... v0 • 0
0 E. robustaV V • c. glauca... F. uhdei
V G. robusta
95
90
85
80
75
70
~<:.~ 65-o 0
~~ 95
-§, C6 90
:5
500 1000 1500 2000 2500
tree density (stems ha-1)
3000 3500 20
o
25 30 35 40basal area (m2 ha-1
)
45 50 55
85 0 0
• ... • ...80 • •
0 0V • ... ... e V
075
70 V
651.5 2.0 2.5 3.0 3.5 4.0 550 600 650 700 750 800
LAI(m2 m-2) rainfall (mm)
Figure 3.8 - Throughfall as a function of various stand characteristics (A-C) and of
rainfall (D) for the period between January and December 1999.
106

A B0 E. robusta
• C. glaucaT T T F. uhde;
v G. robustaT T
• •0 0
• • •T T
0 0
'Iv VV
0 V V 0
5
4
3
2
~c 0.~
'0 0 500 1000 1500 2000 2500 3000 3500 20 25 30 35 40 45 50 55
';R0
?:50
E c.illIn
4
tree density (stems ha-')
T
D
basal area (m2 ha-')
T
T
T
•
3
•02 • •
0
V
0'1
01.5 2.0 2.5 3.0
LAI (m2 m-2)
3.5 4.0 550
•
600
•
650
rainfall (mm)
700
•• •
V V
750 800
Figure 3.9 - Stemflow as a function of various stand characteristics (A-C) and of
rainfall (D) for the period between January and December 1999.
107

4. Evapotranspiration and Groundwater Recharge by Tree
Plantations in the Honouliuli Preserve, Hawaii.
4.1. Abstract
Evapotranspiration (ET) is one of the main components of the hydrological
cycle affecting groundwater recharge by forests. In Hawaii, estimates ofET, and thus
recharge, have usually relied on water balance models developed for continental areas
with no field calibration in Hawaii. This study aimed to compare three methods for
estimating ET based on (1) water balance calibrated with field measurements of soil
moisture, (2) temperature variation above the canopy (TVAR), and (3) sap flow data
in three planted forests of different species composition. The plantations, dominated
by Fraxinus uhdei, Casuarina glauca or Eucalyptus robusta, were located in the
Honouliuli Preserve, which is part of the southern Oahu groundwater flow system. I
hypothesized that (l) the actual ET rates estimated by the TVAR method are higher
than previously estimated based on an uncalibrated water balance model and (2) that
ET rates differ among forests of different species composition. Evapotranspiration
estimates were based on soil moisture, sap flow, and microclimate data collected from
May 5, 2001, to April 27, 2002. Evapotranspiration estimates from the TVAR
method gave erroneous results and were not reliable for testing the hypothesis 1.
Evapotranspiration estimated from both the water balance and the sap flow methods
was higher in the Eucalyptus stand than in the other stands. The water balance
method indicated that ET was 65%, 94% and 91 % of annual rainfall, and runoff 32%,
3% and 11 % of annual rainfall in stands of Casuarina, Eucalyptus, and Fraxinus,
108

respectively. Evaporation of rainfall intercepted by the canopy was substantial,
representing 41 %,29% and 35% ofET, respectively. The only stand that produced
recharge was Fraxinus with 12 mm i l• I concluded that, due to no or very little
recharge, the species chosen for reforestation in Honouliuli, after 50 to 70 years after
planting, have not achieved the desired effect of restoring and protecting the
groundwater resource due to their relatively high ET rates.
4.2. Introduction
One of the greatest concerns related to deforestation is its impact on the
hydrology. Changes in land use in regions with extensive forest cover can affect
hydrological processes such as evapotranspiration (ET) and, consequently, regional or
even global climate (Shukla and Mintz 1982, Lean and Warrilow 1989, Shukla et al.
1990, Salati and Nobre 1991). The development of secondary vegetation in these
areas reduces the impact of deforestation on the hydrological cycle by raising ET and
infiltration rates to levels closer to the primary forest's levels (Giambelluca et al.
1996a, Holscher et al. 1997, Jipp et al. 1998). However, in some cases, natural forest
regeneration is very slow. As a result, a faster process of reforestation of watersheds
may be needed in order to decrease the impacts of deforestation. In Hawaii, the main
concern related to deforestation is the possible reduction of the groundwater level due
to the low infiltration rates generated by denuded land. Thus, fast growing non-native
trees were planted on many deforested Hawaiian watersheds in order to restore
groundwater recharge. Oahu, as many other oceanic islands, depends mostly on
groundwater for domestic consumption and for the development and maintenance of
109
economic activities. In 1995, 86% of the freshwater consumed on the Island of Oahu
was obtained from groundwater (DLNR 1995). The abundance and distribution of
groundwater on the island is limited, and it is a priority to understand the dynamics of
this resource, especially in relation to its recharge.
Although the effects of different cover types (e.g., grasses versus forests) on
the hydrological cycle have been well studied (e.g., Bultot et al. 1990, Hodnett et al.
1996, Calder 1998, Jipp et al. 1998), research on the effects of different forest types
on the magnitude of the water cycle components is still scant (e.g., Bigelow 2001
Cape et al. 1991). Understanding the water cycle in reforested areas may provide
tools to improve land management programs that affect water resources in Hawaii
and other tropical islands.
I use the term evapotranspiration (ET) in this chapter to define the total
evaporation from the forest including interception, transpiration, and litter and soil
evaporation. Estimates on ET in some tropical forests located at continental edges or
islands have shown higher values than in continental forests. In forests of Puerto
Rico (Schellekens 2000) and Fiji (Waterloo et al. 1999), for example, evaporation
from intercepted water was greater than the values predicted by energy balance
equations developed for continental areas, indicating that other sources of energy,
besides solar radiation, are affecting interception (Bruijnzeel 2000). In Hawaii, ET
has been estimated using water balance models developed for continental areas and
based mostly on data on precipitation, stream flow and some pan evaporation in
agricultural sites. Because of the limited amount of available data on soil moisture,
transpiration, interception, ET and infiltration, the models usually estimate these
110

components based on empirical equations, and do not incorporate calibrations
obtained from field measurements (e.g., Giambelluca 1983).
In this study I used soil moisture data collected in forests dominated by
different species to obtain more direct estimates of ET and I hypothesized that ET is
higher, thus groundwater recharge is lower, than previous estimates for Oahu and that
ET is different in forests of different species composition.
4.3. Methods
4.3.1. The study site
The Nature Conservancy's Honouliuli Preserve is located on the eastern slope
of the southern Waianae Mountain Range, on the Island of Oahu, Hawaii, and is part
of the southern Oahu groundwater flow system. Mean annual rainfall in this area
ranges from 540 to 750 mm (Giambelluca et al. 1986). Total rainfall in 1999 was 630
mm, but in 2000 and 2001 it was below usual at 386 and 450 mm, respectively, in the
southern part of the preserve (Chapter 3), where this study was conducted. Normal
rainfall level resumed after November 2001 (Fig. 3.3). This part of Honouliuli is
dominated by 20 to 130 em deep Dystrandepts soils. Between the 1920s and the
1940s, several non-native fast-growing tree species were planted in this area, in
mono-specific stands, in order to reduce erosion and to protect and recharge
groundwater.
111

4.3.2. Field measurements
Stand-level ET was estimated independently by three methods: water balance,
temperature variance, and direct measurements of tree sap flow combined with
rainfall interception (hereafter called the sap flow method). The sap flow and water
balance methods were applied to the data collected in one plantation dominated by
each of three species: Fraxinus uhdei, Casuarina glauca, and Eucalyptus robusta
(hereafter referred to as the forest sites). These stands were located in the southern
part of the preserve and their characteristics are described in Section 1.7.2 and in
Table 1.1. The temperature variance method was not used to estimate ET in the
Eucalyptus stand because of the absence of temperature measurements above the
canopy.
4.3.3. Micrometeorological data
Due to the difficulties in measuring the microclimate directly above the
canopy of the forests stands, micrometeorological data were collected from a weather
station installed above a short-canopy forest, approximately 5 m tall, dominated by
Schinus terebinthifolius (hereafter referred to as the reference site). This site was
located between the Fraxinus and Eucalyptus stands and was used as reference to
allow for the estimate of potential evapotranspiration on the forest sites. The
instruments were placed 2 m above the canopy in the reference site and collected data
on rainfall (tipping bucket rain gauge, Texas Electronics, Dallas, TX, USA), net
radiation (Q7.1_L50, Radiation Energy Balance Systems! Campbell Scientific,
Logan, UT, USA), wind velocity (OI4A, MetOne Instruments, Grants Pass, OR,
112

USA), relative humidity and air temperature (HMP45C, Vaisala, Inc., Sunnyvale,
CA, USA), canopy temperature (infrared transducer 4000AZL, Everest Interscience,
Inc., Tucson, AZ, USA), and incoming and reflected shortwave radiation
(pyranometers, LI-200SZ, LiCor, Lincoln, Nebraska, USA). An additional rain gauge
(Texas Electronics, Dallas, TX, connected to a Hobo Event datalogger, Onset,
Pocasset, MA, USA) was placed near the Casuarina stand. Data were collected from
January 2001 to April 2002.
4.3.4. Potential evapotranspiration
Potential evapotranspiration (PE, in W m-2), the maximum evapotranspiration
by a vegetated surface with unlimited water supply, was estimated at the reference
site based on the equation proposed by Penman (1948) for open water surfaces:
PE = !J.(Rnet - G) + r[(0.263 + 0.138U)(e, - e)]
!J.+r(4.1)
where Rnet (W m-2) is the net radiation, G (W m-2
) the soil heat flux, r (mb K 1) the
psychrometric constant, U (m S-I) the wind velocity, es the saturation vapor pressure
(mb), and e the ambient vapor pressure (mb). The same equation was used to
estimate PE in the forest sites. The values of vapor pressure and wind velocity used
were those obtained at the reference site, but Rnet was calculated with equation 4.2
(Giambelluca et al. 2003), by adjusting the reference site Rnet to an albedo (u) of 0.13.
Rnet =Kd - (uKct) + EA - EoTo4 (4.2)
where Kd (W m-2) is the incoming shortwave radiation, E:: is the emissivity of the
surface, A (W m-2) the downward longwave radiation from the atmosphere, (J the
113

Stephan-Boltzmann constant (5.67 x 10⁻⁸ J K 4 m-2S-I), and To (K) the surface
temperature. Measured canopy infrared temperature at the reference site was
substituted for To (Choudhury et al. 1986).
Soil heat flux (G) was estimated on the basis of Rnet according to data from
Giambelluca et al. (unpublished, Fig. 4.1) from the Brazilian Cerrado from August
2001 to October 2002. Differences in G between the Cerrado and Honouliuli should
not affect the estimates of daily PE in Honouliuli because mean G is negligible over a
daily interval.
4.3.5. Water balance method
The water balance method used in this study is a bookkeeping procedure
(Thomthwaite 1948, Thomthwaite and Mather 1955) modified by Giambelluca
(1983, 1986) to estimate the influence of land use on the water balance of southem
Oahu. The original model proposed by Thomthwaite used monthly means of
precipitation (P) and PE as inputs, and assumed that P evaporated at the PE rate.
Giambelluca (1983,1986) and Giambelluca and Oki (1987) improved the accuracy of
the model by having measurements ofP and PE at shorter intervals (hourly or daily)
as inputs, and by considering soil moisture and depth of water uptake in the ET
calculation. The model keeps account of the exchange of moisture between the soil
and the vegetation that occurs in each interval considered. In this study, the interval
of inputs to the model was daily. A starting value of available water (AWi-I)
describes the initial state of the system, and available water for each day is calculated
based on the state variable Xi:
114

(4.3)
where AW is the difference between the moisture content and the zero extraction
point (ZEP) in the root zone, and Pi, RO j and ET j are the precipitation, surface runoff
and evapotranspiration during day i. All variables are expressed in the same unit of
water depth (mm, in this study). The ZEP is the lowest soil moisture limit available
for evaporation and was considered in this study to be the lowest level of soil
moisture at the end of the 21-month long drought. Available water at the end of each
interval is assumed to be zero when X j ::; 0, or a function ofXj or depth of water
uptake when Xi > °(Table 4.1). The model estimates ET for each day as a function
of PE adjusted for the vegetation cover and the available soil water content in the root
zone (Giambelluca et al. 1996b):
ET=PE for
for
Sc.N
S<N
(4.4)
(4.5)
where S is the instantaneous available moisture content in the root zone, and N is a
function of depth of water uptake and PE, and it could be interpreted as the amount of
available moisture in the root zone below which ET is depressed below PE.
Groundwater recharge in the model is considered to occur only when AW exceeds the
field capacity. Detailed description of the model can be found in Giambelluca et al.
(l996b).
Runoffwas calculated separately, as a function ofP, using the empirical u.s.
Soil Conservation Service Curve Number model (Dunne and Leopold 1978). The
Curve Number model calculates surface runoff based on precipitation, antecedent soil
115

moisture condition (AMC) and the curve number parameter, which represents the
hydrologic characteristics of the site. Antecedent moisture condition is obtained by
adding the rainfall in the 5 days prior to the beginning of each period considered
(AMC I < 12.7 mm, AMC II is between 12.7 and 27.9 mm, and AMC III > 27.9 mm).
The initial curve numbers were estimated in this study based on the soil hydrologic
characteristics and land cover as published by Dunne and Leopold (1978), and were
adjusted based on the measured soil moisture data. The initial curve numbers used
for all sites were 40,60 and 78, for antecedent moisture conditions (AMC) classes I,
II, and III, respectively. These curve numbers represent a forest cover with moderate
levels of grazing in soils with moderate infiltration rates (Dunne and Leopold 1978).
Model calibration andparameters
The water balance model was calibrated by comparing estimated AW against
the field soil moisture measurements done using time domain reflectometry, as
described in Chapter 2. The model parameters were adjusted to improve the fit of the
estimates to the measured soil moisture data points. The accuracy of the model was
assessed by estimating the root mean square error (RMSE) of the relationship
between measured and estimated soil moisture. The RMSE is determined by taking
the square root of the sum of the deviations of the estimated (s) from the measured (0)
values:
(4.6)
The bias of the simulated soil moisture values was determined by the relative
difference between mean simulated values and mean observed values:
116

BIAS = s=oo
The parameters adjusted in the model (Table 4.1) were the field capacity,
(4.7)
depth of water uptake and crop factor. While all other parameters were held constant,
different values were assigned to the parameter being adjusted in order to obtain the
lowest RMSE of the fit between the estimated and the measured AW. The
adjustment of the parameters was done first assuming that no runoff occurred in the
forest sites. After all parameters were adjusted, runoff was added to the model to
increase the fit of the estimated and measured data. The curve numbers used to
estimate runoff were adjusted also in order to get the lowest RMSE.
Available water capacity. Available water capacity (AWC) is the difference between
the field capacity and the zero extraction point (ZEP), i.e., it is the maximum moisture
available for evaporation within the root zone. The ZEP was considered to be the
lowest soil moisture value during the end of the dry period (when soil moisture was
nearly constant).
Depth ofwater uptake. Depth of water uptake is an important parameter for
determining the AW for transpiration. The starting value for depth of water uptake
was based on the estimated values obtained from the measurements in Chapter 2, then
adjusted to reduce the RMSE of the calibration curve.
Crop factor (or adjusted PE). Because Giambelluca's modifications were made to
estimate ET on a surface covered by pineapple and sugar cane, adjustments need to
be made on the PE for vegetation cover based on the proportion of the area covered
with vegetation. The crop factor (CF), adjusted for each forest site in order to reduce
117

the RMSE of the calibration curve, ranges from 0 to 1 and is defined as the ratio of
the forest PE (PEfar) to sugarcane PE (PEsc) (Giambelluca 1983, Giambelluca et al.
1996b):
PEror = CF* PE,c (4.8)
Several sources of uncertainty are associated with this method. The main
sources of errors are from the measured variables and from the estimation of the
parameters. Errors may come from the spatial variation of precipitation and PE, for
example, and also from the measurement errors associated with the sensors or their
installation. Errors in the PE estimates also may have incurred from the difference in
the canopy characteristics between the forest sites and the reference site. Other errors
may come from the estimation of the parameters of the model, which are directly
affected by the soil moisture measurement errors and variability. Giambelluca et al.
(1996b) estimated the errors in the estimation of groundwater recharge caused by the
parameters estimates of the same model but without calibration with field
measurements of 16% for sugar cane and 51 % for pineapple. My calibration of the
model with field measurements of soil moisture should result in lower errors
associated with the parameters estimation than those found by Giambelluca et al.
(1996b).
4.3.6. Temperature variance method (TVAR)
The temperature variance method (TVAR, Tillman 1972, Vugts et al. 1993,
Schellekens et al. 2000) estimates ET based on the standard deviation of temperature
fluctuations, following the general energy balance equation:
118

J...ET = Rnet - G - H
(4.9)
where Ais the latent heat of vaporization (28.36 W m-2 mm-1 d-1) and H is the sensible
heat flux (W m-2). This method was chosen because it requires the measurement of
only one variable (temperature) at a single height above the canopy. In addition, the
TVAR method is not sensitive to irregularities in the terrain, an advantage for
measuring ET in the steep slopes of Honouliuli. Sensible heat flux is estimated in this
method by the following equation (Vugts et al. 1993):
H = 1.075 p Cp crll2[( k g (z- d)/ T ]1/2 (4.10)
where p (kg m-3) is the air density, Cp (J kg-1 K 1
) is the heat capacity of air at constant
pressure, crT is the standard deviation of the temperature, k is the von Karman
constant (0.4), g is the acceleration due to gravity (9.8 m S-2), d is the height of the
zero-plane displacement (m), and T (K) is the temperature measured with fast
response copper-constantan thermocouples at height z (m), which was approximately
2 m above the canopy. Net radiation was estimated based on the measurements at the
reference site as described in Section 4.3.4.
A limitation of the TVAR method is that ET estimates can only be done
during daytime periods (Rnet > 30 W m-2) with no rain. During rainy periods,
transpiration was assumed to be zero for one hour after rainfall events smaller than 1
mm, and for three hours following rainfall events equal or larger than 1 mm. During
these periods, evaporation from interception (E j) was assumed to be the only form of
evaporation occurring. Interception in each forest stand was derived from automated
measurements of rainfall and throughfall, and estimates of stemflow based on the
119
equations proposed in Table 3.4, as described in Section 3.3.3. Other uncertainties
associated with this method come from the placement of the thermocouples above the
canopy. As it can be seen from equation 4.10, H is proportional to the square root of
(z-d). The sensitivity ofthis method to d (zero-plane displacement height) is
considerable, so best results can be obtained if the temperature measurements are
done at a height which is large compared to d (Lloyd et al 1991, Holwerda 1997).
4.3.7. Sap flow method
The sap flow method combines direct measurements of tree sap flow, scaled
to the stand level, and rainfall interception. Sap flow was measured with the heat
dissipation technique (Granier 1985, 1987), as described in Section 2.3.2. Stand
transpiration (Es, in mm) for the dominant tree species in each stand was obtained by
scaling up transpiration from the tree to the stand using the measured trees as
representatives of size classes, based on their DBH, as described by the following
equation (Granier et al. 1996):
E =A *"(SFD *~Js TL-J fAT
(4.11 )
where AT is the stand sapwood area per unit of ground area (m2 ha-l) calculated as the
sum of the sapwood area of all trees divided by the total ground area of the stand,
SFDi is the mean sap flux density (g m-2S-I) of trees in the class of diameter i, and Ai
is the sapwood area (m2) ofthe trees in the class of diameter i. Mean SFD of each
tree was obtained by dividing each tree's sap flow by its sapwood area, which was
determined by inserting a 1% Safranin solution into a hole in the sapwood and
120

collecting a core above the hole two to three hours later. The sapwood area for all
trees in each stand was determined based on the relationships between sapwood area
and basal area described in Section 2.4.4.
The errors associated with estimating stand transpiration based on the sap
flow of individual trees are mostly associated with the scaling from the probe to the
tree (Hatton et al. 1995), which involves errors in the sap flux density measurements,
in the estimation of active xylem area, and in the sampling variance. These errors can
be on the order of 38% of the estimates (Hatton et al. 1995). The use of variable
length probes in this study (Chapter 2) should reduce the errors associated with radial
variation in sap flow within trees. In addition to the sap flow estimates errors,
understory transpiration, and litter and soil evaporation were considered negligible in
the analyses based on this method, which may result in underestimates ofET.
4.4. Results
4.4.1. Potential evapotranspiration (PE)
Potential evapotranspiration was estimated using the Penman (1948) equation
and was adjusted for each plantation type during the calibration of the water balance
model for the period from May 4,2001, to April 28, 2002, based on data collected on
283 days. There were two large gaps in data collection, one from September 3 to
November 2,2001, and the other from November 25 to December 9,2001. The
missing data were replaced by estimated values based on the results of the 10 days
before and 10 days after the missing period. The total estimated PE from May 4,
2001, to April 28, 2002, was 1201, 1472, and 1338 mm for the Casuarina, Eucalyptus
121

and Fraxinus stands, respectively. Mean daily PE for the Casuarina stand was
similar to the estimates made by Giambelluca (1983) for the same area from 1946 to
1975 (Fig. 4.2). The estimates for the Fraxinus and Eucalyptus stands were in
average 14% and 25% higher than Giambelluca's estimates, respectively (Fig. 4.2).
4.4.2. Water balance method
The calibration of the water balance model resulted in a very good fit
between the estimated and measured soil moisture, and yielded different values for
the parameters adjusted in each forest stand (Fig. 4.3). After runoff was added to the
model (Fig. 4.4), the RMSE between the estimates and the measured soil moisture
decreased from 3.01 to 1.34%,2.37 to 2.20%, and 2.64 to 2.62% for the Casuarina,
Eucalyptus and Fraxinus stands, respectively. The estimated biases of the soil
moisture estimates were very low at -0.009,0.001, and 0.096% of AW, respectively.
The final curve numbers used to estimate runoff are listed in Table 4.2.
Estimated runoff for the whole period was 186, 19, and 11 mm for the Casuarina,
Eucalyptus and Fraxinus stands, respectively (Table 4.3). Estimated daily ET ranged
from 0.1 to 3.6 mm in the Casuarina stand, 0.1 to 6.2 mm in the Eucalyptus stand,
and 0.2 to 5.6 mm in the Fraxinus stand. Mean daily ET was lowest from July to
September, 2001, and highest in February and March, 2002 (Fig. 4.5). From the dry
season (May to October) to the wet season (November to March), ET increased from
an average of 0.45 to 1.7 mm d-1 in the Casuarina stand, from 0.6 to 2.8 mm d-1 in the
Eucalyptus stand, and from 0.6 to 2.6 mm d-1 in the Fraxinus stand. Total ET in the
whole period was highest in the Eucalyptus stand and lowest in the Casuarina stand
122

(Table 4.3). The high value of runoff in the Casuarina stand and the high ET in the
Eucalyptus stand resulted in no groundwater recharge by these stands in the period
studied (Table 4.3). The groundwater recharge by the Fraxinus stand, which
exhibited relatively high ET and very low runoff, was only 12 mm for the period
measured, an average of 0.03 mm dol.
4.4.3. Temperature variance method (TVAR)
The TVAR method yielded extremely variable data, with several
exceptionally negative or exceptionally positive values ofET (Fig. 4.6). These values
were probably a result of the low height where the thermocouples were placed above
the canopy (approximately 2 m above the canopy of each stand). For this reason, this
method was not considered reliable for further estimates.
4.4.4. Sap flow method
Estimates of ET using the sap flow method were only done for days when
there were sap flow data for at least three trees and interception data in each stand.
Based on the sap flow data of the dominant species, all stands exhibited low
transpiration rates, with values lower than 1 mm dol, In February and March 2002,
the Eucalyptus stand exhibited the highest transpiration rates of the three stands, with
rates of 0.14 to 0.76 mm dol, and the Casuarina stand the lowest, with rates of 0.1 to
0.23 mm dol. Total evaporation from intercepted rain (Ej) in the dry season (May to
August) was 29 mm for the Casuarina stand, 34 mm for the Eucalyptus stand, and 40
mm for the Fraxinus stand, and in the wet season (November to February) was 75,
89, and 103 mm, respectively. The Eucalyptus stand exhibited higher daily ET rates
123

on practically all days with no rain. However, this was not true for rainy days, when
E j dominated ET (Fig. 4.7). This method tended to underestimate mean daily ET
when compared to the water balance method (Fig. 4.8), and the results exhibited
larger fluctuation than those obtained by the latter (Fig. 4.9).
4.4.5. Interception vs. evapotranspiration
A comparison between the measured interception with the estimated ET rates
by the water balance method describes the patterns of evaporation in the forest sites.
Evapotranspiration was largely determined by interception in wet months following
dry months (when soil moisture was low). This was more evident in the Casuarina
and Fraxinus stands than in the Eucalyptus stand (Fig. 4.10). As expected, in dry
months with high soil moisture, transpiration dominates ET. Total interception in the
period measured was 154, 180 and 209 mm, representing 41 %,29% and 35% ofET
for the stands dominated by Casuarina, Eucalyptus and Fraxinus, respectively.
4.5. Discussion
4.5.1. Effect ofspecies composition on evapotranspiration
The water balance method estimated ET in the Eucalyptus stand to be
slightly higher than in the Fraxinus stand, and almost twice as high as ET in the
Casuarina stand. Similarly, the results from the sap flow method indicated that ET
was higher in the Eucalyptus stand, followed by Fraxinus and, finally, by the
Casuarina stand. In general, the differences in ET among the stands were more
obvious during the wet season as soil moisture during the dry season reached the zero
124

extraction point, causing transpiration in all stands to be at its lowest. This low soil
moisture was a result of a long period of drought that started in February 2000 in the
study area (Fig. 3.3). In addition, evaporation from interception represented a
considerable fraction of total ET, between 29% and 41%. Some of these values are
higher than values of 10 to 34% estimated for continental sites (Jordan and
Heuveldop 1981; Leopoldo et al. 1982, 1995; Moreira et al. 1997), but lower than the
values of 41 to 74% observed in lower montane forests in Jamaica (Hafkensheid
2000) and Puerto Rico (Schellekens 2000).
The low ET found by the two methods in the Casuarina stand can be
explained by this stand's inability to recover transpiration rates after the end of the
drought (Chapter 2), and by the high runoff it generates. This stand, similar to other
stands of Casuarina throughout the preserve, has a very thick layer of litter and a very
dense root mat at the top of the soil, which probably results in a barrier for water
infiltration. Stands of other species of Casuarina were also found to transpire at low
rates (1 mm d- l in C. cunnighamiana, Morris and Collopy 1999), lower than those
estimated in areas with shallow saline water table, between 1.5 and 3 mm d- l, in
Australia (Cramer et al. 1999).
The Eucalyptus stand exhibited the highest levels ofET, mostly due to
relatively high transpiration rates. The sap flow measurements, however, suggest that
the stand-level transpiration in the Eucalyptus stand was lower than measurements on
the same genus made elsewhere. Robert and Rosier (1993) estimated transpiration of
young plantations ofE. camaldulensis or E. tereticornis in southern India from 1 mm
d- l during the dry season up to 6 mm d- l when soil moisture was high. Hunt and
125
Beadle (1998) estimated transpiration of 8-year-old E. nitens plantations to be
between 1.6 and 2.8 mm d-1. The relatively high transpiration rates (in comparison to
the available water) in the Eucalyptus stand may be explained by this stand's
relatively deep water uptake (Chapter 2), large basal area, and possible tree-level high
leaf-specific hydraulic conductivity, which allows high transpiration rates at low leaf
area (as discussed in Chapter 2).
The relatively high stand ET rates found in the Fraxinus stand were probably
a result of the combination of relatively deep water uptake, high leaf area index, and
the relatively high transpiration rates of Fraxinus trees (Chapter 2). Even though the
Fraxinus stand had higher leaf area index (LAI) than the Eucalyptus stand (Fig. 3.4),
its ET was slightly lower. Because the end ofthe 2001 dry season coincided with the
end of a 2l-month long dry period, Fraxinus, which usually loses leaves between
November and January in Hawaii, exhibited its lowest LAI in October 2001. In
normal years, when the difference in LAI between the Fraxinus and the Eucalyptus
stands is larger, ET may reach similar values.
The estimated 40 cm depth of water uptake in the Casuarina stand made
during the calibration procedure of the water balance model was similar to the
estimates based on the hydrogen isotope data (Chapter 2). On the other hand, while
the isotope method suggested that water uptake in the Eucalyptus and in the Fraxinus
stands occurred in the soil profile down to 40 and at least 75 cm, respectively, the
calibration of the water balance model suggested these depths to be 55 and 50 cm,
respectively. The water balance model estimates for depth of water uptake seem to
agree better with the depth of water uptake indicated by the soil moisture profiles in
126

Fig. 2.2. As discussed in section 2.5, the depth of water uptake in Eucalyptus could
have been underestimated due to the possible collection of non-sapwood water for the
isotope measurement.
4.5.2. Evapotranspiration vs. potential evapotranspiration
The TVAR method was the most appropriate of the three methods used to
test the hypothesis that ET is higher than the energy available through radiation, as
found in other oceanic islands (Waterloo et al. 1999, Schellekens 2000). However,
the lack of measurements high above the canopy resulted in ET estimates that did not
seem reliable as it resulted in several days with extremely negative or extremely
positive ET values. Consequently, I was unable to test the hypothesis that ET
measured directly was higher than previously estimated ET.
However, my PE data give some indication that ET underestimation might
have happened in previous studies. Potential evapotranspiration estimated from
measurements at our site was up to 25% higher than that estimated by Giambelluca
(1983), using data from few stations throughout the Pearl Harbor-Honolulu basin.
This could be due to the fact that my study period was dominated by a long drought,
maybe resulting in estimated values not representative of the long-term average.
Also, Giambelluca (1983) used average data for a large zone in contrast to localized
measurements done in my study. The hydrological gradients as elevation increases
are significant, and that could account for much of the difference.
127

As ET estimates are directly related to PE in the model used by Giambelluca
(1983), his study could have underestimated ET by up to 20%, and, consequently,
overestimated groundwater recharge.
4.5.3. Groundwater recharge and runoff
Groundwater recharge was estimated by the water balance method to be 12
mm i 1 for the Fraxinus stand and 0 mm i 1 for the Eucalyptus and Casuarina stands.
Due to the calibration of the model with field measurements of soil moisture, I expect
these estimates to have an associated error lower than 51 %, which was the estimated
error in groundwater recharge estimates by Giambelluca et al. (1996b) using the same
model on Oahu, for pineapple fields. These estimates were much lower than the
average annual recharge estimated by Giambelluca (1983), at 500 mm y-l, for the
same area. The difference between the estimates of the two studies is due to the lack
of available data for this area in Giambelluca's study, and due to the long drought that
my study period encompassed. However, the total rainfall in the year that this study
was conducted (591 to 665 mm) was within the long term annual rainfall range (540
to 750 mm, Giambelluca et al. 1986).
The lack of recharge by the Eucalyptus stand was due to the relatively high
ET rates estimated for this stand, mainly due to its transpiration rates. On the other
hand, the lack of recharge by the Casuarina stand was likely due to the high runoff
this stand generates. Runoff there was generated by rainfall events> 3.8 mm. This is
consistent with personal observations in the field that water does not infiltrate easily
in the soil of this stand. This low infiltration, and thus low soil moisture, may explain
128

the shallow depth of water uptake and low transpiration rates estimated for trees in
the Casuarina stand (Chapter 2). In contrast with Casuarina, runoff in the Fraxinus
and in the Eucalyptus stands was generated only by rainfall events 2: 50 mm, when
antecedent moisture conditions were high. A previous study in another Fraxinus
stand in Honouliuli (in the middle section, code 3088 from Table 1.1) estimated that
no runoff would be generated even with one-hour rainfall of 51 mm h-1 and return
interval of 10 years (Nagel 2003). In the same study, two stands of Eucalyptus
(middle and north, codes 3109 and 3128, respectively, Table 1.1) were found to
exhibit a water-repellency characteristic in over 50% of the soil sampled in the field.
This repellency caused runoff to be generated more frequently than for the Fraxinus
stand (Nagel 2003). The Eucalyptus stand ofthis study did not show obvious
evidence of being water repellent judging by the relatively low runoff it generated.
Based on the data from this study, it is more likely that the Casuarina stand may have
hydrophobic soil than the Eucalyptus stand.
4.5.4. The methods
The water balance method is a valuable tool to estimate ET and groundwater
recharge and requires very little information as input. The only information needed is
PE, rainfall, and a starting value of soil moisture. In this study, the validity of this
method was increased by having frequent soil moisture measurements that allowed
for a good model calibration. However, the uncertainties associated with the model
were not estimated in this study. The sources of uncertainties on the estimates of
groundwater recharge can derive from measurement errors of the input data
129

(precipitation, PE and soil moisture) and errors in estimating the model parameters
(Awe, depth of water uptake, crop factor). The measurement errors include
instrumentation precision, and spatial and temporal variability, while the estimated
parameters would be affected mostly by errors related to the soil moisture
measurements. The coefficient of variation of soil moisture in each stand of in
average between 27% and 40%, plus the lack of continuity in the data (because were
collected manually), missing measurements during the peak of rainfall events,
contributed to the errors involved in estimating the parameters of the model.
The main advantage of the TVAR method is that, besides net radiation, it
needs only data on temperature as input. Even though there is no need to level the
thermocouples above the canopy of the forest, which makes their installation
relatively convenient, it is difficult to place them high above the forest canopy. In the
Fraxinus stand, for example, the thermocouples were initially placed on a cable
running over the canopy of the forest, from a higher location on a ridge to a tall tree.
The cable was tightened as much as possible after installation, but the wind and the
tall-tree movement constantly lowered the height ofthe thermocouples. Later, the
thermocouples were moved to a 7.6-m pole, installed near the top of the ridge. The
canopy below this new position was probably not representative of the parts with
taller trees. A similar pole was installed in the Casuarina stand and the same kinds of
problems might have resulted in the high fluctuation of the data.
Several reasons might have contributed to the underestimation of ET by the
sap flow method. The small number of probes and trees probably caused high
cumulative errors in the scaling up process from the probe to the tree and from the
130

tree to the stand. Hatton et al. (1995) estimated these errors as higher than 38% of the
estimated stand transpiration, mostly due to the scaling from the probe to the tree.
Radial (James et al. 2002, Nadezhdina et al. 2002, Ford et al. 2004) and axial (Fig.
2.7, Hatton et al. 1995) variations of the sap flow within trees are the major source of
errors in estimating tree transpiration from sap flow measurements. Jimenez et al.
(1996) found radial variation in sap flow ranging from 3% to 31 % in Laurus trees. In
addition, sap flow in this study was measured in 3 to 6 trees per stand, or 5 to 7
sampling trees ha-1• Cermak et al. (1995) estimated scaling errors oftranspiration to
the stand of 15% and 22% for pine and spruce, respectively, using 12 sampling trees
ha-1. However, Hatton et al. (1995) estimated that a sample size of 8 trees would be
enough to reduce considerably the errors associated with the scaling from the tree to
the stand. The stand transpiration estimates in Honouliuli were based on
representative trees of the dominant canopy species, neglecting transpiration from
other canopy species and from the understory, which have contributed to the
underestimation ofET by this method. Roberts and Rosier (1994) estimated that 45%
of the annual transpiration of a Fraxinus excelsior stand came from the understory.
4.5.5. Implications ofreforestation on groundwater
Some planted forests do increase soil infiltration in relation to pastures (e.g.,
Wood 1977, Nagel 2003). However, forests are known to have higher ET rates than
pasture or short vegetation (e.g., Waterloo 1994, Jipp et al. 1998) probably due to
lower surface albedo, higher leaf area, higher aerodynamic roughness and deeper
water uptake in the forests versus shorter vegetation. In reforestation efforts in a dry
131

place like Honouliuli, preference should be given to species that have characteristics
that would contribute to more conservative water use and to increase infiltration. It is
very likely that the original forests in Honouliuli were a lot more adapted to the
weather conditions and water availability than the planted forests presently there.
Studies on the comparative physiology of native versus non-native plants in Hawaii
suggest that the former have lower growth and photosynthetic rates (Pattison et al
1998, Baruch and Goldstein 1999, Durand and Goldstein 2001), which would result
in more conservative water use. Moreover, the dominant native tree in some of the
remaining vegetation communities in the mesic forests of Honouliuli, Acacia koa,
was found to be able to adjust its water use efficiency according to water availability
in a gradient of rainfall and elevation on the island of Hawaii (Ares and Fownes
1999).
Fraxinus seemed to be the least negative species of the three, allowing some
water for groundwater recharge and generating very little runoff. This happens
probably because this species is has deep water uptake (Chapter 2), allows the
development of a dense understory, and is deciduous. Fraxinus loses leaves during
one month in the wet season in Hawaii, when ET rates are high. This may
compensate for the relatively high rates of transpiration and interception found in this
stand. Although Eucalyptus are often reported as high water consumers and as
having a detrimental ecological effect (e.g., Shiva and Bandyopadhyay 1983), this
study shows Casuarina to have a more negative effect in the watershed. Besides not
allowing water for groundwater recharge, the stand dominated by Casuarina
produced much higher surface runoff than the other stands. This may not only reduce
132

groundwater recharge in the basin but also increase the amount of nutrients
transported to the streams.
The relative contribution of the different hydrological components to the
water balance of forests is likely to change with time. Vertessy et al. (1998, as cited
by Bruijnzeel 2000), for example, observed that as the understory develops with the
aging of Eucalyptus regnans plantations, its transpiration forms a greater portion of
ET. This occurs concomitantly with a reduction in overstory transpiration and total
ET. At 50 to 70 years of age, the stands studied in Honouliuli still exhibit relatively
high ET rates and very little groundwater recharge. As these stands age it is likely
that ET rates will decrease and more water would be available for recharge, but the
time frame is unknown.
4.6. Conclusion
The stand dominated by Eucalyptus exhibited the highest ET rates followed
by the stand dominated by Fraxinus and by the stand dominated by Casuarina.
Evapotranspiration alone would not give accurate estimates of groundwater recharge
as runoff proved to be a considerable part of the water balance in the Casuarina
stand. The high runoff generated by this stand, at 190 mm it, not only resulted in no
groundwater recharge but may also cause erosion and an increase in the transport of
soil and nutrients to the streams. Of the three stands, the one dominated by Fraxinus
was considered to have the least negative effect on the watershed because it allowed
some water for recharge (12 mm y-t) and generated very little runoff (11 mm it).
The errors associated with these estimates can be up to 50% of the recharge estimates.
133

As recharge was so low, it is difficult to estimate the margin of error involved in the
estimates. In addition, the period measured in this study encompassed the end of a
long drought, which may explain the lack of groundwater recharge. Even though
groundwater recharge during years with normal rainfall is probably higher than the
estimated during my study period, during periods similar to the one study recharge is
probably close to zero, suggesting that these planted forests have not achieved the
desired goal of restoring and protecting groundwater recharge anticipated by
reforestation in the Waianae Mountains.
4.7. References
Ares, A. and J. Fownes. 1999. Water supply regulates structure, productivity, and
water use efficiency ofAcacia koa forest in Hawaii. Oecologia 121 :458-466.
Baruch, Z. and G. Goldstein. 1999. Leaf construction cost, nutrient concentration, and
net CO2 assimilation of native and invasive species in Hawaii. Oecologia
121:183-192.
Bigelow, S. 2001. Evapotranspiration modeled from stands of three broad-leaved
tropical trees in Costa Rica. Hydrological Processes 15: 2779-2796.
Bruijnzeel, L.A. 2000. Forest Hydrology. In: J. Evans (ed.) The Forests Handbook.
Blackwell Scientific, Oxford: 301-343 (Chapter 12).
Bultot, F., G. 1. Dupriez, and D. Gellens. 1990. Simulation ofland use changes and
impacts on the water balance: A case study for Belgium. Journal of Hydrology
114: 327-348.
Calder, I.R. 1998. Water use by forests, limits and controls. Tree Physiology 18: 625
631.
Cape, J.N., A.H.F. Brown, S.M.C. Robertson, G. Howson, and I.S. Paterson. 1991.
Interspecies comparisons of throughfall and stemflow at three sites in northern
Britain. Forest Ecology and Management 46: 165-177.
134

Cennak, J., E. Cienciala, J. Kucera, A. Lindroth and E. Bednarova. 1995. Individual
variation of sap-flow rate in large pine and spruce trees and stand transpiration: a
pilot study at the central NOPEX site. Journal of Hydrology 168: 17-27.
Choudhury, B. 1., R J. Reginato, and S. B. Idso. 1986. An analysis of infrared
temperature observations over wheat and calculation of latent heat flux.
Agricultural and Forest Meteorology 37: 75-88.
Cramer, V.A., P.J. Thorburn, and G.W. Fraser. 1999. Transpiration and groundwater
uptake from fann forest plots of Casuarina glauca and Eucalyptus camaldulensis
in saline areas of southeast Queensland, Australia. Agricultural Water
Management 39: 187-204.
DLNR. 1995. http://www.state.hi.us/dlnr/cwnn/data/db052201.pdf Data complied by
the U.S. Geological Survey and provided by the Hawaii State Department of
Land and Natural Resources, Commission on Water Resource Management.
Dunne, T. and L. B. Leopold. 1978. Water in Environmental Planning. W. H.
Freeman and Company, New York, 818 pp.
Durand, L. and G. Goldstein. 2001. Photosynthesis, photoinhibition, and nitrogen use
efficiency in native and invasive tree ferns in Hawaii. Oecologia 126:345-354.
Ford, C.R, M.A. McGuire, RJ. Mitchell, and RO. Teskey. 2004. Assessing variation
in the radial profile of sap flux density in Pinus species and its effect on daily
water use. Tree Physiology 24: 241-249.
Giambelluca, T. W. 1983. Water Balance of the Pearl Harbor-Honolulu Basin,
Hawaii, 1946-1975. Water Resources Research Center Technical Report 151,
151 p.
Giambelluca, T.W. 1986. Land-use effects on the water balance of a tropical island.
National Geographic Research 2(2): 121-151.
Giambelluca, T. W., M. A. Nullet, and T. A. Schroeder. 1986. Rainfall Atlas of
Hawaii. Report R76, Department of Land and Natural Resources, Honolulu, 267
pp.
Giambelluca, T.W. and D.S. Oki. 1987. Temporal disaggregation of monthly rainfall
data for water balance modeling. The of Climate Change and Climatic
135

Variability on the Hydrologic Regime and Water Resources (Proceedings of the
Vancouver Symposium, August 1987). IAHS Publ. 1688.
Giambelluca, T. W., L. T. Tran, A. D. Ziegler, T. P. Menard, and M. A. Nullet.
1996a. Soil-vegetation-atmosphere processes: Simulation and field
measurements for deforested sites in northern Thailand. Journal of Geophysical
Research 101(D20): 25,867-25,885.
Giambelluca, T.W., K. Loague, R.E. Green, and M.A. Nullet. 1996b. Uncertainty in
recharge estimation: impact on groundwater vulnerability assessments for the
Pearl Harbor Basin, O'ahu, Hawai'I, U.S.A. Journal of Contaminant Hydrology
23: 85-112.
Giambelluca, T. W., A.D. Ziegler, M. A. Nullet, D.M. Truong, and L.T. Tran. 2003.
Transpiration in a small tropical forest patch. Agricultural and Forest
Meteorology 117:1-22.
Granier, A. 1985. Une nouvell methode pour la mesure du flus de seve brute dans Ie
tronc des arbres. Annales des Sciences Forestieres 42: 193-200.
Granier, A. 1987. Evaluation of transpiration in a Douglas-fir stand by means of sap
flow measurements. Tree Physiology 3: 309-320.
Granier, A., P. Biron, N. Breda, J.Y. Pontailler, and B. Saugier. 1996. Transpiration
of trees and forest stands: short and long-term monitoring using sapflow methods.
Global Change Biology 2: 265-274.
Hafkenscheid, R. 2000. Hydrology and biogeochemistry of tropical montane rain
forests of contrasting stature in the Blue Mountains, Jamaica. Ph. D. dissertation.
Hatton, TJ., SJ. Moore, and P.H. Reece. 1995. Estimating stand transpiration in a
Eucalyptus populnea woodland with the heat pulse method: measurement errors
and sampling strategies. Tree Physiology 15: 219-227.
Hodnett, M. G., J. Tomasella, A. de O. Marques Filho, and M. D. Oyama. 1996.
Deep soil water uptake by forest and pasture in central Amazonia: Predictions
from long-term daily rainfall data using a simple water balance model. In:
Amazonian Deforestation and Climate (J. Gash, C. Nobre, J. Roberts, R.
Victoria, eds), John Wiley & Sons: 79-99.
136

Holscher, D., T. D. de A Sa, T. X. Bastos, M. Denich, and H. FoIster. 1997.
Evaporation from young secondary vegetation in eastern Amazonia. Journal of
Hydrology 193(1/4): 293.
Holwerda, F. 1997. A study of evaporation from a lowland and montane tropical
forest in the Luquillo mountains, Puerto Rico. Part of the project "Hydrological
modeling in a humid tropical island setting: with special reference to the Luquillo
Experimental Forest, Puerto Rico", working paper no. 3. Manuscript, 91 pp.
Hunt, M.A and C.L. Beadle. 1998. Whole-tree transpiration and water-use
partitioning between Eucalyptus nitens and Acacia dealbata weeds in a short
rotation plantation in northeastern Tasmania. Tree Physiology 18: 557-563.
James, S. A, M. J. Clearwater, F.C. Meinzer, and G. Goldstein. 2002. Heat
dissipation sensors of variable length for the measurement of sap flow in tree with
deep sapwood. Tree Physiology 22: 277-283.
Jimenez, M.S., J. Cermak, J. Kucera and D. Morales. 1996. Laurel forests in Tenerife,
Canary Islands: the annual course of sap flow in Laurus trees and stand. Journal
of Hydrology 183: 307-321.
Jipp, P.H., D.C. Nepstad, D.K. Cassel, and C.R. de Carvalho. 1998. Deep soil
moisture storage and transpiration in forests and pastures of seasonally-dry
Amazonia. Climatic Change 39: 395-412.
Jordan, C.F., and J. Heuveldop. 1981. The water budget of an Amazonian rain forest.
Acta Amazonica 11(1): 87-92.
Lean, J., and D.A. Warrilow. 1989. Simulation of the regional climatic impact of
Amazon deforestation. Nature 342: 411-413.
Leopoldo, P. R., W. K. Franken, E. Matsui, and E. Salati. 1982. Estimativa de
evapotranspira<;;ao de floresta amazonica de terra flrme. Sup!. Acta Amazonica
12: 23-28.
Leopoldo, P.R., W.K. Franken, and N.A Villa Nova. 1995. Real evapotranspiration
and transpiration through a tropical rain forest in central Amazonia as estimated
by the water balance method. Forest Ecology and Management 73: 185-195.
137

Lloyd, C.R, A.D. Culf, A.J. Dolman, and J.H.C. Gash. 1991. Estimates of sensible
heat flux from observations of temperature fluctuations. Boundary Layer
Meteorology 57: 311-322.
Moreira, M.Z., L. Sternberg, L. Martinelly, R. Victoria, E. Barbosa, L. Bonates, and
D. Nepstad. 1997. Contribution of transpiration to forest ambient vapor based on
isotopic measurements. Global Change Biology 3: 438-450.
Morris, J.D., and J.J. Collopy. 1999. Water use and salt accumulation by Eucalyptus
camaldulensis and Casuarina cunninghamiana on a site with shallow saline
groundwater. Agricultural Water Management 39: 205-227.
Nadezhdina, N., J. Cermak, and R Ceulemans. 2002. Radial patterns of sap flow in
woody stems of dominant and understory species: scaling errors associated with
positioning of sensors. Tree Physiology 22: 907-918.
Nagel, 1. 2003. The influence of non-native, monotypic forest plantations on soil
hydrologic properties within the Honouliuli Preserve, Oahu, Hawaii. Master
thesis, University of Hawaii, USA.
Pattison, R, G. Goldstein, and A. Ares. 1998. Growth, biomass allocation and
photosynthesis of invasive and native Hawaiian rainforest species. Oecologia
117:449-459.
Penman, H.L. 1948. Natural evaporation from open water, bare soils, and grass.
Proceedings of the Royal Society of London Series A, 193: 120-145.
Roberts, J. and P.T.W. Rosier. 1993. Physiological studies in young Eucalyptus
stands in southern India and derived estimates of forest transpiration.
Agricultural Water Management 24: 103-118.
Roberts, J. and P.T.W. Rosier. 1994. Comparative estimates of transpiration of ash
and beech forest at a chalk site in southern Britain. Journal of Hydrology 162:
229-245.
Salati, J., and C.A. Nobre. 1991. Possible climatic impacts of tropical deforestation.
Climatic Change 19: 177-196.
138

Schellekens, J. 2000. Hydrological processes in a humid tropical rain forest: A
combined experimental and modeling approach. Ph. D. dissertation, Vrije
Universiteit, Amsterdam, The Netherlands, 156 pp.
Schellekens, J., L.A. Bruijnzeel, F.N. Scatena, N.J. Bink, and F. Holwerda. 2000.
Evaporation from a tropical rain forest, Luquillo Ezperimental Forest, eastern
Puerto Rico. Water Resources Research 36(8): 2183-2196.
Shiva, V. and J. Bandyopadhyay. 1983. Eucalyptus - a disastrous tree for India. The
Ecologist 13(5): 184-187.
Shukla, J., and Y. Mintz. 1982. Influence ofland-surface evapotranspiration on the
Earth's climate. Science 215: 1498-1500.
Shukla, J., C. Nobre, and P. Sellers. 1990. Amazon deforestation and climate
change. Science 247: 1322-1325.
Thornthwaite, C.W. 1948. An approach toward a rational classification of climate.
Geographical Review 38(1): 55-94.
Thornthwaite, C.W. and J.R. Mather. 1955. The water balance. Publications in
Climatology 8(1), 104 pp.
Tillman, J.E. 1972. The indirect determination of stability, heat and momentum fluxes
in the atmospheric boundary layer from simple scalar variables during dry
unstable conditions. Journal of Applied Meteorology 11: 783-792.
Vugts, H.F., M.J. Waterloo, F.J. Beekman, K.F.A. Frumau, and L.A. Bruijnzeel.
1993. The temperature variance method: A powerful tool in the estimation of
actual evaporation rates. Hydrology of Warm Humid Regions (Proceedings of
the Yokohama Symposium, July 1993), IAHS Publication No. 216.
Waterloo, MJ. 1994. Water and Nutrient Dynamics of Pinus caribaea plantation
Forests on Former Grassland Soils in Southwest Viti Levu, Fiji. Ph.D.
Dissertation, University of Amsterdam, Netherlands.
Waterloo, MJ., L.A. Bruijnzeel, H.F. Vugts, and T.T. Rawaqa. 1999. Evaporation
from Pinus caribaea plantations on former grassland soil under maritime tropical
conditions. Water Resources Research 35: 2133-2144.
139

Wood, RB. 1977. Hydrologic differences between selected forested and agricultural
soils in Hawaii. Soil Science Society of America JoumaI41(l): 132-136.
140

Table 4.1 - Terms (in mm) in the water balance model for day i.
Terms
Precipitation
Potential Evapotranspiration
Wilting PointField Capacity
Available Water Capacity
Depth of water uptakeSoil Moisture
Runoff
Actual Evapotranspiration
Groundwater Recharge
Abbreviation
PE j
WPFC
AWC
ZAWi
Definition
Measured directly
Estimated based on eq. 4.1 (Penman 1948)
Equals AW at the end of the dry seasonEstimated based on model calibration
AWC=FC - WP
Estimated based on model calibrationBased on Xj = AWj_1 + (Pi - ROj- ETDAWi-1 measured in each forest site;If Xi :s 0, AWi = 0If 0 < Xi :s A Wz , A W j = XiIf Xi > AWz, AW i =AWz
AWz is the AW in the root zoneSCS Curve Number method (see text)
If AW 2': Cj, ETi = PEi;If AW < C, ETi = AWi X Cj-I x PEi ;
C j =f(Z, PE)Occurs when AWi > FC
Table 4.2 - Final curve numbers used to estimate runoff in the forest stands studied in
the Honouliuli Preserve between May 2001 and April 2002. See text for explanations
of how the antecedent moisture condition (AMC) class was determined for each
period.
Casuarina glauca
Eucalyptus robusta
Fraxinus uhdei
AMCI
70
22
18
141
AMCII
85
40
35
AMC III
94
60
55

Table 4.3 - Precipitation and estimated values of runoff, evapotranspiration and
groundwater recharge (all in mm) in the forest stands from May 5, 2001, to April 27,
2002. Runoff was estimated using the u.s. Soil Conservation Service curve number
method (Dunne and Leopold 1978). Evapotranspiration and groundwater recharge
were estimated using the bookkeeping water balance method.
Casuarina
Eucalyptus
Fraxinus
Precipitation
581.5
655.7
651.2
Runoff
186.5
19.4
11.2
142
Evapotranspiration
375.0
619.7
592.9
Recharge
o
o
11.9

••
800
G =-10.9 + 0.088Rnet
( =0.75 P < 0.0001
1000
••
600400
Rnet
(W m-2)
• •
200
••
•••
•
• •• ••••
o
••
80
60
40
20..--.~
ES 0"-"
(?-20
-40
-60
-80
Figure 4.1 - Relationship between half-hourly measurements of soil heat flux (G) and
net radiation (Rnet) in the Brazilian Cerrado from August 29 to October 16,2001
(Giambelluca et aI., unpublished).
143

61------------;:===========:::;----~
5
, 4"0
E5g: 3
2
--<>--~-
--0-
1946-1975CasuarinaEucalyptusFraxinus
May Jun Jul Aug Sep Oct Nov Dec Jan Feb Mar Apr
Figure 4.2 - Comparison of mean daily potential evapotranspiration (PE) per month
estimated with Penman (1948) equation from May 2001 to April 2002, above the
canopy of three forest plantations, and the estimated by Giambelluca (1983) for the
years 1946 through 1975, adjusted for dry forest cover.
144
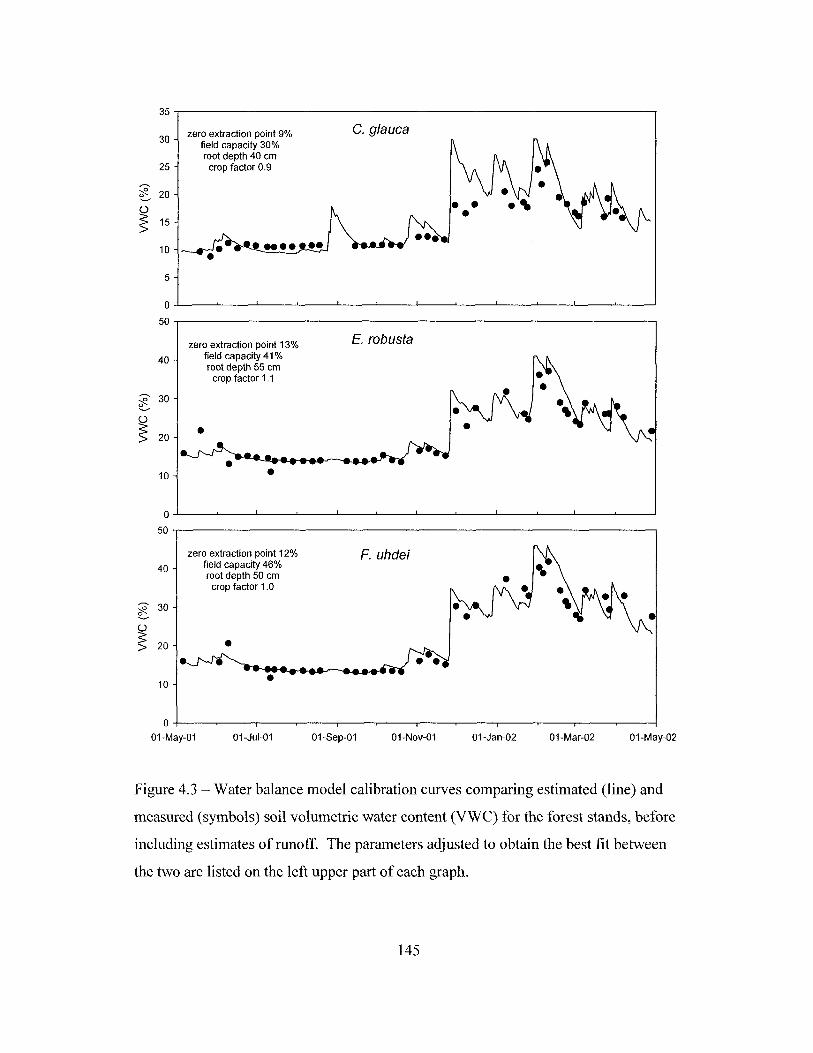
35
30zero extraction point 9%
field capacity 30%root depth 40 em
25 crop factor 0.9
;? 20~
~ 15
10
5
0
50
zero extraction point 13%
40 field capacity 41 %root depth 55 cm
crop factor 1.1
;? 30~
~ •20
•10 •
C. glauca
E. robusta
O...L-__'--_--'-__--'-__-'--_----'__---'--__-'--__l.....-_--'-__--'----__.L-_--'
50.,------------------------------------,
40
;? 30~
~ 20
10
zero extraction point 12%field capacity 46%root depth 50 cmcrop factor 1.0
••
F. uhdei
01-May-0201-Mar-0201-Jan-0201-Nov-0101-Sep-0101-Jul-01
O+--~--_r_--..---__._--...,--____,--~--.__---,.--.__-----,---1
01-May-01
Figure 4.3 - Water balance model calibration curves comparing estimated (line) and
measured (symbols) soil volumetric water content (VWC) for the forest stands, before
including estimates of runoff. The parameters adjusted to obtain the best fit between
the two are listed on the left upper part of each graph.
145
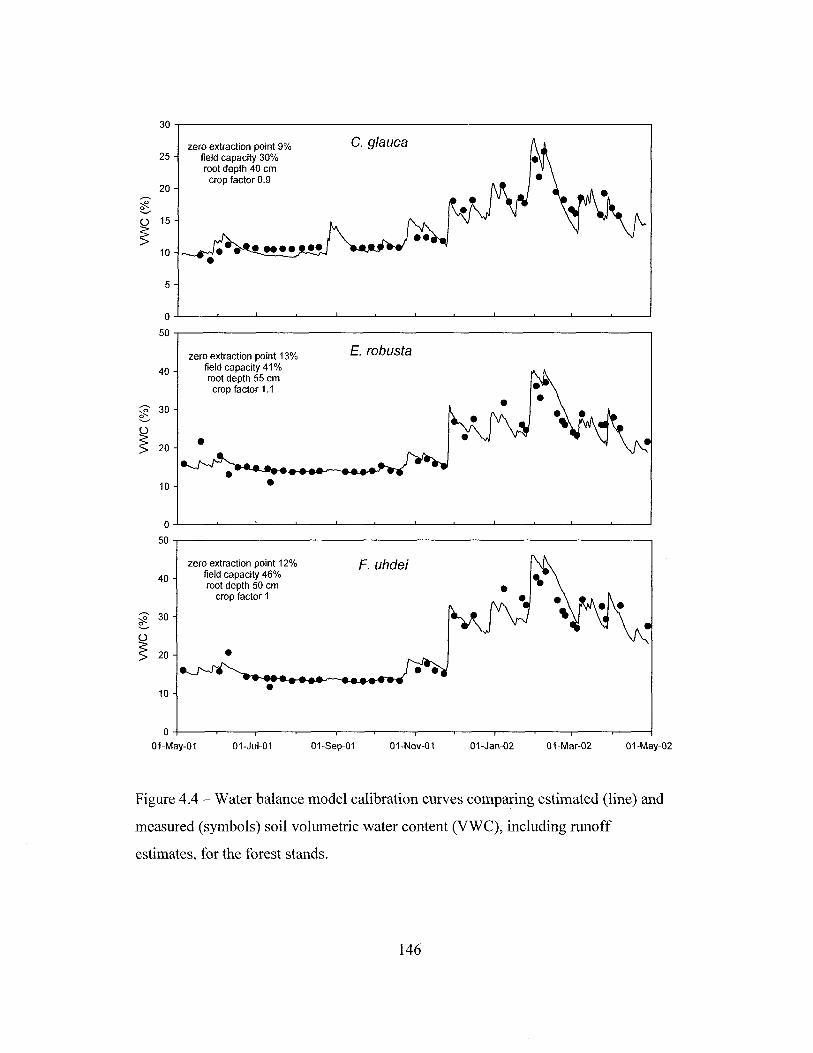
30
zero extraction point 9% C. glauca25 field capacity 30%
root depth 40 cm
20crop factor 0.9
~e-.
~15
10
5
0
50
zero extraction point 13% E. robusta
40 field capacity 41 %root depth 55 cmcrop factor 1.1
.--. 30~.....--0
~ 20 •
10 •0
50
zero extraction point 12% F. uhdei40 field capacity 46%
root depth 50 cmcrop factor 1
.--. 30~e-.0
~ 20 •10 •
0
01-May-01 01-Jul-01 01-Sep-01 01-Nov-01 01-Jan-02 01-Mar-02 01-May-02
Figure 4.4 - Water balance model calibration curves comparing estimated (line) and
measured (symbols) soil volumetric water content (VWC), including runoff
estimates, for the forest stands.
146

5-r--------------------------------,
4
o
-¢--- C. glauca~ E. robusta--D- F. uhdei
MayOl JunOl JulOl AugOl SepOl OctO1 NovOl DecOl Jan02 Feb02 Mar02 Apr02 May02
Figure 4.5 - Evapotranspiration estimated by the water balance method (ETWB) in
stands dominated by Casuarina glauca, Eucalyptus robusta and Fraxinus uhdei
between May 5, 2001 and April 28, 2002.
147

25
20 C. glauca stand
15
10
5
0
-5
-10
-15.--..,...~ -20EE-
o:: 20 F. uhdei stand~
I- 15W
10
5
0
-5
-10
-15
-20
0 5 10 15 20 25
PE (mm d-1)
Figure 4.6 - Comparison of half-hourly estimates between potential
evapotranspiration (PE) and canopy evaporation during daytime periods with no rain
(ETTVAR) for stands dominated by Casuarina glauca and Fraxinus uhdei, between
June and November 2001. The lines indicate equality ofETrvAR and PE.
148

3.5 ~-------------------------------,
3.0
2.5
~
'c 2.0
E.s 1.5u..(/)
~
w 1.0
0.5
0.0
--<>- C. glauca~ E. robusta-0- F. uhdei
09-Mar-02 12-Mar-02 15-Mar-02 18-Mar-02 21-Mar-02 24-Mar-02
Figure 4.7 - Daily evapotranspiration estimated by the sap flow method (ETSF) in
stands dominated by Casuarina glauca, Eucalyptus robusta, or Fraxinus uhdei in
March 2002. There were two rainfall events of 10 to 15 mm each on March 13 and
16.
149

3.0
2.5C. glauca -e- water balance
-0- sap flow
~ 2.0
'0E 1.5.s-f-w 1.0
0.5
0.0
5
E. robusta4
~ 3'0E
2.s-f-w
Q:0
5
4F. uhdei
3
'02
E.s-f-w
0
-1
May-01 Jul-01 Sep-01 Nov-01 Jan-02 Mar-02 May-02
Figure 4.8 - Comparison of evapotranspiration (ET) estimated by the water balance
(WB) and by the sap flow (SF) methods, in three forest stands in the Honouliuli
Preserve dominated by Casuarina glauca, Eucalyptus robusta or Fraxinus uhdei.
Symbols represent mean daily ET in each month and bars represent standard errors.
150

1.4
§1.2 -0- SF
1.0
~
!o 0.8ESI- 0.6UJ
0.4
0.2
0.0
13-May-01 16-May-01 19-May-01 22-May-O1 25-May-01 28-May-01
Figure 4.9 - Daily evapotranspiration (ET) in the Eucalyptus robusta stand estimated
by the water balance (WB) and the sap flow (SF) methods in May 2001.
151

C. glauca
F M ASON 0 JJM J
20
140
160 -.--------------ll~ET -Eil _c:::::J El-P-PE
~ 120E5 100..ci5.. 80Q)
"tJ
.m 60ro:5: 40
E. robusta200 -,-------------------------,
180
160
E 140
5120..ci5..100Q)
~ 802ro:5:
20
o .j-L--L.,f-'--'---t--L-.4-.L.....J.+-Jc:l..+-'----J-r-J----'--f-'-.L+...I.-J4--L.....l--+--l~-f-L_L..j
M J J A SON 0 J F M A
160 r----------------------.
140
~ 120E5 100..ci5.. 80Q)
"tJ... 60~:5: 40
20
F. uhdei
M J J A SON D J F M A
Figure 4.10 - Precipitation (P) and estimated potential evapotranspiration (PE),
evapotranspiration (ET), and interception (Ei) in the forest sites studied from May 5,
2001 to April 28, 2002. ET was estimated by the water balance method and is
represented in the graph by the whole length of the bars.
152

5. Conclusions and implications for groundwater recharge and
watershed restoration projects in Hawaii
This research aimed to primarily answer three important questions regarding
the hydrology of mesic tropical forests dominated by non-native tree species in
Hawaii: (1) Are there differences in the components of the water cycle of forests
characterized by different species? (2) How do measurements of evapotranspiration
compare to values obtained previously? and (3) Do forests dominated by different
species differ in their potential to recharge groundwater? In this chapter, I will revisit
these questions posed in Chapter 1 and will also discuss the implications of this
research for groundwater and watershed management in Hawaii.
5.1. Are there differences in the components of the water cycle of forests
dominated by different species?
The main components of the water cycle studied in this project were rainfall,
throughfall, stemflow, interception, tree transpiration, evapotranspiration, and soil
moisture. Rainfall was measured in five locations, near the forest stands studied. The
most systematic comparison among stands dominated by different species was done
for throughfall, stemflow and interception, in a study using three replicates of stands
dominated by each of four species: Eucalyptus robusta, Fraxinus uhdei, Casuarina
glauca and Grevillea robusta. The remaining components were measured in one
stand dominated by each of the first three species.
153

Throughfall represented over 95% of the water that reached the forest floor in
the Honouliuli tree plantations. On an annual basis, interception and throughfall did
not differ among stands of different species composition. However, within sections
of the preserve, throughfall, and consequently interception, was significantly different
in stands dominated by Fraxinus than in the other stands. In the northern section of
the Honouliuli Preserve, throughfall measured in two-week intervals was higher in
the Fraxinus stand than in the other stands, and, in the southern section, throughfall
measured during each rainfall event was lower in the Fraxinus than in the other
stands. Interestingly, the detection ofthis difference depended on the temporal scale
of the measurements. In the southern section, no differences among the stands were
observed in the accumulated throughfall measured in two-week intervals. This
suggests that the observed differences in throughfall among stands dominated by
different species on an event basis, although biologically relevant, are rather
insignificant when estimating the forest annual water budget or groundwater
recharge.
Stemflow was 1 to 4% ofannual rainfall in the stands studied in Honou1iuli,
and was significantly different between stands dominated by Fraxinus and Grevillea.
Stands dominated by Fraxinus generated approximately twice as much stemflow as
stands dominated by Grevillea, probably due in large part to the very low tree density
found in the Grevillea stands compared to the Fraxinus stands. Even though
stemflow usually constitutes a small part of the water cycle, in dry forests such as the
ones in Honouliuli, this water added to the system in a non-random fashion may
allow species to compete differently for water and for the nutrients in this water.
154

Tree transpiration and depth of water uptake were determined in one stand
each dominated by Eucalyptus, Fraxinus and Casuarina. There were no differences
in the transpiration of trees of same basal area among the three species. However,
stand-level evapotranspiration (ET) was almost two times higher in the stands
dominated by Eucalyptus and Fraxinus than in the stand dominated by Casuarina.
Evapotranspiration in the Casuarina stand increased by a factor of four from the
middle of the dry season until two to three months after the wet season started,
whereas in Fraxinus and Eucalyptus stands, ET showed a six-fold increase in the
same period. The high ET rates detected in Fraxinus can be attributed to the high leaf
area index of stands dominated by this species (0.5 to 2 m2m'2 higher than in stands
dominated by the other species) and to its deep pattern of water uptake. Based on the
natural abundance of stable isotopes of hydrogen, water uptake by Fraxinus trees
occurred in the soil profile deeper than 75 cm, whereas for Casuarina and
Eucalyptus, it was shallower than 40 and 60 cm, respectively. However, ET rates
were equally high in the Eucalyptus stand, when compared to the Fraxinus stand,
even though the stand dominated by Eucalyptus exhibited lower leaf area index and
shallower water uptake. This suggests that Eucalyptus probably exhibits higher leaf
specific hydraulic conductivity than Fraxinus, being able to maintain high
transpiration rates at low leaf area levels.
Soil moisture in the wet season in the stand dominated by Casuarina was
half of that in the stands dominated by Eucalyptus or Fraxinus, possibly a result of
high surface runoff. The soil moisture in the stand dominated by Fraxinus exhibited
155

the largest difference between seasons of the three stands, especially in the deeper
layers, reflecting the deeper pattern of water uptake of this species.
In sum, stands dominated by Fraxinus and by Eucalyptus exhibited higher
interception, higher leaf area index, deeper water uptake, and larger changes in soil
moisture between seasons in the root zone than stands dominated by Casuarina.
These characteristics resulted in higher ET rates in the two stands than in the
Casuarina stand, observed as the rains resumed after a long period of drought in
Honouliuli.
5.2. How do direct measurements of evapotranspiration compare to
previous estimates?
This question could not be answered by this study. The temperature variance
method chosen to measure ET failed to give reliable results. Due to the difficulty in
placing the thermocouples high above the canopy of the forests in Honouliuli, the
temperature data showed high fluctuations, resulting in extremely negative or
extremely positive estimated ET values.
Potential evapotranspiration (PE) estimated from data collected in Honouliuli
was up to 25% higher than estimated by Giambelluca (1983), indicating that ET could
have been underestimated in his study, which calculated ET based on PE.
Giambelluca's study was the most detailed study of the water balance of the Pearl
Harbor-Honolulu basin, where the Honouliuli Preserve is located, and was the basis
for subsequent groundwater recharge estimates for the southern Oahu area (Shade and
Nichols 1996).
156

Even though the few dry areas like Honouliuli do not substantially affect the
water balance of the basin, it is possible that ET higher than predicted occurs in
wetter areas that receive additional non-solar energy. Ekern (1983), for example,
found ET to be at least 19% higher than predicted through net radiation in high
rainfall areas of the Manoa Valley, and attributed that to the positive advection from
the urban areas nearby. A precise estimate ofET in southern Oahu is needed because
it is the main input in models estimating groundwater recharge to replenish the water
supply for greater Honolulu.
5.3. Do forests dominated by different species differ in their potential to
recharge groundwater?
The estimated values of groundwater recharge for stands dominated by
Casuarina, Eucalyptus and Fraxinus for the period between May 5, 2001, and April
27,2002, were 0, 0, and 11 mm, respectively. The spatial variation in the soil
moisture measurements and the calibration of the model may have resulted in an error
of30 to 40% in the groundwater estimates. The short duration of this project during
the end of a very dry period must have yielded values lower than usual, even though
the total annual rainfall was within the long-term annual rainfall range for the area
(Giambelluca et al. 1986). However, these values are much lower than the mean
annual recharge of 500 mm estimated by Giambdluca (1983) for the same area. The
low values of groundwater recharge found in this study deviate from the original
expectation that the reforestation efforts in the early 1900s in the Waianae Mountains
would increase groundwater recharge.
157

The low rate of groundwater recharge found in the forest stands studied
resulted from different aspects of each stand. In the Eucalyptus stand, the nil
groundwater recharge was due to high ET rates, whereas in the Casuarina stand, it
was due to high surface runoff. The Fraxinus stand showed slightly higher
groundwater recharge, with very low runoff values and high ET rates. Even though
there was only one replicate of the stands dominated by each species, the differences
in groundwater recharge among the stands can be attributed to a certain point to their
different species composition. The dominant species confers a particular structure to
the forest, such as leaf area, depth of water uptake, understory development, etc, that
may result in different ET or runoff rates. These two components of the water
balance have to be taken equally into account when managing groundwater recharge.
The Casuarina stand, for example, showed very little interception or transpiration,
resulting in a very low annual ET rate. However, the high runoff generated by this
stand left no water remaining for groundwater recharge. The structure of the stands
studied is very similar to other stands dominated by each of these species throughout
the Honouliuli Preserve (personal observation, Garrison 2003). The most striking
characteristics of the stands dominated by Casuarina, for example, are the extremely
low species diversity, lack of understory, and very thick layers oflitter and roots on
the top of the soil. The concentration of roots at the top of the soil and the lack of
understory could even be a consequence, and not a cause, of high runoff, but still
suggest that high runoff may be produced by these other stands. Similarly, stands of
Fraxinus throughout the preserve exhibit high leaf area index, high density of trees,
well developed understory and deep water uptake, which resulted in high ET and low
158

runoff rates. The Eucalyptus stands commonly exhibit high basal area, some
understory development, and moderately deep water uptake, which, together with
relatively high tree transpiration rates, result in relatively high ET rates.
The indication that forest species composition may have an effect on
groundwater recharge should be tested in a larger scale. The water balance method
appeared to yield reasonable results for the water balance of each stand, using simple
measurements such as micrometeorology in a reference site, and soil moisture within
the forest. These measurements would be relatively easy to take in forests throughout
the southern Oahu watersheds, and could yield more reliable estimates of
groundwater recharge, and useful information for reforestation plans and watershed
management.
5.4. Implications of this research for groundwater recharge and watershed
restoration in Hawai'i
Fresh water is the most important natural resource on oceanic islands,
especially those such as Oahu that have a high population density. Having an
accurate estimate of groundwater recharge is crucial to the economic and social
development of the island. The recharge estimates obtained in this dissertation
suggest that the forests widely planted in the Waianae Mountains to protect and
restore the watersheds actually facilitate very little or no groundwater recharge. Even
though the year when this study was conducted included the end of a long drought,
the total rainfall (591 to 665 mm) was within the long term annual rainfall range (540
to 750 mm, Giambelluca et al. 1986).
159

In addition to a possible overestimation of groundwater recharge by previous
studies (Giambelluca 1983, Shade and Nichols 1996), a disproportionate increase in
water consumption in relation to population growth on Oahu may result in an earlier
than projected shortage of groundwater for the island. Giambelluca (1983), for
example, estimated that the groundwater in the principal source of water supply for
the greater Honolulu area was sufficient to support a population increase of
approximately 450,000 from its number in 1983. The Honolulu County resident
population was 789,000 then, and is projected to be 1,030,000 by the year 2025
(DBEDT 2004), an increase of241,000 people. These projections generate an
optimistic scenario, where groundwater withdrawal would still be below its maximum
capacity for decades to come. However, water use on Oahu has increased at a much
higher rate than population increase. The Honolulu County population grew from
804,294 in 1985 to 876,156 in 2000, an increase of9% (DBEDT 2004). In the same
period, total fresh groundwater use in the Honolulu County increased from 358
million gallons per day (mgd) to 433 mgd, or 21 % (USGS 2004, Hutson et al. 2004).
In view of this, watershed and groundwater management projects on Oahu
need to be seriously reviewed. While reducing water consumption requires a lot of
political and economic motivation, increasing groundwater recharge by managing the
vegetation in the natural areas is a more viable alternative. The planting of fast
growing introduced species in the early 1900s was a decision based on the belief that
these species would reduce the high erosion rates and increase groundwater recharge.
Seventy years later, these forests maintain relatively high ET rates, some of them high
runoff, and most likely did not improve groundwater recharge. Before it was
160

deforested, the mesic Honouliuli area was probably dominated by shrubs and short
trees, which were likely more conservative water users than the fast-growing trees
planted in the reforestation efforts. When choosing species for reforestation, it is
necessary to take into account their effect on the water cycle, preferably by selecting
species that will impart a combination of low ET and low surface runoff rates to the
forest. These species, when planted in monospecific stands, probably provide a well
developed understory, average levels of leaf area index, average depth of water
uptake, and low transpiration rates.
5.5. References
DBEDT 2004. Hawaii Department of Business Economic, Development and
Tourism. http://www2.hawaii.gov/DBEDT/index.cfm
Ekern, P.C. 1983. Measured evaporation in high rainfall areas, leeward Ko'olau
Range, O'ahu, Hawai'i. Water Resources Research Center Technical Report 156,
University ofHawaii at Manoa, Honolulu, Hawaii, USA, 60 pp.
Garrison, J. 2003. The role of alien tree plantations and avian seed-dispersers in
native dry forest restoration in Hawai'i. Ph.D. dissertation, University of Hawaii
at Manoa, USA, 370 pp.
Giambelluca, T.W. 1983. Water Balance of the Pearl Harbor-Honolulu Basin,
Hawaii, 1946-1975. Water Resources Research Center Technical Report 151,
151p.
Giambelluca, T. W., M. A. Nullet, and T. A. Schroeder. 1986. Rainfall Atlas of
Hawaii. Report R76, Department of Land and Natural Resources, Honolulu, 267
pp.
Hutson, S., N. Barber, J. Kenny, K. Linsey, D. Lumia, and M. Maupin. 2004.
Estimated use of water in the United States in 2000. United States Geological
Survey Circular 1268. http://water.usgs.gov/pubs/circ/2004/circ1268/
161

Shade, P., and W.D. Nichols. 1996. Water Budget and the Effects of Land-Use
Changes on Ground-Water Recharge, Oahu, Hawaii. Regional Aquifer-System
Analysis, United States Geological Survey Professional Paper 1412-C, 38 p.
USGS 2004. Water use in the United States. United States Geological Survey,
http://water.usgs. gov/watuse/
162

6. Literature cited
Aboal, J.R., M.S. Jimenez, D. Morales, and J.M. Hernandez. 1999. Rainfall
interception in laurel forest in the Canary Islands. Agricultural and Forest
Meteorology 97:73-86.
Andersson, T. 1990. Influence of stemflow and throughfall from common oak
(Quercus robur) on soil chemistry and vegetation patterns. Canadian Journal of
Forest Research 21: 917-924.
Andrade, J.1., F.C. Meinzer, G. Goldstein, N.M. Holbrook, J. Cavelier, P. Jackson,
and K. Silvera. 1998. Regulation of water flux through trunks, branches, and
leaves in trees ofa lowland tropical forest. Oecologia. 115: 463-471.
Anthony, S.S. 1997. Evaluation of the US Geological Survey Ground-Water Data
Collection Program in Hawaii, 1992. United States Geological Survey, Water
Resources Investigations Report 97-4232.
Ares, A., and J. Fownes. 1999. Water supply regulates structure, productivity, and
water use efficiency ofAcacia koa forest in Hawaii. Oecologia 121: 458-466.
Asner, G., W. Garnett, and B.F. Morgan. 1993. Biological Inventory Report
Honouliuli Preserve.
Barnes, C.J. and G.B. Allison. 1984. The distribution of deuterium and 180 in dry
soils. 3. Theory for non-isothermal water movement. Journal of Hydrology 74:
119-135.
Barritt, A.R., and J.M. Facelli. 2001. Effects of Casuarina pauper litter and grove soil
on emergence and growth of understorey species in arid lands of South Australia.
Journal of Arid Environments 49: 569-579.
Baruch, Z., and G. Goldstein. 1999. Leaf construction cost, nutrient concentration,
and net C02 assimilation of native and invasive species in Hawaii. Oecologia 121:
183-192.
Bigelow, S. 2001. Evapotranspiration modeled from stands of three broad-leaved
tropical trees in Costa Rica. Hydrological Processes 15: 2779-2796.
163

Bruijnzeel, L.A. 1996. Predicting the hydrological impacts ofland cover
transformation in the humid tropics: the need for integrated research. In:
Amazonian Deforestation and Climate (1. Gash, C. Nobre, J. Roberts, R. Victoria,
eds), John Wiley & Sons: 15-55.
Bruijnzeel, L.A. 1997. Hydrology of forest plantations in the tropics. In: Management
of Soil, Nutrients and Water in Tropical Plantation Forests (E. K. S. Nambiar, A.
G. Brown, eds), ACIAR, CSIRO (Australia) and CIFOR (Indonesia): 125-167.
Bruijnzeel, L.A. 2000. Forest Hydrology. In: J. Evans (ed.) The Forests Handbook.
Blackwell Scientific, Oxford: 301-343 (Chapter 12).
Bucci, SJ., G. Goldstein, F.C. Meinzer, A. Franco, P. Campanello, and F. Scholz. In
press. Mechanisms contributing to seasonal homeostasis of minimum leaf water
potential and predawn disequilibrium between soil and plant water potential in
Neotropical savanna trees. Trees.
Bultot, F., G.L. Dupriez, and D. Gellens. 1990. Simulation ofland use changes and
impacts on the water balance: A case study for Belgium. Journal of Hydrology
114: 327-348.
Burgess, S.S.O., M.A. Adams, N.C. Turner, and B. Ward. 2000. Characterisation of
hydrogen isotope profiles in an agroforestry system: implications for tracing water
sources of trees. Agricultural Water Management 45(3):229-241.
Burgess, S.S.O., Adams M.A., Turner N.C., White, D.A., and Ong, C.K. 2001. Tree
roots: conduits for deep recharge of soil. Oecologia 126, 158-165.
Calder, LR. 1998. Water use by forests, limits and controls. Tree Physiology 18: 625
631.
Calder, LR. 2000. Land use impacts on water resources. Land-Water Linkages in
Rural Watersheds Electronic Workshop, 18 September - 27 October 2000, Food
and Agriculture Organization of the United Nations, Rome, Italy, 26 pp.
Caldwell, M.M., and Richards, J.R. 1989. Hydraulic lift: water efflux from upper
roots improves effectiveness of water uptake by deep roots. Oecologia 79: 1-5.
164

Canadell, 1., R.B. Jackson, J.R. Ehleringer, H.A. Mooney, O.E. Sala, and E.-D.
Schulze. 1996. Maximum root depth of vegetation types at the global scale.
Oecologia 108: 583-595.
Cape, J.N., AH.F. Brown, S.M.C. Robertson, G. Howson, and I.S. Paterson. 1991.
Interspecies comparisons of throughfall and stemflow at three sites in northern
Britain. Forest Ecology and Management 46: 165-177.
Cermak, J., E. Cienciala, J. Kucera, A Lindroth and E. Bednarova. 1995. Individual
variation of sap-flow rate in large pine and spruce trees and stand transpiration: a
pilot study at the central NOPEX site. Journal ofHydrology 168: 17-27.
Choudhury, B. J., R. J. Reginato, and S. B. Idso. 1986. An analysis of infrared
temperature observations over wheat and calculation of latent heat flux.
Agricultural and Forest Meteorology 37: 75-88.
Clearwater, MJ., F.C. Meinzer, J.L. Andrade, G. Goldstein, and N. M. Holbrook.
1999. Potential errors in measurement of non-uniform sap flow using heat
dissipation probes. Tree Physiology 19(10): 681.
Cramer, V.A, P.J. Thorburn, and G.W. Fraser. 1999. Transpiration and groundwater
uptake from farm forest plots of Casuarina glauca and Eucalyptus camaldulensis
in saline areas of southeast Queensland, Australia. Agricultural Water
Management 39: 187-204.
Crockford, R.H., D.P. Richardson, and R. Sageman. 1996a. Chemistry of rainfall,
throughfall and stemflow in a eucalypt forest and a pine plantation in south
eastern Australia: 2. Throughfall. Hydrological Processes 10: 13-24.
Crockford, R.H., D.P. Richardson, and R. Sageman. 1996b. Chemistry of rainfall,
throughfall and stemflow in a eucalypt forest and a pine plantation in south
eastern Australia: 3. Stemflow and total inputs. Hydrological Processes 10: 25
42.
David, T.S., M.1. Ferreira, J.S. David, and J.S. Pereira. 1997. Transpiration from a
mature Eucalyptus globules plantation in Portugal during a spring-summer period
of progressively higher water deficit. Oecologia 110: 153-159.
165
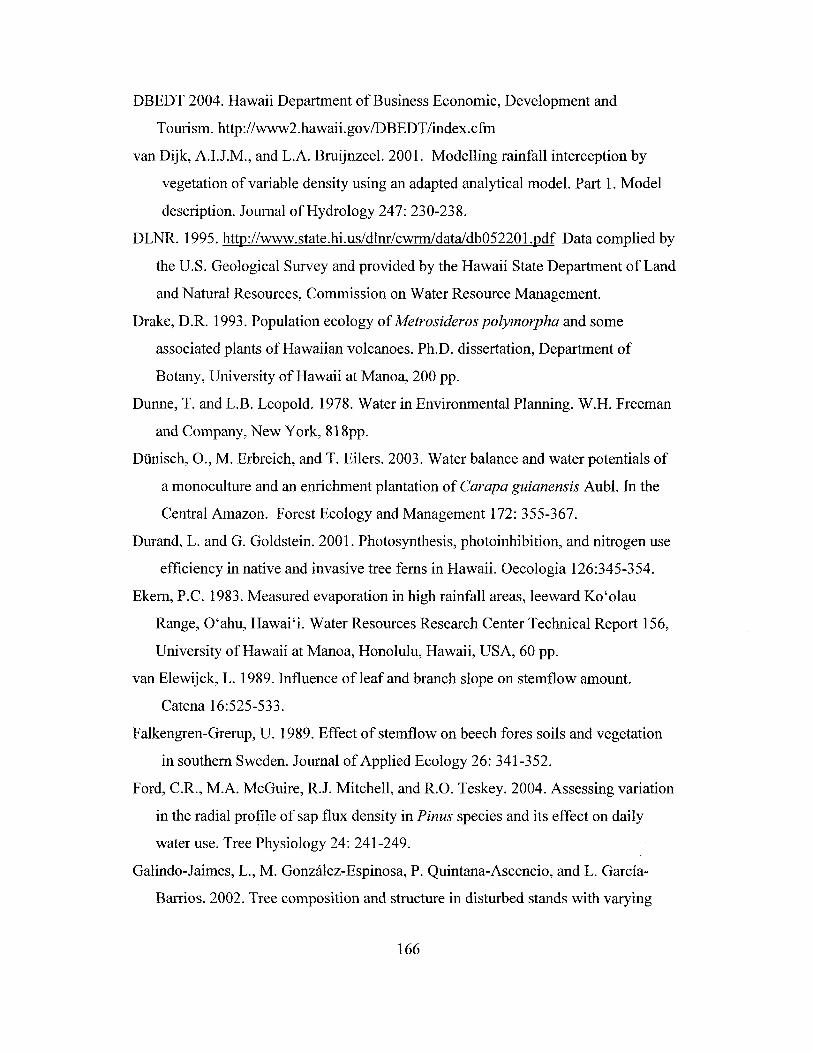
DBEDT 2004. Hawaii Department of Business Economic, Development and
Tourism. http://www2.hawaii.gov/DBEDT/index.cfm
van Dijk, ALJ.M., and L.A Bruijnzeel. 2001. Modelling rainfall interception by
vegetation of variable density using an adapted analytical model. Part 1. Model
description. Journal of Hydrology 247: 230-238.
DLNR. 1995. http://www.state.hi.us/dlnr/cwrm/data/db052201.pdf Data complied by
the U.S. Geological Survey and provided by the Hawaii State Department of Land
and Natural Resources, Commission on Water Resource Management.
Drake, D.R. 1993. Population ecology of Metrosideros polymorpha and some
associated plants of Hawaiian volcanoes. Ph.D. dissertation, Department of
Botany, University of Hawaii at Manoa, 200 pp.
Dunne, T. and L.B. Leopold. 1978. Water in Environmental Planning. W.H. Freeman
and Company, New York, 818pp.
Dtinisch, 0., M. Erbreich, and T. Eilers. 2003. Water balance and water potentials of
a monoculture and an enrichment plantation of Carapa guianensis Aubl. In the
Central Amazon. Forest Ecology and Management 172: 355-367.
Durand, L. and G. Goldstein. 2001. Photosynthesis, photoinhibition, and nitrogen use
efficiency in native and invasive tree ferns in Hawaii. Oecologia 126:345-354.
Ekern, P.C. 1983. Measured evaporation in high rainfall areas, leeward Ko'olau
Range, O'ahu, Hawai'i. Water Resources Research Center Technical Report 156,
University ofHawaii at Manoa, Honolulu, Hawaii, USA, 60 pp.
van Elewijck, L. 1989. Influence of leaf and branch slope on stemflow amount.
Catena 16:525-533.
Falkengren-Grerup, U. 1989. Effect of stemflow on beech fores soils and vegetation
in southern Sweden. Journal of Applied Ecology 26: 341-352.
Ford, C.R., M.A McGuire, R.J. Mitchell, and R.O. Teskey. 2004. Assessing variation
in the radial profile of sap flux density in Pinus species and its effect on daily
water use. Tree Physiology 24: 241-249.
Galindo-Jaimes, L., M. Gonzalez-Espinosa, P. Quintana-Ascencio, and L. Garcia
Barrios. 2002. Tree composition and structure in disturbed stands with varying
166

dominance by Pinus spp. in the highlands of Chiapas, Mexico. Plant Ecology 162:
259-272.
Garrison, J. 2003. The role of alien tree plantations and avian seed-dispersers in
native dry forest restoration in Hawai'i. Ph.D. dissertation, University of Hawaii
at Manoa, USA, 370 pp.
Giambelluca, T.W. 1983. Water Balance of the Pearl Harbor-Honolulu Basin,
Hawaii, 1946-1975. Water Resources Research Center Technical Report 151,
151p.
Giambelluca, T.W. 1986. Land-use effects on the water balance of a tropical island.
National Geographic Research 2(2): 121-151.
Giambelluca, T.W., M.A. Nullet, and T.A. Schroeder. 1986. Rainfall Atlas of Hawaii.
Report R76, Department of Land and Natural Resources, Honolulu, 267 pp.
Giambelluca, T.W. and D.S. Oki. 1987. Temporal disaggregation of monthly rainfall
data for water balance modeling. The of Climate Change and Climatic
Variability on the Hydrologic Regime and Water Resources (Proceedings of the
Vancouver Symposium, August 1987). IAHS Publ. 1688.
Giambelluca, T.W., L.T. Tran, A.D. Ziegler, T.P. Menard, and M.A. Nullet. 1996a.
Soil-vegetation-atmosphere processes: Simulation and field measurements for
deforested sites in northern Thailand. Journal of Geophysical Research 101(D20):
25,867-25,885.
Giambelluca, T.W., K. Loague, R.E. Green, and M.A. Nullet. 1996b. Uncertainty in
recharge estimation: impact on groundwater vulnerability assessments for the
Pearl Harbor Basin, O'ahu, Hawai'I, U.S.A. Journal of Contaminant Hydrology
23: 85-112.
Giambelluca, T. W., A.D. Ziegler, M. A. Nullet, D.M. Truong, and L.T. Tran. 2003.
Transpiration in a small tropical forest patch. Agricultural and Forest
Meteorology 117:1-22.
Goldstein, G., J.L. Andrade, F.C. Meinzer, N.M. Holbrook, J. Cavelier, P. Jackson,
and A. Celis. 1998. Stem water storage and diurnal patterns of water use in
tropical forest canopy trees. Plant, Cell and Environment 21: 397-406.
167

Granier, A 1985. Dne nouvell methode pour la mesure du flus de seve brute dans Ie
tronc des arbres. Annales des Sciences Forestieres 42: 193-200.
Granier, A 1987. Evaluation oftranspiration in a Douglas-fir stand by means of sap
flow measurements. Tree Physiology 3: 309-320.
Granier, A, R Huc, and S.T. Barigah. 1996a. Transpiration of natural rain forest and
its dependence on climatic factors. Agricultural and Forest Meteorology 78: 19
29.
Granier, A., P. Biron, N. Breda, J.Y. Pontailler, and R Saugier. 1996b. Transpiration
of trees and forest stands: short and long-term monitoring using sapflow methods.
Global Change Biology 2: 265-274.
Hafkenscheid, R. 2000. Hydrology and biogeochemistry of tropical montane rain
forests of contrasting stature in the Blue Mountains, Jamaica. Ph. D. dissertation.
Haggar, 1. P., and J. J. Ewel. 1997. Primary productivity and resource partitioning in
model tropical ecosystems. Ecology 78(4): 1211-1221.
Hanchi, A and M. Rapp. 1997. Stemflow determination in forest stands. Forest
Ecology and Management 97: 231-235.
Harrington, RA., and J.J. Ewel. 1997. Invasibility of tree plantations by native and
non-indigenous plant species in Hawaii. Forest Ecology and Management 99:
153-162.
Hatton, T.J., S.J. Moore, and P.H. Reece. 1995. Estimating stand transpiration in a
Eucalyptus populnea woodland with the heat pulse method: measurement errors
and sampling strategies. Tree Physiology 15: 219-227.
Hatton, T., P. Reece, P. Taylor, and K. McEvan. 1998. Does leaf water efficiency
vary among eucalypts in water-limited environments? Tree Physiology 18: 529
536.
Haydon, S.R, RG. Benyon, and R. Lewis. 1996. Variation in sapwood area and
throughfall with forest age in mountain ash (Eucalyptus regnans F.Muell.).
Journal of Hydrology 187: 351-366.
Heath, J.A., and RJ. Huebert. 1999. Cloudwater deposition as a source of fixed
nitrogen in a Hawaiian montane forest. Biogeochemistry 44: 119-134.
168

Helvey, J.D., and J.H. Patrie. 1965. Canopy and litter interception of rainfall by
hardwoods of eastern United States. Water Resources Research 1(2): 193-206
Hodnett, M.G., J. Tomasella, A.de O. Marques Filho, and M.D. Oyama. 1996. Deep
soil water uptake by forest and pasture in central Amazonia: Predictions from
long-term daily rainfall data using a simple water balance model. In: Amazonian
Deforestation and Climate (J. Gash, C. Nobre, J. Roberts, R. Victoria, eds), John
Wiley & Sons: 79-99.
Holscher, D., T.D. de A. Sa, T.X. Bastos, M. Denich, and H. FoIster. 1997.
Evaporation from young secondary vegetation in eastern Amazonia. Journal of
Hydrology 193(1/4): 293.
Holscher, D., T.D. de A. Sa, R.F. Moller, M. Denich, and H. FoIster. 1998. Rainfall
partitioning and related hydrochemical fluxes in a diverse and in a mono specific
(Phenakospermum guyannense) secondary vegetation stand in eastern Amazonia.
Oecologia 114: 251-257.
Holwerda, F. 1997. A study of evaporation from a lowland and montane tropical
forest in the Luquillo mountains, Puerto Rico. Part of the project "Hydrological
modeling in a humid tropical island setting: with special reference to the Luquillo
Experimental Forest, Puerto Rico", working paper no. 3. Manuscript, 91 pp.
Huber, A., and A. Iroume. 2001. Variability of annual rainfall partitioning for
different sites and forest covers in Chile. Journal of Hydrology 248: 78-92.
Huenneke, L.F., and P.M. Vitousek. 1990. Seedling and clonal recruitment ofthe
invasive tree Psidium cattleianum: Implications for management of native
Hawaiian forests. Biological Conservation 53: 199-211.
Hunt, M.A., and C.L. Beadle. 1998. Whole-tree transpiration and water-use
partitioning between Eucalyptus nitens and Acacia dealbata weeds in a short
rotation plantation in northeastern Tasmania. Tree Physiology 18: 557-563.
Hutson, S., N. Barber, J. Kenny, K. Linsey, D. Lumia, and M. Maupin. 2004.
Estimated use of water in the United States in 2000. United States Geological
Survey Circular 1268. http://water.usgs.govIpubslcirc120041eire12681
169

Jackson, P.C., J. Cavelier, G. Goldstein, F.C. Meinzer, and N.M. Holbrook. 1995.
Partitioning of water resources among plants of a lowland tropical forest.
Oecologia 101: 197-203.
Jackson, P.C., F.C. Meinzer, M. Bustamante, G. Goldstein, A. Franco, P.W. Rundel,
L. Caldas, E. Igler, and F. Causin. 1999. Partitioning of soil water among tree
species in a Brazilian Cerrado ecosystem. Tree Physiology 19: 717-724.
Jacobi, J.D., and F.R. Warshauer. 1992. Distribution of six alien plant species in
upland habitats on the Island of Hawaii. In: C.P. Stone and J.T. Tunison (eds.)
Alien Plant Invasions in Native Ecosystems of Hawaii: Management and
Research. University of Hawaii Cooperative National Park Resources Studies
Unit, 155-188.
James, S.A., M.J. Clearwater, F.C. Meinzer, and G. Goldstein. 2002. Heat dissipation
sensors of variable length for the measurement of sap flow in tree with deep
sapwood. Tree Physiology 22: 277-283.
Jimenez, M.S., J. Cermak, J. Kucera and D. Morales. 1996. Laurel forests in Tenerife,
Canary Islands: the annual course of sap flow in Laurus trees and stand. Journal
ofHydrology 183: 307-321.
Jipp, P.H., D.C. Nepstad, D.K. Cassel, and C.R. de Carvalho. 1998. Deep soil
moisture storage and transpiration in forests and pastures of seasonally-dry
Amazonia. Climatic Change 39: 395-412.
Jordan, C.F., and J. Heuveldop. 1981. The water budget of an Amazonian rain forest.
Acta Amazonica 11(1): 87-92.
Lean, J., and D.A. Warrilow. 1989. Simulation of the regional climatic impact of
Amazon deforestation. Nature 342: 411-413.
Lemke, D.E. 1992. Schinus terebinthifolius (Anacardiaceae) in Texas. Phytologia 72:
42-44.
Leopoldo, P.R., W.K. Franken, E. Matsui, and E. Salati. 1982. Estimativa de
evapotranspirayao de floresta amazonica de terra firme. Supl. Acta Amazonica 12:
23-28.
170

Leopoldo, P.R., W.K. Franken, and N.A. Villa Nova. 1995. Real evapotranspiration
and transpiration through a tropical rain forest in central Amazonia as estimated
by the water balance method. Forest Ecology and Management 73: 185-195.
Levia, Jr., D.F., and E.E. Frost. 2003. A review and evaluation of stemflow literature
in the hydrologic and biogeochemical cycles of forested and agricultural
ecosystems. Journal of Hydrology 274: 1-29.
Lima, W.P. 1976. Interceptayao da chuva em povoamentos de eucalipto e de pinheiro.
IPEF, Piracicaba 13:75-90.
Lima, W.P. 1993. Impacto Ambiental do Eucalipto. Editora da Universidade de Sao
Paulo, 301 pp.
Little, E.L., and R.G. Skolmen. 1989. Common Forest Trees of Hawaii (Native and
Introduced), United States Department of Agriculture, Forest Service, Agriculture
Handbook No. 679, 321 pp.
Lloyd, C.R., A.D. Culf, A.J. Dolman, and J.H.C. Gash. 1991. Estimates of sensible
heat flux from observations of temperature fluctuations. Boundary Layer
Meteorology 57: 311-322.
Lopez-Serrano, F.R., T. Landete-Castillejos, J. Martinez-MilUm, and A. del Cerro
Barja. 2000. LAI estimation of natural pine forest using a non-standard sampling
technique. Agricultural and Forest Meteorology 101: 95-111.
Lugo, A. E. 1988. The future of the forest: Ecosystem rehabilitation in the tropics.
Environment 30(7): 17-20,41-45.
Mahendrappa, M.K. 1990. Partitioning of rainwater and chemicals into throughfall
and stemflow in different forest stands. Forest Ecology and Management 30:65
72.
Meinzer, F. C., J. H. Fownes, and R. A. Harrington. 1996. Growth indices and
stomatal control of transpiration in Acacia koa stands planted at different
densities. Tree Physiology 16: 607-615.
Meinzer, F.C., J.L. Andrade, G. Goldstein, N.M. Holbrook, J. Cavelier, and SJ.
Wright. 1999. Partitioning of soil water among canopy trees in a seasonally dry
tropical forest. Oecologia 121: 293-301.
171

Meinzer, F.C., G. Goldstein, and J.L. Andrade. 2001. Regulation of water flux
through tropical forest canopy trees: Do universal rules apply? Tree Physiology
21: 19-26.
Moreira, M.Z., L. Sternberg, L. Martinelly, R. Victoria, E. Barbosa, L. Bonates, and
D. Nepstad. 1997. Contribution of transpiration to forest ambient vapor based on
isotopic measurements. Global Change Biology 3: 438-450.
Morris, J., L. Mann, and J. Collopy. 1998. Transpiration and canopy conductance in
eucalypt plantation using shallow saline groundwater. Tree Physiology 18: 547
555.
Nadezhdina, N., J. Cermak, and R. Ceulemans. 2002. Radial patterns of sap flow in
woody stems of dominant and understory species: scaling errors associated with
positioning of sensors. Tree Physiology 22: 907-918.
Nagel, J. 2003. The influence of non-native, monotypic forest plantations on soil
hydrologic properties within the Honouliuli Preserve, Oahu, Hawaii. Master
thesis, University of Hawaii, USA.
Nakahara, R.H. 1980. Water use in Hawaii 1980. State of Hawaii, Department of
Land and Natural Resources Report R71, 26p
Nelson, R.E., W.H.C. Wong, Jr., H.L. Wick. 1968. Plantation timber on the Island of
Oahu - 1966. United States Department of Agriculture, Forest Service, Resource
Bulletin PSW-I0, 52 pp.
Nepstad, D.C., C. de Carvalho, E. Davidson, P. Jipp, P. Lefebvre, G. Negreiros, E. da
Silva, T. Stone, S. Trumbore, and S. Vieira. 1994. The role of deep roots in the
hydrological and carbon cycles of Amazonian forests and pastures. Nature 372:
666-669.
Nichols, W, P. Shade and C. Hunt, Jr. 1996. Summary of the Oahu, Hawaii, Regional
Aquifer-System Analysis. United States Geological Survey Professional Paper
1412-A,61pp.
Oren, R., N. Phillips, B. E. Ewers, D. E. Pataki, and J. P. Megonigal. 1999. Sap flux
scaled transpiration responses to light, vapor pressure deficit, and leaf area
172

reduction in a flooded Taxodium distichum forest. Tree Physiology 19(6): 337
347.
Pandit, B.R., S.R.K. Chava, and V.V.S.V. Rao. 1991. Interrelationship of rainfall,
throughfall and stemflow in teak forest. Indian Journal of Forestry 14(4): 287
289.
Park, H-T. and S. Hattori. 2002. Applicability of stand structural characteristics to
stemflow modeling. Journal of Forest Research 7: 91-98.
Parrota, J.A. 1992. The role ofplantation forests in rehabilitating degraded tropical
ecosystems. Agriculture, Ecosystems and Environment 41: 115-133.
Parrota, J.A. 1993. Secondary forest regeneration on degraded tropical lands: The role
of plantations as "foster ecosystems". In: H. Lieth and M. Lohmann (eds.)
Restoration of Tropical Forest Ecosystems. Kluwer Academic Publishers, The
Netherlands, 63-73.
Parrota, J. A. 1995. Influence of overstory composition on understory colonization by
native species in plantations on a degraded tropical site. Journal of Vegetation
Sciences 6: 627-636.
Pattison, R., G. Goldstein, and A. Ares. 1998. Growth, biomass allocation and
photosynthesis of invasive and native Hawaiian rainforest species. Oecologia 117:
449-459.
Penman, H.L. 1948. Natural evaporation from open water, bare soils, and grass.
Proceedings of the Royal Society of London Series A, 193: 120-145.
Poore, M.E.D., and C. Fries. 1985. The Ecological Effects of Eucalyptus. Food and
Agriculture Organization of the United Nations, FAO Forestry Paper 59,88 pp.
Raich, J.W. 1983. Throughfall and stem flow in mature and year-old wet tropical
forest. Tropical Ecology 24(2): 234-243.
Restom, T.G., and D.C. Nepstad. 2001. Contribution of vines to the
evapotranspiration of a secondary forest in eastern Amazon. Plant and Soil
236(2): 155-163.
173

Roberts, J. and P.T.W. Rosier. 1993. Physiological studies in young Eucalyptus
stands in southern India and derived estimates of forest transpiration.
Agricultural Water Management 24: 103-118.
Roberts, J. and P.T.W. Rosier. 1994. Comparative estimates of transpiration of ash
and beech forest at a chalk site in southern Britain. Journal of Hydrology 162:
229-245.
Robins, N.S., and A R. Lawrence. 2000. Some hydrogeological problems peculiar to
various types of small islands. Journal of the Chartered Institution of Water and
Environmental Management 14: 341-346.
Rogerson, T.L. 1967. Throughfall in pole-sized loblolly pine as affected by stand
density. In: International Symposium on Forest Hydrology (W. Sopper, H. Lull,
eds), Pergamon Press: 187-190.
Rose, K. L., R. C. Graham, and D. R. Parker. 2003. Water source utilization by Pinus
jefJreyi and Arctostaphylos patula on thin soils over bedrock. Oecologia 134: 46
54.
Rutter AJ., AJ. Morton, and P.C. Robins. 1975. A predictive model of rainfall
interception in forests. II. Generalization of the model and comparison with
observations in some coniferous and hardwood stands. Journal of Applied
Ecology 12: 367-380.
Salati, J., and C.A. Nobre. 1991. Possible climatic impacts of tropical deforestation.
Climatic Change 19:177-196.
Schellekens, J., F.N. Scatena, L.A. Bruijnzeel, and AJ. Wicke!. 1999. Modelling
rainfall interception by a lowland tropical rain forest in northeastern Puerto Rico.
Journal of Hydrology 225:168-184.
Schellekens, J.L. 2000. Hydrological processes in a humid tropical rain forest: A
combined experimental and modeling approach. Ph. D. dissertation, Vrije
Universiteit, Amsterdam, The Netherlands, 156 pp.
Schellekens, 1., L.A Bruijnzeel, F.N. Scatena, N.J. Bink, and F. Holwerda. 2000.
Evaporation from a tropical rain forest, Luquillo Ezperimental Forest, eastern
Puerto Rico. Water Resources Research 36(8): 2183-2196.
174

Shade, P., S.S. Anthony, and K. Takasaki. 1992. Ground-Water Resources
Reconnaissance of the Yap Main Islands, Federated States of Micronesia. United
States Geological Survey, Water-Resources Investigations Report 90-4074.
Shade, P., and W.D. Nichols. 1996. Water Budget and the Effects of Land-Use
Changes on Ground-Water Recharge, Oahu, Hawaii. Regional Aquifer-System
Analysis, United States Geological Survey Professional Paper 1412-C, 38 p.
Shiva, V. and J. Bandyopadhyay. 1983. Eucalyptus - a disastrous tree for India. The
Ecologist 13(5): 184-187.
Shukla, J., and Y. Mintz. 1982. Influence ofland-surface evapotranspiration on the
Earth's climate. Science 215: 1498-1500.
Shukla, J., C. Nobre, and P. Sellers. 1990. Amazon deforestation and climate change.
Science 247: 1322-1325.
Shuttleworth, W.J. 1988. Evaporation from Amazonian rain forest. Proceedings ofthe
Royal Society of London, Series B 233: 321-346.
Sood, V.K., R. Singh, and M. Bhatia. 1993. Throughfall, stemflow and canoopy
interception in three hardwood tree species around Shimla, Himachal Pradesh.
Indian Journal of Forestry 16(1): 39-44.
Stratton, L.C., G. Goldstein, and F.C. Meinzer. 2000. Temporal and spatial
partitioning of water resources among eight woody species in a Hawaiian dry
forest. Oecologia 124: 309-317.
Suresh, K.K., and R.S.V. Rai. 1988. Allelopathic exclusion of understorey by a few
multi-purpose trees. The International Tree Crops Journal 5: 143-151.
Thornburn, PJ., G.R. Walker, and J.P. BruneI. 1993. Extraction of water from
Eucalyptus trees for analysis of deuterium and oxygen-18: laboratory and field
techniques. Plant, Cell and Environment 16: 269-277.
Thornthwaite, C.W. 1948. An approach toward a rational classification of climate.
Geographical Review 38(1):55-94.
Thornthwaite, C.W. and J.R. Mather. 1955. The water balance. Publications in
Climatology 8(1): 104 p.
175

Tillman, J.E. 1972. The indirect determination of stability, heat and momentum fluxes
in the atmospheric boundary layer from simple scalar variables during dry
unstable conditions. Journal of Applied Meteorology 11: 783-792.
Topp, G.C., J.L. Davis, and A.P. Annan. 1980. Electromagnetic determination of soil
water content: measurement in coaxial transmission lines. Water Resources
Research 16(3): 574-582.
Topp, G. C., and J. L. Davis. 1985. Measurement of soil water content using Time
Domain Reflectometry (TDR): A field evaluation. Soil Science Society of
America Journal 49: 19-24.
USGS 2004. Water use in the United States. United States Geological Survey,
http://water.usgs.gov/watuse/
Valentini, R, G.E. Scarascia Mugnozza, and J.R. Ehleringer. 1992. Hydrogen and
carbon isotope ratios of selected species of a Mediterranean macchia ecosystem.
Functional Ecology 6: 627-631.
Vertessy, RA., T.J. Hatton, P. Reece, S.K. O'Sullivan, and RG. Benyon. 1997.
Estimating stand water use of large mountain ash trees and validation of the sap
flow measurement technique. Tree Physiology 17: 747-756.
Vugts, H.F., M.J. Waterloo, F.J. Beekman, K.F.A. Frumau, and L.A. Bruijnzeel.
1993. The temperature variance method: A powerful tool in the estimation of
actual evaporation rates. Hydrology of Warm Humid Regions (Proceedings of the
Yokohama Symposium, July 1993), IAHS Publication No. 216.
Walker, L.R, and P.M. Vitousek. 1991. An invader alters germination and growth of
a native dominant tree in Hawai'i. Ecology 72(4): 1449-1455.
Waterloo, M.J. 1994. Water and Nutrient Dynamics of Pinus caribaea plantation
Forests on Former Grassland Soils in Southwest Viti Levu, Fiji. Ph.D.
Dissertation, University of Amsterdam, Netherlands.
Waterloo, MJ., L.A. Bruijnzeel, H.F. Vugts, and T.T. Rawaqa. 1999. Evaporation
from Pinus caribaea plantations on former grassland soil under maritime tropical
conditions. Water Resources Research 35 :2133-2144.
176

White, J.W.C., E.R. Cook, J.R. Lawrence and W.S. Broecker. 1985. The DIH ratios
of sap in trees: implications for water sources and tree ring D/H ratios.
Geochimica et Cosmochimica Acta 49: 237-246.
Wolf, J. 1998. Species composition and structure of the woody vegetation of the
Middle Casamance region (Senegal). Forest Ecology and Management 111: 249
264.
Wood, H.B. 1977. Hydrologic differences between selected forested and agricultural
soils in Hawaii. Soil Science Society of America Journal 41(1): 132-136.
Woodcock, D.W., J.L. Perry, and T.W. Giambelluca. 1999. Occurrence of indigenous
plant species in a middle-elevation Melaleuca plantation on Oahu (Hawaiian
Islands). Pacific Science 53(2): 159-167.
Zarnoch, SJ., D.A. Abrahamson, and P.M. Dougherty. 2002. Sampling throughfall
and stemflow in young loblolly pine plantations. US Department of Agriculture
Forest Service, Research Paper SRS-27.
Zhou, G.Y., J.D. Morris, lH. Yan, Z.Y. Yu, and S.L. Pengo 2002. Hydrological
impacts of reafforestation with eucalypts and indigenous species: a case study in
southern China. Forest Ecology and Management 167:209-222.
Zimmermann, L., C. Frlihauf, and Ch. Bernhofer. 1999. The role of interception in
the water budget of spruce stands in the Eastern Ore Mountains/Germany. Phys.
Chern. Earth (B) 24 (7): 809-812.
177