The Impact of ICT on Health Promotion - um.edu.uy of ICT on diabetic... · The Impact of ICT on...
28
The Impact of ICT on Health Promotion: A Randomized Experiment with Diabetic Patients Ana Balsa Néstor Gandelman Department of Research and Chief Economist IDB-WP-221 IDB WORKING PAPER SERIES No. Inter-American Development Bank December 2010
-
Upload
duongquynh -
Category
Documents
-
view
221 -
download
0
Transcript of The Impact of ICT on Health Promotion - um.edu.uy of ICT on diabetic... · The Impact of ICT on...

The Impact of ICT on Health Promotion: A Randomized Experiment with Diabetic Patients
Ana Balsa Néstor Gandelman
Department of Research and Chief Economist
IDB-WP-221IDB WORKING PAPER SERIES No.
Inter-American Development Bank
December 2010
The Impact of ICT on Health Promotion:
A Randomized Experiment with Diabetic Patients
Ana Balsa* Néstor Gandelman**
* Universidad de Montevideo ** Universidad ORT Uruguay
2010
Inter-American Development Bank

http://www.iadb.org Documents published in the IDB working paper series are of the highest academic and editorial quality. All have been peer reviewed by recognized experts in their field and professionally edited. The information and opinions presented in these publications are entirely those of the author(s), and no endorsement by the Inter-American Development Bank, its Board of Executive Directors, or the countries they represent is expressed or implied. This paper may be freely reproduced.
Cataloging-in-Publication data provided by the Inter-American Development Bank Felipe Herrera Library Balsa, Ana. The impact of ICT on health promotion : a randomized experiment with diabetic patients / Ana Balsa, Néstor Gandelman. p. cm. (IDB working paper series ; 221) Includes bibliographical references. 1. Health promotion—Uruguay. 2. Medical technology—Uruguay. I. Gandelman, Néstor. II. Inter-American Development Bank. Research Dept. III. Title. IV. Series.

Abstract*
This paper summarizes randomized experiment to study the effects of an Internet-based intervention on type 2 diabetes patients in Montevideo, Uruguay. The intervention consisted of a specially designed website and an electronic social network where participants were able to navigate freely, download materials, and interact with other diabetics and with specialists. No significant impact was found on participants’ knowledge, behavior, or health outcomes. It was also found that only a minority of patients logged on to the website, and most were only reached by email and mobile text (SMS). Participation in the website is correlated with patients’ characteristics, such as gender, marital status, and education. JEL classifications: I1, O31, C93 Keywords: Randomized trial, Diabetes, Public health, Uruguay
* We wish to acknowledge the key role played by the Evimed team (Alvaro Margolis, Elisa Martínez, Thais Forster, Graciela Vitarella, Susana Maggiolo, Laura Llambí, Natalia Miranda, and Antonio López) in the design and implementation of the intervention evaluated in this paper. We thank Diego Lamé and Eugenia Rivas for their valuable research assistance in this project and Giorgina Piani for her help in the survey design. Funding for this project was provided by the IDB Research Department. The content of this paper is the sole responsibility of its authors and does not represent in any way the opinions of the IDB or the universities with which the authors are affiliated.
1

1. Introduction The World Health Organization defines e-health as the combined use of electronic information
and communication technology (ICT) in the health sector. According to a systematic review of
evaluations of e-health implementations by Blaya et al. (2010), the greatest potential for e-health
may lie in systems that improve communication between health care institutions, support
medication ordering and management, and help monitor and improve patient compliance with
care regimens. Evaluations of personal digital assistants and mobile devices may also indicate
the level of effectiveness in improving data collection time and quality. Despite this potential,
there is a severe need for more rigorous evaluation of the effectiveness and cost-effectiveness of
these systems in less-developed countries (Blaya et al., 2010; Kahn et al., 2010).
In this study, we use a randomized controlled trial to evaluate the impact of an Internet
and SMS-based information intervention on the health promotion and disease management of
diabetic patients treated in health care centers in Montevideo, Uruguay. Patients with type 2
diabetes require constant follow-up from the head physician and significant support to achieve
self-control. Also, diabetes is one of the most expensive diseases for the health care system. A
recent study in the United States (Dall et al., 2010) shows that the average annual cost per case is
$2,864 for undiagnosed diabetes, $9,975 for diagnosed diabetes ($9,677 for type 2 and $14,856
for type 1), and $443 for pre-diabetes (medical costs only). This amounts to approximately $700
annually for every American, regardless of diabetes status. The prevalence of diabetes in
Uruguay is 8.2 percent (90 percent of these have type 2 diabetes).1
An Internet-based intervention can empower diabetic patients by providing them with
information and supportive tools that can help them improve their health-related decision making
and ultimately increase their quality of life and wellbeing. Better disease management by the
patient can also result in lower health care costs. These expected effects on health care
utilization, together with the relative low cost and massive scope of Internet-based programs,
suggests that e-health interventions have the potential for substantial cost effectiveness.
Nevertheless, we did not a find significant impact of the Internet and SMS intervention on
knowledge, behavior or health outcomes. We found that effective participation in the web
1 http://diabetologia.org.uy/templates/gega_diabetologia/documentos/prevalencia.htm http://www.presidencia.gub.uy/_web/noticias/2008/04/2008040310.htm
2

platform is in itself a challenge, and we also found that participation is correlated with patients’
characteristics like gender, marital status and education.
2. Background and Significance The widespread use of the Internet and mobile phones is currently challenging the way patients
are educated, supported, and followed up. A number of U.S. surveys show that between 40 and
50 percent of American adults use the Internet to look for advice or information about health or
health care (Diaz et al., 2002; Baker et al., 2003; Dickerson et al., 2004; Fox, 2007). Through the
Internet, patients can access wide-ranging, up-to-date information about their disease, available
medical treatments, costs, and preventive health practices on a 24/7 basis. Interactivity and
anonymity provide patients with new communication options, the potential for accessing
information tailored to their needs, and new sources of support (Anderson and Klemm, 2008;
Cline and Haynes, 2001). The information and support available through the Internet make it a
promising cost-effective vehicle for empowering patients by improving their control over their
health conditions and promoting better decision-making.
There are still a number of pitfalls associated with the use of the Internet as a health
education, management, and support tool. The quality of the information on the Internet is not
uniform and is often inaccurate, which increases the vulnerability of the patient (Eysenbach et
al., 2002). Patients face security and privacy issues (Hong et al., 2008). And access is usually
unequal. In the United States, whites, more educated patients, and individuals of higher
socioeconomic status are more likely than others to access the Internet for health information
reasons (Dickerson et al., 2004; Diaz et al., 2002). Age can also be a source of disparity when it
comes to successfully accessing relevant health information (Ybarra and Suman, 2008).
While there is some skepticism about the value of the Internet for patients’ health-related
decisions (Baker et al., 2003), the literature shows very few reported cases of harm associated
with the use of poor quality health information on the Internet (Crocco et al., 2002). On the other
hand, a growing number of studies are showing positive effects of Internet-based interactive and
informative tools on health, health-related decision-making, and wellbeing, although most of
them occur in developed countries. In a survey of patients with chronic conditions and
disabilities (Fox, 2007), three out of four patients who used the Internet (e-patients) reported that
their online searches had positively affected treatment decisions, their ability to cope with their
3

condition, and their dieting and fitness regimes. Kalichman et al. (2003) found an association
between using the Internet for health-related information and health benefits among people living
with HIV/AIDS. Fogel et al. (2002) found that Internet use for breast health issues was
associated with greater social support and less loneliness than Internet use for other purposes or
non-use among breast cancer patients. Broom (2005) investigated how access to information and
online support affected prostate cancer patients' experiences of disease and their relationships
with their physicians. They found that online access had a profound effect on men’s experience
of prostate cancer, helping them gain control over their disease and limiting inhibitions in face-
to-face encounters with the physician. Gustafson et al. (1999) used a randomized controlled trial
to analyze the effects of a computerized system that provided HIV-positive patients with
information, decision support, and networking tools. They found that the system improved their
quality of life and promoted a more efficient use of health care by these patients.
Several e-health interventions have been associated with the management of diabetes.
Harno et at. (2006) conducted an evaluation of an e-health application with a diabetes
management system and a home care link. They found significantly lower levels of HbA1c,
blood pressure, cholesterol and fasting plasma glucose in the study group relative to the control
individuals, and a lower number of visits by the study patients to doctors and nurses. Meigs et al.
(2003) tested the effects of the Disease Management Application (DMA), a web-based decision
support tool for diabetics developed to improve evidence-based management of type 2 diabetes.
Patients in the intervention group increased the number of HbA1c tests, cholesterol tests, and
foot examinations within a year. They also experienced stronger decreases in levels of HbA1c
and cholesterol than patients in the control group. McKay et al. (2001) evaluated the short-term
benefits of an Internet-based supplement to usual care that focused on providing support for
sedentary patients with type 2 diabetes to increase their physical activity levels. The study
showed no difference in physical activity between patients that were randomized to the Diabetes
Network (D-Net) Active Lives Physical Activity Intervention and patients assigned to an Internet
Information-only condition.
One recurring problem with Internet-based interventions has been patient participation
over time. Fell et al. (2000) found that younger diabetic patients showed increased interest in
interactive Internet interventions, but older patients increased participation only when barriers to
access were addressed. Glasgow et al. (2003) evaluated participation and effects of the “Diabetes
4

Network (D-Net)” Internet-based self-management project, a randomized trial evaluating the
incremental effects of adding tailored self-management training or peer support components to a
basic Internet-based, information-focused comparison intervention. The study encountered a
strong decrease in participation over time. Additions of tailored self-management and peer
support components generally did not significantly improve results.
The use of the Internet by patients is also challenging the basis of the patient-physician
relationship. There are studies suggesting that some physicians may react negatively to the
demands of patients that use the Internet as a source of information and education (Broom,
2005). Research shows that the majority of the patients that use the Internet for health
information do not discuss this information with their doctors (Diaz et al., 2002). And those who
take information sought on the web to the physician want the physician’s opinion, rather than a
specific intervention (Murray et al., 2003). In Murray's study, the effect of taking information to
the physician on the physician-patient relationship was likely to be positive as long as the
physician had adequate communication skills and did not appear challenged by the patient
bringing in information.
While research on e-health interventions is growing exponentially in developed countries,
less is known about the impacts of similar programs in less developed nations. A number of
experiences using mobile phone technology are showing great promise in some Latin American
countries. In Chile, a nurse-based telephone-care service linked with key clinical events and
outpatient visits resulted in improved glycemic levels, blood pressure, and perception of health,
and healthier eating. Another public health disease management program in Nicaragua based on
SMS contributed to increased compliance of patients taking TB drugs (Anta, El Wahab, and
Giuffrida, 2010). Blaya et al. (2010) and Kahn et al. (2010) highlight the need for more rigorous
evaluations of the effectiveness and cost-effectiveness of e-health interventions in less developed
countries.
While e-health interventions are still relatively scarce in Uruguay, the country has shown
a positive trend in the adoption of ICTs in recent years. In a 2008 ranking of 20 Latin American
countries comparing the penetration rates of Internet, broadband Internet, personal computers
(PCs), wireless subscribers, and fixed telephone lines, Uruguay was rated Latin America’s top
technology country (Latin Business Chronicle, 2008). According to data from the International
Telecommunications Union, Uruguay's mobile penetration exceeded 100 percent in 2008,
5
Internet penetration was 40 percent and broadband penetration 9 percent in the same year. A
study conducted in 2006 found significant socioeconomic and age-related inequities in access to
ICTs. The gap in PC use between the poorest and richest income quintiles was only 2 among
adolescents, but increased to 20 when assessing the population age 50 and over (Pittaluga and
Sienra, 2007). This generational gap is of particular concern when considering that many e-
health interventions aim at reaching middle-aged or older individuals.
3. Methodology 3.1 Design Overview A randomized design was employed to evaluate the effects at six months following
randomization of diabetic patients in primary care practices to an Internet-based education and
networking intervention versus the distribution of a brief educational brochure. The aim of the
study was to analyze the effectiveness and cost-effectiveness of the ICT intervention in terms of
achieving higher overall patient wellbeing (self-reported and quality-of-life-adjusted years),
treatment compliance, use of health care, patient’s sense of control of the disease, information
about the disease and its treatment, a better patient-physician relationship, and technology-
related skills. The study design was submitted for review by an ethics committee at the
University ORT Uruguay.
3. 2 Recruitment and Participants Our target population was defined as adult patients suffering from type 2 diabetes who had
Internet access at home (i.e., had a PC and Internet connection at home) or reported navigating
the Internet at least once a week, and were currently being treated in one of three HMOs in
Montevideo. Pregnant women, patients taking insulin, patients under dialysis treatment, or
patients with other complications (such as severe eye disease, cancer, or celiac disease) were
excluded from the study. Patients who had participated as leaders in diabetes education groups
were also excluded from the study.
To recruit the participants, we contacted patients in the waiting rooms of internists
treating diabetic patients or endocrinologists at three HMOs in Montevideo: a large HMO with
236,085 enrollees, and two smaller HMOs, one with 46,612 enrollees and the other with 43,427
6

enrollees.2 Interviewers were assigned to the waiting rooms at different times of the day between
April and July 2009. After ensuring that they qualified for the study, patients were asked to sign
an informed consent form that described the study and the implications of their participation.
At baseline, most patients were interviewed while waiting for their appointment or right
after the appointment. The survey consisted of two questionnaires. The first questionnaire was
administered by the interviewer and inquired about socio-demographics, perceived health status,
morbidity, severity of diabetes, diabetes-related care, disease management and compliance with
treatment, health care utilization in general, and knowledge about diabetes. A second self-
administered questionnaire inquired about depression, the patient-physician relationship, the
patient’s sense of empowerment regarding the disease, use of alcohol and other substances,
physical activity, and diet. All participants were given a brochure developed by experts in
diabetes, which explained the fundamental aspects of type 2 diabetes treatment.
Subjects completing the baseline interview were randomly assigned to the control group
and the intervention group. We ended up with a sample of 388 individuals who qualified for the
study. Patients were randomized to the e-health intervention or a no-intervention setting. Our
final sample consisted of 195 individuals in the intervention group and 193 in the control group.
A follow-up interview was conducted six months after the initiation of the distance phase
of the intervention, between January 26 and May 6, 2010. This second survey consisted of a
subset of questions that had already been asked in the first questionnaire and that reflected
attitudes or behaviors that could potentially be affected by the intervention, and a small set of
new questions referring to some of the topics covered in the e-health intervention. The surveys
were completely administered by the interviewer, and the time and place of the interview was
coordinated beforehand between the interviewer and the participant. We were able to complete
280 interviews in this way. Participants refusing to participate in the face-to-face interview (due
to lack of time, lack of interest, or unwillingness to let a stranger come into their homes or fear of
a scam), were offered the option of answering the survey over the phone. Sixty additional
surveys were completed using this modality. Final sample attrition was 48 observations (12
percent of the original sample): 3 patients died between the baseline and the follow-up survey, 4
could not be located, and 41 refused to participate at follow-up.
2 Data from the October 2008 Health Census.
7

The inclusion and exclusion restrictions that defined the study made recruitment difficult.
Even though the survey took place in the diabetes departments of the above-mentioned HMOs,
many individuals did not qualify for the project. By eliminating type 1 diabetics, we cut out the
younger segment of the diabetic population. The remaining population had a greater chance of
suffering any of the medical conditions that would exclude them from the project (except
pregnancy). Furthermore, only 17 percent of Uruguayans over 50 use the Internet at least
sporadically, according to a recent survey.3 A great majority of those contacted in the waiting
rooms were over 50 years old.
3.3 The Intervention Before the online phase, patients in the intervention group were invited to participate in a short
workshop that instructed them on how to search information on the Internet, and on the use of
social network platforms (wikis, chat, forums). An expert in search and documentation
coordinated each of these workshops, which lasted around two hours. The workshops included
an organized set of practical activities using a PC (one participant per PC) and took into account
the knowledge of participants regarding their “computer skills.” The workshops took place at the
facilities of the Universidad ORT Uruguay between July 20 and July 30, 2009.
Out of the 195 participants in the intervention group, only 57 agreed to attend the
workshop. The main reasons for the decision not to attend were: current illnesses, difficulty to
travel due to lack of mobility, lack of available time to participate, lack of interest in the subject,
and particularly the risks of the Influenza A virus at the time (the workshops took place in
winter).
Eight workshops were originally scheduled, with an average of 20 participants each
expected to attend. The first 10 minutes of the workshop were used for introductions and a brief
presentation of the topics to be discussed in the session; in the next 30 minutes, the
documentation specialist in charge of the workshops gave a tutorial of how to perform good and
efficient searches on the Internet. After that, the participants were given 20-30 minutes to search
the Internet with personalized assistance from the workshop coordinators. The remaining 50-60
minutes were devoted to introducing the diabetes platform created by EviMed4 specifically for
3 “El perfil del internauta Uruguayo” 2008 – Grupo Radar 4 EviMed is a private firm that develops information and educational products and services for physicians throughout Latin America. http://www.evimed.net/
8

this project, with special attention to the forum, chat and wiki, with which the participants were
less familiar.
After the workshop, the instructions for logging on to the website were mailed and e-
mailed to every participant whether they participated in the workshop or not. A week later,
everyone received a phone call to check if they had received the information and to offer
assistance with logging on. The intervention was active through January 2010.
The intervention consisted of the dissemination through the Internet of information and
materials related to type 2 diabetes. The information and materials for the patients were
published on a website (DIABETES 2.0) specially designed for this study and updated weekly.
The intervention group had unlimited access to the site and could download all of the available
materials at no charge. Materials included articles or brief presentations, videos and images,
schedules, news, and links to other related websites. In addition, patients in this group received
periodic reminders about new topics through email and SMS.
The messages and educational materials were developed and chosen by specialists and
edited by EviMed’s interdisciplinary team (documentation specialist, internist, and
communicators) using sources such as Medline Plus, eviDoctor, and others.
Besides providing access to information, one of the main advantages of the Internet in
empowering individuals is its anonymity. The Internet allows individuals to ask questions they
may be ashamed to ask in face-to-face encounters. For instance, sexual dysfunction may be
associated with the evolution of diabetes. The anonymity of the Internet also allows patients to
share their personal experiences and learn from each other. The intervention group had access to
a social network through the site, aimed at facilitating the exchange of personal experiences,
questions, and knowledge between patients that share the same condition. The network was
facilitated through an electronic platform, where patients could meet in forums, chats, and wikis
to discuss ideas or ask about the materials or other aspects of their life as chronic patients. An
example of a forum topic is “What physical workout do we usually do?” and a wiki topic is
“Healthy recipes with spinach.” An “animator” (non-medical) organized and stimulated network
participation. Periodically, a physician specializing in diabetes participated in the network by
commenting on the patients’ comments, clarifying points, and answering some questions.
9

3.4 Program Evaluation The evaluation of the effects of ICT programs is challenged by selection problems. Individuals
that decide to participate in the program are in general subtly different from those that do not
participate. These differences (e.g., motivation, laziness) may have an impact on the evolution of
the disease, the satisfaction of the patient with treatment, and other dimensions of disease
management. The randomized controlled trial framework minimizes this endogeneity problem
but does not completely eliminate it. In this scenario, there is still one concern that needs to be
addressed: non-participation. Although each individual invited to participate in the intervention
could have benefitted from the workshop and the online phase of the study, some of them chose
not to participate. This non-participation may be associated with individual or contextual
characteristics that may also affect the variables under study.
In order to avoid this situation, it is important to implement the treatment with an
“intention to treat” variable, defined as all those that were invited to participate in the
intervention whether they took part in it or not. Once the exogeneity of the treatment is
established, the identification of the causal effects of ICT technologies follows from simple
econometric techniques. Given a certain indicator that we would like to measure, Y, the effect of
the intervention is given by a difference-in-difference procedure.
We implement the difference-in-difference framework (Card, 1992; Gruber, 1994) by
pooling observations in both surveys and estimating a regression of the form:
iiiiii WaveITTWaveITTY εββββ ++++= 232210 *
where and are dummies. is the variable under study, represents the
"intention to treat" group and takes the value 1 if the ith patient was invited to participate in the
internet based intervention and 0 otherwise. takes the value of 1 when the answer refers
to the second survey. The coefficient multiplying iITT ( 1
iITT iWave2 iY iITT
iWave2
β ) reflects baseline differences
between the intention to treat and control groups. The coeff iave2 ( 2icient of W β ) reflects time
trends in outcomes that are common to the intervention and control groups. The effect of the
intervention is captured by the interaction term. When the dependent variable is discrete this
same approach can be used in a probit or ordered probit regression.
10

4. Results 4.1 Participation in the Diabetes 2.0 Intervention According to the information automatically collected by the website Diabetes 2.0, 77 participants
(39 percent of the ITT) logged on at least once during the experiment. Among this subgroup, 34
participants (44 percent) logged on one day, 12 (16 percent) did so two days and the remaining
40 percent did so three days or more. On average, those who logged on did so 4.5 times. Forty-
seven participants (24 percent of the ITT) engaged in a variety of activities, such as forums,
chats, wikis, or online surveys.
There is some discrepancy between the participation records stemming from the web logs
and levels of participation as reported by the participants in the second survey. Of the original
195 ITT participants, 162 took the second survey and answered the question: “How often did you
enter the Diabetes 2.0 website?” Twenty-four participants (15 percent of respondents to the
second survey) who had logged on at least once according to automatic registers did not
remember having visited the site when asked about their participation in the follow-up survey.
And 22 participants (14 percent) who did not log on according to our records reported having
visited Diabetes 2.0. Some of the participants who attended the workshop were provided with a
username and password during the workshop and had a chance to navigate the Diabetes 2.0
website that same day. Other participants that also attended the workshops were sent an email
with the username and password later on. To avoid biases, we did not take into consideration that
first login during the workshop as evidence of participation in the program. This may partially
explain the difference between our records and self-reports of participation. Another reason for
the discrepancies between web registers and self reports may be the lack of experience in the use
of the Internet among some of the participants, which may have led to confusion regarding
whether they actually entered the website or not.
In the second survey, we asked all participants who reported never logging on the reasons
for not doing so. Participants were offered several alternatives and could select as many choices
as they wanted. Eight percent declared that they did not log on because they were not interested
in the topic, 12 percent reported that they preferred using other channels of information on
diabetes, 54 percent reported that they were not frequent Internet users, and 14 percent claimed
to already have all the diabetes-related information they needed.
11

Although more than half of the participants never visited Diabetes 2.0, most members in
the “intention to treat” group were reached by the experiment via e-mail messages and/or SMS
messages. Around 65 percent of participants reported having received text messages related to
the project, and 57 percent reported having received e-mails from the project staff. Overall, 75
percent of the participants reported having received text messages or emails from the staff
(again, some participants may have gotten e-mails or text messages but did not remember or
simply considered it as spam). Combining this information with the web registers, only 30
participants never logged on to Diabetes 2.0 or do not recall receiving emails or text messages.
However, the data indicate that 132 participants were reached by the project’s information and
communication technologies in one way or another.
In order to investigate the possible determinants of participation in the web based
intervention, we estimated a probit model, with a dichotomous indicator of participation in the
Diabetes 2.0 website (according to electronic records) as the dependent variable. The explanatory
variables were gender, age, marital status, any children in the household, education, employment
status, self reported health status, time elapsed since the patient was first diagnosed with
diabetes, self-reported knowledge about diabetes, Internet access at home, previous use of an e-
mail account, previous use of the Internet for health related information, and participant’s HMO.
The first column in Table 1 shows the marginal effects of the participation regression for
a selected set of explanatory variables. Women were 18 percentage points more likely to enter
the Diabetes 2.0 website than men. Having Internet at home was not significantly related to
participation in the website. One of the exclusion restrictions for recruitment into this study was
that participants should have Internet access at home or access to the Internet at least once a
week. The non-significance of the Internet dummy reflects that there are no differences between
those that have Internet at home and those that browse the Internet from somewhere else. Having
a previous e-mail account was not a significant determinant of the participation decision. Having
previously searched for health-related topics on the Internet, on the other hand, increased the
likelihood of participation by 24 percentage points. This suggests that the source of access to the
Internet and the frequency of use are not sufficient conditions for participation in these types of
programs. Those who did participate in the program were inherently more interested in using the
Internet as a source of health-related information.
12
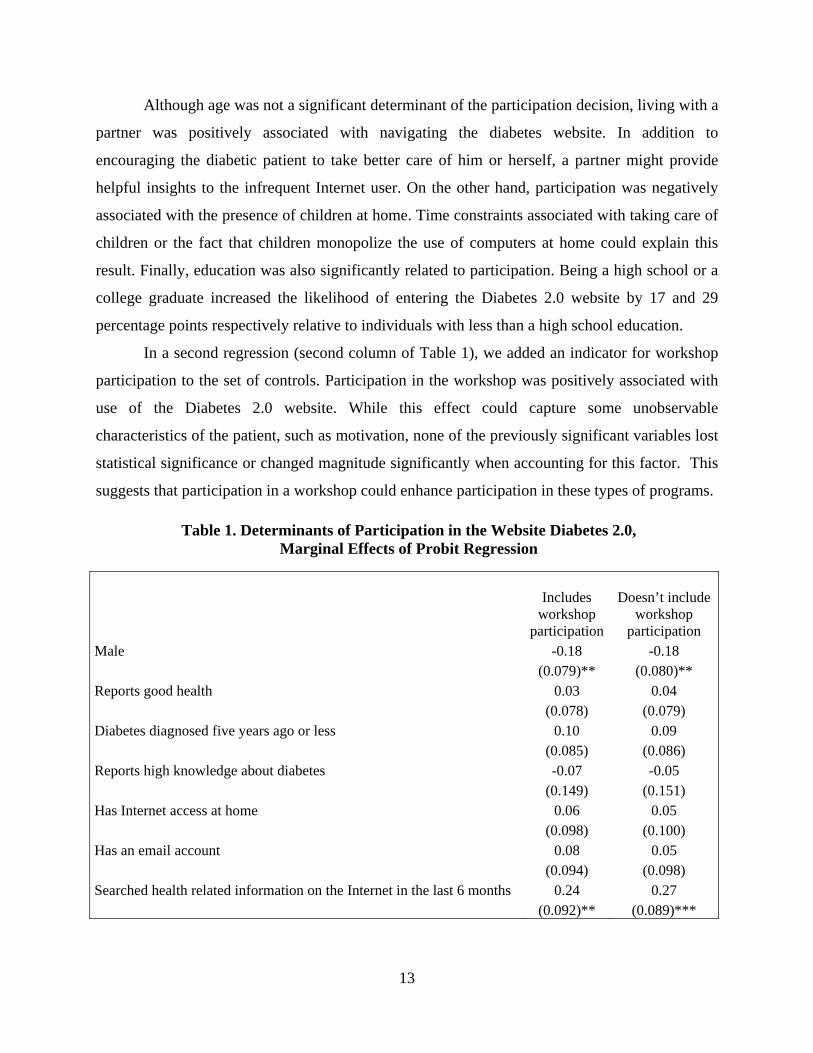
Although age was not a significant determinant of the participation decision, living with a
partner was positively associated with navigating the diabetes website. In addition to
encouraging the diabetic patient to take better care of him or herself, a partner might provide
helpful insights to the infrequent Internet user. On the other hand, participation was negatively
associated with the presence of children at home. Time constraints associated with taking care of
children or the fact that children monopolize the use of computers at home could explain this
result. Finally, education was also significantly related to participation. Being a high school or a
college graduate increased the likelihood of entering the Diabetes 2.0 website by 17 and 29
percentage points respectively relative to individuals with less than a high school education.
In a second regression (second column of Table 1), we added an indicator for workshop
participation to the set of controls. Participation in the workshop was positively associated with
use of the Diabetes 2.0 website. While this effect could capture some unobservable
characteristics of the patient, such as motivation, none of the previously significant variables lost
statistical significance or changed magnitude significantly when accounting for this factor. This
suggests that participation in a workshop could enhance participation in these types of programs.
Table 1. Determinants of Participation in the Website Diabetes 2.0, Marginal Effects of Probit Regression
Includes
workshop participation
Doesn’t include workshop
participation Male -0.18 -0.18 (0.079)** (0.080)** Reports good health 0.03 0.04 (0.078) (0.079) Diabetes diagnosed five years ago or less 0.10 0.09 (0.085) (0.086) Reports high knowledge about diabetes -0.07 -0.05 (0.149) (0.151) Has Internet access at home 0.06 0.05 (0.098) (0.100) Has an email account 0.08 0.05 (0.094) (0.098) Searched health related information on the Internet in the last 6 months 0.24 0.27 (0.092)** (0.089)***
13

Table 1., continued
Includes workshop
participation
Doesn’t include workshop
participation (0.108) (0.108) Age 65-70 0.10 0.09 (0.129) (0.135) Age 70+ 0.15 0.15 (0.131) (0.133) Lives with a couple 0.23 0.20 (0.081)*** (0.084)** Lives with sons/daughters -0.17 -0.13 (0.077)** (0.078)* Interviewed in CASMU -0.29 -0.27 (0.177) (0.182) Completed high school or equivalent 0.17 0.18 (0.096)* (0.098)* Completed college or equivalent 0.29 0.31 (0.126)** (0.127)** Employed -0.06 -0.04 (0.093) (0.095) Participated in the workshop 0.21 (0.082)*** Observations 195 195 Source: Author’s compilation. Standard Deviation in parentheses. * significant at 10 percent; ** significant at 5 percent; *** significant at 1 percent 4.2 Evaluation of the Impact of Diabetes 2.0 The aim of the Diabetes 2.0 intervention was to improve diabetic patients' control over their
health and promote better decision-making by providing patients with relevant up-to-date
information as well as social support. First, we expected the intervention to improve patients’
knowledge and beliefs about their disease and its management. Empowered by this information,
patients might change their health-related behaviors and make more effective health care
decisions. Health outcomes could improve as a result. Following this knowledge-behavior-
outcomes paradigm, we proceed to evaluate the results in each of these three steps.
14

4.2.1 Impact on Knowledge In the baseline and follow up survey, patients were asked several questions about what they
knew or thought they knew about diabetes. Table 2 reports patients’ perceptions of their
knowledge in many relevant dimensions, including medical questions (need for medication),
most common complications (eyes and feet problems and long run effects of diabetes), and
consumption habits (alcohol, smoking) among others. In all cases but one, the majority of
patients considered their knowledge level to be good. The effect of being sick (e.g., having the
flu) on their diabetes was the only dimension where the majority of patients considered that they
lacked adequate knowledge. On the other hand, more than a quarter of respondents considered
they had insufficient knowledge about the impact of cholesterol, alcohol, and smoking on
diabetes and what happens when their blood sugar level is too low.
Table 2. “How much do you know about…?” Baseline Survey
Nothing A little Enough A lot All Cases 1...the effect of being sick (e.g. flu) on diabetes? 36% 16% 42% 6% 100% 340 2...maintaining an appropriate weight? 6% 7% 55% 32% 100% 340 3…what happens when the level of glucose in blood is too low? 12% 14% 53% 21% 100% 339 4…why medication is needed in treating diabetes? 8% 12% 53% 28% 100% 339 5…the long-term impact of diabetes in health? 7% 9% 53% 31% 100% 338 6…the impact of cholesterol on diabetes? 20% 14% 45% 20% 100% 339 7…eye care and control? 14% 9% 50% 27% 100% 340 8…foot care and control? 6% 9% 53% 32% 100% 339 9…the impact of alcohol on diabetes? 16% 10% 50% 24% 100% 340 10…the impact of smoking on diabetes? 16% 9% 49% 26% 100% 340 11…the impact of stress on diabetes? 13% 10% 50% 27% 100% 340 12…the impact of fatigue on diabetes? 16% 11% 49% 24% 100% 339 13…diet plans to control diabetes? 5% 5% 54% 36% 100% 340
Source: Authors’ compilation.
In Table 3 we report the results of implementing the difference-in-difference framework
in an ordered probit regression. The dependent variables, capturing knowledge about diabetes,
take the following values: 1 for nothing, 2 for a little, 3 for enough and 4 for a lot. The
interaction between the intention to treat and second wave dummies is not significant for any of
15

the 13 knowledge questions. This means that the distribution of the beliefs about diabetes was
not affected in any way by the intervention.5
Table 3. The Impact of the Intervention on Knowledge Dif-in-dif Estimation Using an Ordered Probit Model
Question1 Question2 Question3 Question4 Question5 Question6 Question
7 ITT 0.078 0.063 0.082 0.014 0.080 0.083 0.071 (0.119) (0.127) (0.121) (0.121) (0.124) (0.119) (0.122) Wave2 -0.207 0.521 0.303 0.426 0.396 0.035 0.277 (0.118)* (0.125)*** (0.119)** (0.121)*** (0.122)*** (0.117) (0.120)**ITTxWave2 0.011 -0.030 -0.044 0.153 0.234 0.068 0.016 (0.170) (0.178) (0.171) (0.172) (0.176) (0.168) (0.173) Observations 680 680 678 678 676 678 680 Question 8 Question 9 Question 10 Question 11 Question 12 Question 13 ITT 0.059 0.059 0.020 -0.051 -0.023 -0.033 (0.124) (0.119) (0.119) (0.120) (0.120) (0.130) Wave2 0.545 0.204 0.261 0.331 0.161 0.651 (0.124)*** (0.118)* (0.118)** (0.119)*** (0.118) (0.129)*** ITTxWave2 0.016 0.150 0.198 0.102 0.287 -0.037 (0.176) (0.170) (0.169) (0.171) (0.170)* (0.182) Observations 678 680 680 680 678 680 Source: Authors’ compilation. Standard errors in parentheses. *significant at 10 percent; ** significant at 5 percent; *** significant at 1 percent. Dependent variable takes the following values: 1 for nothing, 2 for a little, 3 for enough and 4 for a lot.
4.2.2 Impact on Empowerment and Behavior Table 4 reports the baseline values for several variables measuring physician-patient relationship
and health-related behavior patterns. One of the ways in which the intervention can improve
health care decisions is by empowering the patient in the physician-patient relationship. We
assessed patient trust and doctor-patient communication by implementing a scale developed for
the Primary Care Assessment Survey (PCAS). The PCAS is a validated, patient-completed
questionnaire designed to operationalize formal definitions of primary care. Extensive
psychometric testing and evaluation have been conducted on the PCAS scales. All scales exceed
5 There was a significant effect of time on knowledge: both treatment and control patients gain knowledge about the disease over time.
16

established standards for excellent instrumentation and perform consistently well across
population subgroups (Murray, 2000). The trust and communication scales range from 0 to 100
points, with higher scores indicating better outcomes. According to the baseline survey, the level of
patient trust and the quality of clinical communication were very good. To facilitate interpretation of
the magnitudes for someone not familiar with the PCAS, we also report a direct question on trust.
Patients were asked to rank on a scale from 0 to 10 how much they trusted their medical doctors.
The average answer was almost 9.
We also collected information on food consumption in the past week, including things that
diabetics should avoid (French fries, ready-to-eat meals) and foods that should be encouraged
(fruits, vegetables). On average, the consumption pattern seemed reasonable at baseline: patients
reported consuming fruits and vegetables almost daily, while the average frequency of intake of less
healthy food was once a week or less.
Table 4. Trust, Communication and Consumption Patterns, Baseline Survey
Mean Standard deviation Cases
Trust (1-10) 8.8 1.5 318 Trust (PCAS) 88.7 11.7 329 Communication with M.D. (PCAS) 85.7 14.1 325
Dur
ing
the
last
wee
k, o
n
how
man
y da
ys d
id y
ou
cons
ume.
..
Fruits 6.4 1.5 340 Vegetables 5.6 2.0 340 Ready-to-eat meals 0.6 1.1 340 French fries 0.7 1.1 340 Cookies and other pastry 1.4 2.0 340 Regular soda and juices with sugar 0.4 1.2 339 Fish 1.1 1.1 340 Cold cuts and sausages 1.4 1.8 340
17

The econometric results of Table 5 show that the intervention had no effect on any of the
variables considered.
Table 5. The Impact of the Intervention on Patient-Physician Relationship and Health-related Behaviors: Dif-in-dif Estimation, OLS
Trust (1-10)
Trust (PCAS)
Communication (PCAS)
ITT -0.080 -0.838 -0.347 (0.150) (1.222) (1.471) Wave2 -0.251 1.612 -0.789 (0.146)* (1.198) (1.442) ITTxWave2 -0.166 -2.226 -1.723 (0.212) (1.728) (2.081) Constant 9.180 88.519 87.508 (0.103)*** (0.847)*** (1.019)*** Observations 636 658 650 Consumption in the past week of:
Fruits Vegetables Ready-to-it meals
French fries
Cookies and similar Regular soda Fish
Cold cuts and sausages
ITT -0.230 0.124 -0.040 0.001 0.076 -0.094 0.036 0.021 (0.173) (0.216) (0.129) (0.112) (0.225) (0.135) (0.116) (0.207) Wave2 0.040 0.040 -0.153 -0.080 0.028 -0.011 -0.080 -0.148 (0.170) (0.212) (0.127) (0.110) (0.221) (0.133) (0.114) (0.203) ITTxWave2 0.180 -0.211 0.202 0.110 -0.187 0.011 -0.042 0.075 (0.245) (0.305) (0.182) (0.159) (0.319) (0.191) (0.164) (0.293) Constant 6.358 5.608 0.705 0.676 1.449 0.411 1.165 1.534 (0.120)*** (0.150)*** (0.089)*** (0.078)*** (0.157)*** (0.094)*** (0.080)*** (0.144)***Observations 680 680 680 680 680 678 680 680 Source: Authors’ compilation. Standard errors in parentheses. * significant at 10 percent; ** significant at 5 percent; *** significant at 1 percent
18

4.2.3 Impact on Outcomes Finally, in this subsection we address the effect of the intervention on health outcomes. Table 6
reports the baseline values for self-perceived health status, several medical tests, and
complications of diabetes.
The majority of respondents reported that they were in good health. Only a minority
considered themselves to be in very good or excellent health, and a sizeable share of respondents
ranked their health at the bottom two levels of the distribution (fair or bad).
Blood pressure is the pressure exerted by circulating blood upon the walls of blood
vessels. During each heartbeat, blood pressure varies between a maximum (systolic) and a
minimum (diastolic) pressure. According to Appel et al. (2006), the risk of cardiovascular
disease increases progressively above 115/75 mmHg (millimeters of mercury), but for diabetic
patients, higher levels are considered acceptable (below 130/80 mmHg). The average patient in
this study is just below this limit. This suggests that a sizeable fraction of the patients in our
sample have problems associated with hypertension.
The blood glucose level is the amount of glucose (sugar) present in the blood. This level
fluctuates throughout the day. In the morning, before the first meal of the day (termed “fasting
level”), glucose levels are the lowest and rise after meals for an hour or two. A healthy
individual’s blood sugar level is in a range of about 82 to 110 mg/dL (milligrams/deciliter). After
eating, the blood glucose level may rise up to 140mg/dL for non-diabetics. The American
Diabetes Association recommends a post-meal glucose level of less than 180 mg/dl and a pre-
meal plasma glucose of 90–130 mg/dL. The mean glucose level for the patients in this study is
considered acceptable for people with diabetes.
From the baseline survey it is also clear that the population under study has a significant
probability of suffering from diabetes-related incidents. Over the past six months, about 10
percent had to stay at least one night in a hospital, and about one-third made a visit to the
emergency room. Eight percent, 14 percent, and 6 percent of the sample had foot, eye, and
kidney problems, respectively.
19

Table 6. Outcomes: Descriptive Statistics, Baseline Survey
Bad Fair Good Very good Excellent Cases Self-perceived health 4% 36% 53% 7% 1% 340 Mean s.d. Cases
Last
mea
sure
Systolic blood pressure 129 15 312 Diastolic blood pressure 76 10 309 Fasting blood glucose level 121 35 173 After eating (2 hours) blood glucose level 136 40 66
In th
e la
st 6
m
onth
s
% that had to stay a night in hospital 10% 30% 340 % that had to go to the emergency room 29% 45% 340 % with foot injuries 8% 27% 340 % with eye problems 14% 35% 339 % with kidney problems 6% 24% 337
Given the lack of significant results in the knowledge, assessment of quality of health
care, and health behavior sections, the absence of significant econometric results among the
outcome variables is not surprising. Table 7 reports these results. The regressions in the upper
panel are OLS and in the lower panel are probits.
Table 7. The Impact of the Intervention on Health Outcomes, Dif-in-dif Estimation Last measure of:
Health
evaluation
Systolic blood pressure
Diastolic blood pressure
Fasting blood glucose level
After eating (2 hours) blood glucose level
ITT -0.004 -1.999 -0.701 0.504 17.511 (0.121) (1.704) (1.160) (5.753) (9.280)* Wave2 0.070 0.203 0.236 -5.898 5.389 (0.119) (1.693) (1.150) (5.703) (8.849) ITTxWave2 0.101 -0.917 -0.301 0.062 -5.422 (0.171) (2.409) (1.640) (8.136) (13.124) Constant 130.051 76.293 126.602 124.889 (1.197)*** (0.813)*** (4.033)*** (6.257)*** Observations 680 624 618 346 132 0.01 0.00 0.01 0.04
20

Table 7., continued
In the last 6 months:
Night stay in hospital
Emergency room
Foot injuries
Eye problems
Kidney problems
ITT 0.010 0.095 0.154 -0.261 -0.335 (0.181) (0.143) (0.235) (0.208) (0.290) Wave2 0.030 0.066 0.345 0.289 0.346 (0.177) (0.141) (0.220) (0.176) (0.220) ITTxWave2 -0.212 -0.227 -0.198 0.175 0.025 (0.262) (0.203) (0.309) (0.269) (0.365) Constant -1.237 -0.571 -1.753 -1.335 -1.751 (0.126)*** (0.100)*** (0.172)*** (0.132)*** (0.172)*** Observations 680 680 680 678 674 Source: Authors’ compilation. Standard errors in parentheses. * significant at 10 percent; ** significant at 5 percent; *** significant at 1 percent
5. Conclusions We implemented a randomized controlled trial to study the effects of an Internet-based
intervention on type 2 diabetic patients. After an initial face-to-face workshop, the intervention
group entered the “distance phase” of the project, which lasted six months. Participants were
granted access to a website with information on diabetes and its management and to a social
network platform. Participants were able to navigate the Internet site free of charge, download
materials, and access links. The social network worked through an electronic platform that
promoted social exchange on the basis of different activities (forums, chats, wikis) set up by the
specialists. Specialists participated sporadically in the forums with the aim of informing and
correcting any misperceptions that participants had about their disease and its treatment and
management. Access to the website and social network was granted for six months. A follow-up
survey was conducted immediately after the intervention ended.
The evaluation of the intervention showed no significant impact of information
technologies on knowledge, perception of health care quality, health-related behaviors, or health
outcomes on the participating diabetic patients. Our results present a less optimistic picture of the
potential benefits of web platforms for the empowerment of patients with chronic diseases than
some of the previous literature (Harno et al., 2006; Meigs et al., 2003; and McKay et al., 2001).
There are several possible explanations for this discrepancy. First, the success of these types of
programs may be different in developed and less developed countries where both Internet
21

development and the health care system are at different stages of progress. Even among patients
that had initially reported having Internet access at home or using the Internet at least once a
week, a majority mentioned that they did not access the Diabetes 2.0 website because they were
not frequent Internet users. Second, participants in our study were not necessarily interested ex
ante in an IT-based intervention. Recruitment and the baseline survey were conducted in the
waiting room of the HMO, and the randomization was conducted over the full set of respondents
to this baseline survey. The majority of the patients selected for the intervention never logged on
to the website and were only reached by email or SMS. In other studies, the randomization is
conducted on a sample of individuals that have volunteered to participate in the research. Thus, a
priori interest in these types of interventions may be a prerequisite for their success.
This conjecture is reinforced by our finding that prior use of the Internet as a source of
health information significantly increased participation in the website. We found, in addition,
that participation in the website is correlated with variables like gender, marital status, and
education. Women, patients living with a partner, and those who completed high school appeared
to have a greater appreciation of the value of the IT tool.
One last reason for the lack of significant effects of the intervention could be related to
timing. It may take some time for patients not used to checking the Internet as a source of
information to adopt this new tool as an everyday aid to their disease management. Moreover,
the effects of empowerment derived from the new information tool might appear with some lag.
The positive perception of the intervention among those that ended up participating in the
website partially supports this argument. Those that reported visiting the Diabetes 2.0 website
gave it an average grade of 8.5 out of 10, and most of those who reported receiving e-mails from
the program staff said they had read the emails. Thus, we cannot discount the fact that the
intervention may have produced some effects beyond the six-month follow-up period, or that it
could have been more effective had it been active for a longer period.
To sum up, we did not find information technology tools to increase diabetic patients'
knowledge, empowerment, or health outcomes at six months’ follow-up. Lack of familiarity with
the Internet, associated with the patient's age and educational profile, was one of the main
barriers to participation. Future interventions of this type should exploit patients' prior interest in
participation as well as prior Internet literacy.
22

References American Diabetes Association. 2006. Diabetes Care. “Standards of Medical Care-Table 6 and
Table 7, Correlation between A1C level and Mean Plasma Glucose Levels on Multiple
Testing over 2-3 Months.” 29 Supplement 1: 51-580.
Anderson, A. S.,and P. Klemm. 2008. “The Internet: Friend or Foe When Providing Patient
Education?” Clinical Journal of Oncology Nursing 12(1): 55-63.
Anta, R., S. El-Wahab and A. Giuffrida. 2009. Mobile Health: The Potential of Mobile
Telephony to Bring Health Care to the Majority. Inter-American Development Bank.
Innovation Note. Washington, DC, United States: Inter-American Development Bank.
Appel, L. et al. 2006. “Dietary Approaches to Prevent and Treat Hypertension: A Scientific
Statement from the American Heart Association.” Hypertension 47(2): 296–308.
Baker, L. et al. 2003. “Use of the Internet and E-mail for Health Care Information: Results from
a National Survey. JAMA 289: 2400-2406.
Blaya, J., H. Fraser, and B. Holt. 2010. “E-Health Technologies Show Promise in Developing
Countries.” Health Affairs 29(2): 244-251.
Blonde, L., and C. G Parkin. 2006. “Internet Resources to Improve Health Care for Patients with
Diabetes.” Endocrine Practice 12(Suppl 1):131-137.
Bonina, C., and M. Rivero Illa. 2008. “Telefonía Móvil y Pobreza Digital en América Latina
¿Puede la Expansión de los Teléfonos Celulares Reducir la Pobreza en América Latina?”
DIRSI. (Serie Concurso de Jóvenes Investigadores 3).
Broom, A. 2005. “Virtually Healthy: The Impact of Internet Use on Disease Experience and the
Doctor-Patient Relationship.” Qualitative Health Research 15(3): 325-345.
Bull, S.S. et al. 2005. “Harnessing the Potential of the Internet to Promote Chronic Illness Self-
management: Diabetes as an Example of How Well We Are Doing.” Chronic Illness
1(2):143-155.
Card, D. 1992. “Do Minimum Wages Reduce Employment? A Case Study of California, 1987–
89.” Industrial and Labor Relations Review 46: 38-54.
Crocco, A. G., et al. 2002. “Analysis of Cases of Harm Associated With Use of Health
Information on the Internet.” JAMA 287: 2869-2871.
Cline, R. J. W,. and K. M. Haynes. 2001. “Consumer Health Education Seeking on the Internet:
the State of the Art.” Health Education Research 16(6): 671-692.
23

Dall, T. et al. 2010. “The Economic Burden of Diabetes.” Health Affairs 29(2): 297-303.
Diaz J. A. et al. 2002. “Patients’ Use of the Internet for Medical Information.” Journal of
General Internal Medicine 17(3): 180-185.
Dickerson S., et al. 2004. “Patient Internet Use for Health Information at Three Urban Primary
Care Clinics.” Journal of American Medical Informatics Association 11(6): 499-504.
Drummond, M. F. et al. 2005. Methods for the Economic Evaluation of Health Care
Programmes. London, United Kingdom: Oxford University Press.
Eysenbah G. et al. 2002. “Empirical Studies Assessing the Quality of Health Information for
Consumers on the World Wide Web: a Systematic Review.” JAMA 287: 2691-2700.
Faridi, Z. et al. 2008. “Evaluating the Impact of Mobile Telephone Technology on Type 2
Diabetic Patients’ Self-Management: The NICHE Pilot Study.” Journal of Evaluation in
Clinical Practice 14(3):465-459.
Fogel, J. et al. 2002. “Internet Use and Social Support in Women with Breast Cancer.” Health
Psychology 21(4): 398-404.
Fox, Susannah. 2007. E-patients with a Disability or Chronic Disease. Washington, DC: Pew
Internet and American Life Project.
Glasgow, R.E., et al. 2003. “The D-Net Diabetes Self-Management Program: Long-term
Implementation, Outcome, and Generalization Results.” Preventive Medicine 36(4): 410-
419.
Gruber, J. 1994. “The Incidence of Mandated Maternity Benefits.” American Economic Review
84(3): 622-641.
Gustafson, D.H. et al. 1999. “Impact of a Patient-centered, Computer-based Health
Information/Support System.” American Journal of Preventive Medicine 16(1): 1-9.
Harno, K., R. Kauppinen-Makelin, and J. Syryalainen. 2006. “Managing Diabetes Care using an
Integrated Regional e-Health Approach. Journal of Telemedicine and Telecare
12(Supplement 1):13-5.
Hong, Y., T. B. Patrick, and R. Gillis. 2008. “Protection of Patient’s Privacy and Data Security
in E-Health.” BMEI 1: 643-647.
Kahn, J., J. Yang and J. Kahn. 2010. “'Mobile Health Needs and Opportunities in Developing
Countries.” Health Affairs 29(2): 252-258.
24

25
Kalichman, S.C. et al. 2003. “Health-Related Internet Use, Coping, Social Support, and Health
Indicators in People Living With HIV/AIDS: Preliminary Results From a Community
Survey.” Health Psychology 22(1): 111-116.
Latin Business Chronicle. 2008. http://www.latinbusinesschronicle.com/app/article.aspx?id=3507
McKay, H.G., D. King and E. G. Eakin. 2001. “The Diabetes Network Internet-Based Physical
Activity Intervention. A Randomized Pilot Study.” Diabetes Care 24(8): 1328-1334.
Meigs, J. B. et al. 2003. “A Controlled Trial of Web Based Diabetes Disease Management. The
MGH Diabetes Primary Care Improvement Project.”Diabetes Care 26(3): 750-757
Murray, E. et al. 2003. “The Impact of Health Information on the Internet on the Physician
Patient Relationship.” Archives of Internal Medicine 163(14): 1727-1734.
Murray, A., and D. G. Safran. 2000. The Primary Care Assessment Survey: A Tool for
Measuring, Monitoring and Improving Primary Care. In: M.E. Maruish, editor.
Handbook of Psychological Assessment in Primary Care Settings. Mahwah, United
States:Lawrence Erlbaum Associates.
Pittaluga, L., and M. Sienra. 2007. “Utilización de las Teconologías de la Información y las
Comunicaciones en el Uruguay. Encuesta Nacional de Hogares Ampliada.” Módulo TIC
2do trimestre de 2006. Montivideo, Uruguay: Instituto Nacional de Estadística.
Rivero Illa, M. 2007. Enhancing the Livelihoods of the Rural Poor. The Role of Information and
Communication Technologies. Montevideo, Uruguay: ICP-Universidad de la República.
Ybarra, M., and M. Suman. 2008. “Reasons, Assessments and Actions Taken: Sex and Age
Differences in Uses of Internet Health Information.” Health Education Research 23(3):
512-521.
Wangberg, S. C. 2008. “An Internet-Based Diabetes Self-care Intervention Tailored to Self-
Efficacy.” Health Education Research 23(1):170-9.