The hydrous components in garnets: Grossular ... · American Mineralogist, Volume 76, pages I 153-I...
12
American Mineralogist, Volume 76, pages I 153-I 164, l99l The hydrous components in garnets: Grossular-hydrogrossular Gnoncr R. RossrrlN, Rocnn D. Arxts* Division of Geological and Planetary Science, California Institute of Technology, Pasadena, California 9 I 125, U.S.A. Ansrucr Grossular garnets from 33 localities were examined for indications of OH or HrO in their infrared spectrum. All contained OH-. Classical hydrogrossularwith more than 5 wto/o HrO displays systematicspectroscopic behavior consistent with the hydrogarnet sub- stitution consisting oftwo absorption bands at 3598 and 3662 cm '. These spectroscopic characteristics were generallynot observedin other glossular samples. Instead, 20 distinct absorption bands have been identified in the spectra of common grossular,occurring in groups of four to ten bands. Both the number and intensities of thesebands show a large variation, which does not correspond with the garnet's composition. Seven classesof spectra were identified in the OH region based on the position of the most intense ab- sorption band. The spectroscopic data suggest that in addition to the tetrahedral site, OH groups exist in multiple other environments. The OH content of grossulargarnetscan be obtained from infrared spectra using the equation HrO wto/o : 0.0000786 x integrated absorbance per cm in the OH region near 3600 cm '. The OH content of macroscopic grossular crystals (expressed as weight percent HrO) rangedfrom 12.80/o down to lessthan 0.0050/0. Macroscopic grossulartypically contains lessthan 0.3 wto/o HrO. Grossular from rodingites and low-temperature alteration vugs contained much more than that from skarn or contact metamorphic environments. INrnooucrroN The hydrogamet substitution, (OH)o : SiO", has been established in both synthetic and natural garnets.Gros- sular analyseshave been reported with over l0o/oHrO, and the structure of hydrogrossular has been determined with both X-ray and neutron diffraction (Cohen-Addad etal.,19671, Foreman, 1968; Basso et al., 1983; Sacerdoti and Passaglia, 1985; I-ageretal., 1987a,1989). Most hy- drogrossular with high OH contents consists of crystals typically no more than a few tens of micrometers in size, often with cores of grossularor intimately admixed with vesuvianite(Zabinski, 1966;Rinaldi and Passaglia, 1989). Although such high HrO content garnetsare rare, previ- ous infrared spectraofmacroscopic garnets have indicat- ed that a minor OH component is presentin a variety of garnets(Wilkins and Sabine, 1973). We have previously reported the results of a survey of the infrared spectros- copy of a number of pyrope-almandine garnets (Aines and Rossman, 1985a, 1985b) in which nearly all con- tained OH. The position of the bands in the spectrum of thesegarnets varied systematicallywith the garnet com- position, but the amount of OH varied for garnetsfrom different localities. This paper is primarily concerned with the OH content of common, macroscopic garnets of the grossular com- * Present address: Department ofEarth Science, Lawrence Liv- ermore National l,aboratories, Livermore, California 94550, U.S.A. position. Because the hydrogarnet substitution should be more prevalent in grossular than in pyrope-almandine garnets(Lager et al., 1989),we have examined a number of grossularsamples from a variety of localities to deter- mine if the hydrogrossular substitution was,indeed, com- monplace and to attempt to quantify the extent of this substitution. Infrared spectra have often been used previously to characteize synthetic hydrogrossular samples. These spectra confirm that OH is presentin hydrogrossular and should be a standard of comparison for the identification of OH in natural samples. However, when Passaglia and Rinaldi (1984) describedkatoite, a mineral in the hydro- grossularseries with less than one-third ofthe tetrahedral sites occupiedby Si, they presented an infrared spectrum that bears little resemblance to previously published gros- sular spectra and differs in detail from the spectra ofsyn- thetic hydrogrossular. Consequently, it seemed appropri- ate first to examine carefully the spectroscopic properties of garnetswith known hydrogrossularsubstitution in or- der to compare the spectroscopic properties of natural hydrogrossular samplesto their synthetic counterparts and to the common low OH-content grossularsamples. Such a comparison has not been previously critically per- formed. Expnnrprnx.rAl, DETAILS Sampleswere obtained primarily from museums and private collections.Details of samples, localities, and ma- jor element compositions are presented in Tables I and 0003-004x/9 1/0708-1 I 53$02.00 I 153
Transcript of The hydrous components in garnets: Grossular ... · American Mineralogist, Volume 76, pages I 153-I...

American Mineralogist, Volume 76, pages I 153-I 164, l99l
The hydrous components in garnets: Grossular-hydrogrossular
Gnoncr R. RossrrlN, Rocnn D. Arxts*Division of Geological and Planetary Science, California Institute of Technology, Pasadena, California 9 I 125, U.S.A.
Ansrucr
Grossular garnets from 33 localities were examined for indications of OH or HrO intheir infrared spectrum. All contained OH-. Classical hydrogrossular with more than 5wto/o HrO displays systematic spectroscopic behavior consistent with the hydrogarnet sub-stitution consisting oftwo absorption bands at 3598 and 3662 cm '. These spectroscopiccharacteristics were generally not observed in other glossular samples. Instead, 20 distinctabsorption bands have been identified in the spectra of common grossular, occurring ingroups of four to ten bands. Both the number and intensities of these bands show a largevariation, which does not correspond with the garnet's composition. Seven classes ofspectra were identified in the OH region based on the position of the most intense ab-sorption band. The spectroscopic data suggest that in addition to the tetrahedral site, OHgroups exist in multiple other environments. The OH content of grossular garnets can beobtained from infrared spectra using the equation HrO wto/o : 0.0000786 x integratedabsorbance per cm in the OH region near 3600 cm '. The OH content of macroscopicgrossular crystals (expressed as weight percent HrO) ranged from 12.80/o down to less than0.0050/0. Macroscopic grossular typically contains less than 0.3 wto/o HrO. Grossular fromrodingites and low-temperature alteration vugs contained much more than that fromskarn or contact metamorphic environments.
INrnooucrroN
The hydrogamet substitution, (OH)o : SiO", has beenestablished in both synthetic and natural garnets. Gros-sular analyses have been reported with over l0o/o HrO,and the structure of hydrogrossular has been determinedwith both X-ray and neutron diffraction (Cohen-Addadetal.,19671, Foreman, 1968; Basso et al., 1983; Sacerdotiand Passaglia, 1985; I-ager etal., 1987a, 1989). Most hy-drogrossular with high OH contents consists of crystalstypically no more than a few tens of micrometers in size,often with cores of grossular or intimately admixed withvesuvianite (Zabinski, 1966; Rinaldi and Passaglia, 1989).Although such high HrO content garnets are rare, previ-ous infrared spectra ofmacroscopic garnets have indicat-ed that a minor OH component is present in a variety ofgarnets (Wilkins and Sabine, 1973). We have previouslyreported the results of a survey of the infrared spectros-copy of a number of pyrope-almandine garnets (Ainesand Rossman, 1985a, 1985b) in which nearly all con-tained OH. The position of the bands in the spectrum ofthese garnets varied systematically with the garnet com-position, but the amount of OH varied for garnets fromdifferent localities.
This paper is primarily concerned with the OH contentof common, macroscopic garnets of the grossular com-
* Present address: Department ofEarth Science, Lawrence Liv-ermore National l,aboratories, Livermore, California 94550,U.S.A.
position. Because the hydrogarnet substitution should bemore prevalent in grossular than in pyrope-almandinegarnets (Lager et al., 1989), we have examined a numberof grossular samples from a variety of localities to deter-mine if the hydrogrossular substitution was, indeed, com-monplace and to attempt to quantify the extent of thissubstitution.
Infrared spectra have often been used previously tocharacteize synthetic hydrogrossular samples. Thesespectra confirm that OH is present in hydrogrossular andshould be a standard of comparison for the identificationof OH in natural samples. However, when Passaglia andRinaldi (1984) described katoite, a mineral in the hydro-grossular series with less than one-third ofthe tetrahedralsites occupied by Si, they presented an infrared spectrumthat bears little resemblance to previously published gros-sular spectra and differs in detail from the spectra ofsyn-thetic hydrogrossular. Consequently, it seemed appropri-ate first to examine carefully the spectroscopic propertiesof garnets with known hydrogrossular substitution in or-der to compare the spectroscopic properties of naturalhydrogrossular samples to their synthetic counterparts andto the common low OH-content grossular samples. Sucha comparison has not been previously critically per-formed.
Expnnrprnx.rAl, DETAILS
Samples were obtained primarily from museums andprivate collections. Details of samples, localities, and ma-jor element compositions are presented in Tables I and
0003-004x/9 1/0708-1 I 53$02.00 I 1 5 3
1154 ROSSMAN AND AINES: HYDROUS COMPONENTS IN GARNETS
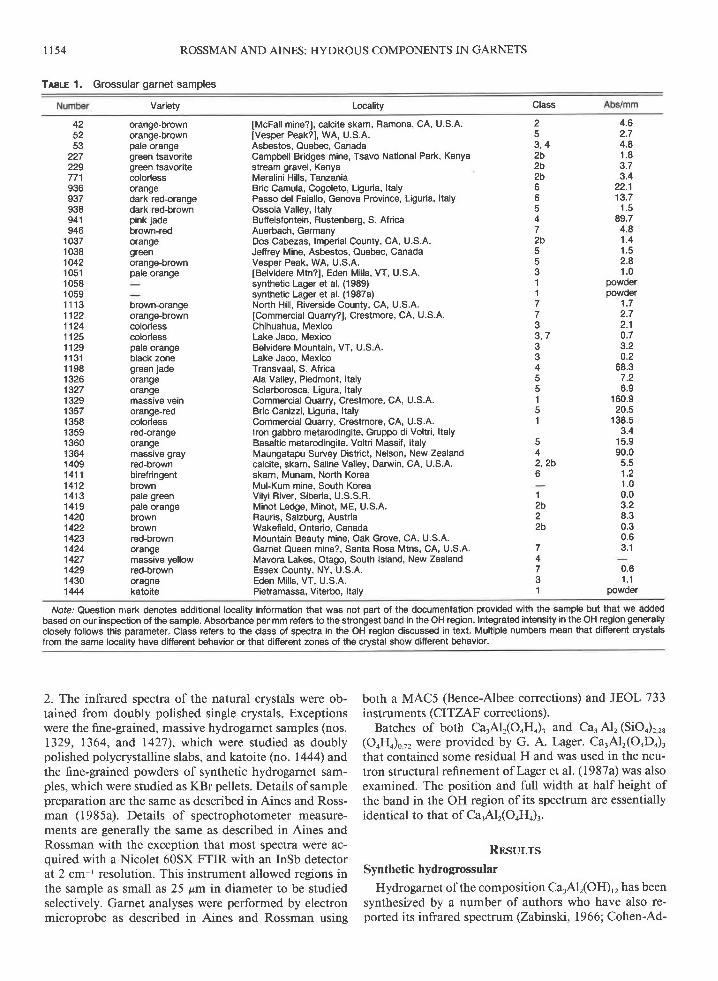
TABLE 1, Grossular garnet samples
Variety Locality Class
425253
227229771936937938941946
1 03710381042105110581 0591 1 1 31122112411251 1291 1311 1981 3261327't32913571 3581 3591 360136414091411141214131 4 1 91420't42214231424142714291430't444
orange-brownorange-brownpale orangegreen tsavoritegreen tsavoritecolorlessorangedark red-orangedark red-brownpink jadebrown-redorangegreenorange-brownpare orange
brown-orangeorange-browncolorlesscolorlesspale orangeblack zonegreen jadeorangeorangemassrve vernorange-reocolorlessred-orangeorangemassrve grayred-brownbirefringentbrownpale greenpale orangebrownbrownred-brownorangemassive yellowred-brownoragnekatoite
[McFall mine?], calcite skarn, Ramona, CA, U.S.A.lvesper Peak?], WA, U.S.A.Asbestos, Quebec, CanadaCampbell Bridges mine, Tsavo National Park, Kenyastream gravel, KenyaMeralini Hills, TanzaniaBric Camula, Cogoleto, Liguria, ltalyPasso del Faiallo, Genova Province, Liguria, ltalyOssola Valley, ltalyButfelsfontein, Rustenberg, S. AfricaAuerbach, GermanyDos Cabezas, lmperial County, CA, U.S.A.Jeffrey Mine, Asbestos, Quebec, CanadaVesper Peak, WA, U.S.A.lBelvidere Mtn?], Eden Mills, W, U.S.A.synthetic Lager et al. (1989)synthetic Lager et al. (1987a)North Hill, Riverside County, CA, U.S.A.lOommercial Quarry?], Crestmore, CA, U.S.A.Chihuahua, MexicoLake Jaco, MexicoBelvidere Mountain, VT, U.S.A.Lake Jaco, MexicoTransvaal, S. AfricaAla Valley, Piedmont, ltalySciarborosca, Ligura, ltalyCommercial Quarry, Crestmore, CA, U.S.A.Bric Canizzi, Liguria, ltalyCommercial Quarry, Crestmore, CA, U.S.A.lron gabbro metarodingite, Gruppo di Voltri, ltalyBasaltic metarodingite, Voltri Massif, ltalyMaungatapu Survey District, Nelson, New Zealandcalcite, skarn, Saline Valley, Darwin, CA, U.S.A.skarn. Munam. North KoreaMul-Kum mine, South KoreaVilyi River, Siberia, U.S.S.R.Minot Ledge, Minot, ME, U.S.A.Rauris, Salzburg, AustriaWakefield, Ontario, CanadaMountain Beauty mine, Oak Grove, CA, U.S.A.Garnet Queen mine?, Santa Rosa Mtns, CA, U.S.A.Mavora Lakes, Otago, South lsland, New ZealandEssex County, NY, U.S.A.Eden Mills, VT, U.S.A.Pietramassa, Viterbo, ltaly
2D
3 , 42b2b2b6b
3
472b5
53'|17733 , 7334cc151
42 , 2 bo
2b22b
4.62.74.81 . 83.73.4
22.113.71 . 5
89.74.81 . 41 .52.81 . 0
powoerpowder
1 . 72.72.10.73.2o.2
68.37.26.9
160.920.5
138.53.4
15.990.0
3 . C
1 . 21 . 00.03.28.30.30.63.1
0.61 , 1
powder
74
31
Nofe.'Question n''ark denotes additional locality information that was not part of the documentation provided with the sample but that we addedbased on our inspection of the sample. Absorbance per mm refers to the strongest band in the OH region. Integrated intensity in the OH region generallyclosely follows this parameter. Class refers to the class of spectra in the OH region discussed in text. Multiple numbers mean that different crystalsfrom the same locality have different behavior or that different zones of the crystal show different behavior.
2. The infrared spectra of the natural crystals were ob-tained from doubly polished single crystals. Exceptionswere the fine-grained, massive hydrogarnet samples (nos.1329, 1364, ar;'d 1427), which were studied as doublypolished polycrystalline slabs, and katoite (no. 1444) andthe fine-grained powders of synthetic hydrogarnet sam-ples, which were studied as KBr pellets. Details of samplepreparation are the same as described in Aines and Ross-man (1985a). Details of spectrophotometer measure-ments are generally the same as described in Aines andRossman with the exception that most spectra were ac-quired with a Nicolet 60SX FTIR with an InSb detectorat 2 cm-t resolution. This instrument allowed regions inthe sample as small as 25 p.m in diameter to be studiedselectively. Garnet analyses were performed by electronmicroprobe as described in Aines and Rossman using
both a MAC5 (Bence-Albee corrections) and JEOL 733instruments (CITZAF corrections).
Batches of both CarAlr(OoHo)3 and Ca3 Al, (Sioo)r r8(OoHo)., were provided by G. A. Lager. CarAlr(OuDo),that contained some residual H and was used in the neu-tron structural refinement ofLager et al. (1987a) was alsoexamined. The position and full width at half height ofthe band in the OH region of its spectrum are essentiallyidentical to that of CarAlr(OoHo)r.
Rnsur,rsSynthetic hydrogrossular
Hydrogarnet ofthe composition Ca.Alr(OH)', has beensynthesized by a number of authors who have also re-ported its infrared spectrum (Zabinski, 1966; Cohen-Ad-

ROSSMAN AND AINES: HYDROUS COMPONENTS IN GARNETS
TrsLe 2, Grossular analyses: formula proportions
I 1 5 5
Number Ca siTiMnFe,*Mg FeP- Crlnfrared vvt"/"
HrO
425253
227229771936937938941946
1 0371 03810421 0511 058a1 059A1 1 1 311221124112581125c1't291 1311 1981 32613271 329D1 35701 358a o1 3591 3601 409E1 409'14111412^14131 4 1 91420142214231424142914301444^
2.89 0.003.03 0.002.93 0.002.99 0.052.99 0.052.95 0.042.92 0.00
2.78 0.02
2.58 0.003.00 na3.00 na2.86 0.012.91 0.002.95 0.062.98 0.053.01 0.122.93 0.002.95 0.09
2.86 0.042.74 0.033.00 na2.67 0.163.00 na2.05 0.032.87 0.022.49 0.012.88 0.002.92 0.012.852.91 0.072.85 0.012.85 0.012.91 0.082:t2 0.012.83 0.00279 0.022.86 0.002.93 0.00
0.08 0.010.00 0.050.03 0.040.00 0.070.00 0.050.00 0.010.08 0.00
0.03 0.18
0.13 0.010.08 0.010.05 0.07
0.01 0.01na nana na
0.11 0.010.06 0.020.00 0.010.00 0.010.00 0.010.06 0.010.00 0.01
0.09 0.010.20 0.03na na
0.14 0.o2na na
0.90 0.020.09 0.020.09 0.410.04 0.080.03 0.04
0.150.o2 0.01o.12 0.010.12 0.030.00 0.010.59 0.280.13 0.030.18 0.010.12 0.02
1 .891 .671 .961 .781.841 .971.05
1.60
1 .661 .781 .93
1 .332.002.001 .521 .551.931 .701.291 .851 .76
1.741.662.OO0.992.001.801.471 .411 .541 .272.001 .711 .861,601 .871.881.721 .701.891.97
0.110.300.060.010.000.010.84
0.37
0.250.200.04
0.68nana
0.430.440.050.240.480. ' t70 .14
o.250.29na
0.80na
0.160.480.570.440.68
0.270 1 10.380.080.100.240.280 . 1 0
0.000.000.000.010.020.000.00
0.00
0.000.000.o2
0.00nana
0.000.000.000.000.000.000.00
0.000.00na
0.00na
0.000.000.000.000.00
0.000.000.000.000.000.000.000.00
nanana
0.07na
0.010.00
0.00
0.010.01na
nanananana
0.00nana
0.000.00
0.000.00nanana
0.010.000.010.000.00
0.000.000.000.000.010.000.000.00
0.000.020.000.020.020.020.11
0.03
0.010.010.01
0.00nana
0.050.020.000.020.280.000.05
0.020.05na
0.21na
0.030.050.010.020.0s
0.020.030.o20.040.010.04o.o20.00
3.023.002.982.963.012.992.99
2.96
2.973.013.01
2.982.280.002.992.993.022.992.802.973.00
3.002.991.642.841.532.962.882.973.002.973.002.982.962.952.962.992.962.913.000.64
nanana
na2.88
12.00nanananana
na
nana5.430.635.88nanananana
nananananana
nanananananana
0.100.14
0.21-0.380.090.150.181.261.010.08
0.260.06
0.08-0.190.1 1-0.130.02-0.04
0.090.130 . 1 10.030.u0.170.013.590.370.47
0.280.850.200.170.080.100.00030.160.260.020.060.170.050.06
na5.00
2.85 0.012.90 0.012.96 0.00
nana9.44
Nofe: The abbreviation na : not analyzed. All other analyses are electron microprobe analyses normalized to five cations in the combined X and Ysites, where Ti4* is assigned to the Y site, Fep* is used to fill the Y site, and the remaining Fe is assigned to Fe,* in the X site. Infrared wty" HrO valuesare from the calibration discussed in the text.
A Literature values: no. 1058 Lager et al. (1989), no. 1059 Lager et al. (1987a), no. 1357 Basso et al. (1981), no. 1358 Basso et al. (198i|), no.1412Hirai and Nakazawa (1986), no. 1444 Sacerdoti and Passagtia (1985).
s Colorless rim.c Brown inner region.o From X-ray cell parameters.E Rim.F Interior.
dad et al., 19671, Harmon et al., 1982; Kobayashi andShoji, I 983, I 984). The spectra ofthese synthetics providea basis of comparison to the natural garnets. The pub-lished spectra are dominated by a major band at 3660cm ', w'ith a broader side absorption decreasing in inten-sity to about 3000 cm '. The magnitude of the broadabsorption varies in the published spectra and containsinflections near 3420 cm-r, which are characteristic ofweakly bound HrO, and frequently present as adsorbedHrO. To avoid adsorbed H2O, our Ca3Alr(OH),, was care-
fully dried in a desiccator and made into a KBr pellet thatwas itself redried after preparation. The spectrum of thepellet, dominated by the major peak at 3662 cm-', showsessentially no indication of the molecular HrO contribu-tionat3420 cm-' and lacks the extensive tail toward lowerenergies (Fig. l).
Also relevant to the discussion ofnatural, hydrous sil-icate garnets are the synthetic garnets, which have partialsubstitution of SiOo by (OH)". Hsu (1980), Cohen-Addadet al. (1967), and Kobayashi and Shoji (1983, 1984) pre-

I 156
t . u
1.0
03800 3600 3400 3200
Wavenumbens (cm ' )
Fig. l. Comparison of the infrared spectra of natural andsynthetic hydrogrossular samples with high OH contents. Fromtop to bottom: synthetic hydrogarnets, CarAl.(SiOo).,, (OoHn)o ,,(no. 1058) in a KBr pellet; polycrystalline hydrogrossular no.1329 (4.2 pm thick); single crystal hydrogrossular no. 1358 fromCrestmore, California, (5.3 pm thick); katoite (no. 1444) in a KBrpellet; and synthetic CarAl?(OoHo)3 (no. 1059) dispersed in a KBrpellet.
sented infrared spectra of these materials. They have amajor absorption band in the range 3600-3620 cm' and
a minor band near 3660 cm-'. In addition, they showvariable amounts of broad absorption near 3420 cm ',
most l ikely from adsorbed HrO. Our spectrum ofCa.Alr(SiOo)r r, (OoHo)'.r, is consistent with the published
spectra (Fie. l).
ROSSMAN AND AINES: HYDROUS COMPONENTS IN GARNETS
0 0 2 0 4
( ! n
5) : v
r
o v
(u(J
cIU_oLoa
Proportion of OoHo in tetrahedral site
Fig. 2. Correlation between the proportion of the OH inten-sity in the 3662 cm-t band vs. the proportion of OoHo in thetetrahedral site. The vertical OH intensity axis represents theratio of band heights defined as (3662 cm-t)/(3662 cm-' + 3588cm-r) where the band heights were estimated by manually fittingthe spectrum to two Gaussian bands.
Natural hydrogrossular
Three samples of natural hydrogrossular with extensiveOH substitution were examined. One (no. 1358) was thehydrogrossular from Crestmore, California, originally de-scribed by Foshag (1920) under the name "plazolite." Itis one of the fragments given to Basso by Pabst. Its struc-ture was determined by Pabst (1937) and later refined byBasso et al. (1983). Its composition is approximatelyCarAlr(SiOo), ,. (OH)r rr. It consisted of a clear, colorlesscrystal fragment approximately 600 pm in size. The sec-ond sample (no. 1329) from Crestmore, California, orig-inally described as "plazolite?" by Woodward et al. (1941),consists of a colorless, somewhat turbid, fine-grained ma-trix, 3-5 mm thick, between grains of akermanite. It isfrom the hand specimen described in the unpublishedthesis of R. A. Crippen. The identity of the portion usedfor spectroscopic measurements was verified by X-raypowder diffraction (ao : 12.15 A, which indicates theformula CarAlr(SiOo), uo (OH), o, according to the calibra-tion of Basso et al., 1983). The third sample is the katoiteof Passaglia and Rinaldi ( I 984). Its spectrum was obtainedfrom a 50-pg crystal cluster that was ground and studiedas a micro-KBr pellet.
The infrared spectra of the two Crestmore hydrogros-sular samples are similar. They consist of a prominentband at 3598 cm-' with a secondary band atabout3677cm ' (Fig. l). The infrared spectra of the macroscopicgarnets discussed in the subsequent sections do not looklike this.
When the natural and synthetic hydrogrossular samplesare compared in Figure l, some trends appear. The bandat 3662 cm ' in the silica-free synthetic garnet is also thedominant band in the katoite spectrum. It is present to
U
Hydrogrossular OH band intensities
H y d n o g n o s s u l a n

some extent in all the spectra in Figure l, although it isshifted to slightly higher energies in the spectra of the moresilica-rich samples. With increasing silica content, the rel-ative intensity ofthe band at about 3598 cm ' increases.Our estimate of the proportion of the total OH intensitycontained in th e 3662 cm-t band, defined as peak heightruur/(height.uu, + heightrrnr), is nearly identical to the propor-tion of (OoHo) units in the tetrahedral position, indicatingthat the two components of the spectrum exhibit simplemixing behavior (Fig. 2).
A different type of spectrum is produced by massivehydrogrossular with much lower OH contents. The bestknown ofthese garnets is the so-called pinkjade ofSouthAfrica, a massive, impure form of hydrogarnet with about5olo HrO. Both Frankel (1959) andZabinski (1966) showedan absorption band at about 3620 cm-' in the KBr pelletspectra of pink jade.
Figure 3 compares the spectrum of a single-crystal re-gion in the pink jade from Transvaal (no. 941) with thesynthetic CarAl,(SiOo)r(OH). (no. 1058). Also included inFigure 3 are the spectra of the massive, pale blue-grayhydrogrossular from Nelson, New Zealand (no. 1364),which is similar to that of the pink jade. The spectrum ofthe pale yellow massive hydrogrossular from MavoraLakes, New Z,ealand (no. 1427), also resembles the pinkjade but contains additional features not identifiable withhydrogrossular, presumably arising from other hydrousminerals in the rock. The 3662 cm-' band of the syntheticsilica-free hydrogrossular is not prominent in any of thesespectra. Although the following discussion will detail theresemblance of the pink jade spectrum to a class of mac-roscopic grossulars (class 4), the vast majority ofgrossularspectra do not resemble the spectra of these massive, fine-grained hydrogrossular samples.
Natural macroscopic garnets
Absorption was observed in the OH region of the in-frared spectrum of every grossular examined. Only in thespectrum ofgrossular l4l3 was the absorption so weakas to be difficult to obtain. The spectra of these garnetsamples show a great diversity, unlike the generally sys-tematic spectral behavior observed in the natural HrO-rich hydrogrossular and in the pyrope-almandine garnetswhere the band position varies smoothly with composi-tion (Aines and Rossman, 1985a). The absolute intensityof the OH bands in grossular spans 3 orders of magnitude,significant variation in the appearance ofthe spectral fea-tures occurs within a single crystal, and the number ofbands and the positions of bands vary widely among gar-nets from different localities.
At first, it appears that there is nearly continuous vari-ation among the different types of grossular spectra. How-ever, when a large number of spectra are examined, anumber of similarities appear in certain sets of spectra.An empirical classification scheme can be devised basedupon the wavelength of the most prominent absorptionband in the spectrum. Ultimately, seven such classes ofspectra were distinguished. Figure 4 compares the least
l t57
2.O
U(J
co_o(-1
r n 4 r ] .L . V
3800 3600 3400 3200
Wavenumbens (cm - )
Fig. 3. Comparison ofthe infrared spectra ofnatural hydro-garnet and synthetic CarAlr(SiOo)r(OoHo). From top to bottom:synthetic CarAl,(SiOJ,(OoHo) no. 1058, pink jade no. 941, mas-sive hydrogrossular no. 1364, and massive hydrogrossular no.l 427. Samples 94 I and I 364 are presented scaled to I 2-pm thick-ness. Sample 1427 Is scaled to 20 prn. The concentration ofsample 1058 in the KBr pellet has been arbitrarily adjusted tohave an intensity comparable to slabs of the other materials.Spectra have been offset vertically for clarity.
complicated spectrum from each class. These spectra il-lustrate the range of wavenumbers of peak absorptionencountered in grossular; it extends from 3662 cm-r to3599 cm-'. Figures 5 through I I illustrate in more detailthe individual characteristics observed in these minerals.
Class I
This group is characterized by the most intense ab-sorption at 3662 cm-r. This is the only band in the spec-trum of the synthetic hydrogrossular (no. 1059) and is themost intense band in the katoite spectrum. Only one nat-ural sample has been observed with this band as the dom-inant band. It is a single zone in the anisotropic grossular(no. FMAP9O.l I l) from the Jeffrey mine (Allen and Bu-seck, 1988). In anisotropic garnet from Belvidere Moun-tain, Eden Mills, Vermont, this band may be the mostintense in one ofthe two extinction directions in spectrataken in polarized light.
Class 2
The most prominent band is at 3647 cm ' (Fig. 5). Asecond feature occurs at 3688 cm-'. Its least complicatedrepresentative is the Ramona, California, grossular (no.42), which occurs in calcite veins (Lager et al., 1987b).
ROSSMAN AND AINES: HYDROUS COMPONENTS IN GARNETS
H y d n o -g n o s s u l a n

- ^ ^ ^ ^ , , 1 - ^U I ' U J 5 U I d I
0)
tron(n
!
qJ(Jco_oLnnr-1
l 1 5 8
03800 3600 3400 3200
Wavenumbens (cm- t )
Fig. 4. Comparison of the infrared spectra of the least com-plicated spectrum from each class of spectra. From bottom totop: class I to class 7. Sample numbers are indicated beside eachspectral trace. Spectra thicknesses are scaled to produce com-parable absorption intensities.
7.?
1 .0
0 .8
0 .6
o.4
v . a
3800 3600 3400 3200
Wavenumbens (cm- t )Fig. 5. Class 2 grossular spectra with the strongest peak at
3646 cm-t. From top to bottom: no.771,100 pm, Tanzania; no.1420, 54.7 pm, Salzburg; no. 42,94.0 pm, Ramona.
ROSSMAN AND AINES: HYDROUS COMPONENTS IN GARNETS
0.8
0 .4
v . (
0
n l
Otrrcf
a_o
3800 3600 3400 3200
Wavenumbens (cm- l )
Fig. 6. Class 3 grossular spectra with the strongest peak at3630 cm I. From top to bottom: no. 1430, 307 pm, Eden Mills;no. 53B-F, 22.1 pm, Asbestos; no. 1051, 380 pm, Eden Mills.
Class 2b
A more complicated variant of the class 2 garnet con-sists of garnet with the prominent band at 3645 cm-' inaddition to a series oflower energy bands, including thoseat 3600. 3568. and 3548 cm '. This class is best exem-plified by the colorless to bright green vanadian grossularsamples from the calcite pods of the Tsavo district ofKenya (nos. 229 and 77 l).
Class 3
These garnet samples (Fig. 6) have their most promi-nent component at 3631 cm '. It is best exemplified bythe sample from Eden Mills, Vermont (no. 105 l). A com-ponent aI 3663 cm ' is always present and is sometimesprominent such as in the spectrum of no. 53B. Lowerenergy bands near 3584 cm ' and 3560 cm ' are welldeveloped in some members of the class.
Class 4
These garnet samples (Fig. 7) have their prominent bandat 3621 cm-'. Sample 53 is transitional between groups3 and 4. The class 3 band at 3631 cm-' is nearly as intenseas the 3621 cm-r band. Sample 941 is characteristic ofclass 4 garnet samples. It is a type of rock known as SouthAfrican Jade. The pink variety of this material consistsof an intimate mixture of two grossular phases that differin their OH content (Zabinski, 1966; Bank, 1982). Itsspectrum has been frequently studied. Both Frankel (1959)
0
G r - o s s u l a nC l a s s 3
- ^ ^ ^ ^ , , 1 ^U I ' U J 5 U I d
C l a s s 2

3.0
?.o
G n o s s u l a nn l ^ ^ ^ tu - t d J 5 z +
3 J
94t
0 n
J U U U 3600 3400 3200
Wavenumbens (cm- t )Fig. 7. Class 4 grossular spectra with the strongest peak at
3621 cm '. From top to bottom: no. 53B, 405 pm, Asbestos; no.941,21 pm, South Africa.
and Zabinski (1966) showed an absorption band at about3620 cm ' in a spectrum ofthe powder from South AfricanJade. We obtained the spectrum from a small, thin, singlegrossular crystal in the pink jade. We found a peak at 3621cm' and a secondary band at 367 2 cm- | . Of all the naturalgrossular samples, the spectrum of the pink jade mostclosely resembles the synthetic Sir * hydrogarnet (no. I 058),appearing as a spectroscopically better resolved versionof the synthetic. The spectra of other, massive hydro-grossular samples from New Zealand resemble the spectraof pink jade (Fig. 3).
Class 5
The class 5 garnet samples were the most commonlyencountered (Fig. 8). Their spectra have the strongest peakat 36ll cm ' with side peaks at about 3664 and,3562cm-'. The spectrum of the Vesper Peak, Washington, gar-net (no. 1042) is the simplest in this class. A variety ofother peaks can occur in these spectra, primarily betweenthe two side peaks. The Italian grossular samples (e.g.,nos. l32l and 1357) are typical of the more complicatedbehavior in this class.
Class 6
These grossular samples have their main peak at 3602cm-' (Fig. 9). Members of this class were infrequentlyencountered. The distinction between classes 6 and 7 issmall. Grossular l4ll is transitional between the twoclasses.
I 159
0.6
o.4
u . t
n3800 3600 3400 3200
Wavenumbens (cm- t )Fig. 8. Class 5 grossular spectra with the strongest peak at
3612 cm '. From top to bottom: no. 938,204 pm, Ossola Valley;no. 1327,41 pm, Sciara; no. 1357, 38.2 pm, Bric Canizzi; no.1042, 116 pm, Vesper Peak.
0.8
0 .6
G n o s s u I a r -C l a s s 6
1 4 I T
v J o
o.4
o.2
3800 3600 3400 3200
Wavenumbens (cm- t )Fig. 9. Class 6 grossular spectra with the strongest peak at
3602 cm '. From top to bottom: no. 141 l, 358 pm, Manum; no.936,27.2 pm, Bric Camula.
ROSSMAN AND AINES: HYDROUS COMPONENTS IN GARNETS
0.8
U
OC(o
_C]Loa_o
n t
Cfr
Ln
1.0
0
ot t
co_oL
a
0
G n o s s u l a nr l a a a E
938

G n o s s u l a nC l a s s 7
l 160
1.0
0 .8
N A
o.4
v . (
n
3800 3600 3400 3200
Wavenumbens (cm- t )Fig. 10. Class 7 grossular spectra with the strongest peak at
3614 cm-'. From top to bottom: no.946, l l l pm, Auerbach;no. 1122, 175 pm, Crestmore; a dark interior zone of no. I125,2.812 mm, Lake Jaco.
Class 7
Many of the class 2b features are found in these garnetsamples. However, the most intense feature of class 7garnets is the band at about 3599 cm-r (Fig. l0). The 3644cm ' band ofthe class I garnet samples is replaced by oneat 3641 cm-'. These features are found in the spectra oflarge, orange-brown grossular samples from the contactzone of the calcite body at Crestmore, California, (no.ll22) and Auerbach, Germany, (no. 946) and in the rimsof the large grossular samples from skarns east of LakeJaco, Mexico.
Miscellaneous behavior
Two garnet samples proved difficult to classify into oneofthe above categories. Their spectra are depicted in Fig-ure I l. The reddish orange grossular from Gruppo diVoltari (no. I 359) has a peak at 361 4 cm-' and two prom-inent side lobes at 3566 and 3658 cm-'.
No evidence of structurally bound molecular HrO
The near-infrared spectral region was examined for ev-idence of molecular HrO in natural garnet. If present, itwould give rise to an absorption band at about 5200 cm '
from the combination mode (bend + stretch). Becausebands in the region are about 100 times less intense thanthose in the region of the fundamental stretch of the OHgroups (-3500 cm-'), it was necessary to use thick sam-ples for near-infrared studies. When the even less-intense
ROSSMAN AND AINES: HYDROUS COMPONENTS IN GARNETS
0.4
Cn-o(r-1r n_o
OJ
C
_oL
a_o
0.3
G n o s s u l a n
1423
1359
u .c
n 4
0 . U
3800 3600 3400 3200
Wavenumbens (cm - )
Fig. ll. Grossular spectra that do not fit into one of thespectroscopic classes. From top to bottom: no. 1423,85.5 pm,Oak Grove; no. 1359, 15.0 pm, Gruppo di Voltri.
first overtones of the OH modes were clearly observednear 7 100 cm-', there never was any indication of a HrOcombination mode in the spectra of unaltered, inclusion-free garnet. Our results with grossular samples are con-sistent with our previous results (Aines and Rossman,I 98 5b) with pyrope-almandine-spessartine garnets, whichalso indicated that H substituted in garnets as OH ratherthan HrO. The only molecular HrO found in the garnetspectra is associated with fluid inclusions visible in thesample. In most cases in our study, it was possible to findan optical path sufficiently free of inclusions (e.g., 100 pmdiameter) for the spectroscopic measurements.
Zonation of OH
The concentration of OH in these garnets is often het-erogeneous. Typical examples are illustrated in Figure 12.There was no consistent zonation trend from core to rim.The rims of grossular samples 1042 (Vesper Peak), I125(Lake Jaco), and 1409 (Saline Valley) were most concen-trated in OH, whereas the cores of grossular samples 14 I 2(Mul-Kum) and 1038 (Asbestos) contained the most. Thegreatest concentration difference we observed was a factorof -4 for grossular sample I4l2 from Mul-Kum.
Correlation with chemical cornposition
We were unable to establish any broadly applicablecorrelations of individual IR bands with minor or tracecomponents in the garnet samples. Concentration profilesacross a number of samples were examined, but they did

not lead to any noteworthy correlations. For example,garnet 1038 contains a green core (Cr3*) and a colorlessrim. Although its infrared pattern showed extensive core-to-rim variation, no correlation could be established withmajor or minor elements.
The large grossular samples from Lake Jaco, Mexico,(e.g., I 125) usually display color zonation. Frequently theyhave colorless rims with interior zones that are brownwhen thin. The primary chemical difference between thezones is the order ofmagnitude greater Ti content in thebrown zones. The spectra ofthe two zones are very dif-ferent (Fig. l2). Because the spectrum of the dark zone issimilar to grossular sample ll22 from Crestmore (Fig. 9),which has about the same Ti content as the colorless zoneofthe Lake Jaco garnet, it is unlikely that the spectroscopicdifferences are necessarily due to Ti.
Very little difference results from the substitution of Vfor Al in grossular from Kenya. The spectrum ofthe green,vanadian grossular (variety, tsavorite, rro. 227) is essen-tially identical to V-free grossular from the same locality(no. 77 l) in spite of a large difference in the V content.
The lack of identifiable correlation with the minor el-ement contents was also observed in an extensive studyof the zonation of OH in grossular from Belvidere Moun-tain (Allen and Buseck, 1988). Furthennore, changes inthe occupation of the octahedral site had little effect onthe spectrum of synthetic high OH-content hydrogrossularsamples in the work of Kobayashi and Shoji (1984). Theyreported that the wavenumbers of OH absorption bandsin their synthetic garnet samples changed by only 4-6cm ' with replacement of up to l0 molo/o of andradite.
Temperature dependence of the spectra
The spectra of about one-third of the garnet sampleswere obtained at -78 K. Spectroscopic resolution im-proved and more bands were revealed. Although reso-lution of features improved, the same components couldbe found in the room temperature spectra with secondderivative analysis.
Ansolurn H coNrnNrs
We have tried to determine the absolute H content ofsome of these garnet samples with H manometry, evolvedHrO coulometry, and thermal analysis and nuclear reac-tion analysis. In many instances we find that our resultswere not reproducible with the low OH-content garnet.In most of these cases, the analyses are being carried outnear the limit of their accuracy because of either the lowabsolute H contents or the difficulty with surface HrOacquired during the grinding of samples. Furthermore, itis usually necessary to work with very small portions ofthe sample to avoid the fluid inclusions that are presentin nearly all samples. The fluid inclusions have minimalinfluence upon the spectroscopic results because they oc-cupy a small proportion of the total area of the sample,and it is usually possible to select small apertures to de-lineate areas free of the inclusions. The inclusions, how-ever, have a major influence upon the total H analyses
I l 6 l
3800 3600 3400 3600 3400
Wavenumbens ( cm- t )
Fig. 12. Four examples of spectra that demonstrate core-to-rim zonation ofOH in grossular. Each set ofspectra is presentedin the 3800 to 3400 cm-'region. No. 1042, Vesper Peak, 1.2mm thick, 4.0 absorbance full scale, rim slightly more intensethan the core. No. ll25,Lake Jaco, 0.60 mm thick, 0.4 absor-bance full scale, colorless rim much more intense than the browncore. No. 1409, Saline Valley, 0.18 mm thick, 2.0 absorbancefull scale, rim more intense than the core. No. 1038, Asbestos,0.225 mm thick, 2.0 absorbance full scale, colorless rim lessintense than the g.reen core.
because they represent a highly concentrated source ofHin the volume of the sample used for H analysis.
Results that we judge to be most reliable are presentedin Table 3 together with literature analyses for some ofthe samples studied. The values believed to be most ac-curate are from the garnet samples with the highest OHcontents. These are used to establish an absolute calibra-tion of the 3600 cm-' region infrared spectral data. Figurel3 summarizes the results. We found that somewhat bet-ter correlations can be obtained from integrated absor-bance values than from the peak height values (absor-bance/millimeter in Table l).
From the reported OH content of Pabst's Crestmorehydrogrossular (5.88 OH per formula unit) and the OHcontent of the Crippen hydrogrossular (5.43 OH), we canestablish molar absorptivity values for OH in these gar-nets. The € values per mole per liter concentration of OHcalculated from the main peak at about 3598 cm I are 62and 79 for the Pabst and Crippen samples, respectively.The integrated absorbance values for these two garnetsamples are 367 5 and 38 l6 per mol/L of OH, respectively,where the integrated absorbance is calculated for a crystal1.0 cm thick.
For purposes ofthis paper, we use the average integrated
ROSSMAN AND AINES: HYDROUS COMPONENTS IN GARNETS
OJ(JCru_oLoa

rt62
200
1 5 0Grossular
o o
o
B
1 0 0
H2O, Wt %
Fig. 13. The calibration of the infrared integrated absorbancein the 3700-3400 cm ' region to analytically determined OHcontents expressed as weight percent HrO.
absorbance value, 3746, for calculating OH concentra-tions. Specifically, a crystal 1.5 mm thick with a measuredintegrated absorbance of 3 I 0 would have a calculated in-tegrated absorbance of 2067 for a I cm path. This cor-responds to an OH concentration of 2067 /3746 : 0.546mol OH/L. If the crystal's density were 3.15, it wouldcontain (0.546 moUL x l7 g OH/mol)/(3150 g/L) :0.295
wto/o OH:0.156 wto/o HrO. The calibration can be ex-pressed in the following two equations:
H,O wto/o : 0.0768 (0.0053) x absorbance per mm
H,O wto/o : 0.000 078 6 (0.000 000 9)
x integrated absorbance per cm
where the numbers in parentheses are the standard errorof the coefficient from the regression analysis of the datain Table 3. An integrated absorbance ofabout 12720 percm per wt0/o HrO is indicated for the higher HrO contentgarnets if minor differences in garnet density are ignored.
Many problems and questions remain about the ab-solute calibration. Our data are inadequate to determine
ROSSMAN AND AINES: HYDROUS COMPONENTS IN GARNETS
ac
P
c
c;
c
I
Eo
NF
q n
a!c
hf
-cF
a
(l)
c
5 0 0
400
1 n n
200
1 0 0
0
cp
Grossular
o
@
0 5 0 1 0 0 1 5 0
Jooo cm I
I n teq . I n tens .
(Thousands)
Fig. 14. Correlation between the integrated absorbance in the3600 crn I region to the integrated absorbance in the 7200 cm '
reglon.
if the calibration factors actually increase for the iow HrOcontent garnet samples as the first two points of Figure13 suggest. We also have not determined if the differentclasses of hydrogarnet spectra have significantly differentcalibration factors.
The HrO contents of our grossular samples range from12.760/o (no. 1329) to nearly zero (no. l4l3) with valuescommonly less than 0.25o/o. The highest HrO contentsoccur in garnets from rodingites, rocks subjected to meta-somatic replacement, or from vugs containing productsof presumably low-temperature alteration. Garnets fromtlpicat carbonate skarns have the lowest HrO contents.
NnAn rNrn-lRED sPEcrRA
In some cases, experimental considerations make it de-sirable to measure the near-infrared OH overtones at about7200 cm-t rather than the fundamental bands near 3600cm r. We explored the correlation between the intensities
1 4t z1 0
Tlele 3. Summary of calibration data for grossular HrO analyses
Integ. abs. HrO content Method of analysis
GrossularGrossularGrossularGrossularHydrogrossularGrossularHydrogrossularGrossular
53'5353F
9411 3291 3571 3581360
2877 0 .182877 0.184796 0.28
61 250 5.00153 420 11 .71
15746 1.20158 750 12.7510 839 0.97
PrOs cell coulometryH2 evolved gas volume1,F nuclear reactionPrOs cell coulometrycalculated from X-ray aoBasso et al. (1981)Basso et al. (1983)Basso et al. (1984a)
* Number 13 of Aines and Rossman (1985b).

of the near infrared and the fundamental OH bands. Fig-ure l4 illustrates a good correlation between the integratedintensities of the bands at -3600 cm 'and -7200 cm Iin the mid-IR. The peak heights of the -3600 cm-'bandsare about 650 times more intense than those near 7200cm-', whereas the integrated intensities are about 340times greater in the 3600 cm-' region than in the 7200cm-tregion.
The resulting calibration equations are:
(H,O) wto/o : 49.7 (0.78) x absorbance per mm(H,O) wto/o : 0.0255 (0.0014)
x integrated absorbance per cm
where the numbers in parentheses are the standard errorofthe coefficient from the regression analysis.
BrnrrnrNcnNT GARNETS
Anisotropic OH absorption was previously reported ina birefringent grossular from Asbestos, Canada, (no. 53)leading Rossman and Aines (1986) to suggest that theordering of the OH could be responsible for the deviationfrom cubic symmetry. Three other strongly birefringentgarnet samples (nos. l4ll and l4l3), including the an-dradite-grossular from Mul-Kum (no. l4 l2) described byHirai and Nakazawa (1986), were examined in this study.The latter three samples differed from the Asbestos garnetby being much more strongly birefringent and by con-taining much less OH. The latter three garnets have spec-tra that are only weakly anisotropic in the OH region.
DrscussroN
The spectra ofthe natural and synthetic hydrogrossularsamples and katoite are most readily interpreted in termsof two types of OH environments that account for the twobands at 3662 cm-' and 3 598 cm'. One pair of candidatesfor the two sites comes from the X-ray data of Sacerdotiand Passaglia (1985) and Basso et al. (1983) who suggestthat the OH sites are different in katoite and plazolite.Sacerdoti and Passaglia have the O-H vector in katoiteprojecting into the volume of the d-site tetrahedron,whereas Basso et al. ( I 98 3) have the O-H vector projectingoutside the tetrahedron. This distinction is difficult tosupport in view ofthe results oflager et al. (1987a, 1989)who also find the O-H vector projecting outside the vol-ume of the tetrahedron in both end-member katoite andhydrogrossular samples of intermediate composition.
Hydrogarnet structures display positional disorder thathas been described in terms of two O sites (the split-atommodel of Ambruster and Lager, 1989). They correspondto the O sites in anhydrous grossular and the sites in Si-free katoite. Our interpretation ofthe hydrogarnet spectrais that it represents the superposition of these two sites.The3662 cm I band in the silica-free hydrogrossular, fol-lowing the assignment of Harmon et al. (1982), representsO.Ho groups that are surrounded by other OuHo groups.The component at 3598 cm-I corresponds to the band inthe 3600-3620 cm-r range previously reported by various
I 163
authors. We assign the band at 3598 cm-', which is dom-inant in the silica-rich hydrogrossular samples, to (OoHo)groups adjacent to SiOo groups. The spectrum ofthe highOH-content hydrogrossular samples then can be viewedas a superposition of the two types of (OoHo) componentsdominated by the Si-free katoiteJike sites.
The hydrogrossular spectrurn in common garnet
The spectra ofmost ofthe low OH content, macroscopicgrossular samples do not resemble those of garnets withverified hydrogrossular substitution. Only the class 4 spec-tra resemble the spectra of the authentic intermediate SiOocontent hydrogrossulars. The complexity and diversity ofthe spectra ofthe low OH content grossular argue that thehydrogrossular substitution found in the high OH contentgarnets is not the dominant mode of substitution at lowerOH contents.
A number of authors have proposed that H occupiessites other than the tetrahedral Si site in hydrogarnets.Basso et al. (1984a, 1984b), Basso and Cabella (1990),and Birkett and Trzcienski (1984) proposed that H maysubstitute in both the dodecahedral and octahedral sites.Kalinichenko et al. (1987) suggest that the protons in hy-drogrossular are situated in both the tetrahedral and theoctahedral sites. The complexity of the spectra of low OHcontent grossular in the OH region is intuitively consistentwith a multiple site occupancy. However, an attempt byLager et al. (1989) to test this hypothesis found no evi-dence for multisite occupancy in the X-ray study of hy-drous titanian andradites. Unfortunately, the garnets thatoften show the greatest spectral complexity in the OHregion contain concentrations of OH too low to be studiedby conventional diffraction techniques. Our initial at-tempts to examine this problem with NMR methods havealso been thwarted by the low OH concentrations in mostnatural samples (Yesinowski et al., 1988).
CoNcr,usroNs
l. Essentially all grossular contains OH.2. The fine-grained grossular samples classically called
hydrogrossular are the most OH-rich.3. Among macroscopic grossular, that from rodingites
is the richest in the OH component.4. Garnets from carbonate skarns contain the lowest
concentrations of OH.5. The OH is readily observed in infrared spectra.6. The infrared spectra of macroscopic garnet samples
are significantly different from the spectra of true hydro-grossular, suggesting that the hydrogarnet substitution SiOo: (OoHo) is not the only means of incorporating OH.
7. For macroscopic grossular examined in this study,seven different classes ofinfrared spectra can be identifiedbased on the energy of the most intense OH absorptionband.
8. Grossular can be zoned in both the concentration ofOH and in details of its site in the crystal.
9. The details of the OH absorption in the infrared are
ROSSMAN AND AINES: HYDROUS COMPONENTS IN GARNETS
t164 ROSSMAN AND AINES: HYDROUS COMPONENTS IN GARNETS
so characteristic that in many cases it was possible toidentify the locality from which an individual grossularcame once a standard spectrum was available.
10. The analytical amount of OH in grossular can beestimated from the infrared spectmm. An integrated ab-sorbance of 37 46 per cm thickness corresponds to an OHconcentration expressed as H2O of I mol of HrO per literof sample.
AcxNowr-rncMENTs
We thank D.G. Schlom for assisting with our synthesis of hydrogarnetand G.A. I-ager (University of Kentucky) for providing samples of hissynthetic hydrogarnets and numerous helpful discussions about the hy-drogamet substitution. Other garnets for this study were donated by A.L.Albee (Caltech), F.M. Allen (Arizona State University), G Amthauer(Salzburg), D. Atkinson (Santa Barbara), R. Basso (Genoa), C. Bridges(Nairobi), B. Cannon (Seattle), R. Coleman (Stanford), R.H. Currier (Ar-cadia), P. Flusser (l,os Angeles), C. Francis (Harvard Mineral Museum),M. Gray (Culver City), G. Harlow (American Museum), W.A. Henderson(Stanford), H S. Hill (Altadena), P. Keller (Los Angeles County Museum),G.A. Novak (California State University, I-os Angeles), and Y. Takeuchi(Tokyo). This study was funded in part by NSF grants EAR-7919987,EAR-8313098, EAR-8618200, and EAR-8916064. Contribution no. 4449.
RnrnnnNces crrEDAines, R.D., and Rossman, G.R. (1985a) The water content of mantle
garnets. Geology, 12, 720-723.- (1985b) The hydrous component in garnets: Pyralspites. American
Mineralogist, 69, | | 16-1 126.Allen, F.M., and Buseck, P.R. (1988) XRD, FIIR, and TEM studies of
optically anisotropic grossular garnets. American Mineralogist, 73, 568-584.
Armbruster, T., and Lager, G.A. (1989) Oxygen disorder and the hydrogenposition in garnet-hydrogarnet solid solutions. European Journal ofMinerafogy, l, 363-369.
Bank, H. (1982) Uber Grossular und Hydrogrossular. Z€itschrift derDeutschen Gemmologischen Gesellschaft, 3 l, 93-96.
Basso, R., and Cabella, R. (1990) Crystal chemical study of garnets frommetarodingites in the Voltri Group metaophilites (Ligurian Alps, Italy)Neues Jahrbuch fiir Mineralogie Monatshefte, 127-136-
Basso, R., Giusta, A.D., andZnfiro, L. (1981) A crystal structure study ofa Ti-containing hydrogarnet. Neues Jahrbuch fiir Mineralogie Monat-shefte, 230-236.
- (1983) Crystal structure refinement ofplazolite: A highly hydratednatural hydrogrossular. Neues Jahrbuch fiiLr Mineralogie Monatshefte,25t-258.
Basso, R., Cimmino, F., and Messiga, B. (1984a) Crystal chemical andpetrological study of hydrogarnets from a Fe-gabbro metarodingite(Gruppo di Voltri, Western Liguria, Italy). Neues Jahrbuch fiir Minera-logie Abhandlung, l5O, 247 -258.
- (1984b) Crystal chemistry of hydrogarnets from three differentmicrostructural sites of a basaltic metarodingite from the Voltri Massif(Western Liguria, Italy). Neues Jahrbuch fiir Mineralogie Abhandlung,r48,246-258.
Birkett, T.C., and Trzcienski, W E (1984) Hydrogamet: Multi-site hy-drogen occupancy in the garnet structure Canadian Mineralogist, 22,675-680.
Cohen-Addad, C., Ducros, P., and Bertaut, E.F. (1967) Etude de la sub- Menuscnrrr REcErwD Aucusr 20,1990stitutiondugoupementSiO4par(OH)4danslescomposdsAlrCa,(OH),, Meuuscntrr AcCEPTED AprIr 18, 1991
et AlrCa.(SiO")r,u(OH),'u de type grenet. Acta Crystallographica, 23,220-230.
Foreman, D.W. (1968) Neutron and X-ray diffraction study ofCa.Al,(O"Do),, a garnetoid. Joumal of Chemical Physics, 48, 3037-304r.
Foshag, W.F. (1920) Ptazolite, a new mineral. American Mineralogist, 5,183 -1E5 .
Frankel, J.J. (l 959) Uvarovite garnet and South African jade from Trans-vaal. American Mineralogist, 44, 565-59 l.
Harmon, K.H., Gabriele, J.M., and Nuttall, A.S. (1982) Hydrogen bond-ing. Part 14. Hydrogen bonding in the tetrahedral OoHl- cluster inhydrogrossular. Journal of Molecular Structure, 82, 213-219.
Hirai, H., andNakazawa, H. (1986)Yisualizinglowsymmetryofa granditegarnet on precession photographs. American Mineralogist, 71, l2l0-1213.
Hsu, L.C. (1980) Hydration and phase relations ofgtossular-spessartinegarnets at PH,o : 2Kb. Contributions to Mineralogy and Petrology, 7 I,407-415.
Kalinichenko, A.M., Proshko, V.Ya., Matyash, I.C., Pavlishin, Y.I., andGamarnik, M.Ya. (1987) NMR data on crystallochemical features ofhydrogrossular. Geochemistry International, 24, 132-135 (translatedfrom Geokhimiya, no.9, 1363-1366, 1986).
Kobayashi, S., and Shoji, T. (1983) Infrared analysis ofthe grossular-hydrogrossular series. Mineralogical Journal, I l, 331-343.
- (1984) Infrared analysis ofthe grossular-hydrogrossular series witha small amount of andradite molecule. Mineralogical Journal, 12, 122-I 36.
Lager, G.A., Armbruster, T., and Faber, J. (1987a) Neutron and X-raydiffraction study of hydrogarnet Ca3Al,(O4H4). American Mineralogist,72 ,7 56 -765 .
Lager, G.A., Rossman, G.R., Rotella, F.J., and Schultz, A.J. (1987b) Neu-tron-diffraction structure of a low-water grossular at 20 K. AmericanMinerafogist, 72, 7 66-7 68.
Lager, G.A., Armbruster, Th., Rotella, F.J., and Rossman, G.R. (1989)The OH substitution in garnets: X-ray and neutron diffraction, infraredand geometric-modeling studies. American Mineral ogist, 7 4, 840-8 5 l.
Pabst, A. (1937) The crystal structure of plazolite. American Mineralogist,22,86r-868.
Passaglia, E., and Rinaldi, R. (1984) Katoite, a new member of theCa.Alr(SiOo),-CarAl,(OH),, series and a new nomenclature for the hy-drogrossular group of minerals. Butletin de Min6ralogie, 107, 605-6I 8.
Rinaldi, R., and Passaglia, E. (1989) Hibschite topotype: Crystal chemicalcharacterization. European Journal of Mineralogy, l, 639-644.
Rossman, G.R., and Aines, R.D. (1986) Birefringent grossular from As-bestos, Quebec, Canada. American Mineralogist, 7 l, 7 7 9-7 80.
Sacerdoti, M., and Passaglia, E. (1 985) The crystal structure ofkatoite andimplications within the hydrogrossular group of minerals. Bulletin deMin6ralogie, 108, l-8.
Wilkins, R.W.T., and Sabine, W. (1973) Watercontent of some nominallyanhydrous silicates. American Mineralogist, 58, 508-5 I 6.
Woodward, A.O., Crippen, R.A., and Garner, K.B. (1941) Section acrossCommercial Quarry, Crestmore, California. American Mineralogist, 26,35 l - 38 l .
Yesinowski, J.P., Ecken, H., and Rossman, G.R. (1988) Characterizationof hydrous species in minerals by high-speed 'H MAS-NMR. Journalofthe American Chemical Society, ll0, 1367-1375.
Zabinski, W. (1966) Hydrogarnets. Polska Akademia Nauk, Oddzial Kra-kowie, Komisja Nauk Mineralogicznych, Prace Mineralogiczne, 3, 1-69.