1 Revision 3: Phase Transformation of Hydrous Ringwoodite ...
29
1 Revision 3: Phase Transformation of Hydrous Ringwoodite to the Lower-Mantle 1 Phases and the Formation of Dense Hydrous Silica 2 Huawei Chen 1 , Kurt Leinenweber 2 , Vitali Prakapenka 3 , Martin Kunz 4 , Hans A. Bechtel 4 , 3 Zhenxian Liu 5 and Sang-Heon Shim 1 4 1 School of Earth and Space Exploration, Arizona State University, Tempe, Arizona. 2 Eyring Materials Center, Arizona State University, Tempe, Arizona. 3 GeoSoilEnviroCars, University of Chicago, Chicago, Illinois. 4 Advanced Light Source Division, Lawrence Berkeley National Laboratory, Berkeley, California. 5 Geophysical Laboratory, Carnegie Institution of Washington, Washington, DC. 5 Keywords: stishovite, ringwoodite, bridgmanite, periclase, water, mantle 6 7 Abstract 8 In order to understand the effects of H 2 O on the mineral phases forming under the 9 pressure-temperature conditions of the lower mantle, we have conducted laser-heated 10 diamond-anvil cell experiments on hydrous ringwoodite (Mg 2 SiO 4 with 1.1wt% H 2 O) at 11 This is a preprint, the final version is subject to change, of the American Mineralogist (MSA) Cite as Authors (Year) Title. American Mineralogist, in press. DOI: https://doi.org/10.2138/am-2020-7261 Always consult and cite the final, published document. See http:/www.minsocam.org or GeoscienceWorld
Transcript of 1 Revision 3: Phase Transformation of Hydrous Ringwoodite ...
1
Revision 3: Phase Transformation of Hydrous Ringwoodite to the Lower-Mantle 1
Phases and the Formation of Dense Hydrous Silica 2
Huawei Chen1, Kurt Leinenweber2, Vitali Prakapenka3, Martin Kunz4, Hans A. Bechtel4, 3
Zhenxian Liu5 and Sang-Heon Shim1 4
1School of Earth and Space Exploration, Arizona State University, Tempe, Arizona.
2Eyring Materials Center, Arizona State University, Tempe, Arizona.
3GeoSoilEnviroCars, University of Chicago, Chicago, Illinois.
4Advanced Light Source Division, Lawrence Berkeley National Laboratory, Berkeley,
California.
5Geophysical Laboratory, Carnegie Institution of Washington, Washington, DC.
5
Keywords: stishovite, ringwoodite, bridgmanite, periclase, water, mantle 6
7
Abstract 8
In order to understand the effects of H2O on the mineral phases forming under the 9
pressure-temperature conditions of the lower mantle, we have conducted laser-heated 10
diamond-anvil cell experiments on hydrous ringwoodite (Mg2SiO4 with 1.1wt% H2O) at 11
This is a preprint, the final version is subject to change, of the American Mineralogist (MSA) Cite as Authors (Year) Title. American Mineralogist, in press.
DOI: https://doi.org/10.2138/am-2020-7261
Always consult and cite the final, published document. See http:/www.minsocam.org or GeoscienceWorld
2
pressures between 29 and 59 GPa and temperatures between 1200 and 2400 K. Our 12
experimental results show that hydrous ringwoodite (hRw) converts to crystalline dense 13
hydrous silica, stishovite (Stv) or CaCl2-type SiO2 (mStv), containing 1 wt% H2O 14
together with Brd and MgO at the pressure-temperature conditions expected for shallow 15
lower-mantle depths between approximately 660 to 1600 km. Considering lack of sign 16
for melting in our experiments, our preferred interpretation of the observation is that Brd 17
partially breaks down to dense hydrous silica and periclase (Pc), forming Brd + Pc + Stv 18
mineralogy. Our experiments may provide an explanation for the enigmatic coexistence 19
of Stv and Fp inclusions in lower-mantle diamonds. 20
Introduction 21
Lines of evidence support that the lower mantle has a similar chemical composition to the 22
upper mantle (Kurnosov et al., 2017; Shim et al., 2001a, 2017) that is likely peridotitic or 23
pyrolitic (McDonough and Sun, 1995). In a pyrolitic lower mantle, (Mg,Fe)(Al,Si)O3 24
bridgmanite (Brd) and (Mg,Fe)O ferropericlase (Fp) are the dominant minerals (Kesson 25
et al., 1998; Lee et al., 2004). The high Mg/Si ratio of pyrolite stabilizes (Mg,Fe)O as a 26
mineral phase (Fp) in the lower mantle. Fp would react with a free silica phase and forms 27
Brd: (Mg,Fe)O (Fp) + SiO2 = (Mg,Fe)SiO3 (Brd). Therefore, it is believed that dense 28
silica phases, such as stishovite (Stv), are not thermodynamically stable in the anhydrous 29
lower mantle (Shim et al., 2001a). 30
In contrast, numerous studies have documented Stv coexisting with (Mg,Fe)O and Brd 31
(pyroxene with a Brd-like composition) as inclusions in diamonds from the lower mantle 32
(Kaminsky, 2012; Litvin et al., 2014; Stachel et al., 2005). Because the pyrolite model 33
This is a preprint, the final version is subject to change, of the American Mineralogist (MSA) Cite as Authors (Year) Title. American Mineralogist, in press.
DOI: https://doi.org/10.2138/am-2020-7261
Always consult and cite the final, published document. See http:/www.minsocam.org or GeoscienceWorld
3
cannot explain the co-existence of Stv and (Mg,Fe)O, the diamond inclusions raise an 34
important question about the mineralogy and composition of the lower mantle 35
(Kaminsky, 2012). Alternatively, the inclusions may originate from non-pyrolitic 36
sources. For example, Stv can exist with (Mg,Fe)O in a system with a much higher Fe 37
content than pyrolite (Fei et al., 1996). However, many of the (Mg,Fe)O inclusions do not 38
have sufficient Fe for this scenario, and so Brd should be observed instead of Stv in those 39
cases. Experiments have shown that subducted basalt contains Stv together with Brd but 40
not with Fp at the lower-mantle pressure–temperature (P–T) conditions (Hirose et al., 41
2005). Therefore, this cannot explain diamond inclusion observations. 42
An important factor to consider is the possible presence of H2O. Studies have shown that 43
minerals in the mantle transition zone can store H2O up to a few wt% (Smyth 1994; 44
Hirschmann 2006; Pearson et al. 2014). Indeed, some diamond inclusions indicated the 45
premise that the mantle transition zone is hydrated at least locally (Pearson et al., 2014; 46
Tschauner et al., 2018). However, recent high-pressure experiments have shown very low 47
H2O storage capacities for Brd and Fp in the lower mantle (Bolfan-Casanova et al. 2003; 48
Panero et al. 2015). Therefore, H2O transport via mantle convection across such a 49
dramatic change in the H2O storage capacity at 660-km depth can induce some important 50
changes in the mineralogy of the lower mantle (Schmandt et al., 2014; Tschauner et al., 51
2018). To understand the effect of H2O on lower-mantle mineralogy, we have conducted 52
laser-heated diamond-anvil cell (LHDAC) experiments on a synthetic hydrous 53
ringwoodite (Mg2SiO4 with 1.1wt% H2O; hRw) starting material at pressures between 29 54
and 59 GPa and temperatures between 1200 and 2400 K, which is expected for the lower 55
mantle. 56
This is a preprint, the final version is subject to change, of the American Mineralogist (MSA) Cite as Authors (Year) Title. American Mineralogist, in press.
DOI: https://doi.org/10.2138/am-2020-7261
Always consult and cite the final, published document. See http:/www.minsocam.org or GeoscienceWorld
4
57
Experimental Methods 58
Starting material: We synthesized Mg2SiO4 ringwoodite (Rw) from a molar mixture 59
(0.613Mg2SiO4 + 0.084SiO2 + 0.167Mg(OH)2) from forsterite, SiO2 (glass), and brucite 60
for synthesis of a Mg2SiO4 with 3 wt% H2O in a 6-8 multi-anvil press combined with a 61
10/5 assemblies at Arizona State University (ASU) (Leinenweber et al., 2012). The 62
starting mixture was loaded into a platinum capsule. Then, we sealed the capsule. We 63
compressed the mixture to 20 GPa and subsequently heated to 1573 K for 30 minutes. 64
After the synthesis, pure ringwoodite was confirmed by X-ray diffraction (XRD) pattern 65
(Fig. S1), which we will describe later. From analysis of infrared (IR) spectra, we 66
obtained 1.1±0.5 wt% H2O for the amount of H2O in Rw from integrated intensity of the 67
O-H vibration mode from infrared at the wavenumber 2600-3600 cm-1 range, following 68
the methods in Smyth et al. (2003) (Fig. S2). 69
Laser-heated diamond-anvil cell: We pre-compressed the powder of the hydrous Rw 70
sample into a 10-μm thick foil into a symmetric diamond anvil cell (DAC). We used 71
diamond anvils with 200 μm (flat) and 150 μm (single beveled) cullets for experiments at 72
pressures below and above 50 GPa, respectively. The sample chamber was made by 73
drilling a 90 or 120 μm diameter hole in a rhenium gasket indented by diamond anvils. 74
Two different types of heating were performed using either Ar or Ne as an insulating 75
medium. The first was CO2 laser heating on the hydrous Rw samples, and the second 76
near infrared (NIR) laser heating (Fig. S3) on hydrous Rw + Pt mixtures (Tab. 1). For the 77
CO2 laser heating experiments, we cryogenically loaded an Ar medium in a DAC. A ruby 78
This is a preprint, the final version is subject to change, of the American Mineralogist (MSA) Cite as Authors (Year) Title. American Mineralogist, in press.
DOI: https://doi.org/10.2138/am-2020-7261
Always consult and cite the final, published document. See http:/www.minsocam.org or GeoscienceWorld
5
chip was loaded at the edge of the sample chamber for pressure measurements, but away 79
from the sample foil in order to avoid any chemical reaction. We compressed the samples 80
with nitrogen-free type-II diamond anvils and focused a CO2 laser beam on the sample 81
foil in the DAC. Single-sided heating was conducted at 1200 to 2420 K using a laser 82
heating system at ASU. Note that we did not mix the ringwoodite powder with any 83
metals in the CO2 heating experiments, because silicate samples couple directly with the 84
CO2 laser beam. The size of the laser heating spot was 50 μm. Temperatures were 85
calculated by fitting the measured thermal radiation spectra to the Planck equation from 86
one side of the sample after subtracting the backgrounds from the optics in the system 87
similar to the method described in (Prakapenka et al., 2008). Pressure was measured 88
using the ruby fluorescence line shift or the first-order Raman mode from the tips of the 89
diamond anvils (Mao et al., 1978). For the NIR measurements, we mixed the Rw starting 90
material with 10 wt% Pt, the latter being used as a laser coupler and internal pressure 91
standard when using XRD (Ye et al. 2017). We loaded Ne as a pressure medium using 92
the gas-loading system at the GESCARS, APS. The NIR laser heating was conducted at 93
GSECARS (Prakapenka et al., 2008). Two near-infrared laser beams (~1 micron 94
wavelength) were focused on the sample through two opposite sides of DAC with a hot 95
spot size of 20–25 μm in diameter. The laser beams were aligned co-axially with the X-96
ray beam. Temperatures were calculated by fitting thermal radiation spectra to the Planck 97
equation from both sides of the sample after background subtraction. 98
Synchrotron X-ray diffraction: We conducted synchrotron X-ray diffraction (XRD) 99
experiments at beamlines 13IDD at APS and 12.2.2 at ALS (Kunz et al., 2005; 100
Prakapenka et al., 2008). For the samples heated with a CO2 laser beam at ASU, we 101
This is a preprint, the final version is subject to change, of the American Mineralogist (MSA) Cite as Authors (Year) Title. American Mineralogist, in press.
DOI: https://doi.org/10.2138/am-2020-7261
Always consult and cite the final, published document. See http:/www.minsocam.org or GeoscienceWorld
6
conducted the measurements at high pressure and 300 K. In the case of the NIR heating, 102
we conducted XRD measurements during laser heating at the beamline (see 103
supplementary information). Pressure was calculated from the equations state of Ar and 104
Pt for the CO2 and NIR laser heated samples, respectively (Ross et al., 1986; Ye et al., 105
2017). The heating durations were 15–30 minutes. We collected diffraction patterns from 106
a monochromatic X-ray beam with a wavelength of either 0.3344, 0.4133, or 0.4959 Å. 107
The sizes of the X-ray focus at the sample were 3×4 and 10×10 μm2 at beamlines 13IDD 108
and 12.2.2, respectively. Diffraction patterns were measured with MarCCD and Pilatus 109
detectors at beamlines 12.2.2 and 13IDD, respectively, with a detector distance of 110
approximately 250 mm. We integrated the diffraction images to 1D patterns in the 111
Dioptas package shown in Fig. S4 (Prescher and Prakapenka, 2015). We performed phase 112
identification and peak fitting in the PeakPo package (Shim 2017). The data obtained 113
from the GSECARS and the 12.2.2 beamlines agreed well with each other. Rietveld 114
refinements were performed using the GSAS-II package (Toby and Von Dreele, 2013) 115
(Table 2 and Fig. S5). We refined phase fractions first, then atomic positions, lattice 116
parameters and spherical harmonic terms for the preferred orientation. After reaching a 117
good visual fit, we refined all the parameters together to further reduce residuals after 118
background subtraction, Rwp-bknd. From the unit-cell volume, we calculated the water 119
content using the relationship presented in Nisr et al. (2017a) (Table 1). 120
Infrared spectroscopy: We conducted IR measurements on polycrystalline hydrous Rw 121
starting material and the recovered samples at beamlines 1.4 of ALS and U2A of NSLS. 122
We loaded the sample of ringwoodite in the sample chamber of the rhenium gasket in the 123
diamond anvil cell. The infrared beam was focused on the sample to the minimum 124
This is a preprint, the final version is subject to change, of the American Mineralogist (MSA) Cite as Authors (Year) Title. American Mineralogist, in press.
DOI: https://doi.org/10.2138/am-2020-7261
Always consult and cite the final, published document. See http:/www.minsocam.org or GeoscienceWorld
7
beamsize of 10×10 μm. We measure the infrared spectra of the sample at 1 bar. For 125
hydrous stishovite, we measure the IR after laser heating of the hydrous ringwoodite 126
sample. At ALS, the system consists of a Nicolet Magna 760 FTIR spectrometer and 127
custom IR microscope with a HgCdTe detector and KBr beamsplitter. At U2A, we used a 128
Bruker Vertex 80v FTIR spectrometer and Hyperion 2000 microscope with HgCdTe 129
detectors. Spectral resolution was 4 cm-1. Spectra were recorded for 256 scans. The 130
beam-size was 10×10 μm2 in diameter at the sample. We conducted spectral fitting for 131
the IR data using the LMFIT package (Newville et al. 2014). 132
133
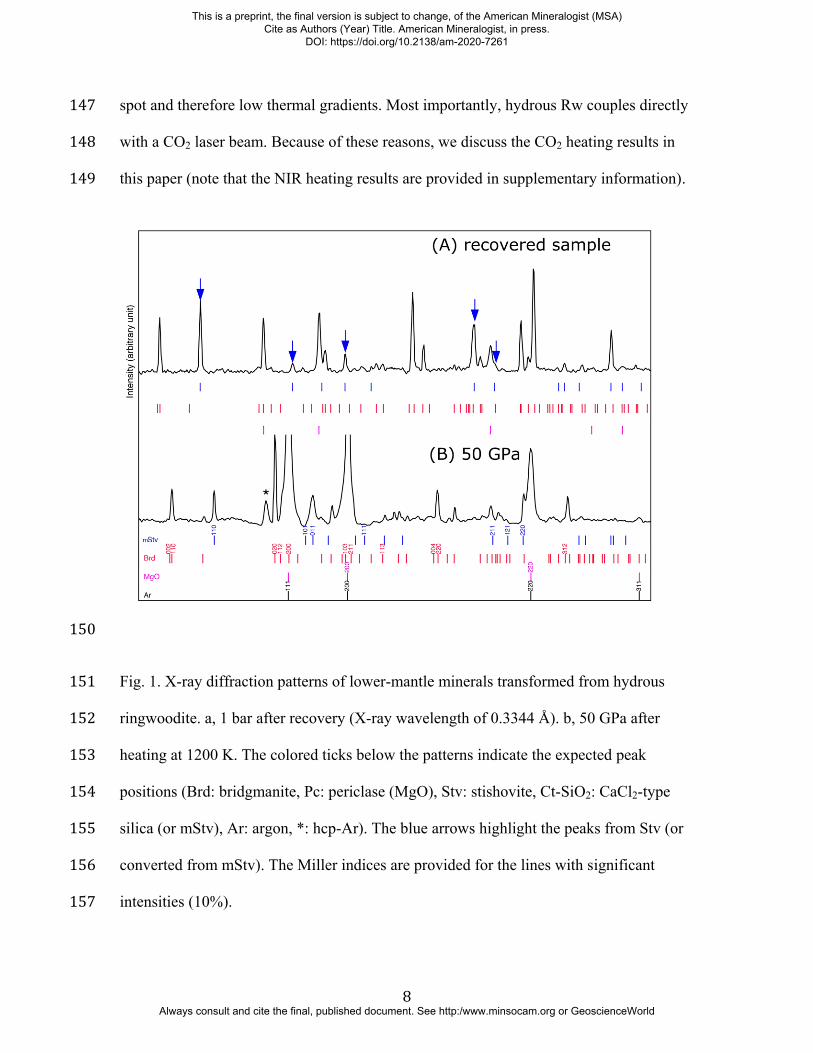
Results 134
Ringwoodite has a Mg/Si ratio of ~2. Thus, heating converts Rw to Brd (MgSiO3) and 135
MgO (periclase, Pc) without silica at the P–T conditions expected for the lower mantle 136
(Shim et al., 2001a). All the diffraction patterns we measured after CO2 laser heating 137
between 35 and 55 GPa, however, showed the peaks of silica (either Stv or its 138
orthorhombic modification in CaCl2-type structure, mStv, together with those of Brd and 139
MgO (Fig. 1). The most intense diffraction line of Stv (and mStv) exists at 2.8–2.9 Å. 140
Because Brd and MgO do not have diffraction lines in this range, the appearance of the 141
intense silica line allows us to unambiguously identify Stv (or mStv). In addition, some 142
high-angle lines of Stv or mStv were identified, such as 101, 211, and 220. However, 143
those features are less unambiguously as diagnostic features because of possible overlaps 144
with the Brd and MgO lines. We also found Stv (or mStv) together with Brd and MgO in 145
the NIR heating experiments (Fig. S3). CO2 laser heating provides much larger heating 146
This is a preprint, the final version is subject to change, of the American Mineralogist (MSA) Cite as Authors (Year) Title. American Mineralogist, in press.
DOI: https://doi.org/10.2138/am-2020-7261
Always consult and cite the final, published document. See http:/www.minsocam.org or GeoscienceWorld
8
spot and therefore low thermal gradients. Most importantly, hydrous Rw couples directly 147
with a CO2 laser beam. Because of these reasons, we discuss the CO2 heating results in 148
this paper (note that the NIR heating results are provided in supplementary information). 149
150
Fig. 1. X-ray diffraction patterns of lower-mantle minerals transformed from hydrous 151
ringwoodite. a, 1 bar after recovery (X-ray wavelength of 0.3344 Å). b, 50 GPa after 152
heating at 1200 K. The colored ticks below the patterns indicate the expected peak 153
positions (Brd: bridgmanite, Pc: periclase (MgO), Stv: stishovite, Ct-SiO2: CaCl2-type 154
silica (or mStv), Ar: argon, *: hcp-Ar). The blue arrows highlight the peaks from Stv (or 155
converted from mStv). The Miller indices are provided for the lines with significant 156
intensities (10%). 157
This is a preprint, the final version is subject to change, of the American Mineralogist (MSA) Cite as Authors (Year) Title. American Mineralogist, in press.
DOI: https://doi.org/10.2138/am-2020-7261
Always consult and cite the final, published document. See http:/www.minsocam.org or GeoscienceWorld
9
We have successfully quenched most of the samples synthesized at 35–55 GPa and 158
measured their diffraction patterns at 1 bar (Fig. 1). All three phases observed at high 159
pressure, Stv, Brd, and MgO, remained present after the pressure quench. The diffraction 160
lines of silica were indexed well with the tetragonal rutile type, that is Stv. The unit-cell 161
volumes of Brd and MgO at 1 bar were in agreement with their anhydrous counterparts 162
within 1.0%. However, for Stv, we found much larger unit-cell volumes than the value 163
reported for anhydrous Stv by 1.7–5.2% in Table 2. 164
Incorporation of H2O increases the unit-cell volume of Stv and the relationship between 165
the H2O content and the volume expansion was measured quantitatively (Spektor et al. 166
2011, 2016; Nisr et al. 2017a). From the volume and H2O content relationship found in 167
other studies (Nisr et al., 2017; Spektor et al., 2016), we obtained 0.4–1.3 wt% H2O for 168
the recovered Stv. In Nisr et al. (2017a), the relationship between the H2O content and 169
unit-cell volume of stishovite was fit to a line using the samples from Spektor et al. 170
(2016): water content (wt%) = 4.64 ± 0.57 × (V - 46.515), where V is the unit-cell 171
volume. The H2O contents of all the samples used for the calibration were directly 172
measured from thermogravimetric analysis (TGA). Some of these samples were also 173
characterized with IR measurements. 174
Stishovite has a tetragonal unit cell with two independent lattice parameters, a and c. 175
When Stv is hydrated, the a-axis expands while the c-axis remains essentially unchanged. 176
Such changes could be related to the bonding of hydrogen to the underbonded oxygen in 177
the silicon defects in the crystal structure (Nisr et al., 2017; Spektor et al., 2011). We 178
found a strong linear correlation between the c/a ratio and the unit-cell volume of the 179
This is a preprint, the final version is subject to change, of the American Mineralogist (MSA) Cite as Authors (Year) Title. American Mineralogist, in press.
DOI: https://doi.org/10.2138/am-2020-7261
Always consult and cite the final, published document. See http:/www.minsocam.org or GeoscienceWorld
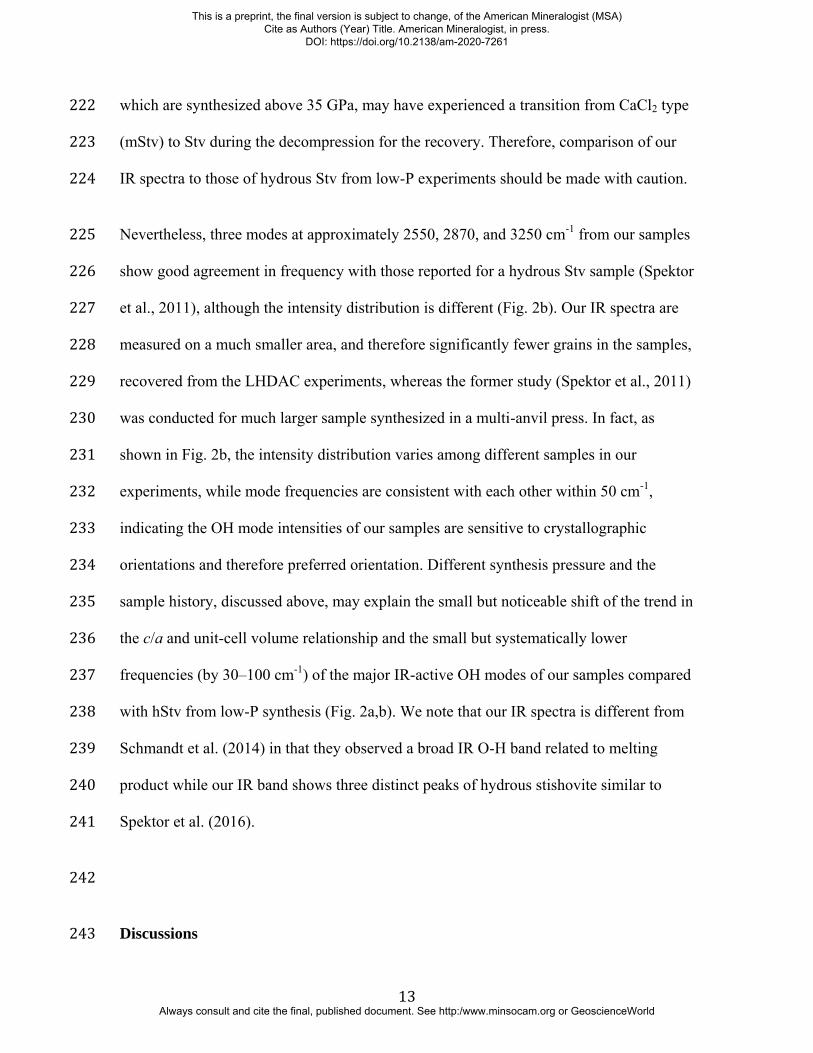
10
recovered Stv (Fig. 3a and Table 2). The trend in our dataset is in agreement with that 180
found in previous studies on hydrous Stv (Spektor et al., 2016, 2011). 181
Infrared (IR) spectroscopy is sensitive to even a trace amount of hydroxyl incorporated in 182
the crystal structures of mineral phases (Rossman, 1996). We measured the IR spectra of 183
the samples recovered from the CO2 lasers where we found complete conversion to the 184
lower-mantle mineral phases, and did not find any Rw diffraction peaks after heating. We 185
found multiples of OH vibrational modes from the recovered samples (Fig. 2b). The 186
detected modes are significantly different from those of hRw (our starting material), 187
MgO, and Brd in both wavenumber and intensity distribution (Bolfan-Casanova et al. 188
2002, 2003; Pearson et al. 2014; Panero et al. 2015). H2O can significantly reduce the 189
transition pressure of Stv to its orthorhombic modification (the CaCl2 type, mStv), for 190
example from 55 GPa to 25 GPa by 3 wt% H2O (Lakshtanov et al. 2007; Nisr et al. 191
2017b). However, the differences in diffraction pattern between the phases are subtle, 192
particularly if the incorporated H2O contents are low. In some diffraction patterns, we 193
were able to identify some diagnostic features of the orthorhombic distortion related to 194
the broadening of stishovite 101 peak as suggested in Fig. 1. However, the severe peak 195
overlaps of the Stv or mStv diffraction lines with Brd, MgO, and Ar at d-spacings smaller 196
than 2.5 Å, made the unambiguous detection challenging. Therefore, we cannot rule out 197
the possibility of a CaCl2-type distortion in the silica phase (mStv) in our pressure range. 198
199
This is a preprint, the final version is subject to change, of the American Mineralogist (MSA) Cite as Authors (Year) Title. American Mineralogist, in press.
DOI: https://doi.org/10.2138/am-2020-7261
Always consult and cite the final, published document. See http:/www.minsocam.org or GeoscienceWorld
11
200
Fig. 2. The solubility of H2O in Stv (or mStv) and its effects on the lower-mantle 201
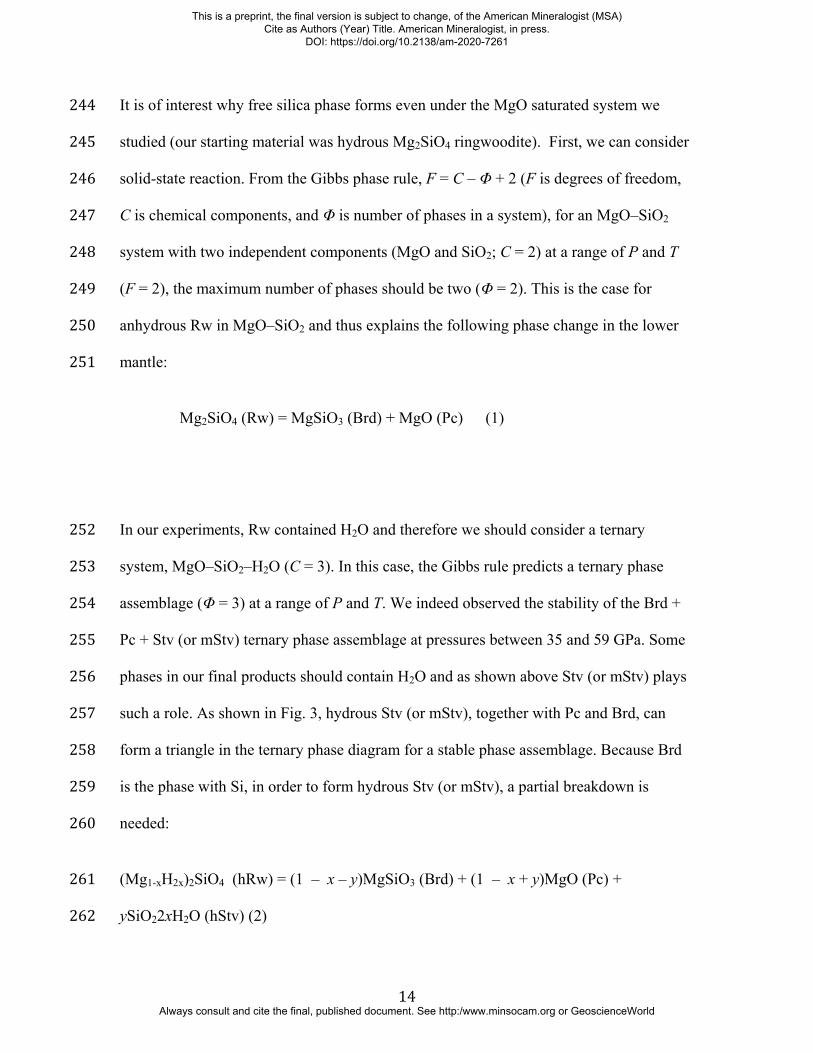
mineralogy. a, The c/a ratio and the unit-cell volume of the recovered Stv co-existing 202
with Brd and MgO. For comparison, we plot the data for hydrous Stv (Spektor et al., 203
2016). b, The IR spectra of the samples recovered from the CO2 heating experiments 204
(dots) with spectral fitting results (black curves). We also present the IR spectra of the 205
starting material (hydrous Rw) and hydrous Stv (Spektor et al., 2011). The gap at 2800–206
3000 cm-1 is a region for C-H modes from CH contaminants on diamond anvils. After 207
opening the diamond-anvil cell, we measured IR through one diamond anvil to prevent 208
accidental loss of the sample. 209
210
This is a preprint, the final version is subject to change, of the American Mineralogist (MSA) Cite as Authors (Year) Title. American Mineralogist, in press.
DOI: https://doi.org/10.2138/am-2020-7261
Always consult and cite the final, published document. See http:/www.minsocam.org or GeoscienceWorld
12
211
212
Fig. 3, The MgO–SiO2–H2O ternary system and the formation of the lower-mantle 213
minerals from anhydrous and hydrous Rw (left, Eq. 1, and right, Eq. 2). The H2O 214
contents in the top two ternary diagrams are exaggerated for the visibility of the expected 215
phase assemblages. We present the properly scaled compositions of our starting material 216
and recovered sample in the bottom diagram. 217
218
Previous studies have reported IR spectra of hydrous Stv (Spektor et al., 2016, 2011). 219
However, these samples were synthesized at pressures lower than 10 GPa and therefore 220
within the stability of Stv without a CaCl2 type distortion. In contrast, our samples, all of 221
This is a preprint, the final version is subject to change, of the American Mineralogist (MSA) Cite as Authors (Year) Title. American Mineralogist, in press.
DOI: https://doi.org/10.2138/am-2020-7261
Always consult and cite the final, published document. See http:/www.minsocam.org or GeoscienceWorld
13
which are synthesized above 35 GPa, may have experienced a transition from CaCl2 type 222
(mStv) to Stv during the decompression for the recovery. Therefore, comparison of our 223
IR spectra to those of hydrous Stv from low-P experiments should be made with caution. 224
Nevertheless, three modes at approximately 2550, 2870, and 3250 cm-1 from our samples 225
show good agreement in frequency with those reported for a hydrous Stv sample (Spektor 226
et al., 2011), although the intensity distribution is different (Fig. 2b). Our IR spectra are 227
measured on a much smaller area, and therefore significantly fewer grains in the samples, 228
recovered from the LHDAC experiments, whereas the former study (Spektor et al., 2011) 229
was conducted for much larger sample synthesized in a multi-anvil press. In fact, as 230
shown in Fig. 2b, the intensity distribution varies among different samples in our 231
experiments, while mode frequencies are consistent with each other within 50 cm-1, 232
indicating the OH mode intensities of our samples are sensitive to crystallographic 233
orientations and therefore preferred orientation. Different synthesis pressure and the 234
sample history, discussed above, may explain the small but noticeable shift of the trend in 235
the c/a and unit-cell volume relationship and the small but systematically lower 236
frequencies (by 30–100 cm-1) of the major IR-active OH modes of our samples compared 237
with hStv from low-P synthesis (Fig. 2a,b). We note that our IR spectra is different from 238
Schmandt et al. (2014) in that they observed a broad IR O-H band related to melting 239
product while our IR band shows three distinct peaks of hydrous stishovite similar to 240
Spektor et al. (2016). 241
242
Discussions 243
This is a preprint, the final version is subject to change, of the American Mineralogist (MSA) Cite as Authors (Year) Title. American Mineralogist, in press.
DOI: https://doi.org/10.2138/am-2020-7261
Always consult and cite the final, published document. See http:/www.minsocam.org or GeoscienceWorld
14
It is of interest why free silica phase forms even under the MgO saturated system we 244
studied (our starting material was hydrous Mg2SiO4 ringwoodite). First, we can consider 245
solid-state reaction. From the Gibbs phase rule, F = C – Φ + 2 (F is degrees of freedom, 246
C is chemical components, and Φ is number of phases in a system), for an MgO–SiO2 247
system with two independent components (MgO and SiO2; C = 2) at a range of P and T 248
(F = 2), the maximum number of phases should be two (Φ = 2). This is the case for 249
anhydrous Rw in MgO–SiO2 and thus explains the following phase change in the lower 250
mantle: 251
Mg2SiO4 (Rw) = MgSiO3 (Brd) + MgO (Pc) (1)
In our experiments, Rw contained H2O and therefore we should consider a ternary 252
system, MgO–SiO2–H2O (C = 3). In this case, the Gibbs rule predicts a ternary phase 253
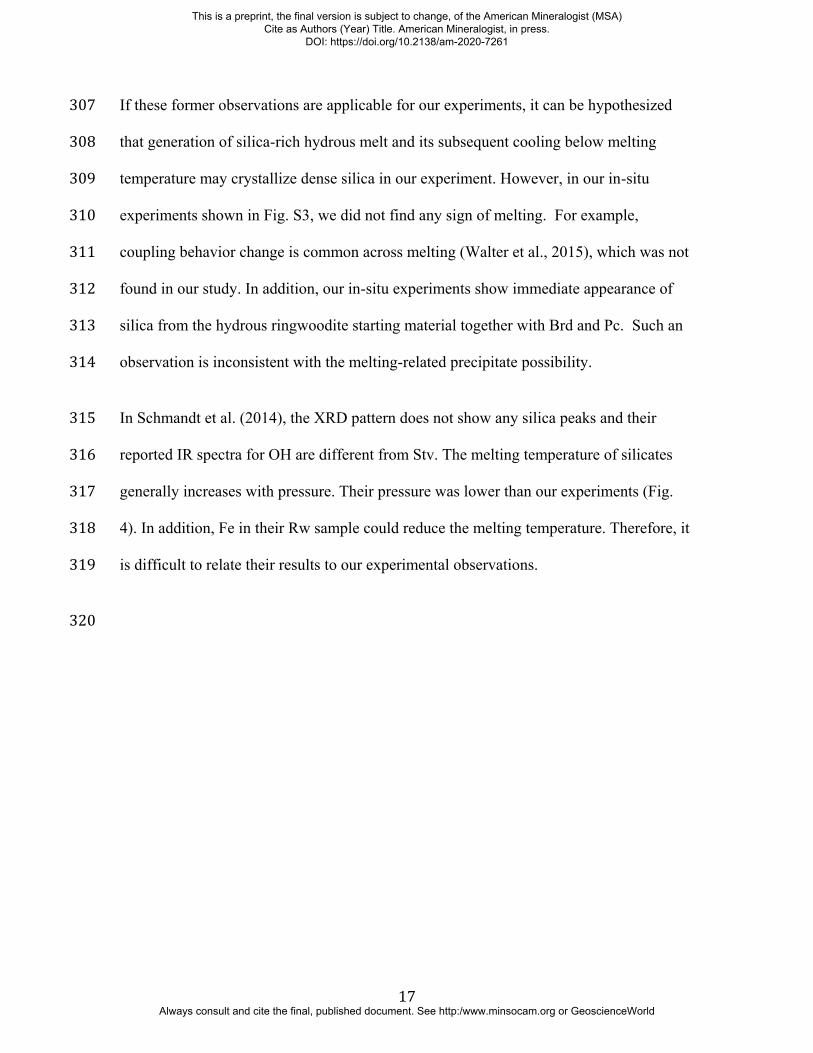
assemblage (Φ = 3) at a range of P and T. We indeed observed the stability of the Brd + 254
Pc + Stv (or mStv) ternary phase assemblage at pressures between 35 and 59 GPa. Some 255
phases in our final products should contain H2O and as shown above Stv (or mStv) plays 256
such a role. As shown in Fig. 3, hydrous Stv (or mStv), together with Pc and Brd, can 257
form a triangle in the ternary phase diagram for a stable phase assemblage. Because Brd 258
is the phase with Si, in order to form hydrous Stv (or mStv), a partial breakdown is 259
needed: 260
(Mg1-xH2x)2SiO4 (hRw) = (1 – x – y)MgSiO3 (Brd) + (1 – x + y)MgO (Pc) + 261
ySiO22xH2O (hStv) (2) 262
This is a preprint, the final version is subject to change, of the American Mineralogist (MSA) Cite as Authors (Year) Title. American Mineralogist, in press.
DOI: https://doi.org/10.2138/am-2020-7261
Always consult and cite the final, published document. See http:/www.minsocam.org or GeoscienceWorld
15
where 2x is the amount of H2O originally in Rw and y is the molar fraction of the Brd 263
breakdown to Pc + Stv (or mStv). Hydrogen would mainly substitute Mg in ringwoodite 264
(Smyth et al. 2004) while stishovite would store hydrogen through direct substitution 265
(Spektor et al., 2011). 266
In Fig. 3, our starting composition is slightly above the triangle formed by the three 267
lower-mantle phases after the transition. We note that the distance between the Rw 268
composition and the phase assemblage triangle of Brd + Pc + Stv is within the estimated 269
uncertainty of the H2O content. The H2O contents were estimated using different methods 270
for Rw and Stv (IR and XRD, respectively) and therefore the systematic differences in 271
these two methods may have contributed more than the estimated error presented in Fig. 272
3. The ternary phase diagram we presented here assumes that the system was closed with 273
no interaction between Rw and the surrounding medium, either Ar or Ne. However, some 274
amounts of H2O could have been released to the pressure medium during heating. The 275
noble gas medium escaped from the sample chamber during recovery, therefore we could 276
not measure the amount of H2O in the medium. If our hydrous Rw lost H2O to the 277
medium during the initial stage of laser heating, the composition point would shift toward 278
the MgO–SiO2 line, and possibly lied within the Brd–Pc–Stv triangle. 279
The hypothesis presented here can be further examined if the fractions of the phases can 280
be reliably determined. We attempted Rietveld refinements (Fig. S5) to obtain phase 281
fractions. However, we found that the intensities of the phases vary strongly at different 282
spots in the sample, likely because of strong recrystallization during laser heating. Our 283
2D diffraction image in Fig. S4 shows that we only have a few single-crystal-like grains 284
This is a preprint, the final version is subject to change, of the American Mineralogist (MSA) Cite as Authors (Year) Title. American Mineralogist, in press.
DOI: https://doi.org/10.2138/am-2020-7261
Always consult and cite the final, published document. See http:/www.minsocam.org or GeoscienceWorld
16
for the phases instead of randomly oriented powder which is required for successful 285
Rietveld refinements. The observation explains the strong variation in the intensity. 286
Because of the limitation, we could not reliably constrain the phase fractions through 287
Rietveld refinements. 288
Second, we consider possibility of melt-involved process. A recent high-pressure 289
experiment (Walter et al., 2015) observed Stv at lower-mantle related pressures in MgO–290
Al2O3–SiO2–H2O even when Mg/Si > 1, which is similar to our study. The study 291
documented that Stv appeared at temperature above 1300 K and remained stable to at 292
least 1900 K at 30 to 50 GPa together with Brd and MgO. They related the appearance of 293
Stv to hydrous melting. 294
Although the H2O content in Stv was not reported, the observation of Stv in the Mg-rich 295
system in Walter et al. (2015) is consistent with our study and supports the important role 296
of H2O for the lower-mantle mineralogy. At lower temperatures, phase D and phase H 297
were observed in the former study (Walter et al., 2015), which was not the case in our 298
experiments. However, their samples contained a factor of 3–5 greater amounts of H2O 299
than our samples, which could change the phase behavior. The amount of H2O in our 300
experiments is more consistent with recent estimations for H2O content in the mantle 301
transition zone (Fei et al., 2017). 302
An experimental study of a (Mg0.9Fe0.1)2SiO4 Rw sample with 1.1(1) wt% H2O reported 303
the observation of Brd, (Mg,Fe)O, and brucite after laser heating to 1873 K at 30 GPa 304
(Schmandt et al., 2014). They identified small amorphous regions in the TEM analysis of 305
the quenched samples and attributed them to hydrous melting. 306
This is a preprint, the final version is subject to change, of the American Mineralogist (MSA) Cite as Authors (Year) Title. American Mineralogist, in press.
DOI: https://doi.org/10.2138/am-2020-7261
Always consult and cite the final, published document. See http:/www.minsocam.org or GeoscienceWorld
17
If these former observations are applicable for our experiments, it can be hypothesized 307
that generation of silica-rich hydrous melt and its subsequent cooling below melting 308
temperature may crystallize dense silica in our experiment. However, in our in-situ 309
experiments shown in Fig. S3, we did not find any sign of melting. For example, 310
coupling behavior change is common across melting (Walter et al., 2015), which was not 311
found in our study. In addition, our in-situ experiments show immediate appearance of 312
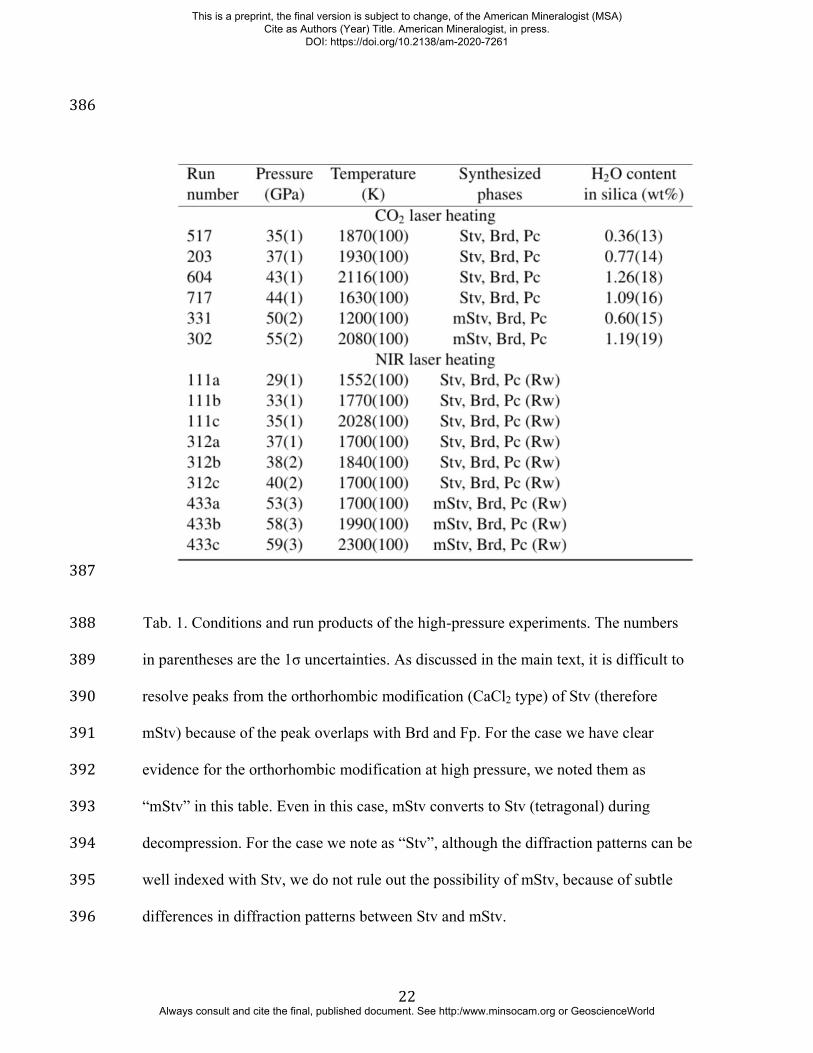
silica from the hydrous ringwoodite starting material together with Brd and Pc. Such an 313
observation is inconsistent with the melting-related precipitate possibility. 314
In Schmandt et al. (2014), the XRD pattern does not show any silica peaks and their 315
reported IR spectra for OH are different from Stv. The melting temperature of silicates 316
generally increases with pressure. Their pressure was lower than our experiments (Fig. 317
4). In addition, Fe in their Rw sample could reduce the melting temperature. Therefore, it 318
is difficult to relate their results to our experimental observations. 319
320
This is a preprint, the final version is subject to change, of the American Mineralogist (MSA) Cite as Authors (Year) Title. American Mineralogist, in press.
DOI: https://doi.org/10.2138/am-2020-7261
Always consult and cite the final, published document. See http:/www.minsocam.org or GeoscienceWorld
18
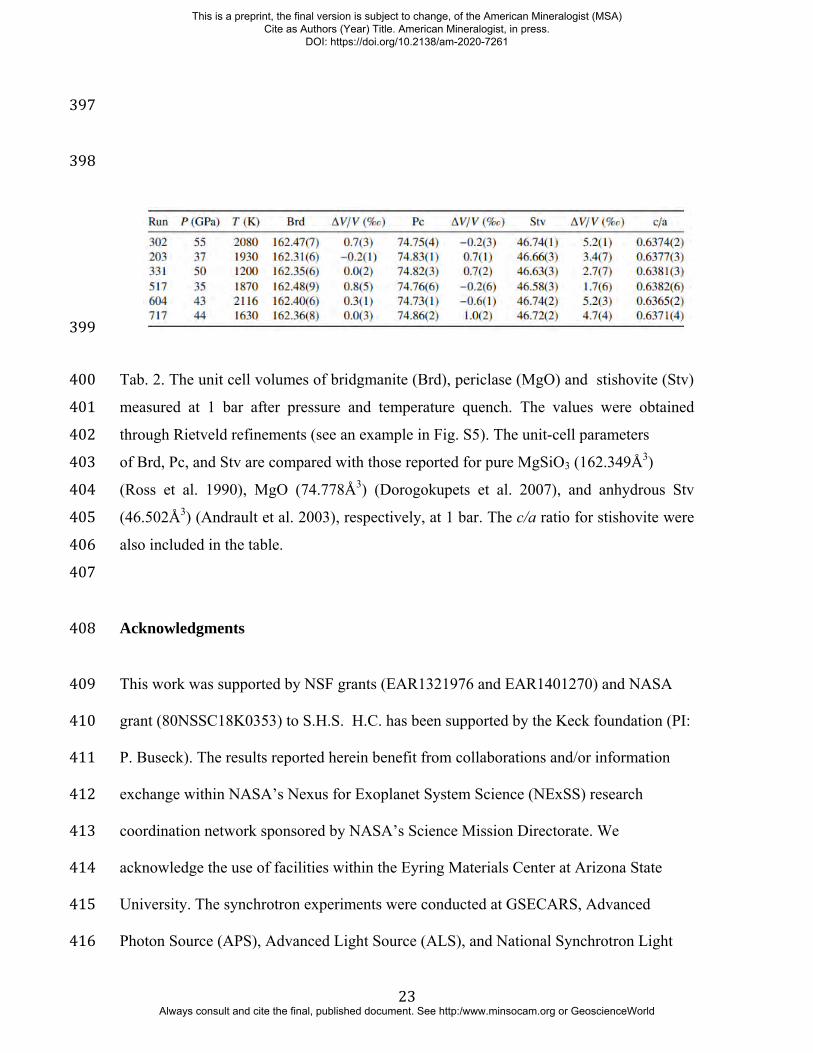
321
Fig. 4. Pressure and temperature conditions for the experimental runs with the observed 322
phase assemblages. We plot the expected temperature ranges at different depths between 323
the cold subducting slabs and the mantle geotherm (Brown and Shankland, 1981; 324
Syracuse et al., 2010). We also show dry liquidus and solidus of the pyrolitic 325
composition, wet liquidus and solidus of pyrolitic composition with 2 wt% water from 326
Litasov and Ohtani (2002). The stability fields of phase D and phase H are from previous 327
studies (Litasov and Ohtani, 2002; Nishi et al., 2014). CO2: CO2 laser-heating 328
experiments, and NIR: NIR laser-heating experiments. We also plotted melting 329
experiment performed by other studies (Bolfan-Casanova et al., 2000; Schmandt et al., 330
2014). 331
332
This is a preprint, the final version is subject to change, of the American Mineralogist (MSA) Cite as Authors (Year) Title. American Mineralogist, in press.
DOI: https://doi.org/10.2138/am-2020-7261
Always consult and cite the final, published document. See http:/www.minsocam.org or GeoscienceWorld
19
For a pyrolitic CaO–MgO–Al2O3–SiO2, a multi-anvil press study showed that 2 wt% of 333
H2O, which is twice more than we have, reduces the melting temperature to 2400 K at 25 334
GPa (Litasov and Ohtani, 2002). Because it increases with pressure, the melting 335
temperature should be higher than 2400 K at the pressure range of our experiments 336
(Litasov and Ohtani, 2002). All of our experiments were conducted at temperatures 337
below 2400 K, and we observed the formation of dense silica polymorph at temperatures 338
as low as 1200–1630 K (Fig. S3). We also did not find any IR modes of brucite, which 339
has been often related to melting in high-pressure samples (Schmandt et al., 2014). 340
Therefore, the melting-involving possibility is less likely. 341
If stishovite observed in our experiments is related to partial melting, because we 342
observed stishovite during in-situ heating, we can hypothesize that Brd undergoes 343
incongruent melting and stishovite appears as a solidus phase, existing together with 344
partial melt. However, such an observation has not been documented yet to our 345
knowledge at the pressure range we studied. 346
Panero et al. (2003) documented that aluminous stishovite has an elevated amount of H2O 347
after partial melting in MORB composition. However, in this case, stishovite is already 348
stable even in anhydrous MORB below melting temperature because of much higher 349
concentration of SiO2 in the composition. Therefore, unlike our case where stishovite 350
cannot exist in anhydrous case because of the high Mg/Si ratio, the observation by Panero 351
et al. (2003) is likely because of H2O partitioning between partial melt and solid residue. 352
Saxena et al. (1996) reported breakdown of MgSiO3 Brd to MgO and SiO2 stishovite at 353
pressures between 58 and 85 GPa. However, the later experiments have shown instead 354
This is a preprint, the final version is subject to change, of the American Mineralogist (MSA) Cite as Authors (Year) Title. American Mineralogist, in press.
DOI: https://doi.org/10.2138/am-2020-7261
Always consult and cite the final, published document. See http:/www.minsocam.org or GeoscienceWorld
20
that MgSiO3 Brd remains stable throughout the lower mantle (Serghiou et al., 1998; Shim 355
et al., 2001b). The source of the earlier breakdown observation has been unclear. While it 356
is intriguing to consider the effect of H2O for the earlier experiments of breakdown from 357
our new observations reported here, we also note that (Saxena et al., 1996) observed the 358
stability of Brd at the pressure range we studied in this report. 359
From these considerations, our preferred interpretation of the silica formation in our 360
experiments is the solid-solid reaction and stabilization of silica through H2O storage in 361
the phase. However, we believe future study is required for more firm conclusions 362
particularly related to the possible partial melting origin of stishovite. For example, 363
transmission electron microscopy (TEM) analysis would be helpful to further address the 364
limitations in this study. Although we attempted, we found it difficult to recover the 365
samples undergone extensive phase changes and recrystallization in a noble gas medium 366
for TEM analysis. Therefore, technical development would be important to achieve the 367
measurements. It is also of particular interest to explore the transition in mineralogy after 368
the stability field of phase D at temperatures higher than the stability of phase H. 369
370
Implications 371
Numerous studies have documented Stv coexisting with (Mg,Fe)O and Brd (pyroxene 372
with Brd-like composition) as inclusions in diamonds from the lower mantle (Kaminsky, 373
2012; Litvin et al., 2014; Stachel et al., 2005). As shown in Eq. 1, the coexistence of Stv 374
is very difficult to explain in the anhydrous pyrolitic lower mantle. Diamond inclusions 375
This is a preprint, the final version is subject to change, of the American Mineralogist (MSA) Cite as Authors (Year) Title. American Mineralogist, in press.
DOI: https://doi.org/10.2138/am-2020-7261
Always consult and cite the final, published document. See http:/www.minsocam.org or GeoscienceWorld
21
have been often related to fluids or H2O (Kaminsky, 2012; Kohn et al., 2016; Tschauner 376
et al., 2018). Here we showed that Stv (or mStv) could form a phase assemblage with Fp 377
and Brd in an Mg-rich system if H2O is present. Our observation, therefore, provides a 378
new possible explanation for the coexistence of Stv with Fp and Brd in the lower-mantle 379
diamonds. If so, those diamonds should originate from hydrous regions in the mid-380
mantle. We proposed that future studies measure the H2O content of the Stv inclusions in 381
lower-mantle diamonds. If future studies indeed support our interpretation for the 382
stabilization of silica through H2O storage in the lower mantle, such a change in 383
mineralogy would impact our understanding on the H2O cycle in Earth and other Earth-384
like planets in our solar system and extra-solar system. 385
This is a preprint, the final version is subject to change, of the American Mineralogist (MSA) Cite as Authors (Year) Title. American Mineralogist, in press.
DOI: https://doi.org/10.2138/am-2020-7261
Always consult and cite the final, published document. See http:/www.minsocam.org or GeoscienceWorld
22
386
387
Tab. 1. Conditions and run products of the high-pressure experiments. The numbers 388
in parentheses are the 1σ uncertainties. As discussed in the main text, it is difficult to 389
resolve peaks from the orthorhombic modification (CaCl2 type) of Stv (therefore 390
mStv) because of the peak overlaps with Brd and Fp. For the case we have clear 391
evidence for the orthorhombic modification at high pressure, we noted them as 392
“mStv” in this table. Even in this case, mStv converts to Stv (tetragonal) during 393
decompression. For the case we note as “Stv”, although the diffraction patterns can be 394
well indexed with Stv, we do not rule out the possibility of mStv, because of subtle 395
differences in diffraction patterns between Stv and mStv. 396
This is a preprint, the final version is subject to change, of the American Mineralogist (MSA) Cite as Authors (Year) Title. American Mineralogist, in press.
DOI: https://doi.org/10.2138/am-2020-7261
Always consult and cite the final, published document. See http:/www.minsocam.org or GeoscienceWorld
23
397
398
399
Tab. 2. The unit cell volumes of bridgmanite (Brd), periclase (MgO) and stishovite (Stv) 400
measured at 1 bar after pressure and temperature quench. The values were obtained 401
through Rietveld refinements (see an example in Fig. S5). The unit-cell parameters 402
of Brd, Pc, and Stv are compared with those reported for pure MgSiO3 (162.349Å3) 403
(Ross et al. 1990), MgO (74.778Å3) (Dorogokupets et al. 2007), and anhydrous Stv 404
(46.502Å3) (Andrault et al. 2003), respectively, at 1 bar. The c/a ratio for stishovite were 405
also included in the table. 406
407
Acknowledgments 408
This work was supported by NSF grants (EAR1321976 and EAR1401270) and NASA 409
grant (80NSSC18K0353) to S.H.S. H.C. has been supported by the Keck foundation (PI: 410
P. Buseck). The results reported herein benefit from collaborations and/or information 411
exchange within NASA’s Nexus for Exoplanet System Science (NExSS) research 412
coordination network sponsored by NASA’s Science Mission Directorate. We 413
acknowledge the use of facilities within the Eyring Materials Center at Arizona State 414
University. The synchrotron experiments were conducted at GSECARS, Advanced 415
Photon Source (APS), Advanced Light Source (ALS), and National Synchrotron Light 416
This is a preprint, the final version is subject to change, of the American Mineralogist (MSA) Cite as Authors (Year) Title. American Mineralogist, in press.
DOI: https://doi.org/10.2138/am-2020-7261
Always consult and cite the final, published document. See http:/www.minsocam.org or GeoscienceWorld
24
Source (NSLS). GSECARS is supported by NSF-Earth Science (EAR-1128799) and 417
DOE-GeoScience (DE-FG02-94ER14466). The Multi-Anvil Cell Assembly Project, 418
DAC gas loading, and the U2A beamline at the NSLS are supported by COMPRES under 419
NSF EAR 11-43050. APS, ALS, and NSLS are supported by DOE, under contracts DE- 420
AC02-06CH11357, DE-AC02-05CH11231, and DE-SC0012704, respectively. The 421
experimental data for this paper are available by contacting [email protected] or 422
[email protected]. 423
424
References cited 425
Andrault, D., Angel, R. J., Mosenfelder, J. L. & Bihan, T. L. (2003) Equation of state of 426 stishovite to lower mantle pressures. American Mineralogist 88, 301–307. 427 Bolfan-Casanova, N., Keppler, H., and Rubie, D.C. (2000) Water partitioning between 428
nominally anhydrous minerals in the MgO–SiO2–H2O system up to 24 GPa: 429 implications for the distribution of water in the Earth’s mantle. Earth and 430 Planetary Science Letters, 182, 209–221. 431
Bolfan‐Casanova, N., Mackwell, S., Keppler, H., McCammon, C., and Rubie, D.C. 432 (2002) Pressure dependence of H solubility in magnesiowüstite up to 25 GPa: 433 Implications for the storage of water in the Earth’s lower mantle. Geophysical 434 Research Letters, 29, 89-1-89–4. 435
Bolfan‐Casanova, N., Keppler, H., and Rubie, D.C. (2003) Water partitioning at 660 436 km depth and evidence for very low water solubility in magnesium silicate 437 perovskite. Geophysical Research Letters, 30. 438
Brown, J.M., and Shankland, T.J. (1981) Thermodynamic parameters in the Earth as 439 determined from seismic profiles. Geophysical Journal International, 66, 579–596. 440
Dorogokupets, P. & Dewaele, A.(2007) Equations of state of MgO, Au, Pt, NaCl-B1, and 441 NaCl- B2: Internally consistent high-temperature pressure scales. High Pressure 442 Research 27, 431–446 . 443 444 Fei, H., Yamazaki, D., Sakurai, M., Miyajima, N., Ohfuji, H., Katsura, T., and 445
Yamamoto, T. (2017) A nearly water-saturated mantle transition zone inferred 446 from mineral viscosity. Science Advances, 3, e1603024. 447
Fei, Y., Wang, Y., and Finger, L.W. (1996) Maximum solubility of FeO in (Mg, Fe)SiO 3 448 -perovskite as a function of temperature at 26 GPa: Implication for FeO content in 449
This is a preprint, the final version is subject to change, of the American Mineralogist (MSA) Cite as Authors (Year) Title. American Mineralogist, in press.
DOI: https://doi.org/10.2138/am-2020-7261
Always consult and cite the final, published document. See http:/www.minsocam.org or GeoscienceWorld
25
the lower mantle. Journal of Geophysical Research: Solid Earth, 101, 11525–450 11530. 451
Hirose, K., Takafuji, N., Sata, N., and Ohishi, Y. (2005) Phase transition and density of 452 subducted MORB crust in the lower mantle. Earth and Planetary Science Letters, 453 237, 239–251. 454
Hirschmann, M.M. (2006) Water, Melting, and the Deep Earth H2o Cycle. Annual 455 Review of Earth and Planetary Sciences, 34, 629–653. 456
Kaminsky, F. (2012) Mineralogy of the lower mantle: A review of ‘super-deep’ mineral 457 inclusions in diamond. Earth-Science Reviews, 110, 127–147. 458
Kesson, S.E., Fitz Gerald, J.D., and Shelley, J.M. (1998) Mineralogy and dynamics of a 459 pyrolite lower mantle. Nature, 393, 252–255. 460
Kohn, S.C., Speich, L., Smith, C.B., and Bulanova, G.P. (2016) FTIR 461 thermochronometry of natural diamonds: A closer look. Lithos, 265, 148–158. 462
Kunz, M., MacDowell, A.A., Caldwell, W.A., Cambie, D., Celestre, R.S., Domning, E.E., 463 Duarte, R.M., Gleason, A.E., Glossinger, J.M., Kelez, N., and others (2005) A 464 beamline for high-pressure studies at the Advanced Light Source with a 465 superconducting bending magnet as the source. Journal of Synchrotron Radiation, 466 12, 650–658. 467
Kurnosov, A., Marquardt, H., Frost, D.J., Ballaran, T.B., and Ziberna, L. (2017) Evidence 468 for a Fe3+-rich pyrolitic lower mantle from (Al,Fe)-bearing bridgmanite elasticity 469 data. Nature, 543, 543–546. 470
Lakshtanov, D.L., Sinogeikin, S.V., Litasov, K.D., Prakapenka, V.B., Hellwig, H., Wang, 471 J., Sanches-Valle, C., Perrillat, J.-P., Chen, B., Somayazulu, M., and others (2007) 472 The post-stishovite phase transition in hydrous alumina-bearing SiO2 in the lower 473 mantle of the earth. Proceedings of the National Academy of Sciences, 104, 474 13588–13590. 475
Lee, K.K.M., O’Neill, B., Panero, W.R., Shim, S.-H., Benedetti, L.R., and Jeanloz, R. 476 (2004) Equations of state of the high-pressure phases of a natural peridotite and 477 implications for the Earth’s lower mantle. Earth and Planetary Science Letters, 478 223, 381–393. 479
Leinenweber, K.D., Tyburczy, J.A., Sharp, T.G., Soignard, E., Diedrich, T., Petuskey, 480 W.B., Wang, Y., and Mosenfelder, J.L. (2012) Cell assemblies for reproducible 481 multi-anvil experiments (the COMPRES assemblies). American Mineralogist, 97, 482 353–368. 483
Litasov, K., and Ohtani, E. (2002) Phase relations and melt compositions in CMAS–484 pyrolite–H2O system up to 25 GPa. Physics of the Earth and Planetary Interiors, 485 134, 105–127. 486
Litvin, Y., Spivak, A., Solopova, N., and Dubrovinsky, L. (2014) On origin of lower-487 mantle diamonds and their primary inclusions. Physics of the Earth and Planetary 488 Interiors, 228, 176–185. 489
Mao, H.K., Bell, P.M., Shaner, J.W., and Steinberg, D.J. (1978) Specific volume 490 measurements of Cu, Mo, Pd, and Ag and calibration of the ruby R1 fluorescence 491 pressure gauge from 0.06 to 1 Mbar. Journal of Applied Physics, 49, 3276–3283. 492
McDonough, W.F., and Sun, S. -s. (1995) The composition of the Earth. Chemical 493 Geology, 120, 223–253. 494
This is a preprint, the final version is subject to change, of the American Mineralogist (MSA) Cite as Authors (Year) Title. American Mineralogist, in press.
DOI: https://doi.org/10.2138/am-2020-7261
Always consult and cite the final, published document. See http:/www.minsocam.org or GeoscienceWorld
26
Newville, M., Stensitzki, Till., Allen, D. B., and Ingargiola, A. (2014) LMFIT: Non-495 Linear Least-Square Minimization and Curve-Fitting for Python. Zenodo, 496 10.5281/zenodo.11813 497
Nishi, M., Irifune, T., Tsuchiya, J., Tange, Y., Nishihara, Y., Fujino, K., and Higo, Y. 498 (2014) Stability of hydrous silicate at high pressures and water transport to the 499 deep lower mantle. Nature Geoscience, 7, 224–227. 500
Nisr, C., Shim, S.-H., Leinenweber, K., and Chizmeshya, A. (2017a) Raman 501 spectroscopy of water-rich stishovite and dense high-pressure silica up to 55 GPa. 502 American Mineralogist, 102, 2180–2189. 503
Nisr, C., Leinenweber, K., Prakapenka, V., Prescher, C., Tkachev, S., and Shim, S.-H. 504 (2017b) Phase transition and equation of state of dense hydrous silica up to 63 505 GPa. Journal of Geophysical Research, 122,2017JB014055. 506
507 Panero, W.R., Pigott, J.S., Reaman, D.M., Kabbes, J.E., and Liu, Z. (2015) Dry 508
(Mg,Fe)SiO3 perovskite in the Earth’s lower mantle. Journal of Geophysical 509 Research: Solid Earth, 120, 2014JB011397. 510
Pearson, D.G., Brenker, F.E., Nestola, F., McNeill, J., Nasdala, L., Hutchison, M.T., 511 Matveev, S., Mather, K., Silversmit, G., Schmitz, S., and others (2014) Hydrous 512 mantle transition zone indicated by ringwoodite included within diamond. Nature, 513 507, 221–224. 514
Prakapenka, V.B., Kubo, A., Kuznetsov, A., Laskin, A., Shkurikhin, O., Dera, P., Rivers, 515 M.L., and Sutton, S.R. (2008) Advanced flat top laser heating system for high 516 pressure research at GSECARS: application to the melting behavior of 517 germanium. High Pressure Research, 28, 225–235. 518
Prescher, C., and Prakapenka, V.B. (2015) DIOPTAS: a program for reduction of two-519 dimensional X-ray diffraction data and data exploration. High Pressure Research, 520 35, 223–230. 521
Rivers, M., Prakapenka, V.B., Kubo, A., Pullins, C., Holl, C.M., and Jacobsen, S.D. 522 (2008) The COMPRES/GSECARS gas-loading system for diamond anvil cells at 523 the Advanced Photon Source. High Pressure Research, 28, 273–292. 524
Ross, M., Mao, H.K., Bell, P.M., and Xu, J.A. (1986) The equation of state of dense 525 argon: A comparison of shock and static studies. The Journal of Chemical Physics, 526 85, 1028–1033. 527
Ross, N. L. & Hazen, R. M.(1990) High-pressure crystal chemistry of MgSiO3 528 perovskite. Physics and Chemistry of Minerals 17, 228–237. 529 Rossman, G.R. (1996) Studies of OH in nominally anhydrous minerals. Physics and 530
Chemistry of Minerals, 23, 299–304. 531 Saxena, S.K., Dubrovinsky, L.S., Lazor, P., Cerenius, Y., Häggkvist, P., Hanfland, M., 532
and Hu, J. (1996) Stability of Perovskite (MgSiO3) in the Earth’s Mantle. Science, 533 274, 1357–1359. 534
Schmandt, B., Jacobsen, S.D., Becker, T.W., Liu, Z., and Dueker, K.G. (2014) 535 Dehydration melting at the top of the lower mantle. Science, 344, 1265–1268. 536
Serghiou, G., Zerr, A., and Boehler, R. (1998) (Mg,Fe)SiO3-Perovskite Stability Under 537 Lower Mantle Conditions. Science, 280, 2093–2095. 538
Shim, S.-H., Duffy, T.S., and Shen, G. (2001a) Stability and Structure of MgSiO3 539 Perovskite to 2300-Kilometer Depth in Earth’s Mantle. Science, 293, 2437–2440. 540
This is a preprint, the final version is subject to change, of the American Mineralogist (MSA) Cite as Authors (Year) Title. American Mineralogist, in press.
DOI: https://doi.org/10.2138/am-2020-7261
Always consult and cite the final, published document. See http:/www.minsocam.org or GeoscienceWorld
27
——— (2001b) The post-spinel transformation in Mg2SiO4 and its relation to the 660-541 km seismic discontinuity. Nature, 411, 571–574. 542
Shim, S.-H., Grocholski, B., Ye, Y., Alp, E.E., Xu, S., Morgan, D., Meng, Y., and 543 Prakapenka, V.B. (2017) Stability of ferrous-iron-rich bridgmanite under reducing 544 midmantle conditions. Proceedings of the National Academy of Sciences, 114, 545 6468–6473. 546
Smyth, J.R. (1994) A crystallographic model for hydrous wadsleyite (β-Mg2SiO4): An 547 ocean in the Earth’s interior? American Mineralogist, 79, 1021–1024. 548
Smyth, J.R., Holl, C.M., Frost, D.J., Jacobsen, S.D. Langenhorst, F and Mccammon 549 CA(2003) Structural systematics of hydrous ringwoodite and water in Earth's 550 interior. American Mineralogist, 88, 1402–1407. 551
Smyth, J.R., Holl, C.M., Frost, D.J., and Jacobsen, S.D. (2004) High pressure crystal 552 chemistry of hydrous ringwoodite and water in the Earth’s interior. Physics of the 553 Earth and Planetary Interiors, 143, 271–278. 554
Spektor, K., Nylen, J., Stoyanov, E., Navrotsky, A., Hervig, R.L., Leinenweber, K., 555 Holland, G.P., and Häussermann, U. (2011) Ultrahydrous stishovite from high-556 pressure hydrothermal treatment of SiO2. Proceedings of the National Academy 557 of Sciences, 108, 20918–20922. 558
Spektor, K., Nylen, J., Mathew, R., Edén, M., Stoyanov, E., Navrotsky, A., Leinenweber, 559 K., and Häussermann, U. (2016) Formation of hydrous stishovite from coesite in 560 high-pressure hydrothermal environments. American Mineralogist, 101, 2514–561 2524. 562
Stachel, T., Brey, G.P., and Harris, J.W. (2005) Inclusions in Sublithospheric Diamonds: 563 Glimpses of Deep Earth. Elements, 1, 73–78. 564
Syracuse, E.M., van Keken, P.E., and Abers, G.A. (2010) The global range of subduction 565 zone thermal models. Physics of the Earth and Planetary Interiors, 183, 73–90. 566
Toby, B.H., and Von Dreele, R.B. (2013) GSAS-II : the genesis of a modern open-source 567 all purpose crystallography software package. Journal of Applied Crystallography, 568 46, 544–549. 569
Tschauner, O., Huang, S., Greenberg, E., Prakapenka, V.B., Ma, C., Rossman, G.R., 570 Shen, A.H., Zhang, D., Newville, M., Lanzirotti, A., and others (2018) Ice-VII 571 inclusions in diamonds: Evidence for aqueous fluid in Earth’s deep mantle. 572 Science, 359, 1136–1139. 573
Walter, M.J., Thomson, A.R., Wang, W., Lord, O.T., Ross, J., McMahon, S.C., Baron, 574 M.A., Melekhova, E., Kleppe, A.K., and Kohn, S.C. (2015) The stability of 575 hydrous silicates in Earth’s lower mantle: Experimental constraints from the 576 systems MgO–SiO2–H2O and MgO–Al2O3–SiO2–H2O. Chemical Geology, 418, 577 16–29. 578
Ye, Y., Prakapenka, V., Meng, Y., and Shim, S.-H. (2017) Inter-comparison of the Gold, 579 Platinum, and MgO Pressure Scales up to 140 GPa and 2,500 K. Journal of 580 Geophysical Research: Solid Earth, 2016JB013811. 581
582
583
This is a preprint, the final version is subject to change, of the American Mineralogist (MSA) Cite as Authors (Year) Title. American Mineralogist, in press.
DOI: https://doi.org/10.2138/am-2020-7261
Always consult and cite the final, published document. See http:/www.minsocam.org or GeoscienceWorld
28
Figure captions 584
Fig. 1. X-ray diffraction patterns of lower-mantle minerals transformed from hydrous 585
ringwoodite. a, 50 GPa after heating at 1200 K. b, 1 bar after recovery (X-ray wavelength 586
of 0.3344 Å). The colored ticks below the patterns indicate the expected peak positions 587
(Brd: bridgmanite, Pc: periclase (MgO), Stv: stishovite, Ct-SiO2: CaCl2-type silica (or 588
mStv), Ar: argon, : hcp-Ar). The blue arrows highlight the peaks from Stv (or converted 589
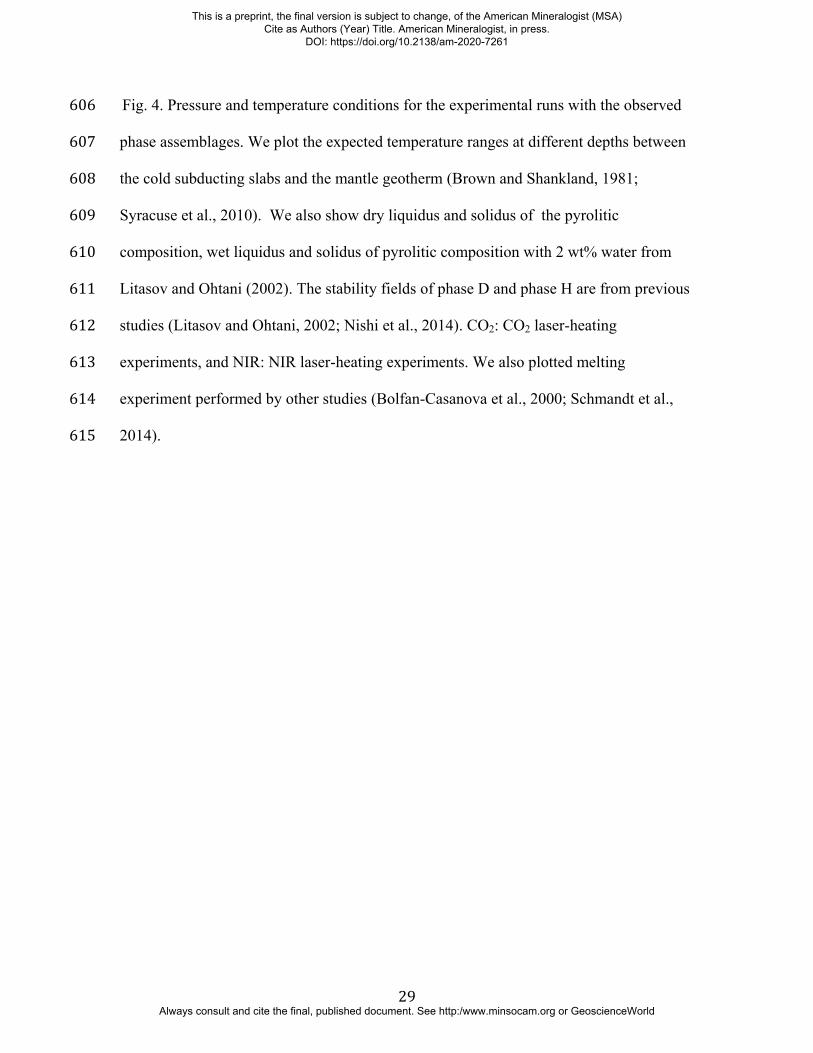
from mStv). The Miller indices are provided for the lines with significant intensities 590
(10%). 591
Fig. 2. The solubility of H2O in Stv (or mStv) and its effects on the lower-mantle 592
mineralogy. a, The c/a ratio and the unit-cell volume of the recovered Stv co-existing 593
with Brd and MgO. For comparison, we plot the data for hydrous Stv (Spektor et al., 594
2016). b, The IR spectra of the samples recovered from the CO2 heating experiments 595
(dots) with spectral fitting results (black curves). We also present the IR spectra of the 596
starting material (hydrous Rw) and hydrous Stv (Spektor et al., 2011). The gap at 2800–597
3000 cm-1 is a region for C-H modes from CH contaminants on diamond anvils. After 598
opening the diamond-anvil cell, we measured IR through one diamond anvil to prevent 599
accidental loss of the sample. 600
Fig. 3, The MgO–SiO2–H2O ternary system and the formation of the lower-mantle 601
minerals from anhydrous and hydrous Rw (left, Eq. 1, and right, Eq. 2). The H2O 602
contents in the top two ternary diagrams are exaggerated for the visibility of the expected 603
phase assemblages. We present the properly scaled compositions of our starting material 604
and recovered sample in the bottom diagram. 605
This is a preprint, the final version is subject to change, of the American Mineralogist (MSA) Cite as Authors (Year) Title. American Mineralogist, in press.
DOI: https://doi.org/10.2138/am-2020-7261
Always consult and cite the final, published document. See http:/www.minsocam.org or GeoscienceWorld
29
Fig. 4. Pressure and temperature conditions for the experimental runs with the observed 606
phase assemblages. We plot the expected temperature ranges at different depths between 607
the cold subducting slabs and the mantle geotherm (Brown and Shankland, 1981; 608
Syracuse et al., 2010). We also show dry liquidus and solidus of the pyrolitic 609
composition, wet liquidus and solidus of pyrolitic composition with 2 wt% water from 610
Litasov and Ohtani (2002). The stability fields of phase D and phase H are from previous 611
studies (Litasov and Ohtani, 2002; Nishi et al., 2014). CO2: CO2 laser-heating 612
experiments, and NIR: NIR laser-heating experiments. We also plotted melting 613
experiment performed by other studies (Bolfan-Casanova et al., 2000; Schmandt et al., 614
2014). 615
This is a preprint, the final version is subject to change, of the American Mineralogist (MSA) Cite as Authors (Year) Title. American Mineralogist, in press.
DOI: https://doi.org/10.2138/am-2020-7261
Always consult and cite the final, published document. See http:/www.minsocam.org or GeoscienceWorld