
Hydrous cobalt–iridium oxide two-dimensional nanoframes ...
21
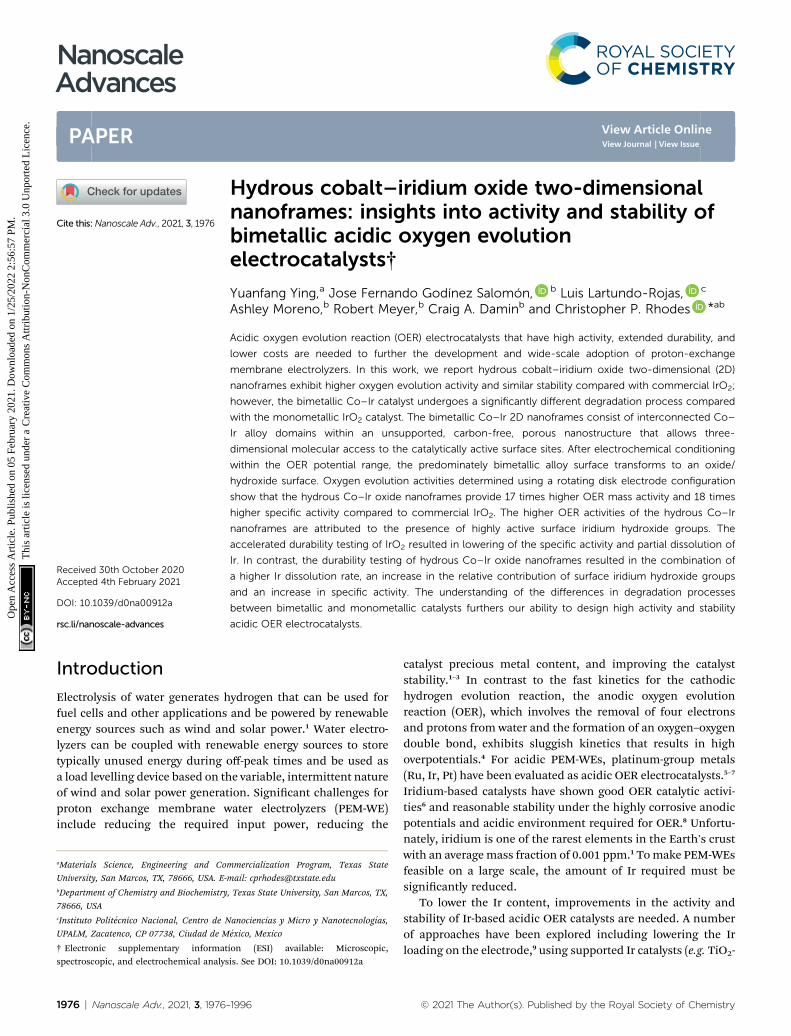
Hydrous cobalt–iridium oxide two-dimensional nanoframes: insights into activity and stability of bimetallic acidic oxygen evolution electrocatalysts† Yuanfang Ying, a Jose Fernando God ´ ınez Salom ´ on, b Luis Lartundo-Rojas, c Ashley Moreno, b Robert Meyer, b Craig A. Damin b and Christopher P. Rhodes * ab Acidic oxygen evolution reaction (OER) electrocatalysts that have high activity, extended durability, and lower costs are needed to further the development and wide-scale adoption of proton-exchange membrane electrolyzers. In this work, we report hydrous cobalt–iridium oxide two-dimensional (2D) nanoframes exhibit higher oxygen evolution activity and similar stability compared with commercial IrO 2 ; however, the bimetallic Co–Ir catalyst undergoes a significantly different degradation process compared with the monometallic IrO 2 catalyst. The bimetallic Co–Ir 2D nanoframes consist of interconnected Co– Ir alloy domains within an unsupported, carbon-free, porous nanostructure that allows three- dimensional molecular access to the catalytically active surface sites. After electrochemical conditioning within the OER potential range, the predominately bimetallic alloy surface transforms to an oxide/ hydroxide surface. Oxygen evolution activities determined using a rotating disk electrode configuration show that the hydrous Co–Ir oxide nanoframes provide 17 times higher OER mass activity and 18 times higher specific activity compared to commercial IrO 2 . The higher OER activities of the hydrous Co–Ir nanoframes are attributed to the presence of highly active surface iridium hydroxide groups. The accelerated durability testing of IrO 2 resulted in lowering of the specific activity and partial dissolution of Ir. In contrast, the durability testing of hydrous Co–Ir oxide nanoframes resulted in the combination of a higher Ir dissolution rate, an increase in the relative contribution of surface iridium hydroxide groups and an increase in specific activity. The understanding of the differences in degradation processes between bimetallic and monometallic catalysts furthers our ability to design high activity and stability acidic OER electrocatalysts. Introduction Electrolysis of water generates hydrogen that can be used for fuel cells and other applications and be powered by renewable energy sources such as wind and solar power. 1 Water electro- lyzers can be coupled with renewable energy sources to store typically unused energy during off-peak times and be used as a load levelling device based on the variable, intermittent nature of wind and solar power generation. Signicant challenges for proton exchange membrane water electrolyzers (PEM-WE) include reducing the required input power, reducing the catalyst precious metal content, and improving the catalyst stability. 1–3 In contrast to the fast kinetics for the cathodic hydrogen evolution reaction, the anodic oxygen evolution reaction (OER), which involves the removal of four electrons and protons from water and the formation of an oxygen–oxygen double bond, exhibits sluggish kinetics that results in high overpotentials. 4 For acidic PEM-WEs, platinum-group metals (Ru, Ir, Pt) have been evaluated as acidic OER electrocatalysts. 5–7 Iridium-based catalysts have shown good OER catalytic activi- ties 6 and reasonable stability under the highly corrosive anodic potentials and acidic environment required for OER. 8 Unfortu- nately, iridium is one of the rarest elements in the Earth's crust with an average mass fraction of 0.001 ppm. 1 To make PEM-WEs feasible on a large scale, the amount of Ir required must be signicantly reduced. To lower the Ir content, improvements in the activity and stability of Ir-based acidic OER catalysts are needed. A number of approaches have been explored including lowering the Ir loading on the electrode, 9 using supported Ir catalysts (e.g. TiO 2 - a Materials Science, Engineering and Commercialization Program, Texas State University, San Marcos, TX, 78666, USA. E-mail: [email protected] b Department of Chemistry and Biochemistry, Texas State University, San Marcos, TX, 78666, USA c Instituto Polit´ ecnico Nacional, Centro de Nanociencias y Micro y Nanotecnolog´ ıas, UPALM, Zacatenco, CP 07738, Ciudad de M´ exico, Mexico † Electronic supplementary information (ESI) available: Microscopic, spectroscopic, and electrochemical analysis. See DOI: 10.1039/d0na00912a Cite this: Nanoscale Adv. , 2021, 3, 1976 Received 30th October 2020 Accepted 4th February 2021 DOI: 10.1039/d0na00912a rsc.li/nanoscale-advances 1976 | Nanoscale Adv., 2021, 3, 1976–1996 © 2021 The Author(s). Published by the Royal Society of Chemistry Nanoscale Advances PAPER Open Access Article. Published on 05 February 2021. Downloaded on 1/25/2022 2:56:57 PM. This article is licensed under a Creative Commons Attribution-NonCommercial 3.0 Unported Licence. View Article Online View Journal | View Issue
Transcript of Hydrous cobalt–iridium oxide two-dimensional nanoframes ...
NanoscaleAdvances
PAPER
Ope
n A
cces
s A
rtic
le. P
ublis
hed
on 0
5 Fe
brua
ry 2
021.
Dow
nloa
ded
on 1
/25/
2022
2:5
6:57
PM
. T
his
artic
le is
lice
nsed
und
er a
Cre
ativ
e C
omm
ons
Attr
ibut
ion-
Non
Com
mer
cial
3.0
Unp
orte
d L
icen
ce.
View Article OnlineView Journal | View Issue
Hydrous cobalt–
aMaterials Science, Engineering and Co
University, San Marcos, TX, 78666, USA. E-bDepartment of Chemistry and Biochemistry
78666, USAcInstituto Politecnico Nacional, Centro de N
UPALM, Zacatenco, CP 07738, Ciudad de M
† Electronic supplementary informatspectroscopic, and electrochemical analys
Cite this:Nanoscale Adv., 2021, 3, 1976
Received 30th October 2020Accepted 4th February 2021
DOI: 10.1039/d0na00912a
rsc.li/nanoscale-advances
1976 | Nanoscale Adv., 2021, 3, 1976–
iridium oxide two-dimensionalnanoframes: insights into activity and stability ofbimetallic acidic oxygen evolutionelectrocatalysts†
Yuanfang Ying,a Jose Fernando Godınez Salomon, b Luis Lartundo-Rojas, c
Ashley Moreno,b Robert Meyer,b Craig A. Daminb and Christopher P. Rhodes *ab
Acidic oxygen evolution reaction (OER) electrocatalysts that have high activity, extended durability, and
lower costs are needed to further the development and wide-scale adoption of proton-exchange
membrane electrolyzers. In this work, we report hydrous cobalt–iridium oxide two-dimensional (2D)
nanoframes exhibit higher oxygen evolution activity and similar stability compared with commercial IrO2;
however, the bimetallic Co–Ir catalyst undergoes a significantly different degradation process compared
with the monometallic IrO2 catalyst. The bimetallic Co–Ir 2D nanoframes consist of interconnected Co–
Ir alloy domains within an unsupported, carbon-free, porous nanostructure that allows three-
dimensional molecular access to the catalytically active surface sites. After electrochemical conditioning
within the OER potential range, the predominately bimetallic alloy surface transforms to an oxide/
hydroxide surface. Oxygen evolution activities determined using a rotating disk electrode configuration
show that the hydrous Co–Ir oxide nanoframes provide 17 times higher OER mass activity and 18 times
higher specific activity compared to commercial IrO2. The higher OER activities of the hydrous Co–Ir
nanoframes are attributed to the presence of highly active surface iridium hydroxide groups. The
accelerated durability testing of IrO2 resulted in lowering of the specific activity and partial dissolution of
Ir. In contrast, the durability testing of hydrous Co–Ir oxide nanoframes resulted in the combination of
a higher Ir dissolution rate, an increase in the relative contribution of surface iridium hydroxide groups
and an increase in specific activity. The understanding of the differences in degradation processes
between bimetallic and monometallic catalysts furthers our ability to design high activity and stability
acidic OER electrocatalysts.
Introduction
Electrolysis of water generates hydrogen that can be used forfuel cells and other applications and be powered by renewableenergy sources such as wind and solar power.1 Water electro-lyzers can be coupled with renewable energy sources to storetypically unused energy during off-peak times and be used asa load levelling device based on the variable, intermittent natureof wind and solar power generation. Signicant challenges forproton exchange membrane water electrolyzers (PEM-WE)include reducing the required input power, reducing the
mmercialization Program, Texas State
mail: [email protected]
, Texas State University, San Marcos, TX,
anociencias y Micro y Nanotecnologıas,exico, Mexico
ion (ESI) available: Microscopic,is. See DOI: 10.1039/d0na00912a
1996
catalyst precious metal content, and improving the catalyststability.1–3 In contrast to the fast kinetics for the cathodichydrogen evolution reaction, the anodic oxygen evolutionreaction (OER), which involves the removal of four electronsand protons from water and the formation of an oxygen–oxygendouble bond, exhibits sluggish kinetics that results in highoverpotentials.4 For acidic PEM-WEs, platinum-group metals(Ru, Ir, Pt) have been evaluated as acidic OER electrocatalysts.5–7
Iridium-based catalysts have shown good OER catalytic activi-ties6 and reasonable stability under the highly corrosive anodicpotentials and acidic environment required for OER.8 Unfortu-nately, iridium is one of the rarest elements in the Earth's crustwith an averagemass fraction of 0.001 ppm.1 Tomake PEM-WEsfeasible on a large scale, the amount of Ir required must besignicantly reduced.
To lower the Ir content, improvements in the activity andstability of Ir-based acidic OER catalysts are needed. A numberof approaches have been explored including lowering the Irloading on the electrode,9 using supported Ir catalysts (e.g. TiO2-
© 2021 The Author(s). Published by the Royal Society of Chemistry

Paper Nanoscale Advances
Ope
n A
cces
s A
rtic
le. P
ublis
hed
on 0
5 Fe
brua
ry 2
021.
Dow
nloa
ded
on 1
/25/
2022
2:5
6:57
PM
. T
his
artic
le is
lice
nsed
und
er a
Cre
ativ
e C
omm
ons
Attr
ibut
ion-
Non
Com
mer
cial
3.0
Unp
orte
d L
icen
ce.
View Article Online
supported, SnO2-supported Ir, etc.),10,11 and increasing theactivity of Ir using through substitution with non-preciousmetals (e.g. Ni, Co, Cu, etc.).12–14 Prior density functionaltheory (DFT) calculations showed that IrO2 binds adsorbedoxygen too strongly which contributes to increasing the over-potential for the OER.15 A prior experimental study showed thatNi substituted within IrO2 resulted in increased OER activityattributed to leaching of Ni atoms, which promote the forma-tion of structurally exible, reactive OH groups that act asreactive surface intermediates for the OER catalytic reaction.16
Other work reported that the substitution of Cu within IrO2
creates oxygen vacancies and changes in the electron occupancyof the t2g and eg orbital states, resulting in loweroverpotentials.17
In addition to increasing activity, the stability of OER catalystremains a signicant challenge1,7,18–20 since all known OERcatalysts with reasonable activity (including Ir) dissolve underthe highly acidic and oxidative potentials required for oxygenevolution.7,18,19 Within substituted IrO2-based catalysts, stabilityremains a major challenge since many of the metals such as Ni,Co and Cu are thermodynamically unstable in acid at highpotentials, as described by Pourbaix diagrams21 and dissolveunder OER testing conditions. Another factor affecting activityand stability is the surface structure. Prior work supports thatthere are signicant surface structure, activity and stabilitydifferences between thermally prepared iridium oxides (IrO2)and amorphous, electrochemically generated iridium oxides(IrOx).19 The predominant current understanding of acidic OERcatalysts is that activity and stability are inherently linked sincethey share a common intermediate.20,22 Prior work on noblemetal monometallic oxides established a direct relationshipbetween the high activity and low stability of acidic OER cata-lysts;5 however, others' work on RuO2 catalysts reports nocorrelation between activity and stability.23 Recent worksuggests that it may be possible to obtain catalysts that are notrestricted by the traditional inverse relationship between OERactivity and stability.24
Cobalt is a potentially promising substituent within IrO2 forimproving OER activity since doping of Co within IrO2 wasshown from DFT calculations to alter the electron density andinuence changes in the binding energies of intermediatesresulting in structures with lower activation energies.25 Anumber of prior studies have evaluated developing improvedacidic OER catalysts through interacting iridium and cobaltwithin iridium–cobalt nanowires,3 iridium–cobalt porousnanocrystals,26 iridium–cobalt oxide,27,28 IrO2–Co3O4 nano-rods,29 and cobalt-doped SrIrO3.30 Nanoframe structures thatcombine iridium with Pt31 or Ni and Cu32 have been previouslystudied to enhance the activity and stability of oxygen evolutionelectrocatalysts. The catalyst structure and resulting OERactivity and stability are highly dependent on the startingmaterials and chemical and electrochemical processes used togenerate the active catalyst.33
Our group has developed bimetallic two-dimensional (2D)nanoframes that combine highly active bimetallic surface sitesand a porous, carbon-free nanoarchitecture to provide oxygenelectrocatalysts with improved activity and stability.14,34,35 The
© 2021 The Author(s). Published by the Royal Society of Chemistry
2D nanoframe structure is synthesized from thermal reductionof precious metal-decorated metal oxide nanosheets and iscomposed of a unique hierarchical 2D framework containinginterconnected solid metallic alloy domains within a porousmatrix that provides 3D molecular accessibility. We recentlyreported unsupported, hydrous iridium–nickel oxide 2D nano-frames exhibit 14 times higher OER mass activity thancommercial IrO2.14 In this prior study, we used interaction of Irwith Ni within the structure to signicantly enhance OERactivity and the porous unsupported electrocatalyst structure toprovide access to the active sites and avoid support degradationand nanoparticle aggregation. However, the stability of thehydrous iridium–nickel oxide nanoframes was substantiallylower than IrO2. We recently reported the combination of CoIrand NiPt 2D nanoframes function as highly efficient bifunc-tional oxygen reduction/evolution electrocatalysts;35 however,our recent study did not explore CoIr nanoframes separately asoxygen evolution catalysts. In this work, we report themorphological and structural characterization of CoIr nano-frames and precursor materials, electrochemical and spectro-scopic characterization of the surface structure, and evaluationof the oxygen evolution activity and stability compared withcommercial IrO2 to provide insight into how cobalt interactingwith iridium within a 2D nanoframe structure affects OERactivity and stability.
Experimental methodsSynthesis
Co(OH)2 nanosheets and iridium-decorated Co(OH)2 nano-sheets, notated as Co(OH)2:Ir, were prepared by adaptinga microwave-assisted hydrothermal synthesis method previ-ously reported by our group for preparation of Ni(OH)2 andNi(OH)2:Ir.14 The synthesis process is summarized in Fig. 1A.The synthesis of Co–Ir nanoframes involved four steps: (i)formation of Co(OH)2 nanosheets using an rapid (10 min)microwave assisted process; (ii) deposition of Ir nanoparticleson a-Co(OH)2 nanosheets; (iii) controlled thermal treatmentunder reducing atmosphere (H2/Ar, 5/95 vol%); and (iv)a chemical leaching step in nitric acid (0.05 M HNO3) to removeunstable metallic Co.
To prepare the Co(OH)2 nanosheets, 1.05 g of Co(NO3)2$6H2O(98%, Alfa Aesar) was combined with 0.6486 g of urea (99.3%,Alfa Aesar) in 3 mL of ultrapure water ($18 MU cm, in-housewater purication system, Purelab Classic, Evoqua Water Tech-nologies) and 21mL of ethylene glycol (99%, VWR). The solutionwas then transferred into a 35 mL microwave vial. The reactionwas conducted in a Discover SP Microwave reactor under vari-ablemicrowave radiation power with a controlled temperature of120 �C for 10 min under active magnetic stirring. The powderwas separated by centrifugation (Sorvall ST16, Thermo) at 3000RPM for 3 min, rinsed ve times with ultrapure water and twotimes with isopropanol (HPLC grade, VWR), and then driedunder ambient atmosphere at 60 �C.
To synthesize iridium-decorated Co(OH)2 nanosheets(Co(OH)2:Ir), 0.038 g of IrCl3$xH2O (99.8%, Alfa Aesar) (equiv-alent to 20 wt% of Ir vs. Co(OH)2) was dissolved in 25 mL of
Nanoscale Adv., 2021, 3, 1976–1996 | 1977
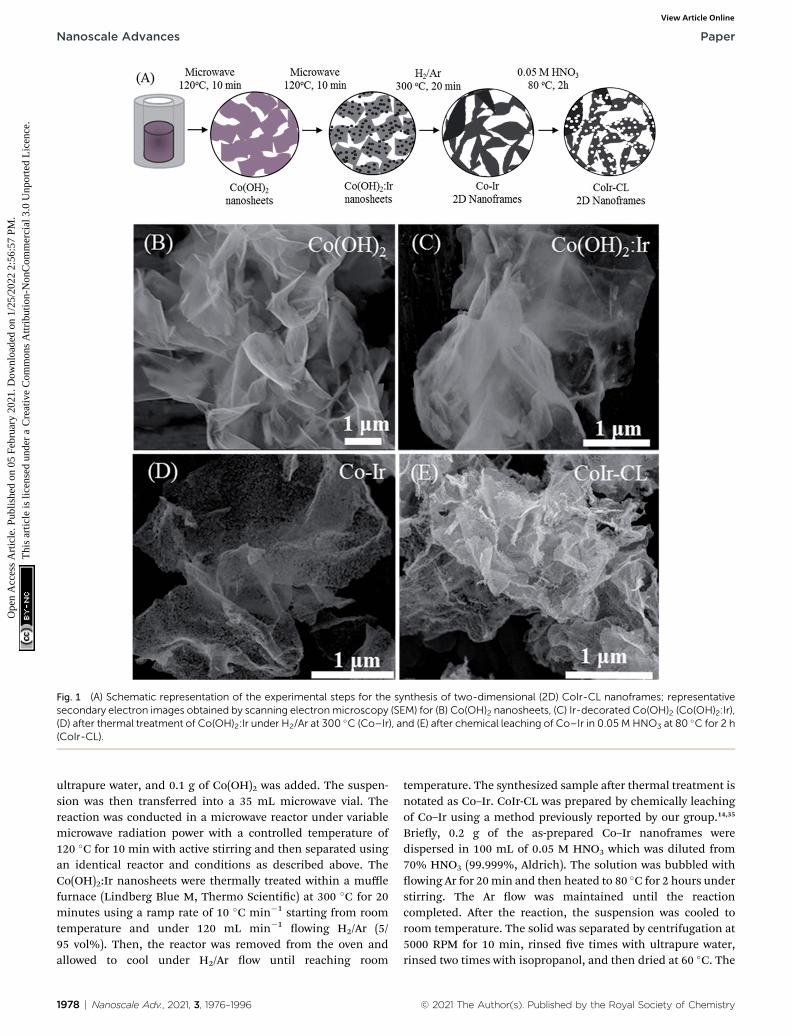
Fig. 1 (A) Schematic representation of the experimental steps for the synthesis of two-dimensional (2D) CoIr-CL nanoframes; representativesecondary electron images obtained by scanning electronmicroscopy (SEM) for (B) Co(OH)2 nanosheets, (C) Ir-decorated Co(OH)2 (Co(OH)2:Ir),(D) after thermal treatment of Co(OH)2:Ir under H2/Ar at 300 �C (Co–Ir), and (E) after chemical leaching of Co–Ir in 0.05 M HNO3 at 80 �C for 2 h(CoIr-CL).
Nanoscale Advances Paper
Ope
n A
cces
s A
rtic
le. P
ublis
hed
on 0
5 Fe
brua
ry 2
021.
Dow
nloa
ded
on 1
/25/
2022
2:5
6:57
PM
. T
his
artic
le is
lice
nsed
und
er a
Cre
ativ
e C
omm
ons
Attr
ibut
ion-
Non
Com
mer
cial
3.0
Unp
orte
d L
icen
ce.
View Article Online
ultrapure water, and 0.1 g of Co(OH)2 was added. The suspen-sion was then transferred into a 35 mL microwave vial. Thereaction was conducted in a microwave reactor under variablemicrowave radiation power with a controlled temperature of120 �C for 10 min with active stirring and then separated usingan identical reactor and conditions as described above. TheCo(OH)2:Ir nanosheets were thermally treated within a mufflefurnace (Lindberg Blue M, Thermo Scientic) at 300 �C for 20minutes using a ramp rate of 10 �C min�1 starting from roomtemperature and under 120 mL min�1
owing H2/Ar (5/95 vol%). Then, the reactor was removed from the oven andallowed to cool under H2/Ar ow until reaching room
1978 | Nanoscale Adv., 2021, 3, 1976–1996
temperature. The synthesized sample aer thermal treatment isnotated as Co–Ir. CoIr-CL was prepared by chemically leachingof Co–Ir using a method previously reported by our group.14,35
Briey, 0.2 g of the as-prepared Co–Ir nanoframes weredispersed in 100 mL of 0.05 M HNO3 which was diluted from70% HNO3 (99.999%, Aldrich). The solution was bubbled withowing Ar for 20min and then heated to 80 �C for 2 hours understirring. The Ar ow was maintained until the reactioncompleted. Aer the reaction, the suspension was cooled toroom temperature. The solid was separated by centrifugation at5000 RPM for 10 min, rinsed ve times with ultrapure water,rinsed two times with isopropanol, and then dried at 60 �C. The
© 2021 The Author(s). Published by the Royal Society of Chemistry
Paper Nanoscale Advances
Ope
n A
cces
s A
rtic
le. P
ublis
hed
on 0
5 Fe
brua
ry 2
021.
Dow
nloa
ded
on 1
/25/
2022
2:5
6:57
PM
. T
his
artic
le is
lice
nsed
und
er a
Cre
ativ
e C
omm
ons
Attr
ibut
ion-
Non
Com
mer
cial
3.0
Unp
orte
d L
icen
ce.
View Article Online
samples are noted as Co(OH)2 (Co(OH)2 nanosheets),Co(OH)2:Ir (decorated Co(OH)2 nanosheets with Ir nano-particles), Co–Ir (Co(OH)2:Ir treated at 300 �C under H2/Ar), andCoIr-CL (Co–Ir aer chemical leaching).
Physical and structural characterization
Scanning electron microscopy (SEM) and energy dispersive X-ray spectroscopy (EDS) elemental mapping were obtained witha Helios NanoLab 400 DualBeam Field Emission ScanningElectron Microscope. The samples were prepared by dispersingthe catalyst in isopropanol and coating the sample on analuminum holder. Powder X-ray diffraction (XRD) measure-ments were collected using a Bruker AXS D8 Advance powder X-ray diffractometer with a Cu Ka (l ¼ 1.5406 A) radiation source,operating at 40 kV and 25 mA and a high-resolution energydispersive 1D Linxeye XE detector. The XRD scan range was 5� <2q < 80� and used a 0.01� increment.
X-ray photoelectron spectra were obtained using a ThermoFischer Scientic K-Alpha X-ray photoelectron spectrometerwith a monochromatic Al Ka X-ray source, 1486.6 eV, micro-focused at the source to give a spot size on the sample of 400microns in diameter. Samples remained under vacuum formore than 10 h in a prechamber directly connected to theequipment and were then transferred to the analysis chamberwith a base pressure of 1 � 10�9 Torr that remained constantduring the experiment. Survey and high-resolution spectra werecollected using an analyzer, operated in Constant AnalyserEnergy mode (CAE), with pass energies of 200 and 10 eV,respectively. In order to compensate effects related to chargeshi, the Ir4f7/2 metal peak at 60.2 eV and the C1s adventitiouscarbon peak at 284.6 eV were used as internal standards. Dataanalysis was performed using AVANTAGE v5.91 soware(Thermo Fisher Scientic) using a Shirley-type backgroundsubtraction and a pseudo-Voigt function with Gaussian (70%)–Lorentzian (30%) for each component. XPS analysis was carriedout from two independent batches of each catalyst material todetermine any signicant changes in the number and contentof chemical elements between batches of the same material. Ineach lot, survey and high-resolution spectra were obtained fromthree different zones with diameters of 400 microns. From theexamination of the survey spectra, it was established thatamong batches of the same sample the chemical elementspresent were the same and that these did not present signicantchanges,#1.0, in their atomic percentage content. On the otherhand, the high resolution spectra for the Ir5p–Ir4f, O1s andCo2p regions suggested that between batches of the samesample, there were some changes in the atomic percentagecontent but not in the number of chemical species formedduring the synthesis protocol (Fig. S6 and S7†). In view of theseresults, it was established that both catalytic systems havea homogeneous elemental and chemical species composition.Therefore, for each material average survey and high-resolutionspectra from the whole set of data obtained were generated forfurther analysis. XPS spectra and quantities presented corre-spond to an average of six measurements from different pointsof each sample batch.
© 2021 The Author(s). Published by the Royal Society of Chemistry
Attenuated total reectance Fourier-transform infrared(ATR-FT-IR) spectra of the Co(OH)2 and Co–Ir samples werecollected using a Harrick Scientic (Pleasantville, NY) SplitPeaATR microsampling accessory coupled to a Bruker (Billerica,MA) Tensor II FT-IR spectrometer. The SplitPea accessory wasequipped with a silicon internal reection element and utilizeda liquid nitrogen cooled mercury–cadmium–telluride detectorcoupled to the Tensor II spectrometer. The solid samples werebrought into direct contact with the silicon internal reectionelement using a 0.5 kg loading. Infrared spectra represent theaverage of 64 individual scans with 4 cm�1 resolution. Trans-mission FT-IR measurements were obtained within the instru-ment described above using potassium bromide (KBr) pelletsprepared by combining the sample with dried KBr powder.
Rotating disk electrochemical characterization
The electrochemical measurements of the catalyst materialswere conducted at constant temperature (298 K) in a three-electrode cell using a thin-lm rotating disk electrode (TF-RDE) conguration with an Autolab PGSTAT128N bipotentio-stat and rotation control (Pine Instruments). A gold disk elec-trode (RDE, Pine Research instrument, geometric area: 0.196cm2) with a thin lm of the prepared catalyst was used as theworking electrode, and a Pt mesh and a freshly preparedreversible hydrogen electrode (RHE) were used as counter andreference electrodes, respectively.
The electrode fabrication and RDE testing protocols werebased on methods previously reported by our group14,35 andother groups.36 Catalyst inks were prepared by combininga specic mass (typically �3 mg) of the acid-leached catalysts(CoIr-CL) with a specic volume of a stock solution to yielda catalyst concentration of 0.43 mgcat mL�1. The stock solutionwas prepared by mixing 0.4 mL of Naon suspension (Aldrich,5 wt%, 1100 g equivalent weight), 20 mL of isopropanol, and79.6 mL ultrapure water ($18 MU cm). The inks were sonicated(Fisher, 40 kHz) in an ice-bath for 20 minutes. The ink was thenimmersed in a controlled temperature bath (25 �C) for 1 minutewhile maintaining agitation and was then used immediately.The inks were applied to a polished Au working electrode (0.196cm2 geometric area) and allowed to dry under rotation (700rpm) under ambient conditions. The electrode loading wascontrolled by depositing a specic volume of the ink onto the Auworking electrode. For the CoIr-CL catalysts, 10 uL was depos-ited onto the Au electrode which corresponds to a loading of15.3 mg Ir cmgeo
�2. Aer depositing the ink on the rotating Auelectrode, the ink was maintained under rotation and allowedto dry under ambient conditions.
The electrochemical characterization of the catalysts wascarried out in 0.1 MHClO4 electrolyte prepared with 70%HClO4
(Veritas Doubly Distilled, GFS Chemicals) (0.000001% Cl�) andultrapure water. For the electrochemical tests, the Au workingelectrode was placed in a three-electrode cell with the 0.1 MHClO4 electrolyte. The electrodes were immersed in argonsaturated 0.1 M HClO4 under potential control (0.1 VRHE). Thecatalysts were rst conditioned by cycling 20 times from 0.05–1.0 VRHE at 100 mV s�1. The electrochemical surface area (ECSA)
Nanoscale Adv., 2021, 3, 1976–1996 | 1979
Nanoscale Advances Paper
Ope
n A
cces
s A
rtic
le. P
ublis
hed
on 0
5 Fe
brua
ry 2
021.
Dow
nloa
ded
on 1
/25/
2022
2:5
6:57
PM
. T
his
artic
le is
lice
nsed
und
er a
Cre
ativ
e C
omm
ons
Attr
ibut
ion-
Non
Com
mer
cial
3.0
Unp
orte
d L
icen
ce.
View Article Online
of metallic Ir was calculated by CO-stripping using a speciccharge of 358 mC cm�2 as the charge corresponding toa monolayer of adsorbed CO.36 Prior to the analysis in the OERpotential range, the catalysts were electrochemically condi-tioned by cycling between 0.05 to 1.5 VRHE for 60 cycles at a scanrate of 100 mV s�1 in argon-saturated 0.1 M HClO4, which isdesignated as the electrochemical oxidation (EO) step. Theelectrochemical surface area of IrO2 (ECSAIrO2
) was then deter-mined by measuring the pseudocapacitive charge between 0.3 Vand 1.25 V obtained using a scan rate of 50 mV s�1 and bysubtracting the contribution of the Au disk current collector.The electrochemical surface area was calculated based on thebackground subtracted pseudocapacitive charge and thecoulombic conversion factor of 596 mC cmIrO2
�2.37
For evaluating the oxygen evolution reaction activity, theelectrode was then conditioned by cycling 10 times in thepotential range 1.2–1.8 VRHE at 100 mV s�1 and 2500 rpm.Linear sweep voltammetry (LSV) in the potential range of 1.2–1.8 VRHE was performed using a scan rate of 20 mV s�1 anda rotation rate of 2500 rpm. Steady-state (iR-corrected) chro-noamperometric measurements were then performed by step-ping the potential at steps of 0.01 V from 1.3 to 1.6 VRHE whileholding for 5 seconds at each potential and rotating the workingelectrode at 2500 rpm. The internal resistance (iR) values (23–27U) was determined prior to every evaluation using the currentinterruption method at 1.6 VRHE. The data obtained fromchronoamperometric measurements was used for the Tafelplots and for determining the OER mass activity and specicactivity. The mass-normalized OER activity was determined bythe current at a specic voltage from the chronoamperometricmeasurements divided by the Ir mass on the electrode. The Irmass on the electrode was determined by the mass loading andthe Ir content within the material determined by inductivelycoupled plasma mass spectrometry (ICP-MS) analysis for CoIr-CL and for IrO2 from the certicate of analysis reported by thevendor (84.5 wt%) which was also corroborated by EDSmeasurements. The actual Ir mass aer EO and aer acceler-ated durability testing (ADT) was determined by subtracting theIr leached into the electrolyte from the initial Ir mass on theelectrode. The percent of Ir leached into the solution wasdetermined by ICP-MS aer each procedure, EO and ADT, forCoIr-CL and ADT for IrO2. Inspection of the Tafel plots for linearbehavior within specic voltage ranges was used to evaluate thatthe electrode was not within a mass-transport limited regimewithin the specic voltage range. Tafel slopes were determinedusing current obtained from chronoamperometry measure-ments using the iR-corrected potential between 1.47 V to 1.52VRHE. Aer the evaluation of the electrocatalyst in the OERpotential range, CV measurements were again obtained todetermine the nature of the surface aer exposure to OERpotentials of up to 1.8 VRHE.
Following the measurements of the OER activity, an accel-erated durability test was carried out by maintaining the elec-trode at a constant potential of 1.6 VRHE for 13.5 hours undera rotation rate of 2500 rpm. Aer the constant potential step wascompleted, the electrolyte was replaced, and a 15 minute argonpurge was performed to help remove entrapped oxygen bubbles
1980 | Nanoscale Adv., 2021, 3, 1976–1996
within the catalyst layer which can contribute the inuencingthe oxygen evolution reaction current using RDE measure-ments.38 CV, CO stripping, LSV, and chronoamperometrymeasurements were then obtained as described above. ICP-MSmeasurements (PerkinElmer NexIon 2000, WashingtonUniversity in Saint Louis) were used to analyze the amount ofiridium dissolved within the electrolyte aer the electro-chemical oxidation step and aer the accelerated durability test.
Results and discussionAnalysis of the morphology and elemental composition ofcobalt–iridium nanoframes and precursor materials
The morphology and elemental composition of the cobalt–iridium nanoframes and precursor materials were determinedby scanning electron microscopy (SEM), energy dispersive X-rayspectroscopy (EDS), and inductively coupled plasma atomicemission spectroscopy (ICP-AES). We evaluated the structure ateach step of the synthesis process (Fig. 1A) to provide insightinto how each step affects the structure of the CoIr-CL catalystmaterial. The SEM image of the Co(OH)2 nanosheets precursor(Fig. 1B), shows the structure consists of extended ultra-thinnanosheets with lateral sizes in the range of 2–5 mm andthicknesses of �10 nm. The morphology of the Co(OH)2 nano-sheets is similar to that of a-Ni(OH)2 nanosheets synthesizedusing a similar protocol.14 Aer the Ir deposition step, themorphology of Co(OH)2:Ir (Fig. 1C) remained similar to that ofthe parent Co(OH)2 nanosheet material, but pores were alsoobserved (Fig. S1†). Following thermal treatment of Co(OH)2:Irunder hydrogen, (i.e. H2/Ar, 300 �C), the extended 2Dmorphology remained; however, signicant structural changesoccurred, resulting in the formation of Co–Ir 2D nanoframesconsisting of interconnected short “nanolaments” that forma three-dimensional porous network (Fig. 1D). The chemicaltreatment of Co–Ir in acid maintained the 2D nanoframemorphology (Fig. 1E); in addition, the removal of unstable Cospecies from Co–Ir resulted in the formation of micropores asdetected by scanning transmission electron microscopymeasurements, as discussed below.
The changes in the relative elemental composition anddistribution of elements within the materials through thesynthesis steps were followed by EDS (Fig. 2). In general, the as-prepared, intermediate materials, and nal catalyst showeda homogeneous distribution of Co and Ir within the structures.The Co(OH)2:Ir material contained 23.1 � 3.5 wt% of Ir, veryclose to the nominal weight ratio determined from weights ofthe precursors used for the synthesis (i.e. 20 wt%), whichdemonstrates good reaction efficiency. Aer thermal treatmentof Co(OH)2:Ir at 300 �C under H2/Ar, within Co–Ir the elementalcomposition of Ir and Co increased to 36.0 � 1.8 wt% iridiumand 46.0 � 2.9 wt% cobalt and the oxygen content decreased to17.3 � 4.3 wt%, which is attributed primarily to the removal ofwater from the structure as a product of the reaction. Aer theacid leaching step which selectively removed Co species, theCoIr-CL sample had a content of 88.3 � 1.5 wt% iridium, 5.2 �0.6 wt% cobalt and 6.3 � 2.0 wt% oxygen. The elementalcomposition of CoIr-CL determined from EDS was similar to the
© 2021 The Author(s). Published by the Royal Society of Chemistry
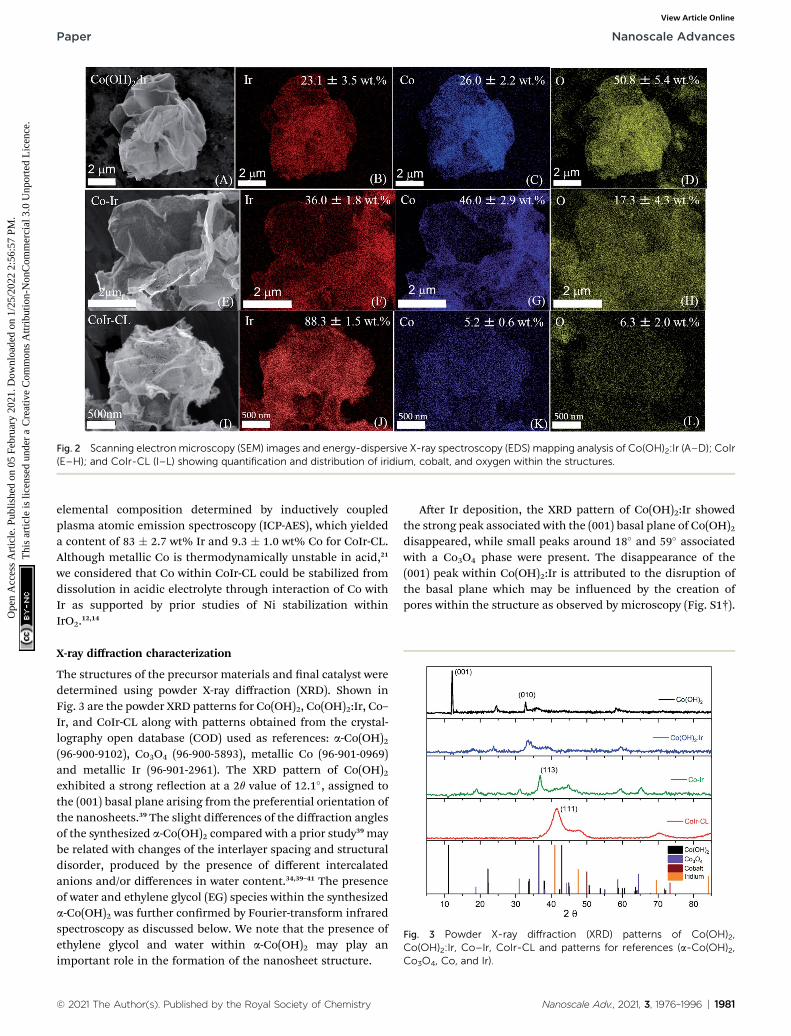
Fig. 2 Scanning electron microscopy (SEM) images and energy-dispersive X-ray spectroscopy (EDS) mapping analysis of Co(OH)2:Ir (A–D); CoIr(E–H); and CoIr-CL (I–L) showing quantification and distribution of iridium, cobalt, and oxygen within the structures.
Fig. 3 Powder X-ray diffraction (XRD) patterns of Co(OH)2,Co(OH)2:Ir, Co–Ir, CoIr-CL and patterns for references (a-Co(OH)2,Co3O4, Co, and Ir).
Paper Nanoscale Advances
Ope
n A
cces
s A
rtic
le. P
ublis
hed
on 0
5 Fe
brua
ry 2
021.
Dow
nloa
ded
on 1
/25/
2022
2:5
6:57
PM
. T
his
artic
le is
lice
nsed
und
er a
Cre
ativ
e C
omm
ons
Attr
ibut
ion-
Non
Com
mer
cial
3.0
Unp
orte
d L
icen
ce.
View Article Online
elemental composition determined by inductively coupledplasma atomic emission spectroscopy (ICP-AES), which yieldeda content of 83 � 2.7 wt% Ir and 9.3 � 1.0 wt% Co for CoIr-CL.Although metallic Co is thermodynamically unstable in acid,21
we considered that Co within CoIr-CL could be stabilized fromdissolution in acidic electrolyte through interaction of Co withIr as supported by prior studies of Ni stabilization withinIrO2.12,14
X-ray diffraction characterization
The structures of the precursor materials and nal catalyst weredetermined using powder X-ray diffraction (XRD). Shown inFig. 3 are the powder XRD patterns for Co(OH)2, Co(OH)2:Ir, Co–Ir, and CoIr-CL along with patterns obtained from the crystal-lography open database (COD) used as references: a-Co(OH)2(96-900-9102), Co3O4 (96-900-5893), metallic Co (96-901-0969)and metallic Ir (96-901-2961). The XRD pattern of Co(OH)2exhibited a strong reection at a 2q value of 12.1�, assigned tothe (001) basal plane arising from the preferential orientation ofthe nanosheets.39 The slight differences of the diffraction anglesof the synthesized a-Co(OH)2 compared with a prior study39 maybe related with changes of the interlayer spacing and structuraldisorder, produced by the presence of different intercalatedanions and/or differences in water content.34,39–41 The presenceof water and ethylene glycol (EG) species within the synthesizeda-Co(OH)2 was further conrmed by Fourier-transform infraredspectroscopy as discussed below. We note that the presence ofethylene glycol and water within a-Co(OH)2 may play animportant role in the formation of the nanosheet structure.
© 2021 The Author(s). Published by the Royal Society of Chemistry
Aer Ir deposition, the XRD pattern of Co(OH)2:Ir showedthe strong peak associated with the (001) basal plane of Co(OH)2disappeared, while small peaks around 18� and 59� associatedwith a Co3O4 phase were present. The disappearance of the(001) peak within Co(OH)2:Ir is attributed to the disruption ofthe basal plane which may be inuenced by the creation ofpores within the structure as observed by microscopy (Fig. S1†).
Nanoscale Adv., 2021, 3, 1976–1996 | 1981

Fig. 4 Attenuated Total Reflectance Fourier-Transform Infraredspectra (ATR-FT-IR) of (a) Co(OH)2; (b) Co(OH)2:Ir; (c) Co–Ir; and (d)CoIr-CL; transmission Fourier-transform infrared spectra (FT-IR) of (e)Co–Ir; and (f) CoIr-CL obtained using KBr pellets; inset showsa magnification of the absorption bands at 670 cm�1 and at 578 cm�1
of Co–Ir.
Nanoscale Advances Paper
Ope
n A
cces
s A
rtic
le. P
ublis
hed
on 0
5 Fe
brua
ry 2
021.
Dow
nloa
ded
on 1
/25/
2022
2:5
6:57
PM
. T
his
artic
le is
lice
nsed
und
er a
Cre
ativ
e C
omm
ons
Attr
ibut
ion-
Non
Com
mer
cial
3.0
Unp
orte
d L
icen
ce.
View Article Online
The deposition of Ir onto the Co(OH)2 nanosheets may result inthe displacement of oxygen by Ir species due to galvanicdisplacement which modies the oxygen stoichiometry due tooxygen depletion28 or may occur via ethylene glycolreduction.42,43
Aer thermal treatment of Co(OH)2:Ir under hydrogen, theXRD patterns of Co–Ir showed signicant morphological andstructural changes. The XRD pattern of Co–Ir showed thepresence of peaks consistent with Co3O4 (at �18�, 32�, 37� and65�).39 The presence of Co3O4 within Co–Ir was also supportedby infrared spectroscopic analysis (described below). The XRDpattern of Co–Ir showed wide peaks between 40� to 50� whichmay be associated with low intensity (111) reections of smallcrystalline domains and/or microstrain from a metallic face-centered cubic CoIr structure.44,45 The presence of a poorlycrystalline metallic Co–Ir phase is supported by the magneticresponse of Co–Ir to a lab magnet; however, further work isneeded to conrm the metallic character. We note that the XRDpattern of Co–Ir prepared by thermal treatment at 300 �C in H2/Ar was signicantly different than the XRD previously reportedof NiIr treated under identical conditions.14 In the case of NiIr,we observed the presence of peaks that correspond to a metallicNiIr phase and no NiO peaks; in contrast, for CoIr, we did notobserve dened peaks corresponding to metallic CoIr phaseand did observe peaks consistent with Co3O4. The differences inthe thermal reduction of Ni(OH)2:Ir and Co(OH)2:Ir to NiIr andCoIr respectively suggests that oxygen binding to Co may bestronger than oxygen binding to Ni within the structure.
Aer the acidic treatment of Co–Ir, most of the Co speciesthat were not stabilized within the Ir structure were removed asshown from EDS analysis (Fig. 2). The XRD pattern of CoIr-CLshows peaks at 41.2� and 46.9� that are associated with the(111) planes (2q ¼ 40.6�) and (200) planes (2q ¼ 47.3�) ofmetallic Ir. The peak position of the Ir(111) reection is shiedto higher 2q values compared to the characteristic position ofa metallic Ir lattice. A lattice constant of 3.771 A was calculatedfrom the peak position of the (111) plane using a face-centeredcubic cell. The lattice constant of 3.771 A for the CoIr-CLmaterial is smaller than the standard metallic iridium latticeconstant of 3.831 A, indicating a �1.6% lattice contraction.These observations support a lattice disruption of iridium likelydue to the inclusion of residual Co within the Ir structure inagreement with STEM data, as presented below. In addition,very low intensity peaks around 36� and 60� assigned to traceCo3O4 within the structure are still observed.
Fourier-transform infrared spectroscopy analysis
Attenuated total reectance Fourier-transform infrared spec-troscopy (ATR-FT-IR) measurements were performed to char-acterize the Co(OH)2, Co–Ir, CoIr-300, and CoIr-CL materials,and ATR-FT-IR spectra are shown in Fig. 4. The ATR-FT-IRspectrum of the as-prepared Co(OH)2 nanosheets, Fig. 4a,shows absorptions at 3500 and 1632 cm�1 that are respectivelyassigned to the O–H stretching and H–O–H bending vibrationsof water within the interlayer region.46–57 The absorption at3617 cm�1 is consistent with a non-hydrogen bonded O–H
1982 | Nanoscale Adv., 2021, 3, 1976–1996
stretch in Co(OH)2.53,56,58,59 The 630 cm�1 absorption is charac-teristic of the Co–O–H bending mode.53,55,56 Absorptions overthe range of 2980–2839 cm�1 are assigned to C–H stretches,potentially resulting from residual ethylene glycol intercalatedbetween the Co(OH)2 nanosheets. A previous study discussedethylene glycol molecules capping the outside of a-NiOH2
nanosheets.60 The 1289 cm�1 absorption could correspond toeither the OH deformation of a 1� alcohol, such as ethyleneglycol, or a symmetric nitrate stretch. The 1106 cm�1 absorptioncould result from either the C–O–CN stretch of a cyanate or theC–O stretch of a 2� alcohol. Residual isopropanol, which wasused to rinse the solid Co(OH)2 following centrifugation, couldremain in the solid following drying. The asymmetric stretch ofa cyanate (OCN�), a byproduct of urea hydrolysis, is assigned tothe 2180 cm�1 absorption.47,49,51,52,54,57,61–63 Soler-Illia et al.proposed that, in addition to CO3
2�, OCN� anions replacedlattice OH� anions in a-Ni(OH)2.47 The 1053 cm�1 absorptioncould be related to either a free nitrate stretching mode6,64,65 orthe C–O stretch of ethylene glycol.66 Peaks at 1105, 1054, and998 cm�1 are attributed to the n(C–O) modes of ethylene glycol66
and n1 mode of nitrate.48,53
© 2021 The Author(s). Published by the Royal Society of Chemistry

Paper Nanoscale Advances
Ope
n A
cces
s A
rtic
le. P
ublis
hed
on 0
5 Fe
brua
ry 2
021.
Dow
nloa
ded
on 1
/25/
2022
2:5
6:57
PM
. T
his
artic
le is
lice
nsed
und
er a
Cre
ativ
e C
omm
ons
Attr
ibut
ion-
Non
Com
mer
cial
3.0
Unp
orte
d L
icen
ce.
View Article Online
A prior study of a-hydroxides, including those of cobalt andnickel, supports that the materials generally contain a signi-cant amount of intercalated anions.61 Within the ATR-FT-IRspectrum of Co(OH)2 nanosheets, Fig. 4a, surface and interca-lated nitrates were assigned to the absorptions at 1381, 1345,997, and 829 cm�1.50,52,56,57,60,63,64 The nitrate absorptions at1381, 1345, and 829 cm�1 correspond to free NO3
� ions with D3h
point group symmetry.48,53,67 Upon coordination to a metal, thelocal symmetry of the NO3
� is lowered to a C2v symmetry.68,69
The remaining nitrate absorption at 997 cm�1 is assigned tocoordinated NO3
� ions in the Co(OH)2 structure with C2v
symmetry.65 The presence of nitrate absorptions in the ATR-FT-IR spectra of the as-prepared Co(OH)2 nanosheets suggests thatNO3
� from Co(NO3)2$6H2O is carried through the synthesisprocedure and exists in two different environments within thematerial.64 The n1 mode of NO3
� is usually IR-inactive; however,the presence of intercalated water between the Co(OH)2 nano-sheets could result in a NO3
� environment in which the n1 modeof NO3
� becomes weakly IR-active.64 The presence of free CO32�
ions with D3h point group symmetry is indicated by absorptionsat 1478 and 889 cm�1.50,52,68 The presence of carbonate withinthe sample could result from the dissolution of CO2 in theaqueous solutions prior to urea hydrolysis. In addition,carbonate anions could be generated by the decomposition ofurea, as previously proposed.47
The ATR-FT-IR spectrum of Co(OH)2:Ir is shown in Fig. 4b.Following iridium deposition onto the Co(OH)2 nanosheets,changes to the Co(OH)2 spectrum are observed. The d(Co–O–H)peak is shied to 632 cm�1 while a new peak with greaterrelative intensity appears at 510 cm�1 in the Co(OH)2:Ir spec-trum. Bands for carbonate and nitrate n3 modes were blueshied to 1495 and 1365 cm�1 respectively. Absorptions at 3417and 1627 cm�1 indicate the presence of surface or interlayerwater. The Co–O–H deformation and Co–O stretch of Co(OH)2are assigned to the absorptions at 633 and 401 cm�1, respec-tively. The absorption at 515 cm�1 is in the range of bandsobserved for n(Ir–O)70 and n(Co–O)71 modes; and further analysisis needed to determine the specic assignment of this bandwithin Co(OH)2:Ir.
The remaining absorptions in the Co(OH)2:Ir spectrum areassociated with surface and interlayer species that are presentin the as-prepared Co(OH)2 precursor. The 2201 cm�1 absorp-tion is attributed to the asymmetric OCN� stretch. The presenceof free NO3
� ions was determined based on the 1354 and828 cm�1 absorptions. The absorption at 1493 cm�1 is assignedto the n3 mode of CO3
2�.52 The O–H deformation and C–Ostretching modes at 1303 and 1040 cm�1, respectively,66 supportthe presence of residual ethylene glycol within Co(OH)2:Ir. Thenitrogen species band is blue shied to 2200 cm�1 and is greatlyreduced in intensity following iridium deposition. Broadeningand red shiing of the n(O–H) band, as well as increased relativeintensity of the d(H2O) band, suggest incorporation of morewater molecules into the structure during the depositionprocess. Broadening and shiing of the n(O–H) bands isconsistent with increased hydrogen bonding within the struc-ture.54 The reduction in the relative intensity of bands arisingfrom ethylene glycol between the spectrum of Co(OH)2 and
© 2021 The Author(s). Published by the Royal Society of Chemistry
Co(OH)2:Ir suggests that it is possible that ethylene glycol mayact as a reducing agent to reduce Ir3+ to Ir during the depositionprocess as supported by prior work on formation of colloidal Irand other platinum-group metal nanoparticles,42,43 or alterna-tively ethylene glycol is removed during the Ir depositionprocess; however, further analysis is needed to determine thepotential role of ethylene glycol during the deposition process.
Fig. 4c shows the ATR-FT-IR spectrum of a Co–Ir samplefollowing a thermal treatment at 300 �C of Co(OH)2:Ir for 20minutes. The ATR spectrum of the resulting black solid indi-cated that the sample strongly absorbed the infrared radiationand possessed a highly metallic character. Dehydration of thesample was apparent by the lack of water related absorptions.The effect of scattering of the infrared radiation by the Co–Irsample is apparent by the sloping baseline. For stronglyabsorbing samples, light scattering within the sample causesthe baseline to slope upwards with increasing wavenumbers.72
The ATR spectrum of the CoIr-CL sample following chemicalleaching of the cobalt, Fig. 4d, also indicated the presence ofa highly metallic phase.70
Since the ATR spectra of Co–Ir and CoIr-CL did not showclearly resolved bands relative to the baseline consistent withtheir metallic character as described above, transmission FT-IRmeasurements of samples within potassium bromide (KBr)pellets were made. Shown in Fig. 4e and (f) are the transmissionFT-IR spectra of Co–Ir and CoIr-CL, respectively. The FT-IRspectrum of Co–Ir (Fig. 4e) has only two dened peaks at 670and 578 cm�1 whose wavenumbers are generally consistentwith the positions of bands from Co3O4 modes based on a priorstudy that reported two distinct and sharp bands at 568 (n1) and664 (n2) cm
�1 which originate from the stretching vibrations ofthe Co–O bonds within spinel Co3O4.71 The n1 band is charac-teristic of a Co3+–O vibration in an octahedral site, and the n2
band is attributed to a Co2+–O vibration in a tetrahedral site inthe spinel lattice.73 Our X-ray diffraction data showed the pres-ence of peaks consistent with Co3O4. It is also possible that the578 cm�1 band originated from a Ir–O stretching mode basedon a prior study;70 however, our X-ray diffraction data did notshow the presence of any IrOx phase.
Scanning transmission electron microscopy characterization
High-angular dark-eld scanning transmission electronmicroscopy (HAADF-STEM) images of CoIr-CL aer chemicalleaching were obtained to evaluate the atomic-level structure(Fig. 5). The low magnication STEM image (Fig. 5A) conrmedthe existence of extended 2D framework created by the highlyporous network of interconnected short nanolaments. Fromnitrogen physisorption analysis, our group reported that themajority of pores within CoIr-CL nanoframes are within the 2–50 nm (mesopore) and >50 nm (macropore) range.35 The porousnetwork within CoIr-CL may play an important role in masstransport processes since in particular mesopores (2–50 nm)within the structure facilitate reactant/product mass transportto the active catalyst sites.37,74
The high-resolution HAADF-STEM image (Fig. 5B) and fastFourier transform (FFT) pattern (Fig. 5D) demonstrate the
Nanoscale Adv., 2021, 3, 1976–1996 | 1983

Fig. 5 Low-magnification (A) and high resolution (B) high-angular dark-field scanning transmission electronmicroscopy (HAADF-STEM) imagesof CoIr-CL catalyst. The yellow box in (B) indicates the area used for the HAADF-STEM intensity profile shown in (C) which shows an interplanardistance consistent with (111) lattice plane; (D) fast Fourier transform (FFT) of the boxed area in yellow in (B).
Nanoscale Advances Paper
Ope
n A
cces
s A
rtic
le. P
ublis
hed
on 0
5 Fe
brua
ry 2
021.
Dow
nloa
ded
on 1
/25/
2022
2:5
6:57
PM
. T
his
artic
le is
lice
nsed
und
er a
Cre
ativ
e C
omm
ons
Attr
ibut
ion-
Non
Com
mer
cial
3.0
Unp
orte
d L
icen
ce.
View Article Online
single-crystalline nature of domains within the material. Theintensity prole (Fig. 4C) shows an average lattice spacing of0.213 � 0.009 nm corresponding to the (111) lattice plane ofbimetallic CoIr-CL, according to a face-centered cubic (fcc)structure identied by XRD (Fig. 3), and conrmed a latticecompression with respect to the metallic iridium pattern takenas the standard (0.216 nm).35 The HAADF-STEM and corre-sponding EDS mapping images of CoIr-CL (Fig. S2†) showuniformly dispersed Co and Ir, consistent with the XRD data.The elemental composition of Ir, Co, and O from HAADF-STEMEDS is in a similar range as values obtained from SEM EDSanalysis (Fig. 2).
Characterization of the surface region using X-rayphotoelectron spectroscopy
X-ray photoelectron spectroscopy (XPS) was used to identify andperform semi-quantitative analysis of chemical species withinthe surface region of the catalyst materials. A comparison of theaverage survey spectra acquired from the surfaces of commer-cial IrO2 and CoIr-CL is shown in Fig. S3.† For both samples,iridium, chlorine, carbon, nitrogen, oxygen and sodium core-level peaks were clearly observed and identied (sodium peaknot shown). In addition to iridium, cobalt, and oxygen, thepresence of carbon, chlorine, nitrogen, and sodium within the
Table 1 Relative weight and atomic percentages of iridium, cobalt,oxygen and elements related to precursors within the surface region ofthe commercial IrO2 (Alfa) and CoIr-CL determined from analysis ofsurvey X-ray photoelectron spectra
Sample Contenta
Element
Ir Co O C N Cl Na
IrO2 Weight% 75.0 — 17.5 6.8 0.4 0.3Atomic% 18.7 — 52.3 27.2 1.4 0.4
CoIr-CL Weight% 75.0 6.7 9.6 7.4 0.9 0.2 0.2Atomic% 21.7 6.4 33.3 34.3 3.4 0.4 0.5
a Average content from six spectra.
1984 | Nanoscale Adv., 2021, 3, 1976–1996
samples was observed and is attributed to the precursors usedduring the synthesis process. As expected, the cobalt core-levelpeak was only observed in the CoIr-CL material.
Semi-quantitative analysis of the XPS average survey spectrawas used to estimate the atomic composition within the surfaceregion (Table 1). Analysis of the survey spectra of CoIr-CL andIrO2 supports that a higher degree of oxygen is present withinthe surface region of IrO2 (52.3 atomic% oxygen) compared toCoIr-CL (33.3 atomic% oxygen). The weight percentages of Ir,Co and O within the surface region determined from XPS are ingeneral agreement with values obtained from SEM-EDS analysis(Fig. 2I–L); however, XPS analysis showed a slightly lowersurface concentration of Ir and a slightly higher concentrationof O and Co species compared to SEM-EDS analysis (Table S1†)whichmay be due to differences in probing of the surface regionbetween these methods.
Spectral tting of Ir5p–Ir4f region. High resolution XPSspectra of CoIr-CL and IrO2 samples within the Ir5p–Ir4fregion were collected, and peak tting was utilized to identifyand estimate the relative atomic percentage of iridiumsurface chemical species. The XPS spectra and tted peakswithin the Ir4f region for CoIr-CL and IrO2 are shown inFig. 6A. Details of the peak tting analysis of the Ir5p–Ir4fpeak binding energies, relative areas, and assignments areprovided in Table 2. Additional details of the basis forspecic peak assignments, tting of the Ir5p region, andtting of the Co3p peaks within the Ir4f region are includedin Table S2, Fig. S4 and ESI.† The XPS tting analysis of theIr4f region supports that the surface region of CoIr-CL andcommercial IrO2 contain anhydrous IrO2 (labelled Ir1),hydrous IrO2 (labelled Ir3), and either Ir2O3 or an iridiumchloride species (labelled Ir2). In the case of CoIr-CL, twoadditional peaks were needed to perform Ir5p–Ir4f highresolution spectra tting: a peak corresponding to the Co3pregion, labelled Co3p, and a peak corresponding to metalliciridium, labelled Ir0, as shown in Fig. 6A. The relative surfacecontent of anhydrous IrO2, hydrous IrO2, and either Ir2O3 oran iridium chloride species was lower within CoIr-CLcompared to commercial IrO2; however, the CoIr-CL sample
© 2021 The Author(s). Published by the Royal Society of Chemistry
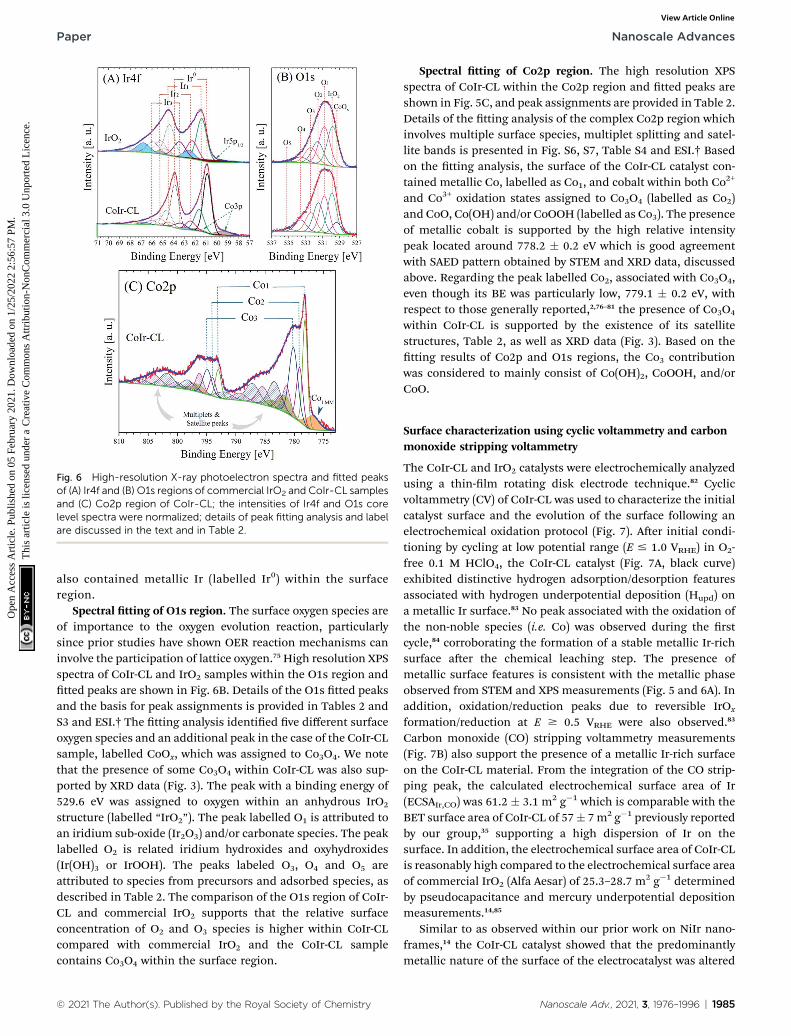
Fig. 6 High-resolution X-ray photoelectron spectra and fitted peaksof (A) Ir4f and (B) O1s regions of commercial IrO2 and CoIr-CL samplesand (C) Co2p region of CoIr-CL; the intensities of Ir4f and O1s corelevel spectra were normalized; details of peak fitting analysis and labelare discussed in the text and in Table 2.
Paper Nanoscale Advances
Ope
n A
cces
s A
rtic
le. P
ublis
hed
on 0
5 Fe
brua
ry 2
021.
Dow
nloa
ded
on 1
/25/
2022
2:5
6:57
PM
. T
his
artic
le is
lice
nsed
und
er a
Cre
ativ
e C
omm
ons
Attr
ibut
ion-
Non
Com
mer
cial
3.0
Unp
orte
d L
icen
ce.
View Article Online
also contained metallic Ir (labelled Ir0) within the surfaceregion.
Spectral tting of O1s region. The surface oxygen species areof importance to the oxygen evolution reaction, particularlysince prior studies have shown OER reaction mechanisms caninvolve the participation of lattice oxygen.75 High resolution XPSspectra of CoIr-CL and IrO2 samples within the O1s region andtted peaks are shown in Fig. 6B. Details of the O1s tted peaksand the basis for peak assignments is provided in Tables 2 andS3 and ESI.† The tting analysis identied ve different surfaceoxygen species and an additional peak in the case of the CoIr-CLsample, labelled CoOx, which was assigned to Co3O4. We notethat the presence of some Co3O4 within CoIr-CL was also sup-ported by XRD data (Fig. 3). The peak with a binding energy of529.6 eV was assigned to oxygen within an anhydrous IrO2
structure (labelled “IrO2”). The peak labelled O1 is attributed toan iridium sub-oxide (Ir2O3) and/or carbonate species. The peaklabelled O2 is related iridium hydroxides and oxyhydroxides(Ir(OH)3 or IrOOH). The peaks labeled O3, O4 and O5 areattributed to species from precursors and adsorbed species, asdescribed in Table 2. The comparison of the O1s region of CoIr-CL and commercial IrO2 supports that the relative surfaceconcentration of O2 and O3 species is higher within CoIr-CLcompared with commercial IrO2 and the CoIr-CL samplecontains Co3O4 within the surface region.
© 2021 The Author(s). Published by the Royal Society of Chemistry
Spectral tting of Co2p region. The high resolution XPSspectra of CoIr-CL within the Co2p region and tted peaks areshown in Fig. 5C, and peak assignments are provided in Table 2.Details of the tting analysis of the complex Co2p region whichinvolves multiple surface species, multiplet splitting and satel-lite bands is presented in Fig. S6, S7, Table S4 and ESI.† Basedon the tting analysis, the surface of the CoIr-CL catalyst con-tained metallic Co, labelled as Co1, and cobalt within both Co2+
and Co3+ oxidation states assigned to Co3O4 (labelled as Co2)and CoO, Co(OH) and/or CoOOH (labelled as Co3). The presenceof metallic cobalt is supported by the high relative intensitypeak located around 778.2 � 0.2 eV which is good agreementwith SAED pattern obtained by STEM and XRD data, discussedabove. Regarding the peak labelled Co2, associated with Co3O4,even though its BE was particularly low, 779.1 � 0.2 eV, withrespect to those generally reported,2,76–81 the presence of Co3O4
within CoIr-CL is supported by the existence of its satellitestructures, Table 2, as well as XRD data (Fig. 3). Based on thetting results of Co2p and O1s regions, the Co3 contributionwas considered to mainly consist of Co(OH)2, CoOOH, and/orCoO.
Surface characterization using cyclic voltammetry and carbonmonoxide stripping voltammetry
The CoIr-CL and IrO2 catalysts were electrochemically analyzedusing a thin-lm rotating disk electrode technique.82 Cyclicvoltammetry (CV) of CoIr-CL was used to characterize the initialcatalyst surface and the evolution of the surface following anelectrochemical oxidation protocol (Fig. 7). Aer initial condi-tioning by cycling at low potential range (E # 1.0 VRHE) in O2-free 0.1 M HClO4, the CoIr-CL catalyst (Fig. 7A, black curve)exhibited distinctive hydrogen adsorption/desorption featuresassociated with hydrogen underpotential deposition (Hupd) ona metallic Ir surface.83 No peak associated with the oxidation ofthe non-noble species (i.e. Co) was observed during the rstcycle,84 corroborating the formation of a stable metallic Ir-richsurface aer the chemical leaching step. The presence ofmetallic surface features is consistent with the metallic phaseobserved from STEM and XPS measurements (Fig. 5 and 6A). Inaddition, oxidation/reduction peaks due to reversible IrOx
formation/reduction at E $ 0.5 VRHE were also observed.83
Carbon monoxide (CO) stripping voltammetry measurements(Fig. 7B) also support the presence of a metallic Ir-rich surfaceon the CoIr-CL material. From the integration of the CO strip-ping peak, the calculated electrochemical surface area of Ir(ECSAIr,CO) was 61.2 � 3.1 m2 g�1 which is comparable with theBET surface area of CoIr-CL of 57� 7m2 g�1 previously reportedby our group,35 supporting a high dispersion of Ir on thesurface. In addition, the electrochemical surface area of CoIr-CLis reasonably high compared to the electrochemical surface areaof commercial IrO2 (Alfa Aesar) of 25.3–28.7 m2 g�1 determinedby pseudocapacitance and mercury underpotential depositionmeasurements.14,85
Similar to as observed within our prior work on NiIr nano-frames,14 the CoIr-CL catalyst showed that the predominantlymetallic nature of the surface of the electrocatalyst was altered
Nanoscale Adv., 2021, 3, 1976–1996 | 1985
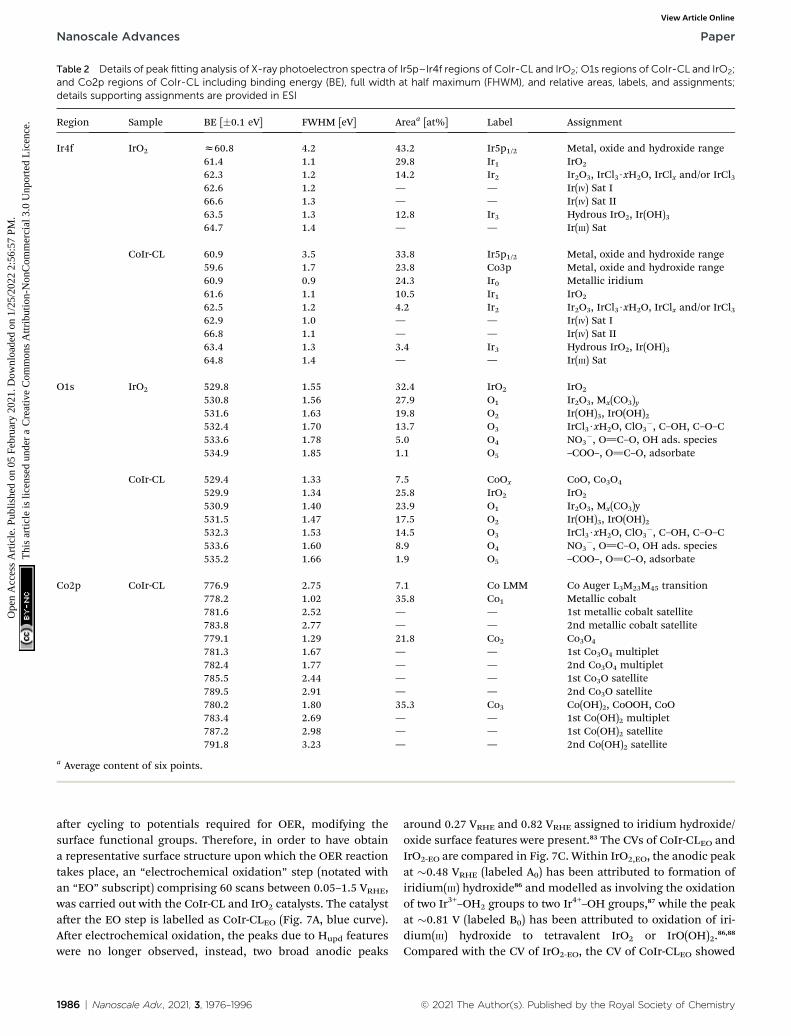
Table 2 Details of peak fitting analysis of X-ray photoelectron spectra of Ir5p–Ir4f regions of CoIr-CL and IrO2; O1s regions of CoIr-CL and IrO2;and Co2p regions of CoIr-CL including binding energy (BE), full width at half maximum (FHWM), and relative areas, labels, and assignments;details supporting assignments are provided in ESI
Region Sample BE [�0.1 eV] FWHM [eV] Areaa [at%] Label Assignment
Ir4f IrO2 z60.8 4.2 43.2 Ir5p1/2 Metal, oxide and hydroxide range61.4 1.1 29.8 Ir1 IrO2
62.3 1.2 14.2 Ir2 Ir2O3, IrCl3$xH2O, IrClx and/or IrCl362.6 1.2 — — Ir(IV) Sat I66.6 1.3 — — Ir(IV) Sat II63.5 1.3 12.8 Ir3 Hydrous IrO2, Ir(OH)364.7 1.4 — — Ir(III) Sat
CoIr-CL 60.9 3.5 33.8 Ir5p1/2 Metal, oxide and hydroxide range59.6 1.7 23.8 Co3p Metal, oxide and hydroxide range60.9 0.9 24.3 Ir0 Metallic iridium61.6 1.1 10.5 Ir1 IrO2
62.5 1.2 4.2 Ir2 Ir2O3, IrCl3$xH2O, IrClx and/or IrCl362.9 1.0 — — Ir(IV) Sat I66.8 1.1 — — Ir(IV) Sat II63.4 1.3 3.4 Ir3 Hydrous IrO2, Ir(OH)364.8 1.4 — — Ir(III) Sat
O1s IrO2 529.8 1.55 32.4 IrO2 IrO2
530.8 1.56 27.9 O1 Ir2O3, Mx(CO3)y531.6 1.63 19.8 O2 Ir(OH)3, IrO(OH)2532.4 1.70 13.7 O3 IrCl3$xH2O, ClO3
�, C–OH, C–O–C533.6 1.78 5.0 O4 NO3
�, O]C–O, OH ads. species534.9 1.85 1.1 O5 –COO–, O]C–O, adsorbate
CoIr-CL 529.4 1.33 7.5 CoOx CoO, Co3O4
529.9 1.34 25.8 IrO2 IrO2
530.9 1.40 23.9 O1 Ir2O3, Mx(CO3)y531.5 1.47 17.5 O2 Ir(OH)3, IrO(OH)2532.3 1.53 14.5 O3 IrCl3$xH2O, ClO3
�, C–OH, C–O–C533.6 1.60 8.9 O4 NO3
�, O]C–O, OH ads. species535.2 1.66 1.9 O5 –COO–, O]C–O, adsorbate
Co2p CoIr-CL 776.9 2.75 7.1 Co LMM Co Auger L3M23M45 transition778.2 1.02 35.8 Co1 Metallic cobalt781.6 2.52 — — 1st metallic cobalt satellite783.8 2.77 — — 2nd metallic cobalt satellite779.1 1.29 21.8 Co2 Co3O4
781.3 1.67 — — 1st Co3O4 multiplet782.4 1.77 — — 2nd Co3O4 multiplet785.5 2.44 — — 1st Co3O satellite789.5 2.91 — — 2nd Co3O satellite780.2 1.80 35.3 Co3 Co(OH)2, CoOOH, CoO783.4 2.69 — — 1st Co(OH)2 multiplet787.2 2.98 — — 1st Co(OH)2 satellite791.8 3.23 — — 2nd Co(OH)2 satellite
a Average content of six points.
Nanoscale Advances Paper
Ope
n A
cces
s A
rtic
le. P
ublis
hed
on 0
5 Fe
brua
ry 2
021.
Dow
nloa
ded
on 1
/25/
2022
2:5
6:57
PM
. T
his
artic
le is
lice
nsed
und
er a
Cre
ativ
e C
omm
ons
Attr
ibut
ion-
Non
Com
mer
cial
3.0
Unp
orte
d L
icen
ce.
View Article Online
aer cycling to potentials required for OER, modifying thesurface functional groups. Therefore, in order to have obtaina representative surface structure upon which the OER reactiontakes place, an “electrochemical oxidation” step (notated withan “EO” subscript) comprising 60 scans between 0.05–1.5 VRHE,was carried out with the CoIr-CL and IrO2 catalysts. The catalystaer the EO step is labelled as CoIr-CLEO (Fig. 7A, blue curve).Aer electrochemical oxidation, the peaks due to Hupd featureswere no longer observed, instead, two broad anodic peaks
1986 | Nanoscale Adv., 2021, 3, 1976–1996
around 0.27 VRHE and 0.82 VRHE assigned to iridium hydroxide/oxide surface features were present.83 The CVs of CoIr-CLEO andIrO2-EO are compared in Fig. 7C. Within IrO2,EO, the anodic peakat �0.48 VRHE (labeled A0) has been attributed to formation ofiridium(III) hydroxide86 and modelled as involving the oxidationof two Ir3+–OH2 groups to two Ir4+–OH groups,87 while the peakat �0.81 V (labeled B0) has been attributed to oxidation of iri-dium(III) hydroxide to tetravalent IrO2 or IrO(OH)2.86,88
Compared with the CV of IrO2-EO, the CV of CoIr-CLEO showed
© 2021 The Author(s). Published by the Royal Society of Chemistry
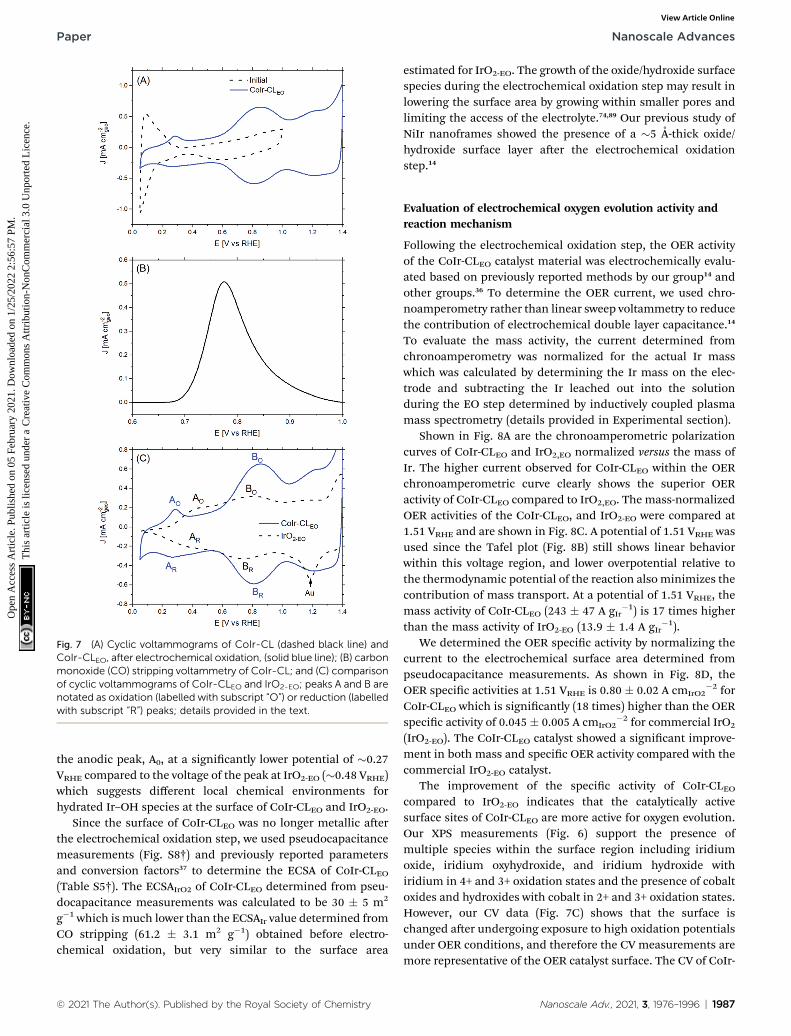
Fig. 7 (A) Cyclic voltammograms of CoIr-CL (dashed black line) andCoIr-CLEO, after electrochemical oxidation, (solid blue line); (B) carbonmonoxide (CO) stripping voltammetry of CoIr-CL; and (C) comparisonof cyclic voltammograms of CoIr-CLEO and IrO2-EO; peaks A and B arenotated as oxidation (labelled with subscript “O”) or reduction (labelledwith subscript “R”) peaks; details provided in the text.
Paper Nanoscale Advances
Ope
n A
cces
s A
rtic
le. P
ublis
hed
on 0
5 Fe
brua
ry 2
021.
Dow
nloa
ded
on 1
/25/
2022
2:5
6:57
PM
. T
his
artic
le is
lice
nsed
und
er a
Cre
ativ
e C
omm
ons
Attr
ibut
ion-
Non
Com
mer
cial
3.0
Unp
orte
d L
icen
ce.
View Article Online
the anodic peak, A0, at a signicantly lower potential of �0.27VRHE compared to the voltage of the peak at IrO2-EO (�0.48 VRHE)which suggests different local chemical environments forhydrated Ir–OH species at the surface of CoIr-CLEO and IrO2-EO.
Since the surface of CoIr-CLEO was no longer metallic aerthe electrochemical oxidation step, we used pseudocapacitancemeasurements (Fig. S8†) and previously reported parametersand conversion factors37 to determine the ECSA of CoIr-CLEO(Table S5†). The ECSAIrO2 of CoIr-CLEO determined from pseu-docapacitance measurements was calculated to be 30 � 5 m2
g�1 which is much lower than the ECSAIr value determined fromCO stripping (61.2 � 3.1 m2 g�1) obtained before electro-chemical oxidation, but very similar to the surface area
© 2021 The Author(s). Published by the Royal Society of Chemistry
estimated for IrO2-EO. The growth of the oxide/hydroxide surfacespecies during the electrochemical oxidation step may result inlowering the surface area by growing within smaller pores andlimiting the access of the electrolyte.74,89 Our previous study ofNiIr nanoframes showed the presence of a �5 A-thick oxide/hydroxide surface layer aer the electrochemical oxidationstep.14
Evaluation of electrochemical oxygen evolution activity andreaction mechanism
Following the electrochemical oxidation step, the OER activityof the CoIr-CLEO catalyst material was electrochemically evalu-ated based on previously reported methods by our group14 andother groups.36 To determine the OER current, we used chro-noamperometry rather than linear sweep voltammetry to reducethe contribution of electrochemical double layer capacitance.14
To evaluate the mass activity, the current determined fromchronoamperometry was normalized for the actual Ir masswhich was calculated by determining the Ir mass on the elec-trode and subtracting the Ir leached out into the solutionduring the EO step determined by inductively coupled plasmamass spectrometry (details provided in Experimental section).
Shown in Fig. 8A are the chronoamperometric polarizationcurves of CoIr-CLEO and IrO2,EO normalized versus the mass ofIr. The higher current observed for CoIr-CLEO within the OERchronoamperometric curve clearly shows the superior OERactivity of CoIr-CLEO compared to IrO2,EO. The mass-normalizedOER activities of the CoIr-CLEO, and IrO2-EO were compared at1.51 VRHE and are shown in Fig. 8C. A potential of 1.51 VRHE wasused since the Tafel plot (Fig. 8B) still shows linear behaviorwithin this voltage region, and lower overpotential relative tothe thermodynamic potential of the reaction also minimizes thecontribution of mass transport. At a potential of 1.51 VRHE, themass activity of CoIr-CLEO (243 � 47 A gIr
�1) is 17 times higherthan the mass activity of IrO2-EO (13.9 � 1.4 A gIr
�1).We determined the OER specic activity by normalizing the
current to the electrochemical surface area determined frompseudocapacitance measurements. As shown in Fig. 8D, theOER specic activities at 1.51 VRHE is 0.80 � 0.02 A cmIrO2
�2 forCoIr-CLEO which is signicantly (18 times) higher than the OERspecic activity of 0.045 � 0.005 A cmIrO2
�2 for commercial IrO2
(IrO2-EO). The CoIr-CLEO catalyst showed a signicant improve-ment in both mass and specic OER activity compared with thecommercial IrO2-EO catalyst.
The improvement of the specic activity of CoIr-CLEOcompared to IrO2-EO indicates that the catalytically activesurface sites of CoIr-CLEO are more active for oxygen evolution.Our XPS measurements (Fig. 6) support the presence ofmultiple species within the surface region including iridiumoxide, iridium oxyhydroxide, and iridium hydroxide withiridium in 4+ and 3+ oxidation states and the presence of cobaltoxides and hydroxides with cobalt in 2+ and 3+ oxidation states.However, our CV data (Fig. 7C) shows that the surface ischanged aer undergoing exposure to high oxidation potentialsunder OER conditions, and therefore the CV measurements aremore representative of the OER catalyst surface. The CV of CoIr-
Nanoscale Adv., 2021, 3, 1976–1996 | 1987

Fig. 8 (A) Current in the oxygen evolution reaction (OER) voltage region determined from chronoamperometry measurements of CoIr-CL 2Dnanoframes and commercial IrO2 after electrochemical oxidation (EO) step; testing performed in O2-free 0.1 M HClO4 under rotation at2500 rpm; (B) Tafel plot and fitted Tafel slopes obtained from chronoamperometry data; the potential (iR-corrected) was set between 1.47 V to1.52 V to reduce themass transport contribution; (C) comparison of OERmass activities at 1.51 VRHE; and (D) comparison of OER specific activitiesat 1.51 VRHE.
Nanoscale Advances Paper
Ope
n A
cces
s A
rtic
le. P
ublis
hed
on 0
5 Fe
brua
ry 2
021.
Dow
nloa
ded
on 1
/25/
2022
2:5
6:57
PM
. T
his
artic
le is
lice
nsed
und
er a
Cre
ativ
e C
omm
ons
Attr
ibut
ion-
Non
Com
mer
cial
3.0
Unp
orte
d L
icen
ce.
View Article Online
CLEO (Fig. 7C) shows peaks consistent with the surface havingIr3+–OH and Ir4+O2 or Ir4+O(OH)2 groups. As discussed above,the potential of the oxidation peak at �0.27 VRHE, attributed tosurface Ir3+–OH groups occurs at a lower potential compared tothe peak potential of �0.48 VRHE for IrO2-EO. Prior worksupports that iridium hydroxo (Ir–OH) surface species arestrongly linked to OER activity,2 and Ir–OH groups can beconsidered as descriptors for OER activity.90 The higher surfaceactivity of CoIr-CLEO compared to IrO2-EO is attributed to pres-ence of highly active Ir-OH species that may interact withsubsurface Co; however, additional analysis is needed to char-acterize the surface under reaction conditions. The OER in acidinvolves a complex, multi-step reaction with multiple interme-diates (discussed below). A number of prior studies support thatat OER potentials the oxidation state of iridium increases from4+ to 5+,91–93 while other studies report only Ir4+ is present underOER conditions.94–96 The different electronegativity of Cocompared to Ir may inuence the oxidation states and electrondensity distribution within one or more of the OER steps and/orintermediates.2,14,90–96 Substituents inuence local electrondensity and affect the OER steps as supported by our previousstudy that modelled the effect of Ni-substituted into IrO2 andfound Ni within specic sites resulted in electron densityaccumulation within bridging oxygens, lowering the activationenergy of the rate-determining OH bond breaking step.14 PriorDFT calculations support that cobalt doping within IrO2
modies the electronic structure of the active site and lowers
1988 | Nanoscale Adv., 2021, 3, 1976–1996
the OER activation energy.25 A previous study reported Coincorporation within SrIrO3 increased the coverage of surfacehydroxyl groups, modied the Ir–O bond covalency, altered theoxygen p-band center of the material, and increased OERactivity.30 We conrmed that cobalt remains within the struc-ture aer exposure to OER conditions following durabilitytesting (Fig. S9†); however, additional analysis is needed todetermine the specic nature of Co within the surface regionaer exposure to electrochemical potentials and how Co withinIrO2 affects the electron density and OER kinetics.
In addition to direct comparison of the OER activity of CoIr-CLEO with IrO2-EO from our group's tests,14 the OER massactivities of CoIr-CLEO were compared with previously reportedCo and Ir based catalysts in Table S6.† A direct comparison isdifficult due to differences in the experimental conditions suchas the type of electrolyte, electrochemical method (i.e. linearsweep voltammetry or chronoamperometry), catalyst loading,potential of the analysis, ohmic drop correction, backgroundsubtraction etc., which can inuence the nal activity values.14
The CoIr-CLEO nanoframes showed one of the highest OERactivities compared to similar CoIr-based materials reported todate only lower than recently reported IrCo nanowires.3 Theoverpotential of CoIr-CLEO nanoframes was also lower than thatof previously reported IrCo oxide materials.27,28
The Tafel slopes of CoIr-CLEO and IrO2,EO (Fig. 8B) wereanalyzed to provide insight regarding the reaction mecha-nism.97,98 The Tafel slope of CoIr-CLEO (40 � 4 mV dec�1) is
© 2021 The Author(s). Published by the Royal Society of Chemistry
Paper Nanoscale Advances
Ope
n A
cces
s A
rtic
le. P
ublis
hed
on 0
5 Fe
brua
ry 2
021.
Dow
nloa
ded
on 1
/25/
2022
2:5
6:57
PM
. T
his
artic
le is
lice
nsed
und
er a
Cre
ativ
e C
omm
ons
Attr
ibut
ion-
Non
Com
mer
cial
3.0
Unp
orte
d L
icen
ce.
View Article Online
similar to the Tafel slope of IrO2,EO (44 � 3 mV dec�1),and consistent with the value of others that report a similarIrOx(OH)y surface structure.99 The similar Tafel slopes of CoIr-CLEO and IrO2-EO suggest that similar rate-determining step iscontrolling the reaction mechanism on both catalysts. Previousstudies on OER mechanisms have proposed different electro-chemical pathways including the “electrochemical oxide path”and “DFT-predicted peroxide path”, differentiated by theformation of dissimilar surface intermediate species andrecombination steps.100–103 The electrochemical oxide path isdescribed by eqn (1)–(3) below,
H2O + M / M–OH + H+ + e� (1)
M–OH / M–O + H+ + e� (2)
2M–O / 2M + O2 (3)
where M describes a surface-active site. The DFT-predictedperoxide path involves the same two rst initial steps as theelectrochemical oxide path, eqn (1) and (2), but then involvesdifferent subsequent reaction steps, described by eqn (4) and (5)below.103
M–O + H2O / MOOH + H+ + e� (4)
MOOH / M + O2 + H+ + e� (5)
Within both reaction mechanisms (i.e. electrochemical oxidepath and DFT-predicted peroxide path), considering the secondproton–electron transfer step as the rate limiting reaction stepresults in a predicted Tafel slope of 40 mV dec�1.101 Themeasured values of the Tafel slopes of CoIr-CLEO and IrO2-EO
suggest that the OER is limited by the second electron transferstep (eqn (2)) which involves formation of Ir–O species and thatthe reaction may proceed via either the electrochemical oxidepath or DFT-predicted peroxide path. It is important to note thatthe analysis of the reaction mechanism using the Tafel slopeincludes the assumption that the relative surface coverage of theadsorbed species is constant.100 Results obtained by microkineticanalysis98 have demonstrated that the evolution of the concen-tration of intermediates must be considered; therefore, moreanalysis needs to be done to corroborate the actual mechanism.
Evaluation of electrocatalyst stability
Within acidic OER catalysts, stability remains a criticallyimportant but signicantly less studied factor relative toactivity.18,104 Catalyst degradation and long term performancehave an important impact on the development of PEM electro-lyzers, particularly with low catalyst loadings.3 The stability ofthe catalyst was evaluated using an accelerated durabilitytesting (ADT) protocol consisting of applying a constantpotential of 1.6 V for 13.5 hours, which has been previouslyutilized to evaluate the durability of a number of iridium-basedcatalysts.3,36
The comparison of the iridium mass-normalized current,Tafel slopes, OER mass activities, and OER specic activities of
© 2021 The Author(s). Published by the Royal Society of Chemistry
CoIr-CLEO and IrO2-EO (aer EO) and CoIr-CLADT and IrO2-ADT
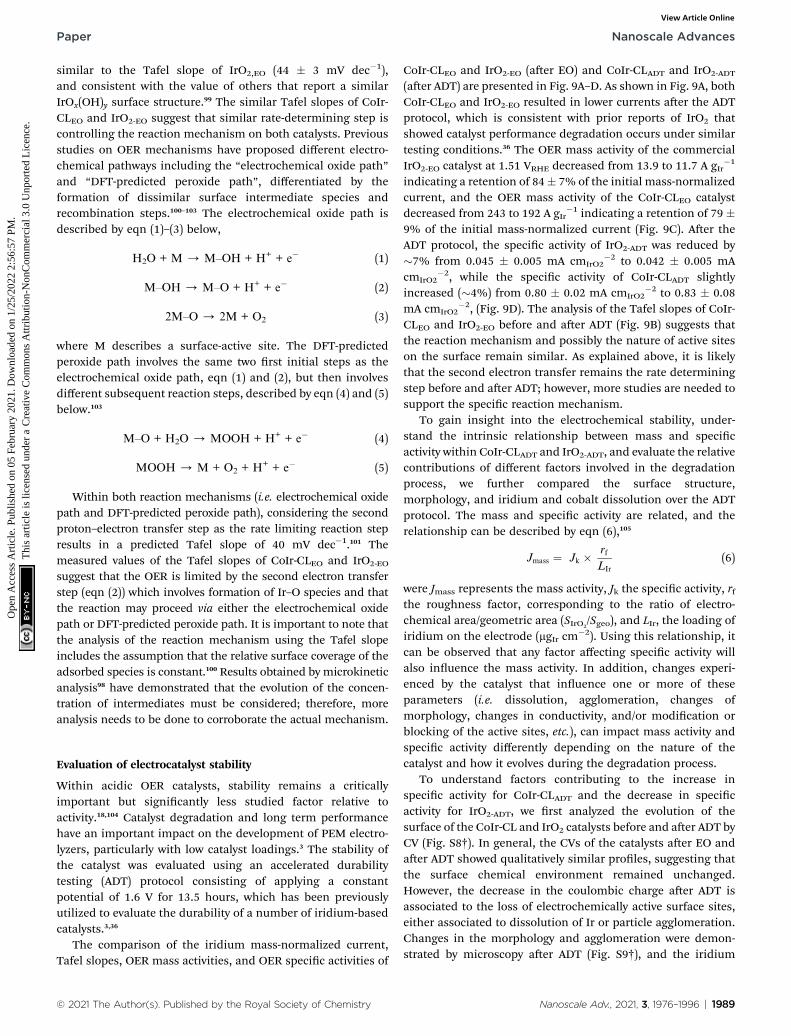
(aer ADT) are presented in Fig. 9A–D. As shown in Fig. 9A, bothCoIr-CLEO and IrO2-EO resulted in lower currents aer the ADTprotocol, which is consistent with prior reports of IrO2 thatshowed catalyst performance degradation occurs under similartesting conditions.36 The OER mass activity of the commercialIrO2-EO catalyst at 1.51 VRHE decreased from 13.9 to 11.7 A gIr
�1
indicating a retention of 84� 7% of the initial mass-normalizedcurrent, and the OER mass activity of the CoIr-CLEO catalystdecreased from 243 to 192 A gIr
�1 indicating a retention of 79 �9% of the initial mass-normalized current (Fig. 9C). Aer theADT protocol, the specic activity of IrO2-ADT was reduced by�7% from 0.045 � 0.005 mA cmIrO2
�2 to 0.042 � 0.005 mAcmIrO2
�2, while the specic activity of CoIr-CLADT slightlyincreased (�4%) from 0.80 � 0.02 mA cmIrO2
�2 to 0.83 � 0.08mA cmIrO2
�2, (Fig. 9D). The analysis of the Tafel slopes of CoIr-CLEO and IrO2-EO before and aer ADT (Fig. 9B) suggests thatthe reaction mechanism and possibly the nature of active siteson the surface remain similar. As explained above, it is likelythat the second electron transfer remains the rate determiningstep before and aer ADT; however, more studies are needed tosupport the specic reaction mechanism.
To gain insight into the electrochemical stability, under-stand the intrinsic relationship between mass and specicactivity within CoIr-CLADT and IrO2-ADT, and evaluate the relativecontributions of different factors involved in the degradationprocess, we further compared the surface structure,morphology, and iridium and cobalt dissolution over the ADTprotocol. The mass and specic activity are related, and therelationship can be described by eqn (6),105
Jmass ¼ Jk � rf
LIr
(6)
were Jmass represents the mass activity, Jk the specic activity, rfthe roughness factor, corresponding to the ratio of electro-chemical area/geometric area (SIrO2
/Sgeo), and LIr, the loading ofiridium on the electrode (mgIr cm
�2). Using this relationship, itcan be observed that any factor affecting specic activity willalso inuence the mass activity. In addition, changes experi-enced by the catalyst that inuence one or more of theseparameters (i.e. dissolution, agglomeration, changes ofmorphology, changes in conductivity, and/or modication orblocking of the active sites, etc.), can impact mass activity andspecic activity differently depending on the nature of thecatalyst and how it evolves during the degradation process.
To understand factors contributing to the increase inspecic activity for CoIr-CLADT and the decrease in specicactivity for IrO2-ADT, we rst analyzed the evolution of thesurface of the CoIr-CL and IrO2 catalysts before and aer ADT byCV (Fig. S8†). In general, the CVs of the catalysts aer EO andaer ADT showed qualitatively similar proles, suggesting thatthe surface chemical environment remained unchanged.However, the decrease in the coulombic charge aer ADT isassociated to the loss of electrochemically active surface sites,either associated to dissolution of Ir or particle agglomeration.Changes in the morphology and agglomeration were demon-strated by microscopy aer ADT (Fig. S9†), and the iridium
Nanoscale Adv., 2021, 3, 1976–1996 | 1989
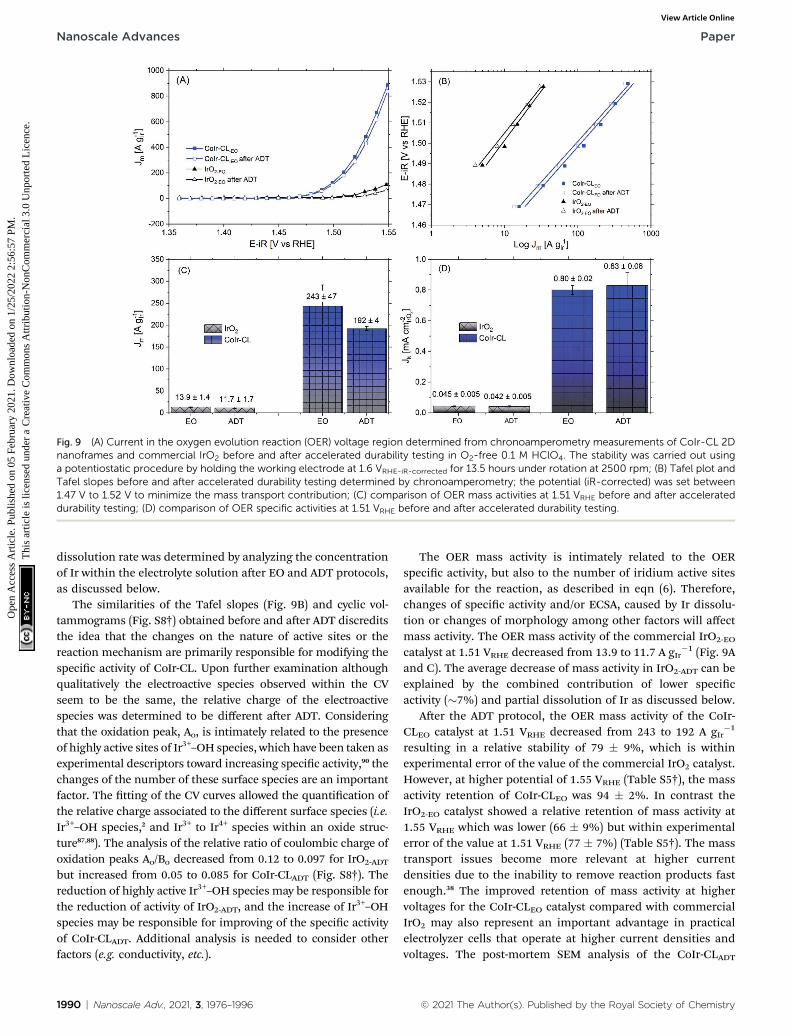
Fig. 9 (A) Current in the oxygen evolution reaction (OER) voltage region determined from chronoamperometry measurements of CoIr-CL 2Dnanoframes and commercial IrO2 before and after accelerated durability testing in O2-free 0.1 M HClO4. The stability was carried out usinga potentiostatic procedure by holding the working electrode at 1.6 VRHE-iR-corrected for 13.5 hours under rotation at 2500 rpm; (B) Tafel plot andTafel slopes before and after accelerated durability testing determined by chronoamperometry; the potential (iR-corrected) was set between1.47 V to 1.52 V to minimize the mass transport contribution; (C) comparison of OER mass activities at 1.51 VRHE before and after accelerateddurability testing; (D) comparison of OER specific activities at 1.51 VRHE before and after accelerated durability testing.
Nanoscale Advances Paper
Ope
n A
cces
s A
rtic
le. P
ublis
hed
on 0
5 Fe
brua
ry 2
021.
Dow
nloa
ded
on 1
/25/
2022
2:5
6:57
PM
. T
his
artic
le is
lice
nsed
und
er a
Cre
ativ
e C
omm
ons
Attr
ibut
ion-
Non
Com
mer
cial
3.0
Unp
orte
d L
icen
ce.
View Article Online
dissolution rate was determined by analyzing the concentrationof Ir within the electrolyte solution aer EO and ADT protocols,as discussed below.
The similarities of the Tafel slopes (Fig. 9B) and cyclic vol-tammograms (Fig. S8†) obtained before and aer ADT discreditsthe idea that the changes on the nature of active sites or thereaction mechanism are primarily responsible for modifying thespecic activity of CoIr-CL. Upon further examination althoughqualitatively the electroactive species observed within the CVseem to be the same, the relative charge of the electroactivespecies was determined to be different aer ADT. Consideringthat the oxidation peak, Ao, is intimately related to the presenceof highly active sites of Ir3+–OH species, which have been taken asexperimental descriptors toward increasing specic activity,90 thechanges of the number of these surface species are an importantfactor. The tting of the CV curves allowed the quantication ofthe relative charge associated to the different surface species (i.e.Ir3+–OH species,2 and Ir3+ to Ir4+ species within an oxide struc-ture87,88). The analysis of the relative ratio of coulombic charge ofoxidation peaks Ao/Bo decreased from 0.12 to 0.097 for IrO2-ADT
but increased from 0.05 to 0.085 for CoIr-CLADT (Fig. S8†). Thereduction of highly active Ir3+–OH species may be responsible forthe reduction of activity of IrO2-ADT, and the increase of Ir3+–OHspecies may be responsible for improving of the specic activityof CoIr-CLADT. Additional analysis is needed to consider otherfactors (e.g. conductivity, etc.).
1990 | Nanoscale Adv., 2021, 3, 1976–1996
The OER mass activity is intimately related to the OERspecic activity, but also to the number of iridium active sitesavailable for the reaction, as described in eqn (6). Therefore,changes of specic activity and/or ECSA, caused by Ir dissolu-tion or changes of morphology among other factors will affectmass activity. The OER mass activity of the commercial IrO2-EO
catalyst at 1.51 VRHE decreased from 13.9 to 11.7 A gIr�1 (Fig. 9A
and C). The average decrease of mass activity in IrO2-ADT can beexplained by the combined contribution of lower specicactivity (�7%) and partial dissolution of Ir as discussed below.
Aer the ADT protocol, the OER mass activity of the CoIr-CLEO catalyst at 1.51 VRHE decreased from 243 to 192 A gIr
�1
resulting in a relative stability of 79 � 9%, which is withinexperimental error of the value of the commercial IrO2 catalyst.However, at higher potential of 1.55 VRHE (Table S5†), the massactivity retention of CoIr-CLEO was 94 � 2%. In contrast theIrO2-EO catalyst showed a relative retention of mass activity at1.55 VRHE which was lower (66 � 9%) but within experimentalerror of the value at 1.51 VRHE (77 � 7%) (Table S5†). The masstransport issues become more relevant at higher currentdensities due to the inability to remove reaction products fastenough.38 The improved retention of mass activity at highervoltages for the CoIr-CLEO catalyst compared with commercialIrO2 may also represent an important advantage in practicalelectrolyzer cells that operate at higher current densities andvoltages. The post-mortem SEM analysis of the CoIr-CLADT
© 2021 The Author(s). Published by the Royal Society of Chemistry
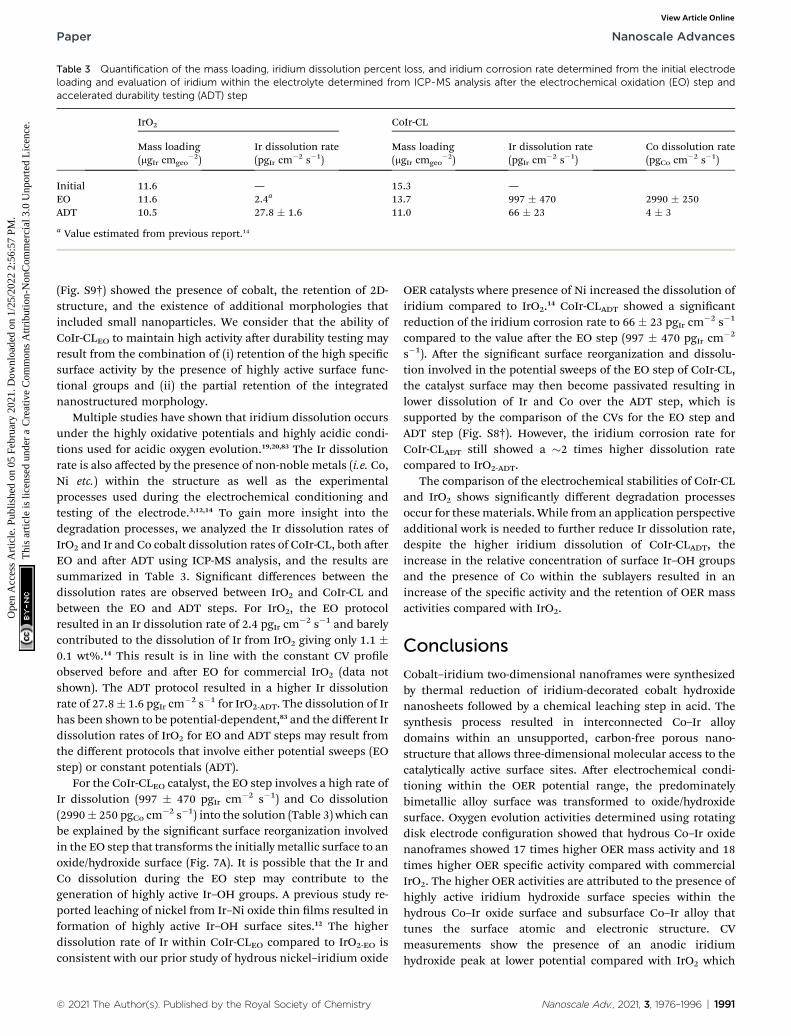
Table 3 Quantification of the mass loading, iridium dissolution percent loss, and iridium corrosion rate determined from the initial electrodeloading and evaluation of iridium within the electrolyte determined from ICP-MS analysis after the electrochemical oxidation (EO) step andaccelerated durability testing (ADT) step
IrO2 CoIr-CL
Mass loading(mgIr cmgeo
�2)Ir dissolution rate(pgIr cm
�2 s�1)Mass loading(mgIr cmgeo
�2)Ir dissolution rate(pgIr cm
�2 s�1)Co dissolution rate(pgCo cm
�2 s�1)
Initial 11.6 — 15.3 —EO 11.6 2.4a 13.7 997 � 470 2990 � 250ADT 10.5 27.8 � 1.6 11.0 66 � 23 4 � 3
a Value estimated from previous report.14
Paper Nanoscale Advances
Ope
n A
cces
s A
rtic
le. P
ublis
hed
on 0
5 Fe
brua
ry 2
021.
Dow
nloa
ded
on 1
/25/
2022
2:5
6:57
PM
. T
his
artic
le is
lice
nsed
und
er a
Cre
ativ
e C
omm
ons
Attr
ibut
ion-
Non
Com
mer
cial
3.0
Unp
orte
d L
icen
ce.
View Article Online
(Fig. S9†) showed the presence of cobalt, the retention of 2D-structure, and the existence of additional morphologies thatincluded small nanoparticles. We consider that the ability ofCoIr-CLEO to maintain high activity aer durability testing mayresult from the combination of (i) retention of the high specicsurface activity by the presence of highly active surface func-tional groups and (ii) the partial retention of the integratednanostructured morphology.
Multiple studies have shown that iridium dissolution occursunder the highly oxidative potentials and highly acidic condi-tions used for acidic oxygen evolution.19,20,83 The Ir dissolutionrate is also affected by the presence of non-noble metals (i.e. Co,Ni etc.) within the structure as well as the experimentalprocesses used during the electrochemical conditioning andtesting of the electrode.3,12,14 To gain more insight into thedegradation processes, we analyzed the Ir dissolution rates ofIrO2 and Ir and Co cobalt dissolution rates of CoIr-CL, both aerEO and aer ADT using ICP-MS analysis, and the results aresummarized in Table 3. Signicant differences between thedissolution rates are observed between IrO2 and CoIr-CL andbetween the EO and ADT steps. For IrO2, the EO protocolresulted in an Ir dissolution rate of 2.4 pgIr cm
�2 s�1 and barelycontributed to the dissolution of Ir from IrO2 giving only 1.1 �0.1 wt%.14 This result is in line with the constant CV proleobserved before and aer EO for commercial IrO2 (data notshown). The ADT protocol resulted in a higher Ir dissolutionrate of 27.8� 1.6 pgIr cm
�2 s�1 for IrO2-ADT. The dissolution of Irhas been shown to be potential-dependent,83 and the different Irdissolution rates of IrO2 for EO and ADT steps may result fromthe different protocols that involve either potential sweeps (EOstep) or constant potentials (ADT).
For the CoIr-CLEO catalyst, the EO step involves a high rate ofIr dissolution (997 � 470 pgIr cm�2 s�1) and Co dissolution(2990� 250 pgCo cm
�2 s�1) into the solution (Table 3) which canbe explained by the signicant surface reorganization involvedin the EO step that transforms the initially metallic surface to anoxide/hydroxide surface (Fig. 7A). It is possible that the Ir andCo dissolution during the EO step may contribute to thegeneration of highly active Ir–OH groups. A previous study re-ported leaching of nickel from Ir–Ni oxide thin lms resulted information of highly active Ir–OH surface sites.12 The higherdissolution rate of Ir within CoIr-CLEO compared to IrO2-EO isconsistent with our prior study of hydrous nickel–iridium oxide
© 2021 The Author(s). Published by the Royal Society of Chemistry
OER catalysts where presence of Ni increased the dissolution ofiridium compared to IrO2.14 CoIr-CLADT showed a signicantreduction of the iridium corrosion rate to 66 � 23 pgIr cm
�2 s�1
compared to the value aer the EO step (997 � 470 pgIr cm�2
s�1). Aer the signicant surface reorganization and dissolu-tion involved in the potential sweeps of the EO step of CoIr-CL,the catalyst surface may then become passivated resulting inlower dissolution of Ir and Co over the ADT step, which issupported by the comparison of the CVs for the EO step andADT step (Fig. S8†). However, the iridium corrosion rate forCoIr-CLADT still showed a �2 times higher dissolution ratecompared to IrO2-ADT.
The comparison of the electrochemical stabilities of CoIr-CLand IrO2 shows signicantly different degradation processesoccur for thesematerials. While from an application perspectiveadditional work is needed to further reduce Ir dissolution rate,despite the higher iridium dissolution of CoIr-CLADT, theincrease in the relative concentration of surface Ir–OH groupsand the presence of Co within the sublayers resulted in anincrease of the specic activity and the retention of OER massactivities compared with IrO2.
Conclusions
Cobalt–iridium two-dimensional nanoframes were synthesizedby thermal reduction of iridium-decorated cobalt hydroxidenanosheets followed by a chemical leaching step in acid. Thesynthesis process resulted in interconnected Co–Ir alloydomains within an unsupported, carbon-free porous nano-structure that allows three-dimensional molecular access to thecatalytically active surface sites. Aer electrochemical condi-tioning within the OER potential range, the predominatelybimetallic alloy surface was transformed to oxide/hydroxidesurface. Oxygen evolution activities determined using rotatingdisk electrode conguration showed that hydrous Co–Ir oxidenanoframes showed 17 times higher OER mass activity and 18times higher OER specic activity compared with commercialIrO2. The higher OER activities are attributed to the presence ofhighly active iridium hydroxide surface species within thehydrous Co–Ir oxide surface and subsurface Co–Ir alloy thattunes the surface atomic and electronic structure. CVmeasurements show the presence of an anodic iridiumhydroxide peak at lower potential compared with IrO2 which
Nanoscale Adv., 2021, 3, 1976–1996 | 1991
Nanoscale Advances Paper
Ope
n A
cces
s A
rtic
le. P
ublis
hed
on 0
5 Fe
brua
ry 2
021.
Dow
nloa
ded
on 1
/25/
2022
2:5
6:57
PM
. T
his
artic
le is
lice
nsed
und
er a
Cre
ativ
e C
omm
ons
Attr
ibut
ion-
Non
Com
mer
cial
3.0
Unp
orte
d L
icen
ce.
View Article Online
supports the Co–Ir nanoframes have highly active Ir–OH surfacespecies that may contribute to the high OER activity.
In addition to higher activity, the hydrous Co–Ir oxidenanoframes exhibited similar retention of initial OER massactivity (79 � 9% retention) as commercial IrO2 (84 � 7%retention) tested with rotating disk electrode measurementsusing an accelerated durability testing protocol. The retentionof OER mass activity over accelerated durability testing ofcobalt-containing Co–Ir nanoframes was dramatically higherthan similarly prepared nickel-containing Ni–Ir nanoframes14
which suggests cobalt–iridium interaction may be more stablethan nickel–iridium interaction within these structures. Thecomparison of the factors inuencing the electrochemicalstabilities of CoIr-CL and IrO2 under OER conditions indicatesthat the catalysts undergo signicantly different degradationprocesses. The decrease in the OER mass activity of the IrO2
catalyst can be explained by the combined contribution of lowerspecic activity and partial dissolution of Ir. The analysis of thedegradation of hydrous Co–Ir oxide nanoframes showeda higher Ir dissolution rate for the compared with IrO2; however,the specic activity of CoIr-CLEO and the relative contribution ofsurface iridium hydroxide groups increased which contributesto the similar OER mass stability of CoIr-CLEO compared withIrO2 under the ADT testing conditions. Our work that showsthat the bimetallic cobalt–iridium 2D nanoframes obtaina signicantly higher OER mass activity and similar stabilitycompared with a commercial benchmark IrO2; however, thebimetallic Co–Ir catalyst undergoes a signicantly differentdegradation process compared with the monometallic IrO2
catalyst. Our work furthers the understanding of factors inu-encing the activity and stability of bimetallic and monometallicacidic OER electrocatalysts and contributes to the design ofelectrocatalysts with high activity and stability.
Conflicts of interest
There are no conicts to declare.
Acknowledgements
The authors acknowledge support of this research from theOffice of Naval Research Grant No. N00014-16-1-2777 andN00014-19-1-2071 for materials, structural and electrochemicalcharacterization. The authors acknowledge support of thisresearch from the National Science Foundation Award No.1936458 for stability and dissolution analysis. R. M. acknowl-edges support from the National Science Foundation ResearchExperiences for Undergraduates (REU) Award, Grant No.1757843. The authors would like to thank Dr Sanmathi Cha-valmane Subbenaik (Washington University in Saint Louis) forher assistance in obtaining ICP-MS analysis.
References
1 M. Carmo, D. L. Fritz, J. Mergel and D. Stolten, AComprehensive Review on PEM Water Electrolysis, Int. J.Hydrogen Energy, 2013, 38, 4901–4934.
1992 | Nanoscale Adv., 2021, 3, 1976–1996
2 D. F. Abbott, D. Lebedev, K. Waltar, M. Povia,M. Nachtegaal, E. Fabbri, C. Coperet and T. J. Schmidt,Iridium Oxide for the Oxygen Evolution Reaction:Correlation between Particle Size, Morphology, and theSurface Hydroxo Layer from Operando XAS, Chem. Mater.,2016, 28, 6591–6604.
3 S. M. Alia, S. Shulda, C. Ngo, S. Pylypenko and B. S. Pivovar,Iridium-Based Nanowires as Highly Active, OxygenEvolution Reaction Electrocatalysts, ACS Catal., 2018, 8,2111–2120.
4 T. J. Meyer, The Art of Splitting Water, Nature, 2008, 451,778.
5 N. Danilovic, R. Subbaraman, K.-C. Chang, S. H. Chang,Y. J. Kang, J. Snyder, A. P. Paulikas, D. Strmcnik,Y.-T. Kim, D. Myers, V. R. Stamenkovic andN. M. Markovic, Activity–Stability Trends for the OxygenEvolution Reaction on Monometallic Oxides in AcidicEnvironments, J. Phys. Chem. Lett., 2014, 5, 2474–2478.
6 M. H. Miles and M. A. Thomason, Periodic Variations ofOvervoltages for Water Electrolysis in Acid Solutions fromCyclic Voltammetric Studies, J. Electrochem. Soc., 1976,123, 1459–1461.
7 T. Reier, M. Oezaslan and P. Strasser, ElectrocatalyticOxygen Evolution Reaction (OER) on Ru, Ir, and PtCatalysts: A Comparative Study of Nanoparticles and BulkMaterials, ACS Catal., 2012, 2, 1765–1772.
8 S. Hackwood, L. M. Schiavone, W. C. Dautremont-Smithand G. Beni, Anodic Evolution of Oxygen on SputteredIridium Oxide Films, J. Electrochem. Soc., 1981, 128, 2569–2573.
9 H. R. Yu, N. Danilovic, Y. Wang, W. Willis,A. Poozhikunnath, L. Bonville, C. Capuano, K. Ayers andR. Maric, Nano-size IrOx Catalyst of High Activity andStability in PEM Water Electrolyzer with Ultra-low IridiumLoading, Appl. Catal., B, 2018, 239, 133–146.
10 S. Zhao, A. Stocks, B. Rasimick, K. More and H. Xu, HighlyActive, Durable Dispersed Iridium Nanocatalysts for PEMWater Electrolyzers, J. Electrochem. Soc., 2018, 165, F82–F89.
11 H. S. Oh, H. N. Nong, T. Reier, A. Bergmann, M. Gliech,J. F. de Araujo, E. Willinger, R. Schlogl, D. Teschner andP. Strasser, Electrochemical Catalyst-Support Effects andTheir Stabilizing Role for IrOx Nanoparticle Catalystsduring the Oxygen Evolution Reaction, J. Am. Chem. Soc.,2016, 138, 12552–12563.
12 T. Reier, Z. Pawolek, S. Cherevko, M. Bruns, T. Jones,D. Teschner, S. Selve, A. Bergmann, H. N. Nong,R. Schlogl, K. J. J. Mayrhofer and P. Strasser, MolecularInsight in Structure and Activity of Highly Efficient, Low-Ir Ir–Ni Oxide Catalysts for Electrochemical WaterSplitting (OER), J. Am. Chem. Soc., 2015, 137, 13031–13040.
13 C. Wang, R. B. Moghaddam and S. H. Bergens, Active,Simple Iridium-Copper Hydrous Oxide Electrocatalysts forWater Oxidation, J. Phys. Chem. C, 2017, 121, 5480–5486.
14 F. Godınez-Salomon, L. Albiter, S. M. Alia, B. S. Pivovar,L. E. Camacho-Forero, P. B. Balbuena, R. Mendoza-Cruz,M. J. Arellano-Jimenez and C. P. Rhodes, Self-SupportedHydrous Iridium–Nickel Oxide Two-Dimensional
© 2021 The Author(s). Published by the Royal Society of Chemistry
Paper Nanoscale Advances
Ope
n A
cces
s A
rtic
le. P
ublis
hed
on 0
5 Fe
brua
ry 2
021.
Dow
nloa
ded
on 1
/25/
2022
2:5
6:57
PM
. T
his
artic
le is
lice
nsed
und
er a
Cre
ativ
e C
omm
ons
Attr
ibut
ion-
Non
Com
mer
cial
3.0
Unp
orte
d L
icen
ce.
View Article Online
Nanoframes for High Activity Oxygen EvolutionElectrocatalysts, ACS Catal., 2018, 8, 10498–10520.
15 J. Rossmeisl, Z. W. Qu, H. Zhu, G. J. Kroes and J. K. Norskov,Electrolysis of Water on Oxide Surfaces, J. Electroanal.Chem., 2007, 607, 83–89.
16 H. N. Nong, H.-S. Oh, T. Reier, E. Willinger, M.-G. Willinger,V. Petkov, D. Teschner and P. Strasser, Oxide-SupportedIrNiOx Core–Shell Particles as Efficient, Cost-Effective, andStable Catalysts for Electrochemical Water Splitting,Angew. Chem., Int. Ed., 2015, 54, 2975–2979.
17 W. Sun, Y. Song, X.-Q. Gong, L.-M. Cao and J. Yang, AnEfficiently Tuned d-orbital Occupation of IrO2 by Dopingwith Cu for Enhancing the Oxygen Evolution ReactionActivity, Chem. Sci., 2015, 6, 4993–4999.
18 C. Spori, J. T. H. Kwan, A. Bonakdarpour, D. P. Wilkinsonand P. Strasser, The Stability Challenges of OxygenEvolving Catalysts: Towards a Common FundamentalUnderstanding and Mitigation of Catalyst Degradation,Angew. Chem., Int. Ed., 2017, 56, 5994–6021.
19 S. Geiger, O. Kasian, M. Ledendecker, E. Pizzutilo,A. M. Mingers, W. T. Fu, O. Diaz-Morales, Z. Z. Li,T. Oellers, L. Fruchter, A. Ludwig, K. J. J. Mayrhofer,M. T. M. Koper and S. Cherevko, The Stability Number asa Metric for Electrocatalyst Stability Benchmarking, Nat.Catal., 2018, 1, 508–515.
20 Y. T. Kim, P. P. Lopes, S. A. Park, A. Y. Lee, J. Lim, H. Lee,S. Back, Y. Jung, N. Danilovic, V. Stamenkovic,J. Erlebacher, J. Snyder and N. M. Markovic, BalancingActivity, Stability and Conductivity of Nanoporous Core-shell Iridium/Iridium Oxide Oxygen Evolution Catalysts,Nat. Commun., 2017, 8, 1449.
21 M. Pourbaix, Atlas of Electrochemical Equilibria in AqueousSolutions, National Association of Corrosion Engineers,Houston, Texas, 1974.
22 O. Kasian, J. P. Grote, S. Geiger, S. Cherevko andK. J. J. Mayrhofer, The Common Intermediates of OxygenEvolution and Dissolution Reactions during WaterElectrolysis on Iridium, Angew. Chem., Int. Ed., 2018, 57,2488–2491.
23 C. Roy, R. R. Rao, K. A. Stoerzinger, J. Hwang, J. Rossmeisl,I. Chorkendorff, Y. Shao-Horn and I. E. L. Stephens, Trendsin Activity and Dissolution on RuO2 under OxygenEvolution Conditions: Particles versus Well-DenedExtended Surfaces, ACS Energy Lett., 2018, 3, 2045–2051.
24 S.-A. Park, K.-S. Kim and Y.-T. Kim, ElectrochemicallyActivated Iridium Oxide Black as PromisingElectrocatalyst Having High Activity and Stability forOxygen Evolution Reaction, ACS Energy Lett., 2018, 3,1110–1115.
25 R. G. Gonzalez-Huerta, G. Ramos-Sanchez andP. B. Balbuena, Oxygen Evolution in Co-doped RuO2 andIrO2: Experimental and Theoretical Insights to DiminishElectrolysis Overpotential, J. Power Sources, 2014, 268, 69–76.
26 J. Feng, F. Lv, W. Zhang, P. Li, K. Wang, C. Yang, B. Wang,Y. Yang, J. Zhou, F. Lin, G.-C. Wang and S. Guo, Iridium-Based Multimetallic Porous Hollow Nanocrystals for
© 2021 The Author(s). Published by the Royal Society of Chemistry
Efficient Overall-Water-Splitting Catalysis, Adv. Mater.,2017, 29, 1703798.
27 W. Hu, H. Zhong, W. Liang and S. Chen, Ir-surface EnrichedPorous Ir-Co Oxide Hierarchical Architecture for HighPerformance Water Oxidation in Acidic Media, ACS Appl.Mater. Interfaces, 2014, 6, 12729–12736.
28 W. Q. Zaman, Z. Wang, W. Sun, Z. Zhou, M. Tariq, L. Cao,X.-Q. Gong and J. Yang, Ni–Co Codoping Breaks theLimitation of Single-Metal-Doped IrO2 with HigherOxygen Evolution Reaction Performance and LessIridium, ACS Energy Lett., 2017, 2, 2786–2793.
29 W. Q. Zaman, W. Sun, Z. H. Zhou, Y. Y. Wu, L. M. Cao andJ. Yang, Anchoring of IrO2 on One-Dimensional Co3O4
Nanorods for Robust Electrocatalytic Water Splitting in anAcidic Environment, ACS Appl. Energy Mater., 2018, 1,6374–6380.
30 L. Yang, H. Chen, L. Shi, X. T. Li, X. F. Chu, W. Chen, N. Liand X. X. Zou, Enhanced IridiumMass Activity of 6H-Phase,Ir-Based Perovskite with Nonprecious Incorporation forAcidic Oxygen Evolution Electrocatalysis, ACS Appl. Mater.Interfaces, 2019, 11, 42006–42013.
31 S. Choi, J. Park, M. K. Kabiraz, Y. Hong, T. Kwon, T. Kim,A. Oh, H. Baik, M. Lee, S. M. Paek, S. I. Choi and K. Lee,Pt Dopant: Controlling the Ir Oxidation States towardEfficient and Durable Oxygen Evolution Reaction in AcidicMedia, Adv. Funct. Mater., 2020, 30, 2003935.
32 J. Park, Y. J. Sa, H. Baik, T. Kwon, S. H. Joo and K. Lee,Iridium-Based Multimetallic Nanoframe@NanoframeStructure: An Efficient and Robust Electrocatalyst towardOxygen Evolution Reaction, ACS Nano, 2017, 11, 5500–5509.
33 S. Cherevko, T. Reier, A. R. Zeradjanin, Z. Pawolek,P. Strasser and K. J. J. Mayrhofer, Stability ofNanostructured Iridium Oxide Electrocatalysts DuringOxygen Evolution Reaction in Acidic Environment,Electrochem. Commun., 2014, 48, 81–85.
34 F. Godinez-Salomon, R. Mendoza-Cruz, M. J. Arellano-Jimenez, M. Jose-Yacaman and C. P. Rhodes, MetallicTwo-Dimensional Nanoframes: Unsupported HierarchicalNickel-Platinum Alloy Nanoarchitectures with EnhancedElectrochemical Oxygen Reduction Activity and Stability,ACS Appl. Mater. Interfaces, 2017, 9, 18660–18674.
35 F. Godınez-Salomon, L. Albiter, R. Mendoza-Cruz andC. P. Rhodes, Bimetallic Two-dimensional Nanoframes:High Activity Acidic Bifunctional Oxygen Reduction andEvolution Electrocatalysts, ACS Appl. Energy Mater., 2020,3, 2404–2421.
36 S. M. Alia, B. Rasimick, C. Ngo, K. C. Neyerlin, S. S. Kocha,S. Pylypenko, H. Xu and B. S. Pivovar, Activity and Durabilityof Iridium Nanoparticles in the Oxygen Evolution Reaction,J. Electrochem. Soc., 2016, 163, F3105–F3112.
37 S. Zhao, H. Yu, R. Maric, N. Danilovic, C. B. Capuano,K. E. Ayers and W. E. Mustain, Calculating theElectrochemically Active Surface Area of Iridium Oxide inOperating Proton Exchange Membrane Electrolyzers, J.Electrochem. Soc., 2015, 162, F1292–F1298.
38 H. A. El-Sayed, A. Weiss, L. F. Olbrich, G. P. Putro andH. A. Gasteiger, OER Catalyst Stability Investigation Using
Nanoscale Adv., 2021, 3, 1976–1996 | 1993
Nanoscale Advances Paper
Ope
n A
cces
s A
rtic
le. P
ublis
hed
on 0
5 Fe
brua
ry 2
021.
Dow
nloa
ded
on 1
/25/
2022
2:5
6:57
PM
. T
his
artic
le is
lice
nsed
und
er a
Cre
ativ
e C
omm
ons
Attr
ibut
ion-
Non
Com
mer
cial
3.0
Unp
orte
d L
icen
ce.
View Article Online
RDE Technique: A Stability Measure or an Artifact?, J.Electrochem. Soc., 2019, 166, F458–F464.
39 J. Yang, H. Liu, W. N. Martens and R. L. Frost, Synthesis andCharacterization of Cobalt Hydroxide, CobaltOxyhydroxide, and Cobalt Oxide Nanodiscs, J. Phys. Chem.C, 2010, 114, 111–119.
40 D. S. Hall, D. J. Lockwood, C. Bock and B. R. MacDougall,Nickel Hydroxides and Related Materials: A Review oftheir Structures, Synthesis and Properties, Proc. R. Soc. A,2015, 471, 21740792.
41 H. J. Yin and Z. Y. Tang, Ultrathin Two-DimensionalLayered Metal Hydroxides: An Emerging Platform forAdvanced Catalysis, Energy Conversion and Storage,Chem. Soc. Rev., 2016, 45, 4873–4891.
42 L. S. Sarma, C. H. Chen, S. M. S. Kumar, G. R. Wang,S. C. Yen, D. G. Liu, H. S. Sheu, K. L. Yu, M. T. Tang,J. F. Lee, C. Bock, K. H. Chen and B. J. Hwang, Formationof Pt-Ru nanoparticles in ethylene glycol solution: An insitu X-ray absorption spectroscopy study, Langmuir, 2007,23, 5802–5809.
43 J. Quinson, M. Inaba, S. Neumann, A. A. Swane, J. Bucher,S. B. Simonsen, L. T. Kuhn, J. J. K. Kirkensgaard,K. M. O. Jensen, M. Oezaslan, S. Kunz and M. Arenz,Investigating Particle Size Effects in Catalysis by Applyinga Size-Controlled and Surfactant-Free Synthesis ofColloidal Nanoparticles in Alkaline Ethylene Glycol: CaseStudy of the Oxygen Reduction Reaction on Pt, ACS Catal.,2018, 8, 6627–6635.
44 V. Pecharsky and P. Zavalij, Fundamentals of PowderDiffraction and Structural Characterization of Materials, 2ndedn, Springer Science+Business Media, LLC, New York,2009.
45 S. M. Londono-Restrepo, R. Jeronimo-Cruz, B. M. Milian-Malo, E. M. Rivera-Munoz and M. E. Rodriguez-Garcia,Effect of the Nano Crystal Size on the X-ray DiffractionPatterns of Biogenic Hydroxyapatite from Human, Bovine,and Porcine Bones, Sci. Rep., 2019, 9, 12.
46 P. V. Kamath and S. Ganguly, Infrared SpectroscopicStudies of the Oxide-hydroxides of Ni, Co and Mn, Mater.Lett., 1991, 10, 537–539.
47 G. Soler-Illia, M. Jobbagy, A. E. Regazzoni and M. A. Blesa,Synthesis of Nickel Hydroxide by HomogeneousAlkalinization. Precipitation Mechanism, Chem. Mat.,1999, 11, 3140–3146.
48 Z. P. Xu and H. C. Zeng, Interconversion of Brucite-like andHydrotalcite-like Phases in Cobalt Hydroxide Compounds,Chem. Mater., 1999, 11, 67–74.
49 P. Jeevanandam, Y. Koltypin and A. Gedanken, Synthesis ofNanosized a-Nickel Hydroxide by a Sonochemical Method,Nano Lett., 2001, 1, 263–266.
50 Z. P. Liu, R. Z. Ma, M. Osada, K. Takada and T. Sasaki,Selective and Controlled Synthesis of a- and b-CobaltHydroxides in Highly Developed Hexagonal Platelets, J.Am. Chem. Soc., 2005, 127, 13869–13874.
51 B. Mavis and M. Akinc, Kinetics of Urea Decomposition inthe Presence of Transition Metal Ions: Ni2+, J. Am. Ceram.Soc., 2006, 89, 471–477.
1994 | Nanoscale Adv., 2021, 3, 1976–1996
52 L. P. Xu, Y. S. Ding, C. H. Chen, L. L. Zhao, C. Rimkus,R. Joesten and S. L. Suib, 3D Flowerlike a-NickelHydroxide with Enhanced Electrochemical ActivitySynthesized by Microwave-assisted Hydrothermal Method,Chem. Mater., 2008, 20, 308–316.
53 Z. A. Hu, Y. L. Xie, Y. X. Wang, L. J. Xie, G. R. Fu, X. Q. Jin,Z. Y. Zhang, Y. Y. Yang and H. Y. Wu, Synthesis of a-CobaltHydroxides with Different Intercalated Anions and Effectsof Intercalated Anions on Their Morphology, Basal PlaneSpacing, and Capacitive Property, J. Phys. Chem. C, 2009,113, 12502–12508.
54 Z. F. Zhu, N. Wei, H. Liu and Z. L. He, Microwave-assistedHydrothermal Synthesis of Ni(OH)2 Architectures andtheir in situ Thermal Convention to NiO, Adv. PowderTechnol., 2011, 22, 422–426.
55 T. Wu and C. Z. Yuan, Facile One-pot Strategy Synthesis ofUltrathin a-Co(OH)2 Nanosheets Towards High-performance Electrochemical Capacitors, Mater. Lett.,2012, 85, 161–163.
56 A. K. Mondal, D. W. Su, S. Q. Chen, J. Q. Zhang, A. S. Ungand G. X. Wang, Microwave-assisted Synthesis ofSpherical b-Ni(OH)2 Superstructures for ElectrochemicalCapacitors with Excellent Cycling Stability, Chem. Phys.Lett., 2014, 610, 115–120.
57 J. T. Mehrabad, M. Aghazadeh, M. G. Maragheh,M. R. Ganjali and P. Norouzi, a-Co(OH)2 Nanoplates withExcellent Supercapacitive Performance: ElectrochemicalPreparation and Characterization, Mater. Lett., 2016, 184,223–226.
58 B. Pejova, A. Isahi, M. Najdoski and I. Grozdanov,Fabrication and Characterization of NanocrystallineCobalt Oxide Thin Films, Mater. Res. Bull., 2001, 36, 161–170.
59 J. Ismail, M. F. Ahmed, P. V. Kamath, G. N. Subbanna,S. Uma and J. Gopalakrishnan, Organic Additive-MediatedSynthesis of Novel Cobalt(II) Hydroxides, J. Solid StateChem., 1995, 114, 550–555.
60 Y. Zhang, Y. Yang, L. Yu, X. Q. Meng, F. Wen, J. L. Zhang,H. P. Bi, X. Wang and J. W. Zhu, A Facile SolventRegulated Method for Phase Control of Two-DimensionalNickel-Cobalt Hydroxide Nanosheets: Towards ImprovedPerformance Hybrid Supercapacitors, Mater. Chem. Phys.,2018, 218, 172–181.
61 M. Dixit, G. N. Subbanna and P. V. Kamath, HomogeneousPrecipitation from Solution by Urea Hydrolysis: A NovelChemical Route to the a-hydroxides of Nickel and Cobalt,J. Mater. Chem., 1996, 6, 1429–1432.
62 B. Mavis and M. Akinc, Cyanate Intercalation in NickelHydroxide, Chem. Mater., 2006, 18, 5317–5325.
63 Q. D. Wu, X. P. Gao, G. R. Li, G. L. Pan, T. Y. Yan andH. Y. Zhu, Microstructure and Electrochemical Propertiesof Al-substituted Nickel Hydroxides Modied with CoOOHNanoparticles, J. Phys. Chem. C, 2007, 111, 17082–17087.
64 D. S. Hall, D. J. Lockwood, S. Poirier, C. Bock andB. R. MacDougall, Raman and Infrared Spectroscopy ofa and b Phases of Thin Nickel Hydroxide Films
© 2021 The Author(s). Published by the Royal Society of Chemistry
Paper Nanoscale Advances
Ope
n A
cces
s A
rtic
le. P
ublis
hed
on 0
5 Fe
brua
ry 2
021.
Dow
nloa
ded
on 1
/25/
2022
2:5
6:57
PM
. T
his
artic
le is
lice
nsed
und
er a
Cre
ativ
e C
omm
ons
Attr
ibut
ion-
Non
Com
mer
cial
3.0
Unp
orte
d L
icen
ce.
View Article Online
Electrochemically Formed on Nickel, J. Phys. Chem. A, 2012,116, 6771–6784.
65 D. S. Hall, D. J. Lockwood, S. Poirier, C. Bock andB. R. MacDougall, Applications of in Situ RamanSpectroscopy for Identifying Nickel Hydroxide Materialsand Surface Layers during Chemical Aging, ACS Appl.Mater. Interfaces, 2014, 6, 3141–3149.
66 W. Sawodny, K. Niedenzu and J. W. Dawson, TheVibrational Spectrum of Ethylene Glycol, Spectrochim.Acta, Part A, 1967, 23A, 799–806.
67 S. B. Yang, X. L. Wu, C. L. Chen, H. L. Dong, W. P. Hu andX. K. Wang, Spherical a-Ni(OH)2 Nanoarchitecture Grownon Graphene as Advanced ElectrochemicalPseudocapacitor Materials, Chem. Commun., 2012, 48,2773–2775.
68 K. Nakamoto, Infrared Spectra of Inorganic and CoordinationCompounds, John Wiley & Sons, New York, 1963.
69 D. N. Sathyanarayana, Vibrational Spectroscopy: Theory andApplications, New Age International, New Dehli, 2015.
70 S. Music, S. Popovic, M. Maljkovic, Z. Skoko, K. Furic andA. Gajovic, Thermochemical formation of IrO2 and Ir,Mater. Lett., 2003, 57, 4509–4514.
71 S. A. Makhlouf, Z. H. Bakr, K. I. Aly and M. S. Moustafa,Structural, Electrical and Optical Properties of Co3O4
Nanoparticles, Superlattices Microstruct., 2013, 64, 107–117.72 P. L. Lang and L. J. Richwine, in Practical Sampling
Techniques of Infrared Analysis, ed. P. B. Coleman, CRCPress, New York, NY, 1993, pp. 145–164.
73 M. Salavati-Niasari, A. Khansari and F. Davar, Synthesis andCharacterization of Cobalt Oxide Nanoparticles by ThermalTreatment Process, Inorg. Chim. Acta, 2009, 362, 4937–4942.
74 D. R. Rolison, Catalytic Nanoarchitectures - The Importanceof Nothing and the Unimportance of Periodicity, Science,2003, 299, 1698–1701.
75 T. Binninger, R. Mohamed, K. Waltar, E. Fabbri,P. Levecque, R. Kotz and T. J. Schmidt, ThermodynamicExplanation of the Universal Correlation Between OxygenEvolution Activity and Corrosion of Oxide Catalysts, Sci.Rep., 2015, 5, 12167.
76 S. C. Petitto, E. M. Marsh, G. A. Carson and M. A. Langell,Cobalt Oxide Surface Chemistry: The Interaction ofCoO(100), Co3O4(110) and Co3O4(111) with Oxygen andWater, J. Mol. Catal. A: Chem., 2008, 281, 49–58.
77 A. Younis, D. W. Chu, X. Lin, J. Lee and S. Li, BipolarResistive Switching in p-Type Co3O4 Nanosheets Preparedby Electrochemical Deposition, Nanoscale Res. Lett., 2013,8, 36.
78 M. C. Biesinger, B. P. Payne, A. P. Grosvenor, L. W. M. Lau,A. R. Gerson, R. S. Smart and R. S. Smart, Resolving SurfaceChemical States in XPS Analysis of First Row TransitionMetals, Oxides and Hydroxides: Cr, Mn, Fe, Co and Ni,Appl. Surf. Sci., 2011, 257, 2717–2730.
79 M. Behazin, M. C. Biesinger, J. J. Noel and J. C. Wren,Comparative Study of Film Formation on High-Purity Coand Stellite-6: Probing the Roles of a Chromium OxideLayer and g-Radiation, Corros. Sci., 2012, 63, 40–50.
© 2021 The Author(s). Published by the Royal Society of Chemistry
80 D. Cabrera-German, G. Gomez-Sosa and A. Herrera-Gomez,Accurate Peak Fitting and Subsequent QuantitativeComposition Analysis of the Spectrum of Co 2p Obtainedwith Al K Radiation: I: Cobalt Spinel, Surf. Interface Anal.,2016, 48, 252–256.
81 N. G. Farr and H. J. Griesser, XPS Excitation Dependence ofMeasured Cobalt 2p Peak Intensity Due to Auger PeakInterference, J. Electron Spectrosc. Relat. Phenom., 1989, 49,293–302.
82 U. A. Paulus, T. J. Schmidt, H. A. Gasteiger and R. J. Behm,Oxygen Reduction on a High-Surface Area Pt/VulcanCarbon Catalyst: A Thin-Film Rotating Ring-DiskElectrode Study, J. Electroanal. Chem., 2001, 495, 134–145.
83 S. Cherevko, S. Geiger, O. Kasian, A. Mingers andK. J. J. Mayrhofer, Oxygen Evolution Activity and Stabilityof Iridium in Acidic Media. Part 1. Metallic Iridium, J.Electroanal. Chem., 2016, 773, 69–78.
84 F. Godınez-Salomon, C. P. Rhodes, K. S. Alcantara, Q. Zhu,S. E. Canton, H. A. Calderon, J. L. Reyes-Rodrıguez,M. A. Leyva and O. Solorza-Feria, Tuning the OxygenReduction Activity and Stability of Ni(OH)2@Pt/C Catalyststhrough Controlling Pt Surface Composition, Strain, andElectronic Structure, Electrochim. Acta, 2017, 247, 958–969.
85 S. M. Alia, K. E. Hurst, S. S. Kocha and B. S. Pivovar, MercuryUnderpotential Deposition to Determine Iridium andIridium Oxide Electrochemical Surface Areas, J.Electrochem. Soc., 2016, 163, F3051–F3056.
86 R. Kotz, H. Neff and S. Stucki, Anodic Iridium Oxide Films:XPS Studies of Oxidation State Changes and O2 Evolution, J.Electrochem. Soc., 1984, 131, 72–77.
87 P. Steegstra, M. Busch, I. Panas and E. Ahlberg, Revisitingthe Redox Properties of Hydrous Iridium Oxide Films inthe Context of Oxygen Evolution, J. Phys. Chem. C, 2013,117, 20975–20981.
88 S. Cherevko, S. Geiger, O. Kasian, A. Mingers andK. J. J. Mayrhofer, Oxygen Evolution Activity and Stabilityof Iridium in Acidic Media. Part 2. ElectrochemicallyGrown Hydrous Iridium Oxide, J. Electroanal. Chem., 2016,774, 102–110.
89 J. Koresh and A. Soffer, Double Layer Capacitance andCharging Rate of Ultramicroporous Carbon Electrodes, J.Electrochem. Soc., 1977, 124, 1379–1385.
90 C. Spori, P. Briois, H. N. Nong, T. Reier, A. Billard, S. Kuhl,D. Teschner and P. Strasser, Experimental ActivityDescriptors for Iridium-Based Catalysts for theElectrochemical Oxygen Evolution Reaction (OER), ACSCatal., 2019, 9, 6653–6663.
91 H. G. S. Casalongue, M. L. Ng, S. Kaya, D. Friebel,H. Ogasawara and A. Nilsson, In Situ Observation ofSurface Species on Iridium Oxide Nanoparticles duringthe Oxygen Evolution Reaction, Angew. Chem., Int. Ed.,2014, 53, 7169–7172.
92 Y. B. Mo, I. C. Stefan, W. B. Cai, J. Dong, P. Carey andD. A. Scherson, In situ iridium L-III-edge X-ray absorptionand surface enhanced Raman spectroscopy ofelectrodeposited iridium oxide lms in aqueouselectrolytes, J. Phys. Chem. B, 2002, 106, 3681–3686.
Nanoscale Adv., 2021, 3, 1976–1996 | 1995
Nanoscale Advances Paper
Ope
n A
cces
s A
rtic
le. P
ublis
hed
on 0
5 Fe
brua
ry 2
021.
Dow
nloa
ded
on 1
/25/
2022
2:5
6:57
PM
. T
his
artic
le is
lice
nsed
und
er a
Cre
ativ
e C
omm
ons
Attr
ibut
ion-
Non
Com
mer
cial
3.0
Unp
orte
d L
icen
ce.
View Article Online
93 A. Minguzzi, O. Lugaresi, E. Achilli, C. Locatelli, A. Vertova,P. Ghigna and S. Rondinini, Observing the Oxidation StateTurnover in Heterogeneous Iridium-based Water OxidationCatalysts, Chem. Sci., 2014, 5, 3591–3597.
94 V. Pfeifer, T. E. Jones, J. J. V. Velez, R. Arrigo, S. Piccinin,M. Havecker, A. Knop-Gericke and R. Schlogl, In SituObservation of Reactive Oxygen Species Forming onOxygen-Evolving Iridium Surfaces, Chem. Sci., 2017, 8,2143–2149.
95 P. Lettenmeier, J. Majchel, L. Wang, V. A. Saveleva,S. Zafeiratos, E. R. Savinova, J. J. Gallet, F. Bournel,A. S. Gago and K. A. Friedrich, Highly Active Nano-SizedIridium Catalysts: Synthesis and Operando Spectroscopyin a Proton Exchange Membrane Electrolyzer, Chem. Sci.,2018, 9, 3570–3579.
96 V. A. Saveleva, L. Wang, D. Teschner, T. Jones, A. S. Gago,K. A. Friedrich, S. Zafeiratos, R. Schlogl andE. R. Savinova, Operando Evidence for a Universal OxygenEvolution Mechanism on Thermal and ElectrochemicalIridium Oxides, J. Phys. Chem. Lett., 2018, 9, 3154–3160.
97 R. L. Doyle and M. E. G. Lyon, in Photoelectrochemical SolarFuel Production: From Basic Principles to Advanced Devices,ed. S. Gimenez and J. Bisquert, Springer InternationalPublishing, Cham, 2016, pp. 41–104.
98 T. Shinagawa, A. T. Garcia-Esparza and K. Takanabe,Insight on Tafel Slopes from a Microkinetic Analysis ofAqueous Electrocatalysis for Energy Conversion, Sci. Rep.,2015, 5, 21.
1996 | Nanoscale Adv., 2021, 3, 1976–1996
99 D. Chandra, D. Takama, T. Masaki, T. Sato, N. Abe,T. Togashi, M. Kurihara, K. Saito, T. Yui and M. Yagi,Highly Efficient Electrocatalysis and MechanisticInvestigation of Intermediate IrOx(OH)y NanoparticleFilms for Water Oxidation, ACS Catal., 2016, 6, 3946–3954.
100 J. O. Bockris, Kinetics of Activation Controlled ConsecutiveElectrochemical Reactions: Anodic Evolution of Oxygen, J.Chem. Phys., 1956, 24, 817–827.
101 Y. X. Zhao, N. M. Vargas-Barbosa, E. A. Hernandez-Paganand T. E. Mallouk, Anodic Deposition of ColloidalIridium Oxide Thin Films from Hexahydroxyiridate(IV)Solutions, Small, 2011, 7, 2087–2093.
102 H. Dau, C. Limberg, T. Reier, M. Risch, S. Roggan andP. Strasser, The Mechanism of Water Oxidation: FromElectrolysis via Homogeneous to Biological Catalysis,ChemCatChem, 2010, 2, 724–761.
103 T. Reier, H. N. Nong, D. Teschner, R. Schlogl andP. Strasser, Electrocatalytic Oxygen Evolution Reaction inAcidic Environments – Reaction Mechanisms andCatalysts, Adv. Energy Mater., 2017, 7, 1601275.
104 S. Cherevko, Stability and Dissolution of Electrocatalysts:Building the Bridge between Model and "Real World"Systems, Curr. Opin. Electrochem., 2018, 8, 118–125.
105 K. J. J. Mayrhofer, D. Strmcnik, B. B. Blizanac,V. Stamenkovic, M. Arenz and N. M. Markovic,Measurement of Oxygen Reduction Activities Via theRotating Disc Electrode Method: From Pt Model Surfacesto Carbon-Supported High Surface Area Catalysts,Electrochim. Acta, 2008, 53, 3181–3188.
© 2021 The Author(s). Published by the Royal Society of Chemistry


![· SHIM SACD Dire Straits rLove Over Gold] (Private Investigations) ' Clear Cygnus SACD ' , IRIDIUM , IRIDIUM , IRIDIUM 11.5 AWG , , PFA 3455R IRIDIUM Clear Cygnus , 5 Trigon Exxpert](https://static.fdocuments.net/doc/165x107/60d04de1d6909b691a4f38e7/shim-sacd-dire-straits-rlove-over-gold-private-investigations-clear-cygnus.jpg)
