![Iron Metabolism in Humans: An Overviewcontaining iron stored as mineral ferric oxyhydroxyhydroxide phosphate [(FeOOH) 8 (FeO-OPO 3H 2)]. which can store upto 4500 iron atoms as hydrous](https://static.fdocuments.net/doc/165x107/5e67af063db03954e646975e/iron-metabolism-in-humans-an-overview-containing-iron-stored-as-mineral-ferric.jpg)
Incorporation of tetrahedral ferric iron in hydrous ringwoodite...Thomson et al. revision 1 08/2020...
34
Thomson et al. revision 1 08/2020 1 Incorporation of tetrahedral ferric iron in hydrous ringwoodite 1 Word Count (excluding abstract, figure captions and references): 5938 2 3 Andrew R. Thomson 1,2* , Ross O. Piltz 3 , Wilson A. Crichton 2 , Valerio Cerantola 3,4 , Isra S. Ezad 1,5 , David P. Dobson 1,6 , Ian G. Wood 1 and John P. Brodholt 1,7 4 1 Department of Earth Sciences, University College London, London, WC1E 6BT. 5 2 ESRF- The European Synchrotron, 38043 Grenoble, France 6 3 Bragg Institute, Australian Nuclear Science and Technology Organisation, Australia. 7 4 European X-ray free-electron laser, Hamburg, Germany 8 5 Department of Earth and Environmental Sciences, Macquarie University. Australia 9 6 Bayeriches Geoinstitut, University of Bayreuth, 95440 Bayreuth, Germany. 10 7 Centre for Earth Evolution and Dynamics, University of Oslo, N-0316 Oslo, Norway 11 *Corresponding Author ([email protected]) 12 ABSTRACT 13 Hydrous Fo 91 ringwoodite crystals were synthesised at 20 GPa and high-temperature conditions using 14 a multi-anvil press. Recovered crystals were analysed using electron microprobe analysis, Raman 15 spectroscopy, infrared spectroscopy, synchrotron Mössbauer spectroscopy, single-crystal X-ray 16 diffraction and single-crystal Laue neutron diffraction, to carefully characterise the chemistry and 17 crystallography of the samples. Analysis of the combined datasets provides evidence for the presence 18 of tetrahedrally coordinated ferric iron and multiple hydrogen incorporation mechanisms within these 19 blue-coloured iron-bearing ringwoodite crystals. Tetrahedral ferric iron is coupled with cation disorder 20 of silicon onto the octahedrally coordinated site. Cation disorder in mantle ringwoodite minerals may 21 be promoted in the presence of water, which could have implications for current models of seismic 22 velocities within the transition zone. Additionally, the presence of tetrahedrally coordinated ferric iron 23 may cause the blue colour of many ringwoodite, and other high-pressure, crystals. 24 This is the peer-reviewed, final accepted version for American Mineralogist, published by the Mineralogical Society of America. The published version is subject to change. Cite as Authors (Year) Title. American Mineralogist, in press. DOI: https://doi.org/10.2138/am-2021-7539. http://www.minsocam.org/ Always consult and cite the final, published document. See http:/www.minsocam.org or GeoscienceWorld
Transcript of Incorporation of tetrahedral ferric iron in hydrous ringwoodite...Thomson et al. revision 1 08/2020...
Thomson et al. revision 1 08/2020
1
Incorporation of tetrahedral ferric iron in hydrous ringwoodite 1
Word Count (excluding abstract, figure captions and references): 5938 2
3 Andrew R. Thomson1,2*, Ross O. Piltz3, Wilson A. Crichton2, Valerio Cerantola3,4, Isra S. Ezad1,5,
David P. Dobson1,6, Ian G. Wood1 and John P. Brodholt1,7 4
1Department of Earth Sciences, University College London, London, WC1E 6BT. 5
2ESRF- The European Synchrotron, 38043 Grenoble, France 6
3Bragg Institute, Australian Nuclear Science and Technology Organisation, Australia. 7
4European X-ray free-electron laser, Hamburg, Germany 8
5Department of Earth and Environmental Sciences, Macquarie University. Australia 9
6Bayeriches Geoinstitut, University of Bayreuth, 95440 Bayreuth, Germany. 10
7Centre for Earth Evolution and Dynamics, University of Oslo, N-0316 Oslo, Norway 11
*Corresponding Author ([email protected])12
ABSTRACT 13
Hydrous Fo91 ringwoodite crystals were synthesised at 20 GPa and high-temperature conditions using 14
a multi-anvil press. Recovered crystals were analysed using electron microprobe analysis, Raman 15
spectroscopy, infrared spectroscopy, synchrotron Mössbauer spectroscopy, single-crystal X-ray 16
diffraction and single-crystal Laue neutron diffraction, to carefully characterise the chemistry and 17
crystallography of the samples. Analysis of the combined datasets provides evidence for the presence 18
of tetrahedrally coordinated ferric iron and multiple hydrogen incorporation mechanisms within these 19
blue-coloured iron-bearing ringwoodite crystals. Tetrahedral ferric iron is coupled with cation disorder 20
of silicon onto the octahedrally coordinated site. Cation disorder in mantle ringwoodite minerals may 21
be promoted in the presence of water, which could have implications for current models of seismic 22
velocities within the transition zone. Additionally, the presence of tetrahedrally coordinated ferric iron 23
may cause the blue colour of many ringwoodite, and other high-pressure, crystals. 24
This is the peer-reviewed, final accepted version for American Mineralogist, published by the Mineralogical Society of America. The published version is subject to change. Cite as Authors (Year) Title. American Mineralogist, in press.
DOI: https://doi.org/10.2138/am-2021-7539. http://www.minsocam.org/
Always consult and cite the final, published document. See http:/www.minsocam.org or GeoscienceWorld

Thomson et al. revision 1 08/2020
2
Keywords: 25
Ringwoodite 26
Single-crystal diffraction 27
Mössbauer spectroscopy 28
29
This is the peer-reviewed, final accepted version for American Mineralogist, published by the Mineralogical Society of America. The published version is subject to change. Cite as Authors (Year) Title. American Mineralogist, in press.
DOI: https://doi.org/10.2138/am-2021-7539. http://www.minsocam.org/
Always consult and cite the final, published document. See http:/www.minsocam.org or GeoscienceWorld

Thomson et al. revision 1 08/2020
3
INTRODUCTION 30
The Earth’s transition zone (TZ), delineated by global seismic velocity discontinuities at ~ 410 and 31
660 km depth (Dziewonski and Anderson 1981), has the potential to be Earth’s largest volatile 32
reservoir with a maximum water storage capacity greater than the entirety of surface reservoirs 33
(Jacobsen 2005). This is possible because wadsleyite and ringwoodite, high-pressure polymorphs 34
forming after olivine, constitute over 60 wt.% of TZ phase assemblages, and are capable of 35
incorporating up to 3.3 wt.% and ~ 2 wt.% H2O respectively (33,000 and 20,000 wt. ppm)i associated 36
with point defects (e.g. Smyth 1987; Inoue et al. 1995; Ye et al. 2012; Fei and Katsura 2020). Whilst 37
experiments clearly demonstrate the potential for TZ water storage, whether or not Earth’s mantle is 38
actually hydrated, and exactly how this water is incorporated in TZ minerals, continue to be the 39
subjects of ongoing research. 40
There is significant variation between the range of estimates for the TZ’s water content. A natural 41
single crystal of ringwoodite, trapped as a mineral inclusion in a Brazilian diamond, was estimated, via 42
FTIR, to contain ~ 1.4 wt.% H2O (Pearson et al. 2014; Thomas et al. 2015). This observation suggests 43
that the TZ is at least locally hydrated. However, it is unclear how this isolated observation from a 44
microscopic diamond-hosted inclusion might relate to the bulk water content of the TZ more globally. 45
Seismological studies aiming to constrain the water content of the TZ to-date have remained 46
inconclusive, variously suggesting that both a dry (< 0.1 wt. % H2O) or wet (~ 1 wt.% H2O) TZ might 47
be consistent with observations based on seismic velocities as well as the depths and magnitudes of 48
discontinuities (van der Meijde 2003; Meier et al. 2009; Suetsugu et al. 2010; Houser 2016). 49
Interpretations of water contents using magnetotelluric (MT) observations are inconsistent, and 50
suggest the TZ contains between 0.001 and 1 wt.% H2O (Karato and Wu 1993; Huang et al. 2005; 51
i Whilst it is convention to discuss the “water content” of hydrous and nominally anhydrous Earth-forming minerals, there is not actually additional water molecules (H2O) stored in these phases. Instead hydrogen is incorporated in association with various cation defects in the “anhydrous” crystal structure, thus it would be more technically accurate to discuss the “proton” or “hydrogen” content of these samples.
This is the peer-reviewed, final accepted version for American Mineralogist, published by the Mineralogical Society of America. The published version is subject to change. Cite as Authors (Year) Title. American Mineralogist, in press.
DOI: https://doi.org/10.2138/am-2021-7539. http://www.minsocam.org/
Always consult and cite the final, published document. See http:/www.minsocam.org or GeoscienceWorld

Thomson et al. revision 1 08/2020
4
Yoshino et al. 2008; Munch et al. 2020). Alternatively, explanation of mantle viscosity profiles seem 52
to require the TZ to be close to water saturation, based on constraints from rheological experiments 53
(Fei et al. 2017). Irrespective of the true TZ water content, understanding the incorporation 54
mechanisms of hydrogen in crystals of wadsleyite and/or ringwoodite is important since, even at low 55
concentrations, defects are known to affect fundamental physical properties vital for understanding the 56
mechanics of mantle convection, e.g. viscosity, conductivity and elasticity (Thomas et al. 2012; 57
Hustoft et al. 2013; Schulze et al. 2018). 58
Compared to the defect chemistry of wadsleyite, which is relatively well understood and in which 59
protons almost exclusively substitute for Mg2+ vacancies (Smyth 1994), the behaviour of ringwoodite 60
is less well constrained (Kudoh et al. 2000; Smyth et al. 2003). Previous studies variously using ab 61
initio calculations, X-ray diffraction, spectroscopy (including at low temperatures) and 1H NMR have 62
concluded that a combination of multiple hydrogen incorporation mechanisms occur in ringwoodite 63
(Smyth et al. 2003; Blanchard et al. 2009; Panero et al. 2013; Grüninger et al. 2017). Suggested 64
substitutions include those where hydrogen is charge balanced by Mg2+ or Si4+ vacancies alone, but 65
also have included more complex mechanisms involving Si-Mg cation disorder. The extremely 66
disordered O-H stretching region observed in FTIR spectra of ringwoodite attests to the complexity of 67
water incorporation mechanisms in ringwoodite (Kudoh 2001; Smyth et al. 2003; Blanchard et al. 68
2009; Panero 2010), which is discussed far more extensively later in this paper. To date only two 69
experimental studies have attempted to directly investigate the hydrogen incorporation mechanisms in 70
iron-free ringwoodite, one using 1H solid state NMR (Grüninger et al. 2017) and the other time-of-71
flight single-crystal neutron diffraction (Purevjav et al. 2018). No published studies have directly 72
investigated the incorporation mechanism of water in iron-bearing ringwoodite samples; this study was 73
an attempt to do this. 74
We present analyses of Fo91 ringwoodite crystals using a variety of techniques, which were all 75
performed on crystals synthesised in a single high-pressure experiment. Employing Electron Probe 76
This is the peer-reviewed, final accepted version for American Mineralogist, published by the Mineralogical Society of America. The published version is subject to change. Cite as Authors (Year) Title. American Mineralogist, in press.
DOI: https://doi.org/10.2138/am-2021-7539. http://www.minsocam.org/
Always consult and cite the final, published document. See http:/www.minsocam.org or GeoscienceWorld

Thomson et al. revision 1 08/2020
5
Micro Analysis (EPMA), Raman, Infrared and Synchrotron Mössbauer Spectroscopy (SMS), the 77
chemistry, water content and ferric/ferrous iron ratio of the samples were determined prior to 78
diffraction data. Subsequently single-crystal X-ray diffraction and Neutron Laue diffraction data were 79
collected from the synthetic samples. This combination of analytical techniques provides new insights 80
into the crystallography of hydrous iron-bearing ringwoodite, which may be a major component of 81
mantle assemblages throughout the transition zone. 82
83
METHODS 84
Sample synthesis 85
The ringwoodite crystals investigated in the present study were synthesised in a single multi-anvil 86
experiment using a 5000 tonne multi-anvil press at the Bayerisches Geoinstitut. The starting material 87
consisted of synthetic brucite (Mg(OH)2), FeO and SiO2, to form a Fo90 olivine composition, and 88
contained 5 wt.% H2O. This material was packed in a 2.0 mm diameter Pt capsule, welded shut, and 89
loaded into an 18 mm Cr-doped MgO octahedron with a LaCrO3 heater. 54 mm WC carbide cubes 90
with 8 mm truncations were used to generate the sample pressure. Conditions of approximately 20 91
GPa and 1470 °C were maintained for 30 minutes before slowly cooling to 1150 °C over 6.5 hours at 92
which point the temperature was rapidly quenched and pressure slowly released. The recovered 93
capsule was opened and blue crystals (figure 1), ranging in size up to ~ 0.5 x 0.5 x 0.5 mm, were 94
recovered. It is noted that different individual crystals, but all from this single high-pressure 95
experiment, were analysed throughout this study. Small fractions of what was, presumably, quenched 96
melt were observed on the capsule walls. 97
Infrared, Raman and Mössbauer spectroscopy 98
Fourier transform infrared (FTIR) spectra were collected from doubly-polished single-crystal wafers of 99
40-60 µm thickness using a Thermo Scientific iN10 MX instrument operated in transmission mode at 100
This is the peer-reviewed, final accepted version for American Mineralogist, published by the Mineralogical Society of America. The published version is subject to change. Cite as Authors (Year) Title. American Mineralogist, in press.
DOI: https://doi.org/10.2138/am-2021-7539. http://www.minsocam.org/
Always consult and cite the final, published document. See http:/www.minsocam.org or GeoscienceWorld

Thomson et al. revision 1 08/2020
6
University College London. Incident beam size was controlled using motorised apertures, and varied 101
from 30 x 30 µm to 100 x 100 µm. Unpolarised spectra were collected between 675 and 7000 cm-1 102
from three randomly oriented crystals through a CaF2 substrate (figure 2b). Sample thicknesses were 103
measured using a reflected light microscope with calibrated z-motion, and are estimated to be accurate 104
to within ± 2 µm (uncertainty of ~ ± 3.5 – 4.8 %). Raman spectra, with 4 cm-1 resolution using a 532 105
nm excitation laser (figure 2a), were collected using a WiTek Raman system in the Department of 106
Earth Sciences, University College London, UK. 107
Energy-domain Mössbauer transmission spectroscopy was performed on a single ringwoodite crystal 108
(~ 100 x 100 x 100 µm in size) at the nuclear resonance beamline ID18 at European Synchrotron 109
Radiation Facility (ESRF) using the synchrotron Mössbauer source (SMS) (Potapkin et al. 2012). The 110
velocity scales of all Mössbauer spectra were calibrated relative to 25 μm-thick α-Fe foil, and all 111
spectra were fitted using the software package MossA (Prescher et al. 2012). 112
Electron probe micro analysis 113
The major element chemistry of several crystals from within the recovered products was determined 114
with wavelength-dispersive spectroscopy using the Field Emission Gun Jeol JXA8530F Hyperprobe 115
situated in the School of Earth Sciences at the University of Bristol. In preparation for these analyses, 116
approximately ten ringwoodite crystals from the synthesis products were randomly picked, mounted in 117
epoxy, and polished using a range of grits down to 0.25 µm diamond paste. Samples were carbon 118
coated alongside a range of natural silicate and metal standards, beam conditions used were 15 keV 119
and 10 nA, and the calibrations were verified by analysing a range of in-house secondary standards 120
prior to analysing samples. Suitable crystals (a total of eight) were analysed in multiple locations using 121
a 30 nm incident electron beam, resulting in a spatial resolution of ~ 2 microns at the sample surface. 122
Data were reduced using a Phi-Rho-Z scheme accounting for the ferric iron (rounded to the nearest 123
absolute 10 %) and water contents measured by SMS and difference from 100 % total respectively. 124
This is the peer-reviewed, final accepted version for American Mineralogist, published by the Mineralogical Society of America. The published version is subject to change. Cite as Authors (Year) Title. American Mineralogist, in press.
DOI: https://doi.org/10.2138/am-2021-7539. http://www.minsocam.org/
Always consult and cite the final, published document. See http:/www.minsocam.org or GeoscienceWorld

Thomson et al. revision 1 08/2020
7
Analyses with totals outside 98-100 wt.% (~ 99 – 101 wt.% after accounting for water incorporation as 125
quantified by FTIR) were rejected. 126
X-ray and Neutron diffraction 127
Single-crystal X-ray diffraction data were collected from a randomly selected crystal (~ 100 x 100 x 128
100 µm in size) using the standard setup on beamline ID15B of the ESRF. A monochromatic x-ray 129
beam (λ=0.410884 Å) of 10 x 10 µm size was used in conjunction with a MAR555 detector to collect 130
diffraction data in a ± 40° 𝜙 scan, integrating over 0.5° increments, Merlini & Hanfland (2013). 131
Integration of the reflection intensities and absorption corrections were performed using CrysAlisPro 132
(RED 171.32.29) software, prior to averaging and structure refinement using Jana2006, Petříček et al. 133
(2014). 134
Single-crystal Laue neutron diffraction of a large (~ 500 x 500 x 500 µm) crystal was performed on the 135
KOALA instrument on the reactor neutron source at the Australian Nuclear Science and Technology 136
Organisation (ANSTO), Australia. KOALA is a vertical-axis Laue diffractometer situated at the end of 137
a thermal-neutron guide. The incoming polychromatic neutron beam, which has a Maxwellian 138
distribution with wavelengths from ~ 0.5 to 4.5 Å, was reduced to 0.8 – 1.7 Å using beam choppers 139
(Piltz 2018a), and diffracted by the sample onto neutron sensitive image plate detectors that surround 140
the sample position in a cylindrical geometry extending ± 144° in the horizontal and ± 52° in the 141
vertical directions. Sample data were collected at 300 and 100 K (using the standard CF-2 cryostat on 142
KOALA), at a total of 33 sample positions. The total collection time for each dataset lasted ~ 3 days. 143
Reflection intensities were corrected for extinction and absorption using the LAUEG program 144
following the methodology of (Piltz 2018b). Subsequent structure refinement was performed using 145
Jana2006. 146
RESULTS 147
Spectroscopy and water content 148
This is the peer-reviewed, final accepted version for American Mineralogist, published by the Mineralogical Society of America. The published version is subject to change. Cite as Authors (Year) Title. American Mineralogist, in press.
DOI: https://doi.org/10.2138/am-2021-7539. http://www.minsocam.org/
Always consult and cite the final, published document. See http:/www.minsocam.org or GeoscienceWorld

Thomson et al. revision 1 08/2020
8
Raman spectra collected from the sample consist of a doublet at ~ 796 and 841 cm-1 and broad peak(s) 149
between 192 and 238 cm-1 (figure 2a), features which are very similar to previous ringwoodite spectra 150
(Kleppe et al., 2002). The collected spectra were otherwise unremarkable, with no significant water 151
related peaks observed between 3000-4000 cm-1 (figure 2b). 152
As observed for other OH-bearing ringwoodite samples, the FTIR spectra of samples in this study are 153
dominated by an extremely broad absorption band caused by O-H stretching modes extending from ~ 154
2000 – 4000 cm-1. This O-H band can be de-convolved into five, or more, symmetric peak 155
contributions centred at 2512, 2854, 3124, 3399 and 3653 cm-1 (figure 2c). This suggests the presence 156
of multiple defect-related hydrogen positions in the ringwoodite structure, as discussed later. Water 157
concentration in the sample was quantified by integrating the area beneath the background corrected 158
absorption spectrum from 2000 – 4000 cm-1 and applying the Beer-Lambert law, 159
𝜀 = (𝐴𝑖 × 1.8) (𝑑 × 𝜌 × 𝑐𝐻2𝑂)⁄ , where 𝜀 is the absorption coefficient (in L.mol−1cm−2), Ai = three 160
times the integrated absorption between 2000 and 4000 cm-1, d is sample thickness in cm, 𝜌 is density 161
(in g.cm-3) and 𝑐𝐻2𝑂 is the concentration of H2O in the sample (in wt.%). As absorption coefficients 162
vary significantly between, and within, individual literature studies (Libowitzky and Rossman 1997; 163
Thomas et al. 2015) we have assumed that a weighted average using a range of coefficients will 164
provide a more accurate estimate of water concentration in the samples. Assuming uncertainties in 165
sample thickness of ± 2 μm and reported uncertainties in 𝜀 (or ± 20% if not explicitly provided in the 166
relevant publication) we calculate the ringwoodite samples studied contain between 0.84(16) and 167
1.32(25) wt.% H2O (table 1, figure 3). The weighted average water concentration in the studied 168
samples, including the water content estimated using EPMA (see below), is 1.05 ± 0.08 wt % H2O. 169
Mössbauer spectroscopy 170
The SMS spectra (figure 4, table 2) from the ringwoodite sample is dominated by an asymmetric 171
quadrupole doublet (centre shift [CS] ~ 1.03 mm.s-1, quadrupole splitting [QS] ~ 2.75 mm.s-1), with a 172
smaller second component (CS ~ 0.09 mm.s-1, QS ~ 0.55 mm.s-1). As expected for the ringwoodite 173
This is the peer-reviewed, final accepted version for American Mineralogist, published by the Mineralogical Society of America. The published version is subject to change. Cite as Authors (Year) Title. American Mineralogist, in press.
DOI: https://doi.org/10.2138/am-2021-7539. http://www.minsocam.org/
Always consult and cite the final, published document. See http:/www.minsocam.org or GeoscienceWorld

Thomson et al. revision 1 08/2020
9
structure, and following previous interpretations, the dominant doublet (coloured green in figure 4) is 174
assigned to octahedral ferrous iron, i.e. Fe2+ substituting for magnesium in octahedral coordination. 175
The smaller second component (blue in figure 4), which is visually similar to previous observations 176
interpreted as a non-specific “charge-transfer” mechanism, is well resolved and consistent with the 177
presence of tetrahedral ferric iron, i.e. Fe3+ substituting for Si4+ cations (Burns and Solberg 1990). The 178
relative intensity of the two fitted doublet signals, assuming a constant recoil-free fraction, implies a 179
ferric iron concentration on the tetrahedral site of 17.7 ± 2.6 % of the ringwoodite crystal’s total iron 180
content (table 2). 181
Crystal chemistry 182
The chemical compositions of eight crystals from the experimental run products are reported in Table 183
3. This confirms the chemical homogeneity between crystals randomly chosen from the run products, 184
and provides a well-characterised composition for constraining diffraction refinements. The average 185
H2O concentration calculated by difference of EPMA totals from 100% is 1.06 ± 0.45 wt.%, which is 186
in good agreement with FTIR analyses (figure 2, table 3). Compositions for all analyses were reduced 187
to cation formulae by assuming the presence of four oxygens per formula unit (pfu, table 3). The 188
uncertainty in the mean sample composition is reported (to 1σ), and is less than ± 0.01 pfu for all 189
cations. 190
Following the results from SMS, initial cation site assignments were made assuming that the entire 191
Fe3+ content in the ringwoodite was present on the B site (within the general formula A2BO4-x.(H2O)x). 192
This suggests a general mineral formula, based on stoichiometric assignments and the assumption that 193
no tetrahedral vacancies are present, of (Mg1.728Fe2+0.146Si0.041[V]A
0.085)(Si0.967Fe3+0.033)O3.915.(H2O)0.085. 194
Single-crystal diffraction 195
X-ray diffraction data from ID15B were refined using Jana2006 software in the 𝐹𝑑3̅𝑚 space group, 196
with the octahedrally coordinated cations in the 16d sites at 0.5, 0.5, 0.5, the tetrahedrally coordinated 197
This is the peer-reviewed, final accepted version for American Mineralogist, published by the Mineralogical Society of America. The published version is subject to change. Cite as Authors (Year) Title. American Mineralogist, in press.
DOI: https://doi.org/10.2138/am-2021-7539. http://www.minsocam.org/
Always consult and cite the final, published document. See http:/www.minsocam.org or GeoscienceWorld

Thomson et al. revision 1 08/2020
10
cations in the 8a sites at 0.125, 0.125, 0.125 and the oxygen anions in the 32e sites at (x, x, x ; x~0.25). 198
The overall sample composition was constrained during refinement, using stoichiometric assignments 199
from EPMA as the starting point for refinements and keeping overall chemistry constrained 200
throughout. From this initial state, complete octahedral/tetrahedral order/disorder of Si, Mg and Fe 201
cations was permitted by refinement of site occupancies. It was observed that no Mg disorder was 202
predicted, so this refinement option was removed after initial investigation. Isotropic thermal 203
parameters were constrained to be equal for all atoms occupying each specific crystallographic site; 204
this appears to be common practice for such refinements (e.g. Smyth et al. 2003). The resulting x-ray 205
refinement has the formula (Mg1.728Fe2+0.133(1)Si0.123(2)[V]A
0.016)(Si0.885(2)Fe3+0.045(1)[V]B
0.07)O4 206
(Supplementary Information), implying an Fe3+/Fetot of 25% if all tetrahedral iron is assumed to be 207
ferric. It is noted that, if the starting point for refinement is changed such that all Mg/Fe cations are in 208
octahedral and all Si in tetrahedral coordination (i.e. 100% ordered cations), the final refined site 209
occupancies do not change significantly from those reported in the supplementary information, and the 210
same minimum is found. The identification of Si-Fe cation disorder, with ~ 12 % Si in octahedral 211
coordination, appears to be reliably constrained in spite of the similarity in scattering factors for Mg 212
and Si (Smyth et al. 2003). 213
Refinement of the single-crystal Laue neutron diffraction datasets, collected at 100 and 300 K, were 214
undertaken in a similar manner. This resulted in similar results from both neutron datasets; both 215
robustly identifying 8-12 % Si cation disordering onto the octahedral site prior to inclusion of H atoms 216
in refinements (Supplementary Information). We emphasise that the neutron refinements were 217
conducted completely separately from treatment of X-ray diffraction data, and the consistency of 218
cation disorder provides further support for the robustness of this observation. It is also notable that 219
both datasets refine to have between 13 ± 3.3 and 28 ± 2.8 % tetrahedrally coordinated iron, which is 220
comparable with the measured ferric iron content from SMS (17.7 ± 2.6 %). The ringwoodite formulae 221
from the two neutron diffraction refinements, on an anhydrous basis, are 222
(Mg1.728Fe2+0.156(6)Si0.085(14)[V]A
0.031)(Si0.923(14)Fe3+0.023(6)[V]B
0.054)O4 and 223
This is the peer-reviewed, final accepted version for American Mineralogist, published by the Mineralogical Society of America. The published version is subject to change. Cite as Authors (Year) Title. American Mineralogist, in press.
DOI: https://doi.org/10.2138/am-2021-7539. http://www.minsocam.org/
Always consult and cite the final, published document. See http:/www.minsocam.org or GeoscienceWorld

Thomson et al. revision 1 08/2020
11
(Mg1.728Fe2+0.129(5)Si0.085(12)[V]A
0.058)(Si0.922(12)Fe3+0.050(5)[V]B
0.028)O4 at 300 K and 100 K respectively. 224
In both cases it is implied that hydrogen is present on both tetrahedrally and octahedrally coordinated 225
sites, to charge balance the cation vacancies. 226
Following anhydrous refinement of the neutron datasets, identification of potential hydrogen positions 227
was attempted using Fourier difference maps. This process was conducted by examining difference 228
maps, looking for regions of negative neutron scattering intensity (red colours in Figure 5) that could 229
be caused by the presence of 1H atoms in the ringwoodite structure. Visual inspection of the data 230
revealed many such negative anomalies (Figure 5), and automated peak finding procedures in 231
Jana2006 were used to identify candidate positions. Subsequently, candidate sites were inspected to 232
ensure only physically reasonable positions were chosen. Since at lower temperatures there is reduced 233
thermal energy in the system, and therefore atoms should produce stronger Fourier anomalies, the 100 234
K dataset was examined first. 235
In this case two potential hydrogen positions were identified, one associated with each of the 236
tetrahedral and octahedral sites. Fourier difference maps demonstrate these red peaks of negative 237
scattering intensity associated with the octahedra near the face of the octahedral site, and, for the 238
tetrahedral sites, as negative intensity halfway along each tetrahedral edge (indicated with black arrows 239
in Figure 5a and b respectively). These observations are reminiscent of those described by Purevjav et 240
al. (2018), collected with ToF single crystal neutron diffraction from an iron-free ringwoodite crystal. 241
We further discuss the reliability of this type of observation in both this study and in Purevjav et al. 242
(2018) in a subsequent section, but if both the anomalies observed here are adopted as hydrogen 243
positions in the structure then a successful refinement of their occupancy and Uiso alongside other 244
refinement parameters can be achieved. This refinement implies both sites identified are partially 245
occupied, with approximately twice as many hydrogen atoms associated with tetrahedral vacancies 246
than are associated with vacant octahedral sites. We note that the uncertainties in site occupancies are 247
particularly large for the octahedral site (± 107% of the refined total occupancy), but the hydrogen 248
This is the peer-reviewed, final accepted version for American Mineralogist, published by the Mineralogical Society of America. The published version is subject to change. Cite as Authors (Year) Title. American Mineralogist, in press.
DOI: https://doi.org/10.2138/am-2021-7539. http://www.minsocam.org/
Always consult and cite the final, published document. See http:/www.minsocam.org or GeoscienceWorld
Thomson et al. revision 1 08/2020
12
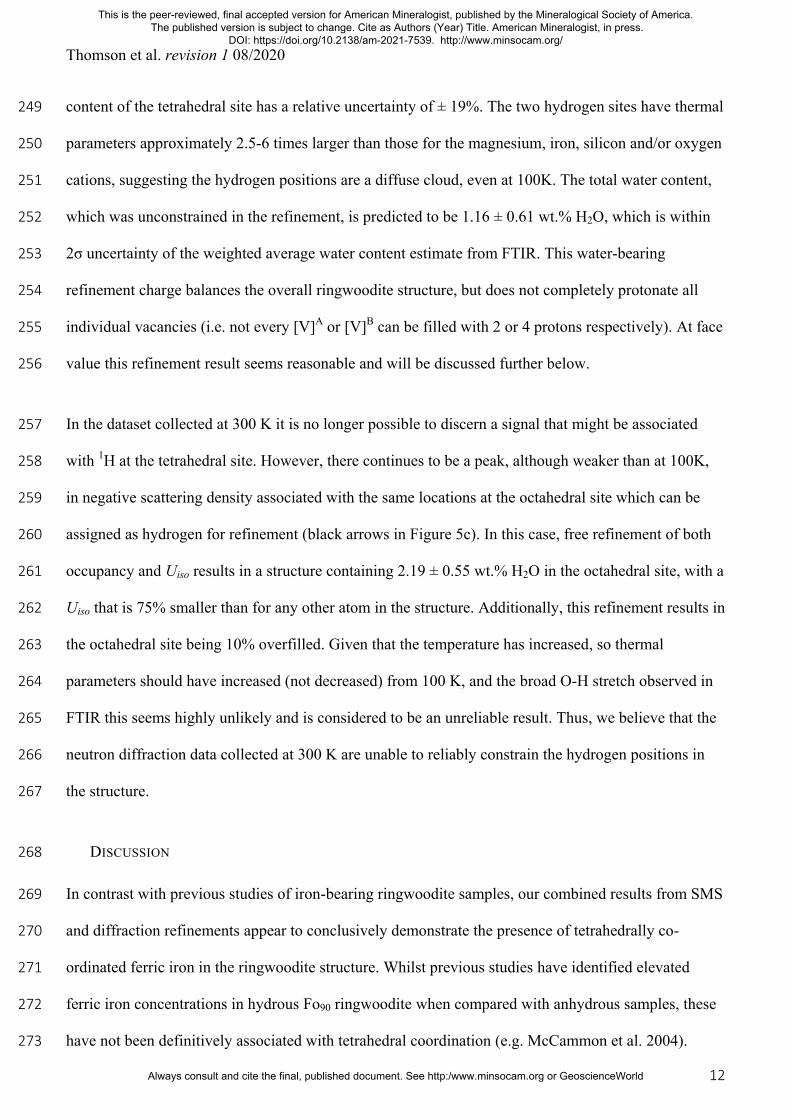
content of the tetrahedral site has a relative uncertainty of ± 19%. The two hydrogen sites have thermal 249
parameters approximately 2.5-6 times larger than those for the magnesium, iron, silicon and/or oxygen 250
cations, suggesting the hydrogen positions are a diffuse cloud, even at 100K. The total water content, 251
which was unconstrained in the refinement, is predicted to be 1.16 ± 0.61 wt.% H2O, which is within 252
2σ uncertainty of the weighted average water content estimate from FTIR. This water-bearing 253
refinement charge balances the overall ringwoodite structure, but does not completely protonate all 254
individual vacancies (i.e. not every [V]A or [V]B can be filled with 2 or 4 protons respectively). At face 255
value this refinement result seems reasonable and will be discussed further below. 256
In the dataset collected at 300 K it is no longer possible to discern a signal that might be associated 257
with 1H at the tetrahedral site. However, there continues to be a peak, although weaker than at 100K, 258
in negative scattering density associated with the same locations at the octahedral site which can be 259
assigned as hydrogen for refinement (black arrows in Figure 5c). In this case, free refinement of both 260
occupancy and Uiso results in a structure containing 2.19 ± 0.55 wt.% H2O in the octahedral site, with a 261
Uiso that is 75% smaller than for any other atom in the structure. Additionally, this refinement results in 262
the octahedral site being 10% overfilled. Given that the temperature has increased, so thermal 263
parameters should have increased (not decreased) from 100 K, and the broad O-H stretch observed in 264
FTIR this seems highly unlikely and is considered to be an unreliable result. Thus, we believe that the 265
neutron diffraction data collected at 300 K are unable to reliably constrain the hydrogen positions in 266
the structure. 267
DISCUSSION 268
In contrast with previous studies of iron-bearing ringwoodite samples, our combined results from SMS 269
and diffraction refinements appear to conclusively demonstrate the presence of tetrahedrally co-270
ordinated ferric iron in the ringwoodite structure. Whilst previous studies have identified elevated 271
ferric iron concentrations in hydrous Fo90 ringwoodite when compared with anhydrous samples, these 272
have not been definitively associated with tetrahedral coordination (e.g. McCammon et al. 2004). 273
This is the peer-reviewed, final accepted version for American Mineralogist, published by the Mineralogical Society of America. The published version is subject to change. Cite as Authors (Year) Title. American Mineralogist, in press.
DOI: https://doi.org/10.2138/am-2021-7539. http://www.minsocam.org/
Always consult and cite the final, published document. See http:/www.minsocam.org or GeoscienceWorld

Thomson et al. revision 1 08/2020
13
Instead, Mössbauer spectroscopy in these studies had assigned the secondary “ferric iron” component 274
as explained by a rapid Fe2+-Fe3+ charge transfer mechanism believed to be possible only if the iron 275
was completely in octahedral coordination (e.g. McCammon et al. 2004). Mössbauer spectra presented 276
by Mrosko et al. (2013) did suggest that, after annealing a sample of Fo90 ringwoodite in air and 277
observing a colour change in the sample, there was some evidence for a minor component (< 3%) of 278
tetrahedral ferric iron that was consistent with their FTIR spectroscopy. The presence of tetrahedral 279
ferric iron in samples from this study also necessarily demonstrates the presence of cation disorder in 280
the ringwoodite structure as, given the chemistry of the samples analysed by EPMA, it is an inevitable 281
consequence that the tetrahedral ferric iron must displace an equivalent portion of Si atoms onto the 282
octahedral sites. Disorder of silicon onto the octahedral site has been suggested in previous studies via 283
refinement of X-ray data alone, with studies reporting up to 4% Si-Mg exchange between the 284
tetrahedral and octahedral sites (Kudoh et al. 2000). This type of exchange has also often been cited as 285
a potential hydrogen incorporation mechanism (see below). However, neither the confirmation of 286
cation disorder with multiple techniques analysing the same samples nor the involvement of ferric iron 287
in this exchange reaction have previously been documented. Independent X-ray and 2 separate neutron 288
diffraction refinements, as well as SMS results in this study all independently suggest that 13 – 28 % 289
of the iron in these samples is ferric and in tetrahedral coordination. It is unclear whether or not this is 290
a unique result of the synthesis method, but since the crystals were grown with excess water in a 291
welded platinum capsule, as in previous studies, this seems unlikely. More likely, perhaps, is the 292
superiority of synchrotron Mössbauer spectroscopy over a lab approach when analysing small samples 293
synthesised at high-pressure, and the increased capability of neutron diffraction for discrimination of 294
iron, magnesium and silicon compared to X-ray scattering techniques. 295
The neutron diffraction refinements, presented above, do not unambiguously identify the hydrogen 296
incorporation mechanism in these samples. Thus, in addition to the presented refinements in Fd3̅m 297
symmetry, neutron data were also refined assuming F4̅3m, F4132 or Fd3̅ space groups in case the 298
presence of hydrogen atoms in ringwoodite, which are more “visible” to neutrons, alters the crystal 299
This is the peer-reviewed, final accepted version for American Mineralogist, published by the Mineralogical Society of America. The published version is subject to change. Cite as Authors (Year) Title. American Mineralogist, in press.
DOI: https://doi.org/10.2138/am-2021-7539. http://www.minsocam.org/
Always consult and cite the final, published document. See http:/www.minsocam.org or GeoscienceWorld

Thomson et al. revision 1 08/2020
14
symmetry. Ultimately, however, none of these additional refinements positively identified hydrogen 300
sites. 301
The difficulty in identifying hydrogen positions using neutron diffraction might be explained by 302
considering whether or not a sufficient concentration of 1H is present that features observable in a 303
Fourier map are to be expected. Assuming that oxygen and hydrogen atoms occupy the same volume, 304
equivalent to equal Uiso’s, we use the relative coherent neutron scattering lengths of 16O and 1H and the 305
observed Fourier intensity of 16O atoms to estimate the peak Fourier scattering density expected from 306
1H atoms. Based on the observed peak scattering density from oxygen (~ 26 fm/Å3), hydrogen atoms 307
completely filling the oxygen sites would be expected to have peak scattering densities of ~ -16.7 308
fm/Å3 (ratio of 1H/16O coherent scattering lengths * observed 16O peak; (-3.74/5.80)*26). If we assume 309
only one hydrogen incorporation mechanism is present, e.g. all 0.17 H atoms pfu (as determined by 310
EPMA) occupy a single site, then, depending on whether the occupied site is 48-fold, 96-fold or 192-311
fold (which are the most likely in this study and Purevjav et al. 2014; 2018), the expected peak 312
scattering density from 1H is then -0.47, -0.23 or -0.12 fm/Å3. In reality it is likely that hydrogen will 313
be more diffusely distributed than oxygen, having a larger Uiso, and will additionally be partitioned 314
between multiple sites in the crystal structure. Thus, it is expected that the peak scattering from 1H 315
atoms in difference Fourier maps will be at least 2-4 (and possibly as much as 10) times smaller than 316
these values. Quick inspection of difference Fourier maps from our samples (fig. 5) reveals that there 317
are many features of much larger positive and negative scattering densities than these predicted 318
theoretical values, and that true signals from hydrogen atoms could easily be hidden within the green 319
colours on figure 5. This makes it virtually impossible to argue that visual identification of all 1H 320
atoms using Fourier maps is robust. Successful hydrogen identification is only convincing if proton 321
positions are assigned and successfully refined for occupancy and thermal parameters with reasonable 322
results. An example of this is seen in the case of the tetrahedrally coordinated hydrogen position in the 323
100 K neutron dataset in this study. However, even in this case, the observed scattering density in the 324
Fourier map is approximately 10 times larger than the expected anomaly, casting doubt on the fidelity 325
This is the peer-reviewed, final accepted version for American Mineralogist, published by the Mineralogical Society of America. The published version is subject to change. Cite as Authors (Year) Title. American Mineralogist, in press.
DOI: https://doi.org/10.2138/am-2021-7539. http://www.minsocam.org/
Always consult and cite the final, published document. See http:/www.minsocam.org or GeoscienceWorld
Thomson et al. revision 1 08/2020
15
of the refinement. Looking at the proposed octahedral hydrogen sites in this, and previous, studies 326
(Purevjav et al. 2018), we note observed negative scattering densities in Fourier maps are at least 20 327
times larger than expected, whilst nearby positive scattering peaks of equal, but opposite, magnitude 328
were unexplained. We conclude that the successful identification of H atoms, especially in general 329
crystallographic sites within the ringwoodite structure, is extremely challenging, and we are cautious 330
to avoid similar interpretations here based on neutron data alone. 331
FTIR and NMR spectroscopy as well as first-principles calculations have all been used to provide 332
additional constraints on hydrogen locations in the ringwoodite structure. We look to previously 333
published studies to provide a framework in which to interpret our FTIR observations, which have 334
frequently identified that hydrogen is likely incorporated in a mixture of protonated cationic defects 335
associated with tetrahedral and octahedral vacancies, as well as via cation disorder mechanisms. On 336
the basis of calculations Blanchard et al. (2009) concluded that simple vacancy defects [VMg(OH)2]x 337
and [VSi(OH)4]x most likely explain the lowest (~ 2500-2600 cm-1) and highest (3500-3750 cm-1) 338
frequency O-H stretches observed by FTIR respectively. However, a plethora of cation-disorder 339
related substitutions were suggested, including [MgSi(OH)2]x and [VMg(OH)2MgSiSiMg]x, and several 340
mechanisms may contribute to the main broad peak observed in γ-Mg2SiO4 centred around ~ 3150 341
cm−1. 342
Whilst other studies using calculations (Panero 2010) and FTIR spectroscopy (Bolfan-Casanova et al. 343
2000) alone have also concluded that a mixture of vacancy associated hydrogen incorporation 344
mechanisms likely occur in ringwoodite, neither of these studies assigned FTIR bands to specific 345
defects. Instead, studies using coupled observations from multiple techniques, e.g. FTIR and XRD, 346
FTIR and calculations, or the pressure/temperature evolution of FTIR spectra, have more frequently 347
attempted to assign specific spectroscopic observations. Smyth et al. (2003) and Chamorro Perez et al. 348
(2006) interpreted the main O-H stretch around 3150 cm-1 as the expression of hydrogen along the 349
edge of vacant tetrahedral sites. In contrast, Panero et al. (2013), Kudoh et al. (2000), Ross et al. 350
This is the peer-reviewed, final accepted version for American Mineralogist, published by the Mineralogical Society of America. The published version is subject to change. Cite as Authors (Year) Title. American Mineralogist, in press.
DOI: https://doi.org/10.2138/am-2021-7539. http://www.minsocam.org/
Always consult and cite the final, published document. See http:/www.minsocam.org or GeoscienceWorld
Thomson et al. revision 1 08/2020
16
(2003) and Mrosko et al. (2013) have all favoured a model where the broad 3150 cm-1 stretch is 351
associated with octahedral vacancies [VMg(OH)2]x. The weaker FTIR stretches at higher frequencies 352
between 3500-3700 cm-1, where assigned, are most commonly associated with the tetrahedral vacancy 353
substitution (Mrosko et al. 2013). Studies investigating the temperature and/or pressure dependence of 354
FTIR spectra clearly identify that multiple H-incorporation mechanisms are required to explain peaks 355
following different pressure/temperature evolution (Chamorro Pérez et al. 2006; Mrosko et al. 2013; 356
Panero et al. 2013; Yang et al. 2014). Interpretation of NMR spectra collected from a hydrous iron-free 357
ringwoodite sample (Grüninger et al. 2017) also requires multiple H-sites in ringwoodite. Grüninger et 358
al. (2017) concluded that the substitution into octahedral vacancies was the most dominant hydrogen 359
incorporation mechanism, presumably explaining the large 3150 cm-1 stretch, but also identified that 360
up to ~ 50% of the hydrogen was incorporated in tetrahedral and cation disorder related defects. With 361
one exception, Mrosko et al. (2013), none of these studies have interpreted the FTIR spectra of iron-362
bearing ringwoodite samples specifically in terms of iron-bearing defects. 363
Although FTIR spectra from iron-free and iron-bearing hydrous ringwoodite samples are broadly 364
similar, they possess subtle, yet important, differences (e.g. Smyth et al. 2003). FTIR spectra of iron-365
free ringwoodite consist of a dominant peak centred around 3100 cm-1 with a full-width-at-half-366
maximum height (fwhm) of ~ 400 cm-1. Additional small peaks occur around ~ 2500-2600 cm-1 and 367
3700 cm-1 in samples with high water content. FTIR spectra of Fo90 ringwoodite, like that in this study 368
(fig 2b), consist a much broader central peak (~ 3150 cm-1, fwhm > 600 cm-1) with a distinctive high 369
frequency shoulder (~ 3400 cm-1); this can readily be deconvolved into multiple components. 370
Additionally, the contribution at the highest frequencies (~ 3650 cm-1) is much more significant, whilst 371
the peak at ~ 2500-2600 cm-1 appears visibly similar to iron-free samples. Thus, it seems logical that 372
the additional FTIR contribution at ~ 3400 cm-1 is associated with a new defect mechanism only 373
occurring in iron-bearing samples. The relative increase in intensity and downward frequency shift of 374
the peak at ~ 3650 cm-1 presumably also has some contribution from the presence of iron in 375
ringwoodite’s structure. Using optical and FTIR spectroscopy Mrosko et al. (2013) identified that 376
This is the peer-reviewed, final accepted version for American Mineralogist, published by the Mineralogical Society of America. The published version is subject to change. Cite as Authors (Year) Title. American Mineralogist, in press.
DOI: https://doi.org/10.2138/am-2021-7539. http://www.minsocam.org/
Always consult and cite the final, published document. See http:/www.minsocam.org or GeoscienceWorld

Thomson et al. revision 1 08/2020
17
heating of a Fo90 ringwoodite crystal above 773 K, at ambient-pressure, caused irreversible water loss 377
and conversion of ferrous to ferric iron. This process caused the area of the broad 3150 cm-1 stretch to 378
decrease (in their study), presumably explained by a drop in [VMg(OH)2]x concentration, whilst the area 379
under peaks at higher frequencies (~ 3650 cm-1 and 3450 cm-1) increased. These are the two peaks we 380
suggest are likely to be associated with ferric iron. Given that the peak, or shoulder, at 3400-3450 cm-1 381
is only observed in iron-bearing samples and is known to increase with increasing Fe3+, we propose 382
that this component arises directly from hydrogen incorporation associated with tetrahedrally co-383
ordinated ferric iron. The second peak at 3650 cm-1, as it is present - although at slightly higher 384
frequencies (~ 3700-3750 cm-1) - in Fo100 ringwoodite is perhaps related to a change in O-H bond 385
length associated with the presence of iron, and following the interpretation of Mrosko et al. (2013) we 386
suggest this is due to the expanded iron-bearing octahedra shortening O-H bond lengths in adjacent 387
tetrahedra. 388
Based on the discussion above, we believe that there is evidence for at least four different hydrogen 389
substitution mechanisms in the samples investigated in this study. This interpretation is consistent with 390
the results from 1H NMR (Grüninger et al. 2017). The four sites, with their assumed associated FTIR 391
shifts, are (i) hydrogen sites associated with octahedral vacancies (3125 cm-1), (ii) hydrogen associated 392
with tetrahedral vacancies (~ 3650 cm-1), (iii) hydrogen associated with ferric iron disorder onto the 393
tetrahedral site (~ 3400 cm-1) and presumably (iv) hydrogen associated with disordered silicon on the 394
octahedral site (2510/2850 cm-1). We assume that mechanisms (i) and/or (iv) and (ii) and/or (iii) are 395
associated with the octahedral and tetrahedral hydrogen sites observed in the 100 K neutron diffraction 396
refinement respectively. We also note that the presence of multiple sites may explain why the 397
identification of hydrogen from refinement of single-crystal neutron diffraction patterns is particularly 398
problematic. 399
IMPLICATIONS 400
This is the peer-reviewed, final accepted version for American Mineralogist, published by the Mineralogical Society of America. The published version is subject to change. Cite as Authors (Year) Title. American Mineralogist, in press.
DOI: https://doi.org/10.2138/am-2021-7539. http://www.minsocam.org/
Always consult and cite the final, published document. See http:/www.minsocam.org or GeoscienceWorld

Thomson et al. revision 1 08/2020
18
Assuming the Earth’s interior composition is approximately pyrolitic, we expect ringwoodite to be the 401
dominant chemical component throughout the lower portion of the transition zone (e.g. Ringwood 402
1968). There is direct evidence, in the form of an exhumed diamond-hosted ringwoodite inclusion 403
found in a Brazilian diamond, that at least one natural ringwoodite sample is hydrous. If the samples 404
examined throughout this study are in any way representative of the mantle ringwoodite component 405
then there are a few interesting consequences. In addition to the possibility that the incorporation of 406
water in ringwoodite significantly lowers its seismic velocities (Jacobsen 2006; Schulze et al. 2018), 407
and therefore allowing mantle water contents to potentially be “mapped” using geophysical 408
techniques, the observation in this study that water could promote primary cation disorder in the 409
ringwoodite structure may amplify these effects. Panero et al. (2008), using first principles 410
calculations, demonstrated that the presence of cation disorder in the ringwoodite structure may cause 411
anomalous, and otherwise unpredicted, softening of the elastic moduli. Panero et al.’s (2008) 412
calculations predict that ringwoodite’s acoustic velocities (vp and vs) will be between 1 and 2% slower 413
at transition zone conditions as a consequence of ~ 4% Si disorder onto the octahedral site when 414
compared with a fully ordered structure. Given we observe ~ 8-12% disorder in ringwoodite, due to a 415
Si-Fe3+ substitution that is seemingly promoted in the presence of water, it may be expected that 416
ringwoodite’s velocities would be reduced by 2-6% more than currently expected in regions of the 417
mantle that are hydrated. Alternatively, observed reductions in transition zone velocities might be 418
explained by smaller concentrations of H2O than currently believed to be present, and mantle water 419
content may be overestimated if the contribution of Si disorder is ignored. 420
The samples analysed in the present study have a deep royal blue colouration, typical of iron-bearing 421
hydrous ringwoodites. The origin of blue colouration in ringwoodite and other high-pressure 422
ferromagnesian silicates is currently uncertain, having been attributed to light scattering (e.g., 423
Lingemann and Stöffler, 1998; Nagy et al. 2011), or intervalence charge transfer (e.g., Taran et al. 424
2009). Iron-bearing magnesian ringwoodite can vary in colour from colourless through pale green to 425
deep blue/purple. Ringwoodites studied using optical and near-infrared spectroscopy possess 426
This is the peer-reviewed, final accepted version for American Mineralogist, published by the Mineralogical Society of America. The published version is subject to change. Cite as Authors (Year) Title. American Mineralogist, in press.
DOI: https://doi.org/10.2138/am-2021-7539. http://www.minsocam.org/
Always consult and cite the final, published document. See http:/www.minsocam.org or GeoscienceWorld

Thomson et al. revision 1 08/2020
19
absorption bands in the visible spectrum that have been attributed to electronic transitions in 427
octahedrally-coordinated Fe2+ (8000-12000 cm-1) and/or Fe2+-Fe3+ intervalence charge transfers that 428
are centred on green wavelengths around 16000-18000 cm-1 (Keppler and Smyth, 2005; Taran et al. 429
2009). It appears that previous samples tend towards a pale green, rather than blue, colour when 430
synthesised under more reducing conditions (Taran et al. 2009). In this study we also observed, at least 431
in one case, that a sample we synthesised under water-free conditions (confirmed by IR spectroscopy) 432
was also pale green. This anhydrous sample, which also contained excess ferropericlase, did not 433
appear to contain tetrahedrally-coordinated ferric iron (Supplementary figure 1). This implies that the 434
blue colouration in ringwoodite and, by extension, other high-pressure hydrous iron-magnesium 435
silicates which sometimes show similar royal blue colouration, including Phase E (Crichton et al. 436
1999, Crichton and Ross 2000) and Phase A (personal comm. D. Dobson), could be related to the 437
presence of a combined ferric iron-proton defect. As crystal-field electronic transitions are spin-438
disallowed for Fe3+, the blue colouration could instead be related to intervalence charge transfers, 439
supporting the assignment of absorption bands by Taran et al. (2009). While strong blue colouration is 440
not a common feature of Fe2+-Fe3+ charge transfer in low-pressure silicates, it is clearly the cause of 441
blue in vivianite, (Fe3(PO4)2.8H2O), as discussed in Burns (1981). A question remains regarding why 442
the charge transfer absorption band moves to higher frequencies in ringwoodite compared to low-443
pressure silicates where it typically occurs around 12000-15000 cm-1. The presence of Fe3+ in 444
tetrahedral coordination, combined with its absence from octahedral sites in the present study, would 445
make ringwoodite a class I mixed-valence compound where intervalence-charge transfer, between 446
structurally dissimilar Fe2+ and Fe3+ sites, would ordinarily occur beyond the visible band. It is 447
possible that proton delocalisation enhances additional charge transfer, by providing fluctuations in 448
local charge environments. Whilst we believe the observations in the present study suggest that the 449
presence of a tetrahedrally coordinated Fe3+-H+ defect in ringwoodite might be related to its blue 450
colouration, further work is required to verify this. 451
ACKNOWLEDGEMENTS 452
This is the peer-reviewed, final accepted version for American Mineralogist, published by the Mineralogical Society of America. The published version is subject to change. Cite as Authors (Year) Title. American Mineralogist, in press.
DOI: https://doi.org/10.2138/am-2021-7539. http://www.minsocam.org/
Always consult and cite the final, published document. See http:/www.minsocam.org or GeoscienceWorld
Thomson et al. revision 1 08/2020
20
We acknowledge the support of UKRI grants NE/P017657/1, NE/M00046X/1 and ST/K000934/1 453
awarded to Thomson, Brodholt and Wood respectively. We thank Dr Benjamin Buse from the 454
University of Bristol for assisting with EPMA analyses and data reduction. The ESRF is thanked for 455
the provision of in-house research time at ID15B and to Dr Michael Hanfland who provided the 456
facility. 457
REFERENCES 458
Blanchard, M., Balan, E., and Wright, K. (2009) Incorporation of water in iron-free ringwoodite: A 459
first-principles study. American Mineralogist, 94, 83–89. 460
Bolfan-Casanova, N., Keppler, H., Science, D.R.E.A.P., 2000 (2000) Water partitioning between 461
nominally anhydrous minerals in the MgO–SiO2–H2O system up to 24 GPa: implications for the 462
distribution of water in the Earth's mantle. Earth and Planetary Science Letters, 182, 209–221. 463
Bolfan-Casanova, N., Schiavi, F., Novella, D., Bureau, H., Raepsaet, C., Khodja, H., and Demouchy, 464
S. (2018) Examination of water quantification and incorporation in transition zone minerals: 465
Wadsleyite, ringwoodite and phase D using ERDA (elastic recoil detection analysis). Frontiers in 466
Earth Science, 6, 354. 467
Burns, R.G., and Solberg, T.C. (1990) 57Fe-Bearing Oxide, Silicate, and Aluminosilicate Minerals: 468
Crystal Structure Trends in Mossbauer Spectra. In L.M. Coyne, S. W. S. McKeever and D. F. 469
Blake (eds) Spectroscopic Characterization of Minerals and Their Surfaces. ACS Symposium 470
Series, Vol 415. American Chemical Society. 471
Burns, R.G. (1981) Intervalence transitions in mixed valence minerals of iron and titanium. Annual 472
Review of Earth and Planetary Sciences, 9, 345–383. 473
This is the peer-reviewed, final accepted version for American Mineralogist, published by the Mineralogical Society of America. The published version is subject to change. Cite as Authors (Year) Title. American Mineralogist, in press.
DOI: https://doi.org/10.2138/am-2021-7539. http://www.minsocam.org/
Always consult and cite the final, published document. See http:/www.minsocam.org or GeoscienceWorld

Thomson et al. revision 1 08/2020
21
Chamorro Pérez, E.M., Daniel, I., Chervin, J.C., Dumas, P., Bass, J.D., and Inoue, T. (2006) 474
Synchrotron IR study of hydrous ringwoodite (γ-Mg2SiO4) up to 30 GPa. Physics and Chemistry 475
of Minerals, 33, 502–510. 476
Crichton, W.A. and Ross, N.L. (2000) Equation of state of phase E. Mineralogical Magazine, 64, 561-477
567. 478
Crichton, W.A., Ross, N.L., and Gasparik, T. (1999) Equations of state of magnesium silicates 479
anhydrous B and superhydrous B. Physics and Chemistry of Minerals, 26, 570–575. 480
Dziewonski, A.M., and Anderson, D.L. (1981) Preliminary reference Earth model. Physics of the 481
Earth and Planetary Interiors, 25, 297–356. 482
Fei, H., and Katsura, T. (2020) High water solubility of ringwoodite at mantle transition zone 483
temperature. Earth and Planetary Science Letters, 531, 115987. 484
Fei, H., Yamazaki, D., Sakurai, M., Miyajima, N., Ohfuji, H., Katsura, T., and Yamamoto, T. (2017) A 485
nearly water-saturated mantle transition zone inferred from mineral viscosity. Science Advances, 486
3, e1603024. 487
Grüninger, H., Armstrong, K., Greim, D., Boffa Ballaran, T., Frost, D.J., and Senker, J. (2017) Hidden 488
Oceans? Unraveling the Structure of Hydrous Defects in the Earth's Deep Interior. Journal of the 489
American Chemical Society, 139, 10499–10505. 490
Houser, C. (2016) Global seismic data reveal little water in the mantle transition zone. Earth and 491
Planetary Science Letters, 448, 94–101. 492
Huang, X., Xu, Y., and Karato, S.-I. (2005) Water content in the transition zone from electrical 493
conductivity of wadsleyite and ringwoodite. Nature, 434, 746–749. 494
This is the peer-reviewed, final accepted version for American Mineralogist, published by the Mineralogical Society of America. The published version is subject to change. Cite as Authors (Year) Title. American Mineralogist, in press.
DOI: https://doi.org/10.2138/am-2021-7539. http://www.minsocam.org/
Always consult and cite the final, published document. See http:/www.minsocam.org or GeoscienceWorld

Thomson et al. revision 1 08/2020
22
Hustoft, J., Amulele, G., Ando, J.I., Otsuka, K., Du, Z., Jing, Z., and Karato, S.-I. (2013) Plastic 495
deformation experiments to high strain on mantle transition zone minerals wadsleyite and 496
ringwoodite in the rotational Drickamer apparatus. Earth and Planetary Science Letters, 361, 7–15. 497
Inoue, T., Yurimoto, H., and Kudoh, Y. (1995) Hydrous modified spinel, Mg1.75SiH0.5O4: a new water 498
reservoir in the mantle transition region. Geophysical Research Letters, 22, 117–120. 499
Jacobsen, S.D. (2005) A systematic study of OH in hydrous wadsleyite from polarized FTIR 500
spectroscopy and single-crystal X-ray diffraction: Oxygen sites for hydrogen storage in Earth's 501
interior. American Mineralogist, 90, 61–70. 502
Jacobsen, S.D. (2006) Effect of Water on the Equation of State of Nominally Anhydrous Minerals. 503
Reviews in Mineralogy and Geochemistry, 62, 321–342. 504
Karato, S.-I., and Wu, P. (1993) Rheology of the upper mantle: A synthesis. Science, 260, 771–778. 505
Keppler, H., and Smyth, J.R. (2005) Optical and near infrared spectra of ringwoodite to 21.5 GPa: 506
Implications for radiative heat transport in the mantle. American Mineralogist, 90, 1209–1212. 507
Kleppe, A.K. (2002) On protons, iron and the high-pressure behavior of ringwoodite. Geophysical 508
Research Letters, 29, 2021. 509
Kudoh, Y. (2001) Structural relation of hydrous ringwoodite to hydrous wadsleyite. Physics and 510
Chemistry of Minerals, 28, 523–530. 511
Kudoh, Y., Kuribayashi, T., Mizobata, H., and Ohtani, E. (2000) Structure and cation disorder of 512
hydrous ringwoodite, γ-Mg1.89Si0.98H0.30O4. Physics and Chemistry of Minerals, 27, 474–479. 513
Libowitzky, E., and Rossman, G.R. (1997) An IR absorption calibration for water in minerals. 514
American Mineralogist, 82, 1111–1115. 515
This is the peer-reviewed, final accepted version for American Mineralogist, published by the Mineralogical Society of America. The published version is subject to change. Cite as Authors (Year) Title. American Mineralogist, in press.
DOI: https://doi.org/10.2138/am-2021-7539. http://www.minsocam.org/
Always consult and cite the final, published document. See http:/www.minsocam.org or GeoscienceWorld

Thomson et al. revision 1 08/2020
23
Lingemann, C.M., and Stöffler, D. (1998) New evidence for the colouration and formation of 516
ringwoodite in severely shocked chondrites. LPI, 1308. 517
McCammon, C.A., Frost, D.J., Smyth, J.R., Laustsen, H.M.S., Kawamoto, T., Ross, N.L., and van 518
Aken, P.A. (2004) Oxidation state of iron in hydrous mantle phases: Implications for subduction 519
and mantle oxygen fugacity. Physics of the Earth and Planetary Interiors, 143, 157–169. 520
Meier, U., Trampert, J., and Curtis, A. (2009) Global variations of temperature and water content in 521
the mantle transition zone from higher mode surface waves. Earth and Planetary Science Letters, 522
282, 91–101. 523
Mrosko, M., Lenz, S., McCammon, C.A., Taran, M., Wirth, R., and Koch-Müller, M. (2013) 524
Hydrogen incorporation and the oxidation state of iron in ringwoodite: A spectroscopic study. 525
American Mineralogist, 98, 629–636. 526
Munch, F.D., Grayver, A.V., Guzavina, M., Kuvshinov, A.V., and Khan, A. (2020) Joint Inversion of 527
Daily and Long‐Period Geomagnetic Transfer Functions Reveals Lateral Variations in Mantle 528
Water Content. Geophysical Research Letters, 47, 185. 529
Nagy, S., Józsa, S., Gyollai, I., Bérczi, S., Bendő, Z., and Stehlik, H. (2011) Ringwoodite 530
microstructures in L-chondrite NWA 5011: implications for transformation mechanism and source 531
region in L parent body. Central European Geology, 54, 233–248. 532
Panero, W.R. (2008) Cation disorder in ringwoodite and its effects on wave speeds in the Earth's 533
transition zone. Journal of Geophysical Research B: Solid Earth, 113, 838. 534
Panero, W.R. (2010) First principles determination of the structure and elasticity of hydrous 535
ringwoodite. Journal of Geophysical Research, 115, 585. 536
This is the peer-reviewed, final accepted version for American Mineralogist, published by the Mineralogical Society of America. The published version is subject to change. Cite as Authors (Year) Title. American Mineralogist, in press.
DOI: https://doi.org/10.2138/am-2021-7539. http://www.minsocam.org/
Always consult and cite the final, published document. See http:/www.minsocam.org or GeoscienceWorld
Thomson et al. revision 1 08/2020
24
Panero, W.R., Smyth, J.R., Pigott, J.S., Liu, Z., and Frost, D.J. (2013) Hydrous ringwoodite to 5 K and 537
35 GPa: Multiple hydrogen bonding sites resolved with FTIR spectroscopy. American 538
Mineralogist, 98, 637–642. 539
Pearson, D.G., Brenker, F.E., Nestola, F., McNeill, J., Nasdala, L., Hutchison, M.T., Matveev, S., 540
Mather, K., Silversmit, G., Schmitz, S., and others (2014) Hydrous mantle transition zone 541
indicated by ringwoodite included within diamond. Nature, 507, 221–224. 542
Piltz, R.O. (2018a) Accurate data processing for neutron laue diffractometers. Journal of Applied 543
Crystallography, 51, 635–645. 544
Piltz, R.O. (2018b) LaueG software for displaying and processing neutron laue images. Journal of 545
Applied Crystallography, 51, 963–965. 546
Potapkin, V., Chumakov, A.I., Smirnov, G.V., Celse, J.P., Rüffer, R., McCammon, C., and 547
Dubrovinsky, L. (2012) The 57Fe Synchrotron Mössbauer Source at the ESRF. Journal of 548
Synchrotron Radiation, 19, 559–569. 549
Prescher, C., McCammon, C., and Dubrovinsky, L. (2012) MossA: a program for analyzing energy-550
domain Mössbauer spectra from conventional and synchrotron sources. Journal of Applied 551
Crystallography, 45, 329–331. 552
Purevjav, N., Okuchi, T., Tomioka, N., Abe, J., and Harjo, S. (2014) Hydrogen site analysis of 553
hydrous ringwoodite in mantle transition zone by pulsed neutron diffraction. Geophysical 554
Research Letters, 41, 6718–6724. 555
Purevjav, N., Okuchi, T., Wang, X., Hoffmann, C., and Tomioka, N. (2018) Determination of 556
hydrogen site and occupancy in hydrous Mg2SiO4 spinel by single-crystal neutron diffraction. 557
Acta Crystallographica Section B: Structural Science, Crystal Engineering and Materials, 74, 115–558
120. 559
This is the peer-reviewed, final accepted version for American Mineralogist, published by the Mineralogical Society of America. The published version is subject to change. Cite as Authors (Year) Title. American Mineralogist, in press.
DOI: https://doi.org/10.2138/am-2021-7539. http://www.minsocam.org/
Always consult and cite the final, published document. See http:/www.minsocam.org or GeoscienceWorld
Thomson et al. revision 1 08/2020
25
Ringwood, A.E. (1968) Phase transformations in the mantle. Earth and Planetary Science Letters, 5, 560
401–412. 561
Ross, N.L., Gibbs, G.V., and Rosso, K.M. (2003) Potential docking sites and positions of hydrogen in 562
high-pressure silicates. American Mineralogist, 88, 1452–1459. 563
Schulze, K., Marquardt, H., Kawazoe, T., Boffa Ballaran, T., McCammon, C., Koch-Müller, M., 564
Kurnosov, A., and Marquardt, K. (2018) Seismically invisible water in Earth's transition zone? 565
Earth and Planetary Science Letters, 498, 9–16. 566
Smyth, J.R. (1987) The beta -Mg2SiO4: a potential host for water in the mantle? American 567
Mineralogist, 72, 1051–1055. 568
Smyth, J.R. (1994) A crystallographic model for hydrous wadsleyite: An ocean in the Earth's interior? 569
American Mineralogist, 79, 1021–1025. 570
Smyth, J.R., Holl, C.M., Frost, D.J., Jacobsen, S.D., Langenhorst, F., and McCammon, C.A. (2003) 571
Structural systematics of hydrous ringwoodite and water in Earth's interior. American 572
Mineralogist, 88, 1402–1407. 573
Suetsugu, D., Inoue, T., Obayashi, M., Yamada, A., Shiobara, H., Sugioka, H., Ito, A., Kanazawa, T., 574
Kawakatsu, H., Shito, A., and others (2010) Depths of the 410-km and 660-km discontinuities in 575
and around the stagnant slab beneath the Philippine Sea: Is water stored in the stagnant slab? 576
Physics of the Earth and Planetary Interiors, 183, 270–279. 577
Taran, M.N., Koch-Müller, M., Wirth, R., Abs-Wurmbach, I., Rhede, D., and Greshake, A. (2009) 578
Spectroscopic studies of synthetic and natural ringwoodite, γ-(Mg, Fe)2SiO4. Physics and 579
Chemistry of Minerals, 36, 217–232. 580
Thomas, S.-M., Bina, C.R., Jacobsen, S.D., and Goncharov, A.F. (2012) Radiative heat transfer in a 581
hydrous mantle transition zone. Earth and Planetary Science Letters, 357-358, 130–136. 582
This is the peer-reviewed, final accepted version for American Mineralogist, published by the Mineralogical Society of America. The published version is subject to change. Cite as Authors (Year) Title. American Mineralogist, in press.
DOI: https://doi.org/10.2138/am-2021-7539. http://www.minsocam.org/
Always consult and cite the final, published document. See http:/www.minsocam.org or GeoscienceWorld
Thomson et al. revision 1 08/2020
26
Thomas, S.-M., Jacobsen, S.D., Bina, C.R., Reichart, P., Moser, M., Hauri, E. H., Koch-Müller, M., 583
Smyth, J. R., and Döllinger, G. (2015) Quantification of water in hydrous ringwoodite. Frontiers in 584
Earth Science, 2, 720–10. 585
van der Meijde, M., Marone, F., Giardini, D., and van der Lee, S. (2003) Seismic Evidence for Water 586
Deep in Earth's Upper Mantle. Science, 300, 1556–1558. 587
Yang, X., Keppler, H., Dubrovinsky, L., and Kurnosov, A. (2014) In-situ infrared spectra of hydroxyl 588
in wadsleyite and ringwoodite at high pressure and high temperature. American Mineralogist, 99, 589
724–729. 590
Ye, Y., Brown, D.A., Smyth, J.R., Panero, W.R., Jacobsen, S.D., Chang, Y.Y., Townsend, J.P., 591
Thomas, S.M., Hauri, E.H., Dera, P., and Frost, D.J. (2012) Compressibility and thermal 592
expansion of hydrous ringwoodite with 2.5(3) wt% H2O. American Mineralogist, 97, 573–582. 593
Yoshino, T., Manthilake, G., Matsuzaki, T., and Katsura, T. (2008) Dry mantle transition zone inferred 594
from the conductivity of wadsleyite and ringwoodite. Nature, 451, 326–329. 595
596
This is the peer-reviewed, final accepted version for American Mineralogist, published by the Mineralogical Society of America. The published version is subject to change. Cite as Authors (Year) Title. American Mineralogist, in press.
DOI: https://doi.org/10.2138/am-2021-7539. http://www.minsocam.org/
Always consult and cite the final, published document. See http:/www.minsocam.org or GeoscienceWorld

Thomson et al. revision 1 08/2020
27
FIGURE CAPTIONS 597
Figure 1: Photomicrograph of selected ringwoodite crystals recovered from synthesis. 598
Figure 2: (a) Raman spectra collected in this study, at 1 cm-1 and 4 cm-1 resolution, compared with a 599
reference spectrum from Kleppe et al. (2002). (b) Raman spectra extended out to 4500 cm-1, covering 600
the spectral region where stretches associated with O-H might be expected. (c) FTIR absorption 601
spectra collected from a single crystal ringwoodite sample at ambient conditions, normalised to 1 cm 602
thickness. Inset: baseline-corrected absorption from 2000 – 4000 cm-1, for H2O concentration 603
quantification and deconvolved into contributing peaks after Monique-Thomas et al (2016). 604
Figure 3: Water content of ringwoodite sample based on individual FTIR calibrations, EPMA by 605
difference and an overall weighted average. 606
Figure 4: Synchrotron Mössbauer spectra collected at ID18, fitted with two spectral components using 607
MossA. Raw data is shown by the black points and the complete model fit by the red curve. The model 608
fit is composed of two components; the green asymmetric doublet is interpreted as the signal from 609
octahedral ferrous iron whilst that highlighted in blue is assigned as tetrahedral ferric iron. 610
Figure 5: Fourier difference maps from single-crystal Laue neutron diffraction data (with elements of 611
the crystal structure superimposed) which allow visualisation of possible hydrogen positions (a) 110 612
plane and (b) 100 through 100 K data collection focussed on the (a) octahedral site of Mg, Fe and Si 613
whose relative proportions are indicated by the orange, brown and blue coloured segments 614
respectively, (b) tetrahedral site contain Si and Fe. (c) 110 plane through 300 K data focussed on the 615
octahedral site in Fd3̅m symmetry. 616
This is the peer-reviewed, final accepted version for American Mineralogist, published by the Mineralogical Society of America. The published version is subject to change. Cite as Authors (Year) Title. American Mineralogist, in press.
DOI: https://doi.org/10.2138/am-2021-7539. http://www.minsocam.org/
Always consult and cite the final, published document. See http:/www.minsocam.org or GeoscienceWorld

Thomson et al. revision 1 08/2020
28
Table 1: Results of FTIR analysis to determine sample H2O concentration using various absorption 617
coefficients 618
Sample d (μm) Ai cH2O (MTa) cH2O (MTb) cH2O (LR) cH2O (MTc) cH2O (BC) a 50 2 1055.9 0.94 0.19 1.06 0.22 0.83 0.17 1.27 0.26 0.78 0.06 b 57 2 1505.9 1.17 0.24 1.33 0.27 1.04 0.21 1.59 0.32 0.97 0.07 c 42 2 760.6 0.81 0.17 0.91 0.19 0.71 0.15 1.09 0.22 0.67 0.05
average 0.97 0.20 1.10 0.22 0.86 0.18 1.32 0.27 0.81 0.06 Numbers in italics are estimated uncertainties in thickness and water content measurements. 619 MTa (𝜀 = 111,815 L.mol-1cm-2) (Thomas et al. 2015) 620 MTb (𝜀 = 98,830 L.mol-1cm-2) (Thomas et al. 2015) 621 LR (𝜀 = 126,393 L.mol-1cm-2) (Libowitzky and Rossman 1997) 622 MTc (𝜀 = 82,640 ± 16,530 L.mol-1cm-2) (Thomas et al. 2015) 623 BC (𝜀 = 135,133 ± 8,794 L.mol-1cm-2) (Bolfan-Casanova et al. 2018) 624 625
626
Table 2: Fitting parameters from SMS spectra of sample crystals. 627
Intensity CS (mm/s) QS (mm/s)
Fe2+ 82.3 ± 2.6 1.030 ± 0.005 2.757 ± 0.009 Fe3+ 17.7 ± 2.6 0.091 ± 0.076 0.551 ± 0.086
628
This is the peer-reviewed, final accepted version for American Mineralogist, published by the Mineralogical Society of America. The published version is subject to change. Cite as Authors (Year) Title. American Mineralogist, in press.
DOI: https://doi.org/10.2138/am-2021-7539. http://www.minsocam.org/
Always consult and cite the final, published document. See http:/www.minsocam.org or GeoscienceWorld

Thomson et al. revision 1 08/2020
29
Table 3: EPMA analyses, in wt.%, of synthetic ringwoodite crystals, assuming Fe3+/Fetot from SMS 629
measurements and H2O by difference 630
Wt.% oxides Atoms per 4 oxygens (pfu)
crystal SiO2 FeO Fe2O3 MgO Total H2O Si Fe2+ Fe3+ Mg H O Mg#
a 41.81 7.51 1.88 47.75 98.95 1.05 1.009 0.152 0.034 1.719 0.171 4 0.90
41.54 7.43 1.86 47.63 98.46 1.54 1.008 0.151 0.034 1.722 0.172 4 0.90
b 41.99 7.49 1.87 47.76 99.11 0.89 1.012 0.151 0.034 1.715 0.171 4 0.90
41.63 7.50 1.88 48.05 99.07 0.93 1.005 0.151 0.034 1.728 0.171 4 0.90
41.65 7.43 1.86 47.63 98.56 1.44 1.009 0.150 0.034 1.720 0.172 4 0.90
41.98 7.38 1.84 47.84 99.04 0.96 1.011 0.149 0.033 1.718 0.171 4 0.90
c 41.24 6.90 1.72 47.99 97.85 2.15 1.004 0.140 0.032 1.742 0.173 4 0.91
41.94 6.70 1.67 48.76 99.07 0.93 1.007 0.134 0.030 1.745 0.170 4 0.91
42.26 6.76 1.69 48.84 99.55 0.45 1.009 0.135 0.030 1.739 0.169 4 0.91
41.89 6.89 1.72 47.77 98.26 1.74 1.014 0.139 0.031 1.724 0.172 4 0.91
d 41.89 7.13 1.78 48.19 99.00 1.00 1.009 0.144 0.032 1.730 0.171 4 0.91
41.52 7.16 1.79 48.33 98.79 1.21 1.003 0.145 0.033 1.740 0.171 4 0.91
41.41 7.02 1.76 47.97 98.16 1.84 1.005 0.143 0.032 1.736 0.172 4 0.91
e 41.70 7.16 1.79 47.86 98.51 1.49 1.009 0.145 0.033 1.727 0.172 4 0.91
f 41.92 6.84 1.71 48.95 99.42 0.58 1.004 0.137 0.031 1.747 0.170 4 0.91
g 42.15 7.03 1.76 48.21 99.14 0.86 1.012 0.141 0.032 1.726 0.170 4 0.91
41.99 7.17 1.79 48.35 99.31 0.69 1.008 0.144 0.032 1.730 0.170 4 0.91
42.07 7.12 1.78 48.08 99.06 0.94 1.012 0.143 0.032 1.724 0.171 4 0.91
h 42.01 7.56 1.89 47.96 99.42 0.58 1.010 0.152 0.034 1.718 0.170 4 0.90
41.74 7.62 1.91 48.13 99.39 0.61 1.004 0.153 0.035 1.726 0.171 4 0.90
41.61 7.71 1.93 47.74 98.98 1.02 1.006 0.156 0.035 1.721 0.171 4 0.90
41.57 7.66 1.92 47.81 98.96 1.04 1.005 0.155 0.035 1.723 0.171 4 0.90
42.02 7.41 1.85 48.20 99.49 0.51 1.008 0.149 0.033 1.724 0.170 4 0.90
Mean 41.80 7.24 1.81 48.08 98.94 1.06 1.008 0.146 0.033 1.728 0.171 4 0.91
± (1σ) 0.25 0.30 0.08 0.37 0.45 0.45 0.003 0.006 0.001 0.009 0.001
0.00 631
This is the peer-reviewed, final accepted version for American Mineralogist, published by the Mineralogical Society of America. The published version is subject to change. Cite as Authors (Year) Title. American Mineralogist, in press.
DOI: https://doi.org/10.2138/am-2021-7539. http://www.minsocam.org/
Always consult and cite the final, published document. See http:/www.minsocam.org or GeoscienceWorld
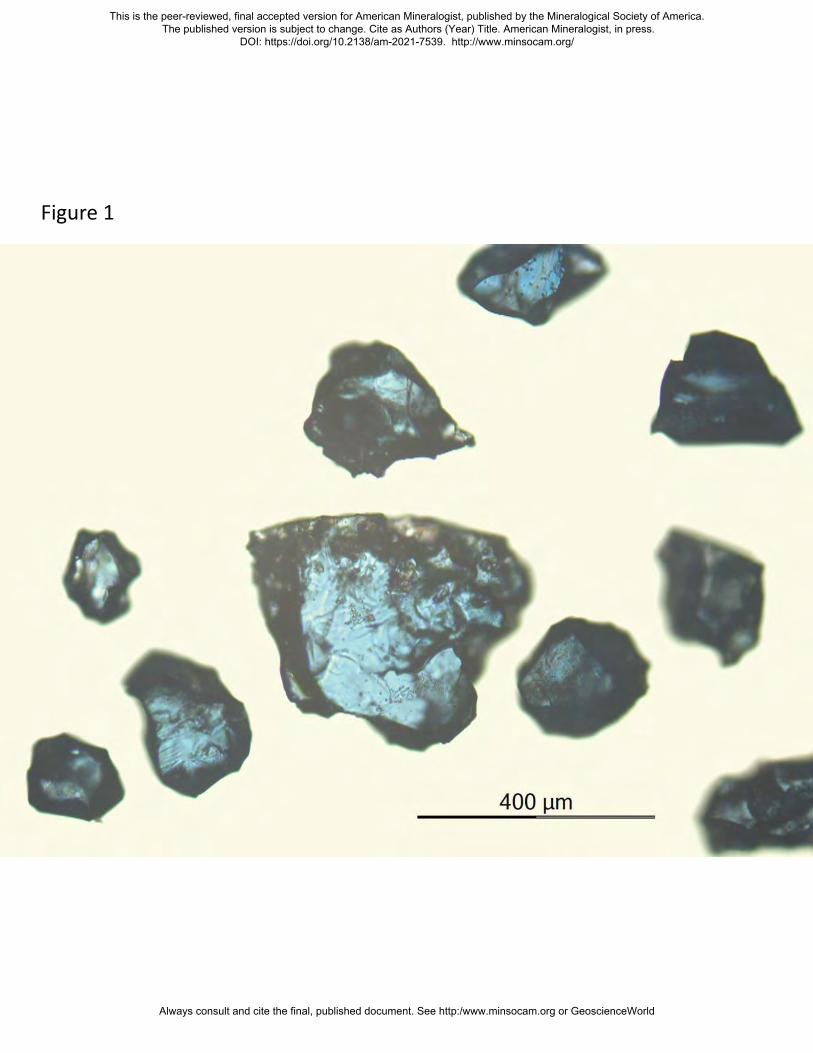
Figure 1
This is the peer-reviewed, final accepted version for American Mineralogist, published by the Mineralogical Society of America. The published version is subject to change. Cite as Authors (Year) Title. American Mineralogist, in press.
DOI: https://doi.org/10.2138/am-2021-7539. http://www.minsocam.org/
Always consult and cite the final, published document. See http:/www.minsocam.org or GeoscienceWorld

200 400 600 800 1000 1200wavenumber cm 1
Inte
nsi
ty (
arb
unit
s)
796
841
192
238
709 this study (4 cm 1 resolution)
this study (1 cm 1 resolution)
Kleppe et al., (2002)
500 1000 1500 2000 2500 3000 3500 4000 4500wavenumber cm 1
Inte
nsi
ty (
arb
unit
s)
1000 1500 2000 2500 3000 3500 4000wavenumber cm 1
0
50
100
150
200
250
300
linear
abso
rpti
on (
cm1)
1184
12
79
1343 160
6
17
42
2512.0 2854.5
3124.6
3398.7
3653.3
(a)
(b)
(c)
Figure 2This is the peer-reviewed, final accepted version for American Mineralogist, published by the Mineralogical Society of America.
The published version is subject to change. Cite as Authors (Year) Title. American Mineralogist, in press. DOI: https://doi.org/10.2138/am-2021-7539. http://www.minsocam.org/
Always consult and cite the final, published document. See http:/www.minsocam.org or GeoscienceWorld
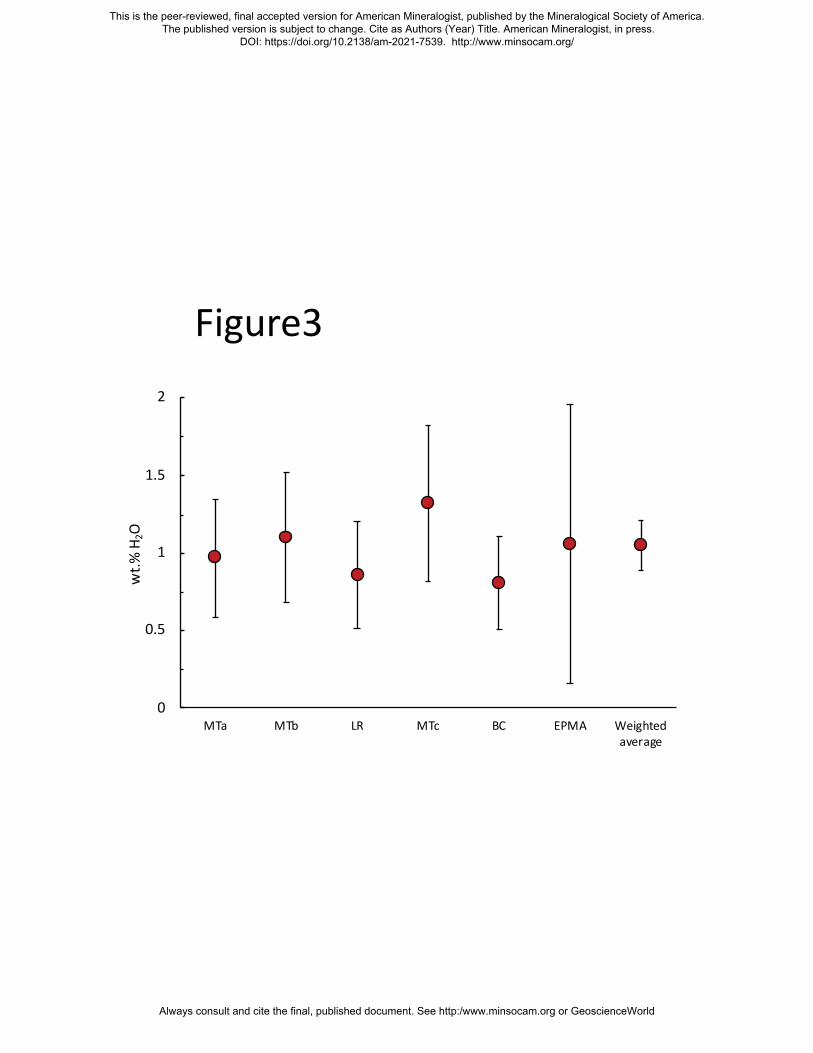
0
0.5
1
1.5
2
MTa MTb LR MTc BC EPMA Weightedaverage
wt.%
H 2O
Figure3
This is the peer-reviewed, final accepted version for American Mineralogist, published by the Mineralogical Society of America. The published version is subject to change. Cite as Authors (Year) Title. American Mineralogist, in press.
DOI: https://doi.org/10.2138/am-2021-7539. http://www.minsocam.org/
Always consult and cite the final, published document. See http:/www.minsocam.org or GeoscienceWorld
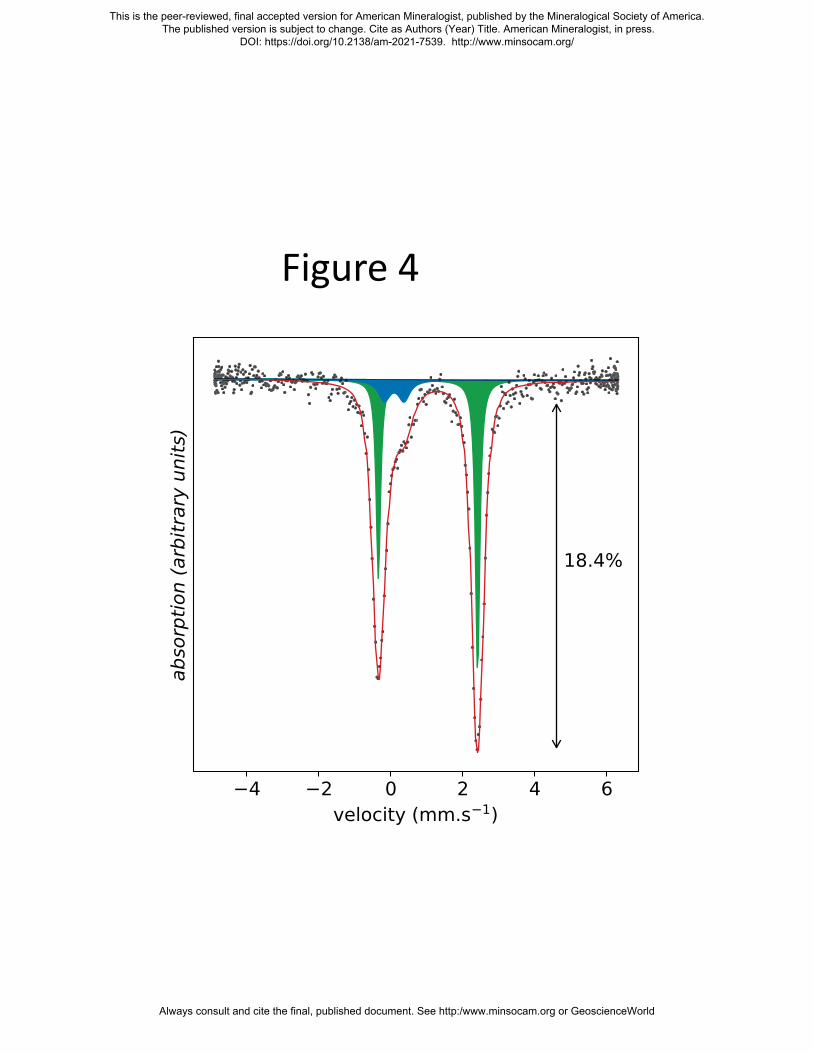
4 2 0 2 4 6velocity (mm.s 1)
abso
rpti
on (
arb
itra
ry u
nit
s)
18.4%
Figure 4
This is the peer-reviewed, final accepted version for American Mineralogist, published by the Mineralogical Society of America. The published version is subject to change. Cite as Authors (Year) Title. American Mineralogist, in press.
DOI: https://doi.org/10.2138/am-2021-7539. http://www.minsocam.org/
Always consult and cite the final, published document. See http:/www.minsocam.org or GeoscienceWorld

0.52
-0.61
0
0.6
-0.7
0
0.67
-0.57
0
fm/Å fm/Å fm/Å
(a) (b) (c)
Figure 5
This is the peer-reviewed, final accepted version for American Mineralogist, published by the Mineralogical Society of America. The published version is subject to change. Cite as Authors (Year) Title. American Mineralogist, in press.
DOI: https://doi.org/10.2138/am-2021-7539. http://www.minsocam.org/
Always consult and cite the final, published document. See http:/www.minsocam.org or GeoscienceWorld