A physicochemical investigation of the recovery of hydrous ...
165
University of Wollongong University of Wollongong Research Online Research Online University of Wollongong Thesis Collection 1954-2016 University of Wollongong Thesis Collections 1978 A physicochemical investigation of the recovery of hydrous tin oxides from A physicochemical investigation of the recovery of hydrous tin oxides from electroplating liquors and rinse waters electroplating liquors and rinse waters Richard Wilfred Whitton University of Wollongong Follow this and additional works at: https://ro.uow.edu.au/theses University of Wollongong University of Wollongong Copyright Warning Copyright Warning You may print or download ONE copy of this document for the purpose of your own research or study. The University does not authorise you to copy, communicate or otherwise make available electronically to any other person any copyright material contained on this site. You are reminded of the following: This work is copyright. Apart from any use permitted under the Copyright Act 1968, no part of this work may be reproduced by any process, nor may any other exclusive right be exercised, without the permission of the author. Copyright owners are entitled to take legal action against persons who infringe their copyright. A reproduction of material that is protected by copyright may be a copyright infringement. A court may impose penalties and award damages in relation to offences and infringements relating to copyright material. Higher penalties may apply, and higher damages may be awarded, for offences and infringements involving the conversion of material into digital or electronic form. Unless otherwise indicated, the views expressed in this thesis are those of the author and do not necessarily Unless otherwise indicated, the views expressed in this thesis are those of the author and do not necessarily represent the views of the University of Wollongong. represent the views of the University of Wollongong. Recommended Citation Recommended Citation Whitton, Richard Wilfred, A physicochemical investigation of the recovery of hydrous tin oxides from electroplating liquors and rinse waters, thesis, , University of Wollongong, 1978. https://ro.uow.edu.au/ theses/2945 Research Online is the open access institutional repository for the University of Wollongong. For further information contact the UOW Library: [email protected]
Transcript of A physicochemical investigation of the recovery of hydrous ...
University of Wollongong University of Wollongong
Research Online Research Online
University of Wollongong Thesis Collection 1954-2016 University of Wollongong Thesis Collections
1978
A physicochemical investigation of the recovery of hydrous tin oxides from A physicochemical investigation of the recovery of hydrous tin oxides from
electroplating liquors and rinse waters electroplating liquors and rinse waters
Richard Wilfred Whitton University of Wollongong
Follow this and additional works at: https://ro.uow.edu.au/theses
University of Wollongong University of Wollongong
Copyright Warning Copyright Warning
You may print or download ONE copy of this document for the purpose of your own research or study. The University
does not authorise you to copy, communicate or otherwise make available electronically to any other person any
copyright material contained on this site.
You are reminded of the following: This work is copyright. Apart from any use permitted under the Copyright Act
1968, no part of this work may be reproduced by any process, nor may any other exclusive right be exercised,
without the permission of the author. Copyright owners are entitled to take legal action against persons who infringe
their copyright. A reproduction of material that is protected by copyright may be a copyright infringement. A court
may impose penalties and award damages in relation to offences and infringements relating to copyright material.
Higher penalties may apply, and higher damages may be awarded, for offences and infringements involving the
conversion of material into digital or electronic form.
Unless otherwise indicated, the views expressed in this thesis are those of the author and do not necessarily Unless otherwise indicated, the views expressed in this thesis are those of the author and do not necessarily
represent the views of the University of Wollongong. represent the views of the University of Wollongong.
Recommended Citation Recommended Citation Whitton, Richard Wilfred, A physicochemical investigation of the recovery of hydrous tin oxides from electroplating liquors and rinse waters, thesis, , University of Wollongong, 1978. https://ro.uow.edu.au/theses/2945
Research Online is the open access institutional repository for the University of Wollongong. For further information contact the UOW Library: [email protected]

A PHYSICOCHEMICAL INVESTIGATION OF THE
RECOVERY OF HYDROUS TIN OXIDES FROM
ELECTROPLATING LIQUORS AND RINSE WATERS
A THESIS SUBMITTED IN PARTIAL FULFILMENT
OF THE REQUIREMENTS FOR THE DEGREE OF
MASTER OF SCIENCE
BY
RICHARD WILFRED WHITTON
SUPERVISOR DR. J. ELLIS
THE UNIVERSITY OF WOLLONGONG
FEBRUARY, 1978
UNIVERSITY OF WOLLONGONG
LIBRARY

«U W b

Z \ \ Cf¥V~

Abstract
The solubility of hydrous tin oxides, precipitated from dilute halogen tinplating rinse waters, has been studied. The degree of solubility in a sodium hydroxide solution is shown to be a function of a number of factors. The precipitation time and temperature, the stannous stannic ratio and the presence of specific impurities are shown to affect the physicochemical properties of the precipitate either independently or in conjunction. The solubility of the precipitate was observed to be related to its morphology. It is suggested that this may be the result of an a/ $ transformation in the hydrous stannic oxides. However, morphology was not the sole reason for changes in solubility as demonstrated by the affect of impurities. It was also demonstrated that highly soluble, rapid settling precipitates could be produced in the system with the aid of a polyacrylamide flocculating agent.

NOMENCLATURE
SYMBOL
TP, P ' oAFRrriY MPV I Z
AHoHfSr SoHSdKKSq
D
Temperaturepressure, initial pressure free energy change Universal gas constant radiuscritical radiussurface tensiongram molecular weightdensitymolar volumefluxgas kinetic collision frequencylatent heat of vapourisationheat of fusionconcentrationheat of solutiondiameterequilibrium constant solubility product charge, total surface charge dielectric constant
ContentsPage
1.0 Introduction 12.0 Solution Chemistry 32.1 Hydrous Oxides of Stannous Tin 62.2 Hydrous Oxides of Stannic Tin 173.0 Precipitation and Solubility -
Review of Relevant Concepts 314.0 Experimental 555.0 Results 615.1 Precipitate Morphology 615.2 Stannous/Stannic Tin Ratio 725.3 Ageing 785.4 Impurity Effects 815.5 Instrumental Analysis 1005.6 Surface Active Agents,
Polyelectrolytes 1105.7 General Reaction Conditions 1216.0 Discussion 1277.0 Conclusions 1488.0 References 154
Acknowledgements 1599.0

1.
1.0 INTRODUCTION
The ability to precipitate mixtures of stannous and stannic tin from solution at pH values in the order of 7.5 is the basis of a pollution control/recovery system suitable for the extraction and concentration of tin from plating electrolytes. Such a technique is employed by Australian Iron and Steel Pty. Ltd. in the recovery of tin from halogen tin plating rinse waters and waste solutions and typically 50,000 kg tin, in the form of hydrated tin oxides, is recovered annually by this process.
The system involves the collection of all rinse water and spills from the plating equipment in a series of trays and sump tanks from which the solution is subsequently pumped to one of a set of 90 kl capacity tanks. The tanks are rubber lined and equipped with stirrers, steam heating pipework and provision is made for agitation with compressed air by direct injection. The tanks are tall cylindrical vessels with a conical bottom where the precipitated hydrated tin oxides can be concentrated after precipitation and settling. The volume of the conical section is 9 kl.
In its simplest form the tin-containing solutions are collected, precipitated with sodium carbonate then the precipitate is allowed to settle into the cone. The clear supernatant liquor is drained off. This effectively gives a 9:1 concentration of tin. The resultant slurry is pumped to a holding tank and then subsequently removed to a tin refining plant.

2.,
The refining process is an electro-winning operation. The first step in the sequence is the solution of the precipitate in hot sodium hydroxide solution. Sodium nitrate is added to ensure all the dissolved tin is in the quadrivalent state. Following the removal of heavy metal impurities by a sulphide treatment, the solution is subjected to an electrolytic process.
The initial precipitation step involving the addition of the sodium carbonate can be controlled effectively by monitoring the pH of the neutralisation. Experience has shown that the quantity and rate of addition of sodium carbonate necessary in practice can be based on an analysis of the collected liquids. Similarly, particle size can be controlled to give adequate settling of the precipitate based on a 24 hour treatment cycle by heating the solutions to 45°C.
Under normal conditions the precipitated hydrated tin oxides can be dissolved in the hot sodium hydroxide solutions, of the refining process, with high efficiency. However, periods have been experienced where the re-solution stage has dropped below the minimum required efficiency of 85%. The decrease in solubility can be quite pronounced and it has been known that, on rare occasions, the efficiency can drop to 30%.

3.,
Such changes in the solubility of the precipitate do not affect the anti pollution objectives of the process, nevertheless they represent a loss of valuable tin from the recovery system.
The problem has in the past been recurrent rather than persistant and such factors as the temperature, the presence of iron, ageing and seawater have all been variously blamed for the difficulties encountered periodically.
The work detailed in this thesis deals with the effect of various treatment parameters and the physio- chemical properties of the precipitates in order to provide an insight into the mechanisms that operate.The scope of the work covers the effect of various treatment conditions, the effect of impurities and the effect of modifying the particles with surface active agents.
2.0 SOLUTION CHEMISTRY
The major ions present in the rinse waters are stannous tin, stannic tin, sodium, chloride and fluoride, all of which are capable of forming complexes. Other trace elements present by design are sodium ferrocyanide and a medium molecular weight polyethylene glycol type brightening agent. Suspended matter is inevitably present in both the rinse waters and the electrolyte itself. Predominately these are oxidation products of the original

4• /
electrolyte solution, fluostannate complexes and ferri- ferrocyanides (Prussian blue). A typical analysis of a solution presented to the recovery process is as follows:
Sn2 + 1.3 ,-lg iSn4 + LO•
o g 1 “ 1
Cl" 2.6 g I-1f" 2.1 g I"1Total Fe 40.0 mg 1PH 3.3
Because the halogen plating electrolyte is concentrated, the specification of the various elements is uncertain, but the rinse waters are relatively dilute, and the species in solution can be predicted with some degree of confidence. Schaap, Davis and Nebergall(1954) as well as Muetterties (1962) have published information on the fluoride complexes of tin. Slater (1967) studied stannous fluoride complexes.
Both chloride and fluoride ions are present in solution but the dissociation constants of the stannous tin complexes are ranked SnF^- << SnCl^ << SnBwith dissociation constants of 1.1 x lO-^, 3 x 10“ and
-2 - 4.5 x 10 respectively. The strength of the SnF^ complex favours the presence of this species in the electrolyte solutions. An alternative species is only favoured when the fluoride concentration is insufficient to satisfy the requirements for SnF^-.

5 • r
In the halogen plating bath a 6:1 mole ratio of fluoride to stannous tin is necessary to ensure excess fluoride is available. This ratio is achieved, or exceeded, in the rinse waters and so ensures the presence of the SnF^ ion.
Stannic tin is always present in solution through oxidation. In the halogen plating solution the stannic tin achieves a steady state level of 25% of the stannous concentration. In the rinse waters this is usually exceeded, depending on the specific history of a given batch. In acidic fluoride solutions the oxidised tin is reported to exist as the specie SnFg-. The oxidised - reduced species are related as follows;
SnF^ + 3F SnF ~ + 2e3 6
The SnF^~ ion eventually exceeds the solubility limit in the electrolyte and precipitates as Na0SnF^. Although this is the predominant component of the suspension found in the solution it is not the sole insoluble impurity. The decomposition product of the sodium ferrocyanide also adds to the insolubles. The sodium ferriferrocyanide complex is responsible for the deep blue colour of the electrolyte and the pale blue colour of the rinse waters. A typical analysis of the sludge reveals a tin content of ^ 30% w/w and an iron content of 5-10% w/w. In the rinse waters the insolubles occur at a level of 0.05 -0.1 g l-1.

6 • r
The above paragraphs describe the chemical nature of the solution that forms the feed for the recovery operation. It is important and relevant at this point to review the chemistry of the hydrated tin oxides which essentially form the end product of the precipitation operation.
2.1 HYDROUS OXIDES OF STANNOUS TIN
2.1.1 Hydrous Oxides
The precipitate obtained on raising the pH of a solution of a stannous salt, usually the halide, with sodium hyroxide, sodium carbonate or ammonium hydroxide is often referred to as SniOH^ but in view of the evidence in literature the precipitate would be more correctly termed hydrous stannous oxide or hydrous tin (2) oxide (Donaldson and Moser 1961).
The precipitate in its pure form is gelatinous and slimey and is difficult to handle, it filters poorly but may be washed by suction or decantation (Mantell 1949) .
Various authors (Donaldson and Moser 1959, 1961; Donaldson, Moser and Simpson 1963) have reported divergent views of the purity of the hydrous stannous oxides, produced by simple precipitation. It is recognised that the stannous form gradually absorbs oxygen from the air, being converted to hydrated stannic oxide, however the extent to which this has influenced results has not always been recognised. On the basis of the failure to

7• /
observe and allow for the effect of tin (4) impurities Donaldson et al (1961) have critically reviewed the work of Bury and Partington and also Weiser and Milligan. Bury and Partington proposed the formula 3 SnO. 2 H20 based on the analysis of total tin and water, whilst Weiser and Milligan proposed the formula 2 SnO. H20, based on the results of dehydration. Weiser and Milligan (1939) in a later work suggested that for hydrous stannous oxide gel is hydrous SnO. 0. 5 H20. Donaldson claimed that by not basing their conclusions on a complete analysis they arrived at an erroneous conclusion. Donaldson's investigations showed that even samples prepared in the complete absence of elemental oxygen contained approximately 2% of tin (4). The oxidation of the stannous material is most evident above pH 6.3 although more precise electro-chemical measurements indicate that the increased oxidation commences at pH 6.0 - 6.2 The explanation offerred for the formation of tin (4) under an atmosphere of nitrogen or in vacuum dessicat- ors is via the reduction of water (hydroxyl) by the bivalent tin (Donaldson and Moser 1961) .
2 Sn2+ + 20H” + Sn4+ + 202“ + H2
Donaldson and co-workers' (1961) results for moisture content were consistently below 5% but after they had made allowances for the impurities (stannic tin and sulphate) the results were adjusted to 5.0 - 5.04% H20.

8• /
On this basis, the formula 5 SnO. was proposed,requiring 83.7% of tin and 5.07% of water. Further evidence suggested was the unit cell and density data. The most probable contents of the large triclinic cell was considered to be more nearly a multiple of 5 SnO. 21^0 than of any other simple formula. Finally, the analogy of hydrous lead (2) oxide as 5 PbO. 2 f^O was added.
In a paper published in 1968 Howie and Moser reported a very careful and painstaking examination of the structure of tin (2) hydroxide. This investigation referred to the previous work of Donaldson and Moser (1961) and pointed out that the formula they had deduced was based on an analytical result on finely divided material but that analytical results on a fine powder of large surface area cannot distinguish between their formula and the alternative 3 SnO. H 2 O, which differs by only one molecule of water per fifteen formula units of tin (2) oxide. Single crystals were prepared by neutralisation, with ammonia under a nitrogen atmosphere, over a 3 month period and the tin (2) oxy-hydroxide, uncontaminated by basic tin (2) salts or appreciable tin (4) was subjected to X-ray diffraction. The crystals of tin (2) oxy-hydroxide were found to possess tetragonal symmetry with unit cell dimensions of a = 7.93 +0.01,

9 • /
c = 9.13 + 0.01 A°. This information, in conjunctionwith the density, is claimed to be compatible only withthe presence of four formula units of 3 SnO. H^O perunit cell. A structural determination shows that thestructural unit is an M,X arrangement consisting of anbapproximately regular cube of oxygen atoms (side 2.82 A°) superimposed on an octahedral cluster of tin atoms (side 3.59 A°) (figure 1).
c
FIGURE 1 Stannous oxy-hydroxide structural unit(Howie and Moser 1968)
The complete structure, as proposed by Howie and Moser, consists of alternating layers of such units differing only in the orientation of the units with respect to the crystallographic axes. The distance between the oxygen atoms of adjacent Sn^Og units in successive layers (2.60 A°) is very much less than the oxygen-oxygen distance between units in the same layer (4.60 A°) and significantly

10 • /
shorter than the oxygen-oxygen distance within a single unit (2.82 A°). The layers are apparently connected by hydrogen bonding. A sketch of this configuration is given below:
1 iik 1 ! <U)I itro jrrtio ii. Stilali ojh*ii aivtu) :»t .Jt*iR .‘in«! Mxyyt i, u t• «hit« li** al III** < ornt rs u f ili»* h«|iiuivh. Duini !• ii^llis n n n tio n -d in (hr Inxt are* nm rkrd. Mi.tdnd and uiitdiud'd »tnit - lu ra l uniti» lin in a lte rn ate luyer*. Dui duali linea are hydrogen borni*.
FIGURE 2 Stannous oxy-hydroxide: 001 projection(Howie and Moser 1968)
2.1.2 Precipitation
Precipitation, on the addition of alkali, is reported by Britton (1925) to commence at pH 1.9, however, it is apparent from the numerous investigators who have covered the field that basic salts are formed at the lower pH values, be it basic chlorides from stannous chloride solutions or basic sulphate

11.,
from stannous sulphate solutions. A number of formulae have been proposed for the compounds formed. Donaldson, Moser and Simpson (1963) have summarised the results of a number of workers. Ditte reported the existence of three basic chlorides, 4 SnO. 3 SnCl2. 6 f^O, SnO.SnCl2. 4 H^O and 3 SnO. 2 SnCl2. 6 H20. Britton reported a range of compounds existed having compositions from Sn (OH) Q 6?. SnCl1 39 at pH 1.9 to Sn(OH)1 86- S n C l ^ ^
at pH7. Hayek formulated the basic chloride which he obtained as Sn(OH)2. SnCl2, while Randall and Murkami found the composition to be Sn(OH) Cl. H20. Donaldson et al (1963) prepared precipitates over a range of pH values from 1.24 to 8.14 and on the basis of the total analysis, for tin (2), tin (4) chloride and water, together with X-ray diffraction studies, concluded that only one definite crystalline basic chloride phase was formed, tetratin (2) hexahydroxide dichloride (Sn^(OH)gCl2) As the pH increases a mixture of hydrous tin oxide and the basic chloride is formed and at a pH of 6.12 and above only the hydrous oxide was produced. A summary of their work is given in the following extracted table.

/12.
Table 1.
pHTin2%
TotalTin%
ChlorideQ.*6
Water% X-Ray Diffraction
1.24 72.7 73.0 10.95 8.30 )))))))))
2.38 73.0 73.2 10.91 8.342.87 72.6 73.1 10.88 8.61 basic chloride3.55 72.5 73.0 10.79 8.644.13 72.8 73.3 10.60 8.844.50 73.3 73.9 10.35 8.99 )
) Some lines of5.08 77.7 78.1 9.05 8.25 )
)basic chloride and hydrous oxide.
5.61 80.3 80.4 4.04 5.36 )6.12 79.1 80.6 2.85 4.98 )
)))
6.66 78.2 80.5 2.19 4.75Hydrous oxide
7.14 78.5 80.6 1.35 4.30 )))8.14 78.3 80.2 0.09 4.17
It appears that the difficulties and discrepancies stem from the fact that oxidised tin impurities were neglected and the fact that many of the compositions reported were in fact mixtures of the basic chloride and the hydrous oxide at various stages in the replacement of chloride by hydroxide in the anion. It is also noted that similar results have been obtained in the study of the basic tin (2) sulphate - hydrous tin (2) oxide system (Donaldson and Moser 1961) .

13 • r
Tarasova et al (1970) have studied the effect of anions on the precipitation of tin (2) hydroxide.Two anion concentration regions were detected which had a different effect on the surface area of the precipitated hydroxide. At a low concentration of anions the effect has an exponential character and at a high concentration of anions, the surface area decreased with increasing concentration of a basic salt.
2.1.3 Anhydrous Oxides
Reference needs to be made to the anhydrous stannous oxides in a review of hydrous tin oxides.
Stannous oxide can be obtained in a number of forms, a SnO, 3 SnO and red tin (2) oxide. The most common form, a SnO, has been variously described as grey, black and blue/black as well as crystalline (Mantell, 1949; Durrant and Durrant 1970? Sneed and Brasted 1958; Howie and Moser 1968; Donaldson and Knifton 1964) which can be prepared in a number of ways. By heating tin with a limited supply of air or by heating tin (2) oxalate, SnC2 0 , in the absence of air, SnC204 SnO + CO + C02, are common methods (Spring 1888).

14 • r
Alternatively it can be prepared from hydrous stannous oxide via red tin (2) oxide by heating in the absence of air. It has been prepared by the hydrolysis of tin (2) formate. (La Rosa et al 1956).
The second allotropic modification of stannous oxide, 3 SnO, can be prepared by heating the a form in a vacuum at 550°C (Sneed and Brasted 1958). Donaldson and Moser (1961) suggest the 8 modification does not exist, the substance being a mix of Sn and SnC>2.
Stannous oxides cannot readily be rehydrated (Mantell 1949).
The red tin (2) oxide has attracted interest in the past due, in part, to the difficulties experienced in reproducing its preparation. Donaldson, Moser and Simpson (1961) attempted to clarify the situation by examining the methods of Roth and of Fremy to determine the exact conditions required. The method of Roth called for tin (2) chloride solution to be reacted with sodium bicarbonate to precipitate hydrous tin (2) oxide. The hydrous oxide is treated with a solution of sodium phosphite in IN acetic acid and the pH adjusted to between 5 and 6. The mix is heated rapidly with stirring at 102°C under an atmosphere of nitrogen until most of the precipitate is converted to red oxide.

The red oxide is separated from hydrous oxide and basic chloride by decantation and cascade filtration. Maximum and minimum limits were established for the phosphite and acetic acid concentration. They noted that Bury and Partington who used hypophosphite solutions, in actual fact, were utilising the phosphite impurity in the preparation of the red oxide. Fremy's method required the use of aqueous ammonia to adjust the pH to 10 to precipitate hydrous tin (2) oxide from a tin (2) chloride solution. The formation of the red oxide depends on very careful experimental technique in heating the concentrated suspension spread in thin films in evaporating basins. An important observation was that the presence of chloride impurities appear vital to the success of the preparation; sulphate and nitrate solutions were unsuccessful and bromide gave small yields.
The purity of the product was found to be superior with the technique based on Roth's method. Analysis of this product gave 87.5%, 87.6%, 87.4% for Sn (2) content and 88.0%, 88.1%, 88.0% total tin respectively. The calculated Sn(2) content of SnO is 88.1%. Infrared data indicated the absence of water or hydroxyl groups removing the doubt that the red tin oxide was a modified hydrous oxide. Crystallographic and X-ray data are reported by Donaldson, Moser and Simpson (1961) .

The material is recognised as metastable and is capable of being transformed to the a SnO form by heat (above 270°C) by mechanical pressure at room temperature, by treatment with a strong alkali, or contact with the stable modification. The apparent stability of the red oxide is believed to be due to a thin protective film of tin (4) oxide. Donaldson et al (1961) had not determined the structure of the red oxide.
2.1.4 Impurities
The problem of impurities in hydrous stannous oxide has been primarily directed at the problem of stannic contamination and its subsequent effect on determining the formula of products.
Donaldson and co-workers (1959, 1961, 1963) strongly suggest that it is impossible to prepare, by precipitation, a sample of hydrous tin (2) oxide which is free from both tin (4) and sulphate (if this is the starting soluble tin salt). Contamination by chloride if prepared from Sn(2) chloride is also indicated (Donaldson, Moser and Simpson (1963).Sulphate contamination of over 1% occurs up to a pH of 7 and appreciable oxidation of tin in the sample occurs from pH 6.3 The distribution of the tin (4) impurity is believed to be homogeneous throughout the hydrous oxide (Donaldson and Moser 1961) .

17 • r
Other elements are recognised as coprecipitating with hydrous stannous oxide. Korenman (1963) described the coprecipitation of tin with magnesium.
2.2 HYDROUS OXIDES OF STANNIC TIN2.2.1 Hydrous Oxides
An interesting feature of the hydrous stannicoxides is the existence of two reported modifications, a and 3 • These modifications were apparently originally defined in terms of their properties and methods of preparation. The a stannic acid form is made as a result of the reaction of ammonium hydroxide with stannic chloride.
4 NH4OH + SnCl4 ■* 4 NH4C1 + Sn(OH)4, or,alternatively, via the action of mineral acids upon a stannate (Mantell 1949; Willstatler et al 1924? Sneed and Brasted 1958).
K2SnC>3 + 2 HC1 + 2 KC1 + SnO(OH)2.
3 Stannic acid is obtained by the action of concentrated nitric acid on metallic tin (Mantell 1949; Sneed and Brasted 1958). Dilute nitric acid results in the formation of stannous nitrate.

/18.
The formula for 3 stannic acid has been proposedas being represented by H0 Sn_ 0n_. 4 Ho0 or (Sn0o. H^O)_z b 11 z 2 2 5so the reaction can be written as,
3 Sn + 4 HN03 + xH20 + 3 Sn02 . xH20 + 4 NO
The different forms, a and 3 stannic acid, were recognised as far back as 1811 by Berzelius, who was responsible for the a/3 designation (Mantell 1949). Both the precipitate formed by the action of nitric acid on tin and the compound precipitated from tin salts by alkalis contained the same proportion of oxygen, but possessed different physicochemical properties. The differences were considered to be analogous to phosphoric acid and metaphosphoric acid and Fremy (Mantell 1949) designated them stannic (a form) and metastannic acid (3 form). Both the ot, 3 nomenclature and the stannic/metastannic nomenclature have enjoyed wide use.
Differences reported between the two forms relate mainly to their solubility characteristics (Mantell 1949; Sneed and Brasted 1958). Moist a stannic acid is easily soluble in nitric acid whereas the 3 stannic acid is insoluble in nitric acid.

19 • /
The a stannic acid is easily dissolved in hydrochloric acid, forming chlorides, whereas the 8 form reacts with hydrochloric acid to form a substance insoluble in excess acid but it is soluble in water. The a stannic acid is reported to be soluble in dilute sulphuric acid, forming sulphates, while the 8 form is stated to be insoluble even in concentrated sulphuric acid.
Several other features indicate the differences in the properties of the two forms. The a form is more basic than the 3 form (Mantell 1949). Both are reported to change litmus red when moist but the comment has been made that the performance of the 8 material is controlled by absorbed acidic impurities. When boiled, solutions of the a form do not gelatinise whereas the 8 form does.
Another aspect of the two forms is the behaviour of their salts. Some controversy exists over the identity of some salts (Mantell 1949; Sneed and Brasted 1958), however, in general, it has been stated that the a salts are readily soluble in water without decomposition whilst the 8 salts are sparingly soluble in water (Mantell 1949).

20 • /
Interconversion of the a and 3 forms is recognised (Mantell 1949; Sneed and Brasted 1958).There is general agreement that the a form can readily be converted to the more insoluble 3 form.The change is accelerated by heat. The reverse transformation is apparently more difficult and there appears to be some variation in the stated ease of the reaction ranging from 'not accomplished' (Sneed and Brasted 1958) to 'slow' (Mantell 1949).
The explanation for the observed properties of the two forms of stannic acid is not simple.Early workers in the field, without the benefits of sophisticated techniques, postulated various theories in the light of the fact that the analysis of the compounds showed that they were apparently identical.The various theories covered are as follows:
(i) Different forms of hydration,(Mantell 1949; Kraut 1929; Weiser and Milligan 1939; Cotton and Wilkinson 1966; Fabrichnyi et al 1970; Gutbier et al 1926)

21 • r
(ii) Different crystal forms,(Mantell 1949; Weiser and Milligan 1939; Cotton and Wilkinson 1966; Posnyak 1926)
(iii) Existence in isomeric or polymeric forms, (Mantell 1949; Weiser and Milligan 1939).
(iv) Different particle size (Mantell 1949; Menon 1937; Cotton and Wilkinson 1966; Fabrichnyi et al 1970; Posnyak 1926).
Some early workers inferred that differences in crystal structure could be responsible but the extensive use of X-ray and electron diffraction techniques have demonstrated that this is not responsible. Sneed and Brasted (1958) stated X-ray examination of the freshly prepared tin (4) acids revealed an irregular array of molecules in each of the forms.
Particle size has also been a favoured theory and has many supporters. In its simplest form it is postulated that the a modification is a much smaller particle than the 3 form thus given the a form an apparent higher solubility although tie process could be related to the kinetics of solution.

22 • /
Menon (1937) studied the diffraction of light by a and 3 stannic acid sols. Light diffracted by a stannic acid is completely polarized at right angles to the incident light while that diffracted by 3 stannic acid is imperfectly polarised. The differences were attributed, by Menon , to differences in particle size. The dimension of particles of the a sol. are approximately the wavelength of light; particles of the 3 sol. are frequently larger. The intensity of diffracted light is proportional to the number of diffracting particles in a given volume, which in turn is proportional to the concentration of a given sol. Mantell's (1949) review referred to the independent work of Mecklenburgh, Zeigmondy and Weiser as advocates of the particle size theory. Posnjak (1926) also claimed that 3 stannic acid particles were coarser. Franz (Mantell 1949) is quoted as assuming that the primary particles are less than a micron in size and that there is a gradual grouping of molecules, through the formation of complexes, to larger secondary particles. The particular properties, therefore, of any stannic acid may be considered to be a function of the grain size, which in turn is dependent on temperature, condition of formation etc.

23
Singh and Bansal (1968) studied the coagulation of dialysed stannic hydroxide sol. over periods of 0-105 days and the data obtained apparently indicated that ageing results in decreased stability of the sol. owing to aggregation of the particles.
Weiser and Milligan (1939) stated that the gel formed by the precipitation of a stannic salt with alkali is hydrous SnO^ and it forms no hydrates or hydroxides. The ortho and metastannic acids are not isomers, but are strucurally identical SnC> 2 with more or less absorbed I^O.
Vignon (Mantell 1949) inferred, from his work on the heats of neutralisation of the stannic acids, that a series of variously hydrated compounds exists between the completely water soluble substance and the anhydrous stannic oxide. Lorenz (Mantell 1949) compared the dehydration rates of the a and 3 acids and stated that their composition was identical, both existing in all stages of hydration between H^SnO^ and H^SnO^. The characteristic properties of the compounds are retained after repeated precipitation, but thesalts are different.
24 • !
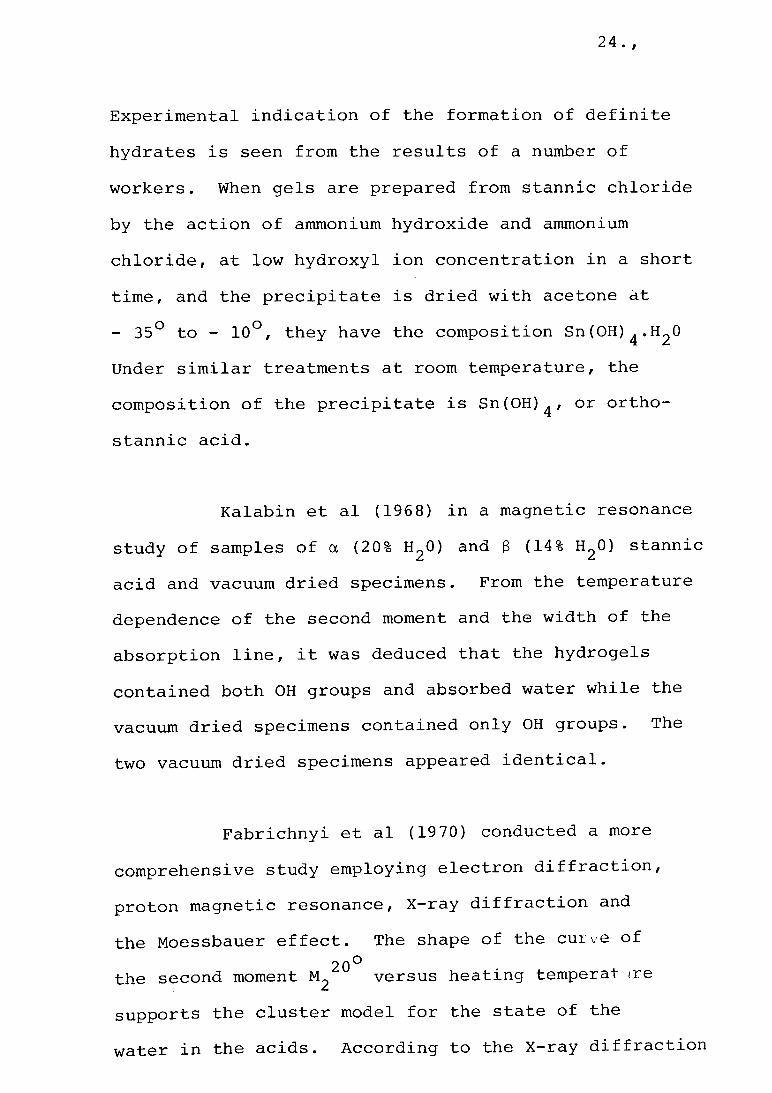
Experimental indication of the formation of definite hydrates is seen from the results of a number of workers. When gels are prepared from stannic chloride by the action of ammonium hydroxide and ammonium chloride, at low hydroxyl ion concentration in a short time, and the precipitate is dried with acetone at - 35° to - 10°, they have the composition Sn(OH)^.H20 Under similar treatments at room temperature, the composition of the precipitate is Sn(OH)^, or orthostannic acid.
Kalabin et al (1968) in a magnetic resonance study of samples of a (20% H20) and £ (14% H20) stannic acid and vacuum dried specimens. From the temperature dependence of the second moment and the width of the absorption line, it was deduced that the hydrogels contained both OH groups and absorbed water while the vacuum dried specimens contained only OH groups. The two vacuum dried specimens appeared identical.
Fabrichnyi et al (1970) conducted a morecomprehensive study employing electron diffraction,proton magnetic resonance, X-ray diffraction andthe Moessbauer effect. The shape of the curve of
20° •the second moment M2 versus heating temperat iresupports the cluster model for the state of thewater in the acids. According to the X-ray diffraction

25 • /
study and the Moessbauer resonance shift lines, the acids are highly dispersed (SnO^ - H20) systems in which the Sn02 particles have a diameter of approximately 20A° and the inner Sn atoms have the same coordination as the surface atoms. These surface Sn atoms obtain the necessary 0 atoms either by connecting OH groups or from H^O molecules. The investigators noted that the stannic acids cannot be described simply as "wet Sn02". Giesekke et al (1967) in their investigations on the thermal decomposition of tin (4) hydroxide using proton magnetic resonance and electron diffraction techniques also subscribed to a cluster model but did not distinguish between the a and 3 forms. Their experimental technique indicated that they studied the a form with a calculated empirical formula of SnC>3H2 on the basis of analysis. They concluded the dehydration process proceeds via crystal stages which are well defined though somewhat overlapping. The first product may be formulated as Sn90 _(OH)9.H^O with the qualification that the protons occur in clusters of three or four. The H20 molecule in this substance is lost in the second dehydration step leaving most protons in well separated Sn-OH groups. The subsequent dehydration was not well understood.

Cotton and Wilkinson (1966) generalised on the differences between and a and (3 forms, indicating that X-ray studies show that both have the rutile structure, with absorbed water, and the differences in reactivity must be due to differences in particle size, nature of the surfaces of the particles etc.
2.2.2 Hydrolysis
Barsukov and Kuril'chikova (1966) studied the solubilisation of Sn(OH)^ in hydrothermal solutions at 25°C, 100°C and 300-400°C. The tin content of the solution varied with temperature and pH. The presence of Cl”, HC03~ and C03“ inhibited solubilisation in all solutions studied. The influence of SiO^ was studied at high temperature and was found to decrease solubility. Solubility increased in the presence of fluorides with the formation of hydroxyfluorostannate complexes of the type (SnF^ (OH)^_x)
Sneed and Brasted (1958) discussed the steps in the hydrolysis of the covalent SnCl^. The first step involves the co-ordinative addition of two molecules of water, enabling the Sn (4) to attain its stable co-ordination number of six. The steps proposed are as follows:
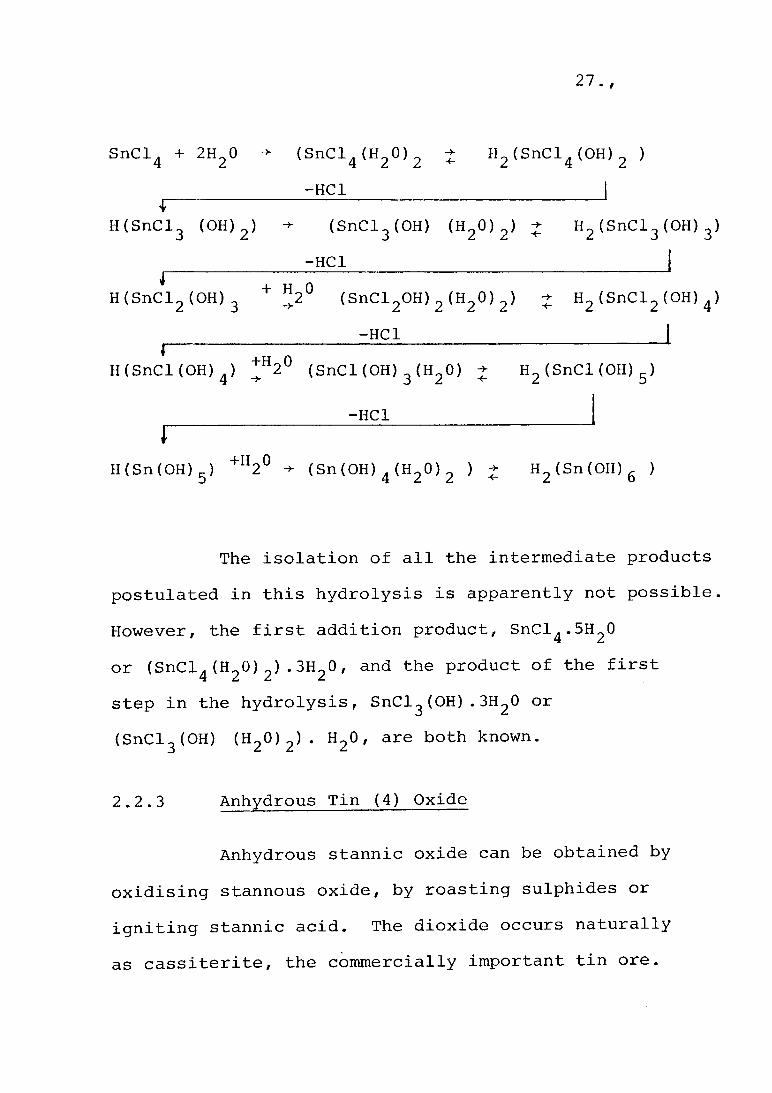
27 • /
SnCl4 + 2H 0 (SnCl (HO)2 J H2 (SnCl. (OH) 2 )_____________ -HC1________________________ 1
■ fH(SnCl3 (OH)2) (SnCl3(OH) (H20) 2) J H2 (SnCl3 (OH) 3)
-HC1 |* + H 0H(SnCl2(OH)3 "2 (SnCl2OH)2 (H20)2) j H2 (SnCl2(OH)4>
—HC1 |I------------------------------------------------H(SnCl(OH).) *H2° (SnCl(OH).(H„0) t H0(SnCl(OH)_)
—HC1f — 1
H (Sn (OH) 5> +H2° (Sn(OH) 4 (H20) 2 ) + H2(Sn(OH)6 )
The isolation of all the intermediate products postulated in this hydrolysis is apparently not possible. However, the first addition product, SnCl4.5H20 or (SnCl4 (H20)2).3H20, and the product of the first step in the hydrolysis, SnCl^(OH).3H20 or (SnCl3(OH) (H20)2). H20, are both known.
2.2.3 Anhydrous Tin (4) Oxide
Anhydrous stannic oxide can be obtained by oxidising stannous oxide, by roasting sulphides or igniting stannic acid. The dioxide occurs naturally as cassiterite, the commercially important tin ore.

28 • r
There appears to be only one form of SnC>2 although difficulties have been reported and other intermediate oxides such as Sn^O^ have been postulated, however, the evidence suggests that disproportionation was the source of the problem (Donaldson and Moser 1961). For example, when stannous oxide is heated in air disproportionation takes place yielding a mixture of tin and SnO^.
Tin (4) oxide has been found to have the rutile structure (Cotton and Wilkinson 1966); Fabrichnyi et al 1970 (figure 3).
Sn
FIGURE 3 Structure of Sn02 (a) elementary cell (b)environment of tin atom (Fabrichnyi et al 1970)
However, Anderson, Bos and Ogden (1971) have studied molecular tin (4) oxide in a krypton matrix and suggested that under these conditions, it is isostruct-
2 •ural with CO

29 • /
2.2.4 ImpuritiesThe presence of impurities affects the
characteristics of the stannic acid precipitate.The reasons for studying the effect of foreign anions and cations in the precipitate vary from deducing the formula of the various forms of the precipitate to the effect on quantitative measurement of tin concentration by gravimetric methods.
Iron is the major impurity given difficulties in analytical techniques involving the precipitation of tin (4). La Rosa et al (1956) referred to early investigators' reports that iron coprecipitates with metastannic acid. Difficulties were experienced with tin determination in alloys in which the iron content was above 0.25%. Lower tin results were obtained because of the increased solubility of the metastannic acid.The investigations of La Rosa et al were directed at the radioactive determination of coprecipitated iron and tin recoveries, by precipitation, at various levels of tin and iron with different nitric acid digestion techniques. Their work confirmed the dual phenomena of solubility and coprecipitation exerted by iron on metastannic acid. Hiroshi Nishida (1964) also investigated the coprecipitation phenomenon of ferric ions with metastannic acid at pH 2.5 and
30 • f
concluded that the phenomenon could be applied to the purification of iron contaminated water to a purity of < 0 . 2 yg 1 1 iron.
The coprecipitation of other elements are also recognised and Mg (Korenman 1963), Sb, As, P (Willard and Diehl 1956) , Pb (Vogel 1951; Willard and Diehl 1956) , Cu (La Rosa et al 1956; Vogel 1951, Willard and Diehl 1956), Zn (La Rosa et al 1956; Vogel 1951) and Ni (Vogel 1951), have been specified in the literature. La Rosa et al (1956) demonstrated and measured the presence of Zn and Cu coprecipitated with their metastannic acid precipitations.
The absorption of impurities is influenced by the method of preparation. Stannic acid precipitated from alkaline solutions absorbs basic dyes whilst that precipitated from acid solutions absorbs acid dyes (Mantell 1949).
31.
3.0 PRECIPITATION AND SOLUBILITY - REVIEW OFRELEVANT CONCEPTS
The processes of precipitation and solution are opposing features of the same phenomenon. Both processes are important to this investigation. The formation of an insoluble substance in the first instance from the tin in solution followed by an intermediate concentration step and the subsequent resolution in an alkaline aqueous medium are the essential components of the process.
3.1 Precipitation
The formation of a new condensed phase as in the precipitation of a solute from a solvent involves a basic series of events. In general, with participating foreign surfaces absent, the first small clusters of molecules form and these grow by accretion to the point of becoming recognisable crystallites which may finally coalesce or grow to yield substantial quantities of a new phase. It has also been observed that the concentration of the solute must exceed the equilibrium solubility of the compound by a significant amount, referred to as supersaturation, before spontaneous precipitation takes place.
The obstacle to the formation of a new phase is associated with the extra surface energy of small clusters which makes their formation difficult. Such
32. ,
clusters, if small, have been called " erms", and if somewhat larger and recognisable as precursor of the new phase, have been called "nuclei".Adamson (1960) presents a thermodynamic treatment of the critical features and thermodynamic concepts in nucleation. The treatment commences with the situation where bubbles are forming in a liquid phase and then goes on to treat the more complex solid precipitation conditions.
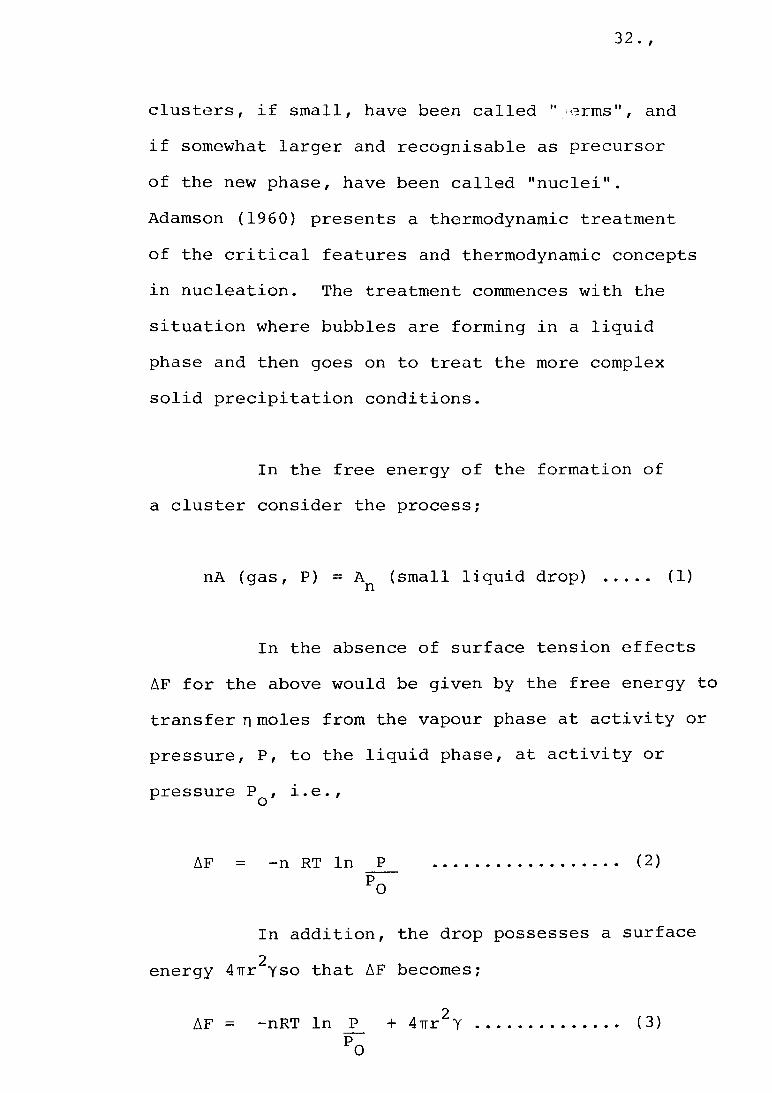
In the free energy of the formation of a cluster consider the process;
nA (gas, P) = An (small liquid drop) .... (1)
In the absence of surface tension effects AF for the above would be given by the free energy to transfer n moles from the vapour phase at activity or pressure, P, to the liquid phase, at activity or pressure Pq , i.e.,
AF -n RT In P ( 2 )PO
In addition, the drop possesses a surface 2energy 4Trr yso that AF becomes;
AF = -nRT In J?_ + 47rr Ypo
(3)

33. ,
This may be rewritten with x denoting Pand the molar volume is M where p is liquid density.
P
3 2AF = - 4tt r (p) RT In x + 47rr Y........... (4)3 M
The two terms of this expression depend differently on r and are of opposite sign if x >1. Under these conditions AF as a function of r goes through a maximum.
The example quoted by Adamson is the case of water at 0°C with x = 4. The plot of AF as a function of r is given below (figure 4).
FIGURE 4 Plot of AF versus r (Adamson 1960)
In this case, one can estimate the sizeof the critical radius, r , by setting d ( AF) = 0,
c drcorresponding to the maximum in the curve. From Equation (4),

34 • r
RT In x 2YM = 2Y V ............. (5)
In this example = 8 A and the drop contains approx. 90 molecules of water. In other words, drops that form with a radius <8 A will be unstable and will break up whilst drops of radius >8 A will be capable of maintaining their identity and contribute to further processes.
This simplified argument for vapours may be developed further to embrace crystallisation.
By combining equations (4) and (5) anexpression for AF is obtained;^ max.
2AF max. = 4 7rr Y .............. (6 )c3
Or, by the elimination of r ,
AF max. = 16ttY^M^..... ........ (7)3p^ (RTln x)
This equation (7) may be applied to crystals,although a small change in the numerical factor, 16_ may
3result because of the non-spherical shape that may beinvolved.

35 • /
Developing the treatment further, in the style of Adamson, Becker and Doring (1935), it is possible to estimate the rate of information of nuclei of critical size. The simplifying device employed was to consider the case of a steady state situation such that the average number of nuclei of any given size was a constant, in time, although different from case to case. By balancing evaporation and condensation rates, the flux, I, the rate of formation of nuclei containing nmolecules from these containing (n -1) molecules, was obtained. A qualitative argument along the line follows from the consideration that the flux, I, is taken to be the same for any size nucleus and that it is related to the rate of formation of a cluster of two molecules,i.e., to Z, the gas kinetic collision frequency
-3 -1(collisions cm sec ).
For the steady state Z should also give the flux of critical nuclei except that the positive free energy of their formation amounts to a free energy of activation. If one modifies the rate Z by the term e’"AFmax-/RT then an approximate value for I results.
I * Ze-AFmax/RT ( 8)

36 • r
The full expression for I is obtained by substituting into (8 ) the expression for ^Fmax and the gas kinetic theory expression for Z.
I = 2n2 a2 (ttRT/M) exp |-167Ty3 M 2 /3p2 (RT In x) 2 | (1/RT).............. (9)
where a is the collision cross-section and n the number3 . . •of molecules of vapour per cm . Since Z is approximately
? 3 210 P , where P is given in millimetres of mercury (9) , can be simplified to;
1 = 102 3 P2 exp | -17.5 V 2 y 2 /T3(ln x)2 | in nuclei cm 3sec 1
(10)
Returning again to the simple example of water at 0°C— —3 -1 - 2and taking V as 20 cm mole , y as 72 ergs cm and PQ
as 4 . 6 mm, then equation (1 0 ) becomes;
I = 2 x 1 0 2 4 x2 exp |-118/(ln x)2 |..... (1 1 )
The change in I with x is illustrated by the data in table 2 , shown below;

37 • /
Table 2.
X -3 -1I nuclei/cm sec
1 . 0 0
5 6 8 0i—1 •rH
1 0
2 3 61.5 1 0
8 2o•
CM
1 0
1 7U> • o 1 0
3.5
001o 1—
1
XCM
4.0 0.153LO• 1 0
The table demonstrates how rapidly I increases with x and it is generally sufficient to define the critical ^upersaturation pressure such that In I is some arbitrary value such as unity. If this is done, equation (10) takes the form?
In x = a T ^ 2 .............. (12)
For a condensed phase, usually a melt, equation (8 ) may be modified in the frequency factor, instead of free collisions between vapour molecules, one now has a closely packed liquid phase. The rate of accretion of clusters is therefore related to the diffusion process.
38 . ,
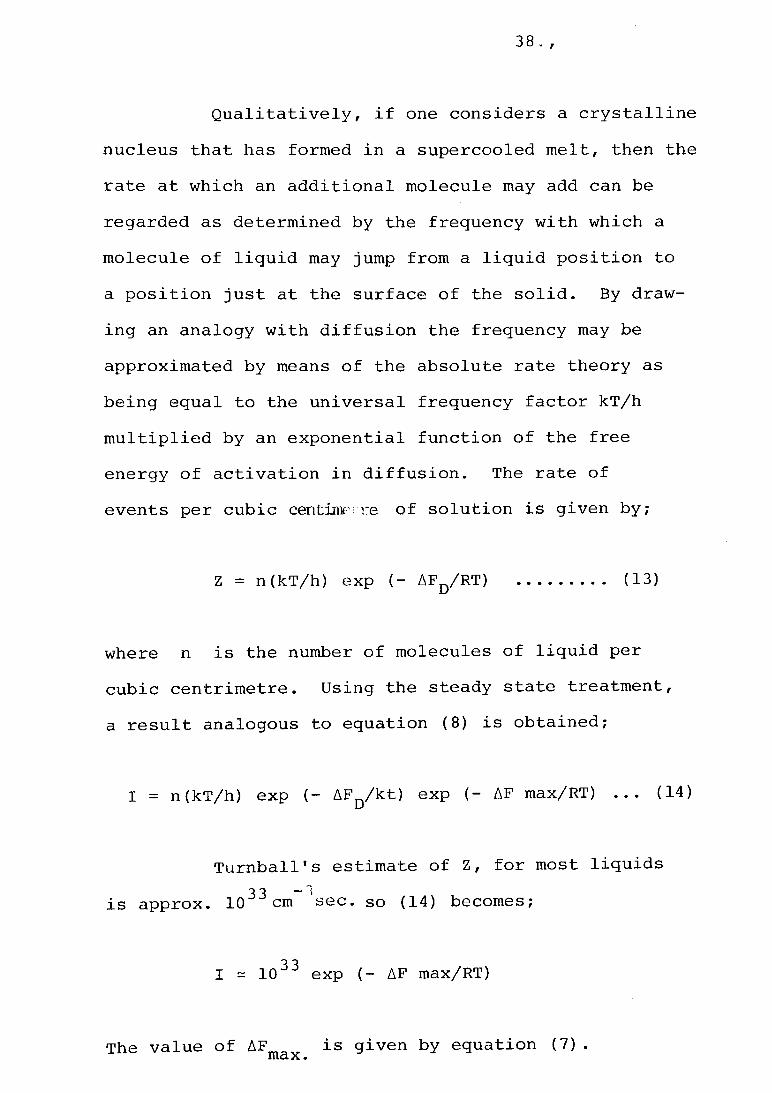
Qualitatively, if one considers a crystalline nucleus that has formed in a supercooled melt, then the rate at which an additional molecule may add can be regarded as determined by the frequency with which a molecule of liquid may jump from a liquid position to a position just at the surface of the solid. By drawing an analogy with diffusion the frequency may be approximated by means of the absolute rate theory as being equal to the universal frequency factor kT/h multiplied by an exponential function of the free energy of activation in diffusion. The rate of events per cubic centimetre of solution is given by;
Z = n (kT/h) exp (- AFD/RT) ........ (13)
where n is the number of molecules of liquid per cubic centrimetre. Using the steady state treatment, a result analogous to equation (8 ) is obtained;
I = n(kT/h) exp (- AF /kt) exp (- AF max/RT) ... (14)
Turnball's estimate of Z, for most liquids is approx. 103 3 cm Jsec. so (14) becomes;
I - 103 3 exp (- AF max/RT)
The value of AF is given by equation (7).
39. ,
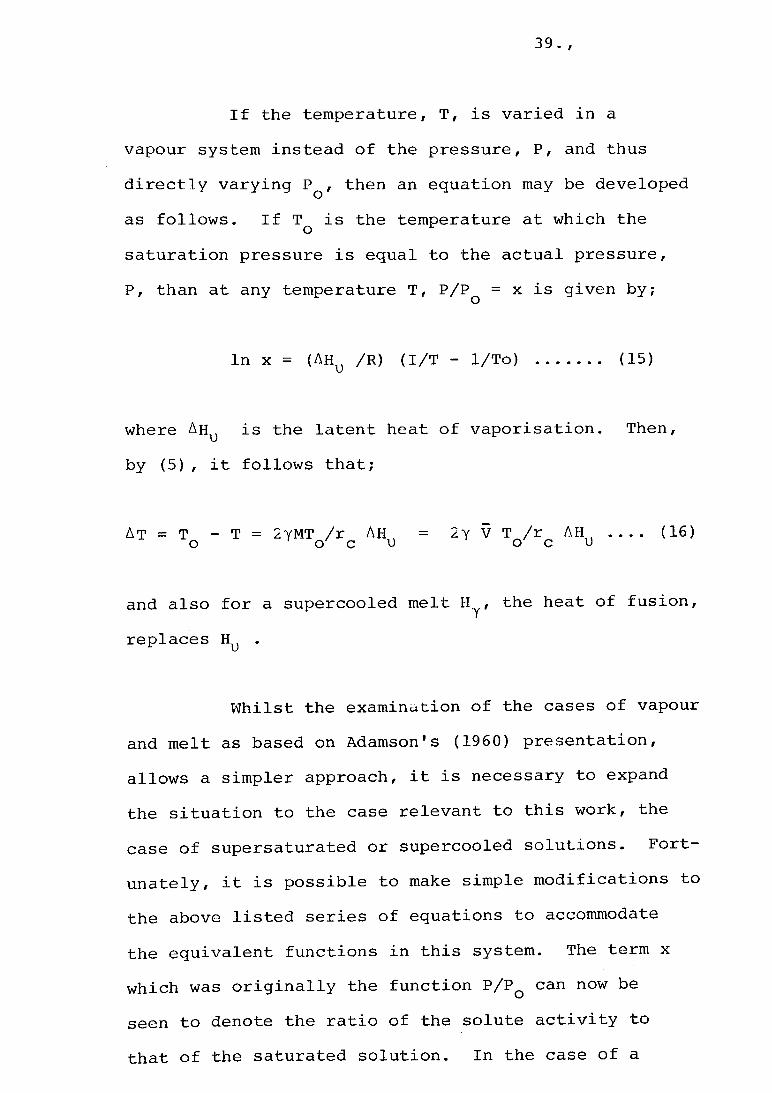
If the temperature, T, is varied in a vapour system instead of the pressure, P, and thus directly varying P , then an equation may be developed as follows. If Tq is the temperature at which the saturation pressure is equal to the actual pressure,P, than at any temperature T, P/PQ = x is given by;
In x = (AHu /R) (I/T - 1/To) ...... (15)
where Ahu is the latent heat of vaporisation. Then, by (5), it follows that;
AT = T - T = 2YMT /r Ah = 2y V T /r AH .... (16)o o c u o c u
and also for a supercooled melt H^, the heat of fusion, replaces Hu .
Whilst the examination of the cases of vapour and melt as based on Adamson's (1960) presentation, allows a simpler approach, it is necessary to expand the situation to the case relevant to this work, the case of supersaturated or supercooled solutions. Fortunately, it is possible to make simple modifications to the above listed series of equations to accommodate the equivalent functions in this system. The term x which was originally the function P/PQ can now be seen to denote the ratio of the solute activity to that of the saturated solution. In the case of a

40 • /
non-electrolyte x = S/Sq , where S is the concentration and in the case of an electrolyte,
RT In S/SQ = 2Y Vr - q 2 V / 8 TTDr4 ..... (17)
The molar heat of solution, H , substitutes for H .s u
Whilst the above series of qualitative arguments for the nucleation process provide a demonstration of conceptual relationships involved in nucleation processes, experimental support for them is not as clear as one might expect for precipitation reactions due in part to the experimental difficulty of ensuring no heterogeneous seeding.
The concept of critical radius for a stable nucleus is an important one and several of the key equations will be shown later to be linked to the solubilising process.
The formation of stable nuclei is followed by particle growth. The growth process, as with the nucleation process, decreases the concentration of the solute and a competition will exist in the system between the two processes.

41. ,
An empirical law, von Weimarn's law, has been used to describe the relationship.
1 - k As ..................... (18)d So
where d is a measure of particle size.
If rapid nucleation occurs then a large number of nuclei form before supersaturation is relieved with the result that the final crystal size will be small. This relationship is utilised frequently in controlling the form of precipitates especially in analytical work.
The actual mechanism by which growth occurs has been studied by many workers and the mechanisms for particular crystal systems have been elucidated which are usually based on the deposition of molecules along dislocations or defects in a crystal surface. This particular aspect of growth phenomenon will not be explored further here except to point out that the line dividing the nucleation and growth processes is not necessarily distinct in that the growth process may be considered as a continuous nucleation of molecules on a pre-existing surface or defect.
• r42
Whilst the formation of primary particles or crystallites, controlled in size and number, by the rate of nucléation and the concentration of the relevant species, may be seen as a completed process thermodynamic considerations indicate otherwise. In a two phase system with a positive interfacial tension the free energy decreases when the surface diminishes, at constant pressure and temperature. The ultimate fate of a finely dispersed solid precipitate, it follows, would be a single large particle suspended in the solution. A number of processes can operate to attempt to achieve this ultimate result. These processes are variously grouped under terms such as "ripening" or "ageing". Within these general terms are a number of mechanisms described as Ostwald ripening, coagulation, recxystallisation, aggregation and flocculation. It should be noted, at this point, that although ageing processes often occur in the latter stages of precipitation, it is not necessarily confined to this tertiary role and can in fact be involved in earlier parts of the process.
Bye and Sing (1973) discussed the ageing of flocculated hydrous oxides. They took ageing to mean all irreversible structural and textural changes which occur after flocculation or gelation. Three distinct mechanisms have been identified;

43. ,
(a) condensation polymerisation,(b) aggregation cementation, and,(c) recrystallisation.
Processes (b) and (c) lead to a decrease in surface area, whereas process (a) may involve the fracture of particles or aggregates and consequently an increase in internal surface area. These processes are stated, by Bye and Sing to have been encountered in detailed studies of the ageing of various precipitated hydrous aluminas and chromia. They stress the fact that water plays a key role in the ageing of these gels and precipitates. At room temperature water helps to stabilise the primary particles and its partial removal tends to accelerate processes(a) and (b). Changes in the nature of the dispersion medium influence the rate of each ageing process and therefore provide additional evidence for the mechanisms proposed. At temperatures above 100°C residual water always promotes additional ageing.
Jirgensen and Straumanis (1962) state that the chief factor which controls ageing is the Brownian movement in the case of colloidal particles. Its intensity depends on the temperature and consequently the rate of ageing must increase with increasing temperature.

44 • r
The ageing of some colloids depends on the solubility of the dispersed phase in the dispersion medium. For example, colloidal silver chloride spontaneously becomes coarser more rapidly than silver bromide. Because of the relatively greater solubility, the small AgCl particles dissolve and the substance crystallises out on the larger particles. This process is slower with AgBr because of its lower solubility. This is recrystallisation ageing as referred to previously.
Other factors that govern the nature of the precipitate are the impurities. Contamination by impurities from unsaturated solutions is stated to be coprecipitation by Freiser and Fernando (1963). Coprecipitation is therefore distinguished from the introduction of impurities by simultaneous precipitation, or in other words, when for each of the substances precipitated, the ion product has exceeded the solubility product constant.
C o p r e c i p i t a t i o n can o c c u r th r o u g h three
g e n e r a l m e c h a n i s m s ;
(a) absorption,(b) solid solution formation and(c) ion entrapment.

• r45
Mechanism (a) is the most common process and is probably the most important. The solid solution mechanism involves circumstances where the contaminating salt crystallises with the same lattice structure and with similar lattice constants as the precipitate. Such conditions are conducive to the formation of solid solutions. For example, AgBr and AgCl form solid solutions.
Foreign ion entrapment is a non-equilibrium process involving the rapid growth of precipitates around absorbed ions.
Adsorption refers to the contamination of the surface of a precipitate by foreign ions. This may occur either by molecular adsorption or by ion exchange adsorption. Typically, adsorption can be described by the empirical Freundlich equation,
1
x = k c n .......................................... (19)m
where x = mass of salt adsorbedm = mass of precipitate C = concentration of salt in solution
k and n constants

46. ,
The degree of adsorption is dependent on the condition of the adsorbing surface and the high surface area of colloidal particles or freshly prepared flocculating precipitates are admirably suited to adsorption. Different ions are known to be not adsorbed equally by adsorbents and ion exchangers and out of various investigations conducted in this area have come rules such as the Fajans-Paneth rule, which observes that ions forming slightly soluble compounds with the absorbent will generally be adsorbed better than most forming more soluble compounds.This is only an approximation as the parallel between solubility and adsorbability is not quantitative.
Many experiments on the adsorption of cations and anions have given rise to ranked sequences. Jirgensen and Straumanis (1962) quote several series including that of Buzagh. From the adsorption of chlorides, bromides, iodides and nitrates on activated charcoal or on blood charcoal, the series, in order of descending strength of adsorption is;
H+ > ..... Ba++ > Sr++ > Ca++ > Mg++ > Rb+> K+> Na+

47 • /
The series of anions was obtained, with the same cation,
OH > ........ CNS > I > Br > Cl > ^SC>4
In the cationic series H+ was the most strongly adsorbed followed by the multivalent ions and finally the univalent ions with gradually decreasing ionic radius.In the anionic series it is the reverse. The univalent anions with the largest ionic radius are absorbed most strongly, then follow the ions with a smaller radius and finally the multivalent anions. Such sequences are useful but ranking can be upset with specific absorbents and for precise ordering the required system must be stud ied.
3.2 Solubility
The solubility of a solid in a solution is dependent upon the difference between the energy required to divorce the ions or molecules from the solid's molecular assembly or crystal lattice and the energy liberated by the solvation and/or formation of new ionic species or molecules.
The solubility of a substance at any given temperature is defined as the concentration of the substance in a saturated solution. An equilibrium

48. ,
exists between the solution and the undissolved solid in contact with the solution. This equilibrium is dynamic in that solution and deposition processes are occurring simultaneously, and it represents a balance point between precipitation or crystallisation on one hand and solution processes on the other.
The solubility product is a usefulrelationship in discussing the solubility ofs p a r i n g l y soluble substances. Tak i n g the example
-5of BaSO^, which has a solubility of 1 x 10 mol 1 in water. The solution process can be written as;
(Ba S04)soli(J Ba++ + SO
for which the equilibrium constant can be written as;
K = aBa++ x aS04 ......... (20)aBaS04
If the activity of the solid is taken as unity, then the expression is;
K = aB a ++ x =SO4(21)
49..,
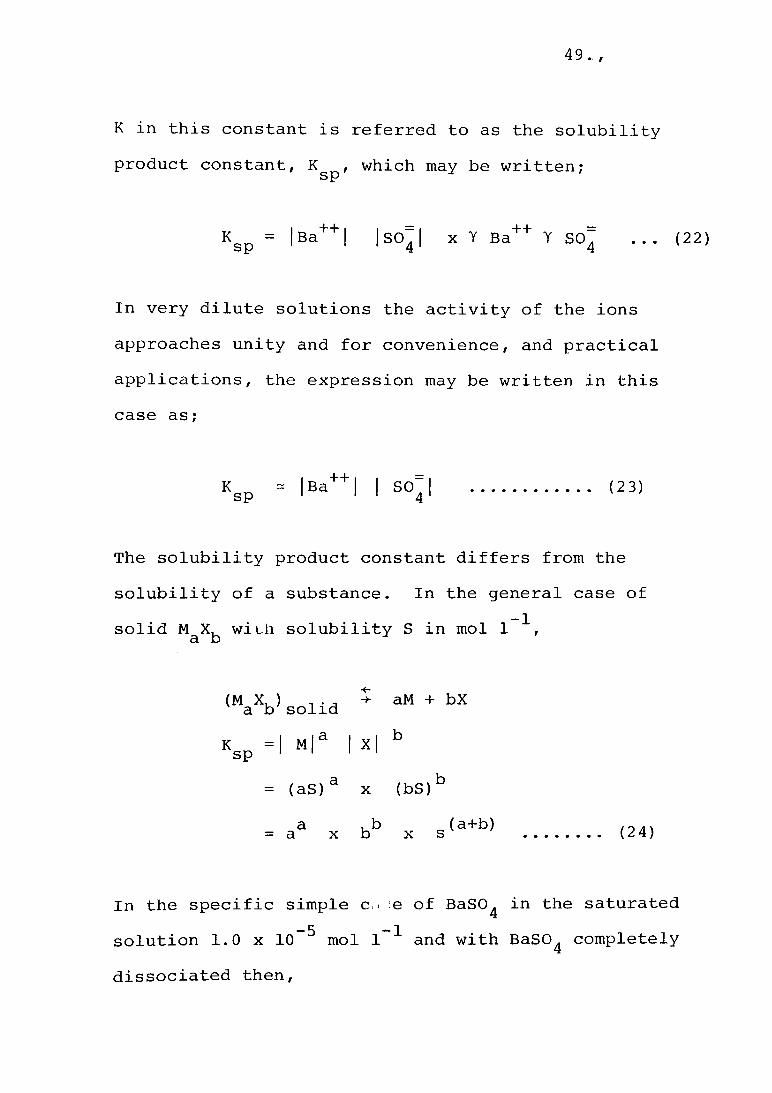
K in this constant is referred to as the solubilityproduct constant, K , which may be written;sp
Ksp = IBa++| |S0=| x Y Ba++ Y SO^ ... (22)
In very dilute solutions the activity of the ions approaches unity and for convenience, and practical applications, the expression may be written in this case as;
K = IBa++I I SO sp 1 1 1 4(23)
The solubility product constant differs from the solubility of a substance. In the general case of solid M Xj with solubility S in mol 1
(MX.) , . -, +a b solid
K =| M|a | X sp 1 1 1
= (aS)a x
aM + bX b
(bS)ba= a x x s(a+b) (24)
In the specific simple c.> e of BaSO^ in the saturated-5 -1solution 1.0 x 10 mol 1 and with BaSO^ completely
dissociated then,

50 • /
K 1 x 1 0-5 x 1 x 1 0
-5sp1 x 1 0
-10
These expressions are simple and whilst the situation is often more involved by way of complex formation and common ion effects, they provide the basis for understanding solubility. The common ion effect will be readily apparent even in this simple equation. The raising of the concentration of one of the ions involved in the K expression (e.g., equation (23) will result in precipitation at lowerconcentrations of the other species, if K is trulyspa constant.
adequately describes simple systems, several other factors should be borne in mind when attempting to resolve discrepancies between theory and practice.In the first place, it should be understood that the existence of impurities in the solid phase can alter the true value of K by straining the crystal lattice or other like mechanisms. Kinetics should not be involved but for very slow processes, it can have the effect of distorting the equilibrium values.
Whilst the thermodynamic property, Ksp

51 • /
Another factor which has attracted the interest of a number of investigators (van Zeggaren and Benson 1957, Freiser and Fernando 1963, Boldyrev and Avvakumov 1971) is the effect of particle size.One qualitative view, expressed by Freiser and Fernando is based on the fact that with large particles the contribution of surface energy is small but as the size of the particles become very small, then the surface energy per mole of solid must be taken into account. The conclusion reached is that the smaller the particle size the greater the solubility.
Adamson reviews the development of an expression related to the Kelvin equation which was central to the line of reasoning developed in the previous section on the opposing process of precipitation and which links particle size and solubility. For an isotropic, spherical particle where V is the molar volume and a denotes the activity of the species, as measured for example by the solubility of a substance, then a form of the Kelvin equation can be written as;
a _RT In a = 2yV/r ............... (25)o
The q u a n t i t y y is us e d to denote surface

• r52
tension, for the term surface free energy onlyapplies to an equilibrium solid surface. For thecase of a sparingly soluble salt M with solu-a bbility, S, then,
O = (M) (X)^ + I r Ta b
(26)
and the activity of the solution is given by;
a = (M)a+ (X)b S (a+ + b">/(a+)a+(X-)x-(27)
If activity coefficients are close to unity, then on substituting in (25) then,
RT (a+ + b”) In S = 2y V/r ___ (28)So
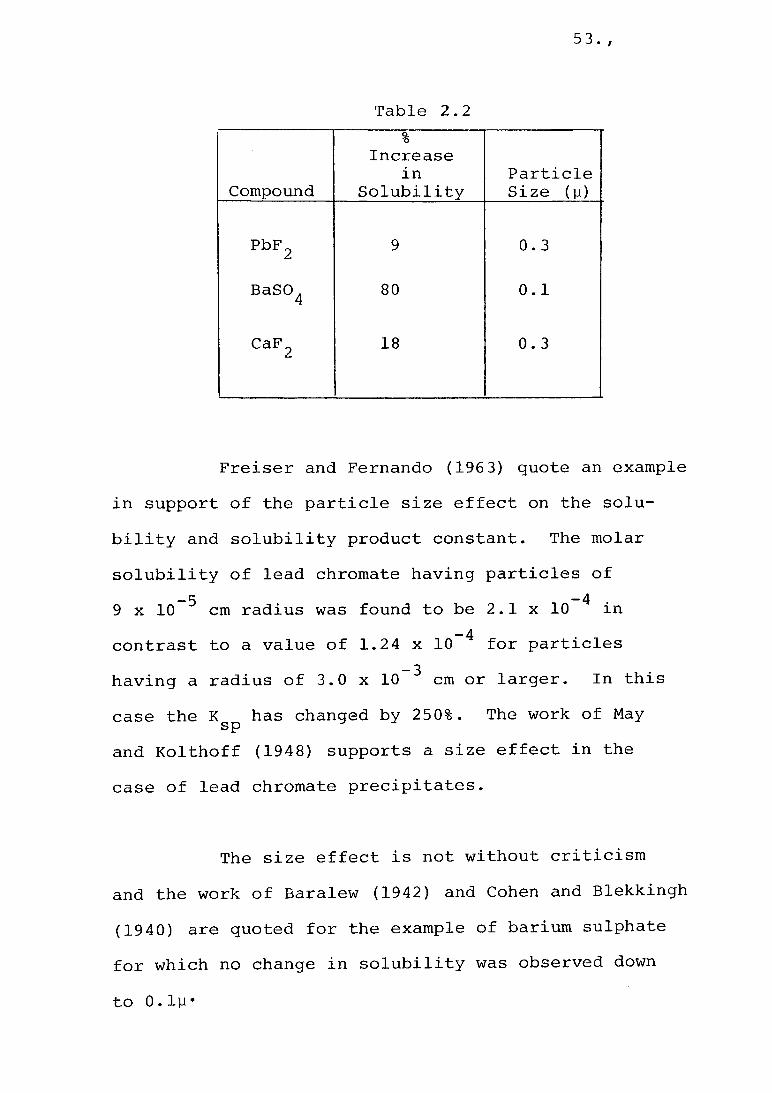
Dundon and Mack (1923) utilised the Kelvin equation and supported the effect of particle size on the increase in solubility. The abbreviated list in Table 2.2demonstrates the magnitude of the effect with very small particles compared with the normal equilibrium value.
53. ,
Table 2.2
Compound
%Increase
inSolubility
Particle Size (v0
Pbp 2 9 0.3
BaSO . 4 80 0 . 1
CaFn 18 0.32
Freiser and Fernando (1963) quote an example in support of the particle size effect on the solubility and solubility product constant. The molarsolubility of lead chromate having particles of
-5 -4 .9 x 1 0 cm radius was found to be 2 . 1 x 1 0 m
-4 •contrast to a value of 1.24 x 10 for particles_ 3 .having a radius of 3.0 x 10 cm or larger. In this
case the K has changed by 250%. The work of May spand Kolthoff (1948) supports a size effect in the case of lead chromate precipitates.
The size effect is not without criticism and the work of Baralew (1942) and Cohen and Blekkingh (1940) are quoted for the example of barium sulphate for which no change in solubility was observed downto O.ly
54 • /
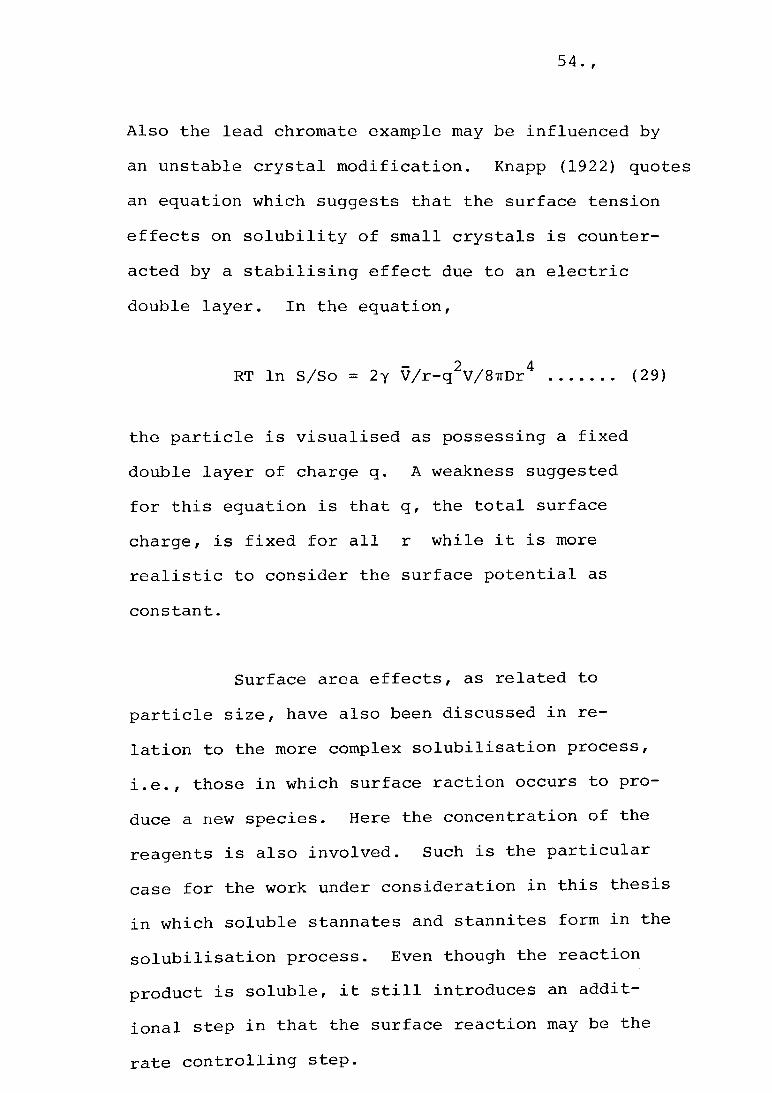
Also the lead chromate example may be influenced by an unstable crystal modification. Knapp (1922) quotes an equation which suggests that the surface tension effects on solubility of small crystals is counteracted by a stabilising effect due to an electric double layer. In the equation,
RT In S/So = 2y V/r-q^V/8TTDr^ ........ (29)
the particle is visualised as possessing a fixed
double layer of charge q. A weakness suggested
for this equation is that q, the total surface
charge, is fixed for all r while it is more
realistic to consider the surface potential as
constant.
Surface area effects, as related to
particle size, have also been discussed in re
lation to the more complex solubilisation process,
i.e., those in w h i c h surface raction occurs to p r o
duce a new species. Here the concentration of the
reagents is also involved. Such is the particular
case for the work under consideration in this thesis
in w hich soluble stannates and stannites form in the
solubilisation process. Even though the reaction
p r oduct is soluble, it still introduces an a ddit
ional step in that the surface reaction may be the
rate controlling step.
55 • r
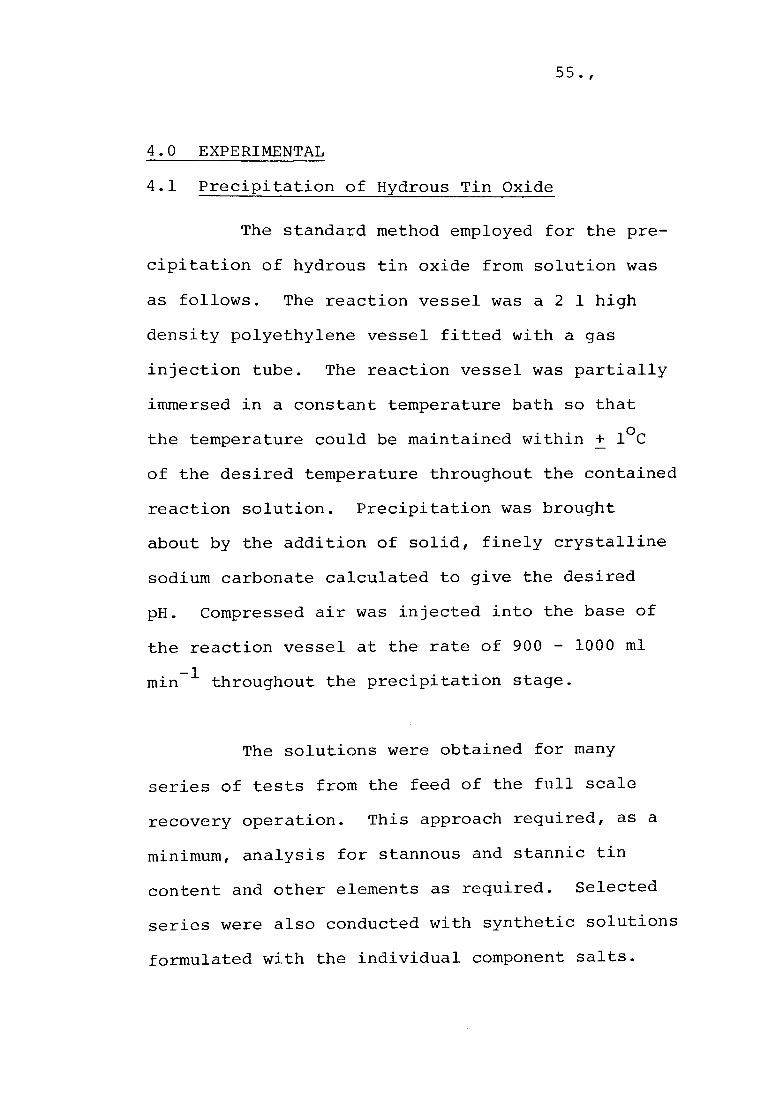
4.0 EXPERIMENTAL4.1 Precipitation of Hydrous Tin Oxide
The standard method employed for the precipitation of hydrous tin oxide from solution was as follows. The reaction vessel was a 2 1 high density polyethylene vessel fitted with a gas injection tube. The reaction vessel was partially immersed in a constant temperature bath so that the temperature could be maintained within + 1°C of the desired temperature throughout the contained reaction solution. Precipitation was brought about by the addition of solid, finely crystalline sodium carbonate calculated to give the desired pH. Compressed air was injected into the base of the reaction vessel at the rate of 900 - 1000 ml min- 1 throughout the precipitation stage.
The solutions were obtained for many
series of tests from the feed of the full scale
recovery operation. This approach required, as a
minimum, analysis for stannous and stannic tin
content and other elements as required. Selected
series were also conducted with synthetic solutions
formulated with the individual component salts.
56 • /
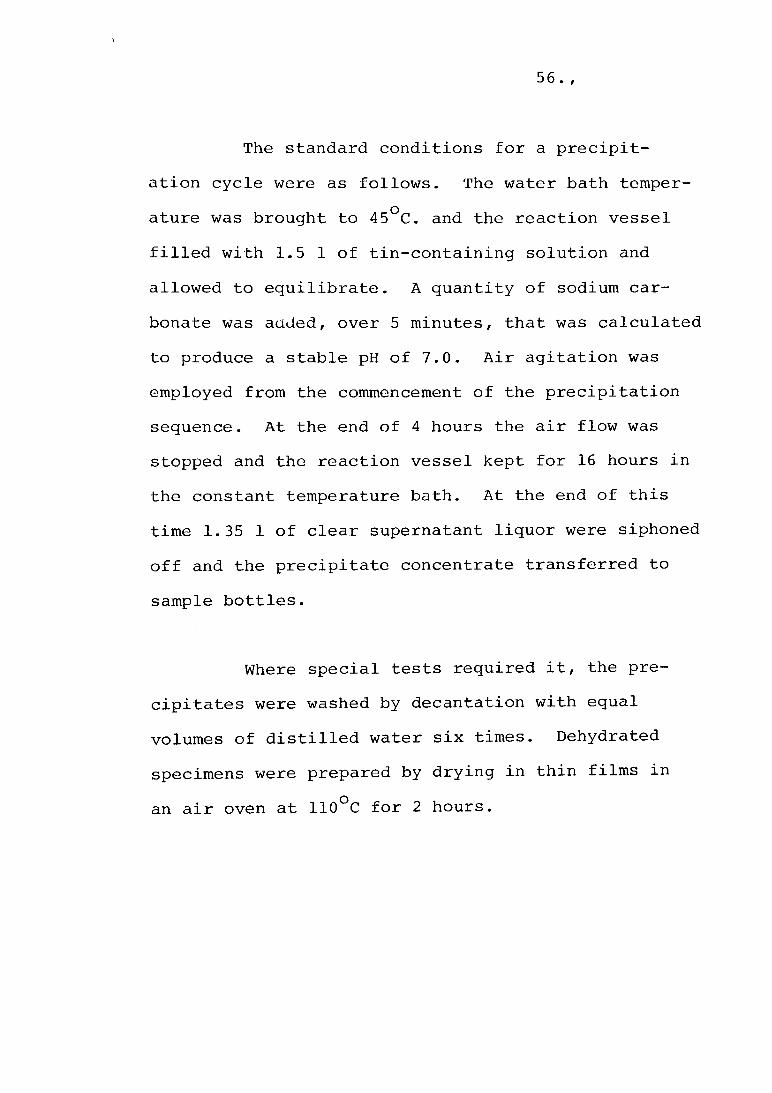
The standard conditions for a precipitation cycle were as follows. The water bath temperature was brought to 45°C. and the reaction vessel filled with 1.5 1 of tin-containing solution and allowed to equilibrate. A quantity of sodium carbonate was added, over 5 minutes, that was calculated to produce a stable pH of 7.0. Air agitation was employed from the commencement of the precipitation sequence. At the end of 4 hours the air flow was stopped and the reaction vessel kept for 16 hours in the constant temperature bath. At the end of this time 1 . 3 5 1 of clear supernatant liquor were siphoned off and the precipitate concentrate transferred to sample bottles.
Where special tests required it, the precipitates were washed by decantation with equal volumes of distilled water six times. Dehydrated specimens were prepared by drying in thin films in an air oven at 110°C for 2 hours.

57 • /
4.2 Determination of Tin Content
The determination of stannous, stannic and total tin was conducted volumetrically by methods similar to that described in the literature (Vogel 1951; Willard and Diehl 1956; Donaldson and Moser 1959). In the case of stannous tin aliquots were placed in dilute hydrochloric acid previously outgassed with carbon dioxide provided by reaction with a small quanity of calcium carbonate. The solutions were titrated to a starch end point with standardised solutions of potassium iodate. Total tin was determined by first reducing by boiling with nickel metal and proceeding as for stannous tin. The stannic component was determined by difference.
4.3 Solubility of Hydrous Tin Oxide in Alkali
The solubility of the precipitated hydrous tin oxides was determined by a simple method that had been employed to monitor the quality of the product of the full scale industrial operations and that had been proved to reflect the performance in the dissolution step of the industrial application.

58. ,
After carefully suspending the precipitate concentrate a 1 0 0 ml aliquot was drawn off rapidly and mixed with an equal volume of sodium hydroxide solution (200 g 1 "S and the mixture heated at 100°C for 3 minutes. From the vigorously stirred solution a 10 ml aliquot, A, was drawn off and placed in a flask. The remaining solution was filtered through a doubled 15 cm No. 40 Whatman filter paper. A 10 ml aliquot of the filtrate, B, was placed in a second flask. Both samples, A and B, were then treated identically. To each was added 20 ml of concentrated sulphuric acid, 50 ml of concentrated hydrochloric acid and then made up to 200 ml with distilled water. The contents were boiled for 30 minutes with nickel coil or shot to effect reduction of stannic tin and after cooling with Schiebler guards fitted the contents were titrated with standardised potassium iodate solution.
The alkaline solubility of the precipitate was expressed as a percentage based on the quantity of tin that had passed into solution compared with the total amount of tin available. The recovery, or alkaline solubility, can be expressed as,
recoverable tin = B Titration x 100A Titration
9,

59 • t
Tests in which the solution time was extended to 30 minutes did not render poorly soluble precipitates soluble.
Trace elements were determined by standard atomic absorption spectrometer techniques unless otherwise stated in the text.
4.4 pH Measurement
Several techniques were applied to pH determinations. A radiomater pH meter equiped with a glass electrode and colomel reference electrode were used to check the pH of dilute fluoride solutions but the bulk of the work relied on colorimetric pH techniques. A Taylor comparator was employed using bromophenol blue indicator for low pH values and methyl red for intermediate values. The alternative colour technique involved the use of multi-indicator strips.
4.5 Polyelectrolytes
Experiments involving the use of polyelectrolytes were performed with stock solutions no more than 3 days old. Stock solutions of solid polyelectrolytes, e.g., Magnafloc 351, were prepared by first wetting 0.5 g of polyelectrolyte

• r60
with 3 ml methanol followed by the addition of 97 ml of water with vigorous shaking. The solution was diluted further to 0.1 g 1 before use.
4.6 Microscopic and Instrument Examination
Precipitate particles were examined by two techniques; optical transmission microscopy and scanning electron microscopy. The optical work was performed by diluting the hydrous tin oxide concentrates to 3:1 and 20:1 with water before smearing on slides and examining at 100500 magnifications.
To prepare specimens for the scanning electron microscope the precipitates were washed by decantation to remove soluble salts and the suspensions spread in thin films on glass microscope slides to be dried in an air oven at 105 C for two hours. To examine the dehydrated specimens in the microscope,coating to prevent charging was required. Whilst the use of Philips antistatic aerosol spray reduced charging, it was necessary to gold coat for optimum resolution. Approximately 10 - 30 nm of gold was sputtered on to the particles in an evacuated chamber. The scanning electron

61. ,
microscopes utilised encompassed a unit located at the C.S.I.R.O. Wool Technology Division, Sydney, a JEOL JXA 50A unit at the University of Newcastle and an ISI MS7 at Australian Wire Industries Pty.Ltd., Newcastle.
Other techniques employed to provide additional data included;
(i) semi-quantitative spectrographic analysis,
(ii) transmission electron microscopy,(iii) electron diffraction(iv) infrared spectroscopy(v) electron probe microanalysis
5.0 RESULTS
5.1 Precipitate MorphologySedimentation is the basis of the concen
tration step in the treatment cycle. The object is to produce a precipitate that will adequately settle in a suitable period. The application of Stokes law can be used to describe the settling characteristics of particles provided adequate information is available on the properties of the system; particle size, density,

shape, density of the fluid etc., however, for hydrous metal oxides and hydroxides, it is difficult to obtain accurate values for some parameters, e.g., specific gravity.
Empirical results are often the best source of data on sedimentation. It had been found, by others, that low temperature precipitation yields fine, poor settling precipitates and a treatment of 4 hours at 45°C enabled settling in a 5.2 m high tank in 16 hours. Under these conditions the particles were sufficiently large to yield supernatant liquors containing 10 mg 1 total tin in laboratory trials and 40 - 80 mg 1 total tin in plant operations.
In striving to achieve good setting, it was suspected that unfavourable particle morphologies may influence the alkaline solubility.

63.
fig 5 Photomicrograph of normal precipitate (diluted 20:1)(xlOO)
fig 6 Photomicrograph of normal precipitate (diluted 3:1) (xlÖO)
fig 7 Photomicrograph of alkaline insoluble residue (diluted 3:1) (xlOO)
64 • /
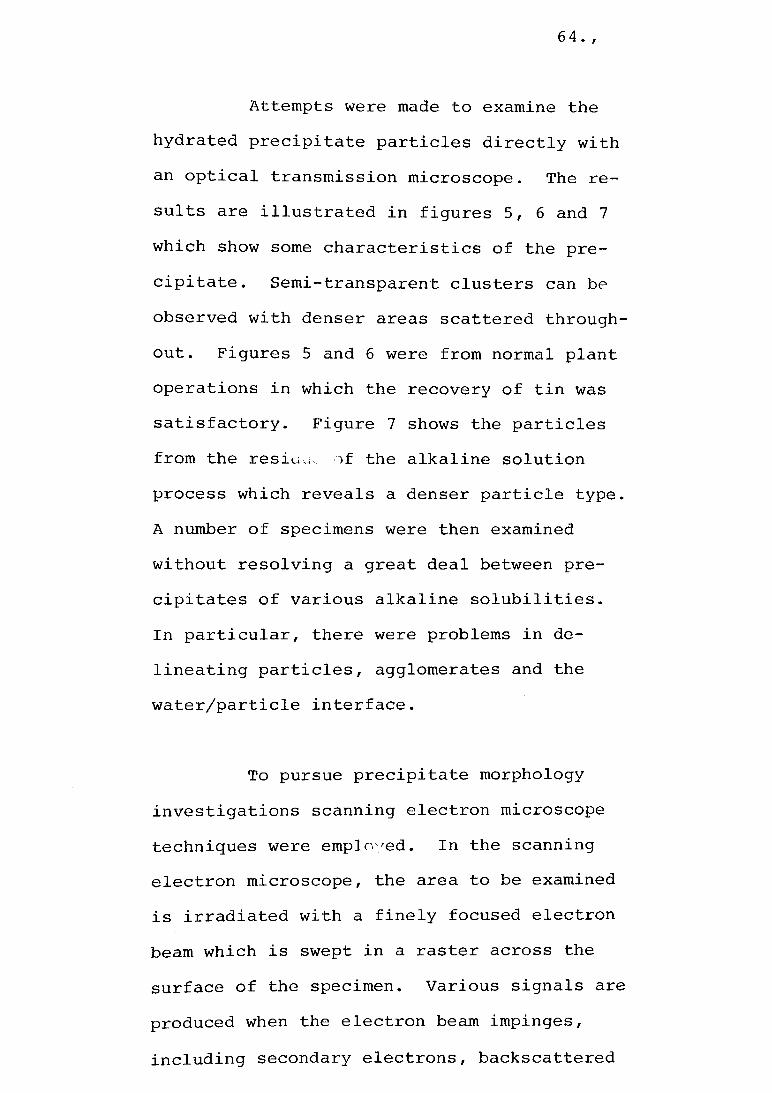
Attempts were made to examine the hydrated precipitate particles directly with an optical transmission microscope. The results are illustrated in figures 5, 6 and 7 which show some characteristics of the precipitate. Semi-transparent clusters can be observed with denser areas scattered throughout. Figures 5 and 6 were from normal plant operations in which the recovery of tin was satisfactory. Figure 7 shows the particles from the resiuu of the alkaline solution process which reveals a denser particle type. A number of specimens were then examined without resolving a great deal between precipitates of various alkaline solubilities.In particular, there were problems in delineating particles, agglomerates and the water/particle interface.
To pursue precipitate morphology investigations scanning electron microscope techniques were employed. In the scanning electron microscope, the area to be examined is irradiated with a finely focused electron beam which is swept in a raster across the surface of the specimen. Various signals are produced when the electron beam impinges, including secondary electrons, backscattered
65 • /
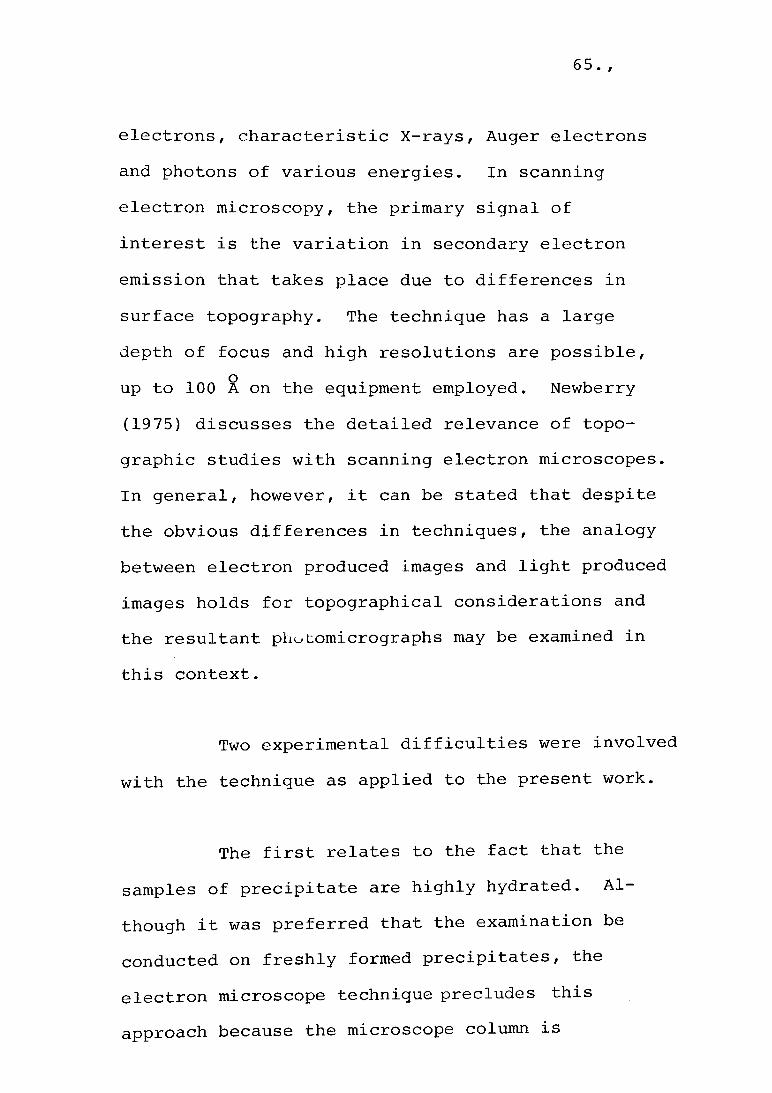
electrons, characteristic X-rays, Auger electronsand photons of various energies. In scanningelectron microscopy, the primary signal ofinterest is the variation in secondary electronemission that takes place due to differences insurface topography. The technique has a largedepth of focus and high resolutions are possible,
oup to 100 A on the equipment employed. Newberry (1975) discusses the detailed relevance of topographic studies with scanning electron microscopes. In general, however, it can be stated that despite the obvious differences in techniques, the analogy between electron produced images and light produced images holds for topographical considerations and the resultant photomicrographs may be examined in this context.
Two experimental difficulties were involved with the technique as applied to the present work.
The first relates to the fact that the samples of precipitate are highly hydrated. Although it was preferred that the examination be conducted on freshly formed precipitates, the electron microscope technique precludes this approach because the microscope column is

66 • /
operated under vacuum. One is confined to the examination of dehydrated secondary structures that might be expected to be a reflection of the original particle morphology.
The second experimental difficulty arises from the insulating properties of the dehydrated tin oxide specimens. When the electron beam strikes the surface, the adsorbed electrons can deflect the beam and cause distortion. Three techniques are available to overcome the problem. These are;
(i) coating with a conducting film,(ii) employing low accelerating potential,(iii) using single frame exposure tech
niques .
The first of these was used exclusively in this investigation as outlined in the Experimental section, 4.6.
It was observed during the examination of a series of dehydrated precipitates that certain characteristics of the morphology could be associated with alkaline solubility.
67 • r
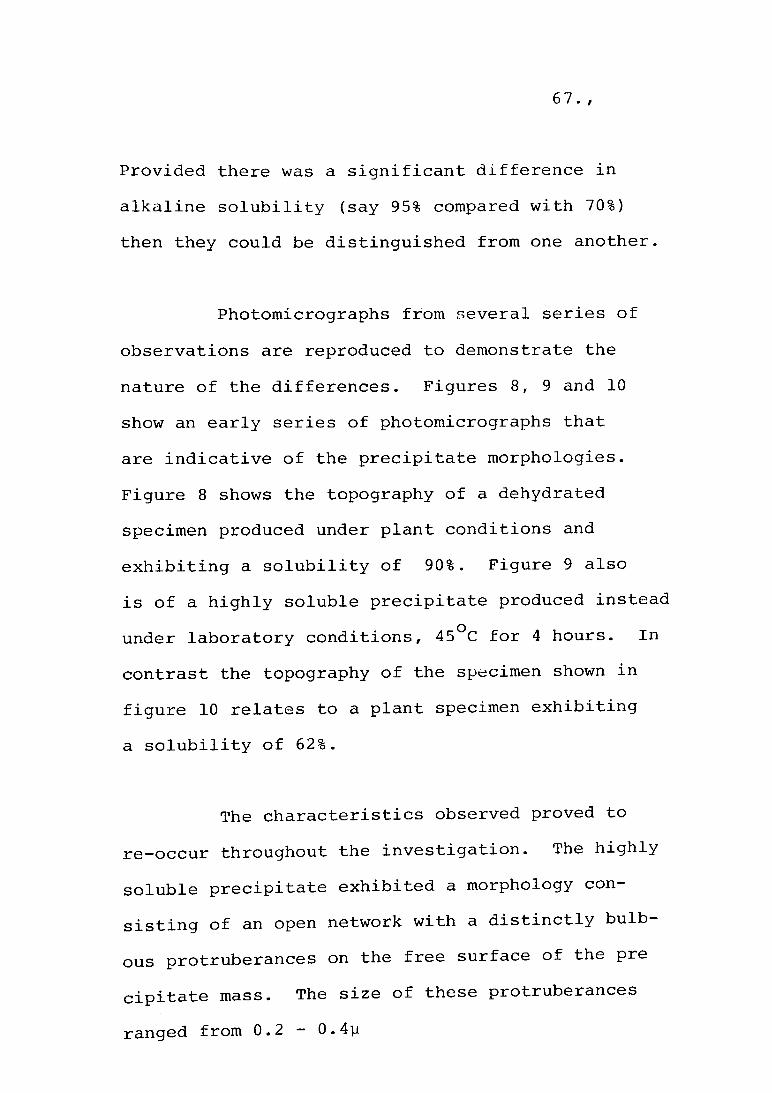
Provided there was a significant difference in alkaline solubility (say 95% compared with 70%) then they could be distinguished from one another.
Photomicrographs from several series of observations are reproduced to demonstrate the nature of the differences. Figures 8, 9 and 10 show an early series of photomicrographs that are indicative of the precipitate morphologies. Figure 8 shows the topography of a dehydrated specimen produced under plant conditions and exhibiting a solubility of 90%. Figure 9 also is of a highly soluble precipitate produced instead under laboratory conditions, 45°C for 4 hours. In contrast the topography of the specimen shown in figure 10 relates to a plant specimen exhibiting a solubility of 62%.
The characteristics observed proved to re-occur throughout the investigation. The highly soluble precipitate exhibited a morphology consisting of an open network with a distinctly bulbous protruberances on the free surface of the pre cipitate mass. The size of these protruberances ranged from 0.2 - 0.4y

68.
fig 8 SEM photograph of dehydrated precipitate Plant specimen. Alkaline solubility^ 90% (x 10,000)
fig 9 SEM photograph of dehydrated precipitate Precipitated at 45°C for 4 hours. Alkaline solubility>90% (xl0,000)
fig 10 SEM photograph of dehydrated precipitate Plant specimen. Alkaline solubility 62% (xl0,000)

69 • r
In contrast the poorly soluble precipitate exhibited a denser form, less open and the protruberances were less obvious.
Figures 11, 12, 13 and 14 are examples from subsequent series of experiments. The group Figure 11 and Figure 12 both represent precipitates that yielded good alkaline solubilities. The precipitate of Figure 11 was treated normally whereas the precipitate in Figure 12 was formed in the presence of 10 mg 1 of the polyelectrolyte, Magnafloc 351. Whilst both exhibit an open structure, the form of the protruberances in Figure 12 is more distinct which apparently is a reflection of the flocculating effect of the polyelectrolyte.
Figure 13 is a laboratory prepared specimen with a low alkaline solubility 51%. This particular specimen was produced with a high stannic to stannous tin ratio, 4:1, and the precipitation treatment consisted of 4 hours at 60°C. The dense structure previously referred to was in evidence.
Figure 14 shows the appearance of a precipitate whose alkaline solubility was reduced by the addition, during the precipitation stage, of seawater (0.25 by proportion).

70.
fig 11 SEM photograph of dehydrated precipitate. Laboratory trials. Precipitated at 45°C over 4 hours. Alkaline solubility 95% (xl0,000)
fig 12 SEM photograph ol dehydrated precipitate. Laboratory trials. Precipitated in the presence of 10 mg 1 Magnafloc 351 Alkaline solubility 97.5%(xlO,000)

71.
fig 13 SEM photograph of dehydrated precipitate. Laboratory trials. Alkaline solubility 51% (xl0,000)
fig 14 SEM photograph of dehydrated precipitate. Laboratory trials. Precipitated in the presence of seawater. Alkaline
solubility 75% (xlO,000)

72 • /
Whilst an alkaline solubility of 75% was recorded, the structure shows the open structure characteristic of more soluble precipitates. It appeared that the effect of impurities in reducing the solubility was not solely by way of a morphology change.
Experiments were also conducted to determine whether previous established particles from poorly soluble precipitates could induce a preferred growth pattern that yielded precipitate particles with poor alkaline solubility. Seeding with a precipitate exhibiting an alkaline solubility of 60% did not induce such behaviour in a precipitate prepared under standard precipitation conditions, 45°C for 4 hours. An alkaline solubility of 96.5% was recorded.
5.2 Stannous/Stannic Tin RatioInspection of groups of plant process data
did not in themselves suggest a strong relationship between the recovery efficiencies on solution and the ratio of stannous to stannic tin. A number of tests conducted in the 1.5 litre reaction vessel appeared to support this view. In these tests samples were taken from the system, checked for stannous and stannic tin concentration and then partially oxidised with hydrogen peroxide solution

73 • /
to provide various ratios with the same total tin concentration. The reactions were conducted under the standard conditions, i.e., reaction at 45°C for 4 hours followed by settling and decantation to 10% of original volume. The results of such a test are quoted in Table 3.
Table 3.
TestStannousTin_ig i
StannicTing i
o.'o
AlkalineSolubility
1 00•
o 0.4 95
2 0.6 0.6 96
3 0.3 0.9 95
With additional experimental work it became apparent that the work should be extended to cope with anomalies that had occurred when examining temperature effects.A series of synthetic solutions were prepared and again the ratio of stannous tin to stannic tin was varied by the addition of hydrogen peroxide solutions. The precipitation reactions were conducted at two temperatures, 45 C and 60°C, for four hours. The results of such a series is shown in table 4.
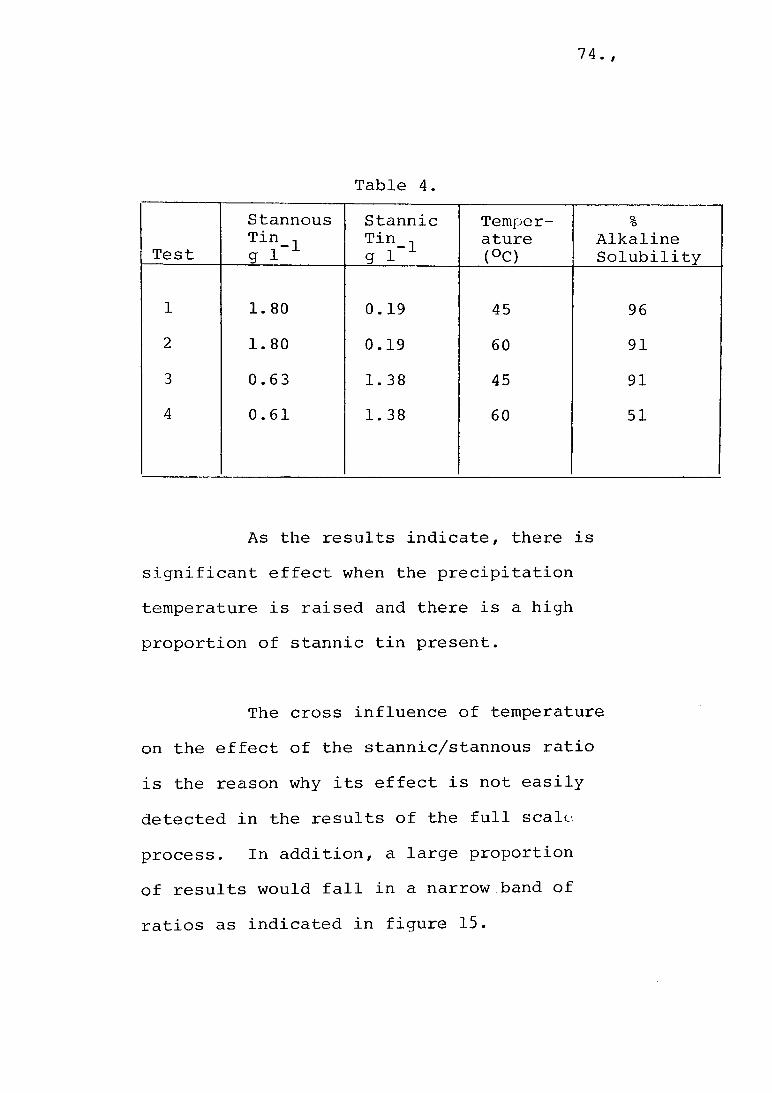
74 • I
Table 4.
TestStannousTin_ig i
StannicTi?-ig i
Temperature(°C)
o,x>AlkalineSolubility
1 1. 80 0.19 45 962 1.80 0.19 60 913 0.63 1.38 45 914 0.61 1.38 60 51
As the results indicate, there is significant effect when the precipitation temperature is raised and there is a high proportion of stannic tin present.
The cross influence of temperature on the effect of the stannic/stannous ratio is the reason why its effect is not easily detected in the results of the full scale process. In addition, a large proportion of results would fall in a narrow band of ratios as indicated in figure 15.

75 • /
1.0 „
CT)
O° R O * OO< l— CO
00
o
0 00 OOO <§> 0
O OO0° ®OOS
6
OO
_ i__________________________ L _____________________________I--------------------------------------------- ------------»
.5 1.0 1.5 2.0STANNOUS CONC. g I * 1
. 2 + 4 +FIGURE 15 Sn /Sn concentrations in plant rinse waters.
It is only when conditions vary such as during desludging of the electrolytic tinning line baths that there is a high risk of finding high stannic tin concentrations.

76. ,
It has been reported by Mantell (1949) and has been observed in experiments that the hydrated stannous oxide has a gelatinous character whereas hydrous stannic oxide precipitates as a white, voluminous, amorphous or colloidal precipitate (a form) or white amorphous particles (3 form) that appear to have a modifying effect on the solubility of the mixed hydrated tin oxide system.
The sensitivity of solutions containing high ratios of stannic tin to high neutralising temperatures is indicative of a transformation of a hydrous stannic oxide to the 3 form. Temperatures suggested for this transformation are stated by Collins and Wood (1923) to range from room temperature to boiling. At low temperatures the rate is slow Graham (186 4) prepared the 3 form by boiling the ot form in suspension.
The scope for influencing the ratio of the two oxidation states is limited inasmuch as the stannous component is concerned. Barring misadventure, the highest ratio of stannous tin to stannic tin occurs in the halogen plating electrolyte where the two states exist in a dynamic equilibrium of Sn 4:1

77.,
The formation of additional stannic tin through direct and indirect oxidation results in the formation of more insoluble sodium fluorostannate. The potential for increases in the stannic tin proportion is high. There is always some oxidation occurring when the waste solutions are being collected albeit small under normal circumstances. More important however, is the presence of the fluorostannate-containing sludge. This is capable of resolution in the diluted waste solution as the temperature is increased. This was in fact the basis of a process of extracting tin from the sludges suggested many years earlier by Nancarrow et al (1962) in which the fluorostannate sludges were leached with hot water.
The use of the hot waste solutions to supplement the tin values by adding sludges has proved to be unsuccessful in the past and in fact the suspended sludge encountered in the waste waters is considered undesirable and is usually removed by settling and removal by overflow. High temperatures for leaching are incompatible with the precipitationstage.

78 • /
It appears then that the preferredconditions for precipitation involve the highest
. 2 + 4 +possible ratio of Sn /Sn . Failure to achieve this requires closer attention to the temperature of the neutralising reaction.
5.3 Ageing
Ageing is often recognised as being involved in the modification of the physicochemical properties of precipitates and reference is made to the phenomenon and the various processes that can be grouped under this term elsewhere in the introductory sections. For the purposes of this investigation, ageing is taken to describe the changes, if any, that occur in the period between concentration of the precipitate into a slurry and the time when the precipitate is redissolved.
Ageing phenomena have been invoked to account for poor plant performance especially because of a particularly poor period in which low solubilities were experienced following the introduction of an intermediate holding tank.

79 • /
In order to test the effect of ageing on redissolution of the hydrous oxide, the following experiment was conducted.
Samples of hydrous tin oxides were removed by grab sampling from the base of the slurry holding tank and during total cleanout of the tank. Precise dating of these specimens was not possible but minimum periods could be confidently predicted.A sample of known age was also available from the precipitate treatment plant. The results obtained are recorded in table 5.
Table 5.
Test SpecimenEstimated
TimeLapse
auAlkalineSolubility
1 Specimen from holding tank 5 cm below settled sludge surface
> 14 days 89
2 Specimen from holding tank 5 cm below settled sludge surface.
> 14 days 92
3 Bottom of holding tank
> 30 days 91
4 Hydrate specimen ex precipitate treatment plant
22 days 93

80. ,
A controlled ageing test was conducted on a laboratory scale at two temperature levels for 56 days using a hydrous tin oxide slurry containing 1.5% w/v solids and exhibiting a solubility of 93%. Precipitated specimens, at pH 7.2, were sealed in 1 litre high density polyethylene bottles. A second group was prepared as above but an additional 10% neutralent over that required was added as solid sodium carbonate to provide an additional unfavourable environment. The bottles were sealed and stored, without stirring, at 20°C and 38°C. These temperatures were achieved in special controlled environment rooms.
The results on samples removed at 14,28 and 56 days are recorded in a graph, figure 16. Some fluctations were observed but overall the change was negligible. In addition, the modest excess of sodium carbonate did not cause problems.
One is forced to conclude that ageing, at least in the context of the storage of concentrated slurries at moderate temperatures and quiet conditions does not produce a marked change in the solubility.

81. ,
TIME weeks
FIGURE 16 Ageing of tin oxide precipitates at (1) 20°C/ (2) 20°C, excess Na2CO , (3) 38°C, (4) 38°C, excess Na2CC>3.
5.4 Impurity Effects
The effects of impurities were explored with experiments in which magnesium ions, calcium ions, seawater, iron ions and high iron concentration plating sludge were added to the hydrate reaction vessel. The most logical pattern is to record the series of tests that demonstrate the effects of seawater and the related effects of magnesium ions and calcium ions followed by the effects of the plating sludge and iron ions.

82. ,
5.4.1 Magnesium, Calcium and Seawater
The effect of iwo test series using the standard reaction sequence, 45°C for 4 hours, is recorded in table 6.
Table 6.
Series
ProportionofRinseWater
Proportionof
SeawaterAlkalineSolubilitya'O
1 1 0 98.50.9 0.1 91.50.8 0.2 86.50.7 0.3 79.00.5 0.5 73.0
2 1 0 99.20.9 0.1 93.10.8 0.2 86.00.7 0.3 79.00.5 0.5 76.1
Series 1 was conducted with a normal drag-out solution taken from the collection system of the electrolytic tinning operation. The relevant composition recorded for this solution was asfollows :

83
Sn2 + 1.6 g i- 1Sn4 + 0.6 g i- 1F~ 2.8 g i-1Cl“ 2.8 g
i—1 1Seawater was added to the drag-out
solution immediately prior to the precipitation in the relevant quantities to yield a constant volume in the reaction vessel.
Series 2 (see table 6) was conducted with a synthetic drag-out solution with the relevant composition:
Sn2 + 1.1 g i-1Sn4 + 0.5 g i-1Cl“ 2.2 g i-1F~ 2.0 g i-1
Admixtures with seawater were prepared as in Series 1.
Whilst these two series cover a wide range of dilution, other tests showed the trends were consistent over a shorter range with smaller increments. The curve in Figure 17 shows the change in the alkaline solubility of the tin component as a function of seawater dilution over the range 0 - 0.10, proportionally.

84. ,
i o o ro
FIGURE 17 Effect of seawater contamination on solubility.
The effects of seawater on the tin oxide precipitate was explored further by varying the pH, time and temperature of the precipitation reaction. The effect of pH over the range6.5 - 8.0 is shown in Table 7 for a seawater dilution of 0.1 by proportion.

85 • r
Table 7
PHAlkalineSolubility
O.*o
6.5 87.46.7 85.67.1 87.27.2 86.17.7 87.88.0 86.8
Initial Solution CompositionSn2 + 1.32 g l-1Sn4 + 0.62 g l-1Cl”
i—1 1i—1oo•
CM
f" 2.2 g 1 1Reacted at 45°C for 4 hours
An unusual pattern is revealed when a series of precipitation time/temperature sequences are compared as shown in Figure 18.

00
90
80
70
60
00
40
30
20
10
Time(hr)
Solution gl ^
Curve Temp. Sn2+ S n 4+
1 45 4 1.0 0.63
2 50 4 1.15 0.6
3 60 4 1.7 0.9
4 60 10 0.95 0.55
5 60 10 0.8 0.8
» ______«_______I_______ »_______ I-------- 1—. 1 .2 .3 A .5 .6PROPORTION OF SEAWATER
IGURE 18 Effect of seawater contamination,and temperature during precipitation on ility.
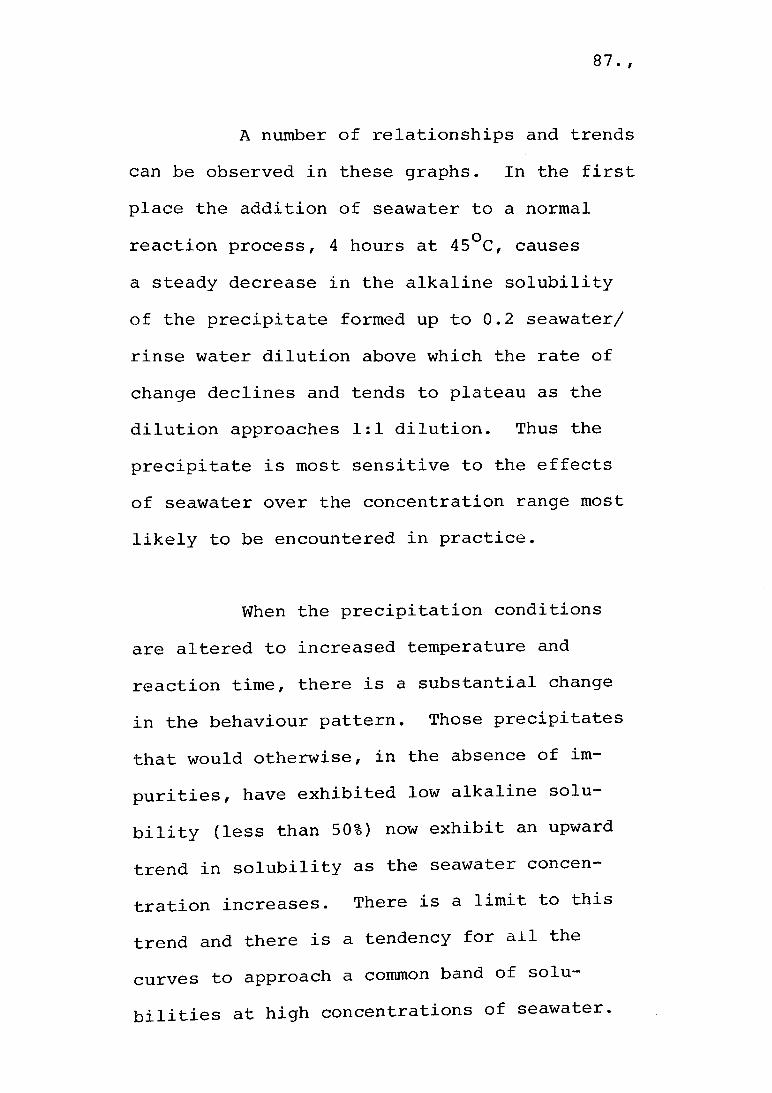
87. ,
A number of relationships and trends can be observed in these graphs. In the first place the addition of seawater to a normal reaction process, 4 hours at 45°C, causes a steady decrease in the alkaline solubility of the precipitate formed up to 0.2 seawater/ rinse water dilution above which the rate of change declines and tends to plateau as the dilution approaches 1:1 dilution. Thus the precipitate is most sensitive to the effects of seawater over the concentration range most likely to be encountered in practice.
When the precipitation conditions are altered to increased temperature and reaction time, there is a substantial change in the behaviour pattern. Those precipitates that would otherwise, in the absence of impurities, have exhibited low alkaline solubility (less than 50%) now exhibit an upward trend in solubility as the seawater concentration increases. There is a limit to this trend and there is a tendency for all the curves to approach a common band of solubilities at high concentrations of seawater.

• I
The curves also demonstrate that seawater contamination is not responsible for very low alkaline solubility values, i.e., less than 50%. The effects of seawater ingress are more likely to be experienced as a general, marginal lowering of the efficiency of the reclamation process.
The effect of the addition of magnesium ions, added as magnesium chloride, to yield concentrations over the range covered with the seawater expriments was examined.The concentration of magnesium in seawater was taken as 1.32 g 1 Checks of seawaterspecimens revealed results ranging from 1.29 g l""1 to 1.35 g l""1. The results of two such experiments are shown in figure 19.
The estimated equivalence of magnesium ion concentration shown on the graph to that produced by seawater contamination was calculated and lasted in Table 8.
88

89 • r
FIGURE 19 Effect of magnesium concentrationon solubility. Two precipitation conditions(1) 45°C for 4 hours, (2) 60°C for 4 hours.
2+ -1Initial solution concentration (1) Sn = 1.1 gl ,
Sn4+ = 0.70 g 1 1 and (2) Sn2+ = 0.95 g 1
Sn4+ = 0.65 g l-1

90. ,
Table 8.Magnesium
Concentration EquivalentSeawaterg 1~ 1 Proportion
0.13 0.100.26 0.200.33 0.250.65 0.50
The trends observed in Figure 19 are consistent with those observed with seawater contamination although the magnitude of the effect is less in the case of standard precipitation conditions, 45°C for 4 hours.
' A similar exercise was pursued withcalcium ions, added as calcium chloride. The results obtained are shown in Figure 20.
The effect of this contaminating ion is clearly demonstrated. The trend, under standard precipitation conditions, is similar to that of magnesium ion contamination and seawater contamination. The test at 60°C for 4 hours differed somewhat in that there is no pronounced improvement in alkaline solubility at high concentrations of calcium ions.

91.
FIGURE 20 Effect of calcium concentration on solubility. Two precipitation conditions (1) 45°C for 4hours, (2) 60°C for 4 hours. Initial solution analysis(1) Sn2+ = 1.25 g l-1, Sn4+ = 0.65 g 1 1 and (2)Sn2+ = 1.28 g l-1, Sn4+ = 0.68 g l-1.

• /92
5.4.2 Iron and Iron-Containing Sludge
The ubiquitous sludge of oxidationproducts suspended in the working halogenelectrolyte and collected rinse waters is asource of iron as an impurity. It is presentas the prussian blue complex, sodium ferri-ferrocyanide. Whilst the iron concentrationof the sludge, and indeed the concentrationof the suspended sludge can vary a sludgehigh in iron was selected for trials toexplore its effect on the solubility of thehydrous tin oxide precipitate. The sludgecontained 7.46% w/w iron. By utilising ahigh iron sludge, the cross influence of the
+ — 4+ . . . .other components, Na , F and Sn is minimised.
With varying amounts of added sludge a series of precipitation reactions were conducted. The results of such trials are indicated in Figure 21.
The discernible trend was towards improved alkaline solubility with increasing sludge addition. In such trials it was possible to impart a slight blue discoloration to the otherwise buff coloured precipitate ¡suggesting that some portion of the sodium ferri-ferrocynanide was present in the final

93 • t
IRON CONTAINING SLUDGE g I
FIGURE 21 Effect of iron containing sludge on the solubility of the hydrous tin oxide precipitate. Initial
2+ -1solution analysis Sn = 1.2 g 1 ,4+ — 1Sn = 0.90 g 1 .

94.precipitate.
To explore the point further iron was added, in the form of ferric chloride, to a series of precipitation reactions conducted at 45°C for 4 hours. The results, as shown in Figure 22, were consistent with the trends observed in the previous case involving iron containing sludges. To permit comparison the following Table 9 of equivalence between the iron concentration in both series has been calculated.
Table 9.
SludgeConcentration
q 1_1
EquivalentIron
Concentrationg l"1
1.0 0.0752.0 0.149
u> • o 0.2244.0 0.2985.0 0.373

95 • r
100
ADDED FERRIC IRON g f‘
FIGURE 22 Effect of added ferric iron on thesolubility of the hydrous tin oxide precipitate• Initial solution analysisSn = 1.4 g 1 , Sn = 0.6 g 1

96 • r
5.4.3. Sorption Behaviour of Magnesium Ions
In view of the role of magnesium in causing substantial decreases in alkaline solubility of the hydrous tin oxide precipitates, it was studied further in terms of its sorption characteristics and with the intent of formulating possible mechanisms by which the interference could occur.
An isotherm was constructed for a particular precipitate reaction condition, 50°C for 4 hours. The results of the series of tests are shown in Figure 23.
The curve indicates two mechanisms arepotentially involved. There is a low graident curve
— 1 2 +to 0.2 g 1 Mg followed by a second, steeper gradient. The initial gradient was verified by a second series involving smaller increments in magnesium ion concentration over a limited range (see Figure 24).
Whilst the curves do not in themselves support a particular mechanism, attention is drawn to the similarity in the magnesium concentration associated with the change in solubility trends and incorporation trends.

Mg
in
PPte
. %
Mg
in pp
te.
97.,
FIGURE 23 Incorporation of magnesium in precipitate.
FIGURE 24 Incorporation of magnesium in precipitate at low concentration.
98 • r
To support the validity of an adsorption process in explaining the observed behaviour, an experiment was designed in which hydrous tin oxide precipitates were initially prepared from synthetic rinse solutions without the addition of impurities. The washed and filtered precipitates were then exposed to impurities, seawater and magnesium ions. These were compared against controls in which the precipitates were resuspended in sodium chloride solutions. It was observed that if the controls were not treated in this fashion, peptisation occurred. Hydrous tin oxides prepared at 45°C and 60°C were treated in this manner.
The principle of this operation arose from the need to avoid occlusion or entrapment processes during the growth of the hydrous tin oxide particles. The results, as shown in table 10, indicate that the changes observed in the alkaline solubility can be wrought through a surface adsorption process.

• r99
Table 10.
TestOriginal
PrecipitatePreparation
Addition in Resuspension
AlkalineSolubility
%
1A 45°C for 4 hours
Control - 1% w/w NaCl solution
97.0
IB 45°C for 4 hours
Seawater - Equivalent to 0.25 proportional dilution with seawater.
84.0
2A 60°C for 4.5 hours
Control - 1% w/w NaCl solution
41.0
2B 60°C for 4.5 hours
Seawater - Equivalent to 0.25 proportional dilution with seawater.
56.5
3A 45°C for 4 hours
Control - 1% w/w NaCl solution.
98.6
3B 45°C for 4 hours
Magnesium Chloride - equivalent to 0.2 g 1~1 Mg2+
88.2
Initial solution analysis Sn2 + 1.3 g 1 1, 0.33 g 1

100. ,
5.5 Instrumental Analysis
A number of techniques were brought to bear on the problem of determining what elements and species are present in the hydrous tin oxide precipitates.
Through the use of photographic spectrographic techniques, the following elemental groupings (Table 11) were provided as a semi-quantitative analysis for the cations.
Table 11.
ElementGroup
Approx.Range
Sample1
Sample2
Sample3
Major > 5% Sn Sn Sn, Na
Minor 0.5% -5%
Na Na, Fe Si, Fe, K
Trace 0.1% - 0.4%
si, Fe Mg, Si Mg, Al
SlightTrace
(<0.1%) Mg, Co, Cu, Ca, Mn, Al
Al, Co, Cu, Ca
Cu, Ti, Ca, Ni, Bi, Ag, Pb, Mn.
The above table of results for three samples taken at random under "normal" tin recovery plant conditions might appear, at first glance, to contain some anomalies. For example, sodium, silicon and

101. ,
iron vary in their ranking and, in addition, the list of slight trace elements is extended for sample 3. The reasons for this are only partially due to the normal variation in composition. It is largely due to the arbitrariness of the cut-off points in the groups and the diligence with which slight trace elements are sought in the sample spectra. The results, nevertheless, are a good guide to the cations expected in the precipitates.
Electron probe microanalysis of specimens from a number of recovery plant operations and a series of laboratory trials yielded additional data on the elements present Information was obtained on both cations and anions as well as on the distribution of partic ular elements of interest. The results of one specimen are tabulated below to illustrate a typical analysis (Table 12).

/102.
Table 12.
Element
Signal Strength (Counts
per second) Average of Line Travers
Background Signal (Counts per Second)
Approximate Concentration
(% w/w)
Sn 2211 207 33Na 287 60 -Fe 877 110 1.7Cu 249 145 0.7Ca 277 225 0.2Mg 92 87 < 0.1Si 455 195 0.4Al 141 115 0.1F 18 16 NilCl 696 279 1.7
Results are for an experimental hydrous tin oxide specimen with 1.5 g 1 sludge added prior to the precipitation sequence.
Electron probe microanalysis results of specimens from experiments to which magnesium or calcium ions had been added prior to the precipitation sequence are listed below in Table 13.

Magnesium Calcium Fluorine
Specimen
Signal Strength above Back
ground(counts/second)
Approx. % w/w
Signal Strength above Background
( counts/second)Approx. % w/w
Signal Strength above Background
(counts/second)r> 2+ _ .Ca Series,, dose 0.2 g 1 6 0.1 232 0.9 N.D.*
r* 2+ _ .Ca Series, dose 0.4 g 1 17 0.1 381 1.6 N.D.
_ 2 + .Ca Series,dose 0.6 g l 8 0.1 407 1.7 N.D.
2 + .Ca Series,dose 0.8 g l 20 0.2 1061 4.4 N.D.
Ca^+ Series, dose 1.0 g l
16 0.1 1155 4.7 3
Mg^+ Series, dose 0.4 g l 528 4.6 35 0.1 6
Mg^+ Series,, dose 0.8 g 1
1023 9.0 Nil 0.0 Nil
* N.D. - Not determined.
Table 13

104 • f
The distribution of elements was examined using the electron probe microanalyser. The analyser was set to the particular X-ray energy level characteristic of individual elements and the specimen scanned on a raster to compile an intensity picture over the field that was a representation of the distribution of the elements. Light areas denote areas of high concentration of the elements. A series of photographs in Figures 25 and 26 records the distribution for two specimens from the calcium and magnesium dosing trials.
Some comment is required on the interpretation of these photographs. Included with each group is an electron intensity photograph to demonstrate the changing electron scattering efficiencies that occur over the surface of the tin oxide specimens. This variation is due primarily to the nature of the surface of the specimen. Flat, homogeneous specimen surfaces would be required for even scattering. The effect is reflected in the scans for each individual element causing an apparent variation in concentration. Such effects must be neglected.

105.
fig 25(d) Cl fig 25(e) Mg f i g 2 5 ( f ) Ca
fig 25. X-ray scanning photographs, magnesium dosing trial specimen (x200)
fig 25(a) electron fig 25(b) Sn fig 25(c) Naimage
fig 25(g) F fig 2 5 (h) Si fig 25(i) Fe

106.
fig 26 X-ray scanning photographs, calcium dosing trial specimen (x200)
fig 26(a) electron image fig 26(b) Sn
fig 26(c) Mg fig 26 (d) Ca

107 • /
Magnesium and calcium show a general distribution with little apparent tendency to forrri high concentration aggregates. Iron and silicon are distributed both locally and generally. Some portion of these appears as discrete concentrated aggregates. This is not unreasonable - airborne dust at all stages would be expected to yield silicon anomalies and the occurrence of blue tinged precipitates in sludge with high iron contents shows that iron compounds can survive as separate entities. Fluorine was not present in measurable quantities and the effect observed is due to background noise. Chlorine shows some patchy as well as general distribution. An unusual pattern may be observed on the calcium intensity photographs due to the nature of the mica prism used in the analyser.
X-ray diffraction studies of the specimens did not prove to be fruitful and were not actively pursued.
Infrared spectra were recorded to provide information on the infrared active groups. Spectra were obtained on specimens dehydrated for 4 hours at 110°C and ground with potassium bromide prepared simultaneously and immediately pressed into discs.

s o e o 9 o 1 0 0 l i o i ? O l i o ¡ '-o
FIGURE 27 I.R. spectrum of precipitated tin oxide specimenooo

109 • t
There were sufficient water molecules present in all specimens to block all study of hydroxyl groups. One such spectrum is recorded in Figure 27. In the light of the work of Thornton and Harrison (1974) the result is not unreasonable. To gain the required detail in the hydroxyl region it would be necessary to work in a vacuum with pure tin oxide discs, encapsulated during preheat treatment and during the recording of the spectra. No bands due to carbonate or bicarbonate groups were detected in the spectra which does not completely exclude the possibility of the presence of low concentrations but does eliminate the existence of substantial quantities in the hydrous tin oxide preparations.A band occurred persistently throughout the infrared work at 2220 cm"1 that could not be satisfactorily explained. It was not found to be associated with a specific experimental variable.
The scope for solid state infrared spectra to differentiate between adsorbed and solid solution environments in the tin oxide particles was believed to be severely limited due to the nature of the precipitates; basically an amorphous solid with a high surface area/volume ratio.
Electron diffraction studies supported the view that the precipitates were amorphous. Only in

110. ,
rare cases was a diffraction pattern obtained and this pattern was consistent with SnO.
5.6 Surface Active Agents, Polyelectrolytes
Primarily due to the interest in theeffects of precipitate morphology, the influenceof polyelectrolytes as surface active agents wasprobed. In addition, there was a particular inter-
2 +est in matching the sensitising effects of Ca and 2 +Mg with the polyelectrolytes in the system under
study with the view to offsetting the influence of these ions. Synergistic action between these ions and polyelectrolytes have been discussed by Loganthan and Maier (1975) and Sommerauer et al (1968).
There was also potential gains anticipated in improving the settling characteristics of the hydrous tin oxide precipitates as this is the rate controlling phase of the commercial operations The settling characteristics influence the particular temperature and time conditions that govern the pre cipitation phase.

Ill • t
Polyelectrolytes are widely employed as synthetic flocculants to bring about the rapid flocculation of finely divided solids in aqueous suspensions by forming large floes which are amenable to physical separation techniques, sedimentation, centrifuging and filtration.
The extent of the family of polyelectrolytes available presents a problem of selection. However, for the particular system under investigation the field can be narrowed on the basis of pH, precipitate type and concentration. A small group of polyelectrolytes marketed under the trade name of Magnafloc* were screened and a non-ionic polyelectrolyte, Magnafloc 351, was selected as being suitable Magnafloc 351 is a non-ionic polyacrylamide with a formula;
CH -
C0
n
Allied Colloids Ltd., Checkheaton Rd., Low Moor Bradford, Yorkshire, U.K.*

112 • t
with none of the -CONH^ converted to -COO Na+.The molecular weight range is 10 - 20 million.
A simple series of tests in which 5 mg 1 10 mg 1 15 mg 1 20 mg 1 and30 mg 1 of Magnafloc 351 was added to the stirred precipitate was performed to establish a satisfactory working concentration. Flocculation occurred in all cases. A level of 10 mg 1 was selected as a practical concentration for further work.
Solubility assessment on precipitates flocculated with the aforementioned levels of Magnafloc 351 yielded results shown in Figure 28.
The effects shown by the curve illustrated the situation that prevailed in subsequent tests and is consistent with results subsequently obtained in plant practice. For normal precipitation reaction conditions, 45°C for 4 hours, the use of modest quantities of polyelectrolyte yielded precipitates that were of similar, or slightly superior, alkaline solubility. The effects in terms of improved solu- j-jj_qity however were too slight to be of practicalimportance.
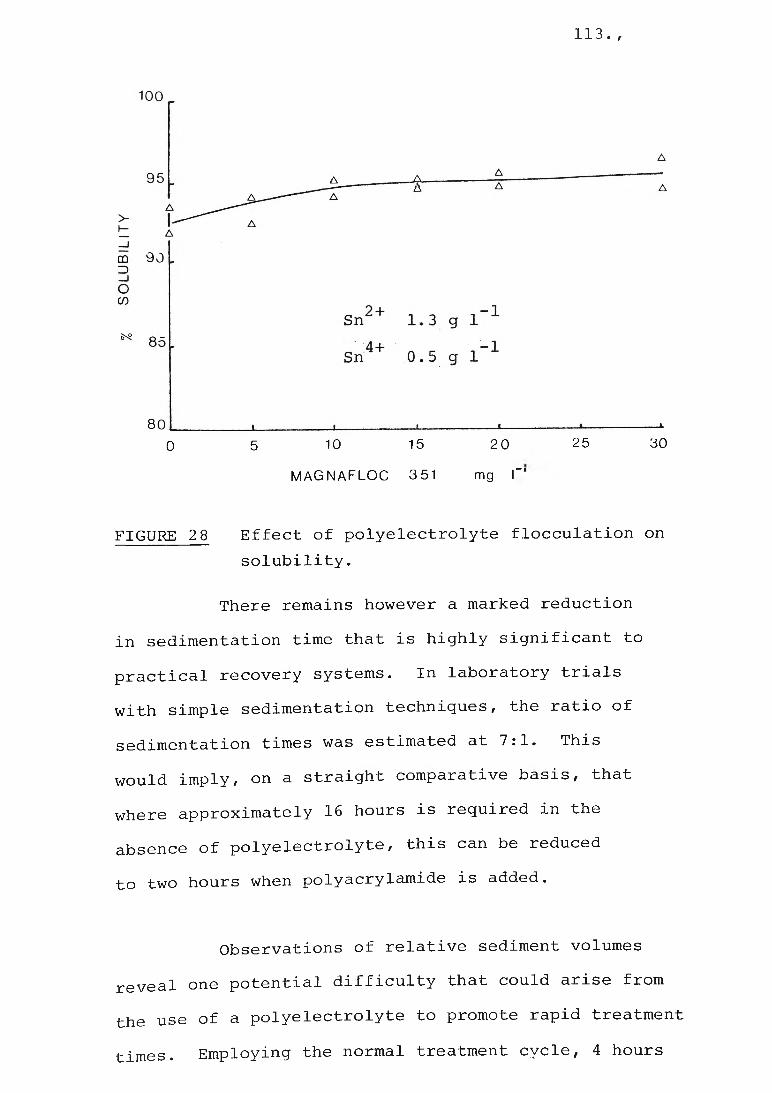
113. ,
0 5 10 15 20 25 30
MAGNAFLOC 351 mg I "
FIGURE 28 Effect of polyelectrolyte flocculation on solubility.
There remains however a marked reduction in sedimentation time that is highly significant to practical recovery systems. In laboratory trials with simple sedimentation techniques, the ratio of sedimentation times was estimated at 7:1. This would imply, on a straight comparative basis, that where approximately 16 hours is required in the absence of polyelectrolyte, this can be reduced to two hours when polyacrylamide is added.
Observations of relative sediment volumes reveal one potential difficulty that could arise from the use of a polyelectrolyte to promote rapid treatment times. Employing the normal treatment cycle, 4 hours

at 45°C with a 16 hour settlement time, a sediment volume of 6.0 ml was generated by 100 ml of suspension containing 2 g 1 tin. With the same 4 hours at 45°C and a 10 mg 1 addition of Magna- floc 351 followed by a 2 hour settlement time yielded a sediment volume of 10 ml. Whilst wall effects and the degree of hindered settling differs in large vessels compared with the 100 ml measuring cylinders used in the laboratory comparison, some adjustment of the current 10% v/v cutoff between the supernatant liquor and the sediment might be required on a plant scale.
The effects of the combined use of seawater and the Magnafloc polyelectrolyte was evaluated. The alkaline solubility of the precipitates formed with 10 mg 1_1 polyacrylamide was compared with a control in which only seawater was added.The trends shown in Figure 29 indicate no influence at this level of dosing and under normal precipitation conditions.

115
100 f□
FIGURE 29 Effect of polyelectrolyte in presence of seawater contamination.
It was reasoned that there may be a gain in modifying the level and technique of dosing with the polyelectrolyte to cope with the varying precipitate particle surface area and the extent of ongoing sorption, if this proved to be the mechanism. Trials weie conducted with levels of 35 mg 1 1 Magnafloc 351 and 150 mg l”1 without effecting a significant improvement in the alkaline solubility of the resultant precipitate. The review of conditions and results of the 150 mg 1 1 dosing test aretabulated below (Table 14). Progressive dosing with both polyelectrolyte and sodium carbonate

116 • /
was extended approx. 35 minutes with the precipitation phase cut short at 2 hours as peptisation was being experienced.
The results as shown in Table 14 reveal no effect on the alkaline solubility of the tin component of the; resultant precipitates.
Table 14.
Item"Normal"Control
PolyelectrolyteAddition
Tin concentration in rinse water
2.0 g l-1 2.0 g l-1
Seawater proportion 0.25 0.25
Alkali addition Continuous over 33 minutes
Continuous over 35 minutes
Final pH 7.5 7.5Magnafloc 351 Nil Continuous
over 40 minutes
Final Magnafloc concentration Nil 150 mg l-1Reaction time/ temperature
2 hours at 45°C
2 hours at 45°C
AlkalineSolubility
74.9% 75.1%

117 • r
An observation was made as to the influence of the polyelectrolyte in the course of the alkaline solubility determinations. The different morphology conferred on the hydrous tin oxide by polyelectrolyte addition remained in the residue left after treatment with sodium hydoxide solution. (See Figure 30).
It was proposed, subsequent to the initial work with Magnafloc 351, that a readily available liquid polyelectrolyte Alfloc 6701* (which is an aqueous solution of polyacrylamide) may be substituted for the Magnafloc 351. The results of tests with this material revealed a similar performance to that of Magnafloc 351. Figure 31 shows the effect of dosing a normal treatment cycle with 5 and 10 mg 1_1 and Figure 32 shows the effect of dosing a seawater contaminated reaction solution.
The results show an insignificant change In alkaline solubility both in respect lo the difference levels of Alfloc 6701 and in the presence of seawater where there was no improvement over the control run.
* C a t o l e u m Pty. Ltd.

118
fig 30. Residues in sodium hydroxide solution. Original precipitates prepared with seawater added (0.25 by proportion). Specimen A contained no added polyelectrolyte. Specimen B was dosed with 150 mg 1 Magnafloc 351 polyelectrolyte .

119 • r
3 0 ,
>
_JCDZ)_Joco 80 »
5
700
j__________—i—5 10
ALFLOC 6701 mg I
—>15
FIGURE 31 Effect of flocculating with Alfloc6701 on the solubility of the precipitate.
2+ -1Initial solution analysis Sn 1.35 g 1 ,Sn4+ = 0.65 g l“1

120 • r
FIGURE 32 Effect of adding Alfloc 6701 to a seawater contaminated precipitate. Curve 1. Control. Curve 2. 5 mg 1 1 Alfloc 6701 polyelectrolyte. Initial solution analysis;Sn2+ 1.2 g l-1, Sn4+ 0.6 g l“1.

121. ,
5.7 General Reaction Conditions
The control of pH in precipitation is undoubtedly an important parameter at least in defining the conditions for successful operations.In practice, the plant control is effected by direct solution analysis with a pH check after the reaction is complete.
Precise, absolute determination of pH of the fluoride solutions is difficult due primarily to the aggressive nature of fluoride ions to the glass electrode systems of conventional pH meters. Nevertheless, glass electrodes are employed to measure the pH of dilute solution which yield suitable comparative pH values. Colorimetric methods such as the Taylor comparator, where colours of indicators in solution are compared with standards, and the multi-indicator plastic based indicator strips, such as those produced by Merck, provide a suitable alternative and were used for the bulk of the work in this study. The glass electrode system was employed where the trial was specifically aimed at pH as a variable.
The result of varying the pH over the normal range experienced, 6.5 to 8.3, on the alkaline solubility of the precipitate is shown in Table 15. The effect of the variation in the pres-

122 • r
ence of seawater, 0.1 by proportion, is recorded in Table 7 of the section dealing with impurity effects.
Table 15.
PH% Alkaline Solubility
6.5 986.7 977.4 98
LO• 96ro•
00 94
Initial sol. 2 + ution Sn
1.3 g l-1,4+Sn 0.6 g 1
The e f f e c t is quite small and the a d d i t i o n
of s e a w a t e r did n o t pr o d u c e a n o t i c e a b l e eff e c t in
the s o l u b i l i t y / p H relationship.
The effect of varying the ionic concentration of the system was examined by dilution with distilled water and with 0.3% sodium chloride solution. The observations which are recorded in Table 16 show no evi dence for an ionic strength effect.
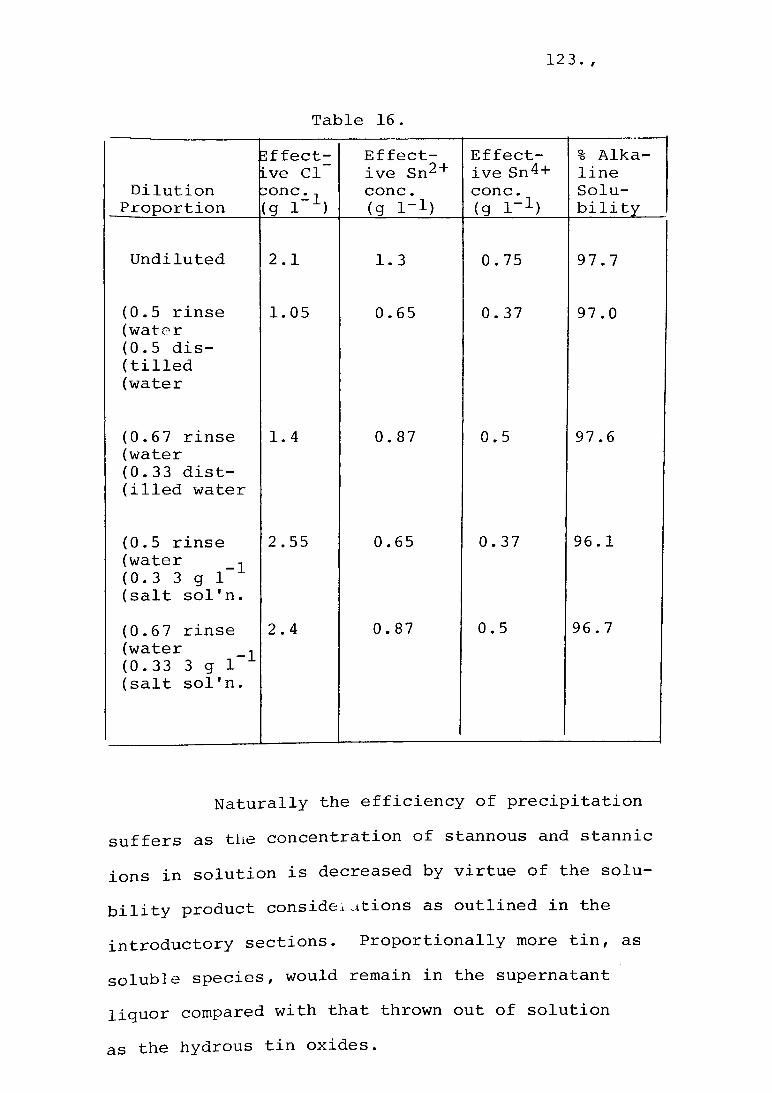
123 • /
Table 16.
DilutionProportion
effective Cl done., (g 1 )
Effective Sn^ + cone.(g l " 1)
Effective Sn4 + cone.(g i_ 1 )
% Alkaline Solubility
Undiluted 2.1 1.3 0.75 97.7
(0.5 rinse (water (0.5 distilled (water
1.05 0.65 0.37 97.0
(0.67 rinse (water (0.33 distilled water
1.4 0.87 0.5 97.6
(0.5 rinse (water (0.3 3 g 1 (salt sol'n.
2.55 0.65 0.37 96.1
(0.67 rinse (water (0.33 3 g 1 (salt sol'n.
2.4 0.87 0.5 96.7
Naturally the efficiency of precipitation suffers as the concentration of stannous and stannic ions in solution is decreased by virtue of the solubility product considerations as outlined in the introductory sections. Proportionally more tin, as soluble species, would remain in the supernatant liquor compared with that thrown out of solution as the hydrous tin oxides.
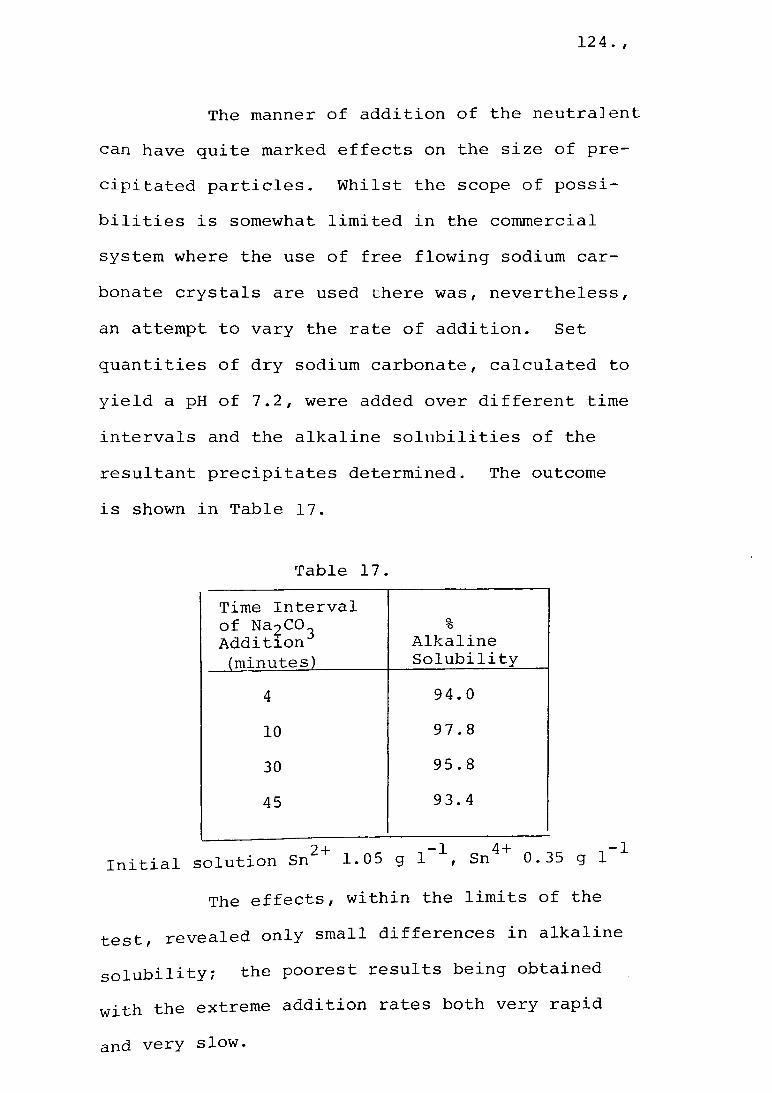
124 • /
The manner of addition of the neutralent can have quite marked effects on the size of precipitated particles. Whilst the scope of possibilities is somewhat limited in the commercial system where the use of free flowing sodium carbonate crystals are used there was, nevertheless, an attempt to vary the rate of addition. Set quantities of dry sodium carbonate, calculated to yield a pH of 7.2, were added over different time intervals and the alkaline solubilities of the resultant precipitates determined. The outcome is shown in Table 17.
Table 17.Time Interval of Na2 CO_ AdditionJ (minutes)
Q.*5AlkalineSolubility
4 94.010 97.830 95.845 93.4
2+ —1 4+ — ]Initial solution Sn 1.05 g 1 , Sn 0.35 g 1The effects, within the limits of the
test, revealed only small differences in alkaline solubility; the poorest results being obtained with the extreme addition rates both very rapid and very slow.

125 • r
The effect of temperature during precipitation was found to have a significant influence on the outcome of the precipitation reaction. Unfortunately the early tests were not always consistent. The effect of increasing the reaction temperature from 45°C to 60°C could, at times, have a devastating impact on alkaline solubility, halving the alkaline solubility of the precipitate, whilst on other occasions the effects were much more modest. It was appreciated that these apparent anomalies were due to the inter-dependence of several variables not the least of which was the stannic/stannous tin ratio. The presence of seawater could also modify the behaviour. These effects are dealt with more fully under Sections5.2 and 5.4
The temperature effects can be demonstrated with reference to Table 18 for one partic- lar set of process conditions. Precipitation was conducted for 4 hours with a solution containing 1.0 g l-1 stannic tin and 0.55 g 1_1 stannous tin.

126. ,
Table 18.Temperature % Alkaline
(°C) Solubility
40 98.545 98.350 90.160 66.8
Reaction time can influence the outcome of the reaction sequence and the precipitate formed. Reaction times of less than 30 minutes can lead to incomplete reactions. At time intervals between 2 and 6 hours there was not a great deal of influence unless other unfavourable conditions were present. In other words, if the temperature of precipitation is increased to 60°C longer reaction times will aggrevate the decrease in solubility. Time, temperature and seawater contamination, applied as variables, are shown to influence solubility in Figure 15.

127 • /
6. DISCUSSION
The morphology of secondary dehydrated structures was observed to be different in both plant and laboratory specimens of the precipitated tin oxides when there was a substantial associated difference in the alkaline solubility of the as- produced precipitates. These effects could be brought about by increasing the temperature and time of the precipitation reaction. An increase in temperature from 45°C to 60°C usually lowered solubility by 30%.
In order to account for the loss in solubility, we turn, in the first instance, to the dissertation provided in the introduction, Section 3.2, on solubility where there is an attempt to demonstrate an effect of precipitate particle (and by inference shape as might be apparent in volume/surface area relationships ) through arguments centred on the Kelvin equation. Along with these arguments are the findings of several workers which indicate the role of size in a number of experimental systems. The conclusions reached support the view that the solubility of fine particles is enhanced over coarse or bulk forms of the same substance and

128 • /
that the effect is one of thermodynamic equilibrium and does not involve kinetics.
It is of interest to observe that the Russian investigators Paudert, Liebscher and Trinks (1967) support the effects of particle size on solubility. A particular example involved stannic oxide being dissolved in 10% sodium hydroxide solution after being subjected to varying degrees of grinding in a mill to decrease particle size.The results are quoted in Table 19.
Table 19.Duration
ofGrinding(hour)
Durationof
Dissolution(hour)
Quantity Transferred to Solution (% of Original)
12 0.5 (60-80°C) 8.725 II 25.047 II 28.072 II 40.4
152 II 63.5210 II 78.0300 II 100.0

129 • /
The examination of precipitates in this study did not reveal any kinetic effects, at least for modest increases in solution time. An increase in solution time by a factor of 10 did not render poorly soluble precipitates soluble.
As it was possible to produce solubility changes without apparent chemical changes and with the only discernible difference being morphology an hypothesis was developed to interpret the structures observed in the scanning electron microscope in the light of particle size effects. Highly soluble precipitates showed an open structure with protruberances after dehydration while the poorly soluble precipitates collapsed into a denser structure. It was reasoned that groupings, or agglomerations, of small particles would necessarily entrain substantially more water than groupings of larger particles. During the dehydration operation the removal of this water left a more open, uneven structure than was possible with the less hydrated agglomerations.
It had been expected that optical microscopy may support this by direct observation, but this did not,prove to be satisfactory. Although fine detail was not discernible in the optical

130 • /
examination, it did indicate the general form of agglomeration of particles. It is of interest to comment on the form in the light of the review of floe form that has been conducted by Matijevic (19 71) . This work draws heavily on the computer simulation of floe formation by Void, Sutherland et al. Three types of floe simulation are reproduced in Figure 33 and it can be seen that the general shape shown in the results section (Figures 5 and 6) compare with those produced by von Smoluchowski collision, i.e., a tentacle like form without a well defined nucleus. However, it is believed the solubility differences relate to detail beyond that revealed in the optical photomicrographs .
The physicochemical effects may also be examined in the light of the reported existence of the two forms, a and 3, of stannic acid or hydrous stannic oxide. A discussion of the literature dealing with these forms has been presented in the introductory section, Section 2.2.
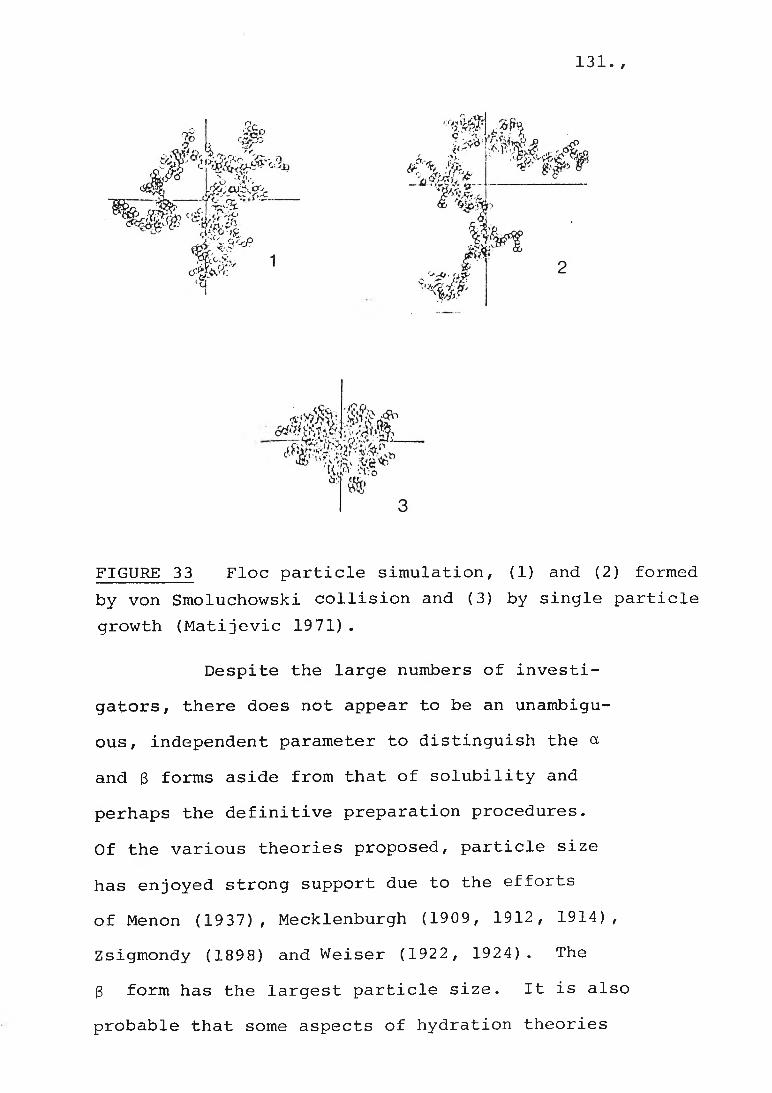
131 • /
FIGURE 33 Floe particle simulation, (1) and (2) formed by von Smoluchowski collision and (3) by single particle growth (Matijevic 1971).
Despite the large numbers of investigators, there does not appear to be an unambiguous, independent parameter to distinguish the a and 3 forms aside from that of solubility and perhaps the definitive preparation procedures.Of the various theories proposed, particle size has enjoyed strong support due to the efforts of Menon (1937), Mecklenburgh (1909, 1912, 1914), Zsigmondy (1898) and Weiser (1922, 1924). The 3 form has the largest particle size. It is also probable that some aspects of hydration theories
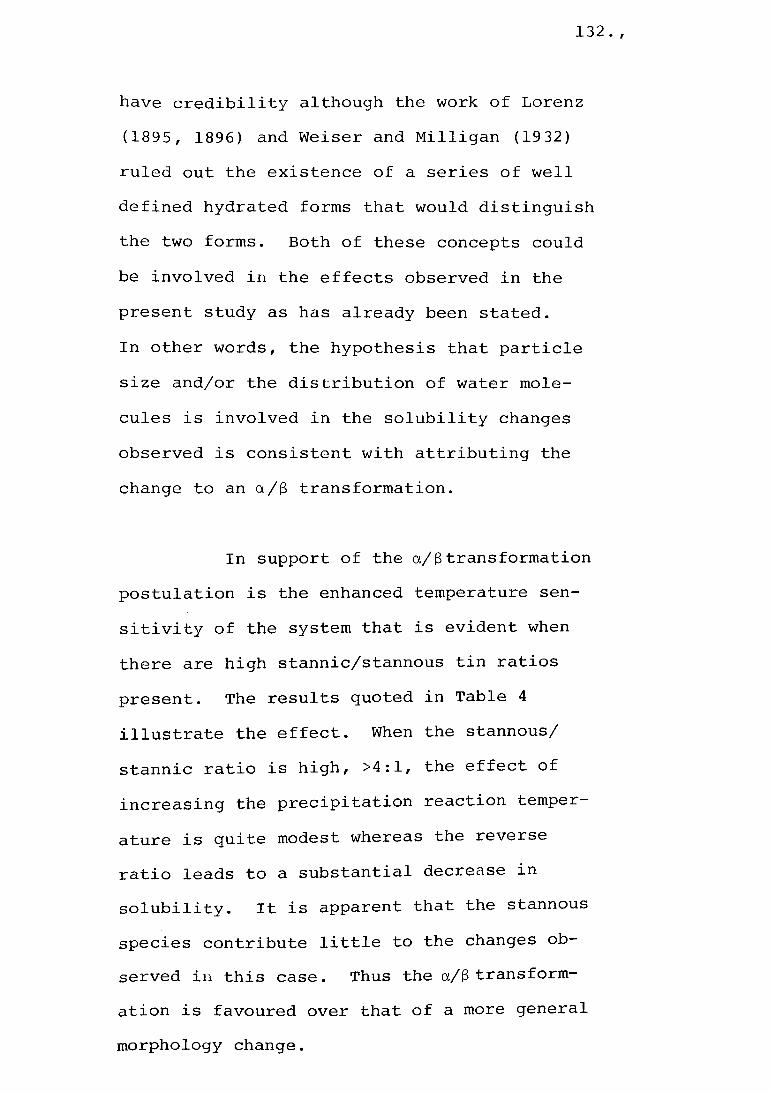
132.
have credibility although the work of Lorenz (1895, 1896) and Weiser and Milligan (1932) ruled out the existence of a series of well defined hydrated forms that would distinguish the two forms. Both of these concepts could be involved in the effects observed in the present study as has already been stated.In other words, the hypothesis that particle size and/or the distribution of water molecules is involved in the solubility changes observed is consistent with attributing the change to an a/3 transformation.
In support of the a/3transformation postulation is the enhanced temperature sensitivity of the system that is evident when there are high stannic/stannous tin ratios present. The results quoted in Table 4 illustrate the effect. When the stannous/ stannic ratio is high, >4:1, the effect of increasing the precipitation reaction temperature is quite modest whereas the reverse ratio leads to a substantial decrease in solubility. It is apparent that the stannous species contribute little to the changes observed in this case. Thus the a/3 transformation is favoured over that of a more general morphology change.

133. ,
The structure of the p r e c i p i t a t e as r e
v e a l e d by the scanning elec t r o n m i c r o s c o p e was
co n s i s t e n t l y amorphous. The only shape obse r v e d
was spherical or part spherical. No p r e f erred
crystal growth habits were observed. Isolated
pockets of crys t a l l i n e m a t e r i a l were observed
on rare specimens but it was d e m o n s t r a t e d that
additional w a s h i n g r e moved them. These were
c r y s t a l l i s e d salts from the electrolyte.
E l e c t r o n d i f f raction examination of
r a n d o m samples also showed them to be amorphous.
In one case where a distinct diffraction pattern
could be observed, the calculated spacings were
consi s t e n t wi t h that of SnO. The particular
sample had shown a mode s t solubility of 88%.
Seeding experiments involving the
addition of small quantities of poorly soluble
precipitates failed to produce an effect.
The pH of the precipitation reaction
was not shown to have a mar k e d influence on
solubility. This might be taken as inconsis
tent wit h the general cases quoted in the
literature. It is recognised that the p h y s i c
ochemical properties of mos t extended surfaces
are pH sensitive and also strongly influenced

134. ,
by the surrounding ionic concentration. A general case involving colloidal kaolinite is discussed by Loganathan and Maier (1975). A more relevant case is reported by Tarasova, Dzis'ko and Barakovskikh (1970) for the particular case of hydrous stannous oxide. The graph reproduced in Figure 34 demonstrates the effect of pH they observed in terms of specific surface area of the precipitated hydrous stannous oxide. The results relate to a sulphate based solution but the investigators also worked with chloride based solutions.
FIGURE 34 Effect of pH on specific surface areaof hydrous stannous oxide (Tarasova et al, 1970) .

135 • /
In view of the above and other more general examples the findings of the present work are not necessarily in conflict, due primarily to the range of pH values studied, pH 6.5 - 8.3. The present work was restricted to this range after studying 65 cases of plant operation where the mean pH was 7.11 and the standard deviation was 0.56. Even with reference to Figure 34 it can be seen that the limited range would have led to a more conservative view of pH influence. The narrower range when applied to Loganathan and Maeir's work would have had a similar effect.
A similar situation arises in the case of changing ionic strength with both distilled water and 3 g 1 salt witer solution. Again the range was limited to simulate the range possible on the plant and little effect was observed.
The rate of precipitation is known to influence the nature of precipitates. The addition rate and homogeneity in the reaction mix of the neutralent can markedly affect the nucléation and growth phases of the precipitate particles as described in the introductory section, Section3.1.

136 • t
Typically, for good quality precipitates, as required in gravimetric analysis, the reactants are required to be dilute and added slowly with efficient stirring to avoid high concentration zones. The system under study falls short of this ideal, particularly in respect to the rate of addition and nature of the alkali, sodium carbonate. The sodium carbonate is added as a free flowing, fine, crystalline powder directly to the stirred reaction vessel. Logistics control the form and rate of addition. Presolution of the sodium carbonate would provide an unnecessary burden on the plant operations through excess liquid volume. However, there is a limit to the rate of reaction created due to the carbon dioxide evolution which serves to explain the modest differences obtained in precipitate solubility when the rate of addition of alkali was altered. The evolution of carbon dioxide serves to modify the otherwise unfavourable conditions by;
(i) providing a vigorous stirring action in the reaction area,
(ii) reducing the rate of attack on the alkali particles with a self generated gas barrier.

137 • t
(iii) limiting the maximum rate ofaddition possible in the plant environment.
Some concept of the rate at which reaction occurs will be gained from the pH change as a function of time shown in Figure 35. These curves were obtained in previous work in which sodium carbonate was added over a 5 minute interval to a 10 1 reaction vessel. For stable pH levels to be achieved, consistent with the requirements of the process, up to 40 minutes may elapse. Curves that would yield stable pH values between6.5 and 8.0 would be relevant to process requirements, i.e., curves 2 and 3 but less than curve 4.
The initial rise in pH is quite rapid which raises the question of coprecipitation or occlusion of hydroxychlorides. At pH values up to 5.6, Donaldson et al (1963) reported a basic stannous chloride phase, Sn^COHj^Cl^f was formed in stannous chloride solutions and with the less than ideal conditions that prevail, coprécipitation can be anticipated. In fact, it was not possible to produce hydrous tin oxide precipitates without chloride contamination. A level of 1.5% w/w chloride was obtained even in carefully washed precipitates. The EPMA results invariably

138 • t
TIME hoursFIGURE 35 Variation in pH during precipitation
with increasing levels of sodium carbonate addition, curves 1 to 4.

139. ,
revealed significant chloride contamination. The direct determination of the extent of coprecipitation versus surface adsorption was not possible. Collins and Wood (1923), for example, discussed the adsorption of stannous chloride by hydrous stannic oxide.It is of interest to note that they proposed that if a stannous chloride solution is added to a stannic chloride solution, then with the onset of hydrolysis, a course will be pursued where the hydrous stannic oxide, or stannic acid, will be precipitated first and then stannous chloride is adsorbed. They also observed that the 3 form is either necessary or desirable but claim that a definitive test is not possible since the a form from the instant it is produced, will commence to move to the 3 form, albeit slowly. They also conceded that not all the stannous component is adsorbed as the chloride and suggest portion is adsorbed as the hydroxide. Certainly at the levels of chloride and stannous tin found in the precipitates of the present study, the adsorption of the stannous component as the chloride cannot be large.
Barsukov and Kuril'chikova (1966) studied the solubility of hydrous stannic oxide in hydrothermal solutions and concluded that chloride inhibits solubilisation however, this does not seem to be a relevant point as solubilities

140 • t
approaching 100% of the available tin were often obtained in spite of the presence of chloride ions.
Contamination of the precipitates extends beyond that of the chloride indicated above. The results of the semi-quantitative spectrographic analysis of some specimens are recorded in the results section and revealed a wide range of contamination. In review, the major cations were tin and sodium. Assuming different degrees of importance, depending on the conditions during neutralisation, there was a group of minor cations including iron, potassium, silicon, aluminium, magnesium, calcium and copper. To this list were added another eleven trace ions which were not pursued experimentally.
Among the list of anions were hydroxyl groups, oxides and chlorides. Fluoride and ferri- ferrocyanide occured in trace quantities depending on prevailing conditions.
The results sections describe the outcome of a number of experiments conducted to explore the effects of the most pertinent foreign ions andspecies.
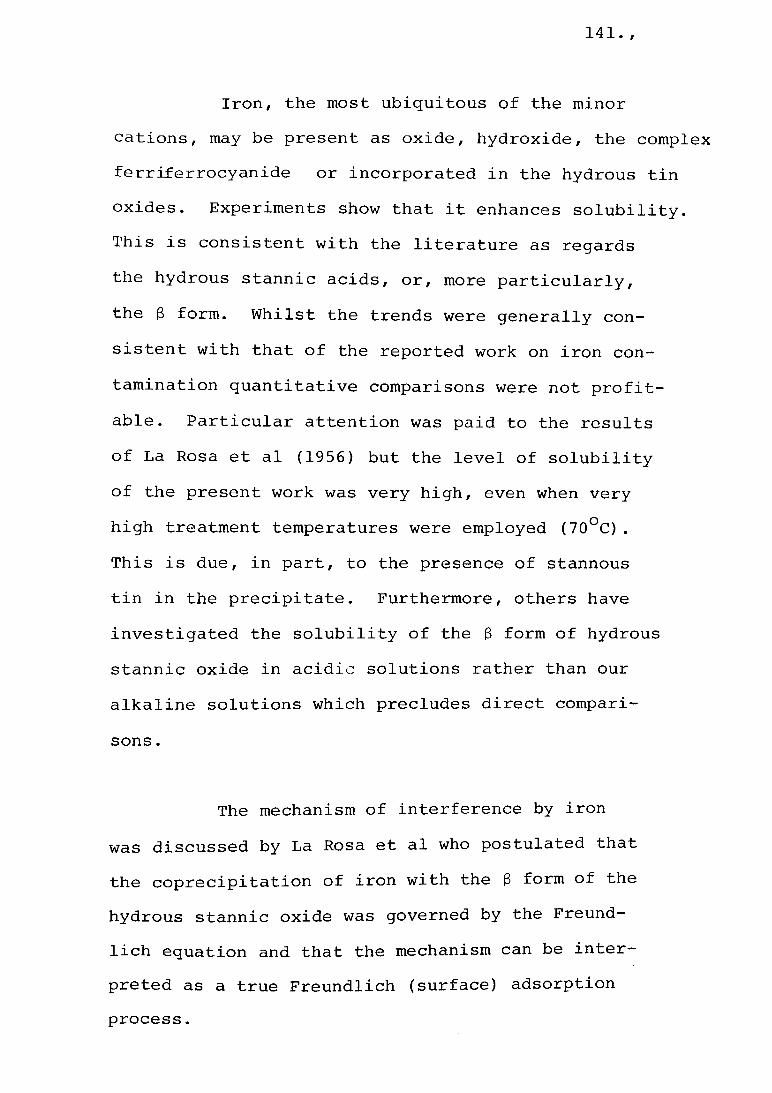
141 • r
Iron, the most ubiquitous of the minor cations, may be present as oxide, hydroxide, the complex ferriferrocyanide or incorporated in the hydrous tin oxides. Experiments show that it enhances solubility. This is consistent with the literature as regards the hydrous stannic acids, or, more particularly, the 3 form. Whilst the trends were generally consistent with that of the reported work on iron contamination quantitative comparisons were not profitable. Particular attention was paid to the results of La Rosa et al (1956) but the level of solubility of the present work was very high, even when very high treatment temperatures were employed (70°C).This is due, in part, to the presence of stannous tin in the precipitate. Furthermore, others have investigated the solubility of the 3 form of hydrous stannic oxide in acidic solutions rather than our alkaline solutions which precludes direct comparisons .
The mechanism of interference by iron was discussed by La Rosa et al who postulated that the coprecipitation of iron with the 3 form of the hydrous stannic oxide was governed by the Freundlich equation and that the mechanism can be interpreted as a true Freundlich (surface) adsorptionprocess.

142 . ,
They attribute the effect of iron to peptisation brought about by adsorbed (Fe20^.H^O)Fe^+. The ability of the hydrated ferric oxide to exist as a colloid was important to this mechanism.
The peptisation by an adsorbed iron complex is a possible mechanism for the improved solubility noted in the system under study. Both ferriferrocyanide complex and hydrous ferric oxide, are capable of behaving as colloids. The electron probe photomicrographs showed iron to be distributed generally through the precipitate as well as discrete particles.
There is a feature of the presence of iron in the system under study that bears consideration. The iron is usually part of the insoluble sludge consisting of oxidation products, the primary component of which is sodium fluoro- stannate. If this sludge is added to the rinse waters to leach its tin content, the stannous/ stannic ratio will be altered. Furthermore, if high temperatures are employed, say 60 C or more, to maximise this extraction, then the conditions will be conducive to the formation of poorly soluble hydrated tin oxides in the subsequent

143. ,
precipitation phase. Because of the coincidental presence of iron it is possible to mistakenly attribute the effect to this impurity.
The effect of the introduction of seawater was studied in detail. Figure 18 demonstrates some of the effects observed. Whilst the conditions examined ranged up to a dilution of 1:1 with plating rinse solution the most important range of seawater proportions extends from 0 to 0.20 where volume changes in the recovery system due to internal leakage of the saltwater cooling system are likely to go undetected. Dilution tests to vary the ionic strength of the solutions demonstrated that this was not a factor in the effects observed.The magnesium and calcium ions in the seawater were suspected as the offending impurity ions. Evidence of these elements being a source of solubility reduction was provided in several ways. A number of poorly soluble precipitates from the plant recovery operations revealed magnesium and calcium contamination but more importantly, the behaviour of reaction mixtures dosed with magnesium and calcium ions revealed a similar pattern to that of the changes brought about by seawater. Whilst

144 • /
both of these ions were recognised as contributing, the primary effort was directed at magnesium and its effects. This course was dictated, in part, by the higher concentration of magnesium in seawater (5.4X) .
Adsorption on the surface of the hydrous tin oxide precipitate must be considered a potential mechanism by which the non amphoteric magnesium ions can influence the solubility although other explanations involving continuous layering or solid solution type mechanisms may also be modes of interaction. To pursue the point the relationship between the magnesium concentration in solution and that found in the precipitate was established(Figure 23). Two processes were indicated, one
-1 2 +up to approx. 0.2 g 1 Mg and a second up to-1 2+ .the limit of the test, 1.0 g 1 Mg . This be
haviour may be compared with the solubility curves of the hydrous tin oxide precipitates prepared at 45°C and 50°C when Mg is present (Figures 18 and 19). The initial part of the adsorption curve is seen to be associated with the initial decrease in solubility of the precipitates.

145 • r
To avoid the inclusion of magnesium in the growing precipitate experiments were performed in which the impurity was added after the hydrous tin oxides were formed. Reductions in solubility were noted with the resultant precipitates and the anomalous performance with low solubility precipitate was observed. Whilst this evidence does not define the mechanism involved, it does show that surface adsorption is capable of producing the effects observed in the system.
As to the nature of the adsorbed layer that could be present, there is no direct evidence. If the work of Korennan (1963) is reviewed where he studied the reverse case of tin adsorption on magnesium hydroxide, then it seems possible that after the initial adsorption of a small quanity of impurity then there is potential for magnesium stannates or stannites to be formed.
Opportunities for other species to be adsorbed should also be considered. Loganathan and Maier (1975) in considering the adsorption of Mg^”*" on kaolinite referred to the relationship;
Kx = (MqOH+) = 102'4(Mg2+)(0H_)
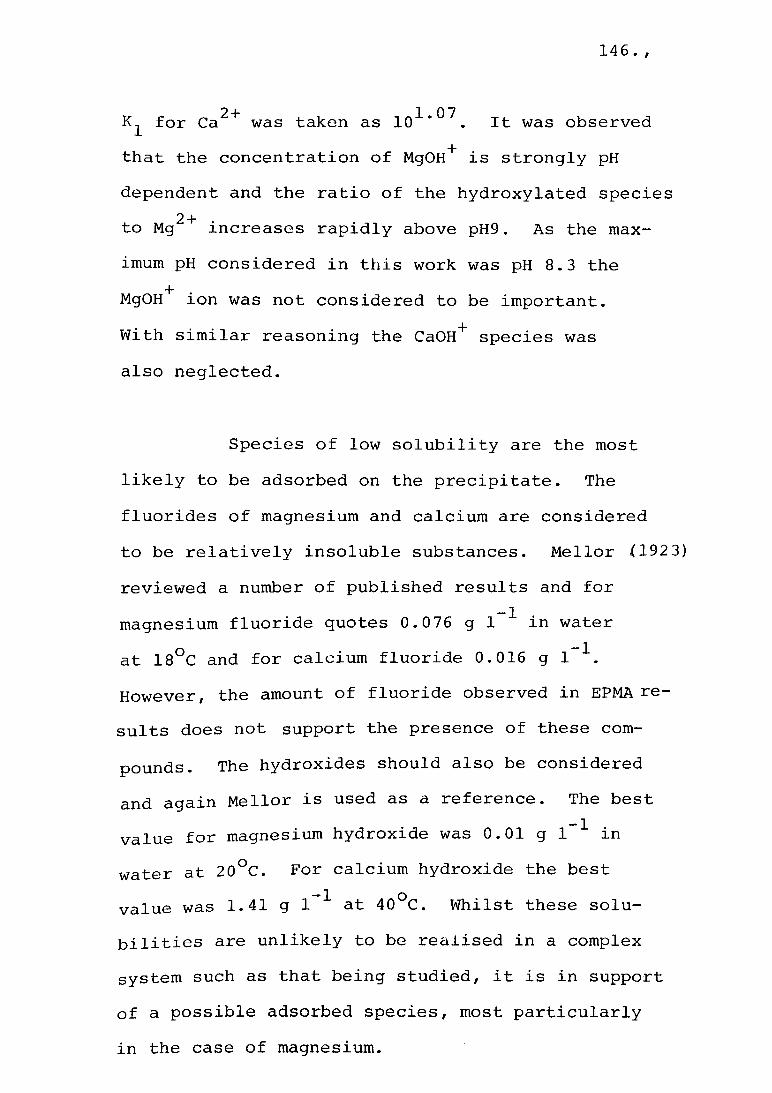
146 • r
2+ 107for Ca was taken as 10 * . It was observedthat the concentration of MgOH+ is strongly pHdependent and the ratio of the hydroxylated species
2+ .to Mg increases rapidly above pH9. As the maximum pH considered in this work was pH 8.3 the MgOH+ ion was not considered to be important.With similar reasoning the CaOH+ species was also neglected.
Species of low solubility are the most likely to be adsorbed on the precipitate. The fluorides of magnesium and calcium are considered to be relatively insoluble substances. Mellor (1923) reviewed a number of published results and for magnesium fluoride quotes 0.076 g 1 in water at 18°C and for calcium fluoride 0.016 g 1 \However, the amount of fluoride observed in EPMA results does not support the presence of these compounds. The hydroxides should also be considered and again Mellor is used as a reference. The best value for magnesium hydroxide was 0.01 g 1 1 in water at 20°C. For calcium hydroxide the best value was 1.41 g 1 at 40°C. Whilst these solubilities are unlikely to be realised in a complex system such as that being studied, it is in support of a possible adsorbed species, most particularly in the case of magnesium.
147 • r
A suggested sorption process for magnesiumis as follows. Magnesium ions are adsorbed at isolatedenergetically favourable sites in an oxygen or hydroxylmolecular environment until sufficient concentration isreached for the formation of coherent molecular groupson the surface of the precipitate such as magnesiumstannate. The second phase is seen to commence at
-1 2+ .approx. 0.2 g 1 Mg in the system under study.It is further suggested the adsorbed film inhibits the a/3 transformation in the hydrous stannic oxide precipitates.
Having established the combined effects of precipitate morphology and magnesium and calcium ions on solubility the use of polyelectrolytes to modify solubility behaviour was investigated. The flocculation of colloidal precipitates is well known and investigators such as Sommerauer, Sussman andStumm (1968) and Loganathan and Maier (1975) have
. . 2+ 2+described the sensitising effects of Mg and Ca .Whilst it was anticipated that the complexing effect
2+ 2+of the polyelectrolyte molecules on Ca and Mg during bridging might neutralise their effects, this did not prove to be the case. However, flocculation of the hydrated tin oxide precipitates was greatly enhanced and full scale plant trials (Hopkins 1975) have shown large reductions in

148 • r
settling time with high tin recovery. Solubility results using polyelectrolytes, Magnafloc 351 and Alfloc 6701, were good. The morphology of dehydrated specimens when the nonionic polyelectrolyte, Magnafloc 351, was used is consistent with structures exhibiting good solubility, an open structure with the surface covered with small protruberances. One could also expect gains in the recovery process by lowering the time and temperature of precipitation and relying on the polyelectrolyte to control floe size.
7.0 CONCLUSIONS
1. The morphology of the hydrous tin oxide precipitates has been observed to be involved in the mechanism by which the solubility is modified. Whilst the precipitate is characteristically amorphous, the texture of dehydrated specimens shows a qualitative trend towards denser structures with poorly soluble precipitates. The effect is considered to be due to particle sizedifferences.

149 • t
2. Temperature (and time) of the precipitation reaction influence the alkaline solubility of the precipitates. As the temperature increases above 45°C the risk of lowered solubility increases. The effect is interrelated with the stannous/stannic tin ratio. At normal treatment temperatures (45°C) changes in the ratio of stannous to stannic tin have little influence, however at higher ten^ jratures there is a significant affect. The higher the ratio of stannic to stannous tin, the poorer the alkaline solubility of precipitates produced at higher temperatures.
3. The lowering of the solubility of the hydrous tin oxide precipitates, in the absence of impurities, is believed to be controlled by the stannic component which is capable of undergoing an a/$ transformation, passing from a more soluble to less soluble form.

150. ,
4. Iron (Fe ), as an impurity, was found to improve the alkaline solubility of the precipitates. The ferriferro- cyanide complex was observed to have a similar effect.
2 + . .5. The addition of Mg as an impurity decreased the alkaline solubility of precipitates produced under normaltreatment conditions up to 0.2 g 1 ^
2+ .Mg . The effect of magnesium athigher treatment temperatures and times serves to modify the solubility in reverse; the solubility of poorly soluble precipitates is enhanced.The adsorption isotherm for Mg^+ with the hydrous tin oxides shows an inflection at 0.2 g 1 which is consistent with the change in solubility effects.
6. Calcium has a similar effect to magnesium in that it leads generally to lower solubilities.
3 +

151. ,
7. The effect of seawater on the solubility of hydrous tin oxide arises from its magnesium and calcium ion content.
8. The use of a nonionic polyelectrolyte (Magnafloc 351) was found to be incapable of modifying the influence of seawater contamination.
9. Precipitates formed in the presence of a nonionic polyelectrolyte, such as Magnafloc 351 or Alfloc 6701, exhibit good alkali solubility and rapid flocculation and sedimentation. As little as 5 mg 1 can produce significant effects. Opportunities are presented for modifying treatment cycles.
10. The effect of pH of precipitation (between 6.5 and 8.3) was found to be minimal in terms of the solubility of the precipitate..
1 1 . The reclamation of oxidised tin sludges by leaching in the rinse water recovery system has a deleterious affect by way of increasing the stannic concentration and fostering higher reaction temper-atures.

153 • i
12. Quiescent ageing (up to 56 days) of concentrated hydrated tin oxide precipitates from the treatment process does not influence tin recovery.

154.
8.0 REFERENCES
ADAMSON, A .W ., "Physical Chemistry of Surfaces", (Interscience Publishers Inc., New York, 1960).
ANDERSON, J.S., BOS, A., & OGDEN, J.S., Chem. Commun., 1971, 1381.
BARALEW, D., Kolloidzeitschrift, 1942, 97, 300
BARSOKOV, V.I. & KURIL'CHIKOVA, G.E., Geokhimiya, 1966 8, 943
BECKER, R. & DÖRING, W., Annin. Phys., 1935, 24, 719
BOLDYREV, V.V. & AVVAKUMOV, E.G., Russ, chem. Revs., 1971, 4<D (10) , 847
BRITTON, J.T.S., J. chem. Soc., 1925, 127, 2120
BYE, G.C. & SING, K.S.W., "Particle growth in Suspensions" Proceedings of a Symposium by Soc. of Chem. Ind. and Colloid and Surface Chemistry Group (edited A. Smith) 1973
COHEN, E., & BLEKKINGH, J.J.A., Z. phys. Chem., 1940 186, 257
COLLINS, G.E. AND WOOD, J.K., J. chem. Soc^, 1923,123, 452
COTTON, F.A. & WILKINSON, G., "Advanced Inorganic Chemistry" (Interscience Publishers, New York 1966)
DONALDSON, J.D., & MOSER, W., Analyst, Lond., 1959,£4, 10,
DONALDSON, J.D. & MOSER, W., J. chem. Soc. 1961, 835

155 • /
DONALDSON, J.D., MOSER, W., & SIMPSON, W.B., J. chem.Soc.y 1961, 839
DONALDSON, J.D., MOSER, W. & SIMPSON, W.B., J. chem.Soc., 1963, 1727
DUNDON, M.L. & MACK, E., J. Am. chem. Soc., 1923, 45,2479
FABRICHNYI, P.B., BABESHKIN, A.M., PORTYANOI, V.A., & NESMEYANOV, A.N., Zh. strukt, Khim, 1970, 11, (4), 772
FREISER, H. & FERNANDO, Q., "Ionic Equilibria in Analytical Chemistry" (John Wiley & Sons Inc., New York 1963)
GIESEKKE, E.W., GUTOWSKY, H.S., KIRKOV, P. & LAITINEN, H.A., Inorg. Chem. 1967, 6_ (7) , 1294
GRAHAM, T., J. Chem. Soc. 1864, 17, 318
GUTBIER, A., HUTTIG, G.F. & DÖBLING, H., Chem. Ber.,1926, 59B, 1232.
HARRISON, P.G. & THORNTON, E.W., J, chem. Soc., 1974 70, 461
HOPKINS, P., Australian Iron & Steel Pty. Ltd. Internal report CFPM/TC/75/035, 1975.
HIROSHI NISHIDA, Japan Analyst, 1964, 1_3 (1) , 59
HOWIE, R.A., & MOSER, W., Nature, Lond., 1968, 219, 372
JIRGENSON, B. & STRAUMANIS, M.E., "A Short Textbook of Colloid Chemistry" (Pergammon Press Ltd., New York 1962)

156 • r
KALABIN, V.N. & SHARKO, E.D., Yad. Magn. Rezonans, Leningrad Gos. Univ., 1968, 2, 123
KNAPP, L.T., Trans. Faraday Soc., 1922 , 1 4 5 7
KORENMAN, Y.I., Tr. po Khim i Khim Teckhnol., 1963 1, 146.
KRAUT, H. , Kolloidzeitschrift, 1929, 49_, 353
LA ROSA, C.N., GELD, I., TICKER, A., DI LAURO, S.F. & KALINSKY, J.L., Analyt. Chem., 1956 , 28 (9), 1447
LORANATHAN, P. & MAIER, W.J., J. Am. Wat. Wks Assn., 1975, 336
LORENZ, R., Z. anorg. Chem., 1895, 9, 369
LORENZ, R., Z. anorg. Chem., 1896, 1 2 , 436
MANTELL, C.L., "Tin" (Reinhold, New York 1949)
MATIJEVIC, E., "Surface and Colloid Science, Volume 4, (Wiley - Interscience; New York 1971)
MAY, D.R. & KOLTHOFF, I.M., J. phys. Colloid Chem., 1948, 5_2, 836
MECKLENBURGH, W., Z. anorg. Chem., 1909, 64, 368
MECKLENBURGH, w . , Z. anorg. C h e m . , 1912 , 74, 207
M E C K L E N B U R G H , w . , Z. anorg. C h e m . , 1914, 84, 121
MELLOR, J.W., "Comprehensive Treatise on Inorganic and Theoretical Chemistry" (Longmans, Green and Co. Ltd., London 1923).
157 • r
MENON, A.S., Kolloidzeitschrift, 19 37, 78 , 2 72
MUETTERTIES, E.L., Inorg. Chem., 1962, 1 (2), 342
NANCARROW, P. & WILTSHIRE, N.D., unpublished work, 1962
NEWBERRY, D.E., "Practical Scanning Electron Microscopy" edited J.J. Goldstein & H. Yakowitz (Plenum Press, New York 1975).
PAUDERT, R., LIEBSCHNER, S., & TRINKS, W., Chem. Tech. Berl., 1967, 19, 356
POSNJAK, E., J, Phys. Chem., 1926, 30, 1073
SCHAAP, W.B., DAVIS, J.A. & NEBERGALL, W.H., J. Am. chem. Soc. , 1954, _76 , 5226
SINGH, M., & BANSAAL, O.P., J, Indian chem. Soc.,1968, 4!5 (3) , 283
SLATER, S.J.E., B.Sc. Honours Thesis, W.U.C., University of New South Wales, 1967.
SNEED, M.C., & BRASTED, R.C., "Comprehensive Inorganic Chemistry", (Van Nostrand Co. Inc., New Jersey 1958).
SOMMERAUER, A., SUSSMAN, D.L. & STUMM, W . , Kolloidzeitschrift, 1968, 225, (2), 147
TARASOVA, D.V., DZIS'KO, V.A. & B A R A K O V S K I K H , T.B., Kinet. R a t a l, 1970, 'll, (5) , 1323
WEISER, H.B., J. Phys. Chem. 1922, 26, 654
WEISER, H.B., J. Phys. Chem., 1924, 2_8, 232
WEISER, H.B. & MILLIGAN, W . O . , J. Phys. Chem., 1932, 36 3030.
158 /
WILLARD, H.H. & DIEHL, A., Analysis" (D. van Nostrand 1943)
WILLSTATTER, R., KRAUT, H. 1924, 57B, 1491
VAN ZEGGERIN, F. & BENSON, 1957, 35, 1150
VOGEL, A.I. "A Textbook of Analysis" (Longmans, Green
"Advanced Quantitative Co., Inc. New Jersey,
& FREMERY, W., Chem. Ber.
G.C., Can. J, Chem.
Quantitative Inorganic & Co., London 1951)
ZSIGMONDY, R., 301, 368
Justus Liebigs Annin Chem., 1898,

9.0 ACKNOWLEDGEMENT
The author is grateful for the guidance and helpful discussions with Dr. J. Ellis and also for the assistance of personnel at Australian Iron and Steel Pty. Ltd. and Australian Wire Industries Pty. Ltd., without whose support the work would not have been possible. The author is also indebted to the personnel at the University of Newcastle for their assistance. The author sincerely appreciates the efforts of Mrs. J. Chapman in typing the thesis and also B.H.P. Central Research Laboratories for photographic reproductions.