The EY Financial Services Index 2nd quarter 2016FILE/...The Financial Services Index – 2nd quarter...
29
The EY Financial Services Index 2 nd quarter 2016
Transcript of The EY Financial Services Index 2nd quarter 2016FILE/...The Financial Services Index – 2nd quarter...

The EY Financial Services Index2nd quarter 2016

The Financial Services Index – 2nd quarter 2016 EY | 2
Table of contentsExecutive Summary ....................................................................................................................................3
The EY Financial Sector Confidence Index .....................................................................................................4
Retail banks ................................................................................................................................................6
Investment banks ......................................................................................................................................10
Asset management ...................................................................................................................................14
Life insurance ...........................................................................................................................................21
Technical note ..........................................................................................................................................25

The Financial Services Index – 2nd quarter 2016 EY | 3
Executive Summary• The EY Financial Services Confidence Index (EY FSI) increased from 51 in the first quarter to 59 in the second quarter of
2016.
• In the second quarter, three segments - retail banking, investment banking and asset management confidence increased,while life insurance confidence held steady.
• Despite these increases, confidence remained below their long-term average across all segments.
• Although retail bank cost growth remained steady, income growth was weak. As a result, net profits after tax growth slowedto its slowest pace since the middle of last year.
• The relatively low investment banking confidence levels could mainly be attributed to weak business volumes growth andprofits.
• Weak net inflows, poor income growth and much lower profit growth continued to weigh down asset managementconfidence.
• Of late slowing premium income growth and net profits has dampened life insurance confidence.

The Financial Services Index – 2nd quarter 2016 EY | 4
The EY Financial Sector Confidence IndexThe EY Financial Sector Confidence Index (EY FSI) increased from 51 in the first quarter to 59 in the second quarter of 20161,2.Despite the increase confidence remains relatively low given that it is somewhat below the long-term average of 76.
30
40
50
60
70
80
90
100
02 03 04 05 06 07 08 09 10 11 12 13 14 15 16
EY Finan Sector Confidence Index% rating bus conditions satisfactory
Long term average 0
20
40
60
80
100
02 03 04 05 06 07 08 09 10 11 12 13 14 15 16Retail B Invest B Asset Man Life Ins
Business confidence% rating bus cond satisfactory
Long term average
The percentage of respondents answering “satisfied” to the question “Are prevailing business conditions satisfactory orunsatisfactory?” is taken as the indicator of financial sector confidence.
The EY FSI reflects the unweighted average confidence of four segments of the financial sector, namely:
• retail banking,
• investment banking,
• asset management, and
• life insurance.
In the second quarter, confidence increased in three of the four segments and remained unchanged in one. Retail banking,investment banking and asset management confidence increased and life insurance confidence held steady relative to the firstquarter. Despite these increases, confidence remained below their long-term average in all the segments.
1. During the second quarter of 2016, respondents were asked to provide their views on the estimated developments for theperiod April to June 2016 and their expectations for the period July to September 2016. To improve the readability of thereport, we refer to the first period as “estimation of the second quarter of 2016” (16Q2) and the second period as“expectations for the third quarter of 2016” (16Q3).
2. The Bureau for Economic Research (BER) at Stellenbosch University conducted the survey and processed the results onbehalf of EY. The survey was conducted between 30 May and 13 June 2016. The results were processed on 14 June2016. The number of responses processed was: retail banks (15), investment banks (12), asset managers (30) and lifeinsurers (12).
The Financial Services Index – 2nd quarter 2016 EY | 5
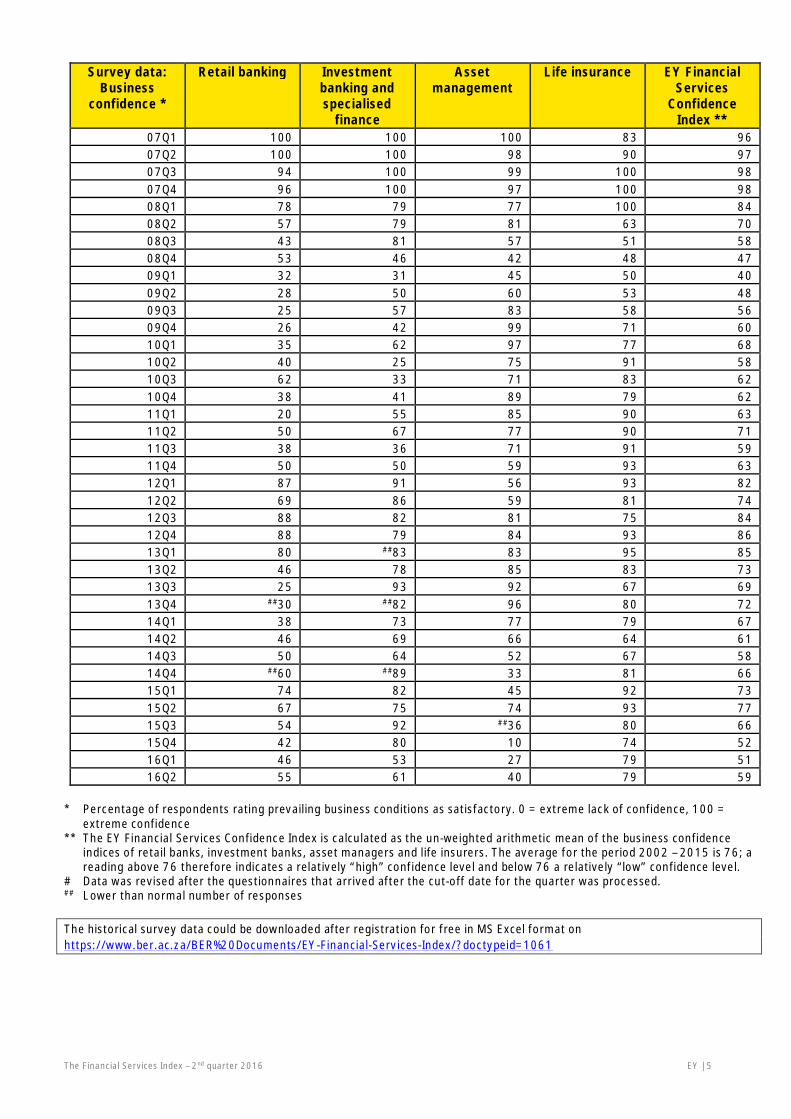
Survey data:Business
confidence *
Retail banking Investmentbanking andspecialised
finance
Assetmanagement
Life insurance EY FinancialServices
ConfidenceIndex **
07Q1 100 100 100 83 9607Q2 100 100 98 90 9707Q3 94 100 99 100 9807Q4 96 100 97 100 9808Q1 78 79 77 100 8408Q2 57 79 81 63 7008Q3 43 81 57 51 5808Q4 53 46 42 48 4709Q1 32 31 45 50 4009Q2 28 50 60 53 4809Q3 25 57 83 58 5609Q4 26 42 99 71 6010Q1 35 62 97 77 6810Q2 40 25 75 91 5810Q3 62 33 71 83 6210Q4 38 41 89 79 6211Q1 20 55 85 90 6311Q2 50 67 77 90 7111Q3 38 36 71 91 5911Q4 50 50 59 93 6312Q1 87 91 56 93 8212Q2 69 86 59 81 7412Q3 88 82 81 75 8412Q4 88 79 84 93 8613Q1 80 ##83 83 95 8513Q2 46 78 85 83 7313Q3 25 93 92 67 6913Q4 ##30 ##82 96 80 7214Q1 38 73 77 79 6714Q2 46 69 66 64 6114Q3 50 64 52 67 5814Q4 ##60 ##89 33 81 6615Q1 74 82 45 92 7315Q2 67 75 74 93 7715Q3 54 92 ##36 80 6615Q4 42 80 10 74 5216Q1 46 53 27 79 5116Q2 55 61 40 79 59
* Percentage of respondents rating prevailing business conditions as satisfactory. 0 = extreme lack of confidence, 100 =extreme confidence
** The EY Financial Services Confidence Index is calculated as the un-weighted arithmetic mean of the business confidenceindices of retail banks, investment banks, asset managers and life insurers. The average for the period 2002 – 2015 is 76; areading above 76 therefore indicates a relatively “high” confidence level and below 76 a relatively “low” confidence level.
# Data was revised after the questionnaires that arrived after the cut-off date for the quarter was processed.## Lower than normal number of responses
The historical survey data could be downloaded after registration for free in MS Excel format onhttps://www.ber.ac.za/BER%20Documents/EY-Financial-Services-Index/?doctypeid=1061
The Financial Services Index – 2nd quarter 2016 EY | 6
Despite weakening income and profits growth, retailbanks’ confidence levels riseThe second quarter of 2016 saw continued weakening economic fundamentals. GDP growth in the first quarter turnednegative, and came in considerably weaker than expectations. In line with this, unemployment figures rose yet again, indicatingthat 1 out of every 4 adults in South Africa is jobless. Business confidence remains at very low levels, all of which has resultedin rising consumer indebtedness, with limited affordability to take on additional debt. In addition, with no new jobs beingcreated, the banking sector has limited market growth to exploit.
Despite the sombre economic mood, retail banking confidence increased from 46 (out of 100) in the first quarter, to 55 in thesecond quarter of 2016. Whilst this is a noticeable rise in confidence, it nevertheless remains below long term levels (67 indexpoints).
The rise in confidence could be a result of Standard and Poor’s decision to maintain the country’s credit rating. A creditdowngrade would have pressured the banking industry’s cost of funding upwards, making a difficult trading environment evenmore challenging. A recovery in equity markets and the rand exchange rate during the survey period may also have supportedconfidence. (The fieldwork was completed before the onset of renewed financial market turmoil due to fears of a Brexit andpoor US employment numbers.)
These positive “psychological factors” probably outweighed the dampening effect of the deterioration in retail banks’ financialperformance.
Although the growth in costs remained contained, income growth was weak and as a result, growth in net profits after taxdecelerated to its slowest pace since the middle of last year.
Respondents expect income growth to slow significantly in the third quarter. To sustain profitability, they therefore plan tosubstantially cut cost increases.
On the positive side, given that credit losses remained steady, retail banks applied less stringent credit standards tohouseholds.

The Financial Services Index – 2nd quarter 2016 EY | 7
Survey data: Retail Banking 1 2014 2015 2016Q4## Q1 Q2 Q3 Q4 Q1 Q2 Q3*
1 Business confidence 2 60 74 67 54 42 46 552. Income
a) total income 3, 4 80 69 71 67 41 9 9 -14b) net interest income 3, 5 90 82 72 65 65 19 0c) fee income 3, 6 50 55 26 -6 29 4 -13d) investment income 3, 7 60 36 25 -8 6 -5 -16
3. Expenditurea) total operating expenses (excluding cost of funding) 3, 4 80 100 90 83 59 50 54 26b) credit losses 3, 8 30 -46 5 45 6 25 24c) total number of people employed 3 0 0 30 -5 -47 -41 -31
4. Efficiency and profitabilitya) cost-to-income ratio 3 10 9 0 0 0 -9 -13b) net profit after tax 3 70 55 10 11 41 32 9
5. Credit standards for approving applications for loans 3, 9
a) total 3, 4 30 -16 17 46 64 57 55 59b) households 3 25 0 19 61 75 58 45c) firms 3 30 20 6 20 28 30 27
* Expected## Lower than normal number of responses.
1. Retail banking consists of regular retail banking, private banking, micro lending, commercial banking and corporatebanking.
2. % satisfactory3. Net balance (see Technical Note at the end of the report)4. The total reflects the responses of participants. It is therefore not calculated as the average of the responses to the
components. Each data series has to be considered on its own. Deviations between the total and components occurwhen participants reply “the same” given that the net balance statistic does not take “the same” responses intoaccount. The fact that respondents only answer questions applicable to them and that missing items are not imputedalso have an effect.
5. Interest income less interest expenses6. Fees and commission7. “Investment income” refers to all income from investments and not the investment return. It excludes deferred
income and capital depreciation, but includes realised and unrealised capital gains and losses on investments.8. Value of non-performing loans until 09Q29. Credit standards refer to the terms of the loans and credit lines, such as maximum size, spread of loan rates over
bank’s cost of funds, premiums charged on riskier loans, collateral requirements etc.

The Financial Services Index – 2nd quarter 2016 EY | 8
20
40
60
80
100
02 03 04 05 06 07 08 09 10 11 12 13 14 15 16
Retail Bank Confidence% rating bus cond satisfactory
Long term average
-20
0
20
40
60
80
13Q1 13Q3 14Q1 14Q3 15Q1 15Q3 16Q1 16Q3
Total incomeNet balance: % up less % down
Expected
0
20
40
60
80
100
13Q1 13Q3 14Q1 14Q3 15Q1 15Q3 16Q1 16Q3
Net interest incomeNet balance: % up less % down
-20
0
20
40
60
80
13Q1 13Q3 14Q1 14Q3 15Q1 15Q3 16Q1 16Q3
Fee incomeNet balance: % up less % down
-20
0
20
40
60
13Q1 13Q3 14Q1 14Q3 15Q1 15Q3 16Q1 16Q3
Investment incomeNet balance: % up less % down
20
40
60
80
100
13Q1 13Q3 14Q1 14Q3 15Q1 15Q3 16Q1 16Q3
Total operating expenses (excl cost offunds), net balance: % up less % down
Expected

The Financial Services Index – 2nd quarter 2016 EY | 9
-80
-60
-40
-20
0
20
40
60
80
02Q1 04Q1 06Q1 08Q1 10Q1 12Q1 14Q1 16Q1
Number of people employedNet balance: % up less % down
-60
-40
-20
0
20
40
60
80
13Q1 13Q3 14Q1 14Q3 15Q1 15Q3 16Q1 16Q3
Credit lossesNet balance: % up less % down
-20
0
20
40
60
80
13Q1 13Q3 14Q1 14Q3 15Q1 15Q3 16Q1 16Q3
Credit standards for approving loansNet balance: % up less % down
Long term average
Expected
0
20
40
60
80
13Q1 13Q3 14Q1 14Q3 15Q1 15Q3 16Q1 16Q3
Households Firms
Credit standards for approving loansNet balance: % up less % down
-40
-20
0
20
40
60
13Q1 13Q3 14Q1 14Q3 15Q1 15Q3 16Q1 16Q3
Cost to income ratioNet balance: % up less % down
0
20
40
60
80
100
13Q1 13Q3 14Q1 14Q3 15Q1 15Q3 16Q1 16Q3
Net profit after taxNet balance: % up less % down

The Financial Services Index – 2nd quarter 2016 EY | 10
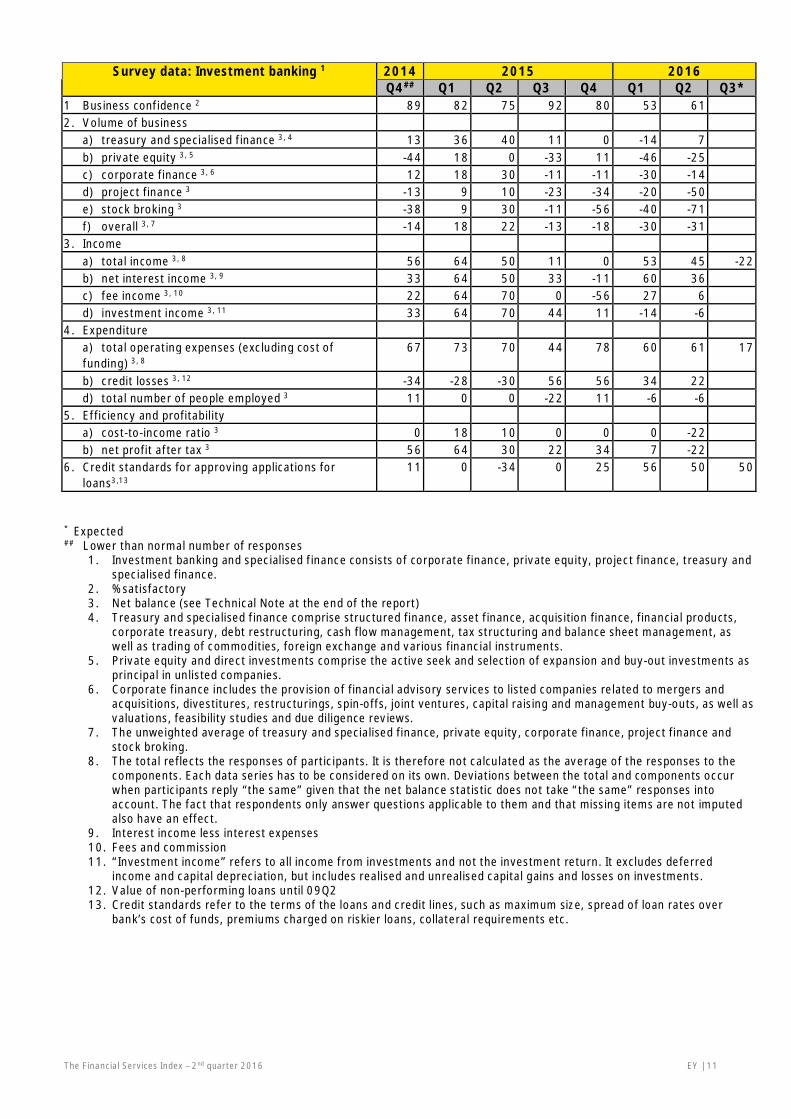
Investment bank confidence recovers from a weak firstquarterAfter falling from 80 in the fourth quarter of 2015 to 53 in the first quarter, investment banking confidence recoveredsomewhat in the second quarter, to 61 index points. Nevertheless, confidence remains low from a historical perspective. Theslight boost to confidence could well stem from S&P’s decision to maintain the country’s sovereign risk rating. This in turn keptthe cost of funding steady.
The low confidence level could be attributed to weakening business volumes and the impact of these lower volumes on bottomline profits.
Business conditions remained challenging. While some business segments (such as private equity and corporate finance)performed satisfactorily, others (such as project finance and stock broking) deteriorated further during the quarter. Treasuryand specialised finance were the only segments to improve more noticeably.
The second quarter saw total income increasing in line with first quarter levels. The growth in net interest and fee incomedecelerated. Investment income improved, but remains very weak in comparison with the last three years.
However, bottom line profits shrunk sharply during the quarter, despite a substantial fall in efficiency ratios. This is the firsttime in over four years that investment banks reported a quarterly contraction in profits.
Respondents are very pessimistic about the third quarter, expecting income growth to drop sharply. As a result, they plan toslash costs by a large margin.
Although edging lower, credit losses continued to increase at a high rate in the second quarter. As a result, investment bankskept credit standards almost unchanged at the same relatively tight level as the first quarter.
The Financial Services Index – 2nd quarter 2016 EY | 11
Survey data: Investment banking 1 2014 2015 2016Q4## Q1 Q2 Q3 Q4 Q1 Q2 Q3*
1 Business confidence 2 89 82 75 92 80 53 612. Volume of business
a) treasury and specialised finance 3, 4 13 36 40 11 0 -14 7b) private equity 3, 5 -44 18 0 -33 11 -46 -25c) corporate finance 3, 6 12 18 30 -11 -11 -30 -14d) project finance 3 -13 9 10 -23 -34 -20 -50e) stock broking 3 -38 9 30 -11 -56 -40 -71f) overall 3, 7 -14 18 22 -13 -18 -30 -31
3. Incomea) total income 3, 8 56 64 50 11 0 53 45 -22b) net interest income 3, 9 33 64 50 33 -11 60 36c) fee income 3, 10 22 64 70 0 -56 27 6d) investment income 3, 11 33 64 70 44 11 -14 -6
4. Expenditurea) total operating expenses (excluding cost offunding) 3, 8
67 73 70 44 78 60 61 17
b) credit losses 3, 12 -34 -28 -30 56 56 34 22d) total number of people employed 3 11 0 0 -22 11 -6 -6
5. Efficiency and profitabilitya) cost-to-income ratio 3 0 18 10 0 0 0 -22b) net profit after tax 3 56 64 30 22 34 7 -22
6. Credit standards for approving applications forloans3,13
11 0 -34 0 25 56 50 50
* Expected## Lower than normal number of responses
1. Investment banking and specialised finance consists of corporate finance, private equity, project finance, treasury andspecialised finance.
2. % satisfactory3. Net balance (see Technical Note at the end of the report)4. Treasury and specialised finance comprise structured finance, asset finance, acquisition finance, financial products,
corporate treasury, debt restructuring, cash flow management, tax structuring and balance sheet management, aswell as trading of commodities, foreign exchange and various financial instruments.
5. Private equity and direct investments comprise the active seek and selection of expansion and buy-out investments asprincipal in unlisted companies.
6. Corporate finance includes the provision of financial advisory services to listed companies related to mergers andacquisitions, divestitures, restructurings, spin-offs, joint ventures, capital raising and management buy-outs, as well asvaluations, feasibility studies and due diligence reviews.
7. The unweighted average of treasury and specialised finance, private equity, corporate finance, project finance andstock broking.
8. The total reflects the responses of participants. It is therefore not calculated as the average of the responses to thecomponents. Each data series has to be considered on its own. Deviations between the total and components occurwhen participants reply “the same” given that the net balance statistic does not take “the same” responses intoaccount. The fact that respondents only answer questions applicable to them and that missing items are not imputedalso have an effect.
9. Interest income less interest expenses10. Fees and commission11. “Investment income” refers to all income from investments and not the investment return. It excludes deferred
income and capital depreciation, but includes realised and unrealised capital gains and losses on investments.12. Value of non-performing loans until 09Q213. Credit standards refer to the terms of the loans and credit lines, such as maximum size, spread of loan rates over
bank’s cost of funds, premiums charged on riskier loans, collateral requirements etc.

The Financial Services Index – 2nd quarter 2016 EY | 12
20
40
60
80
100
02 03 04 05 06 07 08 09 10 11 12 13 14 15 16
Investment bank confidence% rating bus cond satisfactory
Long term average -80
-60
-40
-20
0
20
40
60
80
10Q1 11Q1 12Q1 13Q1 14Q1 15Q1 16Q1
Treasury Priv Eq Corp Fin Proj Fin Stock B
Business volumesNet balance: % up less % down
Long term average
-40
-20
0
20
40
60
80
13Q1 13Q3 14Q1 14Q3 15Q1 15Q3 16Q1 16Q3
Total incomeNet balance: % up less % down
Expected
-20
0
20
40
60
80
13Q1 13Q3 14Q1 14Q3 15Q1 15Q3 16Q1 16Q3
Net interest incomeNet balance: % up less % down
-60
-40
-20
0
20
40
60
80
13Q1 13Q3 14Q1 14Q3 15Q1 15Q3 16Q1 16Q3
Fee incomeNet balance: % up less % down
-20
0
20
40
60
80
13Q1 13Q3 14Q1 14Q3 15Q1 15Q3 16Q1 16Q3
Investment incomeNet balance: % up less % down

The Financial Services Index – 2nd quarter 2016 EY | 13
0
20
40
60
80
13Q1 13Q3 14Q1 14Q3 15Q1 15Q3 16Q1 16Q3
Total operating expenses (excl cost offunds), net balance: % up less % down
Expected
-40
-20
0
20
40
60
80
02Q1 04Q1 06Q1 08Q1 10Q1 12Q1 14Q1 16Q1
Number of people employedNet balance: % up less % down
-60
-40
-20
0
20
40
60
13Q1 13Q3 14Q1 14Q3 15Q1 15Q3 16Q1 16Q3
Credit lossesNet balance: % up less % down
-40
-20
0
20
40
60
13Q1 13Q3 14Q1 14Q3 15Q1 15Q3 16Q1 16Q3
Credit standards for approving loansNet balance: % up less % down
Long term average
Expected
-40
-20
0
20
40
60
80
100
13Q1 13Q3 14Q1 14Q3 15Q1 15Q3 16Q1 16Q3
Cost to income ratioNet balance: % up less % down
-40
-20
0
20
40
60
80
100
13Q1 13Q3 14Q1 14Q3 15Q1 15Q3 16Q1 16Q3
Net profit after taxNet balance: % up less % down

The Financial Services Index – 2nd quarter 2016 EY | 14
Asset management confidence recovers on strongerprofit trendsThe second quarter of 2016 saw somewhat stronger capital market gains, and less currency depreciation than experienced inthe preceding quarters. This was on the back of improving emerging market sentiment, and encouraged by revival incommodity prices across the board. This resulted in a somewhat more supportive operating environment for asset managers.
After falling to a record low 10 index points in the fourth quarter of 2015, asset manager confidence recovered to 27 in thefirst quarter and further to 40 in the second quarter of 2016.
Although higher than during the previous three quarters, second quarter confidence remained low from a historicalperspective. Weak net inflows, poor income growth and much lower profit growth continued to weigh down confidence.However, improving capital markets during the survey period may have lifted the spirits of some managers. In addition,progress in cost control and the resultant further improvement in net profits after tax also supported higher confidence levels.
During the second quarter, net inflows remained in line with weak first quarter levels. Large managers were impactedparticularly hard. The waning net inflows could be partly attributed to the deterioration in household finances and partly to aprecautionary shift away from more risky equity investments to more stable, safer and higher return bank deposits followingthe rise in interest rates.
Asset managers are hopeful that net inflows will rebound in the third quarter.
After decelerating sharply during the second half of 2015, income growth rebounded in the first half of 2016. Despite thisimprovement, the rate of increase is still below that registered at any time since the global financial crisis. A slight rise inaverage management fees supported income growth, but these remain well below 2013 and 2014 levels.
Asset managers kept cost increases contained by cutting back all components, namely back office, IT, marketing anddistribution costs. They also reduced their headcounts further and cut bonus payments.
Profits were flat in the 2nd quarter, an improvement on the previous three quarters of shrinking profits. However, the latestquarter is the fifth consecutive quarter of either flat or shrinking profits, illustrating why the asset management’s confidencelevels are the lowest across financial services.

The Financial Services Index – 2nd quarter 2016 EY | 15
Survey data: Asset management – All 2014 2015 2016Q4 Q1 Q2 Q3# Q4 Q1 Q2 Q3*
1 Business confidence 1 33 45 74 36 10 27 402. Net inflows
a) Total net inflows 2, 3 -37 29 20 -9 -38 -30 -35 -5b) Institutional net inflows 2, 4 -27 -19 -15 -44 -55 -49 -49c) Unit trust net inflows: total 2, 3 -4 22 -6 -15 -26 -12 -18
i) Institutional 2, 4 -26 14 -20 -53 -73 -57 -32ii) Retail 2, 5 45 46 -19 -25 -31 -27 -16
d) Private client net inflows 2 0 10 1 -21 -40 -19 -113. Income
a) Total income 2, 3 42 26 18 -31 -63 -29 -8 15b) Average management fees charged 2 8 -12 -27 -12 -15 -14 -4
4. Expensesa) Total expenses 2, 3 61 19 32 22 23 19 18 7b) number of people employed: total 2, 3 -3 9 6 20 5 -5 -13c) back office costs 2 38 23 15 22 47 34 2d) IT and systems costs 2 67 3 10 33 49 42 18e) marketing costs 2 23 -10 -13 -18 10 17 -3f) other distribution costs 2 57 58 47 31 28 10 -15g) bonuses paid 2 26 4 -30 -29 -54 -35 -62
5. ProfitabilityNet profit after tax 2, 3 20 6 1 -29 -60 -14 0
* Expected# Data was revised after the questionnaires that arrived after the cut-off date for the quarter was processed.% satisfactory, weighted according to firm size
1. Net balance (see Technical Note at the end of the report), weighted according to firm size2. The total reflects the responses of participants. It is therefore not calculated as the average of the responses to the
components. Each data series has to be considered on its own. Deviations between the total and components occurwhen participants reply “the same” given that the net balance statistic does not take “the same” responses intoaccount. The fact that respondents only answer questions applicable to them and that missing items are not imputedalso have an effect.
3. According to the Association of Collective Investments (ACI), an institutional fund is a fund in which an individualinvestor cannot invest. The units are held in the name of structures such as pension funds, provident funds,companies, endowment policies and structured funds.
4. According to the ACI, a retail fund is a fund in which individual investors can invest directly and indirectly and theinvestments are held in their names. Direct investments take place when individual investors deal directly with themanagement companies. Indirect investments take place when a reseller (LISP) or third party (e.g. a broker) acts as ago-between the individual investors and the management companies.

The Financial Services Index – 2nd quarter 2016 EY | 16
0
20
40
60
80
100
02 03 04 05 06 07 08 09 10 11 12 13 14 15 16
Asset management confidence% rating bus cond satisfactory
Long term average
-40
-20
0
20
40
60
13Q1 13Q3 14Q1 14Q3 15Q1 15Q3 16Q1 16Q3
Total net inflows: All firmsWeighted,net balance: % up less % down
Expected
-60
-40
-20
0
20
40
60
13Q1 13Q3 14Q1 14Q3 15Q1 15Q3 16Q1 16Q3
Institutional net inflows: All firmsWeighted,net balance: % up less % down
-40
-20
0
20
40
60
13Q1 13Q3 14Q1 14Q3 15Q1 15Q3 16Q1 16Q3
Unit trust net inflows: All firmsWeighted,net balance: % up less % down
-40
-30
-20
-10
0
10
20
30
13Q1 13Q3 14Q1 14Q3 15Q1 15Q3 16Q1 16Q3
Private client net inflows: All firmsWeighted,net balance: % up less % down
-80
-60
-40
-20
0
20
40
60
80
100
13Q1 13Q3 14Q1 14Q3 15Q1 15Q3 16Q1 16Q3
Total income: All firmsWeighted,net balance: % up less % down
Expected

The Financial Services Index – 2nd quarter 2016 EY | 17
-40
-20
0
20
40
60
13Q1 13Q3 14Q1 14Q3 15Q1 15Q3 16Q1 16Q3
Avg management fees charged: All firmsWeighted,net balance: % up less % down
0
20
40
60
80
100
13Q1 13Q3 14Q1 14Q3 15Q1 15Q3 16Q1 16Q3
Total expenses: All firmsWeighted,net balance: % up less % down
Expected
-20
0
20
40
60
80
13Q1 13Q3 14Q1 14Q3 15Q1 15Q3 16Q1 16Q3
No of people employed: All firmsWeighted,net balance: % up less % down
-80
-60
-40
-20
0
20
40
60
80
13Q1 13Q3 14Q1 14Q3 15Q1 15Q3 16Q1 16Q3
Back office IT Marketing Other distrib Bonuses
Costs: All firmsWeighted,net balance: % up less % down
0
10
20
30
40
50
60
70
80
13Q1 13Q3 14Q1 14Q3 15Q1 15Q3 16Q1 16Q3
Back office costs: All firmsWeighted,net balance: % up less % down
-60
-40
-20
0
20
40
60
80
100
13Q1 13Q3 14Q1 14Q3 15Q1 15Q3 16Q1 16Q3
Net profit after tax: All firmsWeighted,net balance: % up less % down
The Financial Services Index – 2nd quarter 2016 EY | 18
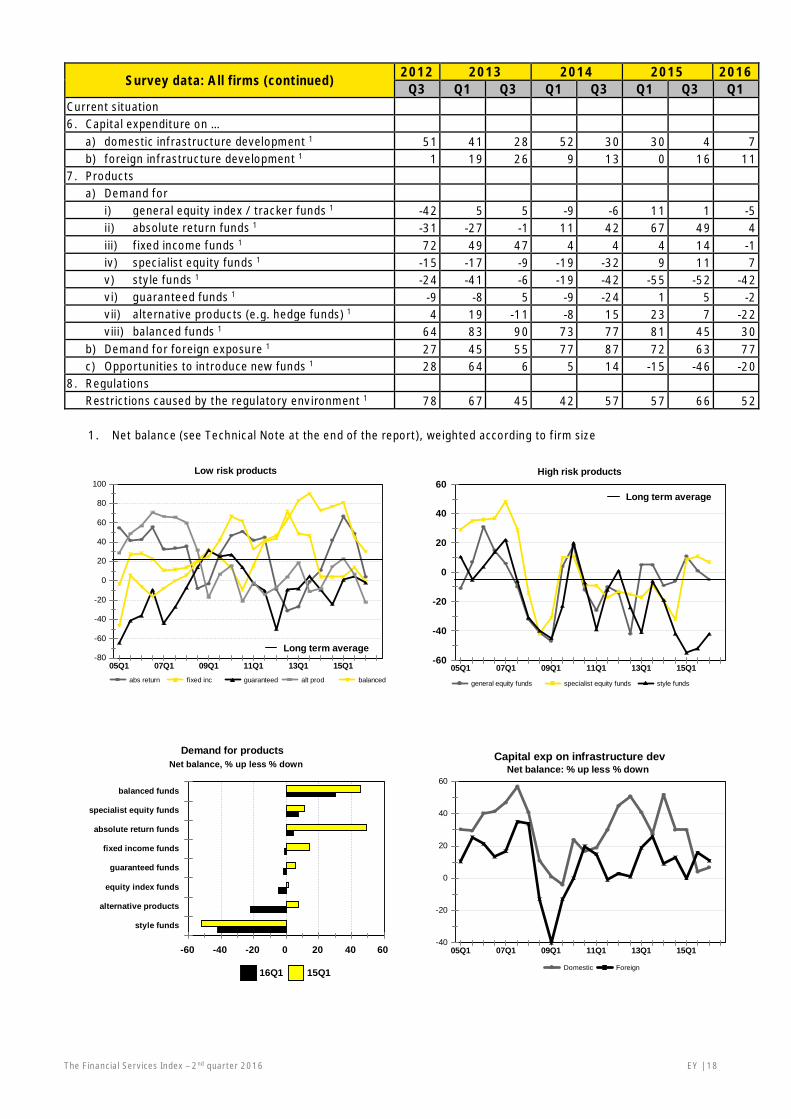
Survey data: All firms (continued) 2012 2013 2014 2015 2016Q3 Q1 Q3 Q1 Q3 Q1 Q3 Q1
Current situation6. Capital expenditure on …
a) domestic infrastructure development 1 51 41 28 52 30 30 4 7b) foreign infrastructure development 1 1 19 26 9 13 0 16 11
7. Productsa) Demand for
i) general equity index / tracker funds 1 -42 5 5 -9 -6 11 1 -5ii) absolute return funds 1 -31 -27 -1 11 42 67 49 4iii) fixed income funds 1 72 49 47 4 4 4 14 -1iv) specialist equity funds 1 -15 -17 -9 -19 -32 9 11 7v) style funds 1 -24 -41 -6 -19 -42 -55 -52 -42vi) guaranteed funds 1 -9 -8 5 -9 -24 1 5 -2vii) alternative products (e.g. hedge funds) 1 4 19 -11 -8 15 23 7 -22viii) balanced funds 1 64 83 90 73 77 81 45 30
b) Demand for foreign exposure 1 27 45 55 77 87 72 63 77c) Opportunities to introduce new funds 1 28 64 6 5 14 -15 -46 -20
8. RegulationsRestrictions caused by the regulatory environment 1 78 67 45 42 57 57 66 52
1. Net balance (see Technical Note at the end of the report), weighted according to firm size
-80
-60
-40
-20
0
20
40
60
80
100
05Q1 07Q1 09Q1 11Q1 13Q1 15Q1abs return fixed inc guaranteed alt prod balanced
Low risk products
Long term average-60
-40
-20
0
20
40
60
05Q1 07Q1 09Q1 11Q1 13Q1 15Q1
general equity funds specialist equity funds style funds
High risk products
Long term average
-60 -40 -20 0 20 40 60
style funds
alternative products
equity index funds
guaranteed funds
fixed income funds
absolute return funds
specialist equity funds
balanced funds
16Q1 15Q1
Demand for productsNet balance, % up less % down
-40
-20
0
20
40
60
05Q1 07Q1 09Q1 11Q1 13Q1 15Q1
Domestic Foreign
Capital exp on infrastructure devNet balance: % up less % down

The Financial Services Index – 2nd quarter 2016 EY | 19
Survey data: Asset management – SmallFirms 1
2014 2015 2016*Q4 Q1 Q2 Q3# Q4 Q1 Q2 Q3*
1 Business confidence 2 59 53 58 39 38 55 572. Net inflows
a) Total net inflows 3, 4 14 41 -6 -18 -19 4 -6 29b) Institutional net inflows 3, 5 0 35 -21 -74 -61 -16 -16c) Unit trust net inflows: total 3, 4 38 23 25 5 -18 18 35
i) Institutional 3 9 29 12 -16 -59 -14 28ii) Retail 3 62 35 44 10 18 15 25
d) Private client net inflows 3 60 67 73 31 5 33 383. Income
a) Total income 3, 4 46 29 -11 -31 -24 15 24 44b) Average management fees charged 3 0 0 0 -27 4 -3 -3
4. Expensesa) Total expenses 3, 4 76 71 78 70 48 20 18 6b) number of people employed: total 3, 4 50 53 42 61 33 25 35c) back office costs 3 4 0 16 4 -14 27 13d) IT and systems costs 3 18 0 16 30 -4 32 40e) marketing costs 3 9 0 0 13 5 23 35f) other distribution costs 3 23 24 21 -9 9 8 11g) bonuses paid 3 18 -35 -58 0 -9 4 -32
5. ProfitabilityNet profit after tax:3, 4 46 12 -31 5 -10 16 8
* Expected# Data was revised after the questionnaires that arrived after the cut-off date for the quarter was processed.
1. Firms with funds under management of less than R40 billion in 2013.2. % satisfactory3. Net balance (see Technical Note at the end of the report), weighted according to firm size4. The total reflects the responses of participants. It is therefore not calculated as the average of the responses to the
components. Each data series has to be considered on its own. Deviations between the total and components occurwhen participants reply “the same” given that the net balance statistic does not take “the same” responses intoaccount. The fact that respondents only answer questions applicable to them and that missing items are not imputedalso have an effect.
5. Private pension funds, public pension funds managed on behalf of the Public Investment Commissioners (PIC), lifefunds, medical aid funds, etc.

The Financial Services Index – 2nd quarter 2016 EY | 20
Survey data: Asset management – Largefirms 1
2014 2015 2016Q4 Q1 Q2 Q3 Q4 Q1 Q2 Q3*
1 Business confidence 2 21 42 79 34 0 0 252.Net inflows
a) Total net inflows 3, 4 -60 24 27 -6 -44 -63 -62 -35b) Institutional net inflows 3, 5 -40 -37 -13 -31 -52 -82 -75c) Unit trust net inflows: total 3, 4 -32 21 -12 -22 -28 -44 -57
i) Institutional 3 -42 9 -28 -65 -76 -91 -75ii) Retail 3 37 50 -35 -36 -44 -63 -48
d) Private client net inflows 3 -21 -8 -21 -40 -52 -63 -483.Income
a) Total income 3, 4 39 24 26 -31 -76 -72 -37 -10b) Average management fees charged 3 12 -17 -33 -5 -20 -24 -5
4.Expensesa) Total expenses 3, 4 54 4 19 3 14 17 18 8b) number of people employed: total 3, 4 -27 -6 -5 4 -5 -34 -57c) back office costs 3 52 31 14 29 66 41 -7d) IT and systems costs 3 90 4 8 33 66 52 -2e) marketing costs 3 30 -15 -17 -31 11 11 -38f) other distribution costs 3 73 71 56 46 35 11 -38g) bonuses paid 3 30 19 -22 -39 -68 -72 -88
5.ProfitabilityNet profit after tax 3, 4 8 4 11 -40 -76 -47 -9
* Expected1. Firms with funds under management in excess of R40 billion in 2013.2. % satisfactory3. Net balance (see Technical Note at the end of the report), weighted according to firm size4. The total reflects the responses of participants. It is therefore not calculated as the average of the responses to the
components. Each data series has to be considered on its own. Deviations between the total and components occurwhen participants reply “the same” given that the net balance statistic does not take “the same” responses intoaccount. The fact that respondents only answer questions applicable to them and that missing items are not imputedalso have an effect.
5. Private pension funds, public pension funds managed on behalf of the Public Investment Commissioners (PIC), lifefunds, medical aid funds, etc.

The Financial Services Index – 2nd quarter 2016 EY | 21
Life insurance confidence remains steadyLife insurers have largely evaded the weak economy that have impacted other sectors of the economy more visibly. Despite thecontinued lack of employment growth, coupled with pressured consumer and household income, premium levels wereremarkably strong in the 2nd quarter, with growth rising nearly threefold from Q1 levels.
Despite the sustained weak economy, life insurer confidence remained unchanged at 79 in the second quarter of 2016.Although it is the highest of all the segments across the financial services sector, life insurer confidence is relatively low incomparison with its long term average.
After falling sharply in the second half of 2015, premium income growth (from both risk and investment contracts) reboundedin the first half of 2016. Although risk business delivered strong growth, investment business remains relatively constrained. Inaddition, there were further strong rises in new business premiums and investment income, coupled with lower lapses. Thisbodes well for income growth over the upcoming few quarters.
Life insurers cut back again on administration and marketing cost increases.
Notwithstanding improved cost control, net profits after tax edged lower due to declining profitability of risk business. Even so,profits growth far exceeds the other segments of financial services.

The Financial Services Index – 2nd quarter 2016 EY | 22
Survey data: Life Insurance 1 2014 2015 2016Q4 Q1 Q2 Q3 Q4 Q1 Q2 Q3*
1 Business confidence 2 81 92 93 80 74 79 792. Inflow
a) total inflow 3, 4 64 -3 14 49 -22 23 74b) total premium income 3, 5 73 -4 16 58 -28 34 90 51
i) risk business / no of new contracts 3 12 49 78 24 -9 27 67ii) investment business (only individual business) 3 5 -50 -30 -70 -100 -51 -30
c) new business premium income 3 78 89 76 40 9 28 67d) lapses / no of contracts terminated 3 -20 -47 -25 -13 -9 26 8e) investment income 3, 6 27 2 7 14 3 -20 12
3. Outflowa) total outflow 3, 7 59 58 57 69 81 69 70b) benefits 3 59 58 55 69 81 70 72 84c) value of surrenders 3 31 -13 2 46 17 27 47d) sales remuneration 3, 8 53 68 80 72 57 64 84e) administration and marketing expenses 3 61 53 75 71 76 64 54f) number of full-time admin employees 3, 9 53 14 -2 -7 -2 -18 -38g) number of in-house agents 3 -27 51 57 31 56 -13 -35
4. Profitabilitya) net profit after tax 3 39 -51 36 87 51 56 36b) profitability of risk business 3 -30 -45 28 18 23 44 8c) administration expenses as % of premium income 3 -10 69 41 16 61 38 -30d) value of new business 3 32 28 29 16 -54 42 41
* Expected1. Individual life and retirement annuities business plus group life and employee benefit business.2. % satisfactory, weighted according to firm size3. Net balance (see Technical Note at the end of the report), weighted according to firm size4. Weighted net balance (80% total premium income + 20% investment income)5. The total reflects the responses of participants. It is therefore not calculated as the average of the responses to the
components. Each data series has to be considered on its own. Deviations between the total and components occurwhen participants reply “the same” given that the net balance statistic does not take “the same” responses intoaccount. The fact that respondents only answer questions applicable to them and that missing items are not imputedalso have an effect.
6. “Investment income” refers to all income from investments and not the investment return. It includes dividend,interest, rental and other non-capital investment income, as well as realised and unrealised capital gains and losses oninvestments.
7. Weighted net balance (90% benefits + 10% administration and marketing expenses)8. Distribution costs and commissions.9. Excluding field staff

The Financial Services Index – 2nd quarter 2016 EY | 23
40
50
60
70
80
90
100
02 03 04 05 06 07 08 09 10 11 12 13 14 15 16
Life insurance confidence% rating bus cond satisfactory
Long term average
-40
-20
0
20
40
60
80
100
13Q1 13Q3 14Q1 14Q3 15Q1 15Q3 16Q1 16Q3
Total premium incomeNet balance: % up less % down
Long term average
Expected
-20
0
20
40
60
80
100
13Q1 13Q3 14Q1 14Q3 15Q1 15Q3 16Q1 16Q3
Premium income: Risk businessNet balance: % up less % down
Long term average
-100
-80
-60
-40
-20
0
20
40
13Q1 13Q3 14Q1 14Q3 15Q1 15Q3 16Q1 16Q3
Premium income: Investment businessNet balance: % up less % down
Long term average
-40
-20
0
20
40
60
13Q1 13Q3 14Q1 14Q3 15Q1 15Q3 16Q1 16Q3
Investment incomeNet balance: % up less % down
-20
0
20
40
60
80
100
13Q1 13Q3 14Q1 14Q3 15Q1 15Q3 16Q1 16Q3
New business premium incomeNet balance: % up less % down
Long term average

The Financial Services Index – 2nd quarter 2016 EY | 24
-60
-40
-20
0
20
40
13Q1 13Q3 14Q1 14Q3 15Q1 15Q3 16Q1 16Q3
LapsesNet balance: % up less % down
Long term average50
60
70
80
90
13Q1 13Q3 14Q1 14Q3 15Q1 15Q3 16Q1 16Q3
BenefitsNet balance: % up less % down
Long term average
Expected
-20
0
20
40
60
80
13Q1 13Q3 14Q1 14Q3 15Q1 15Q3 16Q1 16Q3
Value of surrendersNet balance: % up less % down
Long term average10
20
30
40
50
60
70
80
13Q1 13Q3 14Q1 14Q3 15Q1 15Q3 16Q1 16Q3
Administration and marketing expensesNet balance: % up less % down
Long term average
-60
-40
-20
0
20
40
60
80
100
13Q1 13Q3 14Q1 14Q3 15Q1 15Q3 16Q1 16Q3
Net profit after taxNet balance: % up less % down
Long term average
-60
-40
-20
0
20
40
60
80
13Q1 13Q3 14Q1 14Q3 15Q1 15Q3 16Q1 16Q3
Profitability of risk businessNet balance: % up less % down
Long term average
The Financial Services Index – 2nd quarter 2016 EY | 25
Technical note
A document with more information on the survey method is available on www.ber.ac.za . Click the button named “Services” andthen select “Surveys” and finally “Financial Services”. Alternatively, click on “EY Financial Survey” on the home page and then on“Financial Services” under Quick Links.
Survey methodThe BER started conducting surveys amongst retail and investment banks in 2002. The scope of the survey was expanded to assetmanagers and life insurers in 2003.
EY, the international accounting and business advisory firm, not only supports the financial sector survey financially, but also madevaluable inputs to the design and makes the overall results public. However, the BER conducts the survey and interprets theresults. The BER treats the identities of participants and individual responses as confidential and does not reveal this information toany third party, including the sponsoring firm.
The division heads of all the major retail banks, investment banks, asset managers and life insurers operating in South Africaparticipate in the survey.
The survey results reveal current and expected changes in income, expenses and profitability for these firms’ South Africaoperations only. Industry specific issues, such as banks’ credit standards and the demand for various products of asset managers,are covered during the first and third quarter surveys.
The surveys are conducted during March, June, September and December. The results reflect developments per calendar quarter,i.e. the first quarter reflect developments during January, February and March; the second quarter reflects April, May and Juneetc.
On occasion questionnaires reach us after the date on which the results of the current quarter are processed. Small revisions of thesurvey results of the previous quarter could occur when we process such questionnaires at a later stage.
The need for the financial sector surveySouth Africa has one of the most advanced financial sectors of all emerging market economies and its development is in manyrespects on par with those of industrialised countries – and yet its performance is not measured regularly and consistently. There isa general consensus on the need for a regular, consistent and impartial financial services survey, from managers in the financialsector to financial analysts.
The contribution of the financial sector to GDP has in-creased over the past decade and stood at 9.7% during 2011. Thecontribution of – for example – real estate (6.0%), transport (6.6%) and retail trade (7.2%) are all lower compared to that of thefinancial sector. However, the general government (16.5%), manufacturing (12.8%) and mining (10.2%) are bigger.
Despite its importance, current information on the performance of the financial sector lags behind:
• Statistics SA publishes GDP and employment figures for the sector covering financial intermediation, insurance, real estate andbusiness services with a lag of one quarter and no details about the sector’s financial performance.
• The compulsory monthly BA 120 (DI 200 until 2007) returns of banks to and the Annual Report of the Bank SupervisionDepartment of the Reserve Bank, the Quarterly Financial Stability Review of the Financial Stability Department of the ReserveBank and the Annual Report of the Financial Services Board (FSB) provide detailed information about the performance of banksand other financial institutions, but the information is made public with a lag in time except for the BA 120 returns.
• The interim and annual reports of listed financial companies provide information about their performance, but these reportsappear at irregular intervals (their release dates depend on the financial year-ends of the different companies) and the resultsare not always comparable.
• The periodic Price Waterhouse Coopers (PWC) Survey, although entirely relevant in relation to its intended target market andultimate aim, differs fundamentally from the EY financial services survey. The EY survey measures the same performancecriteria of financial institutions over time, appears quarterly and the results are obtained by means of short questionnaires.

The Financial Services Index – 2nd quarter 2016 EY | 26
• The quarterly unit trust and bi-annual life insurance reviews of the Association for Savings and Investment SA (ASISA) areuseful. However, the unit trust review does not provide information on the financial performance of management companies andthe life insurance review is only published twice a year.
• The investment performance and strategy of asset managers are measured regularly (e.g. Alexander Forbes and Plexus), but noregular, consistent measure of income and expenditure of asset managers exist.

The Financial Services Index – 2nd quarter 2016 EY | 27
The international standing of the financial sector surveyThe UK, Poland and Switzerland have the longest experience in conducting financial services surveys. In the UK, the Confederationof British Industries (CBI) in London has been conducting comprehensive quarterly financial services surveys in partnership withPrice Waterhouse Coopers (PWC) since December 1989. In Poland, the Research Institute for Economic Development (RIED) at theWarsaw School of Economics has been conducting a banking survey since 1999. The Swiss Business Cycle Institute (KOF) in Zurichhas been conducting a quarterly banking and insurance survey since the beginning of 2000.
In the USA, the Federal Reserve Bank has been conducting a “Senior Loan Officer Opinion Survey on Bank Lending Practices” formany years, but unlike the UK, Polish and Swiss banking surveys, it focuses on bank lending practices and not the financialperformance of the bank sector.
The South African financial services survey is modelled on those of the UK and Switzerland. However, the questionnaire has beenadapted for South African conditions and needs. Furthermore, it also includes the questions on credit standards for approvingapplications for loans and credit lines out of the US “Senior Loan Officer Opinion Survey”.
Ensuring the reliability and accuracy of the financial sector surveyThe questionnaire has been designed for maximum efficiency and minimum input time. Only multiple-answer type ticks arerequired. No figures are requested. For example, participants only have to tick if a particular activity (such as total income ornumber of people employed) is “up”, “the same” or “down” compared to the same period a year ago and with respect to theirSouth African operations only.
Respondents are carefully selected and approached on the basis of their position in the financial world. The head of retail bankingor the head of group life insurance is quizzed and not the chairperson of the board of directors of the group or holding company.Divisional heads tend to be best informed about their business units. The confidentiality of the responses adds to the honesty andcandour of participants. Furthermore, respondent quality is monitored.
The same group of participants is surveyed from one quarter to the next. Changes in the results from one quarter to the next cantherefore be attributed to an actual change in the performance yardstick in question and not because of the participation – or not –of particular banks, asset managers or life insurers.
South Africa has relatively few banks, asset managers and life insurers. For example, four banks dominate the retail and six themerchant and investment banking sector. Likewise, two companies dominate the life insurance industry. The number of potentialparticipants in a financial sector survey is therefore relatively low in South Africa.
The degree of presentation of the panel of participants has an important impact on the reliability of a quantitative survey, i.e. whenrespondents have to indicate actual amounts for each activity and the rand value of the level and change are calculated. Incontrast, the financial sector survey is a qualitative survey, i.e. the majority view of respondents on a particular activity is taken asan indication of the direction and strength of the trend in that activity. The degree of presentation of the panel of participants isless of a concern in the case of qualitative surveys. Furthermore, the participation – or not – of a particular respondent has less ofan impact on the overall results in the case of qualitative surveys compared to quantitative ones, as the view of the majority isestablished and not the actual size.
The participating retail and investment banks accounted for 95% of total assets of registered banks in December 2007. The valueof the total funds under management of the participating asset managers accounted for 63% of the total during the second quarterof 2007.
For reasons of focus, the following financial institutions are not covered, namely short-term insurers, public financial institutions(e.g. the Reserve Bank, Land Bank, Post Bank and official pension and provident funds), medical insurance savings schemes, theinformal micro-lending and savings industry, retailers providing credit and individual insurance brokers/agents. The survey alsoonly focuses on the supply of financial services and not on the demand for such services, which stems from government,businesses, households and the rest of the world.
The survey results reveal trends and not actual figures. The net balance statistic is used to interpret the survey results. (See nextsection for more details on the interpretation of the net balance statistic.) The net balance statistic is the percentage ofrespondents replying “up” less the percentage replying “down”. The percentage of respondents replying “the same” is ignored.Over the years, the net balance statistic has proved to be the most reliable indicator of the direction and size of change in the trend

The Financial Services Index – 2nd quarter 2016 EY | 28
of the respective activities surveyed. The net balance statistic is a qualitative yardstick of the direction and size of the year-on-yeargrowth rate of a particular activity. A positive net balance implies positive year-on-year growth and vice versa. The higher the valueof the net balance (positive / negative), the larger the rate of increase / decrease of the activity in question.
To aggregate the sector performance, individual responses are weighted according to their relative size. It makes sense that theresponse of a small participant has to count less compared to that of a large participant.
Results are published according to type of activity (e.g. retail banking, investment banking, life insurance and asset management)and not per institution (e.g. ABSA, Investec, Sanlam or Coronation).
How to interpret the net balance statisticWe base our interpretation of the survey results on the net balance statistic. Over the years, the net balance statistic has proved tobe the most reliable indicator of the direction and size of change in the trend of the respective activities surveyed.The net balance statistic is the percentage of respondents replying “up” less the percentage replying “down”. The percentage ofrespondents replying “the same” is ignored. For example, if the percentage of respondents rating the volume of business higher /the same / lower compared to the same period a year ago is as follows:
Higher Same Lower Net balance70% 10% 20% 50%
Then we can conclude that the majority of participants experienced higher business volumes. A net majority (i.e. the percentage ofrespondents rating the volume of business higher less the percentage rating the volume lower) of 50% is registered in the aboveexample.
The net balance statistic is an advanced qualitative yardstick / indicator of the direction (up, same or down) and size (small orlarge) of the year-on-year percentage change of the corresponding quantitative data (if available) of a particular activity. A netbalance of zero tends to indicate no growth (marked “A” on the accompanying chart), between 0 and –100 a contraction (marked“B”) and between 0 and 100 an expansion (marked “C”) compared to the same quarter a year ago. A positive net balance,therefore, implies positive year-on-year growth and vice versa. The higher the value of the net balance (positive / negative), thelarger the rate of increase / decrease of the activity in question tend to be.
Note that a net balance of –50%, for instance, is therefore notequivalent to a –50% decline (calculated year-on-year) in thequantitative data series. A net balance of –50% may correspond to –10% in the case of one set of quantitative data and –3% in anothercase. The net balance and corresponding percentage change in thequantitative data vary from one data set to the next and thisrelationship could only be established if many data points areavailable.
-100
-50
0
50
100
Net
bala
nce
=%
uple
ss%
dow
n
-15
-10
-5
0
5
10
15
%ch
ange
,Qon
sam
eQ
aye
arag
o
11Q1 11Q3 12Q1 12Q3 13Q1 13Q3 14Q1 14Q3 15Q1 15Q3
Net balance of survey data (lhs)
% change YoY of quantitative data (rhs
Net balance vs % change YoY
A
B B
C C

Published July 2016
WarningThis material has been prepared for general information purposes only and maynot be relied upon as accounting, tax, or other professional advice. EYspecifically renounces any liability for reliance on this material by either you orany third party to whom this material may be distributed. Please refer to youradvisors for specific advice.
EY | Assurance | Tax | Transactions | Advisory
About EYEY is a global leader in assurance, tax, transaction and advisoryservices. The insights and quality services we deliver help buildtrust and confidence in the capital markets and in economies theworld over. We develop outstanding leaders who team to deliveron our promises to all of our stakeholders. In so doing, we play acritical role in building a better working world for our people, forour clients and for our communities.
EY refers to the global organization, and may refer to one ormore, of the member firms of Ernst & Young Global Limited,each of which is a separate legal entity. Ernst & Young GlobalLimited, a UK company limited by guarantee, does not provideservices to clients. For more information about our organization,please visit ey.com.
© 2016 EYGM Limited.All Rights Reserved.