Y E EY E EY E EY E E YOUNGEUROPEANENTERPRISE. España España.
Upload
ezzedine-ghlamallahCategory
view
203download
0
World Islamic Banking Competitiveness Report 2014–15 Participation Banking 2.0
About MEGAMEGA is the leading international information
business results for
MEGA brands represents

WIBC is a MEGA Brand MEGA Brands. MEGA Clients. Market Leaders.
More than 20 Years of Market Leadership
Dear Banking and Finance Leader,
Yours sincerely,
David McLean Chief Executive


Contents

Abdulaziz Al-Sowailim
World Islamic Banking Competitiveness Report 2014–156

82%
Ashar Nazim
World Islamic Banking Competitiveness Report 2014–15 7

Robert Abboud Jan Bellens
World Islamic Banking Competitiveness Report 2014–158

World Islamic Banking Competitiveness Report 2014–15 9
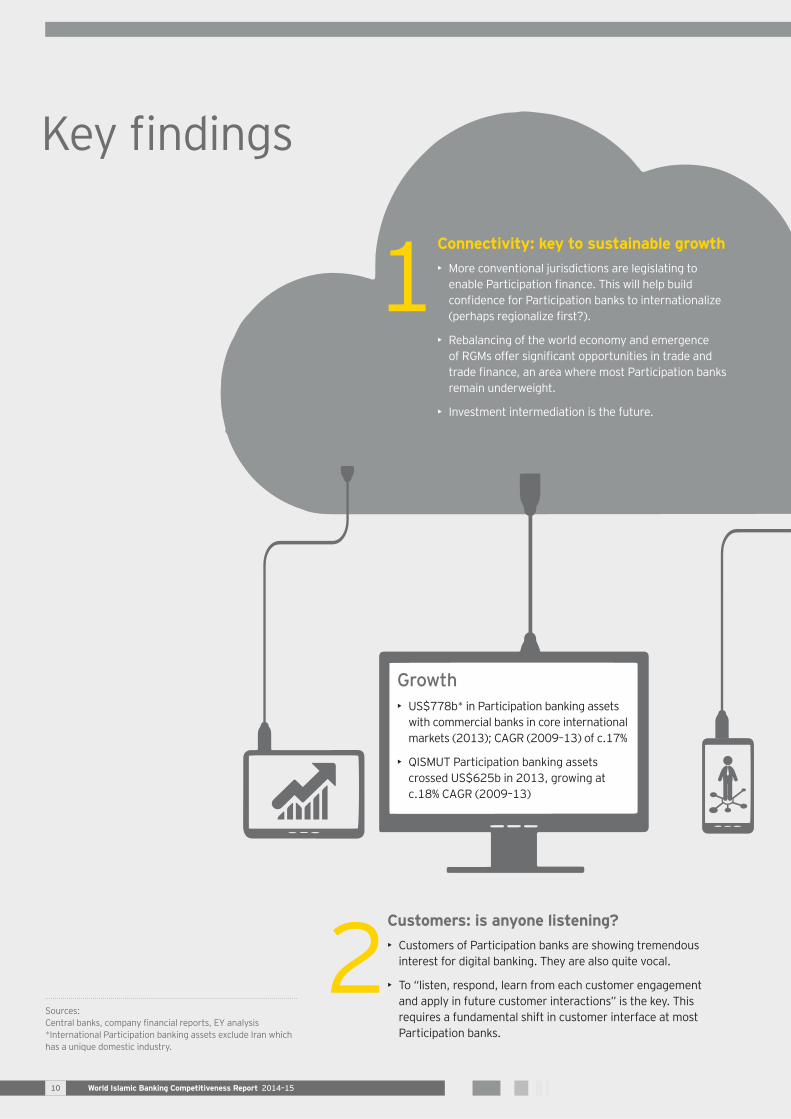
Customers: is anyone listening?•
•
Growth•
•
Connectivity: key to sustainable growth •
•
•
World Islamic Banking Competitiveness Report 2014–1510

Going mainstream: Participation Banking 2.0•
•
Customers•
•
World Islamic Banking Competitiveness Report 2014–15 11

World Islamic Banking Competitiveness Report 2014–1512

Industry overview
World Islamic Banking Competitiveness Report 2014–15 13

International Participation banking assets* (US$b)
295
517
71
160
333
93
385
117
454
140
2009 2010 2011 2012 2013
GCC ASEAN Turkey and ROW South Asia
41
78
11 50
14 53
17 69
20
23
417
778
17%
Share of international Participation banking assets*
0% 20% 40% 60% 80% 100%
Turkey and ROW
South Asia
ASEAN
GCC
Islamic Conventional Malaysia
5%
12%
14%
33%
World Islamic Banking Competitiveness Report 2014–1514

Banking penetration and Participation assets market share
Malaysia
Saudi Arabia
UAE
Kuwait
Qatar
Turkey
Bahrain
Indonesia
Bangladesh
Egypt
PakistanJordan
0%
20%
40%
60%
0% 50% 100% 150% 200% 250%
Part
icip
atio
n ba
nkin
g m
arke
t sha
re
Banking penetration
Size of circle depicts Participation banking asset volumes
Growth rate of assets YOY 2013 (in local currency)
–20% 0% 20% 40% 60% 80% 100%
Pakistan
Bahrain
Indonesia
Turkey
Qatar
Kuwait
UAE
Malaysia
Saudi Arabia
Conventional Islamic
CAGR 2009–13
17%
19%
11%
11%
26%
19%
43%
2%
29%
Going mainstream
World Islamic Banking Competitiveness Report 2014–15 15

Global distribution of Participation banking assets*
•
•
National market shares for Participation banking
•
•
Bahrain
31.7% 16.7%
48.9%20.7%
1.7%
27.7%
UAE
Saudi Arabia
Kuwait
Malaysia21.4% 44.6%
14.6%10.5%
World Islamic Banking Competitiveness Report 2014–1516
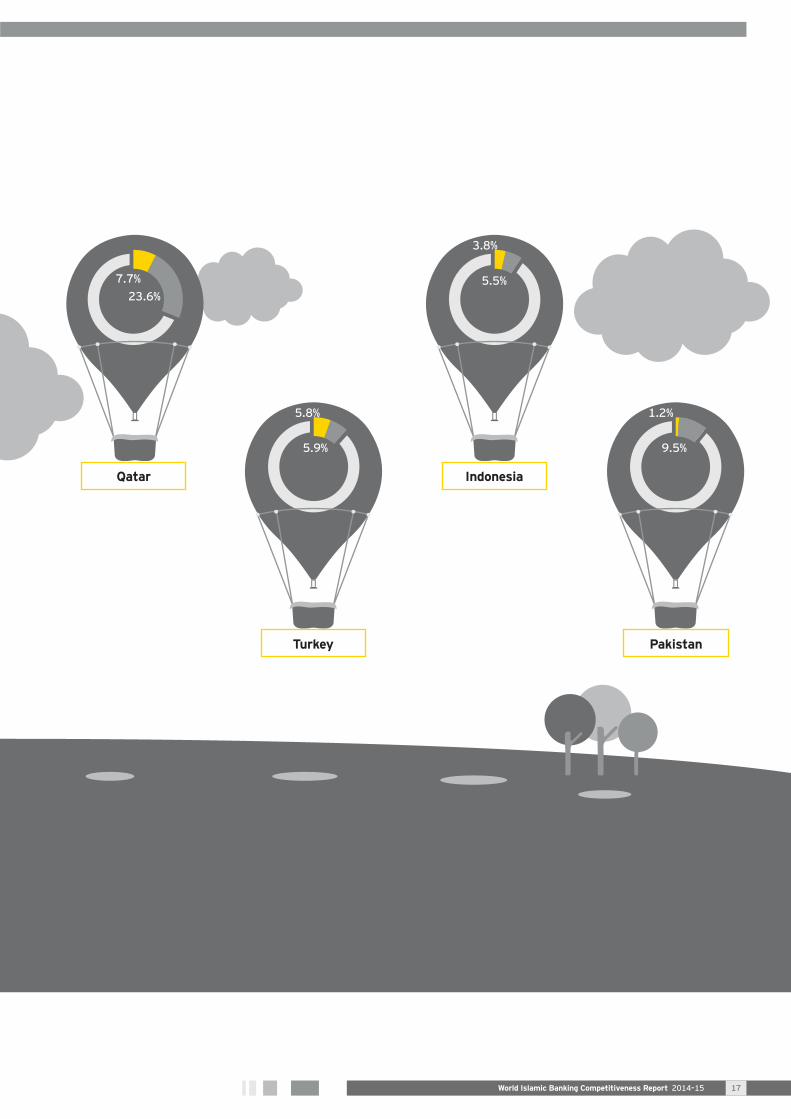
3.8%
5.5%
Turkey
IndonesiaQatar
23.6%
5.9%
7.7%
5.8%
Pakistan
9.5%
1.2%
World Islamic Banking Competitiveness Report 2014–15 17

Strengthening of capital base
•
•
Capitalization of top 20 banks
2010 2011–13
US$b
20%
CAR2013
17%
33%
18%
17%
19%
17%
21%
14%
15%
14%
19%
14%
13%
19%
14%
31%
16%
16%
14%
20%
CAR2012
13%
28%
17%
16%
19%
21%
17%
13%
16%
19%
19%
14%
15%
19%
14%
35%
16%
12%
14%
10 2 3 4 5 6 7 8 9 10 11
World Islamic Banking Competitiveness Report 2014–1518

•
•
Top 20 Participation banksAverage ROE 2009–2013Total assets 2013
0% 10% 20%020406080US$b
Average ROE
Average assets
Average growth 2009–13
Comparable
World Islamic Banking Competitiveness Report 2014–15 19
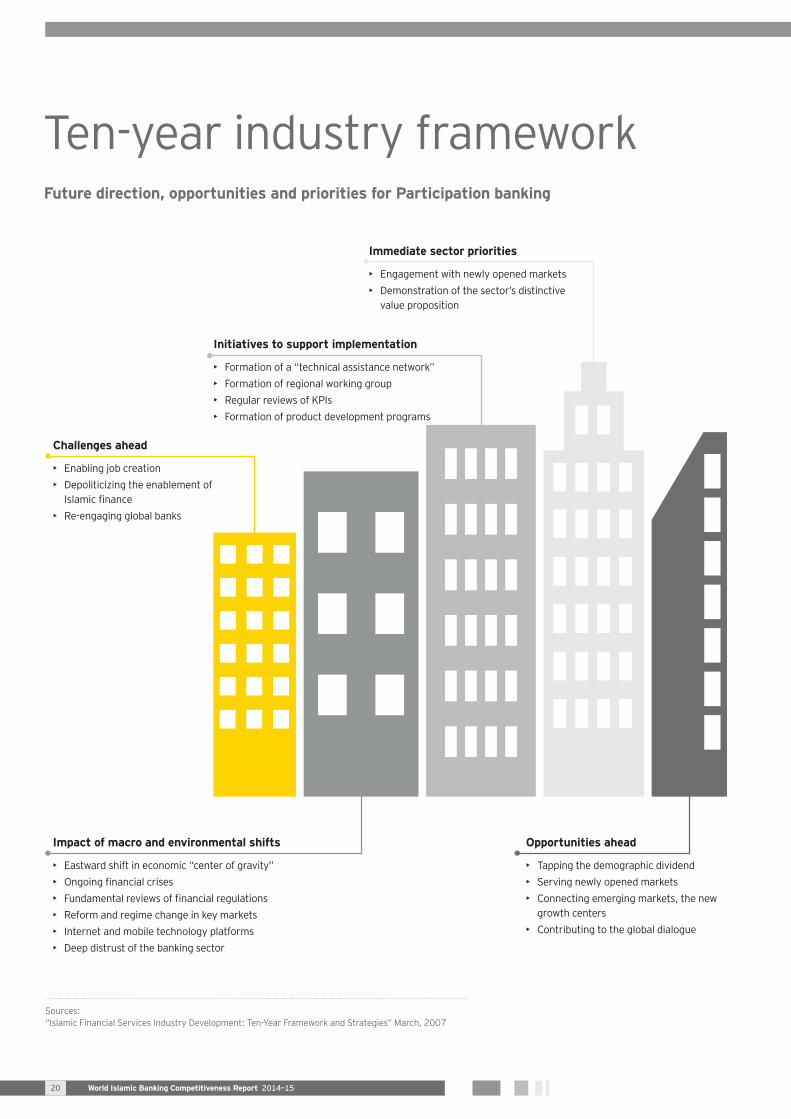
Future direction, opportunities and priorities for Participation banking
Initiatives to support implementation
• • • •
Opportunities ahead
• • •
• Contributing to the global dialogue
Challenges ahead
• •
•
Immediate sector priorities
• •
Impact of macro and environmental shifts
• • • • • •
World Islamic Banking Competitiveness Report 2014–1520
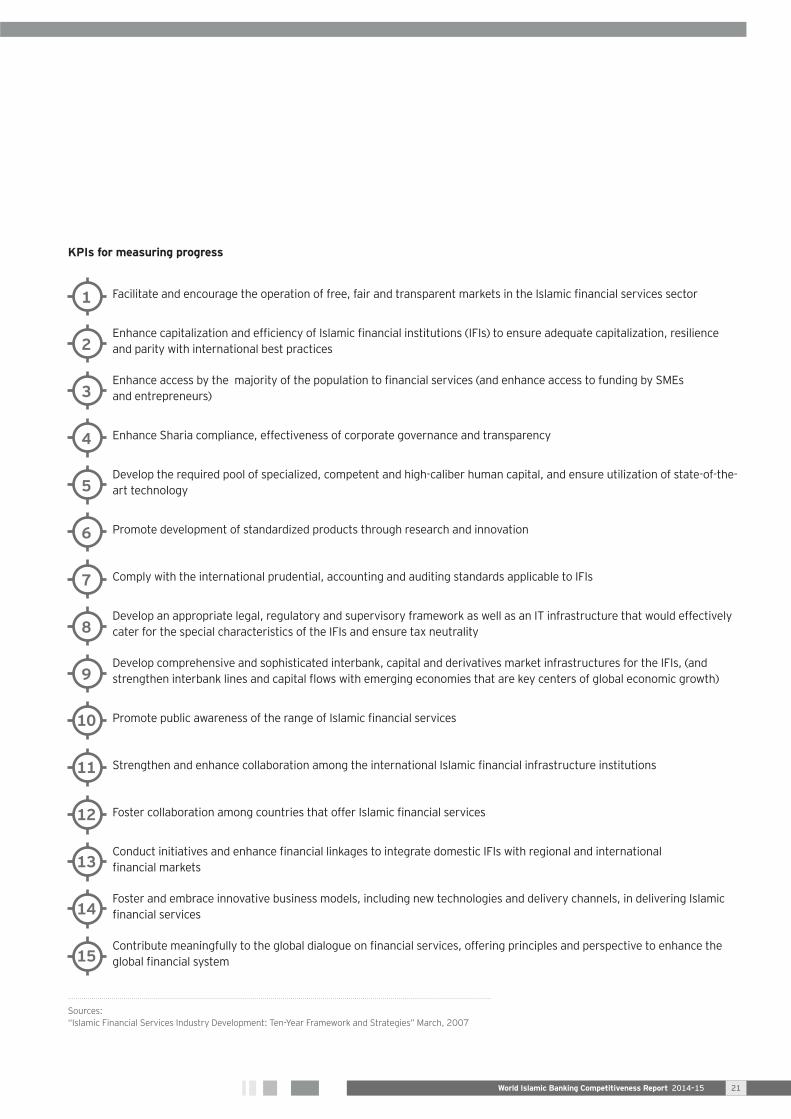
KPIs for measuring progress
1
2
3
4
5
6
7
8
9
10
11
12
13
14
15
World Islamic Banking Competitiveness Report 2014–15 21

Financial market infrastructure challenges Challenge scale*
Question marks remain on the state of the industry’s infrastructure
HighState of readiness
World Islamic Banking Competitiveness Report 2014–1522

World Islamic Banking Competitiveness Report 2014–15 23

World Islamic Banking Competitiveness Report 2014–1524

Performance outlook
World Islamic Banking Competitiveness Report 2014–15 25

0 100 200 300 400 500 600 700 800
2019f assets (US$b)2014e assets (US$b)
Pakistan
Bahrain
Indonesia
Turkey
Qatar
Kuwait
Malaysia
UAE
Saudi Arabia290
127
155
90
86
58
37
15
11
683
263
394
157
202
135
143
27
25
US$b
World Islamic Banking Competitiveness Report 2014–1526

US$10.2b in 2013
2013 2019
3x
Potential profit pool from business as usual
Potential incremental profit resulting fromtransformation improvements
0
5
10
15
20
25
30
35
40
World Islamic Banking Competitiveness Report 2014–15 27

Digitization
Impact banking
positioning itself as socially responsible
Customer engagement
Like Share
World Islamic Banking Competitiveness Report 2014–1528

World Islamic Banking Competitiveness Report 2014–15 29

World Islamic Banking Competitiveness Report 2014–1530

Your talking customers
World Islamic Banking Competitiveness Report 2014–15 31

World Islamic Banking Competitiveness Report 2014–1532

More than
2.25 million
Key message
Implications for future
Customers are increasingly active online and vocal about their experiences.
4 out of every 10 Participation banks are not “listening.”
World Islamic Banking Competitiveness Report 2014–15 33

Moment of truth
Malaysia
Relevant posts (000)
Indonesia
Bahrain
Kuwait
UAE
Qatar
Turkey
Oman
Saudi Arabia
375
22
184
44
25
905
47
212
523
Customer service
Branch experience
Online and phone
banking
Other general
sentiments
Products and services
Note: Bubble size represents size of comments in category for the country.Negative comments outnumber positive comments for category by more than 5%.Variance between positive and negative comments is less than 5%.Positive comments outnumber negative comments for category by more than 5%.
World Islamic Banking Competitiveness Report 2014–1534

experience-led”
World Islamic Banking Competitiveness Report 2014–15 35
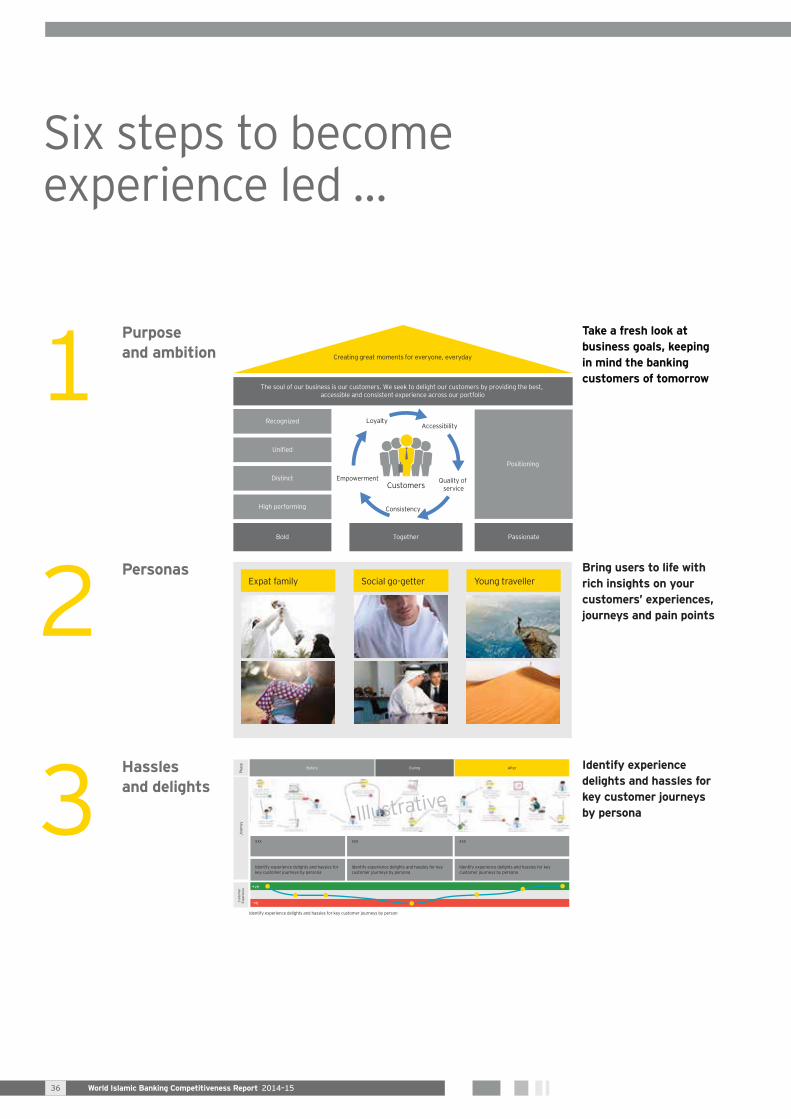
Purpose and ambition Creating great moments for everyone, everyday
The soul of our business is our customers. We seek to delight our customers by providing the best, accessible and consistent experience across our portfolio
Recognized
Unified
Distinct
High performing
Positioning
Bold Together Passionate
Customers
Accessibility
Quality of service
Consistency
Empowerment
Loyalty
Take a fresh look at business goals, keeping in mind the banking customers of tomorrow
Personas Bring users to life with rich insights on your customers’ experiences, journeys and pain points
Hassles and delights
Before During After
Phas
eJo
urne
y
+ve
Cust
omer
Ex
perie
nce
Identify experience delights and hassles for key customer journeys by person
Identify experience delights and hassles for key customer journeys by persona
xxx
Identify experience delights and hassles for key customer journeys by persona
xxx
Identify experience delights and hassles for key customer journeys by persona
xxx
Illustrative
–ve
Identify experience delights and hassles for key customer journeys by persona
World Islamic Banking Competitiveness Report 2014–1536

Intentional journey maps
48 hours
Journey maps
Stage 1: Enter branch Stage 2: Customer contact Stage 3: Phone reg. Stage 4: Issue
Xxx Xxx
Xxx Xxx Xxx
Xxx
Xxx
Xxx
Xxx
Xxx
Create journey maps to communicate future experience and identify areas for improvement
Capability needs and gaps
Customer Interations
Life cycle stages
People Process Technology Data
See
Aware
Buy
Deposit
Post Exp
Training1. 2. 3.4.
Activity1. 2. 3.4.
Tech1. Applications
cannot currentlygather secondarycutomer information
Data1. Data collected only for
the primary customer2. Birth date and previous
historical transactionscannot be identified
ILLUSTRATIVE
1. ..................................
2. ..................................
3. ..................................
4. ..................................
5. ..................................
6. ..................................
7. ..................................
8. ..................................
9. ..................................
10. Customer walks-in
11. .................................
12. .................................
13. .................................
14. .................................
15. .................................
16. .................................
P1 P2 Px R1 R2 Rx T1 T2 Tx D1 D2 Dx
Experiences prioritized based on importance and complexity
Experiences aligned to work-stream and sub-groups
Ownership assigned for gaps
Build future-state, multichannel customer experience across talent, process, data, tools and technology
Experience calculator and road map
Impa
ct
High
Act Now
Act Now
Act Now Act Now
Medium
Long-term
Long-term
Long-term
Low
Aware Aware
Low Medium High
Complexity
Initiatives
123
123
123
123
123
123
123
123
123
12332
32
32
32
32
32
32
32
32
32
32
32
32
3232
32
32
32
Type 1Type 2Type 3Type 4Type 5Type 6Type 7Type 8
Prioritize initiatives on the basis of their value to customer and complexity to implement
World Islamic Banking Competitiveness Report 2014–15 37

Bahrain
30,397sentiments monitored
Total post and relevant post — daily volume
0
50
100
150
200
250
300
350
400
Jan-10 Jan-11 Jan-12 Jan-13 Jan-14
Irrelevant Volume Relevant Volume
posts on this
termination of
Positive and negative (Total)
General
Products and services
Customer service
Branch experience
Online and mobile banking
Neutral: general neutral
42%45%
5%12%
2%16%
17%4%
7%13%
10%1%
13%
Positive Negative Neutral
Topic wheel highlighting key negative opinions*
General
Topic wheel highlighting key positive opinions*
Positive and negative opinion breakdown
Bank B
Bank
B
Bank B
World Islamic Banking Competitiveness Report 2014–1538

World Islamic Banking Competitiveness Report 2014–15 39
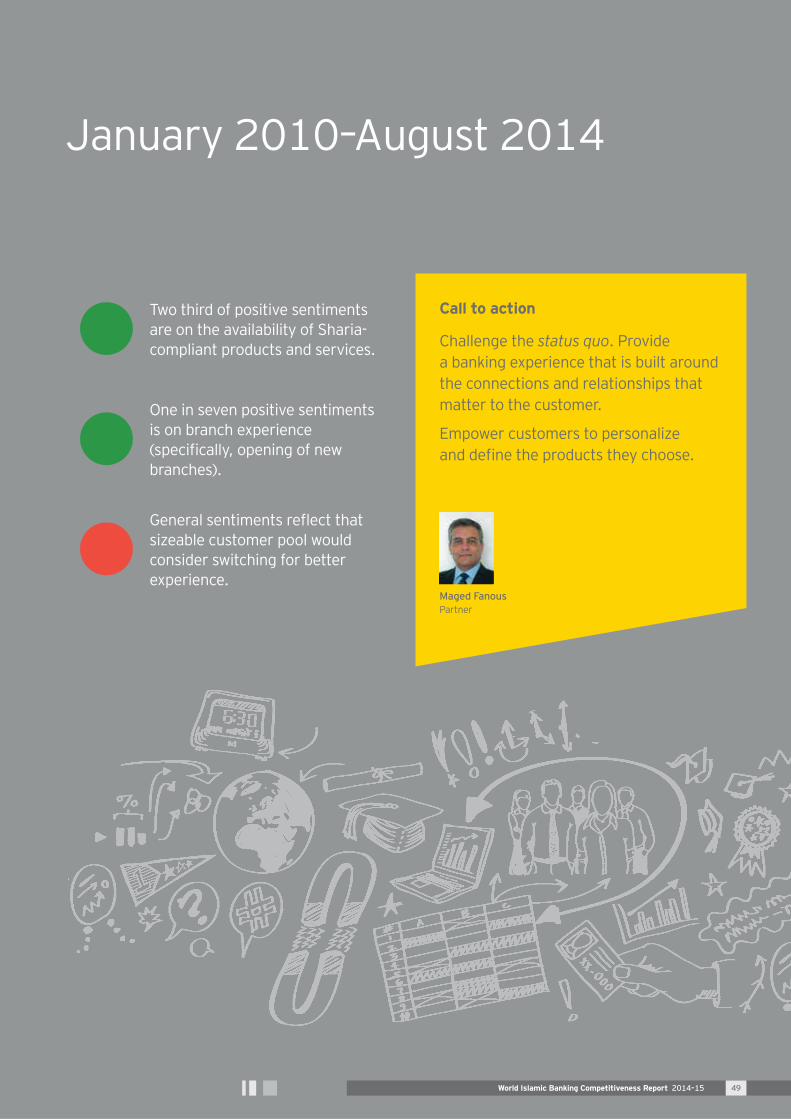
Call to action
Changing the status quo
Abid Shakeel

Total post and relevant post — daily volume
0
2000
4000
6000
8000
10000
12000
Jan-10 Jan-11 Jan-12 Jan-13 Jan-14
Irrelevant Posts Relevant Posts
Positive and negative (Total)
General
Products and services
Customer service
Branch experience
Online and mobile banking
Neutral: general neutral
63%26%
6%3%
3%1%
29%4%
7%7%
17%10%
11%
Positive Negative Neutral
Topic wheel highlighting key negative opinions*
General
Topic wheel highlighting key positive opinions*
Positive and negative opinion breakdown
Interest generated from
340,441sentiments monitored
World Islamic Banking Competitiveness Report 2014–1540

World Islamic Banking Competitiveness Report 2014–15 41
Call to action
Mohd Husin

Saudi Arabia
Total post and relevant post — daily volume
0
1000
2000
3000
4000
5000
6000
7000
8000
9000
Jan-10 Jan-11 Jan-12 Jan-13 Jan-14
Irrelevant Posts Relevant Posts
Topic wheel highlighting key negative opinions*
General
Topic wheel highlighting key positive opinions*
Positive and negative opinion breakdown
567,071sentiments monitored
Positive and negative (Total)
General
Products and services
Customer service
Branch experience
Online and mobile banking
Neutral: general neutral
67%29%
7%14%
16%7%
7%3%
20%4%
17%1%
5%
Positive Negative Neutral
More than
posts related to an online and
Saudi Arabia
World Islamic Banking Competitiveness Report 2014–1542

World Islamic Banking Competitiveness Report 2014–15 43
Ashar Nazim
Call to action

55,884sentiments monitored
Total post and relevant post — daily volume
0
200
400
600
800
1000
1200
1400
Jan-10 Jan-11 Jan-12 Jan-13 Jan-14
Irrelevant Posts Relevant Posts
Topic wheel highlighting key negative opinions*
General
Topic wheel highlighting key positive opinions*
Positive and negative opinion breakdown
Positive and negative (Total)
General
Products and services
Customer service
Branch experience
Online and mobile banking
Neutral: general neutral
58%30%
11%4%
5%17%
29%1%
11%7%
2%1%
12%
Positive Negative Neutral
posts on this
sentiments
Bank B
World Islamic Banking Competitiveness Report 2014–1544

World Islamic Banking Competitiveness Report 2014–15 45
Call to action
Karan RanaManager

Total post and relevant post — daily volume
0
100
200
300
400
500
600
700
800
900
Jan-10 Jan-11 Jan-12 Jan-13 Jan-14
Irrelevant Posts Relevant Posts
posts related
partnership
a leading
Qatar
Topic wheel highlighting key negative opinions*
General
Topic wheel highlighting key positive opinions*
Positive and negative opinion breakdown
Positive and negative (Total)
General
Products and services
Customer service
Branch experience
Online and mobile banking
Neutral: general neutral
30%33%
7%2%
8%6%
2%1%
5%20%
8%4%
38%
Positive Negative Neutral
29,718sentiments monitored
Qat
ar
Bank B
Feedback
FeedbackSpeed
Qatar Bankin
g
Customer request
Product 1Marke
ting
World Islamic Banking Competitiveness Report 2014–1546

World Islamic Banking Competitiveness Report 2014–15 47
Call to action
Houssam Itani

199,415sentiments monitored
Total post and relevant post — daily volume
0
1000
2000
3000
4000
5000
6000
7000
Jan-10 Jan-11 Jan-12 Jan-13 Jan-14
Irrelevant Posts Relevant Posts
Topic wheel highlighting key negative opinions*
General
Topic wheel highlighting key positive opinions*
Positive and negative opinion breakdown
Positive and negative (Total)
General
Products and services
Customer service
Branch experience
Online and mobile banking
Neutral: general neutral
58%27%
4%15%
39%7%
2%2%
8%2%
4%1%
16%
Positive Negative Neutral
World Islamic Banking Competitiveness Report 2014–1548
Call to action
Challenge the status quo
Maged FanousPartner
World Islamic Banking Competitiveness Report 2014–15 49

71,130sentiments monitored
Total post and relevant post — daily volume
0
500
1000
1500
2000
2500
Jan-10 Jan-11 Jan-12 Jan-13 Jan-14
Irrelevant Posts Relevant Posts
Topic wheel highlighting key negative opinions*
General
Topic wheel highlighting key positive opinions*
Positive and negative opinion breakdown
Positive and negative (Total)
General
Products and services
Customer service
Branch experience
Online and mobile banking
Neutral: general neutral
55%15%
16%3%
9%1%
8%2%
4%5%
18%4%
30%
Positive Negative Neutral
World Islamic Banking Competitiveness Report 2014–1550

Call to action
Noman MubashirManager
World Islamic Banking Competitiveness Report 2014–15 51

918,565sentiments monitored
Total post and relevant post — daily volume
0
20000
40000
60000
80000
100000
120000
Jan-10 Jan-11 Jan-12 Jan-13 Jan-14
Irrelevant Posts Relevant Posts
Topic wheel highlighting key negative opinions*
General
Topic wheel highlighting key positive opinions*
Positive and negative opinion breakdown
Positive and negative (Total)
General
Products and services
Customer service
Branch experience
Online and mobile banking
Neutral: general neutral
45%38%
20%34%
10%1%
1%1%
1%2%
12%1%
18%
Positive Negative Neutral
about a
World Islamic Banking Competitiveness Report 2014–1552

World Islamic Banking Competitiveness Report 2014–15 53
Call to action
Murat Hatipoglu

Indonesia
374,400sentiments monitored
Total post and relevant post — daily volume
0
2000
4000
6000
8000
10000
12000
Jan-10 Jan-11 Jan-12 Jan-13 Jan-14
Irrelevant Posts Relevant Posts
Topic wheel highlighting key negative opinions*
General
Topic wheel highlighting key positive opinions*
Positive and negative opinion breakdown
General
Products and services
Customer service
Branch experience
Online and mobile banking
Neutral: general neutral
Positive and negative (Total) 11%88%
2%3%
1%6%
7%18%
1%53%
1%9%
2%
Positive NeutralNegative
World Islamic Banking Competitiveness Report 2014–1554

sentiments relate to disappointing
World Islamic Banking Competitiveness Report 2014–15 55
Call to action
Yasir YasirPartner

World Islamic Banking Competitiveness Report 2014–1556

Country outlook
World Islamic Banking Competitiveness Report 2014–15 57

•
•
•
Participation banking penetration in Bahrain
Total banking assets**
US$
b
2009 2010 2011 2012 2013
13
35
29% 28%
0
10
20
30
40
US$
b
2009 2010 2011 2012 2013
12
22
31% 35%
0
10
20
30
40
Total deposits**
30% 33%
0
10
20
30
40
2009 2010 2011 2012 2013
11
23
US$
b
Assets** YoY growth 2% 4%
5%
2010 2011 2012 2013
–1%
–10%
0%
10%
20%
Financing** YoY growth 2% -2%
2010 2011 2012 2013
7%
–10%–10%
0%
10%
20%
Deposits** YoY growth 4% 1%
7%
–15%
–5%
5%
15%
2010 2011 2012 2013
0%
Bahrain
World Islamic Banking Competitiveness Report 2014–1558
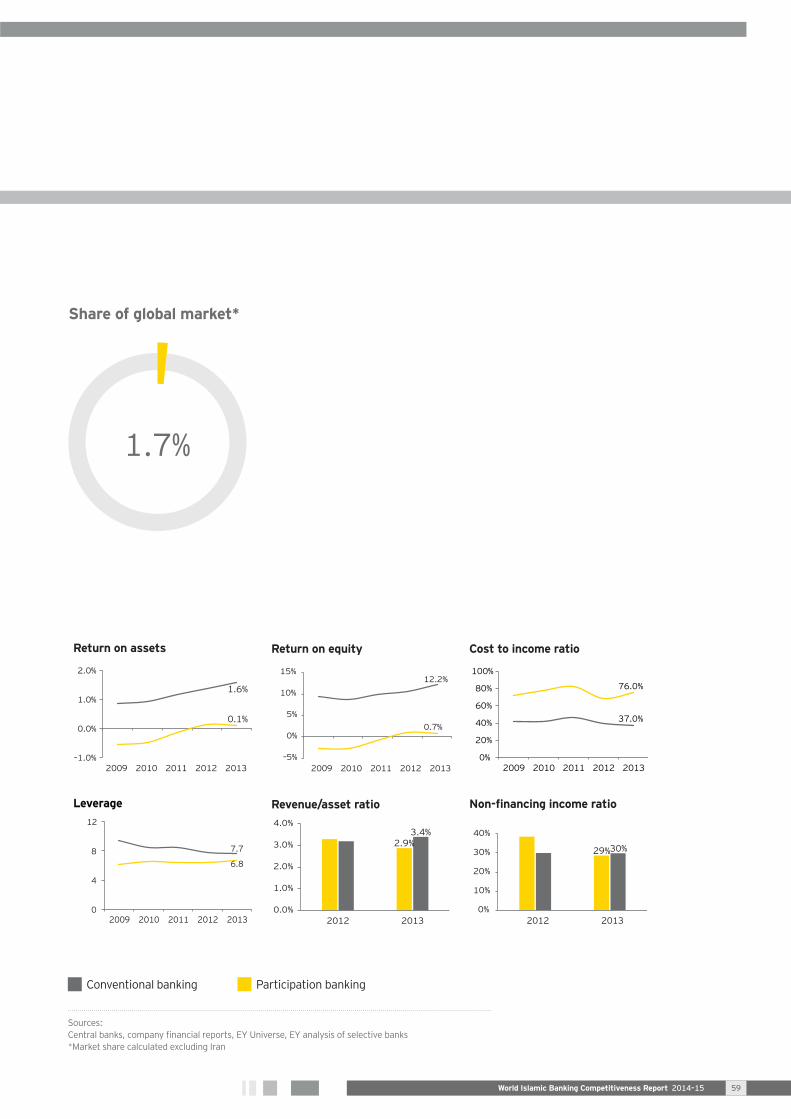
Share of global market*
Return on assets
–1.0%
0.0%
1.0%
2.0%
2009 2010 2011 2012 2013
1.6%
0.1%
Return on equity
2009 2010 2011 2012 2013
12.2%
0.7%
–5%
0%
5%
10%
15%
Cost to income ratio
2009 2010 2011 2012 2013
76.0%
37.0%
0%
20%
40%
60%
80%
100%
Leverage
2009 2010 2011 2012 2013
7.7
6.8
0
4
8
12
Revenue/asset ratio
0.0%
1.0%
2.0%
3.0%
4.0%
2012 2013
2.9%3.4%
0%
10%
20%
30%
40%
2012 2013
29%30%
World Islamic Banking Competitiveness Report 2014–15 59

Saudi Arabia
• Participation banking penetration in the Saudi Arabia
Total banking assets
0
100
200
300
400
2009 2010 2011 2012 2013
247258
US$
b
36% 49%
2009 2010 2011 2012 2013
207174
0
100
200
300
400
US$
b
47% 54%
Total deposits*
0
100
200
300
400
2010 2011 2012 2013
374
US$
b
2009
Assets YoY growth 17% 2%
0%
10%
20%
30%
40%
2010 2011 2012 2013
14%
5%
Financing YoY growth 15% 7%
–10%
0%
10%
20%
30%
40%
2010 2011 2012 2013
16%12%
Deposits YoY growth* 10%
–10%
0%
10%
20%
30%
40%
2010 2011 2012 2013
11%
World Islamic Banking Competitiveness Report 2014–1560
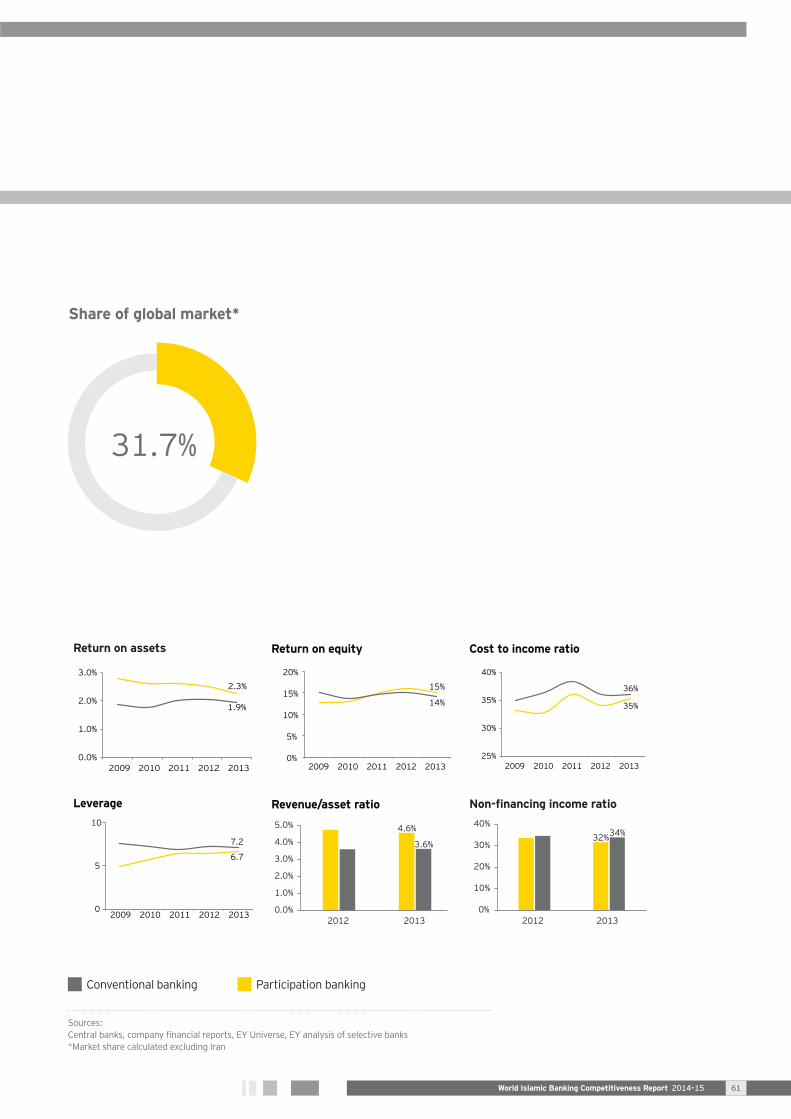
Share of global market*
Return on assets
0.0%
1.0%
2.0%
3.0%
2009 2010 2011 2012 2013
1.9%
2.3%
Return on equity
0%
5%
10%
15%
20%
2009 2010 2011 2012 2013
15%
14%
Cost to income ratio
25%
30%
35%
40%
2009 2010 2011 2012 2013
36%
35%
Leverage
2009 2010 2011 2012 2013
7.2
6.7
0
5
10
Revenue/asset ratio
2012 2013
4.6%
3.6%
0.0%
1.0%
2.0%
3.0%
4.0%
5.0%
0%
10%
20%
30%
40%
2012 2013
32%34%
World Islamic Banking Competitiveness Report 2014–15 61

Total banking assets
US$
b
16% 21%
0
200
400
600
2009 2010 2011 2012 2013
498
130
US$
b
0
200
100
300
500
400
2009 2010 2011 2012 2013
85
282
17% 23%
Total deposits
0
200
100
300
500
400
2009 2010 2011 2012 2013
106
360
US$
b
17% 23%
Assets YoY growth 19% 10%
0%
10%
20%
30%
40%
2010 2011 2012 2013
1%
8%16%
Financing YoY growth 23% 11%
0%
10%
20%
30%
40%
2010 2011 2012 2013
14%
1%
22%
Deposits YoY growth 19% 9%
–10%
0%
10%
20%
30%
2010 2011 2012 2013
–1%
15%
7%
Participation banking penetration in Malaysia•
•
World Islamic Banking Competitiveness Report 2014–1562

Return on assets
0.0%
1.0%
2.0%
2009 2010 2011 2012 2013
0.9%
0.8%
Return on equity
0%
5%
10%
15%
20%
2009 2010 2011 2012 2013
11%
10%
Cost to income ratio
30%
40%
50%
60%
2009 2010 2011 2012 2013
48%
41%
Leverage
2009 2010 2011 2012 2013
12.2
12.1
11
12
13
14
Revenue/asset ratio
0%
1%
2%
3%
4%
5%
2012 2013
2.6%3.3%
2012 2013
34%33%
0%
10%
20%
30%
50%
40%
Share of global market*
World Islamic Banking Competitiveness Report 2014–15 63
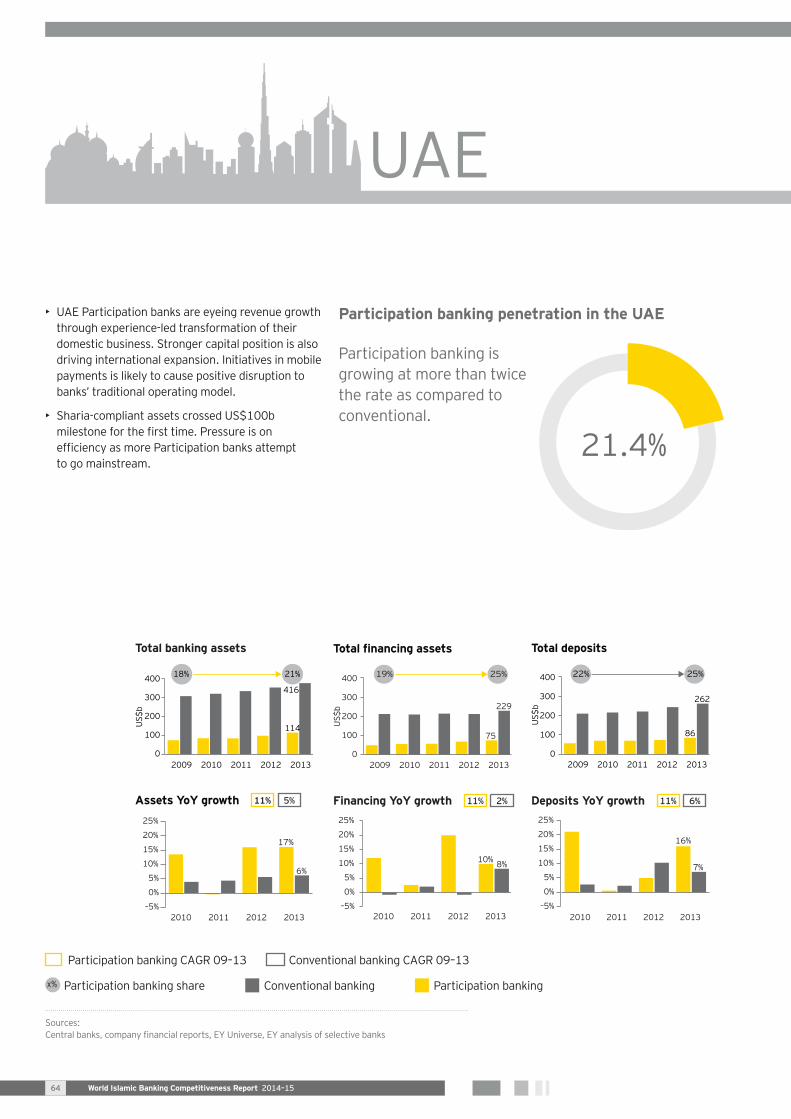
•
•
Participation banking penetration in the UAE
Total banking assets
0
100
200
300
400
2009 2010 2011 2012 2013
US$
b
18% 21%
416
114
2009 2010 2011 2012 2013
75
229
US$
b
19% 25%
0
100
200
300
400
Total deposits
2009 2010 2011 2012 2013
86
262
US$
b
22% 25%
0
100
200
300
400
Assets YoY growth 11% 5%
–5%
0%
5%
10%
15%
20%
25%
2010 2011 2012 2013
17%
6%
Financing YoY growth 11% 2%
–5%
0%
5%
10%
15%
20%
25%
2010 2011 2012 2013
10% 8%
Deposits YoY growth 11% 6%
–5%
0%
5%
10%
15%
20%
25%
2010 2011 2012 2013
16%
7%
World Islamic Banking Competitiveness Report 2014–1564

Share of global market*
Return on assets
0.0%
1.0%
2.0%
3.0%
2009 2010 2011 2012 2013
1.6%
1.3%
Return on equity
0%
5%
10%
15%
20%
2009 2010 2011 2012 2013
12%
10%
Cost to income ratio
20%
30%
40%
50%
2009 2010 2011 2012 2013
46%
31%
Leverage
7
8
9
2009 2010 2011 2012 2013
7.9
7.8
Revenue/asset ratio
0.0%
1.0%
2.0%
3.0%
4.0%
5.0%
2012 2013
3.6%3.7%
0%
10%
20%
30%
40%
2012 2013
30%25%
World Islamic Banking Competitiveness Report 2014–15 65

Participation banking penetration in Kuwait
more than three times their
•
•
Total banking assets
020
406080
100
120
2009 2010 2011 2012 2013
82101
US$
b
38% 45%
020
406080
100
120
2009 2010 2011 2012 2013
5647U
S$b
41% 54%
Total deposits
020
406080
100
120
2009 2010 2011 2012 2013
6168
US$b
44% 47%
Assets YoY growth 11% 3%
–15%
–5%
5%
15%
25%
2010 2011 2012 2013
12%7%
Financing YoY growth 11% –3%
–15%
–5%
5%
15%
25%
2010 2011 2012 2013
0%
16%
Deposits YoY growth 9% 5%
–15%
–5%
5%
15%
25%
2010 2011 2012 2013
10%7%
World Islamic Banking Competitiveness Report 2014–1566
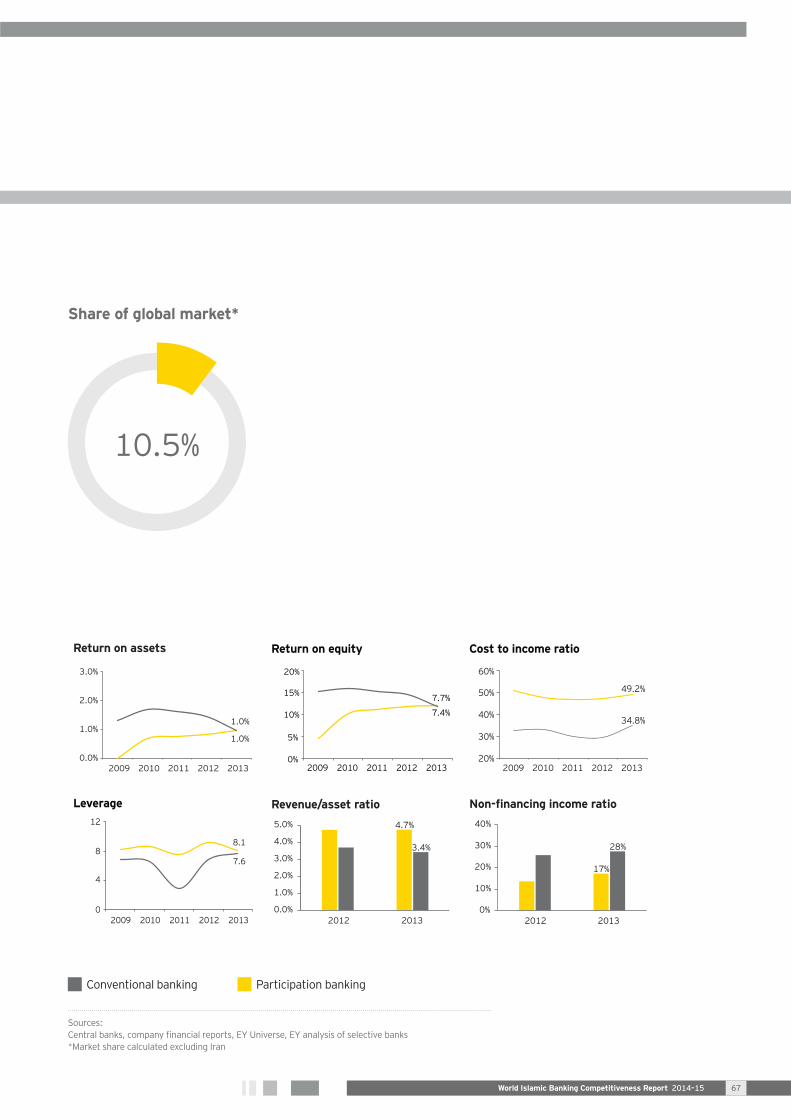
Share of global market*
Return on assets
0.0%
1.0%
2.0%
3.0%
2009 2010 2011 2012 2013
1.0%
1.0%
Return on equity
0%
5%
10%
15%
20%
2009 2010 2011 2012 2013
7.4%
7.7%
Cost to income ratio
20%
30%
40%
50%
60%
2009 2010 2011 2012 2013
49.2%
34.8%
Leverage
0
4
8
12
2009 2010 2011 2012 2013
8.1
7.6
Revenue/asset ratio
0.0%
1.0%
2.0%
3.0%
4.0%
5.0%
2012 2013
4.7%
3.4%
0%
10%
20%
30%
40%
2012 2013
17%
28%
World Islamic Banking Competitiveness Report 2014–15 67

Qatar
Participation banking penetration in Qatar•
•
Total banking assets
0
50
100
150
200
250
2009 2010 2011 2012 2013
60
US$b
18% 24%
193
0
50
100
150
200
250
2009 2010 2011 2012 2013
38
121
US$
b
21% 24%
Total deposits
0
50
100
150
200
250
2009 2010 2011 2012 2013
39
111
US$
b
16% 26%
Assets YoY growth 26% 16%
0%
20%
40%
80%
60%
2010 2011 2012 2013
11%12%
Financing YoY growth 25% 20%
0%
20%
40%
80%
60%
2010 2011 2012 2013
13%14%
Deposits YoY growth 38% 18%
0%
20%
40%
80%
60%
2010 2011 2012 2013
16%20%
World Islamic Banking Competitiveness Report 2014–1568

Share of global market*
Return on assets
0.0%
1.0%
2.0%
3.0%
4.0%
2009 2010 2011 2012 2013
2.1%2.1%
Return on equity
0%
5%
10%
15%
20%
25%
2009 2010 2011 2012 2013
13%
16%
Cost to income ratio
0%
10%
20%
30%
40%
2009 2010 2011 2012 2013
28%
25%
Leverage
0
5
10
2009 2010 2011 2012 2013
7.7
6.0
Revenue/asset ratio
0.0%
1.0%
2.0%
3.0%
4.0%
5.0%
2012 2013
3.4%3.3%
0%
10%
5%
15%
20%
25%
2012 2013
11%
23%
World Islamic Banking Competitiveness Report 2014–15 69

Participation banking penetration in Turkey•
•
Total banking assets
US$
b
4% 6%
0
200
400
600
800
2009 2010 2011 2012 2013
45
726
US$
b
7% 6%
0
200
400
600
800
2009 2010 2011 2012 2013
30
447
Total deposits
US$
b
6% 7%
0
200
400
600
800
2009 2010 2011 2012 2013
29
410
Assets YoY growth 19% 10%
0%
10%
20%
30%
40%
2010 2011 2012 2013
14%5%
37%
Financing YoY growth 18% 21%
–10%0%
10%20%30%40%50%60%
2010 2011 2012 2013
8% 11%30%
Deposits YoY growth 12% 8%
–10%0%
10%20%30%40%50%60%
2010 2011 2012 2013
3% 7%24%
World Islamic Banking Competitiveness Report 2014–1570
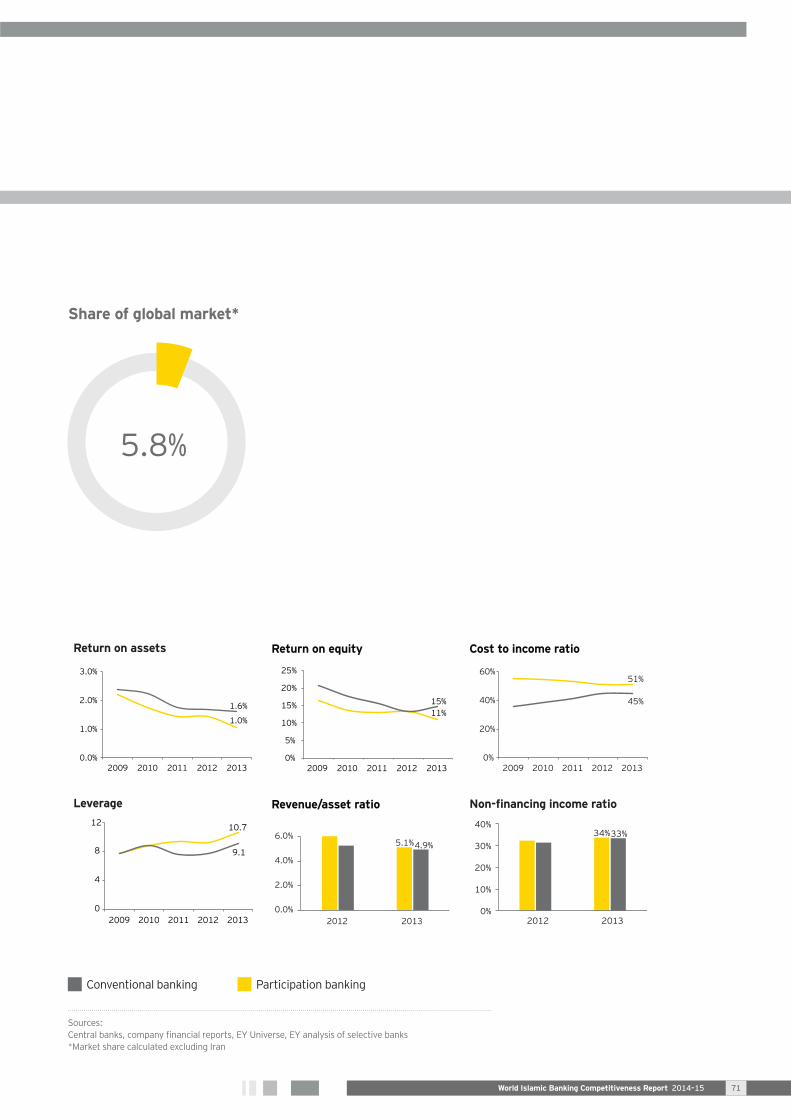
Share of global market*
Return on assets
0.0%
1.0%
2.0%
3.0%
2009 2010 2011 2012 2013
1.6%
1.0%
Return on equity
0%
5%
10%
15%
20%
25%
2009 2010 2011 2012 2013
15%11%
Cost to income ratio
0%
20%
40%
60%
2009 2010 2011 2012 2013
51%
45%
Leverage
0
4
8
12
2009 2010 2011 2012 2013
10.7
9.1
Revenue/asset ratio
0.0%
2.0%
4.0%
6.0%
2012 2013
5.1%4.9%
0%
10%
20%
30%
40%
2012 2013
34%33%
World Islamic Banking Competitiveness Report 2014–15 71

•
•
•
Participation banking penetration in Indonesia
Total banking assets
US$
b
2% 6%
0
200
400
600
2009 2010 2011 2012 2013
510
30
US$
b
2% 4%
0
200
400
600
2009 2010 2011 2012 2013
15
356
Total deposits
US$
b
2% 4%
0
200
400
600
2009 2010 2011 2012 2013
15
398
Assets YoY growth 43% 12%
–20%
0%
20%
40%
60%
80%
2010 2011 2012 2013
46%
–11%
85%
Financing YoY growth 32% 15%
–20%
0%
20%
40%
60%
80%
2010 2011 2012 2013
–1%–3%
25%
Deposits YoY growth 28% 9%
–20%
0%
20%
40%
60%
80%
2010 2011 2012 2013
–1%–10%
24%
Indonesia
World Islamic Banking Competitiveness Report 2014–1572

Share of global market*
Return on assets
0.0%
1.0%
2.0%
3.0%
2009 2010 2011 2012 2013
2.7%
1.3%
Return on equity
0%
5%
10%
15%
20%
25%
2009 2010 2011 2012 2013
22%
15%
Cost to income ratio
0%
20%
40%
60%
80%
2009 2010 2011 2012 2013
64%
37%
Leverage
0
5
10
15
20
2009 2010 2011 2012 2013
11.8
8.0
Revenue/asset ratio
0.0%
2.0%
4.0%
6.0%
8.0%
10.0%
2012 2013
6.8%
8.8%
0%
5%
10%
15%
20%
25%
2012 2013
17%20%
World Islamic Banking Competitiveness Report 2014–15 73
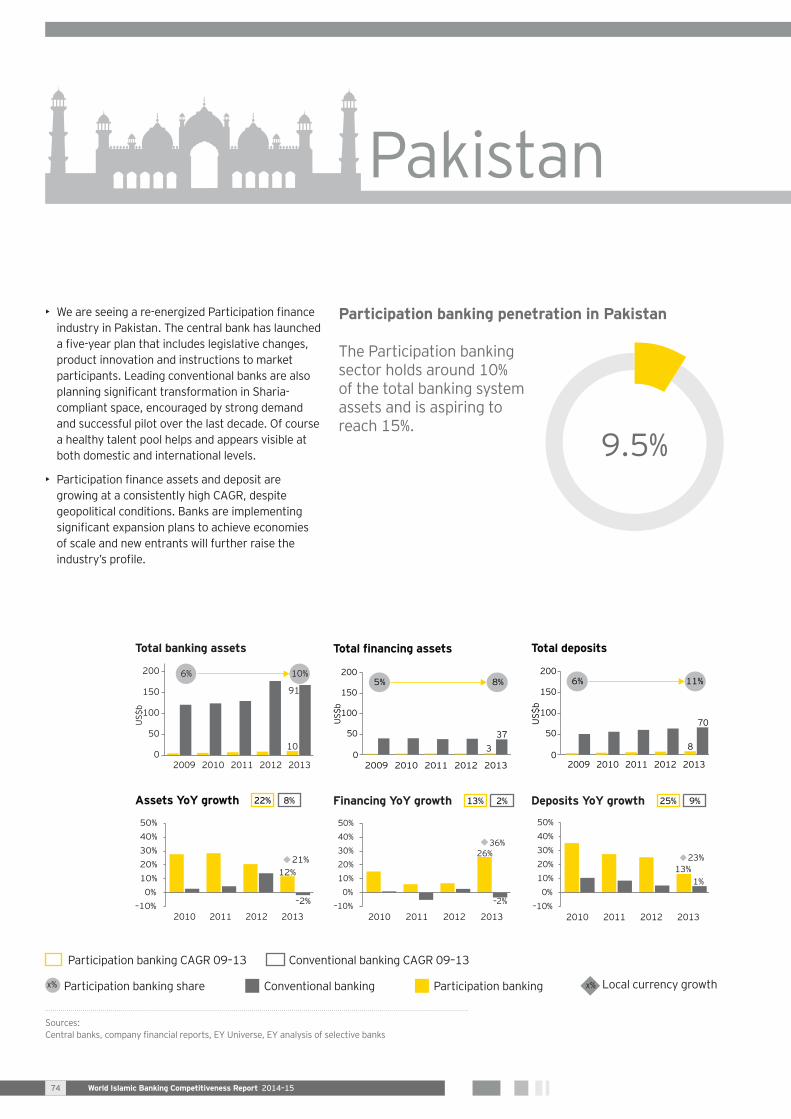
Participation banking penetration in Pakistan
assets and is aspiring to
Total banking assets
2009 2010 2011 2012 2013
10
US$
b
6% 10%
0
50
100
150
200
91
02009 2010 2011 2012 2013
337
US$
b
5% 8%
50
100
150
200
Total deposits
02009 2010 2011 2012 2013
8
70US$
b
6% 11%
50
100
150
200
Assets YoY growth 22% 8%
–10%0%
10%20%30%40%50%
2010 2011 2012 2013
12%
–2%
21%
Financing YoY growth 13% 2%
–10%0%
10%20%30%40%50%
2010 2011 2012 2013
26%
–2%
36%
Deposits YoY growth 25% 9%
–10%0%
10%20%30%40%50%
2010 2011 2012 2013
13%1%
23%
•
•
World Islamic Banking Competitiveness Report 2014–1574
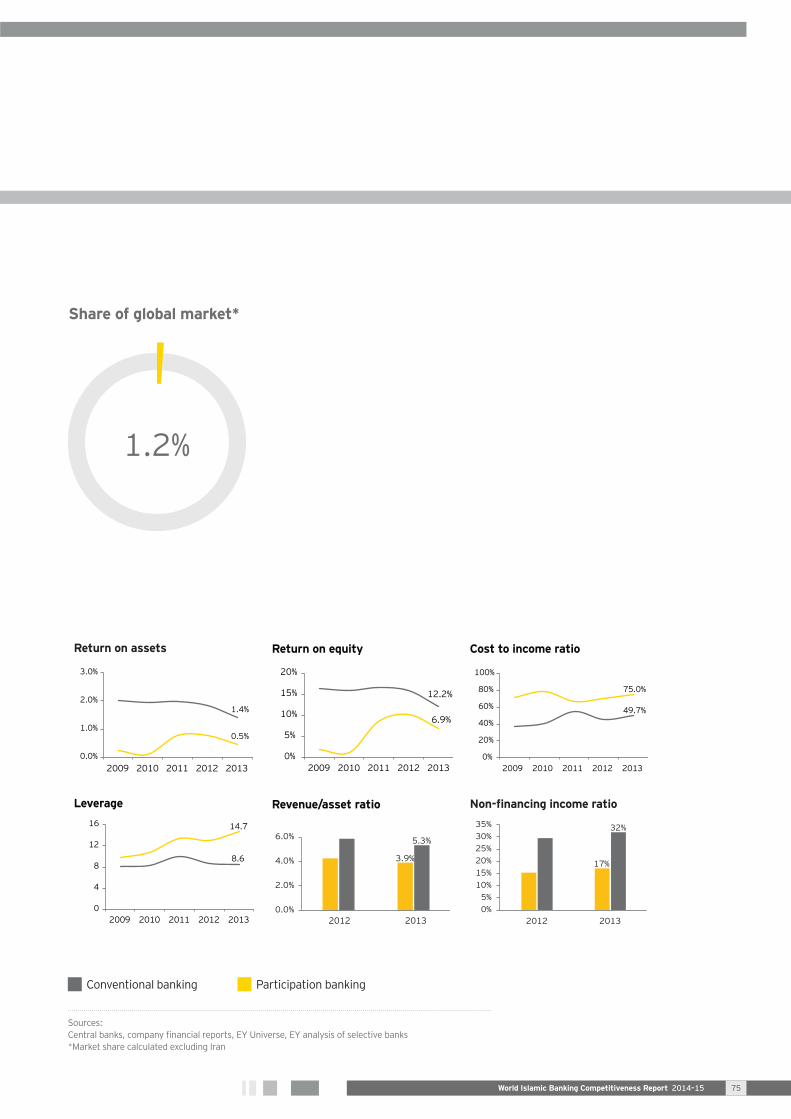
Share of global market*
Return on assets
0.0%
1.0%
2.0%
3.0%
2009 2010 2011 2012 2013
1.4%
0.5%
Return on equity
0%
5%
10%
15%
20%
2009 2010 2011 2012 2013
12.2%
6.9%
Cost to income ratio
0%
20%
40%
60%
80%
100%
2009 2010 2011 2012 2013
75.0%
49.7%
Leverage
0
4
8
12
16
2009 2010 2011 2012 2013
14.7
8.6
Revenue/asset ratio
0.0%
2.0%
4.0%
6.0%
2012 2013
3.9%
5.3%
0%5%
10%15%20%25%30%35%
2012 2013
17%
32%
World Islamic Banking Competitiveness Report 2014–15 75

Our industry awards
Best Islamic Advisory Firm,
2014
Euromoney Islamic Banking Award
Best Takaful Advisory Firm,
2011/2009
3rd International Takaful Summit,
London
WIBC Leading Islamic Financial
Services Provider,2008
World Islamic Banking Awards, Bahrain
Best Islamic Finance
Advisory Firm, 2009/2008/
2007
World Islamic Banking Awards, Bahrain
Best Islamic Advisory Firm,
2014
8th International Takaful Summit 2014
Thought Leadership
Award, 2013
20th Annual World Islamic Banking
Conference Awards, Bahrain
ADIB — Appreciation Award, 2013
1st Annual Global Islamic Economy Summit, Dubai
10th international Real Estate Finance Summit Awards —
London
Best Islamic Advisory Firm, 2013/2011/ 2010/2009
World Islamic Banking Competitiveness Report 2014–1576

•
•
•
•
•
•
•
•
•
•
•
•
•
•
•
•
•
•
•
•
•
•
•
•
•
•
•
•
•
•
World Islamic Banking Competitiveness Report 2014–15 77

Ashar Nazim
Gordon Bennie
Robert Abboud
World Islamic Banking Competitiveness Report 2014–1578
Wajih Ahmed(Bahrain)
Nader Rahimi(Bahrain)
Muzammil Kasbati(Bahrain)
Sarvesh Ramachandran(Dubai)
Imitiaz Ibrahim(Qatar)
Abid Shakeel(Saudi Arabia)
Karan Rana(Dubai)
Nida Raza(Dubai)
Adnan Setaih(Bahrain)
Noman Mubashir(Bahrain)
Umair Yousaf(Bahrain)
Houssam Itani(Qatar)
Ashar Nazim
Noman Mubashir
Murat Hatipoglu (Turkey)
Mohd Husin (Malaysia)
Ken Eglinton (UK)
Merisha Kassie (South Africa)
Yasir Yasir (Indonesia)
World Islamic Banking Competitiveness Report 2014–15 79
EY | Assurance | Tax | Transactions | Advisory
About EYEY is a global leader in assurance, tax, transaction and advisory services. The insights and quality services we deliver help build trust and confidence in the capital markets and in economies the world over. We develop outstanding leaders who team to deliver on our promises to all of our stakeholders. In so doing, we play a critical role in building a better working world for our people, for our clients and for our communities.
EY refers to the global organization, and may refer to one or more, of the member firms of Ernst & Young Global Limited, each of which is a separate legal entity. Ernst & Young Global Limited, a UK company limited by guarantee, does not provide services to clients. For more information about our organization, please visit ey.com.
The MENA practice of EY has been operating in the region since 1923. For over 90 years, we have grown to over 5,000 people united across 20 offices and 15 countries, sharing the same values and an unwavering commitment to quality. As an organization, we continue to develop outstanding leaders who deliver exceptional services to our clients and who contribute to our communities. We are proud of our accomplishments over the years, reaffirming our position as the largest and most established professional services organization in the region.
© 2014 EYGM Limited. All Rights Reserved.
EYG no. EK0339
ED 0115
This material has been prepared for general informational purposes only and is not intended to be relied upon as accounting, tax, or other professional advice. Please refer to your advisors for specific advice.
ey.com/mena