THE EFFECTS OF STATE FUNDING ON EQUALIZING PUBLIC … · Effects of Funding on Education Wendy L....
51
Effects of Funding on Education Wendy L. Warmuth 1 | Page THE EFFECTS OF STATE FUNDING ON EQUALIZING PUBLIC EDUCATION by Wendy L. Warmuth SUBMITTED IN PARTIAL FULFILLMENT OF THE REQUIREMENTS FOR THE DEGREE OF MASTER OF ARTS IN EDUCATION AT NORTHERN MICHIGAN UNIVERSITY November 8th, 2012 Approved: __________________________________________ Dr. Frances O’Neill
Transcript of THE EFFECTS OF STATE FUNDING ON EQUALIZING PUBLIC … · Effects of Funding on Education Wendy L....

Effects of Funding on Education Wendy L. Warmuth
1 | P a g e
THE EFFECTS OF STATE FUNDING ON EQUALIZING PUBLIC EDUCATION by
Wendy L. Warmuth
SUBMITTED IN PARTIAL FULFILLMENT OF THE REQUIREMENTS FOR THE DEGREE OF MASTER OF ARTS IN EDUCATION
AT NORTHERN MICHIGAN UNIVERSITY
November 8th, 2012
Approved: __________________________________________
Dr. Frances O’Neill

Effects of Funding on Education Wendy L. Warmuth
2 | P a g e
Table of Contents
Chapter 1: Introduction
Statement of Problem
Background of Problem
New Legislation
Research Questions
Definition of Terms
Theoretical Framework
Summary
Chapter 2: Literature Review: Proposal A’s Effect on Funding
Introduction
Proposal A’s Effect on Equalized Education
Comparative Study
Educational Outcomes affected by Funding
New Legislation Affecting Student Equity
Public funding vs Charter schools funding
Public funding vs Cyber-Charter schools funding
Community Support affects Funding
Student Performance
Equalized Funding in Education; accomplishments of Proposal A
Chapter 3: Concluding Study
Effects of Funding on Education Wendy L. Warmuth
3 | P a g e
Results of Study
Public Funding, schools of choice, Charter and Online Schools
Chapter 4: Concluding Discussion
Conclusion of Study
Implications
Further Studies
References

Effects of Funding on Education Wendy L. Warmuth
4 | P a g e
Abstract
I would like to answer the following question through quantitative study, research, and
data verification; what are the effects of State funding on equalizing public education in
Michigan after proposal A and how has subsequent legislation changed the existing structure of
student equability as well as the financial structure? I believe this topic is important because an
expectation of being a citizen of the United States of America is a free quality education. One of
the main reasons No Child Left Behind (NCLB) was created was because Americans were
concerned about the state of education. Whether people agree with NCLB or not, standardized
testing is a required part of all public schools and annual yearly progress must be met. I hope to
demonstrate that in studying the issue of funding, there will be a correlation between how
education is funded and how schools are able to accomplish student progress (Fiscal Year, 2012).

Effects of Funding on Education Wendy L. Warmuth
5 | P a g e
Chapter I - Introduction
The definition of a funding equity factor according to the federal government is how
evenly funding is distributed across a state (Federal Education, 2012). Funding equity in
educational services means all school districts receive funding based on an equalized basis to
provide a solid education for their students. Educational equity means good educational
opportunities are equally available to students regardless of the neighborhood a child lives in or
economic environment. Unequal funding translates into students not being equally prepared for
colleges or employment after graduation, which is a primary function of teachers and schools.
Schools not equitably funded give uneven levels of preparation and success for students.
Michigan has over five hundred and fifty public school districts serving more than 1.6 million
students. One of the main reasons No Child Left Behind was created was because Americans
were concerned about the state of education. I believe this topic is important because an
expectation of being a citizen of the United States of America is a free quality education. By a 5-
4 vote, the U.S. Supreme Court ruled that the U.S. Constitution does not require equal funding
among school districts. This decision effectively foreclosed federal court action to remedy
inequities in school funding, at least for the near future. Although as citizens of the United
States we expect a free quality education, the federal government does not require an equitable
education. However, many state constitutions mandate equal opportunities in education.
Whether people agree with NCLB or not, standardized testing is a required part of all
public schools and annual yearly progress (AYP) must be met. AYP is a cornerstone of the
federal NCLB. In Michigan, it measures year-to-year student achievement on the Michigan
Education Assessment Program (MEAP) for elementary and middle schools, or the Michigan

Effects of Funding on Education Wendy L. Warmuth
6 | P a g e Merit Examination for high schools. Other indicators, such as the number of students who
participate in the assessments and graduation rate for high schools, are also considered in the
calculation (MDE, 2012). I hope to demonstrate that a correlation between how education is
funded and how schools are able to accomplish student progress. NCLB supports standards-
based education reform based on the premise that setting high standards and establishing
measurable goals can improve individual outcomes in education. The Act requires states to
develop assessments in basic skills. States must give these assessments to all students at select
grade levels in order to receive federal school funding. The Act does not assert a national
achievement standard; standards are set by each individual state. CLB expanded the federal role
in public education through annual testing, annual academic progress, report cards, teacher
qualifications, and funding changes.
Statement of the Problem
Strong examples show Proposal A did not equalize education between high and low
spending districts. High spending districts will pass bonds to assist their schools and free up
other money to put into their general fund budgets. These previously higher spending districts,
prior to Proposal A, still have higher test scores (Papke, 2008). Michigan has tried to equalize
education by equalizing funding. Proposal A takes away options for local taxpayers to enhance
their local schools with the exception of bonds to fix buildings and infrastructure. Governor
Snyder has added new legislation that changes the funding structure of public school entities
based on prior standardized test scores. Eighteen years have passed since the inception of
Proposal A, what are the successes and failures of this sweeping reform on equalization of
education?

Effects of Funding on Education Wendy L. Warmuth
7 | P a g e Background of Problem
In 1993, Michigan state legislature eliminated local school property taxes, thereby
reducing annual funding for the state’s public schools by almost $7 billion. Michigan took this
action because of several concerns: property taxes were too high, property assessments were
increasing too quickly; and geographic differences in the revenue from property taxes were
creating significant disparities in per-pupil funding across school districts. Proposal A was
instituted in 1994 by taxpayers to create equity in not only the distribution of monies by creating
a state foundation allowance to replace local funding, but to close the gap on student
achievement between previously high spending districts and low spending districts. Power for
school decisions was based in a locally elected school board and the financial support of school
districts was built on systems of local elections to set the millage rate for property tax. The courts
found that school districts were delivering dramatically different funding levels to individual
districts and schools based on their location within the State and their ability to generate
sufficient local resources for their schools. Starting in the 1970s plaintiffs' groups began to make
constitutional challenges to the heavy use of local property tax revenues to finance public
schools. This resulted in systemic discrimination in educational opportunity for many children.
The courts ruled these funding formulas fundamentally flawed and ordered the involved states to
create new funding systems for their states. Funding public schools in this fashion can cause
large disparities in per-pupil expenditures between property-rich and property-poor districts.
Equity suits started arising in the early 1980s based on the state constitutional guarantees of
equal protection and uniformity. Consequently, many states have reformed their funding
formulas to meet equity standards (Board, n.d.). Michigan was not under court review of its

Effects of Funding on Education Wendy L. Warmuth
8 | P a g e school funding structure, but Michigan’s system of locally voted millage rates and local property
taxes created a system where vast differences in funding and educational program were available
to children based solely on their geographic location. Michigan’s system also resulted in state
property owners paying property taxes that were about 35% above the national level. At the
same time, our local school districts were being funded at dramatically different levels. Some of
our poorest school districts were funding their schools with only about $3,277 per child while
some of the state’s richest areas were spending over $10,356 per child. Before the final crafting
of the ballot initiative that was to become Proposal A, legislators, school officials and private
citizens had invested years in searching for the language that would win support from
Michigan’s electorate After 25 years of futility and 12 ballot proposals, Proposal A passed
(Michigan in Brief, 2012).
Proposal A also had a component for schools of choice, which allows students to attend a
public school in a district other than the one in which he or she resides. Students are responsible
for their o wn transportation, and all students have an equal chance of acceptance, regardless of
residence. Under the current schools of choice program, local districts may opt to open their
doors to students who live in other districts but reside within the same Intermediate School
District (ISD). Currently, there are 549 traditional public school districts organized within 57
ISDs in Michigan. Allowing students to take their foundation grant to the public or charter
school of their choice was intended to make schools more responsive to student needs and parent
expectations.
Governor Engler was a strong supporter of this legislation. Cigarette companies opposed
this legislature because Proposal A would increase the tax on cigarettes to be the highest in the

Effects of Funding on Education Wendy L. Warmuth
9 | P a g e nation at the time the proposal passed. The Cigarette companies joined forces with the Michigan
Education Association (MEA) as well as other labor unions who did not believe in this funding
and tax restructuring (National Cancer Society, 2006). The MEA was against proposal A
because they felt it would take money out of their classrooms and schools would become
underfunded in the future (Weeks, 1994).
New Legislation
Several new changes that affect student funding in Michigan have been implemented for
the fiscal year of 2012-2013. Governor Snyder signed a budget bill with an overall increase of
$200.5 million in K-12 education funding when compared to current spending. Some of this
funding was tied to pupil performance funding as well as state defined best practices. The pupil
performance portion includes $30 million for districts showing improvement based on 2010-11
Michigan Educational Assessment Program (MEAP) and Michigan Merit Exam (MME)
performance. The best practice component of the school funding includes $80 million for
districts (maximum payment of $52 per pupil) to all districts that meet the specified criteria.
This bill also included equity payments totaling $80 million for school districts with the
lowest foundation allowances, raising the foundation floor from $6,846 per pupil to $6,966 per
pupil and further closing the gap between the lowest and highest foundation allowance districts.
This further strengthens the equity of funding for Michigan school districts.
New legislation permits the state to operate five cyber charter schools by 2013. In 2014,
the cap will be raised to 10 cyber schools, after which the number could increase to 15. The
number of enrolled students in each cyber school will gradually increase from 2,500 in the first
year, to 5,000 in the second, and 10,000 in the third year and beyond. As soon as cyber charter

Effects of Funding on Education Wendy L. Warmuth
10 | P a g e school enrollment exceeds the two percent cap of total student population, no new students can
enroll.
The new legislation will pay additional funds on a per pupil basis based on performance.
The Governor had set two goals when creating this new funding opportunity. First, implement a
system of State Board of Education rewards for High Performing and High Progressing Schools.
Second, develop policies that incentivize and reward school performance on outcomes, including
improved student achievement proficiency and growth and reduced need for post-secondary
remediation.
Research questions
This literature review should show the changes that have occurred since the inception of
Proposal A. Answering the questions below should provide clearer understanding how this
major funding shift has affected the school systems in Michigan.
1. Did proposal A create a more equitable educational system financially?
2. How much can a community do to assist its local school under Proposal A?
3. Has Proposal A changed educational outcomes in Michigan?
4. What is the impact of charter schools on traditional public school funding?
Definition of Terms
Many terms associated with funding and school districts are used by educators, the
department of education, and legislators that need a solid understanding to make a valid analysis.
The following terms have come from educationally related sources.
Proposal A. Proposal A is a Michigan law, which promised a minimum per pupil
foundation allowance, more equity among local school districts, lower property taxes, and more

Effects of Funding on Education Wendy L. Warmuth
11 | P a g e school accountability. It became a law in 1993 but is still referred to as Proposal A (Michigan
Department of Treasury, 2002).
Best Practices. A best practice is a method or technique that has consistently shown
results superior to those achieved with other means and that is used as a benchmark
Charters Schools. Charter schools are publicly funded elementary or secondary schools
that have been freed from some of the rules, regulations, and statutes that apply to other public
schools, in exchange for some type of accountability for producing certain results, which are set
forth in each charter school's charter (National Education Association, 2002). Public Act 277
provides for an increase in the state’s 225 charter schools to 300 in 2012, 500 in 2014, with no
limit thereafter (Hanover, 2012). A charter school must be charted by the governing board of a
public body that is authorized to issue charter contracts. The following are authorized charters:
State Public University, Community College, K‐12 Local Education Agency, Intermediate
School District (ISD), or two or more of these public agencies exercising power, privilege, or
authority jointly pursuant to an inter-local agreement.
Cyber Charters. Cyber charters are public schools in which students take all of their
coursework online (Higgins, 2012).
Foundation Allowance. A foundation allowance is a per-pupil allowance allocated to
each school district used to pay for school operations (Wicksall & Cleary, 2009).
No Child Left Behind. The No Child Left Behind Act of 2001 is a United States Act of
Congress that is a reauthorization of the Elementary and Secondary Education Act, which
included Title I, the government's flagship aid program for disadvantaged students.

Effects of Funding on Education Wendy L. Warmuth
12 | P a g e
Schools of Choice. The schools of choice provisions in Section 105 and 105c of the State
School Aid Act are designed to allow local school districts to enroll nonresident students and
count these students in membership without having to obtain approval from the district of
residence (Michigan Department Education, 2011).
Theoretic Framework
Michigan has a three-tied educational governance, which includes the Michigan
Department of Education (MDE), Intermediate School Districts (ISD), and Local Educational
Agencies (LEA). State funding is provided to local schools on a monthly basis October through
August omitting September. This funding is called State Aid and makes whole the per pupil
foundation after the State Equalized Value (SEV) is assessed to taxpayers. The theory of
proposal A funding is that all public schools will be given a base foundation for a full time
equivalency (FTE) regardless of their location. The intent is to create an equal funding stream
while allowing for districts to enhance their buildings or infrastructure by allowing voters to pass
a millage for specific purposes.
Below is an example of how the foundation grant is calculated (Thiel, 2011). If the State
has set a foundation of $7,300 per pupil, they will calculate the non-homestead rate for the local
property tax obligation and subtract it from the $7,300 to calculate the State’s obligation.

Effects of Funding on Education Wendy L. Warmuth
13 | P a g e
Effects of Funding on Education Wendy L. Warmuth
14 | P a g e
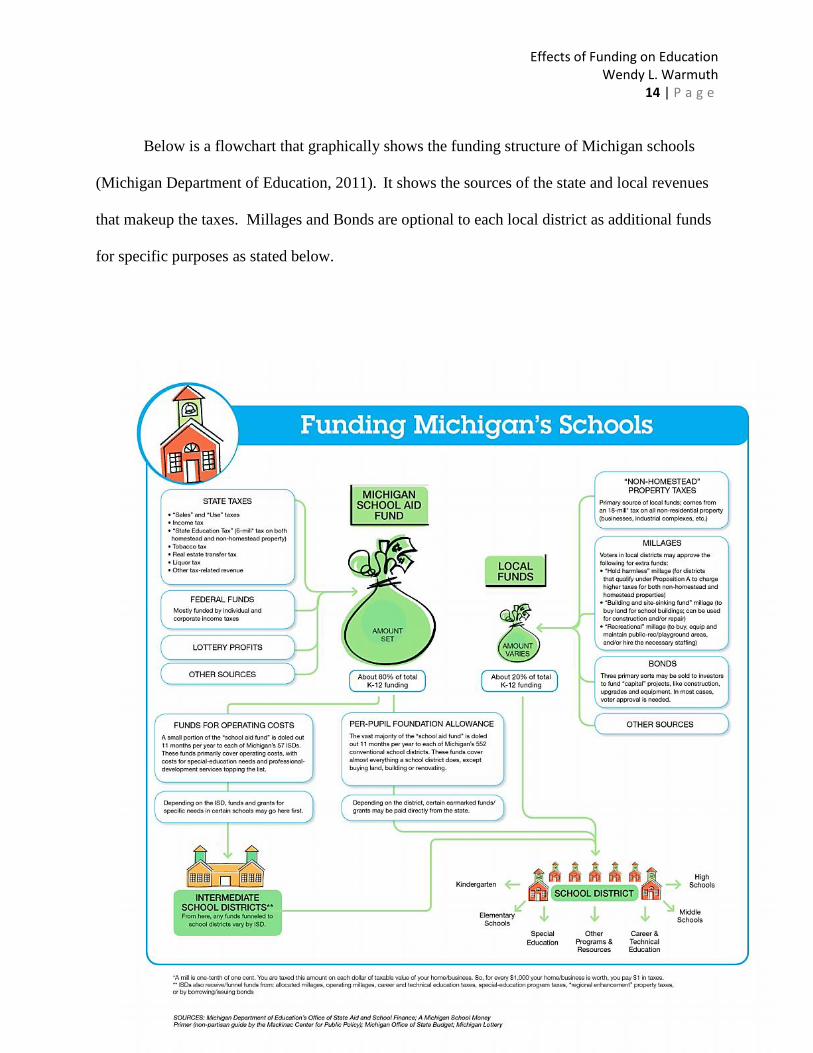
Below is a flowchart that graphically shows the funding structure of Michigan schools
(Michigan Department of Education, 2011). It shows the sources of the state and local revenues
that makeup the taxes. Millages and Bonds are optional to each local district as additional funds
for specific purposes as stated below.

Effects of Funding on Education Wendy L. Warmuth
15 | P a g e Summary
Proposal A was implemented to equalize funding, as well as to allow for additional
options besides physical residency for families when choosing which school to send their
children. School of choice has created competition among school districts vying for the
foundation allowance. The new legislation that affects the 2012-2013 school year will change
the funding structure and challenge the integrity of Proposal A. The pupil achievement portion
could have negative results on the equity of funding. If the department of education gives more
state aid to schools that perform higher, performance may be correlated to the more highly
funded schools and reduce the gains made in closing the funding discrepancies between public
schools in Michigan.
Cyber-schools receive money from the state for each pupil enrolled as traditional public
schools. If the cyber-school is taking students previously enrolled in local public schools, those
public schools will experience a reduction in funding that could prove devastating to a system
that is already on shaky financial ground.

Effects of Funding on Education Wendy L. Warmuth
16 | P a g e
Chapter II – Literature Review
Introduction
I will present data that has been tested in the efforts to analyze the effects of Proposal A
efforts to equalize education in Michigan. High and low performing schools will be compared
before and after the passage of Proposal A. Community bond proposals, new legislation and
other outside influences are examined such as charter, and online schools.
My goal is to investigate how current funding affects the overall achievement of students
throughout the state of Michigan using test scores, financial structures, as well as other indicators
that show school and student success.
Proposal A’s Effect on Equalized Education
Proposal A was instituted in 1994 by taxpayers to create equity in not only the
distribution of monies by creating a state foundation allowance to replace local funding, but to
close the gap on student achievement between previously high spending districts and low
spending districts. A longitudinal study was implemented to see if an increase in spending by
low income districts improved student performance and test scores (Papke, 2008). All 552 public
school districts in Michigan were included in the case study. The estimated effects relied on the
fixed effects and instrumental variable of years prior to Proposal A and years after Proposal A.
Comparative Study
Changing the funding of Michigan’s public schools in 1994-1995 was an attempt to
equalize distribution of monies by shifting responsibility from local school districts to the state.
Proposal A still allows affluent regions to circumvent the system. Researchers have statistical
evidence to support high-spending school districts within Michigan have a greater likelihood of

Effects of Funding on Education Wendy L. Warmuth
17 | P a g e issuing bonds (Zimmer and Jones, 2005). Their quantitative study illustrated that the very
policies designed to centralize control of public school funding produced unintended
consequences, which weakened control. Variables of before Proposal A, after Proposal A, and
limits of spending were used as controls for factors in common within all school districts, and
meant to capture the effect of the spending limit after centralization in 1994-1995. Before and
after referred to the period before and after the funding changed whereas limit referred to the
funding limit each school before the attempt to equalize funding.
High spending districts were the treatment group and low spending districts were the
control group. Using probit regression for the estimates, the results showed a 47% increase in
the probability that a bond would pass in high spending districts. A secondary result showed
bond proposals increased from a mean of $7,568 per pupil before the funding change to a mean
of $20,605 after the funding change. Regression estimates support the theory that districts
limited by centralized funding policies are more likely to issue debt as concluded by Zimmer and
Jones (2005).
Educational Outcomes Affected by Funding
To analyze the data differences between high performing and low performing schools,
samples were split based on average pass rates for the first three years prior to Proposal A
starting in the 1991-1992 school year (Papke, 2005). A production formula of PR = EN + SP +
YE + DE + ER, was used where PR is the district-level Pass Rate, EN contains controls for
Enrollment, SP is Spending Per student, YE is a set of aggregate Year Effects, DE is unobserved
District Effects and ER as peculiar Error that changes across time for each district. Using these
methods for estimates, the results showed that 10 percent more real spending increased the

Effects of Funding on Education Wendy L. Warmuth
18 | P a g e student pass rate by 2.5 percentage points, and more for initially underperforming schools in the
first three years after Proposal A. Test scores improved in previously low spending districts.
The average pass rate for districts in the low spending schools went from 44 percent in the year
just before Proposal A to 76.1 percent in 2003/04 (Papke, 2005).
Another study was done in Oklahoma to determine if higher levels of school funding led
to improvements in student test scores when the effects of other variables, such as family wealth
and the race of the student, were controlled (Ellinger, Wright & Hirlinger, 1995). If money
indeed improved student learning, then the movement toward greater equity in school finance
would take on more significance. The study done included every independent school district in
Oklahoma using data from 1989-90 and 1990-91.
The operationalization of the independent variables for this multiple regression analysis
were as follows: (1) “Revenue”: Total per-pupil revenue received by the school district from
local, state, and federal sources; (2) “Minority”: Percentage of racial minority students; (3) “Free
Lunch”: Percentage of students participating in federal free and reduced-price lunch programs;
(4) “Teacher Salary”: Average teacher salary; (5) “Teacher Degree”: Percentage of teachers with
advanced degrees; and (6) “Teacher Experience”: Average years of teacher experience. The
dependent variable to be explained in this analysis, student achievement, was operationalized by
the use of 1lth-grade achievement test scores..

Effects of Funding on Education Wendy L. Warmuth
19 | P a g e
The major finding was that achievement test scores tend to be higher when school
funding is higher, even when the effects of such important factors as the student’s race, the
family socioeconomic status, and selected teacher characteristics (i.e., teacher experience,
education level, and salary) are held constant. Moreover, these relationships were statistically
significant at the .Ol level in both years, meaning that there is less than one chance in one
hundred that the relationship occurs by chance. Based on this two-year study of every
independent school district in Oklahoma, higher funding does equate to higher student
achievement.
An important part of Proposal A was to level the playing field for student achievement. A
study that showed students in the lowest-spending districts improved significantly on state tests,
though students did not make any significant gains in either ACT scores or participation

Effects of Funding on Education Wendy L. Warmuth
20 | P a g e (Cavanagh, 2011). Meanwhile, evidence supports the hypothesis that the constraints created by
Proposal A had a negative impact on students in the highest-spending districts. A different study
showed a correlation between increases in expenditures by ten percent, the increase is associated
with a 1.0% increase in satisfactory rates in the fourth grade pass scores without the control for
prior outcomes, and a miniscule 0.2% decrease with the control (Cullen, 2000). The increase in
pass scores is evidence that more resources were targeted to districts that were more likely to
improve on test pass rate measures even in the absence of reform. We will have to wait and see
what will happen to pass scores as state aid increases are given to districts who meet the pupil
performance criteria.
New Legislation Affecting Student Equity
On June 26, 2012, the Governor enacted legislation under Section 22f of the State School
Aid Act, 2012 PA 201, that appropriates $80,000,000 to provide $52 per pupil allocations for the
FY 2012-13 school year to local school districts and public school academies meeting seven out
of eight of the following best practices. School districts can choose to forego meeting these
requirements and give up the additional funding. If a district chooses to participate, the eight best
practices are as follows:
1. Hold policy on medical benefit plans
2. Obtain competitive bids for the provision of 2012-13 non-instructional services
3. Accept applications for enrollment of non-resident pupils under Section 105 or 105c
4. Monitor individual pupil academic growth in each subject area at least twice during
the school fiscal year using competency based online assessment.
Effects of Funding on Education Wendy L. Warmuth
21 | P a g e
5. Support opportunities for pupils to receive postsecondary credit while attending
secondary school.
6. Offer online instructional programs or blended learning opportunities to all eligible
pupils.
7. Provide a link on district’s home page to the url for the MiSchoolData portal or
provide data elements on website consistent with the MiSchoolData tables
8. Provide physical education consistent with the 2003 state board policy on quality
physical education, or provide health education consistent with the 2004 state board
policy on comprehensive health education (Wolenberg, 2012).
Best practices, which by NCLB definition refers to a teaching or instructional method
that has been demonstrated by research to be an effective learning tool do not apply to the best
practices listed above. Looking at the eight above best practices, three of them are fiscal best
practices; holding the insurance policy, obtaining competitive bids for non-instructional, and
providing a link to the MiSchoolData. The other five practices are more in line with effective
learning tools and influence student achievement. All of these practices are significant because
if schools do not meet these targets, it will affect the funding they receive from the state.
Whereas proposal A worked toward reducing differences in funding, this new legislation has
potential for greater inequities of the base foundations. By following several of the educational
best practices, it will cost districts money to get money. For example, providing post-secondary
education during high school or dual enrollment allows Michigan high schoolers to take college
courses, with the tuition paid for by their school district, which can be costly. Online learning

Effects of Funding on Education Wendy L. Warmuth
22 | P a g e can also cost school districts money because many pay tuition to Michigan virtual high school
for course offerings.
The federal No Child Left Behind program penalizes individual schools when students do
not make annual progress. Michigan is not the first state to consider rewarding schools that do
well. Governor Rick Snyder's plan for districts to compete for $70 million in extra state money
is part of a growing trend in performance-based education funding. Schools must meet specific
criteria to qualify for this additional payment. The total amount received from all districts cannot
exceed $30,000,000.00.
An amount not to exceed 30% of the maximum per pupil amount allocated shall be used
to make performance incentive payments to qualifying districts based on pupil performance on
state assessments in mathematics in grades 3 to 8. The amount of a payment equals up to $30.00
per pupil for all pupils in membership in a qualifying district. The department shall determine
the qualifying districts as follows:
(a) Using a model determined by the department that incorporates the most recent cut
scores adopted for the Michigan educational assessment program for each pupil in grades
3 to 8 in the 2010-2011 school year, the department shall calculate a point score using a
metric that assigns points to each of those pupils as follows:
(i) For each pupil who began the school year not performing proficiently in
mathematics and who declines in proficiency, as determined by the department,
over the school year, 0 points.

Effects of Funding on Education Wendy L. Warmuth
23 | P a g e
(ii) For each pupil who began the school year performing proficiently in
mathematics and declines in proficiency, as determined by the department, over
the school year, 0 points.
(iii) For each pupil who began the school year not performing proficiently in
mathematics and who maintains his or her level of proficiency, as determined by
the department, over the school year, 1 point.
(iv) For each pupil who began the school year performing proficiently in
mathematics and who maintains his or her level of proficiency, as determined by
the department, over the school year, 2 points.
(v) For each pupil who began the school year not performing proficiently in
mathematics and who improves in proficiency, as determined by the department,
over the school year, 3 points.
(vi) For each pupil who began the school year performing proficiently in
mathematics and who improves in proficiency, as determined by the department,
over the school year, 2 points.
(b) The department shall then calculate a district average for this metric for the 2010-
2011 school year by totaling the number of points for all pupils in grades 3 to 8 under
subdivision (a) and dividing that total by the number of those pupils.
(c) A district is a qualifying district for the payment if the district average for the 2010-
2011 school year is at least equal to a factor of 1.5, and the district tested at least 95% of
its pupils in mathematics, and the district had at least 30 full academic year pupils in
grades 3 to 8 with a performance level change designation in mathematics.

Effects of Funding on Education Wendy L. Warmuth
24 | P a g e
An amount not to exceed 40% of the maximum per pupil amount allocated shall be used
to make performance incentive payments to qualifying districts for high school improvement
using a metric based on the positive trend over a 4-year period in the percentage of high school
pupils in the district testing as proficient in all tested subject areas on the state assessments of
high school pupils. The amount of a payment under this subsection is an amount equal to $40.00
per pupil for all pupils in membership in the district. The department shall determine the
qualifying districts under this subsection as follows:
(a) Calculate a linear regression of the percentage of high school pupils in the district
testing as proficient in all tested subject areas on state assessments of high school pupils
on school year over the 4-year period ending with the 2010-2011 school year as adjusted
for changes in cut scores most recently adopted for the Michigan merit examination.
(b) Calculate a statewide average for all districts operating a high school of the linear
regression of the percentage of high school pupils testing as proficient in all tested subject
areas on state assessments of high school pupils on school year over the 4-year period
ending with the 2010-2011 school year, as adjusted for changes in cut scores most
recently adopted for the Michigan merit examination as the base year for all comparisons.
(c) A district is a qualifying district for the payment under this subsection if the district's
linear regression over the 4-year period ending with the 2010-2011 school year under
subdivision (a) is at least equal to the statewide average linear regression over the 4-year
period ending with the base year under subdivision (b), and the district's linear regression
over the 4-year period ending with the 2010-2011 school year under subdivision (a) is
positive, and the district tested 95% of high school pupils in each tested subject on the

Effects of Funding on Education Wendy L. Warmuth
25 | P a g e
Michigan merit examination, and the district had at least 20 full academic year pupils
take all tested subjects on the Michigan merit examination over each of the most recent 4
years. (The State School, 2012).
Ohio gives an additional $17 per student to districts and community schools rated
excellent or excellent with distinction, and Iowa offers incentives for districts that meet a wide
number of measures that go beyond test scores. Ohio school districts and community schools
can earn an “Excellent with Distinction” or “Excellent” rating and be granted a per pupil subsidy.
Ohio Department of Education put in a requirement that federal maintenance of effort provisions
must be kept for special education and career-technical education. That provision would ensure
that schools would need to meet previous funding efforts within those specified areas in order to
receive the additional funds. (Budget for the state, 2012).
The Iowa incentive program works differently; the goal of the project is to create a new
teacher leadership and compensation structure to help boost student achievement. Iowa’s model
creates mentor and master teacher roles that provides support for classroom teachers and
provides for teachers who specialize in science, technology, engineering and math to seek more
training at local universities (Office of the Governor, 2012).
Public Funding vs Charter Schools F unding
As I stated previously, public Act 277 provides for an increase in the state’s 225 charter
schools to 300 in 2012, 500 in 2014, with no limit thereafter (Hanover, 2012). If new charter
schools open up in Michigan, they will draw students from existing private or public schools.
One of the largest discrepancies between charters and traditional public schools funding occurs
in special education, where traditional districts spent over $500 more per pupil annually than

Effects of Funding on Education Wendy L. Warmuth
26 | P a g e charters (Mack, 2012). Nine percent of charter schools in Michigan have no special education
expenditures. The high cost of educating students with special needs is disproportionately
falling on traditional public schools as other students increasingly opt for alternatives that
aren't always readily open to those requiring special education. Charter schools also have
considerably fewer students classified as English Language Learners, fewer English students
with special education needs, or both. Those students with disabilities who are enrolled in
charter schools tend to have mild and less-costly disabilities. While traditional public schools do
receive special education funds from state and federal sources, those seldom cover all the costs
incurred; districts must cover additional special education costs as part of their current operating
expenses. That doesn’t bring the picture fully into focus, however, because charter schools
generally are more likely to cater to elementary school students, avoiding the upper secondary
students who are most costly to educate (Roy, 2011).
Charter schools can also limit enrollments to ensure an efficient match with existing
facilities and instructors. For example, a charter school with four teachers can choose to admit
only 100 students to ensure that each class will have 25 students. A public school with four
teachers might end up with 80 students or 115 students. Adjustments can be made and more
staff hired, but the teacher-student ratio in traditional public schools is not always predictable
and not necessarily the most cost efficient (Mack, 2012).
Public Funding versus Cyber-charter Online Schools
The cyber-charter expansion was among the more controversial of the newly passed bills
in 2012. Many in the traditional K-12 community opposed this legislation because they felt there
were not enough safeguards to ensure quality for the new cyber charters. Up until now, Michigan

Effects of Funding on Education Wendy L. Warmuth
27 | P a g e law allowed only two cyber charters to exist and capped enrollment in the first year to 400, with
a maximum of 1,000 students. The schools also were required to enroll a significant number of
students who have dropped out of school. The new law will now allow up to five cyber charter
schools to open by Dec. 31, 2013. The cap would increase to 10 by Dec. 31, 2014, and to 15
after that date. Enrollment would be restricted in each cyber charter to 2,500 in the first year, to
no more than 5,000 in the second year, and to no more than 10,000 in the third and subsequent
years. (Michigan Department Education, 2012).
The expansion of Cyber schools has many educators concerned based on several reports.
For example, students in schools operated by the nation’s largest online education company (K12
Inc.) are falling behind students in traditional programs and less likely to remain in their schools
for a full year, according to a National Center for Education Policy (NCEP) report (Murray,
2012).
In the NCEP report, Miron and Urschel (2012) analyzed federal and state data sets for
revenue, expenditures, and student performance. In terms of student demographics and school
performance data, the researchers studied all of K12’s 48 full-time virtual schools. In terms of
revenues and expenditures, they used a federal data set that includes seven K12 Inc. schools from
five different states (Arizona, Arkansas, Idaho, Ohio and Pennsylvania), although these seven
schools accounted for almost 60 percent of all of K12 Inc.’s enrollment from 2008-09, which is
the most recent year of available finance data.
K12 Inc. schools generally operate on less public revenue, but they have considerable
cost savings. They devote minimal or no resources to facilities, operations, and transportation.

Effects of Funding on Education Wendy L. Warmuth
28 | P a g e These schools also have more students per teacher and pay less for teacher salaries and benefits
than brick-and-mortar schools.
Key findings include: Math scores for K12 Inc.’s students are 14 to 36 percent lower than
scores for other students in the states in which the company operates schools. Only 27.7 percent
of K12 Inc.’s schools reported meeting Adequate Yearly Progress (AYP) standards in 2010-11,
compared to 52% for brick-and-mortar schools in the nation as a whole. Student attrition is
exceptionally high in K12 Inc. and other virtual schools. Many families appear to approach the
virtual schools as a temporary service: Data in K12 Inc.’s own school performance report
indicate that 31% of parents intend to keep their students enrolled for a year or less, and more
than half intend to keep their students enrolled for two years or less. K12 Inc.’s schools spend
more on overall instructional costs than comparison schools, including the cost of computer
hardware and software, but noticeably less on teachers’ salaries and benefits. K12 Inc. spends
little or nothing on facilities and maintenance, transportation, and food service. K12 Inc. enrolls
students with disabilities at rates moderately below public school averages; although this
enrollment has been increasing. K12 Inc. spends half as much per pupil as charter schools
overall spend on special education instruction and a third of what districts spend on special
education instruction. The study concluded that the high pupil to teacher ratio had a negative
effect on student achievement.
The Wisconsin Department of Public Instruction collects school-by-school data in
numerous categories, including state assessment tests, ACT scores, graduation rates, attendance,
dropout rates and discipline. Gannett Wisconsin Media parsed and compiled the data to pull out

Effects of Funding on Education Wendy L. Warmuth
29 | P a g e results for virtual schools and put it alongside statewide averages, as the audit bureau had
recommended.
Virtual charter schools, those that allow students around the state to enroll full time in
online classes, have operated in Wisconsin for 10 years, growing from four schools with 265
students in 2002-03 to 25 schools with nearly 5,000 students in 2011-12 (Litke, 2012). The
schools, which operate independently and are overseen by local school boards, enroll about 0.5
percent of the students in the state. Enrollment in Wisconsin’s online schools has doubled in the
last five years, but students who have chosen class without a classroom often struggle to
complete their degrees and repeat grades four times as often as their brick-and-mortar
counterparts, according to a Gannett Wisconsin Media analysis.
When data was not available, as was the case for Advanced Placement tests, teacher
certification, marketing costs and cost per virtual student, Gannett Wisconsin Media filed open
records requests with all 25 virtual charter schools and gathered the information. The result is a
virtual report card, a segmented breakdown of how virtual students measure up to statewide
averages that consist primarily of students from brick-and-mortar classrooms. Gannett
Wisconsin Media examined 25 schools registered with the state as virtual charter schools,
meaning they can and, for the most part, do, conduct classes exclusively online that are open to
any student in the state. Standardized test results also show that virtual school students trail
traditional students in every subject but reading and are far less likely than their peers to take the
ACT or Advanced Placement tests.
In the 2011-12 Wisconsin Student Assessment System testing, virtual students fared
slightly better in reading than their brick-and-mortar counterparts, with 83.1 percent scoring

Effects of Funding on Education Wendy L. Warmuth
30 | P a g e proficient or advanced, compared with 81.9 percent statewide. However, virtual students fell
short in other subjects, with 5 percent to 12 percent fewer virtual students scoring proficient or
advanced in math, social studies, language arts and science compared with the statewide average.
Virtual students also scored lower on the ACT in 2011-12, with students statewide averaging a
score of 22, and virtual students averaging 21.5. Statewide in 2010-11, 99.4 percent of all
students completed the school term they started. In virtual schools, that number was only 83.3
percent. Only 1.4 percent of students statewide were required to repeat a grade that year,
compared with 6.8 percent of virtual students. This study saw a correlation between high teacher
to pupil ratios and lower standardized test scores.
Community Support Affects Funding
Proposal A caps the student foundation to be equal for all schools in order to provide
equalized funding. Communities cannot raise taxes to add to the school’s foundation; however,
taxpayers can pass a bond to assist with capital expenses. A successful bond issue will allow
schools to spend money in classrooms that would have been spent on capital expenses such as a
roof or boiler system. School districts often maintain local discretion over capital expenditures
financed by the sale of bonds. A study conducted by Zimmer and Jones which included all
Michigan’s public schools (2005), found that Michigan's high-spending school districts have a
greater probability of issuing bonds after centralizing public school funding, indicating that debt
financing of capital expenditures may have become a way to allow these school districts to
circumvent the Proposal A’s intent for greater spending equity.
Another way communities can still assist their school district is to donate time and money
to the booster clubs such as athletics, academics, music, art or drama. Schools that have good

Effects of Funding on Education Wendy L. Warmuth
31 | P a g e extra-curricular or well-funded programs will draw school of choice students and assist in
budgetary shortfalls (Plank & Sykes, 1999). Besides drawing school of choice students, if
athletic funding is being assisted by booster clubs, less of general fund money will need to be
transferred to cover costs. High school athletic departments generally operate with funds from
two major sources. They receive their largest amount from their school's general fund and
supplement that with revenue from event admissions (Kalahar, 2010).
Student Performance
Michigan’s school finance reform was designed to improve the equity in funding across
school districts. Most efforts at school finance reform in the 1980s and early 1990s focused on
improving funding equity as required by court actions. Today however, the school finance
debate has moved beyond equalizing school funding to increasingly focus on the idea of
“educational adequacy.” The goal is to design a school financing system that assures that all
students receive a desired level of learning and that financing provides the necessary resources to
support student achievement. In this framework, school financing is linked to both student and
school performance and differences in student characteristics, and regional costs are considered
in determining the equitable level of funding for each school.
In Michigan, the purpose of Proposal A’s equalizing reform was both to offer equal
educational opportunities and to improve student performance, particularly in initially low-
spending (and low-performing) school districts. A study done by Papke (2005) examined the
dramatic changes in district and school-level funding that resulted from Proposal A. Panel data
on Michigan elementary schools for the years 1992 to 1998 was used to examine the effects of
increased spending on test pass rates. The study used annual data at the building level from

Effects of Funding on Education Wendy L. Warmuth
32 | P a g e years bracketing the reform. For each school, pass rates on various Michigan Educational
Assessment Program (MEAP) exams were available, along with per student spending, school
enrollment, average teacher salaries, and pupil-to-teacher ratios. The data come from annual
Michigan School Reports (MSRs). The MSRs had some information on student demographics or
economic status; they used the percent of students eligible for the school lunch program as a
proxy variable for economic well-being of the students at a school. Papke (2005) said that
Michigan's Proposal A created an excellent opportunity to examine the performance-spending
relationship since the dramatic change in school funding produced a natural experiment, in
particular, exogenous changes in spending, that allows for better estimates of the effect of
spending. By using data from before and after the re-financing initiative, she was able to use
school-level data to explore the variation in spending and performance within school districts.
Following is the model used for data collection: Data was pooled across school and time
and estimate standard regression models by ordinary least squares (OLS). They model the
student performance variable, a school pass rate, as a function of per-student spending and other
observable controls. Aggregate time intercepts allow for secular changes in student performance
and spending over time. The equation can be written as Yit=Xitβ+γSit+Ttθ+vit, where Y is
the percent of students passing the MEAP math test at a satisfactory level, X includes students
and school characteristics, school enrollment and percent of students eligible for the school lunch
program, and S is per-student spending at the school level. The vector Tt contains dummy
variables for each year, and v is the unobserved disturbance for school i at time t. The Michigan
School Report data do not contain many such controls, although the free-lunch variable

Effects of Funding on Education Wendy L. Warmuth
33 | P a g e essentially measures the poverty rate, and school enrollment allows school size to affect
achievement and be correlated with spending.
The original Michigan legislation authorizing the establishment of educational standards
and assessment of academic achievement dates from the 1970s. The legislation initially required
tests administered at the elementary and junior high level. Subsequently, an optional high school
series was added that has now become mandatory as well. The mathematics test for 4th and 7th
graders was first administered in 1991. The percentage of students achieving a satisfactory level
of performance in each school and district on these tests, the pass rate, is widely reported. While
pass rates increased generally for all spending percentiles over time, the lowest spending
percentile with the lowest pass rate initially also had the largest increase in the pass rate, 15.7
percentage points, in the first year of reform. The increase in the pass rate in the highest decile
for the 1994/1995 school year was 11.47 percentage points. The study concluded that the
estimated effect of a 10% increase in average spending increases the pass rate by 0.84 percentage
points. A rough rule-of-thumb would be that 10% more real spending increases the pass rate by
between one and two percentage points, and more for initially underperforming schools.
Equalized Funding in Education; Accomplishments of Proposal A
Proposal A has partially achieved its goals. Property taxes in our state are now at about
the national level, and the average Michigan property owner is now paying about $2,000 less
than before Proposal A. The inequality in funding between school districts has also diminished.
The gap before Proposal A was almost 3 to 1 between the highest and lowest spending district.
While still significant, this spending gap has been reduced to about 2 to 1.

Effects of Funding on Education Wendy L. Warmuth
34 | P a g e
The reduction of the spending gap has been Proposal A’s greatest accomplishment
according to researchers at Michigan State University (Proposal A, 2006). The two graphs on
the following pages are provided by Michigan’s house fiscal agency (Wicksall & Wolf, 2012).
The first one shows the shrinking of the difference between the largest and smallest foundation
allowances since the inception of Proposal A. These highest paid foundations have increased by
$1,400 and the lowest paid foundations have increased by $2,646 thus shrinking the gap by
$1,246. The second chart shows that most of Michigan’s students are concentrated within the
lowest two foundation allowances. These foundations are only $500 apart and yet house 74% of
the students.

Effects of Funding on Education Wendy L. Warmuth
35 | P a g e

Effects of Funding on Education Wendy L. Warmuth
36 | P a g e

Effects of Funding on Education Wendy L. Warmuth
37 | P a g e

Effects of Funding on Education Wendy L. Warmuth
38 | P a g e
Chapter III Concluding Study
Results of Study
The Papke (2005) pass test study concluded that at the onset of Proposal A, equalization
improved among all school districts test scores. Proposal A failed to address two longstanding
shortcomings of the old system. First, the formula does not take into account the regional cost
differences of providing education. For example $7,000 per pupil buys a lot more education in
the Upper Peninsula than in southeast Michigan (for example, in 1994 salaries in the Oakland
County ISD were 44 percent higher than in the eastern U.P. ISD). Second, there is no provision
for equalizing debt millage, which places low-property-value districts at a great disadvantage
(for example, Birmingham can raise about $270 per mill per pupil, while Detroit can raise only
$16).
Public Funding, Schools of Choice, Charter and Online Schools
Opponents to charter schools argue that charter schools take away funds from the public
schools. These same opponents also question the stability of charter schools. Several charter
schools have opened and later closed due to poor management or financial problems. Some
charter schools last only a few years. In addition, charter schools are often not available for
middle school or high school students. The necessity to change may be a concern for some, as
the child will not be able to continue in the same schooling environment (Charter schools, n.d.).
In Michigan, the State School Aid Act (SAA) allows school districts to accept students
from within the same intermediate school district (ISD) or from other ISDs, without needing to
obtain the permission of the home district of the student (Saultz, 2009). The percentage of
students who choose to participate in the schools of choice program outside of their resident ISD
Effects of Funding on Education Wendy L. Warmuth
39 | P a g e increased by 123.7% from the fall of 2002 to the fall of 2008. In the fall of 2008, nearly 16,000
students statewide (or 1.0%) were in schools of choice outside their home ISD. The percentage
of students participating in schools of choice within their resident ISD rose 85.6% over the same
time, and accounted for nearly 4.0% of the statewide student population by the fall of 2008. The
percentage of students attending charter schools increased by 55.5% over the six-year period,
accounting for 6.5% of the number of students statewide. In total, more than 11.3% of
Michigan's students (more than 183,000) attended school not in their resident district, but used
schools of choice in another district within the home ISD, in another district outside the home
ISD, or at a charter school, a 69.4% increase over six years. These figures are significant since
families who have children attending a school of choice or a charter school, can vote against a
bond issue in their school district and not influence their children. Families could also send their
children to schools that passed bonds and take advantages of additional services without the tax
burden.
Students in schools operated by the nation’s largest online education company (K12 Inc.)
are falling behind students in traditional programs and less likely to remain in their schools for a
full year, according to a National Center for Education Policy report (Murray, 2012). The first
two cyber-charters in the state, based in Grand Rapids and Lansing, opened a year ago. Murray
said math scores for K12 Inc.’s students are 14 to 36 percent lower than scores for other students
in the states in which the company operates schools. Also, 27.7 percent of K12 Inc.’s schools
reported meeting Adequate Yearly Progress standards in 2010-11, compared to 52 percent for
traditional schools in the nation as a whole (Murray, 2012).

Effects of Funding on Education Wendy L. Warmuth
40 | P a g e
Children in Michigan who enrolled in the K12 Inc. cyber-school received full-time
instruction in front of a computer instead of in a classroom. Those children compared with
students who had a live teacher are more likely to fall behind in reading and math. The students
in the cyber schools are also more likely to move between schools or leave school altogether and
the cyber school is less likely to meet federal education standards. The study comes after
Michigan lawmakers have expanded the number of cyber charter schools allowed to open in the
state, and as traditional school districts open their own online schools.

Effects of Funding on Education Wendy L. Warmuth
41 | P a g e
Chapter IV Concluding Discussion
Introduction
Proposal A had two major objectives at the onset of passage eighteen years ago. Equalize
funding among school systems and reduce personal property taxes. Equalizing funding was
expected to equalize student success. The property tax is easy to track through county records
and is clear-cut, equalization and student success is much more complex.
Conclusion of Study
Proposal A was a radical shift in the way schools were funded. The gap has narrowed,
but there is still a disparity. House Fiscal Agency analysts have said that 40 percent of the state's
550 districts get the $6,846 minimum, and 34 percent are just above it, topping out at $7,346.
And 18 percent are between $7,346 and $8,346. Some receive nearly $12,000 per child. This
reform equalized spending across districts by bringing up the lowest spending districts and
essentially freezing the revenues of higher spending districts. The funding responsibility shifted
responsibilities to the state level and constrained the revenue raising capacity of local
jurisdictions. Local property taxes were cut $63 billion from 1994 through 2003 while state
taxes were increased $46 billion for a net cut of $17 billion over the ten years. (Michigan
Department of Treasury, 2002).
Studies have shown that local communities can alter equalized funding from the State.
High spending districts that reside in affluent neighborhoods will go for a bond issue and have a
likelihood of having the bond passed. Bond monies allow for capital expenses, which can reduce
their general fund expenses. Using bond monies translates into more money into the high
spending school districts and unequal funding (Zimmer & Jones, 2005).

Effects of Funding on Education Wendy L. Warmuth
42 | P a g e
Test scores did improve in previously low spending districts; the average pass rate for
districts in the low spending schools went from 44 percent in the year just before Proposal A to
76.1 percent in 2003/04 (Papke, 2005). Generally, the problem is that variations in education
inputs might be correlated with unobserved factors that affect student outcomes such as; family
income, drug or alcohol abuse or difficult home situations. The increase could also be attributed
to changes in teaching methods or parental support.
The impact of Proposal A creating school of choice changed the landscape of the student
demographic by allowing parents to make decisions on where to educate their children. With
proposed changes in legislation uncapping charter and online schools, public education may need
to brace for another major shift. However, the current research indicates that both charter and
cyber-charters are performing below traditional school districts. The biggest indicator of success
is the teacher-pupil ratio, so maybe the State could consider tying funding to lower class sizes as
well as achievement.
Linking school finance to school performance outcomes is here to stay. Providing access
to an adequate education should be considered as important as equity in funding. One hardship
would be defining what is adequate, it can take many forms and still requires considerable
judgment. In addition, should schools be held fully accountable for student outcomes when so
many other household and community factors beyond the schools’ control influence student
performance? Perhaps the most controversial question is whether standardized tests should be
used to determine what constitutes adequate performance.

Effects of Funding on Education Wendy L. Warmuth
43 | P a g e What Can Be Done about Inequities in Schools?
Teachers and administrators need to understand the funding of schools and contact their
legislators with thoughts on how to adequately, and equally fund our schools. Discussions could
be had on what percent fund equity is allowed, how much money is transferred to athletics, how
much should be required to go into classrooms. Teachers need to think of how to provide the
best education possible to their students with the funds received annually. Involving teachers in
the budget process could provide needed insight to cost containment proposals.
If people in the United States were to commit themselves to a level playing field in public
education, they, like some other countries, should provide extra funding for schools that serve
large numbers of impoverished students. Such funds would be needed not only for special
educational programs and extra physical facilities but also for additional salaries to recruit and
retain qualified teachers who would otherwise migrate to schools serving fewer “problematic”
students.
In the United States, 17 states have progressive funding systems, according to which the
state allocates greater funding to districts buckling under poverty (Cavanagh, 2012). Utah, New
Jersey, Ohio, and Minnesota are the most progressive states. Six states have regressive funding
systems, in which richer school districts receive more state dollars. Illinois is the most regressive
state, followed by North Carolina, Alabama, Michigan, Texas, and Colorado. The top-ranked
state, in terms of devoting a sufficient share of state and local funding to needy districts, is Utah.
While that state provides only $6,586 in mean revenues per pupil, its poorest districts receive
much more, $8,608 per student, than the wealthiest ones do, at $5,700. But what seems

Effects of Funding on Education Wendy L. Warmuth
44 | P a g e indisputable is that their focus on impoverished schools is critical to many of the debates playing
out in public education today, given the nationwide focus on turning around low-performing
schools, finding teachers to work in those schools, and arranging interventions to help struggling
students. Many of the lowest-performing students come from impoverished backgrounds.
State Budget Solutions examined national trends in education from 2009-2011, including
state-by-state analysis of education spending as a percentage of total state spending, and a
comparison of average graduation rates and average ACT scores per state. The study shows that
states that spend the most do not have the highest average ACT test scores, nor do they have the
highest average graduation rates (DePena, 2012). Based on the findings in the full study, higher
levels of funding do not ensure higher graduation rates, nor does it directly correlate to higher
test scores on the ACT. Improving education requires multifaceted efforts, not solely increasing
funding.
If you are an educator, an administrator, a school board member, or a parent interested in
greater funding equity, here are a few strategies you can consider. Become familiar with the facts
and issues associated with equity and funding in U.S. schools. Become politically active in
support of funding reform. Work with the media to raise public awareness of funding inequities
and their implications in education. Lobby your representatives in Congress to make the case for
more federal support of impoverished schools, and work with others at the state level to support
legal and legislative actions favoring greater funding equity.
Further Research
Michigan was making headway in creating funding equity after Proposal A, but added
new legislation that could swing the funding out of balance. There is a need for more research

Effects of Funding on Education Wendy L. Warmuth
45 | P a g e on charter and cyber-charter schools. With Michigan expanding the number of allowable cyber-
charter schools, MDE should place a priority on understanding why cyber-charters are under-
performing in comparison to traditional schools. The numbers of charter schools are also being
uncapped and warrant further review. Traditional districts spent over $500 more per pupil
annually than charter schools and service more special education (costly) students. Should all
schools be funded similarly, or should there be a structure put in place that reviews the cost of
educating elementary students versus high school students versus special education students
versus online students? Additional factors that could be included would be transportation,
building expenses, special education, and the student to teacher ratio. Lastly, as Michigan’s
pupil performance funding begins to create a research base, MDE should look into whether or
not the funding closes the funding equity gap or increases the gap. In other words, will the high-
spending districts meet the student achievement benchmarks and the low-spending districts miss
the mark.

Effects of Funding on Education Wendy L. Warmuth
46 | P a g e
REFERENCES
Board, J. (n.d.). Consequently, many states have reformed their funding formulas to meet equity
standards. Retrieved from
http://education.stateuniversity.com/pages/1882/Constitutional-Requirements-Governing-
American-Education.html
Budget for the State of Ohio. (2012). Transforming Ohio for growth. Retrieved from
http://governor.ohio.gov/Portals/0/pdf/budget/Post%20Budget%20Education%20Reform
%20Fact%20Sheet.pdf
Cavanagh, S. (2012). How progressive is your state’s school funding? Education Weekly
Cavanagh, S. (2011). Michigan policy helped poor districts academically, not rich ones, study
says, Education Week. Retrieved from
http://blogs.edweek.org/edweek/state_edwatch/2011/05/did_michigan_plan_to_help_low
-income_districts_hurt_higher-income_ones.html
Charter Schools (n.d.); More choices for parents, just for mommies. Retrieved from
http://www.justmommies.com/articles/charter-schools.shtml#ixzz1beBkmPcb
Cullen, J., & Loeb, S. (2000). School finance reform in Michigan: evaluating proposal A,
University of California. Retrieved from
http://dss.ucsd.edu/~jbcullen/research/MIschfin.pdf
DePena, E. (2012). Throwing money at education isn’t working. State Budget Solutions.

Effects of Funding on Education Wendy L. Warmuth
47 | P a g e Ellinger, K., Wright, D.E. III, & Hirlinger, M.W. (1995). Brains for bucks?: School revenue and
student achievement in Oklahoma. The Social Science Journal, 32(3), 299-308.
Federal Education Budget Project. (2012). No child left behind act – title I school funding equity
factor. Retrieved from http://febp.newamerica.net/background-analysis/no-child-left-
behind-act-title-i-school-funding-equity-factor
Fiscal Year 2013 Education omnibus budget. (2012, June). Budget basics for child and family
advocates. Voices for Michigan Children.
Hanover, N. (2012). Michigan gives green light for charter school expansion. World Socialist
Web Site. Retrieved from http://www.wsws.org/articles/2012/jan2012/mich-j18.shtml
Higgins, J. (2012). Snyder signs bill to expand cyber charter schools in Michigan. Detroit Free
Press
Kalahar, G. (2010). High school athletic departments feeling effects of budget crunches.
Retrieved from
http://www.mlive.com/news/jackson/index.ssf/2010/05/high_school_athletic_departmen.
html
Litke, E. (2012). Virtual charter schools in Wisconsin not making the grade. Gannett Wisconsin
Media analysis
Mack, J. (2012). Michigan charter schools spend more on administration, less on instruction,
study finds. Retrieved from
http://www.mlive.com/education/index.ssf/2012/04/michigan_charter_schools_spend.ht
ml
Effects of Funding on Education Wendy L. Warmuth
48 | P a g e Michigan Department of Education. (2011). Schools of Choice. Retrieved from
http://www.michigan.gov/mde/0,1607,7-140-6530_30334-106922--,00.html
Michigan Department of Education. (2012). AYP. Retrieved from
http://www.michigan.gov/mde/0,1607,7-140-22709_22875---,00.html.
Michigan Department of Education. (2012). Snyder, Flanagan address cyber charter school
legislation. Retrieved from http://www.michigan.gov/mde/0,4615,7-140--277296--
,00.html
Michigan Department of Treasury. (2002). School finance reform in Michigan proposal a:
retrospective. Retrieved from http://www.michigan.gov/documents/propa_3172_7.pdf
Michigan in Brief. (1998). K-12 Funding. Michigan in brief: 1998–99. Retrieved from
http://www.michiganinbrief.org/edition06/text/issues/issue-39.htm
Miron, G. & Urschel, J. (2012). A study of student characteristics, school finance, and school
performance in schools operated by K12 inc. National Education Policy Center.
Retrieved from http://nepc.colorado.edu/files/nepcrbk12miron.pdf
Miron, G. & Urschel, J. (2010). Equal or Fair? A Study of Revenues and Expenditures in
American Charter Schools. East Lansing, MI: The Great Lakes Center for Education
Research & Practice.
Murray D. (2012). Study says K12 cyber school students falling behind, company calls report
'deeply flawed'. Retrieved from
http://www.mlive.com/education/index.ssf/2012/07/study_says_k12_cyber_school_st.ht
ml

Effects of Funding on Education Wendy L. Warmuth
49 | P a g e National Cancer Institute (2006), Michigan’s proposal a. Retrieved from
http://cancercontrol.cancer.gov/tcrb/monographs/19/m19_appendix.pdf
National Education Association. (2002). Charter schools. Retrieved from
http://www.nea.org/charter
Office of the Governor of Iowa. (2012) Gov. Branstad, Lt. Gov. Reynolds announces Iowa
school districts receive teacher incentive funding. Retrieved from
https://governor.iowa.gov/2012/09/gov-branstad-announces-iowa-school-districts-
receive-teacher-incentive-funding/
Papke, L. E. (2008). The effects of changes. Public Finance Review, 36, 456-474.
doi:10.1177/1091142107306287
Papke, L. E. (2005). The effects of spending on test pass rates: Evidence from Michigan. Journal
of Public Economics, 89, 821-839. doi:10.1016/j.jpubeco.2004.05.008
Plank, D., & Sykes, G. (1999). How choice changes the education system: A Michigan case
study. International Review of Education, 45, 385-416. doi:10.1023/A:1003802302518
Proposal A was a landmark decision in Michigan, (2006) Michigan State University. Retrieved
from http://www.educ.msu.edu/epfp/meet/01-26-04propa.htm
Roy, Joydeep. (2011). Impact of School Finance Reform on Resource Equalization and
Academic Performance: Evidence from Michigan. Retrieved from
http://www.mitpressjournals.org/doi/pdf/10.1162/EDFP_a_00030
Roy, Joydeep. (2011). Do charter schools crowd out private schools. Federal Reserve Bank of
New York Staff Report. Retrieved from
http://www.newyorkfed.org/research/staff_reports/sr472.pdf
Effects of Funding on Education Wendy L. Warmuth
50 | P a g e Saultz, A. (2009). Topics of legislative interest: explaining school choice, State Notes. Retrieved
from
http://www.senate.michigan.gov/sfa/Publications/Notes/2009Notes/NotesJulAug09ks.pdf
The State School Aid Act Of 1979 (Excerpt) Act 94 of 1979. (2012). Michigan legislative
website. Retrieved from
http://www.legislature.mi.gov/(S(jc20kf55ee0ohve0g0oyvg45))/mileg.aspx?page=MCLI
ndex&objectname=mcl-chap388
Thiel, C. (2011). Financing k-12 education in Michigan: background and current status, Citizens
Research Council of Michigan. Retrieved from
http://www.crcmich.org/PUBLICAT/2010s/2011/ElkRapids_05-24-11.pdf
Van Beek, M. (2011). Michigan spends more on teacher’s benefits than most other states.
Retrieved from http://www.michigancapitolconfidential.com/14273
Weeks, G. (1994). Odd couple: MEA, tobacco industry team up to fight school ballot issue.
Detroit New. February 10.
Wicksall, B., & Cleary, M. A. (2009). The basics of foundation allowance. House Fiscal Agency,
Retrieved from
http://house.michigan.gov/hfa/PDFs/Basics%20of%20the%20Foundation%20Allowance
_FY09.pdf
Wicksall, B. & Wolf, M. (2012). School aid. House Fiscal Agency. Retrieved from
http://www.house.mi.gov/hfa/PDFs/Briefings_New/School%20Aid%2011-12.pdf
Wolenberg, C. (2012, August). Memorandum. Michigan Department of Education.

Effects of Funding on Education Wendy L. Warmuth
51 | P a g e Zimmer, R., & Jones, J. T. (2005). Unintended consequence of centralized public school funding
in Michigan education. Southern Economic Journal, 71, 534-544. doi:10.2307/20062058