The effect of the fitzgerald-lorentz contraction on the...
28
606 The Effect of the Fitzgerald-Lorentz Contraction on the Frequency of Fongitudinal Vibration of a Rod By A. B. W ood , D.Sc., Admiralty Research Laboratory and G. A. T om- linson , D.Sc., and L. E ssen , B.Sc., National Physical Laboratory ( Communicated by SirFrank 1936) The failure of the Michelson-Morley experiment to detect ether-drift led Fitzgerald in 1892 to suggest that the framework which supported the interferometer mirrors was distorted by its motion through the ether in such a way that the expected ether-drift effect was exactly neutralized. Later experiments by Morley and Miller, in 1903, using different materials for the framework led substantially to the same result. Fitzgerald’s hypothesis received the support of Lorentz in 1895, and as recently as 1921 the latter remarks “ There can be no question about the reality of this change of length Lorentz considered that the change of length produced by motion was just as real as that produced by change of temperature. * According to the Fitzgerald-Lorentz theory, a moving body contracts in the direction of motion in the ratio where v is the velocity of translation of the body and c is the velocity of light. The velocity of the earth’s orbital motion is approximately 30 km./sec., and the velocity of light is 300,000 km./sec. A body carried by the earth is therefore subject to a contraction of 5 parts in 109 of its length as it is oriented from a direction at right angles to a direction along the line of the earth’s orbital motion.f If this change of length is real, as Lorentz supposes, an interesting problem arises for a rod vibrating longitudinally. The fundamental * ‘ Nature,’ vol. 106, p. 793 (1921). t This disregards the rotational motion of the earth about its N.S. axis, the velocity of a point on the equator being only 0-46 km./sec. Other motions of the earth apart from the orbital motion in the solar system, are also disregarded. I ntroduction By A. B. W ood , D.Sc. (1) on July 12, 2018 http://rspa.royalsocietypublishing.org/ Downloaded from
Transcript of The effect of the fitzgerald-lorentz contraction on the...

606
The Effect of the Fitzgerald-Lorentz Contraction on the Frequency of Fongitudinal Vibration of a Rod
By A. B. W o o d , D.Sc., Admiralty Research Laboratory and G. A. T omlin so n , D.Sc., and L. E ssen , B.Sc., National Physical Laboratory
( Communicated by Sir Frank Smith, Sec. R.S.— Received 30 ,1936)
The failure of the Michelson-Morley experiment to detect ether-drift led Fitzgerald in 1892 to suggest that the framework which supported the interferometer mirrors was distorted by its motion through the ether in such a way that the expected ether-drift effect was exactly neutralized. Later experiments by Morley and Miller, in 1903, using different materials for the framework led substantially to the same result. Fitzgerald’s hypothesis received the support of Lorentz in 1895, and as recently as 1921 the latter remarks “ There can be no question about the reality of this change of length Lorentz considered that the change of length produced by motion was just as real as that produced by change of temperature. *
According to the Fitzgerald-Lorentz theory, a moving body contracts in the direction of motion in the ratio
where v is the velocity of translation of the body and c is the velocity of light. The velocity of the earth’s orbital motion is approximately 30 km./sec., and the velocity of light is 300,000 km./sec. A body carried by the earth is therefore subject to a contraction of 5 parts in 109 of its length as it is oriented from a direction at right angles to a direction along the line of the earth’s orbital motion.f
If this change of length is real, as Lorentz supposes, an interesting problem arises for a rod vibrating longitudinally. The fundamental
* ‘ Nature,’ vol. 106, p. 793 (1921).t This disregards the rotational motion of the earth about its N.S. axis, the velocity
of a point on the equator being only 0-46 km./sec. Other motions of the earth apart from the orbital motion in the solar system, are also disregarded.
I n t r o d u c t io n
By A. B. W o o d , D.Sc.
(1)
on July 12, 2018http://rspa.royalsocietypublishing.org/Downloaded from

The Fitzgerald-Lorentz Contraction 607
frequency N of such a vibration for a rod of length /, elasticity E, density p, and sound velocity u, is given by
If the length only is affected by motion we should expect a change of frequency of 5 parts in 109 as the rod is turned from a direction at right angles to a direction along the line of the earth’s orbital motion. In the Michelson-Morley experiment an attempt was made to observe a change in the apparent velocity of light as the apparatus was rotated. The fail ure to detect the change led to the assumption regarding the change of length of the apparatus. The vibrating rod experiment now proposed differs in one important particular. If, as we might suppose, there is no observable change of frequency of the rod as it is rotated, the neutralization of the change of length must be due to a change in some other physical characteristic of the rod. This has no counterpart in the Michelson- Morley experiment.
Relativity theory predicts the result of the Michelson-Morley experiment and states, further, that it is impossible by means of an experiment to detect uniform motion relative to the ether. This being so we should not expect to detect a change of frequency of the vibrating rod as it is rotated. This implies not only a change of length of the rod but also a change of elasticity and/or density. It seems unlikely that the density will change, for the motion would probably affect the density of the rod equally whether broadside or end-on to the ether drift. Zero change of frequency would therefore imply a change of elasticity which exactly compensates for the change of length assumed by Fitzgerald and Lorentz.* On this basis, expression (2) for the frequency indicates a decrease o f elasticity in the ratio
That is to say, the length of the rod will change by 5 parts in 109 and the elasticity by 10 parts in 109 due to the earth’s orbital motion.
* The alternative explanation, that neither length nor elasticity change would, of course, be completely at variance with the Fitzgerald-Lorentz theory and would require a stationary ether.
<3)
which neutralizes the decrease o f length in the ratio
2 TVOL. c lv iii.— A.
on July 12, 2018http://rspa.royalsocietypublishing.org/Downloaded from

608 A. B. Wood, G. A. Tomlinson, and L. Essen
During the last few years very accurate methods have been devised for comparison of standards of frequency. The National Physical Laboratory, has an elinvar rod and a quartz oscillator which can be relied on to maintain a constant frequency with an accuracy of ± 1 part in 109 for an hour or more. Standard quartz oscillators in use at the Physikalisch- Technische Reichsanstalt, Berlin, are stated to be capable of maintaining an accuracy of the same order. The frequency stability of these oscillators is determined by means of slow beats obtained between two oscillators of nearly equal frequencies, the time required to give a definite number of beats being accurately measured.* Quartz rod oscillators are particularly suitable for the vibrating rod experiment. If an appreciable change of frequency occurs whilst one rod is rotated, a second “ reference” rod remaining stationary, then a change of beat frequency between the two rodsf will be observed.
The errors arising in the Michelson-Morley interferometer experiment are due mainly to the relatively large dimensions of the interferometer arms, 4 or 5 metres long. Minute changes of separation of the interferometer mirrors might be caused by: temperature variations, magnetic and centrifugal effects, yielding of supports, flexure of the arms in rotation, etc. The elimination of these errors presents a formidable problem when a search is being made for a change of 5 parts in 109. With a rod of quartz a few centimetres long, however, such troubles are almost entirely absent and the accuracy of the final result must therefore be greatly increased.
The possibilities of carrying out such an experiment with quartz rods were discussed with Mr. J. E. Sears and Dr. G. A. Tomlinson, in February, 1935. Sir Arthur Eddington very kindly advised on the relativity aspect of the matter, and it is desired to take this opportunity of thanking him for his very helpful comments on the proposed experiments. The Director of the Laboratory, the late Sir Joseph Petavel, agreed to have the experiment made, and the work has been carried out by Dr. G. A. Tomlinson and Mr. L. Essen who, in their respective Departments of the Laboratory, have much experience of accurate time and frequency standards.
* Sheibe and Adelsberger, ‘ Ann. Physik,’ vol. 18, p. 1 (1933).t The beats occur, of course, between the electrical circuits containing the two
rods.
on July 12, 2018http://rspa.royalsocietypublishing.org/Downloaded from
The Fitzgerald- LorentzContraction 609
E xperim ental I nvestigation
By G. A. T om linson , D.Sc., and L. E ssen, B.Sc.
The experiment suggested is clearly one that demands an extremely high degree of precision in the frequency measurements involved, if it is to be completely successful. Oscillators in use at The National Physical Laboratory as frequency standards had been maintained at a constant frequency for a period of an hour to within 1 part in 109; two oscillators of different types, controlling phonic motor clocks, had maintained relatively correct time to within 0 001 second for ten days. Even this high order of precision was considered to be hardly adequate for this experiment in which one must, if successful, discriminate decisively between an effect of magnitude such as 5 parts in 109 and no effect at all. To improve on the precision already attained, with the added complication that the oscillator under observation must be rotated, presented a problem beset with difficulties. Nevertheless, a careful consideration of all the factors affecting the experiment led us to think that it might be attempted with a reasonable chance of success.
The experiment with sound waves, as contrasted with the use of light waves in the Michelson-Morley experiment, appeared to have certain inherent advantages. The wave path, for example, needs to be only a few centimetres in length, and it appeared possible that the frequency measurements could be made with sufficiently high precision to yield a definite result in a single experiment, eliminating the necessity for resort to a statistical analysis of a large number of observations.
There is not at present an entirely satisfactory agreement amongst those who have worked at great length and with great care on the Michelson- Morley experiment. Although the experiment is always cited as proving that there is no ether drift, it is interesting to note that this has never been claimed by the original experimenters themselves. Michelson and Morley concluded from their experiments that the effect was not more than one-fourth of that anticipated, or that the relative motion did not exceed one-fourth of the earth’s orbital velocity. The whole of these observations, and those of later experiments conducted by Morley and Miller, have more recently been analysed by Miller,* who finds that they are in striking agreement, giving a relative velocity of about 9 km./sec. On the other hand, the experiment has been repeated by a number of
* ‘ Rev. Mod. Phys.,’ vol. 5, p. 203 (1933).
on July 12, 2018http://rspa.royalsocietypublishing.org/Downloaded from

610 G. A. Tomlinson and L. Essen
other observers among whom are Kennedy,* A. Piccard and Stahel,f Michelson, Rease, and Pearson,% and Joos,§ and they all report a null effect within the limit of accuracy of their measurements which is usually of the order of 1 km./sec.
These considerations made it appear particularly desirable to undertake the similar experiment on the velocity of sound, especially as the total experimental evidence of other kinds, mainly astronomical, in support of the theory of relativity is so limited.
G eneral Scheme of the Experiment
The oscillators previously established at the Laboratory consisted of a ring type of quartz crystal and a metre bar of elinvar in a vertical position. The former is obviously of unsuitable form for the purpose of this experiment and the latter would lead to a very unwieldy piece of apparatus. It was therefore decided to set up two closely similar quartz oscillators of bar shape, one of these being stationary and the other mounted on a rotating table. The frequency selected as suitable was 100 kilocycles per second and the two oscillators were tuned to have a frequency difference of approximately 3 cycles per second. The frequencies are compared by making an accurate measurement of their mutual beat frequency by means of a high precision chronograph. Comparisons of the two frequencies were made with six different positions of the rotating plate in steps of 60°. The length of the crystal having the above frequency is 54 mm., which leads to a complete assembly of apparatus of very reasonable dimensions.
The success of the experiment depends largely on two factors, the possibility of measuring the beat frequency with sufficient precision in a reasonably short time such as from two to five minutes, and the attainment of a sufficiently stable frequency over the duration of the experiment. The problem of measurement, with the equipment already available, has proved fairly straightforward; but various difficulties have beenencountered with frequency stability, on account of the very high degree of constancy required.
These difficulties arise to some extent from the fact that an electrically maintained oscillator of any kind does not vibrate exactly at its tree
* ‘ Proc. Nat. Acad. Sci. Wash.,’ vol. 12, p. 621 (1926); ‘ Astrophys. J.,’ vol. 68, p. 367 (1928).
t ‘ C.R. Acad. Sci., Paris,’ vol. 183, p. 420 (1926), and vol. 185, p. 1198 (1927);‘ Naturwiss.,’ vol. 14, p. 935 (1926), and vol. 16, p. 25 (1928).
t‘ Nature,’ vol. 123, p. 88 (1929).§ ‘ Ann. Physik,’ vol. 537, p. 385 (1930).
on July 12, 2018http://rspa.royalsocietypublishing.org/Downloaded from

The Fitzgerald-Lorentz Contraction 611
acoustical frequency, but at a frequency slightly modified by the associated electrical circuit. The frequency is also affected by changes in physical conditions such as temperature and pressure. Precautions were therefore taken to ensure that all the conditions that affect the frequency were maintained as constant as possible continuously day and night. These features of the experiment are described in more detail in the sections which follow.
D escriptio n of the Q u a r t z Bars and the A ssociated E lectrical
C ir c u its
For the purposes of this experiment the requirements were not quite the same as for the usual standard of frequency. The long period stability of the oscillator was not so important, since a complete set of observations occupied only two hours; but it was desired, if possible, to reduce the random fluctuations of the order of 1 part in 109 which have hitherto been found to occur in the most stable standards known. To achieve this a considerable amount of preliminary investigation was necessary. Bars of different dimensions were cut to attain a temperature coefficient of frequency of as low a value as possible at a suitable temperature of operation. They were tested as resonators to ensure that no other unwanted modes of vibration were present, and that the logarithmic decrement was low, and the position of the nodes was carefully determined by this means. Experiments were made with a number of different types of mounting and with different circuit conditions. This work was, however, pursued only so far as to give an oscillator of the desired stability, and we shall here merely give a brief description of the final form adopted. The type of frequency standard developed at the Physikalisch-Technische- Reichsanstalt appeared very suitable for the purpose in view and was accordingly used for the investigations.
The bars are 54*3 mm. long in the direction of the electric axis and of square section, the sides of the square being of length 7-5 mm. in the directions of the optic and third axes. They vibrate longitudinally in their first overtone mode at a frequency of 100 kc./sec., and are supported rigidly at the two nodes. They were cut in the optical workshop of the Laboratory and the frequency was adjusted by the authors by grinding one of the end faces with a fine abrasive.
The method adopted for supporting the quartz crystal at its nodal points is shown in fig. 1. The bar A rests on four points B with its diagonal directions horizontal and vertical, the points bearing at the centre of two adjacent faces. Each point is formed on the end of an adjustable screw
on July 12, 2018http://rspa.royalsocietypublishing.org/Downloaded from

612 G. A. Tomlinson and L. Essen
C carried by a rigid bar D which is soldered to the centre electrode E The contact point is actually in the form of a spherical cap made by polishing the apex of a conical end turned on the screw. To prevent any movement of the bar that might be caused by vibration, it is held against each point by a light pressure applied by a similar point on the opposite face, this point being attached to the end of a cantilever spring
S e c t io n XYF ig . 1.
F of phosphor bronze strip. To minimize any tangential torce at ihe point of contact, the springs are made of two parallel strips of phosphor bronze soldered to small brass separating blocks at each end. ne block is used to attach the spring by a screw to the electrode and the oner carries the contact point, a short piece of phosphor bronze wire. 1 this system of springs the contact approaches the surface of the qu bar closely in the normal direction.
The frequency is directly affected by any alteration of the an ga
on July 12, 2018http://rspa.royalsocietypublishing.org/Downloaded from

The Fitzgerald-Lorentz Contraction 613
between the b ar and the electrodes, an d it is therefore im p o rtan t to keep this d im ension constan t. T o th is end each electrode is extended in bo th directions perpendicu lar to the b a r and is clam ped, as show n in the illustration, to tw o pieces o f silica tube G w hich lie para lle l to the quartz bar. This construction has am ple rig id ity an d provides h igh insulation resistance betw een the electrodes.
The circuit used to m ain ta in the oscillations an d provide an o u tp u t a t 100 kc./sec. is show n in fig. 2. I t is sim ilar to the circuit used a t the L ab o ra to ry fo r m ain ta in ing the v ib ra tio n o f the frequency standards, previously described by one o f the au thors .* Special p recau tions have been taken , how ever, to ensure th a t there is no reaction on the frequency
100 V o—^wwvy*-“ 4 0 V
+ lOOVo—Fig. 2—ViV2, LS7 valves; LxL3, 1 mH (approx.); Q , 0 • 0023 ( F ; C2, 0
C, 2 [iF ; r,2 m egohms; R, 20,000 ohms.
•i-4 Output
V,
•0028 (iF;
by the lo ad tak en from the am plifier valve an d th a t there is no coupling w ith any outside circuits. A ll the coils used are to ro id s, and are screened by copper cases. T he p rim ary coil L x consists o f 300 tu rns, over w hich the secondary w inding L 2 consisting o f 10 tu rn s is sym m etrically disposed. This is connected to the grid o f the am plifier valve. L 3 o f 300 tu rn s and L 4 o f 100 tu rn s are the p rim ary and secondary o f a to ro id in the am plifier
valve circuit.T he low- an d h igh-tension supplies to the driv ing an d am plifier circuits
were p rovided by accum ulators w hich w ere continuously trickle-charged from the D .C . m ains. U n d er these conditions th e voltage rises to ab o u t 2*15 volts p e r cell an d then rem ains very co n stan t in spite o f small fluctuations in the voltage o f the m ains. L arge condensers w ere connected across the batteries to sm ooth o u t the m ore rap id variations.
* Essen, * Proc. Roy. Soc.,’ A, vol. 155, p. 498 (1936).
on July 12, 2018http://rspa.royalsocietypublishing.org/Downloaded from
614 G. A. Tomlinson and L. Essen
The general result of the preliminary work showed that the oscillator with the electrode system and method of mounting described above possessed satisfactory characteristics in nearly all respects. The coefficients of frequency change with changes in the various external conditions were small, having the following values:—
— 3 in 1010 for a 0T% increase in L.T. voltage.—3 in 1010 for a 0T% increase in H.T. voltage.+ 1 - 5 in 1010 for a 0*01% increase in anode (tuned circuit) capacitance.—8 in 1010 for a 0-001 g.(xF increase in grid-cathode capacitance.+ 1 in 1010 for a 0-001° C. increase in temperature (Bar 1).— 1 in 1010 for a 0-001° C. increase in temperature (Bar 2).— 1 -6 in 1010 for a 0-01 mm. increase in pressure.
On the other hand, the frequency of this type of oscillator, probably owing to some ageing effect, was invariably found to be subject to continuous drift in one direction from day to day. The rate of change steadily diminishes but the frequency was not constant after several months under very constant conditions. The rate of drift throughout any day was liable to vary slightly, probably owing to small changes of temperature. These changes, however, were quite slow, and as the oscillators had proved to be very satisfactory with regard to random fluctuations of frequency it was decided to proceed with the experiments and make a suitable correction for the drift observed in the course of each experiment.
T he M easurem ent of th e B eat F requency
The comparison of the relative frequency involves simply an accurate measurement of the frequency of the beats set up between the two oscillators. For this purpose the outputs of the two amplifiers shown in fig. 2 were connected through screened leads to the grids of two valves Vi and V2 in the circuit shown in fig. 3. The combined output was amplified in two resistance capacity coupled stages, so that in the anode circuit of the last valve the current varied sinusoidally between about 0 and 4 milliamperes at the frequency of the beat, about 3-5 cycles per second. These current pulses were recorded on a high precision chronograph* designed and made at the Laboratory.
To attain a precision in the frequency comparison of 1 part in 1010 requires a precision of about 3 parts in 106 in the actual measurement of the beat frequency, or in a period such as 5 minutes the beats require to
* Sears and Tomlinson, ‘ J. Sci. Instr.,’ vol. 8, p. 21 (1931).
on July 12, 2018http://rspa.royalsocietypublishing.org/Downloaded from

The Fitzgerald-Lorentz Contraction 615
be recorded with an error not exceeding 0*001 second. It would clearly be very difficult to do this with a direct record o f a sinusoidal current o f such a low frequency, and various m ethods were investigated for recording the beats. In one o f these m ethods an additional circuit followed the amplifier to produce an impulse in the form o f a condenser discharge, which was recorded directly on the chronograph with the precision required. In another method the beat current controlled a multivibrator at the frequency o f the beat and the impulsive current supplied by this circuit was recorded. The m ethod finally adopted, on account o f its simplicity and reliability, involves the use o f a reed armature relay* designed by one o f the authors.
Chronograph 1 Coil
4 IO O V
F ig . 3—Circuit arrangements for recording the beats. Vls V a, V8, PM2DX valves: V4, PM21A valve; R1} 60,000 ohms; Ra, 100,000 ohms; r, 2 megohms; Q 0-1 [J.F; Ca, 1 fxF.
The armature o f this relay is a stiff reed o f stalloy, clamped rigidly at one end, carrying a platinum contact point at the free end. The m ovement o f the reed follow s the changes in the current alm ost instantaneously, the lag being not m ore than 0*0001 second. There is no friction in the movement o f the reed and consequently the input current required to deflect the reed sufficiently to m ake contact is very constant. If, therefore, the relay is adjusted so that the operating value o f the current is reached during the steep portion o f the sinusoidal current supply, a very satisfactory precision in the tim ing o f the contact is obtained. The relay on making contact discharged a condenser through the coil o f one o f the two chronograph markers, as shown by the circuit diagram o f fig. 3. W hen the relay contact is broken the condenser is charged again, in readiness for the next beat signal, through a resistance o f 100,000 ohm s
* Tomlinson, ‘ J. Sci. Instr.,’ vol. 10, p. 204 (1933).
on July 12, 2018http://rspa.royalsocietypublishing.org/Downloaded from

616 G. A. Tomlinson and L. Essen
by a dry battery. In this manner the slowly varying current of the beat wave was converted into an abrupt pulse in the chronograph marker, and the uniformity of operation of the relay proved to be very satisfactory. A series of successive beat signals would be recorded uniformly on the chronograph to well within a millisecond.
Variations in the speed of the chronograph were effectively eliminated by recording accurate seconds signals from a high precision clock on the other marker. The observed duration between the first and last beats in the period measured thus consisted of an integral number of seconds obtained directly in terms of the clock, with only a fraction of a second to be measured on the chronograph and therefore dependent on the uniformity of its speed.
The calculation of the change in frequency of the rotating oscillator relative to that of the fixed oscillator is a simple one. If n and are the respective frequencies, the beat frequency is
/ n ~ m Nt
if t seconds is the measured time for N beats. If is found to vary by a small amount Bt, due to a change in the frequency of the rotating oscillator, we have
and therefore
Bt _ _ B f = , Bn t f
§n ___j_ f Btn (2)
A numerical example will show more clearly the high degree of precision attainable in the frequency measurement. In one of the actual observations the time for 880 beats was measured, the duration being almost exactly 250 seconds. If for Bt we insert the value 0-0005 sec., which represents the probable error in the measurement of t, the expression Bn/n then represents the error in the frequency measurement, and it has the value
Bn 880 „ 1 w 0-0005n ' ± 250 100,000 250
= ± 0 - 7 x 10⁻¹⁰.
T em perature C ontrol
The two oscillators were installed in a small room which was constructed for use as a cold store. This room is very effectively lagged with
on July 12, 2018http://rspa.royalsocietypublishing.org/Downloaded from
The Fitzgerald-Lorentz Contraction 617
granulated cork and is fitted with double doors and internal shutters to the windows. The lower half of the room is below the ground level. The room is thus very suitable for close temperature control. For this purpose a toluene thermostat was used to operate a relay for switching two heater lamps on or off. A fan directed a stream of air on to the wall at a point between the two lamps and so circulated two streams of warmed air in opposite directions. The fan was supported from the ceiling by rubber cords to minimize the effects of its vibration.
Each quartz oscillator was enclosed at a pressure of 20 mm. in a sealed glass vessel A about 4 inches in diameter, as seen in fig. 4 which shows the arrangement of apparatus used for the rotating oscillator. The vessel is placed on three cork supports inside a massive brass cylinder B with thick brass end covers. The air space between the glass vessel and the metal cylinder is loosely filled with cotton wool. The cylinder B is again completely surrounded by a second larger brass cylinder C covered externally with ^-inch felt D and again with cotton wool in the interspace. The circuit E for maintaining the crystal in vibration is placed alongside the outer cylinder and an earthed copper cover F lined externally with felt G is lowered over the whole.
The heavy thermal insulation is intended to prevent the residual fluctuations in the room temperature from penetrating to the quartz oscillators to any significant extent. The alternative and more usual method of temperature control by a thermostat and heating element suitably placed inside the apparatus was not adopted on account of possible electrical disturbance of the regularity of the beats by the on and off operation of the heating current. The temperature of the apparatus has been found to vary very slightly from day to day, probably due to gradients in the room. This is not of great importance, however, as we are concerned only with changes in the relative frequency of the two oscillators over the duration of any individual experiment. The arrangements in the case of the fixed oscillator were similar in all essential respects.
D escription of the R otating Table
It is necessary that the moving oscillator, its amplifier, thermal insulating vessels, and the earthed screen should all rotate together to avoid any changes of capacitance in the amplifier circuits. With this in view all the apparatus is placed on a double circular slab of gaboon board H (fig. 4) which itself rests on the face of a special type of rotating plate J that is used in the Metrology Department of the Laboratory for a variety of purposes. This consists of a fixed circular base plate K, resting on
on July 12, 2018http://rspa.royalsocietypublishing.org/Downloaded from

618 G. A. Tomlinson and L. Essen
three levelling screws, and a rotating upper plate L. The bearing surface of each plate is a highly finished horizontal plane face M in the form of an annular ring about 7 inches in diameter and f-inch in width. The bearing
F ig . 4.
was filled with a heavy grease to carry the weight of the apparatus and the table was found to turn very smoothly like a well-greased tap. h was originally intended to design a more elaborate means of rotation in which the apparatus would be floated in a bath of liquid, and the rotating
on July 12, 2018http://rspa.royalsocietypublishing.org/Downloaded from

The Fitzgerald-Lorentz Contraction 619
table was used in the first place as a temporary method only. It proved to be so satisfactory, however, that it has been retained throughout the experiments.
The driving circuit of the rotating oscillator must be provided with leads for the low- and high-tension supplies, which could not be housed conveniently in the enclosure, and for the output current. For this purpose six concentric circular mercury troughs turned in the face of a thick disk N of teak are used. The teak disk is supported by two brass columns P screwed to the base-board. Contact with the rotating mercury troughs is made by means of a comb Q of six insulated amalgamated copper wires bent to suit the curvature of the troughs, with a length of about two inches submerged in the mercury. These contact wires are carried by an arm R which is supported on a pivot S in such a way that the arm can be hauled upwards to enable the copper cover to be removed when necessary.
The proper functioning of the dipping contacts was regarded as of considerable importance since the frequency is affected by the low tension voltage to the extent of 1 part in 1010 per millivolt. An experiment was therefore made in which leads were taken from the apparatus to a potentiometer and careful observations of the voltage actually supplied to the amplifier were made while the apparatus was being rotated. The potentiometer was sensitive to within 0-1 millivolt, but no variation of voltage could be observed.
The outer screening cover of copper is cylindrical in shape and has a circular hole cut in the top face, large enough to pass over the teak disk. To complete the electrical screening the teak disk is lined beneath with a copper disk T about an inch larger than the hole in the cover which rests on and overlaps the copper disk when lowered into place. The top of the cover is not exposed to the air but is covered with a loose disk V turned from thick gaboon board, and on this is placed a graduated scale for measuring the angle of rotation.
The rotating plate rests on a built-up pedestal consisting of slabs of stone W separated by blocks of cork.
A d justm en t of th e P lane of R otation
It was observed during the preliminary experiments that the frequency was slightly affected by any change in the inclination of the oscillator. Such a change would occur in the course of a revolution if the plane of rotation was not truly horizontal. The magnitude of the effect was examined by producing known changes in the inclination of the crystal
on July 12, 2018http://rspa.royalsocietypublishing.org/Downloaded from
620 G. A. Tomlinson and L. Essen
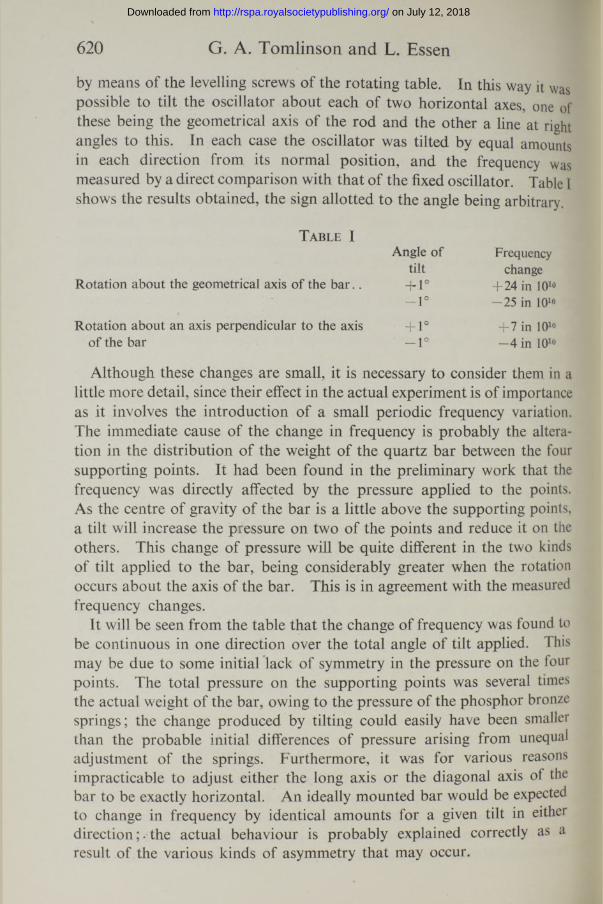
by means of the levelling screws of the rotating table. In this way it was possible to tilt the oscillator about each of two horizontal axes, one of these being the geometrical axis of the rod and the other a line at right angles to this. In each case the oscillator was tilted by equal amounts in each direction from its normal position, and the frequency was measured by a direct comparison with that of the fixed oscillator. Table I shows the results obtained, the sign allotted to the angle being arbitrary.
T able IAngle of Frequency
tilt changeRotation about the geometrical axis of the bar.. + 1° +24 in 101®
- 1 ° -2 5 in 101®
Rotation about an axis perpendicular to the axis + 1° + 7 in 101®of the bar - 1 ° - 4 in 101®
Although these changes are small, it is necessary to consider them in a little more detail, since their effect in the actual experiment is of importance as it involves the introduction of a small periodic frequency variation. The immediate cause of the change in frequency is probably the alteration in the distribution of the weight of the quartz bar between the four supporting points. It had been found in the preliminary work that the frequency was directly affected by the pressure applied to the points. As the centre of gravity of the bar is a little above the supporting points, a tilt will increase the pressure on two of the points and reduce it on the others. This change of pressure will be quite different in the two kinds of tilt applied to the bar, being considerably greater when the rotation occurs about the axis of the bar. This is in agreement with the measured frequency changes.
It will be seen from the table that the change of frequency was found to be continuous in one direction over the total angle of tilt applied. This may be due to some initial lack of symmetry in the pressure on the four points. The total pressure on the supporting points was several times the actual weight of the bar, owing to the pressure of the phosphor bronze springs; the change produced by tilting could easily have been smaller than the probable initial differences of pressure arising from unequal adjustment of the springs. Furthermore, it was for various reasons impracticable to adjust either the long axis or the diagonal axis of the bar to be exactly horizontal. An ideally mounted bar would be expected to change in frequency by identical amounts for a given tilt in either direction;. the actual behaviour is probably explained correctly as a result of the various kinds of asymmetry that may occur.
on July 12, 2018http://rspa.royalsocietypublishing.org/Downloaded from

The Fitzgerald-Lorentz Contraction 621
The rotating plate was initially adjusted by means of a sensitive level to turn in a horizontal plane, and after the apparatus had been assembled on the plate it was readjusted with the level, and observations were made of the deviations from the horizontal plane on rotating the plate. The measured variation in the inclination of the level during a revolution was found to be within ± 30". From the results of Table I the frequency change caused by this deviation does not exceed 2 parts in 1011. Furthermore, the table indicates that there should be one maximum and one minimum value of the frequency per revolution, and that these should be approximately the same amount above and below the mean frequency. The periodic effect introduced has, therefore, one complete cycle in 360° and it is nearly symmetrical.
In the ultimate experiments on the possible periodic effect caused by the Fitzgerald-Lorentz contraction, the frequency variation in two successive half-revolutions were virtually added, to derive a mean value of the effect. In this process, any periodic change having one cycle per revolution was eliminated altogether if it was symmetrical. We may thus conclude that the final results of the experiment were not affected to any significant extent by the small periodic effect of magnitude ± 2 in 1011 which was expected to occur as the result of residual errors in levelling. It may be of interest to mention here that an experiment is described later in the paper in which we rotated the oscillator in a plane deliberately set not quite horizontal, and observed the frequency variations. The result appears in fig. 12 and is a well-defined periodic having a 360° cycle, confirming the above conclusions.
It has been mentioned that the quartz rod itself was not placed with any precision in a horizontal plane. This was not considered to be of importance provided the plane of rotation was horizontal, as this ensured that the rod would rotate with an invariable inclination.
G eneral E xperim ental P rocedure
The procedure adopted in an experiment was as follows. One of us took charge of the chronograph and the other made the series of rotations of the oscillator. As these were in different buildings a timed schedule was always prepared and adhered to. In each angular position of the oscillator the total time of a number of beats, such as 880, for example, was measured, but only the beats in the initial and final ten seconds were actually recorded. This was done to economize as regards the space used on the chronograph for each observation, and enabled four successive complete rotations, with a total of 25 frequency measurements,
on July 12, 2018http://rspa.royalsocietypublishing.org/Downloaded from
622 G. A. Tomlinson and L. Essen
to be recorded easily on one plate. The time allowed for each frequency measurement was usually from 3 to 5 minutes with an interval of about a minute for the rotation to the next position. Although most of the beats were not recorded, there was no doubt about the total number between the first and last beats measured, as a preliminary fully recorded trial was always made.
Generally speaking, the precision attained in the measurement of the frequency has exceeded the residual variations in actual frequency of the oscillators, which is a desirable condition. Two beats and two seconds signals were usually measured each time and the average of these taken. This was found to give a sufficiently precise measurement, although there were about 35 beats recorded in the 10 seconds, all of which were available for measurement if it had been necessary.
Early experiments in which the oscillator made only a single rotation showed at once that there was no periodic change of frequency at all comparable in magnitude with the Fitzgerald-Lorentz contraction as usually estimated. At the same time these experiments showed that the erratic variations in frequency and those which are due to the slow drift already mentioned might easily conceal a very small periodic effect when only a single rotation is made. The erratic changes may also in one rotation lead to an incorrect estimate of the true amount of drift, for which a correction is ultimately made. It was therefore considered advisable to turn the oscillator through several complete revolutions in succession and examine the average variations in frequency. This procedure in a large measure eliminates the effects of the erratic variations and yields a more correct value of the mean frequency drift per cycle.
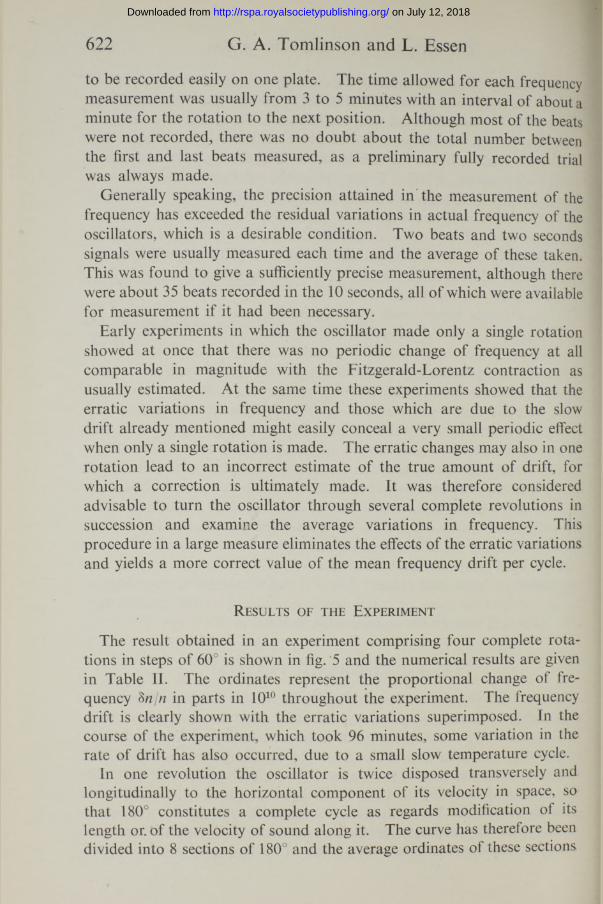
R esults of th e E x perim en t
The result obtained in an experiment comprising four complete rotations in steps of 60° is shown in fig. 5 and the numerical results are given in Table II. The ordinates represent the proportional change of frequency <$njn in parts in 1010 throughout the experiment. The frequency drift is clearly shown with the erratic variations superimposed. In the course of the experiment, which took 96 minutes, some variation in the rate of drift has also occurred, due to a small slow temperature cycle.
In one revolution the oscillator is twice disposed transversely and longitudinally to the horizontal component of its velocity in space, so that 180° constitutes a complete cycle as regards modification of its length or. of the velocity of sound along it. The curve has therefore been divided into 8 sections of 180° and the average ordinates of these sections
on July 12, 2018http://rspa.royalsocietypublishing.org/Downloaded from
The Fitzgerald-Lorentz Contraction 623
T able II— 2 Ju n e , 1936. T ime 7.18 p .m .
Measured time o f 670 beats Unit 1 sec.
Change in relative frequency Unit 1 in 1010
r x”---------0°
OOVO 120° OO o o 0° 60° 120° 180°1st cycle . . 189-9683 189-9686 189-9679 189-9674 0 + 0-5 - 0-7 - 1*72nd „ . . 189-9674 189-9646 189-9641 189-9635 - 1-7 - 6-8 - 7-8 - 8-93rd „ . . 189-9635 189-9612 189-9606 189-9609 - 8-9 - 1 3 1 -1 4 -2 - 1 3 - 74th „ . . 189-9609 189-9594 189-9596 189-9589 - 1 3 - 7 — 16*5 - 1 6 1 - 1 7 - 45th „ . . 189-9589 189-9573 189-9557 189-9543 - 1 7 - 4 - 2 0 - 4 - 2 3 - 3 - 2 5 - 96th „ . . 189-9543 189-9557 189-9510 189-9515 - 2 5 - 9 —23 * 1 - 3 2 - 0 - 3 1 - 07th „ . . 189-9515 189-9488 189-9473 189-9443 - 3 1 0 - 3 6 0 - 3 8 - 8 - 4 4 - 58th „ . . 189-9443 189-9430 189-9414 189-9405 - 4 4 - 5 - 4 6 - 8 - 5 0 0 - 5 1 - 7
Mean o f 8 cycles - 1 7 - 9 - 2 0 - 3 - 2 2 - 9 - 2 4 - 4Values relative to 0° position 0 - 2-4 - 5-0 - 6-5
0° 60 120° 180° 0° 6(f 12<f 180*0* 60* I2(f I8b°
I Revolutions
Mean variation in 8 cycles
Periodic variation ± 4 in 10
Fig. 5.
have been p lo tted to tw ice the scale o f the com plete curve, as show n by the inset graph . T he irregularities are greatly reduced by the averaging process and a reasonab le m ean stra igh t line has been d raw n th ro u g h th e po in ts, representing th e m ean progressive frequency change th ro u g h o u t the experim ent. T he deviations fro m th is line o f the actua l p o in ts represen t the m axim um am o u n t o f any period ic effect due to the ro ta tio n o f the oscillator. These deviations do n o t exceed a range o f dr 4 p a rts in 10“
on July 12, 2018http://rspa.royalsocietypublishing.org/Downloaded from

624 G. A. Tomlinson and L. Essen
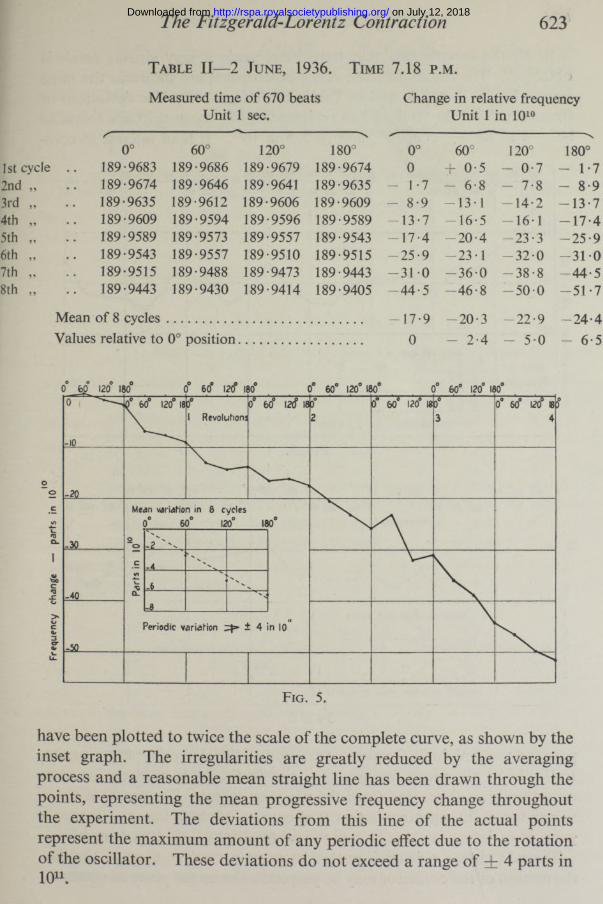
In all the experiments tha t have been m ade a very similar result is obtained. The results o f some other experiments are shown in the same way in figs. 6, 7, and 8, and in Tables III, IV, and V. The deviations of frequency from the straight line representing the m ean drift are found to be i t 4 in 1011, dz 5 in 1011, and i t 3 *5 in 1011. I t is o f interest to com-
0° 60° 120° 180°I R evolutions
Mean variation in 8 cyclesn° cn° ion0 i
Periodic variation ± 4*5 in lo"
Fig. 6.
I Revolutions.
Mean variation in 8 cycles
Periodic variation + 5 in 10
Fig. 7.
pu te the m ean periodic frequency variation o f the above four experiments.. In Table VI the m ean frequency change in the cycle is given for each experiment, as abstracted from the previous tables. The mean of these values for each angular position is shown in the fifth line and the progressive variation in these is linear to within limits ± 2 - 5 parts in 1 0 .
There *is always a possibility that a t some particular hour o f the day the m otion of the oscillator may be perpendicular to the plane of rotation,
on July 12, 2018http://rspa.royalsocietypublishing.org/Downloaded from
1st cycle 2nd „ 3rd „ 4th „ 5th „ 6th „ 7th „ 8th „
1st cycle 2nd „ 3rd „ 4th „ 5th „ 6th „ 7th „ 8th „
The Fitzgerald-Lorentz Contraction 625
0® 60® 120® BO®
0® 60® 120® BO'
Main variation in 6 cycles2o Q® 60* 120® B
Periodic variation £ 3-5 in I0n
F ig . 8.
Table III— 30 M ay , 1936. Time 5.50 a .m.
Measured time of 670 beats. Unit 1 sec.
Change in relative frequency. Unit 1 in 1010
<0° 60° 120°
(o00 0° 60° 120° 180°
189-9641 189-9666 189-9643 189-9620 0 + 4-6 + 0-4 - 3-5189-9620 189-9601 189-9603 189-9573 - 3-5 - 7-4 - 7-0 -1 2 -6
.. 189-9573 189-9597 189-9590 189-9591 -1 2 -6 - 8*1 - 9-4 - 9-2
.. 189-9591 189-9586 189-9563 189-9566 - 9-2 -1 0 -2 -1 4 -4 — 13*8189-9566 189-9582 189-9610 189-9576 — 13*8 -1 0 -9 - 5-7 - 1 2 0
.. 189-9576 189-9564 189-9592 189-9579 - 1 2 0 -1 4 -2 - 9 0 — 11-5189-9579 189-9583 189-9560 189-9572 — 11*5 -1 0 -7 - 1 5 0 -1 2 -8
.. 189-9572 189-9572 189-9595 189-9614 -1 2 -8 -1 2 -8 -1 2 -2 - 5-0
Mean of 8 cycles - 9-4 - 8-7 - 9-0 - 1 0 0Values relative to 0° position. 0 + 0-7 + 0-4 — 0-6
Table IV— 25 M ay , 1936. T ime 10.15 p .m.Measured time of 740 beats. Change in relative frequency.
Unit 1 sec. Unit 1 in 1010/
0° 60°.. 209-8583 209-8562
209-8531 209-8525209-8489 209-8497
.. 209-8496 209-8491209-8493 209-8499
.. 209-8523 209-8520
.. 209-8513 209-8534
.. 209-8493 209-8495Mean of 8 cyclesValues relative to 0° position
120° 180° 0°209-8542 209-8531 0209-8498 209-8489 - 8-7209-8481 209-8496 -1 5 -8209-8489 209-8493 -1 4 -6209-8526 209-8523 - 1 5 1209-8515 209-8513 - 1 0 1209-8515 209-8493 — 11 *7209-8483 209-8511 — 15-1
—11*40
60° 120° 180°- 3-5 - 6-9 - 8-7- 9-7 -1 4 -7 — 15*8
-1 4 -5 - 1 7 1 -1 4 -6-1 5 -4 — 15*8 — 15-1— 14* 1 - 9-6 —10*1-1 0 -6 — 11-5 — 11-7- 8-2 — 11-5 - 1 5 1-1 4 -6 — 16*8 - 1 2 1
— 11-3 - 1 3 0 -12 -9+ 0-1 - 1-6 - 1-5
2 U 2
on July 12, 2018http://rspa.royalsocietypublishing.org/Downloaded from

626 G. A. Tomlinson and L. Essen
T able V— 20 M ay , 1936. T ime 9.50 p .m .
Measured time of 880 beats. Unit 1 sec.
Change in relative frequency. Unit 1 in 1010
0° 60° 120° 180°1st cycle .. 249-9800 249-9807 249-9808 249-97792nd „ 249-9779 249-9768 249-9768 249-97533rd „ 249-9753 249-9735 249-9722 249-97054th „ .. 249-9705 249-9718 249-9714 249-97265th „ 249-9726 249-9712 249-9671 249-96586th „ 249-9658 249-9650 249-9676 249-9663
Mean of 6 cycles..................Values relative to 0° position
/---------0° 60° 120° 180°0 + 1-0 ~f~ 1*0 - 2-9
- 2-9 - 4-5 - 4-5 - 6-6- 6-6 - 9-1 -1 0 -9 -13-3-1 3 -3 -1 1 -5 - 1 2 0 -10-4-1 0 -4 -1 2 -3 —18 0 -19-9—19-9 -2 1 -0 -1 7 -4 -19-2
- 8-8 - 9-6 -1 0 -3 —12-00 - 0-8 - 1-5 - 3-2
T able V I
Mean frequency change in one cycle. Unit 1 in 1010N
Experiment 1 ....................0°
— 17 960°
-2 0 -3120°
-2 2 -9180°
-2 4 -42 .................... . . . . - 9-4 - 8-7 - 9-0 -1 0 -03 .................... — 11-4 — 11-3 —13 0 —12-94 .................... . . . . - 8-8 - 9-6 -1 0 -3 —12 0
Mean of 4 values ............ -1 1 -8 7 -12-48 -1 3 -8 0 -14-82Relative to 0° position . .. 0 - 0-61 - 1 -93 - 2-95
and in this event no modification of any of its properties would beexpected. The experiments have therefore been made at various times to investigate any difference of effect that might be due to this cause. As the results show, there is no difference in this respect within the limits of accuracy attained. This is confirmed by other experiments in which several shorter trials were made at intervals on the same day. These also yielded a null result in all cases, though with a slightly less precision than the longer experiments already described.
We have also considered the further possibility that the cosmical and orbital velocities of the earth were equal and opposite at the time the experiments were made. The probability of such an occurrence seems very small, as astronomical observations lead to an estimate of the cosmical velocity which is considerably greater than the orbital velocity. The question of the cosmical velocity, however, is inevitably so uncertain, both as to its estimated magnitude and as regards the system of reference, that we have repeated the experiments after an interval of four months. In this time the change in direction of the orbital velocity will have caused a material change in the resultant velocity of the oscillator irrespective
on July 12, 2018http://rspa.royalsocietypublishing.org/Downloaded from

The Fitzgerald-Lorentz Contraction 627
of any consideration of the magnitude of the cosmical velocity. Simple reasoning shows that, whatever the magnitude and direction of the cosmical velocity, the oscillator cannot have no velocity at both the periods when the experiments were made, and must, in fact, have a velocity of at least the same order as the orbital velocity on at least one of the occasions.
The later experiments were again carried out at different hours of the day and the results are shown in Tables VII, VIII, and IX and figs. 9, 10, and 11. The maximum periodic effect of rotation on the frequency in these experiments is found to be ± 4 in 1011, ± 3 in 10u , and ± 3 in 1011 and the mean variation of the three experiments amounts to not more than ± 1 in 1011. The results thus show that the prediction of the theory of relativity, that the frequency should be unaffected by motion relative to the ether, is proved experimentally to be correct within very narrow limits.
In an experiment of this kind, in which at most only a small effect of the order 1 in 108 could be expected, and which actually yields a null result, it is natural to wonder whether the methods employed would have accurately picked out ka small periodic variation in frequency if this had occurred. It has been possible to test this by artificially introducing a small periodic change by tilting the plane of rotation of the oscillator slightly out of the horizontal plane. One of the levelling screws supporting the rotating plate was turned round once, making the plane of rotation inclined to the horizontal by about 0-5°. The effect of a small alteration in the inclination of the oscillator has already been discussed.
An experiment was carried out similar in all respects to those previously described, and in this case a pronounced periodic variation of frequency was found, having an amplitude of about ± 9 parts in 1010 and giving a complete cycle in 360° of rotation. The result of this experiment is given in fig. 12 which demonstrates in a satisfying way that the methods and apparatus were quite capable of measuring a very minute periodic effect had such an effect existed.
Some further experiments were made to prove that a real periodic variation of frequency was not all the time being cancelled out by an equal and opposite effect introduced without our knowledge by other causes inherent in the apparatus. The probability of this happening is not large and, moreover, such a periodic error arising from any of the causes mentioned below would be expected to have a full cycle in every 360° of rotation, and would therefore disappear, if symmetrical, in the subdivision of the rotation into sections of 180°.
The only further possible causes of a periodic effect that we can imagine are (1) the rotation of the apparatus in the earth’s magnetic field, (2)
on July 12, 2018http://rspa.royalsocietypublishing.org/Downloaded from

628 G. A. Tomlinson and L. Essen
T able VII— 15 September, 1936. T ime 11 a .m .
Measured time of 1020 beats. Unit 1 sec.
Change in relative frequency. Unit 1 in 1010
A V N0° 60° 120° 180° 0° 60° 120° 180°
1st cycle .. 2601665 260-1692 260-1702 260-1662 0 + 4-1 + 5-6 - 0-42nd „ .. 2601662 260-1675 260-1711 260-1738 - 0-4 + 1-5 + 6-9 +11 "03rd „ .. 260-1738 260-1755 260-1767 260-1774 + 11-0 + 13-6 + 15-4 + 16-54th „ .. 260-1774 260-1738 260-1716 260-1721 + 16-5 + 11-0 + 7-7 + 8-55th „ .. 260-1721 260-1736 260-1754 260-1766 + 8-5 + 10-7 + 13-4 + 15-26th „ . . 260-1766 260-1766 260-1756 260-1743 + 15-2 + 15-2 + 13-7 + 11-8
Mean of 6 cycles + 8-47 + 9-35 + 10-45 + 10-43Values relative to 0° position 0 + 0-88 + 1-98 + 1-96
T able VIII—21 Septem ber , 1936. T ime 6 a .m .
Measured time of 934 beats. Unit 1 sec.
Change in relative frequency. Unit 1 in 1010
0° 60° 120° 180° 0° 60° 120° 180°1st cycle .. 239-9833 239-9841 239-9867 239-9855 0 + 1*3 + 5*5 + 3-52nd 99 . . 239-9855 239-9850 239-9846 239-9850 + 3-5 + 2-7 + 2-1 + 2-73rd 99 . . 239-9850 239-9856 239-9882 239-9884 + 2-7 + 3-7 + 7-9 + 8-24th 99 .. 239-9884 239-9868 239-9878 239-9894 + 8-2 + 5-7 + 7-3 + 9-95th 99 . . 239-9894 239-9909 239-9907 239-9903 + 9-9 + 12-3 + 12-0 + 11-36th 99 . . 239-9903 239-9906 239-9896 239-9904 + 11 -3 + 11-8 + 10-2 + 11-5
Mean of 6 cycles + 5-93 + 6-25 + 7-5 + 7-85
Values relative to 0° position 0 + 0-32 + 1-57 + 192
T able IX—24 Septem ber , 1936. T ime 8.35 p .m .
Measured time of 934 beats. Unit 1 sec.
Change in relative frequency. Unit 1 in 1010
^--- ------------- . \0° 60° 120° 180° 0° 60° 120°
1st cycle .. 239-8840 239-8839 239-8823 239-8837 0 - 0 - 2 - 2 - 72nd „ .. 239-8837 239-8818 239-8808 239-8799 - 0 - 5 - 3 - 6 - 5 - 23rd „ .. 239-8799 239-8799 239-8800 239-8816 - 6 - 6 - 6 - 6 - 6 -54th „ .. 239-8816 239-8828 239-8833 239-8848 - 3 - 9 - 1 -9 -1 -15th „ .. 239-8848 239-8857 239-8876 239-8873 + U3 + 2-7 + 5-86th „ .. 239-8873 239-8888 239-8873 239-8867 + 5-3 + 7-8 + 5-4
Mean of-6 cycles -0 -7 3 -0 -3 0 -0 -7 2
Values relative to 0° position 0 +0-43 + 001
180° -0 1 — 6-6 -3 -9 + 1-3 + 5-3 +4-4
on July 12, 2018http://rspa.royalsocietypublishing.org/Downloaded from

requ
ency
ch
an
The Fitzgerald-Lorentz Contraction 629
Mean variation in 6 cycles
Periodic variation — 4 in 10
I Revolutions 2 2
F ig . 9.
Mean variation in 6 cycles
Periodic variation — 3 in 10o
0° ~ 60°
0° 60° (20° 180° I Revolutions
F ig . 10.
Mean variation in 6 cycles Periodic vnnahon + 3 in 10
0° 60° i20° tao*
0° 60° I20°I80° fi Revoluhons
F i g . 1 1 .
0° 60° 120° !8Cf
on July 12, 2018http://rspa.royalsocietypublishing.org/Downloaded from

630 G. A. Tomlinson and L. Essen
electrical coupling between the two oscillators, and (3) capacitance changes between the rotating mercury troughs and the fixed comb of contact wires.
To examine the possible effect of a magnetic field, two large Helmholtz coils were set up one on each side of the rotating apparatus to produce a magnetic field half-way between the coils in the North and South direction of about 10 times the magnitude of the earth’s horizontal field. The frequency of the oscillator was measured in different angular positions, and no alteration at all could be detected due to the magnetic field. It was not possible to place the coils at the standard Helmholtz
120° 180° 240° 300c 360°
6 0
F ig . 12.
distance and the field was therefore not uniform. As a completely null result was obtained, this was not considered to be essential.
To test the second possibility, a large sheet of stalloy was placed between the two oscillators, firstly in a vertical position and insulated, and secondly in a horizontal position and connected to earth. These two arrangements would introduce considerable disturbances in the amount of coupling, if any, due to magnetic and electric fields respectively. Consecutive frequency measurements were made with the normal arrangement of apparatus, then with the sheet of stalloy in place, and again with the sheet removed. The results showed nothing more than the usual random changes of 1 to 2 parts in 1010, proving that the screening of the oscillators is effective in preventing any significant amount of coupling. There is good independent evidence that the coupling between the fixed and moving oscillators * is negligible, although the two are comparatively near. In
on July 12, 2018http://rspa.royalsocietypublishing.org/Downloaded from

The Fitzgerald-LorentzContraction 631
the course of the preliminary work, the fifth harmonic of the Laboratory standard crystal oscillator, of frequency 20 kilocycles per second, was used for comparison purposes. This crystal is situated at a distant part of the building and could have no coupling influence on the two 100 kilocycle oscillators. It was found that when one of these was completely switched out of action there was no measurable change in the frequency of the other relative to that of the standard.
The effect of capacitance changes due to the rotation of the mercury troughs was examined in a direct manner by comparing the frequency with and without a 50 condenser connected in turn across the low tension and output, the low tension and high tension, and the high tension and output. Although this added capacitance is many times greater than any periodic change that can be caused by any relative movement of the leads during the rotation, its effect on the frequency was less than 4 parts in 1010.
The rotation of the oscillator will give rise to a periodic contraction in the width of the crystal differing in phase by 180° from the contraction in length. It was anticipated that such a change in one of the cross-sectional dimensions might produce a secondary change in the frequency of longitudinal vibration. This was investigated during the course of grinding the quartz, when there was an opportunity of measuring the frequency with a progressively diminishing width of rod. It was found that a proportional change in the width produced an effect on the frequency of about 1% of the effect produced by the same proportional change in the length of the bar. The effect of a periodic lateral contraction is therefore negligible, in view of the general magnitude of the observed effects.
D iscussion of the R esult of the Experiment
The experiment, on every occasion it has been made, has yielded a null result, showing that the frequency of the oscillator is unaffected by its orientation with respect to the direction of its motion. The possibility of encountering a condition in which the velocity of the oscillator has a zero component in the plane of rotation has been eliminated by making the experiment at different times of the day. Such a condition is unique and can only occur once in the day. The variation in the inclination of the horizontal plane is a large angle equal to twice the latitude of London, so that in at least some of the experiments it is certain that there is a large component of the velocity in the plane of rotation. The more unlikely possibility of the oscillator having zero or a very small resultant velocity has been met by making the experiment at two different
on July 12, 2018http://rspa.royalsocietypublishing.org/Downloaded from

632 G. A. Tomlinson and L. Essen
points in the earth’s orbit. Again there can be only one place in the orbit where this condition could occur, and if this were in May, for example, the velocity in September would be approximately \/3 times the earth’s orbital velocity.
It is of some practical interest that the experiments demonstrate that any form of longitudinal oscillator or tuning fork used as a frequency standard is not subject to a diurnal periodic effect on account of the rotation of the earth, or to any annual effect due to the change in direction of the orbital velocity of the earth.
The result of the experiment is a decisive verification of the prediction of the theory of relativity, which affirms that the experiment must of necessity fail to show by a change of frequency whether the bar is moving relatively to the ether. Mathematicians might be prepared to accept this prediction as a result of abstract reasoning, and the chief interest of the result lies, perhaps, in its physical implications. From the point of view of physics, the complete compensation of the Fitzgerald-Lorentz contraction by a modification of the elasticity is so remarkable that the experimental proof of this should be welcome to the physicist who is convinced by the Michelson-Morley experiment that the oscillator alters in length.
The deduction that the elasticity of matter is modified by motion relative to the ether invites interesting speculation in itself, and the further deduction that this modification exactly compensates the modification in another physical property greatly enhances the interest in the physical phenomena involved. That both the length and elasticity of a body are affected by the ether stream is quite intelligible, as both these perceptible physical properties must be reducible ultimately to the operation of atomic forces, which implies electric or magnetic forces. The compensating property of the two modifications appears to suggest that there may be some close connexion between the physical causes which determine the length and the elasticity respectively. The possibility of such a connexion is evident, without any reference to the present experiment, if we regard the dimensions of a body as being determined by the atomic distance, when the atomic forces are in equilibrium, and the elasticity as a direct result of the operation of the same atomic forces under conditions of disturbed equilibrium.
Further than these simple considerations, which suggest that there may be a physical interpretation of the deduction from the theory of relativity, we do not propose to digress into the region of speculation, but prefer to leave this paper as a record of experimental work.
on July 12, 2018http://rspa.royalsocietypublishing.org/Downloaded from

The Fitzgerald-Lorentz Contraction 633
We have pleasure in acknowledging our indebtedness to Mr. J. E. Sears and Dr. E. H. Rayner who have encouraged us very materially with their support and interest. We have to thank the Research Committee of the Laboratory for the opportunity to carry out the experiment. We should also like to record our appreciation of the great interest taken in the experiment by the late Sir Joseph Petavel, which was maintained throughout his fatal illness.
Sum m ary
An experiment somewhat analogous to the Michelson-Morley experiment is suggested. In this experiment a rod in longitudinal vibration is rotated in a horizontal plane so that its length varies periodically by reason of the Fitzgerald-Lorentz contraction. Accurate measurements are made of the vibration frequency, which should vary with the length, if the length only is affected. Relativity theory, however, predicts that no change of frequency should be observed and that there should be a complete compensation of the contraction in length by a modification of the velocity of sound according to the orientation of the bar with respect to the direction of its motion.
The experiment has been carried out with two similar longitudinal piezo-electric quartz oscillators, one rotating and one stationary, the relative frequency being measured. The methods adopted to attain the necessary degree of precision are described.
The results fully confirm the prediction of the theory of relativity. The experiment yielded a null result within narrow limits of uncertainty of about -t 4 parts in 10u , or less than 1% of the estimated contraction due to the earth’s orbital motion.
on July 12, 2018http://rspa.royalsocietypublishing.org/Downloaded from