The effect of changes in sodium chloride concentration on the ...
16
569 J. Physiol. (I957) I36, 569-584 THE EFFECT OF CHANGES IN SODIUM CHLORIDE CONCENTRATION ON THE SMOOTH MUSCLE OF THE GUINEA-PIG'S TAENIA COLI By MOLLIE E. HOLMAN* From the Department of Pharmacology, University of Oxford (Received 17 January 1957) Studies of variation in the ionic environment of nerve and skeletal muscle have contributed much to our knowledge of the ionic basis of their activity (Hodgkin, 1951). Few such studies have been made on smooth muscle and, in particular, there is little information regarding changes in NaCl concentra- tion. Vogt (1943) found that hypertonic NaCl solution caused a tonic contrac- tion in the circular muscle of the rabbit jejunum, but concluded that this was mainly of nervous origin. Prosser, Smith & Melton (1955) found that replace- ment of half the NaCl in normal solution with choline chloride prolonged the negative phase of the complex action potential recorded in the rat ureter. This paper discusses the effects of changes in NaCl concentration on the guinea-pig taenia coli, which was found to be able to maintain its spontaneous activity when the Na ion concentration was reduced to 1/9 of normal. Unlike nerve or skeletal muscle the spike potentials were unaffected by the Na ion concentration over a wide range, though they were not maintained if all the Na ions were removed. METHODS The smooth muscle used for all experiments was the longitudinal intestinal muscle of the guinea- pig's caecum, the taenia coli. Lengths from 4 to 6 mm were mounted isometrically in an organ bath of 2 ml. capacity through which solution flowed continuously at the rate of 2 ml./min and at a constant temperature of 370 C. The normal solution contained (mM): NaCl 134, KCI 4 7, MgC12 0 1, NaHCO3 16*3, NaH2PO4 1. 1, CaCl, 2-5, glucose 7-8; and was aerated with CO2 5 02 95 %. Throughout the paper changes in NaCl concentration are referred to as, for example, 3 x NaCl which means 402 mm, etc. When the NaCl was reduced, either sucrose or choline chloride was used to adjust tonicity. Unless otherwise stated, the remaining components of the solution were unchanged. Membrane potential was measured with intracellular electrodes whose resistance ranged from 10 to 50 MQ. Tension was measured with a mechano-electronic transducer valve (RCA 5734) mounted in the manner described by Bulbring (1955). * Melbourne University Travelling Scholar
Transcript of The effect of changes in sodium chloride concentration on the ...
569
J. Physiol. (I957) I36, 569-584
THE EFFECT OF CHANGES IN SODIUM CHLORIDECONCENTRATION ON THE SMOOTH MUSCLE OF
THE GUINEA-PIG'S TAENIA COLI
By MOLLIE E. HOLMAN*From the Department of Pharmacology, University of Oxford
(Received 17 January 1957)
Studies of variation in the ionic environment of nerve and skeletal musclehave contributed much to our knowledge of the ionic basis of their activity(Hodgkin, 1951). Few such studies have been made on smooth muscle and,in particular, there is little information regarding changes in NaCl concentra-tion. Vogt (1943) found that hypertonic NaCl solution caused a tonic contrac-tion in the circular muscle of the rabbit jejunum, but concluded that this wasmainly of nervous origin. Prosser, Smith & Melton (1955) found that replace-ment of half the NaCl in normal solution with choline chloride prolonged thenegative phase of the complex action potential recorded in the rat ureter.
This paper discusses the effects of changes in NaCl concentration on theguinea-pig taenia coli, which was found to be able to maintain its spontaneousactivity when the Na ion concentration was reduced to 1/9 of normal. Unlikenerve or skeletal muscle the spike potentials were unaffected by the Na ionconcentration over a wide range, though they were not maintained if all theNa ions were removed.
METHODS
The smooth muscle used for all experiments was the longitudinal intestinal muscle of the guinea-pig's caecum, the taenia coli. Lengths from 4 to 6 mm were mounted isometrically in an organbath of 2 ml. capacity through which solution flowed continuously at the rate of 2 ml./min and ata constant temperature of 370 C.The normal solution contained (mM): NaCl 134, KCI 4 7, MgC12 0 1, NaHCO3 16*3, NaH2PO4 1. 1,
CaCl, 2-5, glucose 7-8; and was aerated with CO2 5 02 95%. Throughout the paper changes in NaClconcentration are referred to as, for example, 3 x NaCl which means 402 mm, etc. When the NaClwas reduced, either sucrose or choline chloride was used to adjust tonicity. Unless otherwisestated, the remaining components of the solution were unchanged.Membrane potential was measured with intracellular electrodes whose resistance ranged from
10 to 50 MQ. Tension was measured with a mechano-electronic transducer valve (RCA 5734)mounted in the manner described by Bulbring (1955).
* Melbourne University Travelling Scholar

MOLLIE E. HOLMAN
RESULTS
Excess sodium chlorideThe immediate effect of increasing the NaCl concentration of the bathingsolution was excitation, that is, the spike frequency and tension were increased.The large tonic contraction so produced was similar to that described by Vogt(1943). The effect was not influenced by atropine (5 x 10⁻⁵). The contractionreached a maximum after 7-12 min and then spike frequency and tensiongradually fell. If high concentrations of NaCl were used (2 or 3 x NaCl) allspikes ceased after 20-30 min exposure. If the exposure was continued forlonger periods, after the spikes had ceased, the tension did not continue tofall but remained at a fairly high level. On washing out with normal solutionrecovery was slow. At first there was no change but after 10-15 min thetension fell abruptly to a much lower level where it remained until spikesappeared again. The effects of excess NaCl were completely reversible.
(a) 6g (b) 7-5g (c) 8g (d) lOg
(e) 9-5 g (f) 7g (g) 4*5g (h) 3 g (i) 7 g10sec
Fig. 1. Electrical activity of taenia coli (a) and (b) in normal solution; (c) to (g) during exposureto 2 x NaCl, at 5, 6, 10, 23 and 40 min from start (first arrow); (h) 25 min, (i) 40 min afterreadmission of normal solution (second arrow).
Changes in electrical activity produced by doubling the NaCl concentrationare illustrated in Fig. 1. The response to excess NaCl was an initial increase inspike frequency, a subsequent slowing and a final cessation of spikes. Thetension, which in the normal solution fluctuated between 6 and 8 g, roseto a maximum of 10 g and then fell to 4-5 g. About 10 min after washing out,when there was still no spike discharge, the tension fell to 3 g. The last recordin Fig. 1 was taken 40 min later, when spikes had reappeared and the tensionhad returned to normal (7 g).
These three phases: (1) increased spike frequency and tension, (2) main-tenance of tension without spikes, and (3) relaxation after a latent periodfollowing washing out, were seen very distinctly in 2 or 3 x NaCl. This is shownin Fig. 2, in which the spike frequency and tension are plotted against timefor three sections of an experiment with 3 x NaCl. The tension remained at
570

SODIUM CHLORIDE AND SMOOTH MUSCLE
7
6
5
'-14
<,, 3
2
0
A
o0 0
- '0--O--0 0
0
Spike \ 3xN\Clfrequency3
'0
0.~0Tnsion
00
0 8-0-0-0
4 8 12 16 20 80 84Minutes
C
0--0 -
110 114
571
14
12
10 @0
8 L
0.
0LI,
4
2
0
Fig. 2. Changes in spike frequency (0--O) and tension (0-0) during an experiment in which theNaCl concentration was increased to 3 x NaCl. (A) illustrates variation during the controlperiod; (B) during exposure to excess NaCl; (C) the level to which the tension fell after washingout with normal solution. Excess NaCl was introduced at zero min and normal solution wasreadmitted at 85 min.
8 12x NaCI
7 15/ oTnsion
6C! ''a " l
0 10 0 C
44 _ frequencyj0
3 5~
Fig. 3. Changes in spike frequency and tension during an experiment in which theNaCl was increased to Ij x NaCl at 0 min. (Symbols as in Fig. 2.)
I I

572 MOLLIE E. HOLMAN3 g for 10 min after changing back to normal solution and then fell during thenext 10 min to reach the steady level shown in section C of the graph. Pro-longed exposure to 14 x NaCl (see Fig. 3) did not abolish the spike dischargecompletely, through the frequency became very low and irregular. Every burstof spikes was accompanied by a small increase in tension. Some fall in tensionon washing out was noted in several experiments after exposure to 14 x NaCl.
In Table 1 changes in spike frequency and tension during excitation aresummarized from the results of sixteen experiments. A similar increase inspike frequency was produced by all three concentrations, but the initialincrease in tension was greatest in 4 x NaCl, i.e. a mean increase of 57%compared with 26% in 3 x NaCl. In general the time during which frequencyand tension were greater than normal was shortest in 3 x NaCl.
Control. Mean val
Spikefrequency Tensi((per 10 sec) (g)
9 2-810 5-6
9 5-59 2.9,
1211910109
10121289
11
4-68.07-54-85-26-0
3-59*53-55.34*09.0
TABLE 1. Excitation produced by excess NaClExcess NaCl
ues Maximum value Percentage increase
Spike)n Concentration frequency Tension Spike
of NaCl (per 10 sec) (g) frequency Tensionne17 4-5 90 61Increase Increase
1-5 x NaCl - observed observed15 8-0 66 4614 4-8 55 65
2 x NaCl {
3 x NaCl
301715152017
182416141517
6-211105-9
7-2
4.910-14-46-76-39.4
Mean 7015055665010090
Mean 858010033756655
Mean 68
5735383323
2030406
2626574
26
Fig. 4 shows changes in spike configuration which occurred during excitation.The normal records show the range through which frequency and tensionfluctuated spontaneously. The next record was taken during exposure to12xNaCl at maximum tension (8 g, off the record). The spikes were longer induration than normal and the frequency greatly increased. The next recordwas taken a few minutes later. The spikes were much smaller and of still longerduration. The last record in Fig. 4 was taken after 23 min exposure to thehigh NaCl solution. Spikes of this type continued in irregular bursts through-out the period of exposure and were not dissimilar to those recorded in a
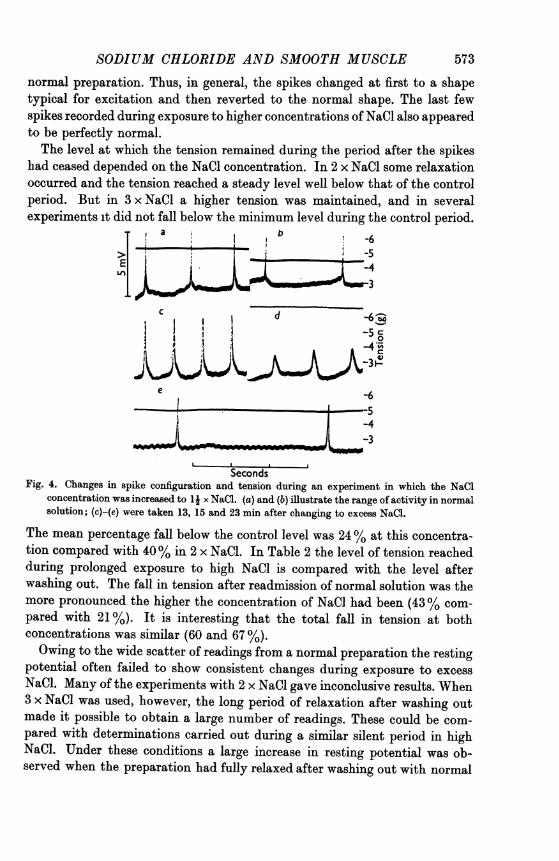
SODIUM CHLORIDE AND SMOOTH MUSCLEnormal preparation. Thus, in general, the spikes changed at first to a shapetypical for excitation and then reverted to the normal shape. The last fewspikes recorded during exposure to higher concentrations of NaCl also appearedto be perfectly normal.The level at which the tension remained during the period after the spikes
had ceased depended on the NaCl concentration. In 2 x NaCl some relaxationoccurred and the tension reached a steady level well below that of the controlperiod. But in 3 x NaCl a higher tension was maintained, and in severalexperiments it did not fall below the minimum level during the control period.
. a bt-b ~~~~-6
> -6
E -4
-35~~~~~~~~~~~-
SecondsFig. 4. Changes in spike configuration and tension during an experiment in which the NaCl
concentration was increased to lj x NaCi. (a) and (b) illustrate the range of activity in normalsolution; (c)-(e) were taken 13, 15 and 23 min after changing to excess NaCl.
The mean percentage fall below the control level was 24 %/ at this concentra-tion compared with 40%°/ in 2 x NaCl. In Table 2 the level of tension reachedduring prolonged exposure to high NaCl is compared with the level afterwashing out. The fall in tension after readmission of normal solution was themore pronounced the higher the concentration of NaCi had been (43 %/ com-pared with 21%). It is interesting that the total fall in tension at bothconcentrations was similar (60 and 67 %/).Owing to the wide scatter of readings from a normal preparation the resting
potential often failed to show consistent changes during exrposure to excessNaCl. Many of the experiments with 2 x NaCl gave inconclusive results. When3 x NaCl was used, however, the long period of relaxration after washing outmade it possible to obtain a large number of readings. These could be com-pared with determinations carried out during a similar silent period in highNaCl. Under these conditions a large increase in resting potential was ob-served when the preparation had fully relaxed after washing out with normal
573

MOLLIE E. HOLMAN
TABLE 2. Comparison of tension maintained after cessation of spikes in excess NaClwith tension reached after further relaxation on washing out with normal solution
Conen.of
NaCl2 x NaCl
Controlperiod.Meantension
(g)4-68-07-54-85*26-0
Period after cessationof spikes
(excess NaCl solution){-\
Meaitensic
(g)3X15-44-53-22-92-7
3 x NaCl 3-59.53.55.34090
2-27-82X94-03-06-8
)n Fall*(%)333340334455
Mean 40371817252524
Mean 24
Period after furtherrelaxation
(normal solution)
Mean Furthertension fall*
(g) (%)2-0 244-2 153*0 202-6 131-4 291-3 23
1-26-01-11-20-82-8
Mean 21291951585545
Mean 43* Fall calculated as percentage of mean control tension.
.---3x NaCI-*
Tension
/ ',x'
10
x
x,\0-0
Ix' / \Spike \I
frequency' x
0o----o --0-0-0
Restingpotential
x / K'
KI K ~~~~0x \;
I XIO
i I~'I"1\
-0-0-0-0-0-0- - -0- ---
0 20 40 60 80 100 120 140 160Minutes
180
15
10 Q00n
Q
0)-!
5Q
O V
Fig. 5. Changes in resting potential, spike frequency and tension during an experiment where the
NaCl concentration was increased to 3 x NaCl. The excess NaCl solution was introduced at
20 min and washed out 70 min later. Each point represents the mean of all readings taken
during a period of 5 min. (Symbols as in Fig. 2 and x -.- x, resting potential).
574
50-
40-mV
30-
20
7 '_
I)
/ I6O IO.2
vlc
5 X
X/ J
3

SODIUM CHLORIDE AND SMOOTH MUSCLE
solution. This isshown inFig. 5. The period of excitation on exposure to 3 x NaClwas not marked in this preparation since the spontaneous activity and tensionwere already high in normal solution. When the spike frequency and tensiondeclined, the resting potential rose at first but then it also declined and con-tinued to fall after spikes had ceased. For 10 min after washing out, tensionand resting potential were little changed. After about 12 min the restingpotential began to increase and at this time the muscle relaxed. During thenext hour the resting potential rose steadily and was then maintained at a levelwell above normal. When spikes appeared again and the tension rose, theresting potential began to fall.The results of four such experiments with 3 x NaCl are set out in Table 3.
The largest increase in resting potential was seen in Expt. 18 where the meanpotential rose from 26 to 43 mV. This table also shows a small decrease inresting potential during the period of excitation when spike frequency andtension were greater than normal.
TABLE 3. Changes in resting potential during experiments in 3 x NaCl. Values (mV)are means for each period
3 x NaCl
Spike Normal Greater Zero Zero Less Normalfrequency than than
normal normalTension Normal Greater Less Fully Less Normal
than than relaxed thannormal normal normal
(steady)Expt. 18 37 29 26 43 32 29
19 59 41 53 41 5020 52 50 3021 41 39 31 44 39 36
Addition of sucrose to normal solutionIn order to determine whether the effects described above were due to
hypertonicity alone, the addition of sucrose to normal solution was tested.The immediate effect of the sucrose was a brief relaxation due to an inhibitionof spike frequency. The muscle recovered again, but throughout the next30-60 min spike frequency and tension gradually fell. There was no indicationof any excitation. The time which elapsed before all the spikes ceased wasvariable. In the experiment illustrated in Fig. 6 spikes occurred in irregularbursts up to 60 min. In another experiment all spikes had ceased after 15 min.No differences were noticed between the two concentrations studied whichwere equivalent to 2 and 3 x NaCl. After washing out, spikes reappearedwithin 10 min and frequency and tension returned to normal during the next40 min. There was no further fall in tension. The resting potential showed theusual scatter throughout these experiments but there were no obvious changesduring or after exposure to the sucrose solutions.
575

MOLLIE E. HOLMAN
Low sodium chloride: replacement with sucroseThe effect of sucrose in a low NaCl solution was very similar to that which it
produced when added to normal solution. In Fig. 7 spike frequency andtension are plotted from an experiment in which the NaCl was reduced to1/3 and tonicity was restored with sucrose. Spike frequency and tension fell
10~~~~~~~~~~~~~~1i, s 1 1' rdySucrose 19 , . Spike ,Fig. 6 frequency a0-0-0- 8
0
8 - 0-0'
7 -)
S-7 0NaC sursep
k ension
6 0~~~~~~%>I' C
I U..5 0-0-0 0 0
0-0- 0 0
0 20 40 60 80 100 120 140Minutes
Fig. 6. Changes in spike frequency and tension produced by sucrose which was added to makea solution of the same tonicity as 2 x NaCi. The sucrose solution was introduced at 37 mNand washed out 70 min later. Each point represents the mean of all readings taken duringa period of 5 min. (Symbols as in Fig. 2.)
53~ NaCI sucrose
Tension4 0 -10
a)\ A,
C I 0.0 6 o--oC "o--o
to\ %O~~,/\ -bSpike
4
frequency
2 2
0 10 20 30 40 50 60Minutes
Fig. 7. Changes in spike frequency and tension during an experiment where the NaCl concentra-tion was reduced to 1/3 of normal and sucrose used to maintain tonicity. The low NaCIsolution was introduced at 0 min and washed out 45 min later. Each ~point represents themean of all readings taken during a period of 5 mmn. (Symbols as in Fig. 2.)
576

577SODIUM CHLORIDE AND SMOOTH MUSCLE
throughout the period of exposure. In this experiment all spikes ceased after40 min.The effect of replacing 1/3, 2/3 and 9/10 of the NaCl was determined. In the
experiment where 9/10 of the NaCl had been replaced by sucrose all regularactivity ceased after 10 min; a few spikes were detected during the next20 min. In this experiment recovery was very slow. After 2 hr spike frequencyand tension were still well below normal.
Fig. 8 shows some typical spikes from an experiment where 1/3 of the NaClwas replaced by sucrose. Spikes occurring during the test period were in-distinguishable from normal-there was no change in spike height orconfiguration.
un1_
44-2
-4.2-2
-6.4,
-2
1 secFig. 8. Records of spikes and tension from an experiment in which the NaCl was reduced to
1/3 of normal and sucrose used to maintain tonicity. The first two records were taken innormal solution. The low Na solution was introduced at the upper arrow and the next recordswere taken 4, 5, 8, 9, 18, 22, 33 and 38 min later. At the lower arrow normal solution wasreintroduced and the last records were taken 7, 8, 13, 18 and 20 min later.
Low sodium chloride: replacement with choline chlorideWhen choline chloride was used to replace the NaCl a very different result
was obtained: there was no cessation of spikes during exposures up to 150 min.The immediate effect of the choline chloride solution was one of excitation inspite of the presence of atropine (104). During this period the spike durationwas increased. This is shown in the second record of Fig. 9, which was taken5 min after exposure to a choline chloride solution containing 1/3 NaCl. Thelast record in Fig. 9 was taken about 30 min later. About this time some declinein spike frequency and tension was noted. This soon passed off and throughoutthe remaining exposure spike frequency and tension were greater than normal.
37 PHYSIO. CXXXVI

MOLLIE E. HOLMAN
Except for the initial period of excitation the spike potentials were in-distinguishable from normal. A similar result was obtained whether 2/3, 9/10or all the NaCl had been replaced by choline chloride.When all the NaCl had been replaced the solution still contained 17 mM-Na,
derived from bicarbonate and acid phosphate. Thus the taenia coli was able tomaintain its spontaneous activity, although the concentration of Na ions wasonly 1/9 of normal. Even at this low concentration, after the initial excitation
>~~~~~~~~~~~~~~~~~~~~~~~~~~~~~~~~~4E ___L L
__ _ _ _ __ _ _ _ __ _ _ _ _ .- 8g
p
8~~~~~~~~~~- g
1 secFig. 9. Records from an experiment in which the NaCl was 1/3 of normal and choline chloride
was used to maintain tonicity. Top record, normal; second record, after 5 min in the lowNaCl solution; bottom record, after 45 min exposure.
had passed, there was no change in spike height or configuration. In Fig. 10the records were taken from an experiment where the choline chloride solutionremained in contact with the muscle for 150 min. The first record was takentowards the end of the excitation period. The next record was taken during theperiod of lower spike frequency which followed excitation; the next was taken100 min later. Spike frequency and tension were greater than in the finalnormal record (lowest record) but the spikes still showed normal configuration.The resistance of all the electrodes used during this experiment was 20 MQ.The mean height of the spikes occurring throughout the test period (allowing30 min for equilibration and excitation) was 8-7 mV. In two further experi-ments with 1/3 NaCl (similar electrodes) the mean spike height was 8-5 and10-4 mV. In 1/10 NaCl the mean height was 10-3 mV. Mean values for thecontrol periods during these experiments ranged from 5 0 to 12-8 mV.
Total replacement of sodium ions by cholineBefore it was possible to replace all the Na ions by choline it was necessary
to choose a new (K-buffer) 'normal' solution, containing only 5 mm of bufferin the form of K salts, and no KCl. The following solution was prepared: NaCl,
578

SODIUM CHLORIDE AND SMOOTH MUSCLE 579150 mM; KHCO3, 50 mM, aerated with C02 1, 02 99%; concentrations ofCaCl2, MgCl and glucose as before; the pH was 7-3 at 350 C.
This solution was tested on a preparation in an isolated organ bath wherethe tension only was recorded on a kymograph with an isometric lever. The
>EC1
l l l l | -10604
10-8
_ - 4 u-w-C0
I ~~~~~~~~CI ~~~-lOu604
108.6
1secFig. 10. Records from an experiment in which all the NaCI present in 'normal' solution had been
replaced with choline chloride. The first three records were taken at 10, 45 and 100 minafter changing over to the choline chloride solution; the last record was taken 20 min afterwashing out with normal solution.
*5g915 min
Fig. 11. Kymograph record of an experiment where the removal of all Na ions was tested:(a) tonic contraction, (b) level of tension before washing out with normal solution and abruptfall to zero, (c) first increase in tension 20 min after washing out, (d) tension 80 min later.The muscle was exposed to Na-free solution for 75 min.
behaviour of the muscle was perfectly normal. No changes could be detectedwhen K-buffer solution was alternated with the 'original' normal solution.
Fig. 11 shows a kymograph record of the effect of removing all Na ions froimthe bathing fluid. In this experiment the tonic contraction was very marked>
37-2
-i L'i
1. I ..-
r..
ji -4.. 2

MOLLIE E. HOLMANthe initial tension being low. Prolonged exposure produced a fall in tension toa level a little below normal. On replacing the (K-buffer) normal solution afurther very abrupt fall in tension occurred, in this case to zero. Such a fallhad also been noted in other experiments when the choline solutions werewashed out.
> a
Et a .s-6-2g
b
4-T2g
-5:8 g
-584g
_-40 g.~~~~~4S4
1 secFig. 12. Changes in spike configuration during an experiment with Na-free solution. (a) normal,
(b) after 25 min exposure to Na-free solution; (c) after 35 min and (d) after 40 min exposure;(e) 60 min after washing out with normal solution.
The corresponding changes in electrical activity are shown in Fig. 12.During the tonic contraction the spike duration increased and spike heightfell, but instead of returning to a normal configuration as in those experimentswhere 1/9 of the Na ions were still present the spike height continued to fall.The rate of repolarization was reduced initially, and after about 20 min therate of depolarization also began to decrease. After 30 min the spikes hadbecome very small. They continued for some time but grew steadily longer induration and smaller in height. After about 50 min they could no longer bedetected. No further activity was seen. On washing out, the tension fellwithout delay. Spikes appeared again 10-20 min later, usually in bursts offairly high frequencies. Recovery was complete in 60-80 min.
DISCUSSION
It is well known that the electrical activity of many vertebrate tissues dependson the presence of Na ions in the external solution. In cardiac muscle reduc-tion of the concentration of Na ions slows the rate of impulse production(Clark, 1913) and when the Na ions are reduced to 20% of normal, the spon-
580

SODIUM CHLORIDE AND SMOOTH MUSCLE
taneous activity of Purkinje tissue is abolished (Draper & Weidmann, 1951).It was surprising, therefore, to find that the smooth muscle of the guinea-pigtaenia coli was able to maintain its spontaneous discharge of spike potentialsat normal frequency when the Na ion concentration was reduced to 11 %. Thissuggested that the processes underlying the production of spontaneous activityin taenia muscle were different from those involved in cardiac muscle.The variation of the height of the action potential with the Na ion concentra-
tion has been studied in vertebrate nerve (Huxley & Staimpfli, 1951), skeletalmuscle (Nastuk & Hodgkin, 1950) and cardiac muscle (Draper & Weidmann,1951). In all these tissues the height and rate of rise of the action potentialdeclined as the Na ion concentration was reduced. When the concentrationwas between 10 and 20% of normal, the action potential was reduced to abouthalf its normal amplitude. At lower concentrations propagation failed.The spikes recorded from a normal taenia have been shown to differ from
those of nerve and striated muscle, in that they were variable in height andduration and generally caused only a partial depolarization. However, thoughchanges in spike height and configuration occurred spontaneously, definitechanges beyond the normal range could be recognized during stimulation orinhibition by pharmacological agents (Biilbring, 1957). However, in thecomplete absence of NaCl (leaving only 17 mm Na) there was no change in thespike height nor in the spike configuration.Only when the taenia was bathed in a solution completely free of Na ions,
which was changed continuously by constant flow, the spikes graduallydecreased in height until they degenerated into small oscillations. The rela-tively slow time course of the decay in spike height (about 40 min) might havebeen due to a delay in the removal of all the Na ions from the extracellularspace, which in taenia coli has been found to be equal to 36% of the total wetweight (E. Biilbring & G. V. R. Born, personal communication). Nevertheless,the ultimate fall in spike height to zero suggested that the presence of Na ionsin the external solution was necessary for the spike production.
According to the ionic theory of activity in nerve (Hodgkin, 1951) therising phase of the action potential is due to an inward movement of Na ionswhich carries the membrane potential towards the Na equilibrium potential(determined by the ratio [Na]0/[Na]1). In nerve and skeletal muscle the initialincrease in Na permeability is followed by an increase in K permeability. Thisenables K ions to move out of the cell and as a result the membrane potentialis restored to its original level. The rising phase of the spike in taenia coli isvery slow compared with nerve or striated muscle, and normally only leadsto a partial depolarization. This suggests that there may be an increase inK permeability at a rather variable membrane potential, but well before theNa equilibrium potential is reached. Provided there is sufficient Na outsidethe cell to keep the Na equilibrium potential below the resting potential, an
581

MOLLIE E. HOLMANincrease in Na permeability would then still lead to a partial depolarization.If the concentration of Na ions in the intracellular water of smooth muscle issimilar to that of other tissues (about 20 mM) then a depolarization might stillhave been possible when the Na ion concentration was reduced to 11% ofnormal (17 mM). If the Na carrier mechanism were similar to that in nerve andstriated muscle a marked slowing in the rate of depolarization should havebeen apparent when the external Na concentration was only 17 mm. No suchchange was detected in the present experiments at this concentration, althoughchanges in spike configuration did occur after prolonged exposure to Na-freesolution. This suggests that the Na carrier may be saturated at very lowexternal Na concentrations.Another explanation may be put forward. Shaw & Simon (1955) have shown
that frog sartorius muscle can adjust its internal Na when placed in lowNa solution, so that the ratio [Na] 0/[Na], is restored to normal levels. It ispossible that the taenia is capable of adjusting its internal Na in this manner.The effects of excess NaCl on the taenia were complex. During the initial
rise in tension spike configuration changed to that typical of excitation(Bulbring, 1957). As the tension fell, however, spikes reverted to their originalshape; there was no increase in spike height.The rise in tension produced by high concentrations of NaCl was followed
by a period during which the tension remained high although the spike dis-charge was abolished. Born & Biilbring (1956) have shown that, in taenia,contraction is associated with an increase in the rate of loss of cell K, andrelaxation with an increase in the rate of uptake of K. In the presence ofexcess NaCl the maintenance of tension without spikes may have been due toa continuous loss of K from the muscle. Shaw, Simon, Johnstone & Holman(1956) have shown that toad sartorius muscle, after prolonged exposure tohigh NaCl (5 x normal concentration), lost 90% of its intracellular K. The fallin resting potential which was caused by high NaCl in taenia suggests thathere also, there was a loss of K from the muscle. This explanation is furthersupported by the observation that the tension level was much lower in 2 x NaClthan in 3 x NaCl, when the loss ofK from the cells should have been less. The de-layed relaxation which occurred after washing out the excess NaCl with normalsolution was associated with an increase in resting potential. This may havereflected an increase in activity on the cell pumps, removing the excess Na andtaking up K.Vogt (1943) previously reported a contraction of smooth muscle in response
to excess NaCl. Working with rabbit jejunum she found that a 20% increaseproduced a strong tonic contraction in the circular muscle, but was withouteffect on the longitudinal muscle. This contraction was not affected byatropine but was abolished by large doses of nicotine and by cooling. Sheconcluded that the most likely site of stimulation was the nerve plexus. Our
582

SODIUM CHLORIDE AND SMOOTH MUSCLEexperiments do not exclude the possibility that the initial excitation producedby excess NaCl was of nervous origin, but this is unlikely because it occurredin the presence of atropine. It seems more probable that the highNa concentra-tion stimulated the muscle directly by causing an increase in intracellularNa and a loss of K.Vogt found a similar contraction of the circular muscle when sucrose was
used to make the bathing solution hypertonic. She noted, however, that thelongitudinal muscle was inhibited under these conditions. The taenia, whichis the longitudinal muscle of the guinea-pig caecum, was also relaxed bysucrose, whether it was added to normal solution or used to replace NaCl. Thetime which elapsed before all spikes ceased was variable in both cases but theeffect was most marked in the experiment where only 1/10 of the normalconcentration of NaCl was present. This suggests that in low NaCl solutionsthe inhibition may have been due to a movement of sucrose into the cells anda disturbance of osmotic balance.The present experiments indicate that the spike in taenia is due to a similar
mechanism to that of the action potential in nerve or striated muscle becausethe presence of Na ions appears to be essential. Some differences, however, mustexist since the spontaneous activity is abolished only after prolonged exposureto a Na-free medium and the spike discharge can therefore proceed at anextremely low Na ion concentration in the extracellular fluid. The normalspikes in taenia have a very slow rate of rise and their configuration is inde-pendent of the Na ion concentration over a wide range. These observationssuggest that the Na carrier mechanism may not be as highly developed insmooth muscle as in tissues where rapid conduction occurs. Further investiga-tion concerning the nature of the spike potential is at present in progress.
SUMMARY
1. Resting potential, spike discharge and tension have been recorded in theisolated taenia coli of the guinea-pig.
2. Excess NaCl in the bathing solution caused a fall in resting potential,increased spike frequency and increase in tension. Prolonged exposure to highconcentrations of NaCl abolished the spike discharge but a high tension wasmaintained, associated with a low resting potential. Following readmission ofnormal solution relaxation occurred, after a latent period. This was associatedwith an increase in resting potential.
3. Hypertonicity produced by the addition of sucrose to normal solutiondid not cause excitation but it depressed spike frequency and tension.
4. Reduction of NaCl with the addition of sucrose to maintain normaltonicity produced a similar depression.
5. When choline chloride was used to replace NaCl (the other componentsof the bathing solution being unchanged so that 17 mM-Na remained) spike
583

584 MOLLIE E. HOLMAN
frequency was not depressed and tension remained high for exposures of upto 21 hr.
6. No changes in spike configuration were detected when the concentrationof Na ions was varied between 17 and 150 mM, irrespective of whether cholinechloride or sucrose was used to maintain tonicity.
7. When all the Na ions were removed the spike potentials decayed andwere completely abolished after 40 min exposure.
I wish to acknowledge the encouragement and guidance of Dr Edith Biulbring during the courseof this investigation. I also wish to thank Mr 0. B. Saxby and Mr D. Groves for their help andadvice in the construction of the apparatus.
REFERENCESBORN, G. V. R. & BtLBRING, E. (1956). The movement of potassium between smooth muscle and
the surrounding fluid. J. Physiol. 131, 690-703.BiYLBRING, E. (1955). Correlation between membrane potential, spike discharge and tension in
smooth muscle. J. Phy8iol. 128, 200-221.BULBRING, E. (1957). Changes in configuration of spontaneously discharged spike potentials from
smooth muscle of the guinea-pig's taenia coli. The effect of electrotonic currents and ofadrenaline, acetylcholine and histamine. J. Phy8iol. 135, 412-425.
CLARK, A. J. (1913). The action of ions and lipoids upon the frog's heart. J. Physiol. 47, 66-107.DRAPER, M. N. & WEIDMANN, S. (1951). Cardiac resting and action potentials recorded with an
intracellular electrode. J. Physiol. 115, 74-95.HODGKIN, A. L. (1951). The ionic basis of electrical activity in nerve and muscle. Biol. Rev. 26,
339-409.HUXLEY, A. F. & STXMPFLI, R. (1951). Effect of potassium and sodium on resting and action
potentials in single myelinated fibres. J. Physiol. 112, 496-508.NASTUK, W. L. & HODGKIN, A. L. (1950). Electrical activity of single muscle fibers. J. cell. comp.
Physiol. 35, 39-77.PROSSER, C. L., SMITH, C. E. & MELTON, C. E. (1955). Conduction of action potentials in the ureter
of the rat. Amer. J. Physiol. 181, 651-660.SHAw, F. H. & SIMON, S. E. (1955). Sodium extrusion in muscle. Nature, Lond , 176, 1031-1032.SHAW, F. H., SIMON, S. E., JOHNSTONE, B. & HOLMAN, M. E. (1956). The effect of changes of
environment on the electrical and ionic pattern in muscle. J. gen. Phy8iol. 40, 263-288.VOGT, M. (1943). The site of action of some drugs causing stimulation of the circular coat of the
rabbit's intestine. J. Physiol. 102, 170-179.