
Computer simulation studies of aqueous sodium chloride ...omh.umeche.maine.edu/pdfs/Aqueous sodium...
13
Computer simulation studies of aqueous sodium chloride solutions at 298 K and 683 K S. Koneshan a) and Jayendran C. Rasaiah b) Department of Chemistry, University of Maine, Orono, Maine 04469 ~Received 3 May 2000; accepted 10 August 2000! We have carried out molecular dynamics simulations of NaCl solutions at room temperature ~298 K! and at a supercritical temperature of 683 K using discrete simple point charge ~SPC or SPC/E! molecular models for the water solvent. The solvent densities were 0.997 g cm 23 at 298 K and 0.35 g cm 23 and 0.175 g cm 23 at 683 K. The ion–ion and ion–solvent distribution functions were calculated and compared with corresponding functions for a continuum model of the solvent also determined by computer simulation. Our studies confirm the presence of significant amounts of ion pairing and clustering at supercritical conditions as seen in visualizations of the equilibrium configurations of the solution. However, the degree of pairing and clustering of ions in supercritical solutions is significantly different for discrete and continuum representations of the solvent. Simulations of a 1 molal solution of NaCl at 683 K, using a discrete molecular model for the solvent at a density of 0.35 g cm 23 , show the presence of a single megacluster of 10 sodium and chloride ions in a system of 555 water molecules. Three smaller clusters containing positive and negative charges are observed at 683 K when the electrolyte concentration is reduced to 0.5 molal at a solvent density of 0.35 g cm 23 and also at a lower solvent density of 0.175 g cm 23 . Molecular dynamics simulations of the velocity auto correlation functions of Na 1 and Cl 2 ions have distinct forms related to the cluster to which the ion belongs. The diffusion coefficients of Na 1 and Cl 2 ions, at infinite dilution, are larger at 683 K than at 298 K, and decrease with increasing electrolyte concentration. They are nearly equal to each other in the one molal solution at 683 K, which may correspond to a supersaturated solution in which the large cluster of sodium and chloride ions moves as an entity over an observed lifetime greater than 200 ps. © 2000 American Institute of Physics. @S0021-9606~00!50242-6# I. INTRODUCTION The dielectric properties of water influence the dissocia- tion of an electrolyte and subsequent solvation of ions in aqueous solutions. Oppositely charged ions in aqueous solu- tions tend to associate when the temperature is increased, which is evident from the conductivity measurements of aqueous electrolyte solutions carried out at supercritical tem- peratures by Quist and Marshall 1 and by Wood et al. 2 This phenomenon is explained qualitatively by the observed de- crease in the dielectric constant of water from nearly 78 at ambient temperatures to approximately 5 near critical condi- tions. The dielectric properties of water also change with the solvent density, and correlations of the experimental dielec- tric constant with temperature and density were discussed recently by Fernandez et al. 3 The decrease in the dielectric constant with temperature is also observed in computer simulation studies of simple point charge models ~SPC and SPC/E! for water. Mountain and Wallquist, 4 Cui and Harris, 5 Neumann, 6 and Guissani and Guillot 7 have published details of their simulations of the dielectric constant of water over wide ranges of temperature and density. These simulations, using the SPC or SPC/E models for water, are generally in agreement with the experi- mental dielectric constant and transport properties of water, such as the diffusion coefficient. This gives us confidence in employing the same models to study the properties of ionic solutions at elevated temperatures by computer simulation. Supercritical water is characterized by a large compress- ibility k T that is related to density fluctuations in an open system and the solvent pair correlation function g ( r ) through the well-known compressibility equation 8 r w kT k T 51 2r w E ~ g ~ r ! 21 ! d r. ~1! Here r w is the number density of water, k is Boltzmann’s constant, T is the temperature in degrees Kelvin, and the integration is over all space. The high compressibility in the critical region allows for large variations in the solvent den- sity with small changes in the external pressure. The effect of solvent density fluctuations on ion solvation, association, and ionic reactions at supercritical temperatures however, is less well understood, and is currently an active area of research. 9,10 Computer simulations of the potential of mean force of NaCl ~Chiavlo and Cummings, 11 Dang et al., 12 Rey and Guardia et al., 13 Berkowitz et al. and Karim et al. 14 ! in solu- tion at ambient conditions suggest that association of Na 1 and Cl 2 ions takes place in two or more steps. In its simplest form, this is represented schematically as 11 Na 1 1Cl 2 ⇔Na 1 u Cl 2 ⇔Na 1 Cl 2 . a! Current address: Department of Computer Science, Cornell University, Ithaca, New York. b! Author to whom correspondence should be addressed. JOURNAL OF CHEMICAL PHYSICS VOLUME 113, NUMBER 18 8 NOVEMBER 2000 8125 0021-9606/2000/113(18)/8125/13/$17.00 © 2000 American Institute of Physics Downloaded 05 Jun 2004 to 130.111.64.68. Redistribution subject to AIP license or copyright, see http://jcp.aip.org/jcp/copyright.jsp
Transcript of Computer simulation studies of aqueous sodium chloride ...omh.umeche.maine.edu/pdfs/Aqueous sodium...

JOURNAL OF CHEMICAL PHYSICS VOLUME 113, NUMBER 18 8 NOVEMBER 2000
Computer simulation studies of aqueous sodium chloride solutionsat 298 K and 683 K
S. Koneshana) and Jayendran C. Rasaiahb)
Department of Chemistry, University of Maine, Orono, Maine 04469
~Received 3 May 2000; accepted 10 August 2000!
We have carried out molecular dynamics simulations of NaCl solutions at room temperature~298 K!and at a supercritical temperature of 683 K using discrete simple point charge~SPC or SPC/E!molecular models for the water solvent. The solvent densities were 0.997 g cm23 at 298 K and 0.35g cm23 and 0.175 g cm23 at 683 K. The ion–ion and ion–solvent distribution functions werecalculated and compared with corresponding functions for a continuum model of the solvent alsodetermined by computer simulation. Our studies confirm the presence of significant amounts of ionpairing and clustering at supercritical conditions as seen in visualizations of the equilibriumconfigurations of the solution. However, the degree of pairing and clustering of ions in supercriticalsolutions is significantly different for discrete and continuum representations of the solvent.Simulations of a 1 molal solution of NaCl at 683 K, using a discrete molecular model for the solventat a density of 0.35 g cm23, show the presence of a single megacluster of 10 sodium and chlorideions in a system of 555 water molecules. Three smaller clusters containing positive and negativecharges are observed at 683 K when the electrolyte concentration is reduced to 0.5 molal at a solventdensity of 0.35 g cm23 and also at a lower solvent density of 0.175 g cm23. Molecular dynamicssimulations of the velocity auto correlation functions of Na1 and Cl2 ions have distinct formsrelated to the cluster to which the ion belongs. The diffusion coefficients of Na1 and Cl2 ions, atinfinite dilution, are larger at 683 K than at 298 K, and decrease with increasing electrolyteconcentration. They are nearly equal to each other in the one molal solution at 683 K, which maycorrespond to a supersaturated solution in which the large cluster of sodium and chloride ions movesas an entity over an observed lifetime greater than 200 ps. ©2000 American Institute of Physics.@S0021-9606~00!50242-6#
iaioso
em
dad
thlese
tupl
hetuCer
ter,in
nicn.ss-
en
hehen-t ofandlessof
of
aest
sit
I. INTRODUCTION
The dielectric properties of water influence the dissoction of an electrolyte and subsequent solvation of ionsaqueous solutions. Oppositely charged ions in aqueous stions tend to associate when the temperature is increawhich is evident from the conductivity measurementsaqueous electrolyte solutions carried out at supercritical tperatures by Quist and Marshall1 and by Woodet al.2 Thisphenomenon is explained qualitatively by the observedcrease in the dielectric constant of water from nearly 78ambient temperatures to approximately 5 near critical contions. The dielectric properties of water also change withsolvent density, and correlations of the experimental dietric constant with temperature and density were discusrecently by Fernandezet al.3
The decrease in the dielectric constant with temperais also observed in computer simulation studies of simpoint charge models~SPC and SPC/E! for water. Mountainand Wallquist,4 Cui and Harris,5 Neumann,6 and Guissaniand Guillot7 have published details of their simulations of tdielectric constant of water over wide ranges of temperaand density. These simulations, using the SPC or SPmodels for water, are generally in agreement with the exp
a!Current address: Department of Computer Science, Cornell UniverIthaca, New York.
b!Author to whom correspondence should be addressed.
8120021-9606/2000/113(18)/8125/13/$17.00
Downloaded 05 Jun 2004 to 130.111.64.68. Redistribution subject to AIP
-nlu-ed,f-
e-ti-ec-d
ree
re/Ei-
mental dielectric constant and transport properties of wasuch as the diffusion coefficient. This gives us confidenceemploying the same models to study the properties of iosolutions at elevated temperatures by computer simulatio
Supercritical water is characterized by a large compreibility kT that is related to density fluctuations in an opsystem and the solvent pair correlation functiong(r ) throughthe well-known compressibility equation8
rwkTkT512rwE ~g~r !21!dr . ~1!
Here rw is the number density of water,k is Boltzmann’sconstant,T is the temperature in degrees Kelvin, and tintegration is over all space. The high compressibility in tcritical region allows for large variations in the solvent desity with small changes in the external pressure. The effecsolvent density fluctuations on ion solvation, association,ionic reactions at supercritical temperatures however, iswell understood, and is currently an active arearesearch.9,10
Computer simulations of the potential of mean forceNaCl ~Chiavlo and Cummings,11 Dang et al.,12 Rey andGuardiaet al.,13 Berkowitzet al. and Karimet al.14! in solu-tion at ambient conditions suggest that association of N1
and Cl2 ions takes place in two or more steps. In its simplform, this is represented schematically as11
Na11Cl2⇔Na1uCl2⇔Na1Cl2.
y,
5 © 2000 American Institute of Physics
license or copyright, see http://jcp.aip.org/jcp/copyright.jsp
nthri
umth
on
ncatthran
sold
lanreetua
tl
mene
Sraa
peepseumum
oopionn
u-ndo
lyolvumtholirsngo
r.us-
of
ndtem-at-
ions
in-de-forh
onsts
ch
lu-heiumsol-lalils.nsnta-s
e-olu-ge-
olu-es,
lu-uresla-ngdif-ion
a-
8126 J. Chem. Phys., Vol. 113, No. 18, 8 November 2000 S. Koneshan and J. C. Rasaiah
Here Na1uCl2 represents a solvent separated ion pair, aNa1Cl2 is a contact ion pair. This scenario underscoresintimate role that the solvent plays, beyond its dielectproperties, in the association of oppositely charged ionsform pairs. However the interionic distance between sodiand chloride ions is a poor reaction coordinate sincetransmission coefficient is low14 and Geissleret al.15 havediscussed how solvent fluctuations and collective motidetermine kinetic pathways for this reaction.
The effect of ions on the properties of a polar solvelike water near its critical region is also of great theoretiand experimental interest.16–19 They could conceivably shifthe critical constants and alter the critical exponents ofsolvent. Conversely the solvent, which mediates the intetions between ions through its dielectric properties acharge screening, could promote the formation of clusterpositive and negative ions with intervening solvent mecules. This may even lead to charge density waves, ascussed by Nabutovskiiet al.20 and Ho”ye and Stell.21
In this paper, we describe molecular dynamics simutions of NaCl solutions at 298 and 683 K, using discrete acontinuum models for the solvent. We first present oursults for 1.0 and 0.5 molal NaCl solutions using discrmodels for the solvent. The study at 298 K is at the ussolvent density of 0.997 g cm23, while the simulations of theone molal sodium chloride at 683 K were carried out asolvent density of 0.35 g cm23 which is close to the criticadensity of water which is 0.32 g cm23. Our studies are nearly30° above the critical temperature of water. The high teperature~683 K! studies of the 0.5 molal NaCl solution werperformed at two different solvent densities of 0.35 a0.175 g cm23 to investigate the effect of this variable on thproperties of the system under supercritical conditions.dium chloride is sparingly soluble in water at high tempetures, and the one molal solution of NaCl in SPC water683 K discussed in our studies may correspond to a susaturated solution, while the 0.5 molal solutions should rresent concentrated salt solutions at 683 K. We also preresults of molecular dynamics studies of one molal sodichloride solutions at 298 K and at 683 K using a continumodel for the solvent with appropriate dielectric constants78 and 5, respectively. This allows us to compare the prerties of an electrolyte at the same concentration in solutthat differ primarily in the treatment of the solvent as a cotinuum dielectric medium or discrete molecular medium.
We determine the pair correlation functions and diffsion coefficients of the ions in NaCl solutions at 298 K a683 K and compare them with each other and with the cresponding data at infinite dilution.22,23 This enables us tocharacterize the essential features that distinguish electrosolutions at supercritical temperatures from the same stions at ambient temperature. The main difference obserin our simulations between the 1 molal and 0.5 molal sodichloride at high and low temperatures, is the clustering ofsodium and chloride ions in supercritical region of the svent that goes beyond the formation of isolated ion paThe formation of small clusters of ions eventually organiziinto a larger mass with increasing temperature was alsoserved previously by Driesneret al.24 and Testeret al.25,26 in
Downloaded 05 Jun 2004 to 130.111.64.68. Redistribution subject to AIP
decto
e
s
tl
ec-dof-is-
-d-
el
a
-
d
o--tr--nt
f-s
-
r-
teu-ed
e-.
b-
their simulations of NaCl solutions in supercritical wateOur study investigates the diffusion of the ions and ion clters at supercritical temperatures as well as the diffusionfree ions at room temperature.
We find that the diffusion coefficients of the sodium achloride ions at infinite dilution determined in the discresolvent models for water increase sharply with rise in teperature. This is similar to the behavior of other simple cions and anions, reported by us in recent studies,22,23 andagrees with the trends shown by experimental determinatof the mobilities of ions in water at infinite dilution.1,2 Wealso find that the ion diffusion coefficients decrease withcreasing salt concentration, as expected from theory. Thecrease is much greater for supercritical solutions than it issolutions under ambient conditions. At a sufficiently higsalt concentration, the clusters of sodium and chloride idiffuse as single entities and the ionic diffusion coefficienof the Na1 and Cl2 ions become essentially equal to eaother.
We also discuss simulations of sodium chloride sotions using a continuum model for the solvent. Although, tqualitative features of the structure and dynamics of sodand chloride solutions using a continuum and discretevent models remain the same in our simulations of 1 moNaCl solutions, there are important differences in the detaFor example, the extent of pairing and clustering of ioobserved at 683 K in the continuum and discrete represetions of the solvent are significantly different. This showthat dielectric continuum models, while useful in many rspects, are oversimplified caricatures of real electrolyte stions at supercritical temperatures due to solvent inhomoneity caused by density fluctuations.
There have been other investigations of aqueous stions of NaCl at ambient and supercritical temperaturapart from the studies of Driesneret al.,24 Tester, Harris, andtheir groups,25,26 and Chiavlo and Cummings.11 Hummeret al.27 studied the equilibrium properties of aqueous sotions of NaCl at several concentrations and at temperatranging from ambient to supercritical conditions, by simution and calculation of the ion correlation functions usiintegral equation approximations. These studies have aferent perspective from ours, which investigates the diffus
TABLE I. Na1–water, Cl2–water, ion–ion, and water–water potential prameters.
Ion s io ~Å! e io ~kJ/mol! s ih ~Å! e ih ~kJ/mol!
Na1 2.72 0.560 14 1.310 0.560 14Cl2 3.55 1.505 75 2.140 1.505 75
Ion pair s ~Å! e ~kJ/mol!
Na1Na1 2.443 0.119 13Na1Cl2 2.796 0.352 6Cl2Cl2 3.487 0.979 06
Water soo ~Å! eoo ~kJ/mol! Charge (q)
O~H2O! 3.156 0.650 20 20.82H~H2O! 10.41
license or copyright, see http://jcp.aip.org/jcp/copyright.jsp
a
es.nas
emthol
ois
1in
nin-
dbic
andtheey
ials
n
s
8127J. Chem. Phys., Vol. 113, No. 18, 8 November 2000 Simulation studies of aqueous sodium chloride
of ions in solution and their relation to cluster formationhigh temperature.
II. MOLECULAR DYNAMICS SIMULATIONTECHNIQUES
Our primary system of ions in a discrete aqueous solvconsisted of 10 Na1, 10 Cl2, and 555 SPC water moleculeThis represents a NaCl solution at a 1 molal concentratioelectrolyte. The density of water in our simulations w0.997 g cm23 at 298 K and 0.35 g cm23 at 683 K. Thesevalues of the solvent density require cubic simulation cbox lengths of 25.54 Å and 36.20 Å, respectively. The nuber of water molecules was increased by a factor of 2 forsimulations of 0.5 molal NaCl solutions carried out at svent densities of 0.35 g cm23 and 0.175 g cm23 at 683 K;they correspond, in our simulations, to cubic box lengths45.6 Å and 57.5 Å, respectively. The correlation lengthgiven by25
j5j0~DT!2n@11j1~DT!D11¯#, ~2!
whereDT5(T2Tc)/Tc , n50.63, andD150.51. For waterj051.3 andj152.16. At 683 K the correlation length is 1Å, which is considerably smaller than half the box lengthall cases considered.28
The parameterssoo andeoo for the interactions betweewater molecules displayed in Table I are for the simple pocharge~SPC! for water with the potential energy of interaction between two water molecules given by
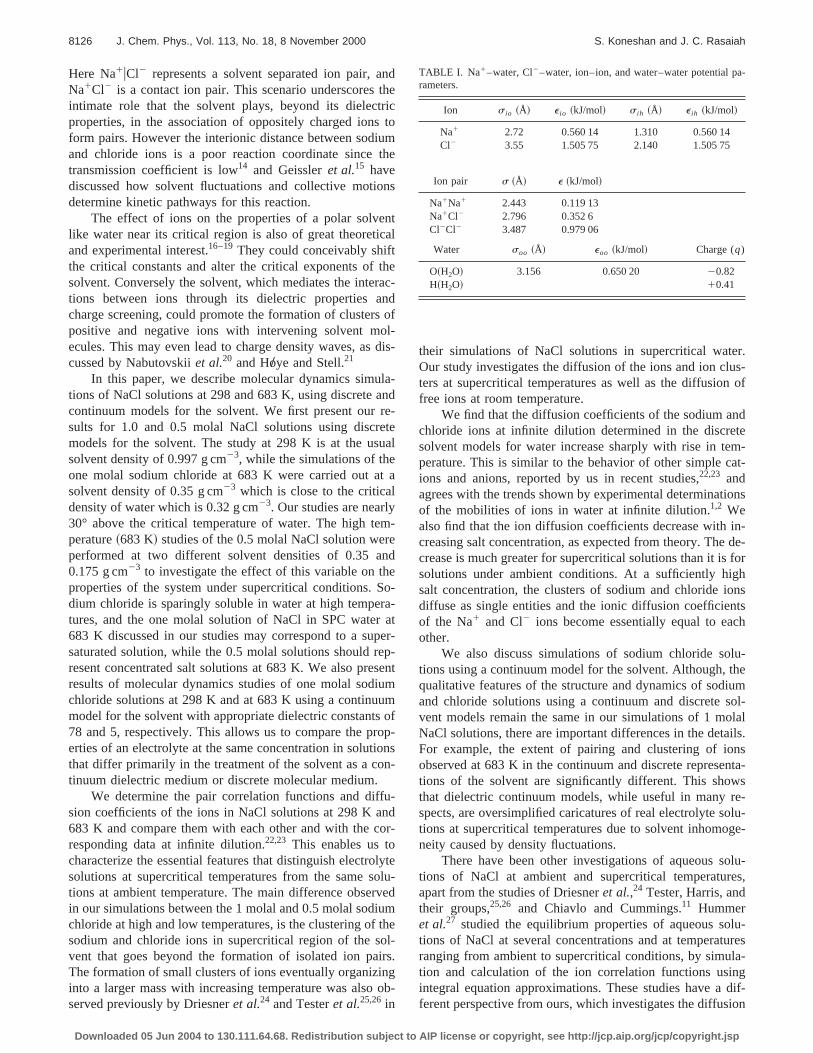
FIG. 1. Comparison of the non-Coulombic interactions between Na1 andCl2 ions using Huggins–Mayer~solid line! and Lennard-Jones~dashed line!potentials. The Lennard-Jones parameterse ands were calculated from theHuggins–Mayer potential and Eq.~8!. Both models give potential functionthat coincide closely in the regions shown.
Downloaded 05 Jun 2004 to 130.111.64.68. Redistribution subject to AIP
t
nt
of
ll-e-
f
t
uwater54eooF S soo
r ooD 12
2S soo
r ooD 6G1
1
4pe0(i 51
3
(j 51
3qiqj
r i j.
~3!
Heree0 is the permittivity of free space. The ion–water anion–ion potentials consist of Lennard-Jones and Coulomcomponents. The Lennard-Jones~LJ! interaction betweentwo water molecules is only between the oxygen atoms,the corresponding LJ ion–water interactions are betweenion–oxygen and ion–hydrogen atoms of SPC water. Thare both of the form
u~r !54eF S s
r D 12
2S s
r D 6G , ~4!
with subscripts~i, o, and h! for e and s to distinguish be-tween the different water–water and ion–water LJ potentas displayed in Table I.
The e and s parameters for the ion–water and ion–ioLJ potentials were chosen to match the Pettit–Rossky29 pa-rameters for the Huggins–Mayer30 potential for the non-Coulombic part of the interaction
u~r !5A exp~2Br !2C
r 6 . ~5!
Taking C54es6 andA54e exp(Bs), we have
u~r !54eFexpB~s2r !2S s
r D 6G . ~6!
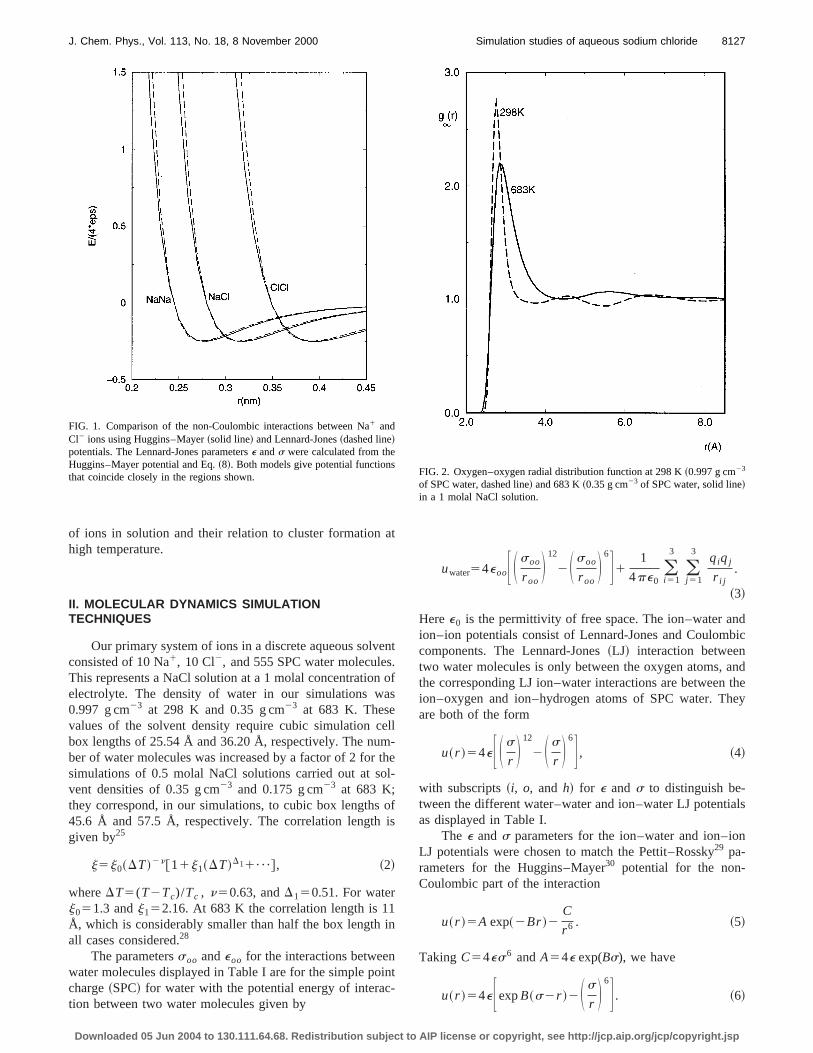
FIG. 2. Oxygen–oxygen radial distribution function at 298 K~0.997 g cm23
of SPC water, dashed line! and 683 K~0.35 g cm23 of SPC water, solid line!in a 1 molal NaCl solution.
license or copyright, see http://jcp.aip.org/jcp/copyright.jsp
rdeebp
ourn-
and
nster
ras 1ns.Pe-nd
um-
talnof
tersom
ofwoari-ties
deh
tworogen
s.
8128 J. Chem. Phys., Vol. 113, No. 18, 8 November 2000 S. Koneshan and J. C. Rasaiah
This implies that u(r )50 at r 5s. Requiring also thatu(r )52e at r 521/6s, fixes the value ofBs through therelation
Bs5S 1
1221/6D lnS 1
4D511.36. ~7!
It follows that A54e exp ~11.36! and the L-J parameterseand s are related to parametersA and C of the Huggins–Mayer potential through the relations
e5S A
4 Dexp~211.36!52.9131026A,
~8!
s5F S C
ADexp~11.36!G1/6
56.6414S C
AD 1/6
.
Figure 1 compares the Huggins–Mayer and LennaJones potentials for the non-Coulombic interaction betwNa1 and Cl2. The Lennard-Jones potential is seen toessentially identical to the Huggins–Mayer form exce
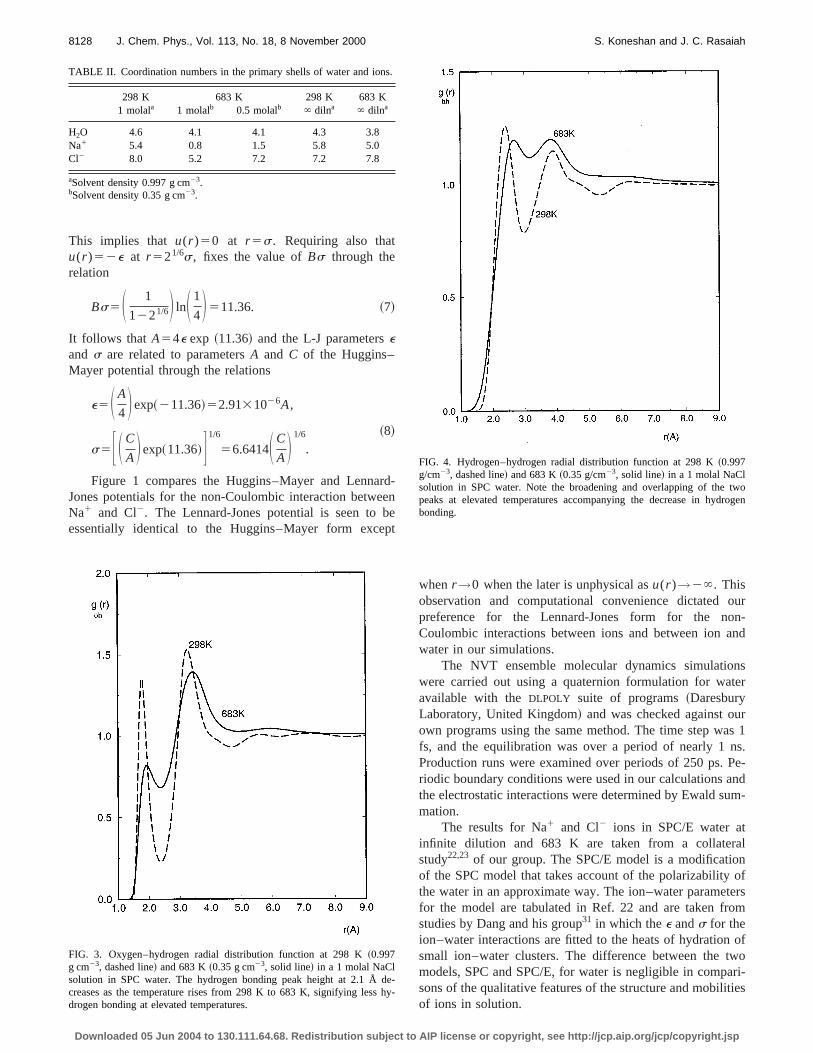
FIG. 3. Oxygen–hydrogen radial distribution function at 298 K~0.997g cm23, dashed line! and 683 K~0.35 g cm23, solid line! in a 1 molal NaClsolution in SPC water. The hydrogen bonding peak height at 2.1 Åcreases as the temperature rises from 298 K to 683 K, signifying lessdrogen bonding at elevated temperatures.
TABLE II. Coordination numbers in the primary shells of water and ion
298 K 683 K 298 K 683 K1 molala 1 molalb 0.5 molalb ` dilna ` dilna
H2O 4.6 4.1 4.1 4.3 3.8Na1 5.4 0.8 1.5 5.8 5.0Cl2 8.0 5.2 7.2 7.2 7.8
aSolvent density 0.997 g cm23.bSolvent density 0.35 g cm23.
Downloaded 05 Jun 2004 to 130.111.64.68. Redistribution subject to AIP
-n
et
whenr→0 when the later is unphysical asu(r )→2`. Thisobservation and computational convenience dictatedpreference for the Lennard-Jones form for the noCoulombic interactions between ions and between ionwater in our simulations.
The NVT ensemble molecular dynamics simulatiowere carried out using a quaternion formulation for waavailable with theDLPOLY suite of programs~DaresburyLaboratory, United Kingdom! and was checked against ouown programs using the same method. The time step wfs, and the equilibration was over a period of nearly 1Production runs were examined over periods of 250 ps.riodic boundary conditions were used in our calculations athe electrostatic interactions were determined by Ewald smation.
The results for Na1 and Cl2 ions in SPC/E water ainfinite dilution and 683 K are taken from a collaterstudy22,23 of our group. The SPC/E model is a modificatioof the SPC model that takes account of the polarizabilitythe water in an approximate way. The ion–water paramefor the model are tabulated in Ref. 22 and are taken frstudies by Dang and his group31 in which thee ands for theion–water interactions are fitted to the heats of hydrationsmall ion–water clusters. The difference between the tmodels, SPC and SPC/E, for water is negligible in compsons of the qualitative features of the structure and mobiliof ions in solution.
-y-
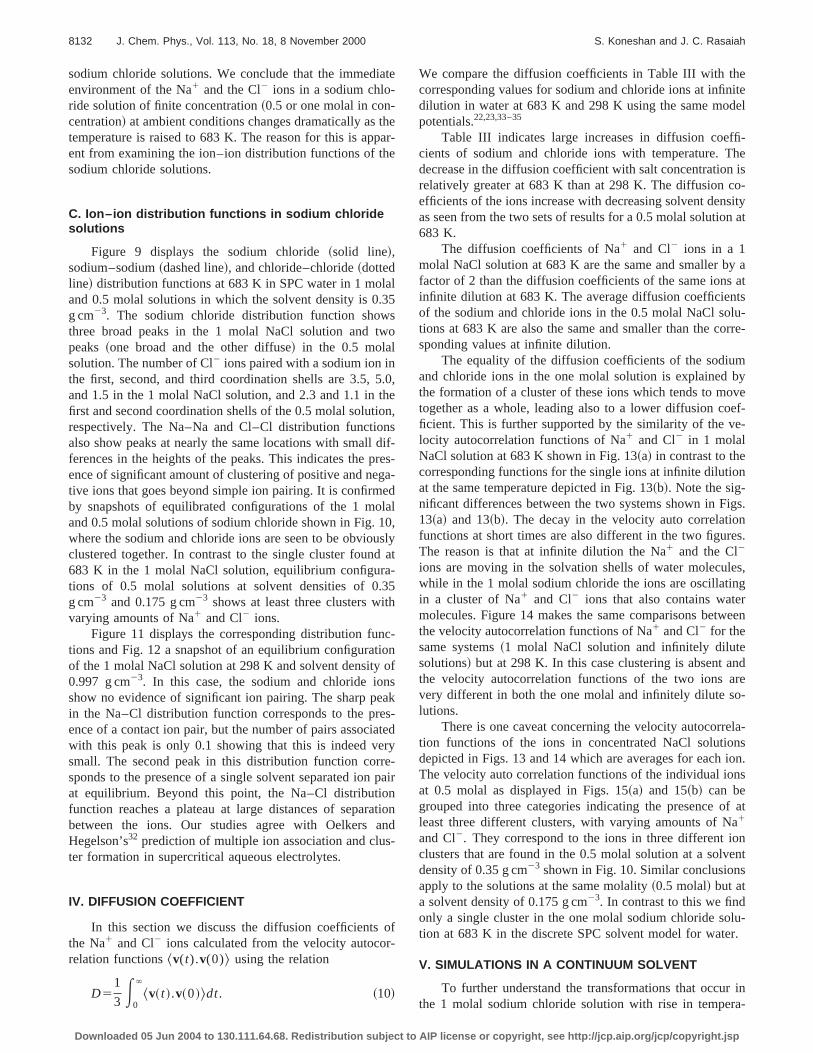
FIG. 4. Hydrogen–hydrogen radial distribution function at 298 K~0.997g/cm23, dashed line! and 683 K~0.35 g/cm23, solid line! in a 1 molal NaClsolution in SPC water. Note the broadening and overlapping of thepeaks at elevated temperatures accompanying the decrease in hydbonding.
license or copyright, see http://jcp.aip.org/jcp/copyright.jsp

h-
s.ak-
8129J. Chem. Phys., Vol. 113, No. 18, 8 November 2000 Simulation studies of aqueous sodium chloride
FIG. 5. ~a! Sodium–oxygen~solidline! and sodium–hydrogen~dashedline! radial distribution functions at298 K ~0.997 g cm23! and 683 K~0.35g cm23! in a 1 molal NaCl solution inSPC water. At 298 K, the distributionfunctions are in close agreement witthose for a single sodium ion at infinite dilution. At 683 K, ~b! showsthree distinct sodium–oxygen peakEach of the peaks correlates withcorresponding sodium-hydrogen peashown in the same figure. For comparison, ~c! and ~d! show the ion–oxygen~solid line! and ion–hydrogen~dashed line! radial distribution func-tions at 683 K for sodium and chlorideions in an infinitely dilute solution at asolvent density of 0.35 g cm23.
onad
r aarmaseouaitioK
ith
ea
aydial
or-Theentworesell,
d in
forhe
III. RESULTS
We present our results for the equilibrium correlatifunctions before discussing the diffusion coefficients of N1
and Cl2 ions at infinite dilution in SPC/E water at 298 K anin 0.5 and 1 molal sodium chloride solutions in SPC wate683 K. While the properties of SPC and SPC/E watersimilar to that of real water at ambient and supercritical teperatures, they are still only models representing waterfluid or solvent. However, we believe they capture the esstial physics of the interactions in these solutions, andsimulations of these model systems could be consideredguide to the behavior of real ionic solutions in the supercrcal region and at room temperature. We then discusssimulations of one molal sodium chloride solutions at 298and 683 K using a continuum model for the solvent wdielectric constants of 78 and 5, respectively.
A. Solvent atom distribution functions
We determined the oxygen–oxygen, oxygen–hydrogand hydrogen–hydrogen radial distribution functions of w
Downloaded 05 Jun 2004 to 130.111.64.68. Redistribution subject to AIP
te-a
n-r
s a-ur
n,-
ter in the neat solvent and in NaCl solutions in the usual wfrom histograms. Figure 2 shows the oxygen–oxygen radistribution functiongoo(r ) at 298 K ~0.997 g/cm3, dashedline! and 683 K~0.35 g/cm3, solid line! for SPC water in 1molal NaCl. It shows three peaks at room temperature cresponding to first, second, and third nearest neighbors.third peak, which lies furthest away from the central oxygatom, disappears at elevated temperatures while the firstpeaks are shifted away from the origin at high temperatuas shown in Fig. 2. The hydration numbers in the first shwere calculated from the integral
Nh5rwE0
RUgoo~r !4pr 2dr. ~9!
HereRU is the outer radius of the hydration shell andrw isthe number density of water. The results are summarizeTable II.
The locations of the first and second peaks of thegoo(r )in NaCl solutions are similar to the corresponding peakspure water, but the peak heights are slightly different. T
license or copyright, see http://jcp.aip.org/jcp/copyright.jsp

h
k
e
s-
8130 J. Chem. Phys., Vol. 113, No. 18, 8 November 2000 S. Koneshan and J. C. Rasaiah
FIG. 6. Chloride–oxygen~solid line!and chloride–hydrogen~dashed line!radial distribution functions at 298 K~0.997 g cm23! and 683 K ~0.35g cm23! in a 1 molal NaCl solution inSPC water. At 298 K, the distributionfunctions are in close agreement witthe corresponding functions for asingle chloride ion at infinite dilution.At 683 K, ~b! shows three differentchloride–oxygen peaks. Each peacorrelates with a correspondingchloride–hydrogen peak shown in thsame figure. At 683 K Na1 and Cl2
ions are close to each other in a cluter.
.3
Cth
reth
thhytth
lsra
r atthe
1as
ent.wa-lal
heinare8.5
35
coordination number of SPC water at 298 K is 4.6 in themolal NaCl solution; this is greater than the value of 4obtained with pure SPC/E water in our previous studies.34 At683 K, the coordination number of water in the 1 molal Nasolution is about 4.1 for the SPC model. This is close tovalue observed of 3.8 in simulations of pure SPC/E water22,23
at the same temperature.The extent of hydrogen bonding at higher temperatu
is expected to be less. Figures 3 and 4 which showoxygen–hydrogengoh(r ) and hydrogen–hydrogenghh(r )radial distribution function at 298 K~0.997 g cm23, dashedline! and at 683 K~0.35 g/cm3, solid line! in the 1 molalNaCl solution confirm this. The two peaks ingoh(r ) corre-spond to the two hydrogen atoms of a water molecule infirst shell and the first peak is usually referred to as thedrogen bonding peak. As the temperature is increased,height of this peak decreases signaling a breakdown ofhydrogen bonding network. Both peaks in Fig. 3 are ashifted away from the central oxygen at the higher tempe
Downloaded 05 Jun 2004 to 130.111.64.68. Redistribution subject to AIP
1
le
se
e-hee
o-
tures. The bimodal distribution in Fig. 4 becomes broadehigh temperature with a shallower minimum betweenmaxima.
The peaks in these solvent distribution functions of amolal sodium chloride solution are at the same locationsthe corresponding peaks in pure water~not shown! for thesame model, but the peak heights are again slightly differThese differences must represent slight perturbations ofter structure by the sodium and chloride ions in a one mosodium chloride solution.
B. Solute–solvent atom distribution function
The solute–solvent atomic distribution functions for t1 molal NaCl solutions at 298 K and 683 K are displayedFigs. 5 and 6. The solvent densities at 298 K and 683 K0.997 g cm23 and 0.35 g cm23, respectively. Figures 7 andshow the corresponding distribution functions for the 0molal NaCl solutions at 683 K at solvent densities of 0.
.e-–lts
FIG. 7. Sodium–oxygen~solid line!and sodium–hydrogen~dashed line!radial distribution functions at 683 K~0.35 g cm23, 0.175 g/cm23! in a 0.5molal NaCl solution in SPC waterThe sodium–oxygen peaks are corrlated with the corresponding sodiumhydrogen peaks. Corresponding resufor one molal sodium chloride are inFig. 5~b!.
license or copyright, see http://jcp.aip.org/jcp/copyright.jsp

.r-
--
8131J. Chem. Phys., Vol. 113, No. 18, 8 November 2000 Simulation studies of aqueous sodium chloride
FIG. 8. Chloride–hydrogen~dashedline! and chloride–oxygen~solid line!radial distribution functions at 683 K~0.35 g/cm23, 0.175 g/cm23! in a 0.5molal NaCl solution in SPC waterThe chloride–hydrogen peaks are corelated with the correspondingchloride–oxygen peaks. Corresponding results for one molal sodium chloride are in Fig. 6~b!.
laee
fi-
catenno
s
eHd
hefir
om
n
atasa-res-
he
aity.en-
n-K.
en. 7lal
and 0.175 g cm23, respectively. The Na1 and Cl2 ion–solvent distribution functions in the 1 molal and 0.5 moNaCl solutions at 683 K are significantly different from thfunctions for the infinitely dilute solutions that are discusselsewhere22,23 and reproduced in Figs. 5~c! and 5~d!. In con-trast to this, the ion–solvent distribution functions at innitely dilution ~not shown! and in a 1 molal NaCl@Fig. 5~a!#solution remain essentially the same at 298 K. The implition is that sodium or chloride ions in NaCl solutions of finiconcentration at 683 K are in a completely different enviroment from the corresponding solutions at infinite dilutioWe will see that this is due to ion pairing and clusteringions in concentrated solutions at elevated temperatures.
As pointed out earlier, the solvent distribution functionat both temperatures~298 K and 683 K! are slightly per-turbed by added electrolyte, in contrast to the solute–solvdistribution functions. Although the first Na–O and Cl–peaks in the 683 K solution at infinite dilution are shifteonly slightly from their positions at room temperature, tpeak heights are different. The hydration numbers in the
Downloaded 05 Jun 2004 to 130.111.64.68. Redistribution subject to AIP
l
d
-
-.f
,
nt
st
shells of the sodium and chloride ions are calculated frEq. ~9!, with goo(r ) replaced bygio(r ), andRU given by theposition of the first minimum in this distribution functiowhich changes with temperature and solvent density.24 Thehydration numbers of ions in the 1 molal NaCl solutions298 K displayed in Table II remain essentially the samethe numbers at infinite dilution. This is not so for the hydrtion numbers calculated at 683 K, which decrease progsively with electrolyte concentration.
Figure 5~b! shows three prominent peaks at 683 K in tsodium oxygen~Na–O! and sodium hydrogen~Na–H! radialdistribution functions, with the peak of one correlated withcorresponding peak of the other that is in close proximThe three peaks indicate the presence of three differentvironments for Na1 ions in 1 molal sodium chloride. Like-wise, Fig. 6~b! shows the presence of three different enviroments for chloride atoms at 683 K, that are absent at 298Similar peak correlations are observed in the ion–oxygand ion–hydrogen distribution functions displayed in Figsand 8 for the sodium and chloride ions at 683 K in 0.5 mo
-t
e
--
FIG. 9. Sodium–chloride~solid line!,sodium–sodium ~dashed line!, andchloride–chloride~dotted line! radialdistribution functions at 683 K in a 1and 0.5 molal NaCl solution in SPCwater. The sodium–chloride distribution function shows a strong peak acontact ion distance of 2.1 Å. Note thprominent peaks in the sodium–sodium and chloride–chloride distribution functions that suggest ion clustering in these systems.
license or copyright, see http://jcp.aip.org/jcp/copyright.jsp
at
thpae
al.3s
w
5.thonnsdregaela0
usd-
35th
cioo
nsa
esatryrepn
atans-
or-
eiteel
fi-heis
o-sityn at
y aat
tslu-rre-
mbyveef-e-
on
igs.nes.
es,ngreen
ndre
o-
la-nsion.s
f atan
ents
lu-r.
ina-
8132 J. Chem. Phys., Vol. 113, No. 18, 8 November 2000 S. Koneshan and J. C. Rasaiah
sodium chloride solutions. We conclude that the immedienvironment of the Na1 and the Cl2 ions in a sodium chlo-ride solution of finite concentration~0.5 or one molal in con-centration! at ambient conditions changes dramatically astemperature is raised to 683 K. The reason for this is apent from examining the ion–ion distribution functions of thsodium chloride solutions.
C. Ion–ion distribution functions in sodium chloridesolutions
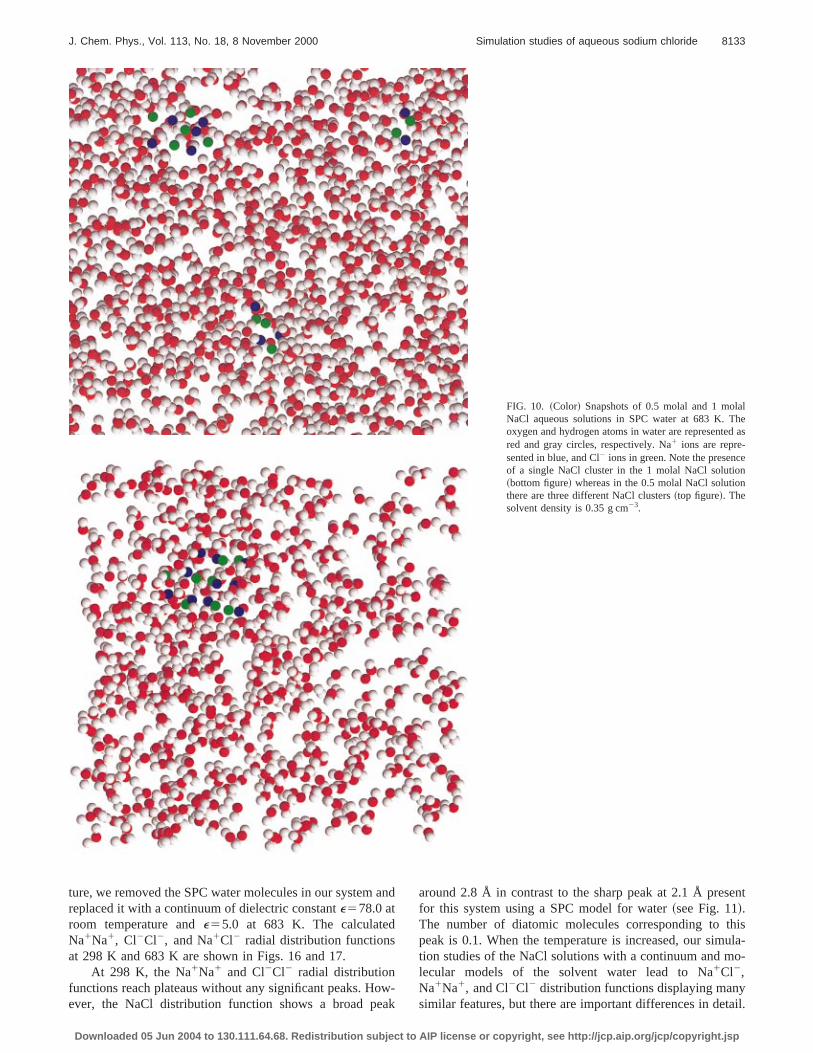
Figure 9 displays the sodium chloride~solid line!,sodium–sodium~dashed line!, and chloride–chloride~dottedline! distribution functions at 683 K in SPC water in 1 moland 0.5 molal solutions in which the solvent density is 0g cm23. The sodium chloride distribution function showthree broad peaks in the 1 molal NaCl solution and tpeaks~one broad and the other diffuse! in the 0.5 molalsolution. The number of Cl2 ions paired with a sodium ion inthe first, second, and third coordination shells are 3.5,and 1.5 in the 1 molal NaCl solution, and 2.3 and 1.1 infirst and second coordination shells of the 0.5 molal solutirespectively. The Na–Na and Cl–Cl distribution functioalso show peaks at nearly the same locations with smallferences in the heights of the peaks. This indicates the pence of significant amount of clustering of positive and netive ions that goes beyond simple ion pairing. It is confirmby snapshots of equilibrated configurations of the 1 moand 0.5 molal solutions of sodium chloride shown in Fig. 1where the sodium and chloride ions are seen to be obvioclustered together. In contrast to the single cluster foun683 K in the 1 molal NaCl solution, equilibrium configurations of 0.5 molal solutions at solvent densities of 0.g cm23 and 0.175 g cm23 shows at least three clusters wivarying amounts of Na1 and Cl2 ions.
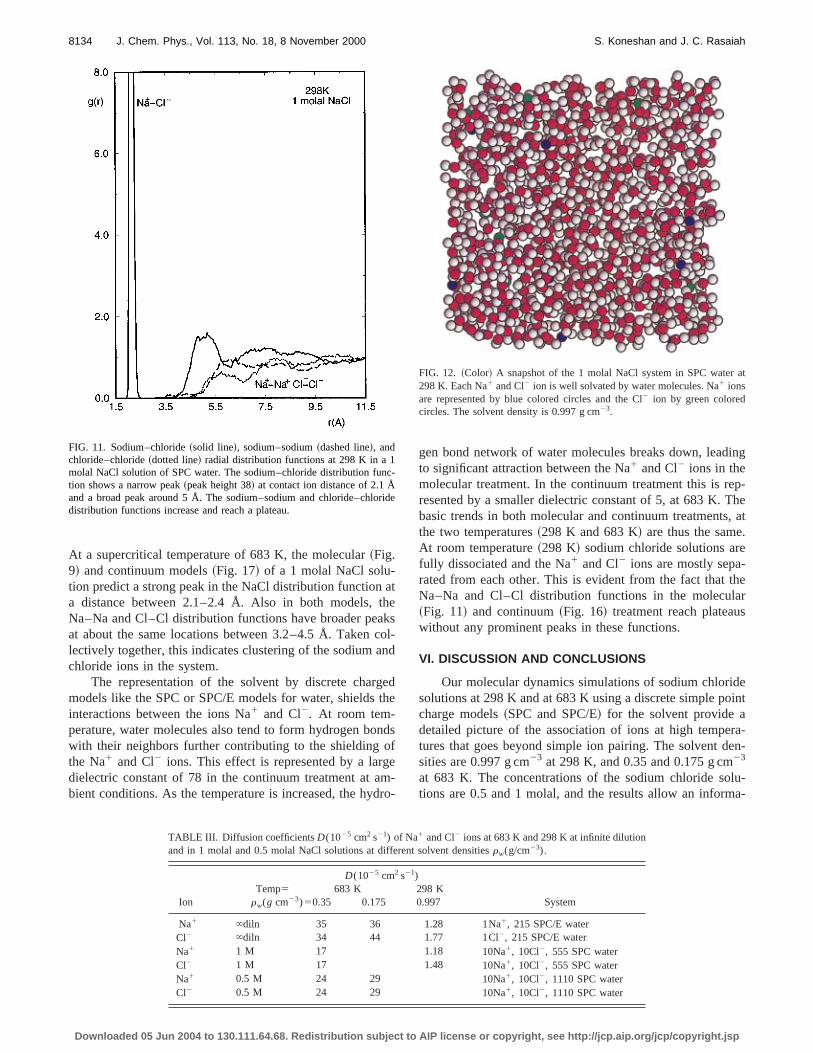
Figure 11 displays the corresponding distribution funtions and Fig. 12 a snapshot of an equilibrium configuratof the 1 molal NaCl solution at 298 K and solvent density0.997 g cm23. In this case, the sodium and chloride ioshow no evidence of significant ion pairing. The sharp pein the Na–Cl distribution function corresponds to the prence of a contact ion pair, but the number of pairs associwith this peak is only 0.1 showing that this is indeed vesmall. The second peak in this distribution function corsponds to the presence of a single solvent separated ionat equilibrium. Beyond this point, the Na–Cl distributiofunction reaches a plateau at large distances of separbetween the ions. Our studies agree with OelkersHegelson’s32 prediction of multiple ion association and cluter formation in supercritical aqueous electrolytes.
IV. DIFFUSION COEFFICIENT
In this section we discuss the diffusion coefficientsthe Na1 and Cl2 ions calculated from the velocity autocorelation functions v(t).v(0)& using the relation
D51
3 E0
`
^v~ t !.v~0!&dt. ~10!
Downloaded 05 Jun 2004 to 130.111.64.68. Redistribution subject to AIP
e
er-
5
o
0,e,
if-s--
dl,lyat
-nf
k-ed
-air
iond
f
We compare the diffusion coefficients in Table III with thcorresponding values for sodium and chloride ions at infindilution in water at 683 K and 298 K using the same modpotentials.22,23,33–35
Table III indicates large increases in diffusion coefcients of sodium and chloride ions with temperature. Tdecrease in the diffusion coefficient with salt concentrationrelatively greater at 683 K than at 298 K. The diffusion cefficients of the ions increase with decreasing solvent denas seen from the two sets of results for a 0.5 molal solutio683 K.
The diffusion coefficients of Na1 and Cl2 ions in a 1molal NaCl solution at 683 K are the same and smaller bfactor of 2 than the diffusion coefficients of the same ionsinfinite dilution at 683 K. The average diffusion coefficienof the sodium and chloride ions in the 0.5 molal NaCl sotions at 683 K are also the same and smaller than the cosponding values at infinite dilution.
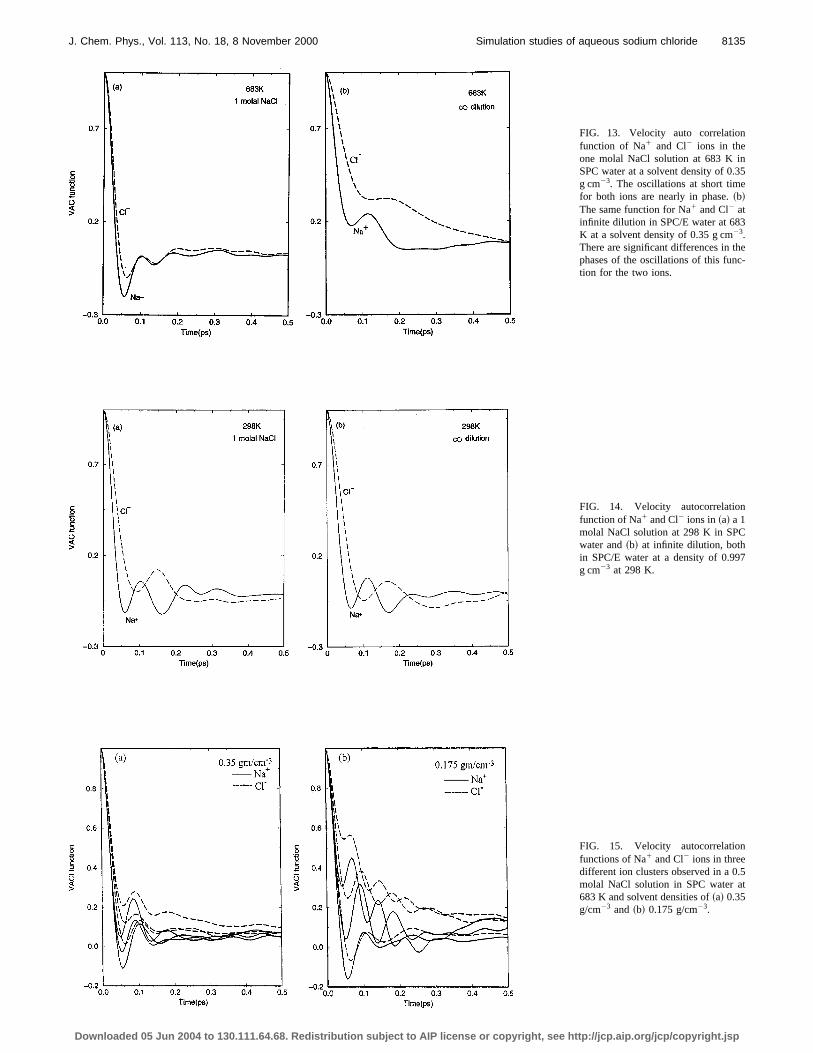
The equality of the diffusion coefficients of the sodiuand chloride ions in the one molal solution is explainedthe formation of a cluster of these ions which tends to motogether as a whole, leading also to a lower diffusion coficient. This is further supported by the similarity of the vlocity autocorrelation functions of Na1 and Cl2 in 1 molalNaCl solution at 683 K shown in Fig. 13~a! in contrast to thecorresponding functions for the single ions at infinite dilutiat the same temperature depicted in Fig. 13~b!. Note the sig-nificant differences between the two systems shown in F13~a! and 13~b!. The decay in the velocity auto correlatiofunctions at short times are also different in the two figurThe reason is that at infinite dilution the Na1 and the Cl2
ions are moving in the solvation shells of water moleculwhile in the 1 molal sodium chloride the ions are oscillatiin a cluster of Na1 and Cl2 ions that also contains watemolecules. Figure 14 makes the same comparisons betwthe velocity autocorrelation functions of Na1 and Cl2 for thesame systems~1 molal NaCl solution and infinitely dilutesolutions! but at 298 K. In this case clustering is absent athe velocity autocorrelation functions of the two ions avery different in both the one molal and infinitely dilute slutions.
There is one caveat concerning the velocity autocorretion functions of the ions in concentrated NaCl solutiodepicted in Figs. 13 and 14 which are averages for eachThe velocity auto correlation functions of the individual ionat 0.5 molal as displayed in Figs. 15~a! and 15~b! can begrouped into three categories indicating the presence oleast three different clusters, with varying amounts of N1
and Cl2. They correspond to the ions in three different ioclusters that are found in the 0.5 molal solution at a solvdensity of 0.35 g cm23 shown in Fig. 10. Similar conclusionapply to the solutions at the same molality~0.5 molal! but ata solvent density of 0.175 g cm23. In contrast to this we findonly a single cluster in the one molal sodium chloride sotion at 683 K in the discrete SPC solvent model for wate
V. SIMULATIONS IN A CONTINUUM SOLVENT
To further understand the transformations that occurthe 1 molal sodium chloride solution with rise in temper
license or copyright, see http://jcp.aip.org/jcp/copyright.jsp
8133J. Chem. Phys., Vol. 113, No. 18, 8 November 2000 Simulation studies of aqueous sodium chloride
FIG. 10. ~Color! Snapshots of 0.5 molal and 1 molalNaCl aqueous solutions in SPC water at 683 K. Theoxygen and hydrogen atoms in water are represented asred and gray circles, respectively. Na1 ions are repre-sented in blue, and Cl2 ions in green. Note the presenceof a single NaCl cluster in the 1 molal NaCl solution~bottom figure! whereas in the 0.5 molal NaCl solutionthere are three different NaCl clusters~top figure!. Thesolvent density is 0.35 g cm23.
a
wa
ent
hisula-o-
tail.
ture, we removed the SPC water molecules in our systemreplaced it with a continuum of dielectric constante578.0 atroom temperature ande55.0 at 683 K. The calculatedNa1Na1, Cl2Cl2, and Na1Cl2 radial distribution functionsat 298 K and 683 K are shown in Figs. 16 and 17.
At 298 K, the Na1Na1 and Cl2Cl2 radial distributionfunctions reach plateaus without any significant peaks. Hoever, the NaCl distribution function shows a broad pe
Downloaded 05 Jun 2004 to 130.111.64.68. Redistribution subject to AIP
nd
-k
around 2.8 Å in contrast to the sharp peak at 2.1 Å presfor this system using a SPC model for water~see Fig. 11!.The number of diatomic molecules corresponding to tpeak is 0.1. When the temperature is increased, our simtion studies of the NaCl solutions with a continuum and mlecular models of the solvent water lead to Na1Cl2,Na1Na1, and Cl2Cl2 distribution functions displaying manysimilar features, but there are important differences in de
license or copyright, see http://jcp.aip.org/jcp/copyright.jsp
athakcon
geth
nofgemdr
ing
ep-he, at.
-thears
deint
ra-en-
lu-a-
at
nc
ri
8134 J. Chem. Phys., Vol. 113, No. 18, 8 November 2000 S. Koneshan and J. C. Rasaiah
At a supercritical temperature of 683 K, the molecular~Fig.9! and continuum models~Fig. 17! of a 1 molal NaCl solu-tion predict a strong peak in the NaCl distribution functiona distance between 2.1–2.4 Å. Also in both models,Na–Na and Cl–Cl distribution functions have broader peat about the same locations between 3.2–4.5 Å. Takenlectively together, this indicates clustering of the sodium achloride ions in the system.
The representation of the solvent by discrete charmodels like the SPC or SPC/E models for water, shieldsinteractions between the ions Na1 and Cl2. At room tem-perature, water molecules also tend to form hydrogen bowith their neighbors further contributing to the shieldingthe Na1 and Cl2 ions. This effect is represented by a lardielectric constant of 78 in the continuum treatment at abient conditions. As the temperature is increased, the hy
FIG. 11. Sodium–chloride~solid line!, sodium–sodium~dashed line!, andchloride–chloride~dotted line! radial distribution functions at 298 K in a 1molal NaCl solution of SPC water. The sodium–chloride distribution fution shows a narrow peak~peak height 38! at contact ion distance of 2.1 Åand a broad peak around 5 Å. The sodium–sodium and chloride–chlodistribution functions increase and reach a plateau.
Downloaded 05 Jun 2004 to 130.111.64.68. Redistribution subject to AIP
tesl-
d
de
ds
-o-
gen bond network of water molecules breaks down, leadto significant attraction between the Na1 and Cl2 ions in themolecular treatment. In the continuum treatment this is rresented by a smaller dielectric constant of 5, at 683 K. Tbasic trends in both molecular and continuum treatmentsthe two temperatures~298 K and 683 K! are thus the sameAt room temperature~298 K! sodium chloride solutions arefully dissociated and the Na1 and Cl2 ions are mostly separated from each other. This is evident from the fact thatNa–Na and Cl–Cl distribution functions in the molecul~Fig. 11! and continuum~Fig. 16! treatment reach plateauwithout any prominent peaks in these functions.
VI. DISCUSSION AND CONCLUSIONS
Our molecular dynamics simulations of sodium chlorisolutions at 298 K and at 683 K using a discrete simple pocharge models~SPC and SPC/E! for the solvent provide adetailed picture of the association of ions at high tempetures that goes beyond simple ion pairing. The solvent dsities are 0.997 g cm23 at 298 K, and 0.35 and 0.175 g cm23
at 683 K. The concentrations of the sodium chloride sotions are 0.5 and 1 molal, and the results allow an inform
FIG. 12. ~Color! A snapshot of the 1 molal NaCl system in SPC water298 K. Each Na1 and Cl2 ion is well solvated by water molecules. Na1 ionsare represented by blue colored circles and the Cl2 ion by green coloredcircles. The solvent density is 0.997 g cm23.
-
de
TABLE III. Diffusion coefficientsD(1025 cm2 s21) of Na1 and Cl2 ions at 683 K and 298 K at infinite dilutionand in 1 molal and 0.5 molal NaCl solutions at different solvent densitiesrw(g/cm23).
D(1025 cm2 s21)Temp5 683 K 298 K
Ion rw(g cm23)50.35 0.175 0.997 System
Na1 `diln 35 36 1.28 1Na1, 215 SPC/E waterCl2 `diln 34 44 1.77 1Cl2, 215 SPC/E waterNa1 1 M 17 1.18 10Na1, 10Cl2, 555 SPC waterCl2 1 M 17 1.48 10Na1, 10Cl2, 555 SPC waterNa1 0.5 M 24 29 10Na1, 10Cl2, 1110 SPC waterCl2 0.5 M 24 29 10Na1, 10Cl2, 1110 SPC water
license or copyright, see http://jcp.aip.org/jcp/copyright.jsp
5
e-
7
5t
8135J. Chem. Phys., Vol. 113, No. 18, 8 November 2000 Simulation studies of aqueous sodium chloride
FIG. 13. Velocity auto correlationfunction of Na1 and Cl2 ions in theone molal NaCl solution at 683 K inSPC water at a solvent density of 0.3g cm23. The oscillations at short timefor both ions are nearly in phase.~b!The same function for Na1 and Cl2 atinfinite dilution in SPC/E water at 683K at a solvent density of 0.35 g cm23.There are significant differences in thphases of the oscillations of this function for the two ions.
FIG. 14. Velocity autocorrelationfunction of Na1 and Cl2 ions in~a! a 1molal NaCl solution at 298 K in SPCwater and~b! at infinite dilution, bothin SPC/E water at a density of 0.99g cm23 at 298 K.
FIG. 15. Velocity autocorrelationfunctions of Na1 and Cl2 ions in threedifferent ion clusters observed in a 0.molal NaCl solution in SPC water a683 K and solvent densities of~a! 0.35g/cm23 and ~b! 0.175 g/cm23.
Downloaded 05 Jun 2004 to 130.111.64.68. Redistribution subject to AIP license or copyright, see http://jcp.aip.org/jcp/copyright.jsp

idensideith
iro-resw-
fer-nd 1
at-1etala
olu-0.5Kizeby
c-
elsns.meionthatentn-s-ra-
stri-hesa
ersisla-
bu-nstem.attri-in.eps
u-
,ged
atby
n-int
ithdin
umts.35
otionlve
8136 J. Chem. Phys., Vol. 113, No. 18, 8 November 2000 S. Koneshan and J. C. Rasaiah
FIG. 16. Sodium–chloride~solid line!, sodium–sodium~dashed line!, andchloride–chloride~dotted line! distribution functions in a 1 molal sodiumchloride solution at 298 K, with a continuum treatment of the solvent wan effective dielectric constant of 78. Figure 11 shows the corresponresults for SPC water at a solvent density of 0.997 g/cm23.
FIG. 17. Sodium–chloride~solid line!, sodium–sodium~dashed line!, andchloride–chloride~dotted line! distribution functions in a 1 molal sodiumchloride solution at 683 K in which the solvent is treated as a continuwith a dielectric constant of 5. Figure 9~a! shows the corresponding resulfor 1 molal sodium chloride in SPC water at a solvent density of 0g cm23. The strong peak at contact in the Na1–Cl2 distribution functionsoccur at the same distance in both figures, but the peak heights anddetails of the structure differ. The Na–Na and Cl–Cl radial distributfunctions show peaks at approximately the same locations for both somodels but the peaks are less prominent in the continuum model.
Downloaded 05 Jun 2004 to 130.111.64.68. Redistribution subject to AIP
tive comparison with the properties of sodium and chlorions in aqueous solutions at infinite dilution. Comparisoare also made with simulations of one molal sodium chlorat 683 K and 298 K, using continuum solvent models wdielectric constants of 5 and 78, respectively.
We find similar qualitative behavior of the solute padistribution functions in our simulations of sodium and chlride ions in concentrated solutions at ambient temperatuusing both discrete and continuum molecular solvent. Hoever, at supercritical temperatures, there is significant difence between these systems. The simulations of 0.5 amolal sodium chloride solutions in SPC water show Na1 andCl2 ions clustering together with water molecules participing in cluster formation. The ions in our simulation of amolal solution of sodium chloride formation a single largcluster of ten sodium and ten chloride ions equal to the tonumber of ions in our system which tend to diffuse assingle entity. This may correspond to a supersaturated stion. After a 200 ps production run, snapshots of themolal NaCl solutions at two different solvent densities 683reveal the presence of three ion clusters of different ssolvated by water molecules. This picture is supportedcalculations of the individual velocity autocorrelation funtions of the ions.
At both temperatures~298 K and 683 K!, the ion distri-bution functions of continuum and molecular solvent modof ionic solutions have peaks at nearly the same locatioHowever, the peak heights in the two models of the saelectrolyte solution are different, and the amount of thepairing in the molecular treatment is always greater thanof the continuum treatment. This suggests that the solvmolecules also participate in cluster formation and cotinuum models oversimplify the nature of pairing and clutering in ionic solutions especially at supercritical tempetures.
We have observed that the peak heights in these dibution functions at 683 K changed back and forth with tsimulation time but the ion solvent distribution functionNaO, ClO, NaH, ClH, etc. are very stable. This could bemanifestation of the break down and reformation of clustthat occur during the time scale of our simulations whichabout 200 ps and the small number of ions in our simutions. In order to get better averages of the ion–ion distrition functions, it would be necessary to perform simulatiofor at least a several nanoseconds using a larger sysHowever, this may add only little new information to whwe already have, since the fluctuations in the ion–ion disbution functions over shorter time scales would still remaAll of the ion–solvent distribution functions at 683 K on thother hand were stable and reproducible in shorter 200runs.
Our studies are in accord with molecular dynamics simlations of Driesneret al.24 and Testeret al.25,26 of the equi-librium properties of Na1 and Cl2 ions in aqueous solutionswhich also suggested ion pairs, triplets and larger charand uncharged clusters of varying size in NaCl solutionssupercritical temperatures. We have complemented thisinvestigating the diffusion coefficients of ions in concetrated solutions of sodium chloride using discrete po
g
her
nt
license or copyright, see http://jcp.aip.org/jcp/copyright.jsp

viuundluntia-.na
3
em
elt
E
terna
. JJ.
nd.
m.
innce1999.s.
cta
T.
ens.
.
hys.
oc.
8137J. Chem. Phys., Vol. 113, No. 18, 8 November 2000 Simulation studies of aqueous sodium chloride
charge models for the solvent and by studying the behaof these solutions when the solvent is treated as a contindielectric. Our simulations lend support to Oelkers aHelgeson’s32 predictions of multiple ion association ancluster formation in supercritical aqueous electrolyte sotions. These predictions are based on experimeevidence1,36,37 and free energy minimization of an assoction model of ions in a structureless low dielectric medium32
A detailed molecular theory that explains the structure adynamics of these solutions including cluster formation hyet to be developed.
ACKNOWLEDGMENT
This study was supported by Grant No. CHE-99613from the National Science Foundation.
1~a! A. S. Quist and W. L. Marshall, J. Phys. Chem.72, 684 ~1968!; 72,1545~1968!; ~b! L. A. Dunn and W. L. Marshall,ibid. 73, 723~1969!; ~c!J. D. Frantz and W. L. Marshall, Am. J. Sci.282, 1666~1982!.
2R. H. Wood, M. S. Gruszkiewicz, and G. H. Zimmerman, J. Phys. Ch99, 11612~1995!.
3D. P. Fernandez, A. R. H. Goodwin, E. W. Lemmon, J. M. H. LevSengers, and R. C. Williams, J. Phys. Chem. Ref. Data26, 1125~1997!.
4~a! R. D. Mountain and A. Wallquist ‘‘Collection of Results for SPC/water,’’ NISTR Report No. 5778, 1996;~b! A. Wallquist and R. Moun-tain, Rev. Comput. Chem.13, 183 ~1999!.
5S. T. Cui and J. G. Harris, J. Phys. Chem.99, 2900~1995!.6M. Neumann, inPhysical Chemistry of Aqueous Solutions, edited by H. J.White Jr., J. V. Sengers, D. V. Neumann, and J. C. Bellows~BegellHouse, New York, 1995!.
7~a! Y. Guissiani and B. Guillot, J. Chem. Phys.99, 3049 ~1993!; ~b! B.Guillot and Y. Guissiani,ibid. 98, 728 ~1994!.
8H. L. Friedman,A Course in Statistical Mechanics~Prentice–Hall, Engle-wood Cliffs, 1985!.
9~a! H. Luo and S. Tucker, Theor. Chem. Acc.96, 84 ~1997!; ~b! S. Tuckerand M. W. Maddox, J. Phys. Chem. B102, 2537~1998!.
10~a! P. J. Rossky and K. P. Johnston, ‘‘Chemistry in supercritical waInsights from theory and simulation,’’ in Proceedings of the InternatioConference on the Properties of Water and Steam, Toronto, 1999;~b! G.E. Bennet, P. J. Rossky, and K. P. Johnston, J. Phys. Chem.99, 16136~1995!; ~c! L. W. Flanagan, P. B. Balbuena, K. P. Johnston, and PRossky,ibid. 99, 5196 ~1995!; ~d! P. B. Bulbuena, K. P. Johnston, P.Rossky, and J-K. Lee, J. Phys. Chem. B102, 3806~1998!.
11~a! A. A. Chialvo, P. T. Cummings, H. D. Cochran, J. M. Simonson, aR. E. Mesmer, J. Chem. Phys.103, 9379~1995!, and references therein
12~a! L. X. Dang and B. M. Pettitt, J. Phys. Chem.94, 4303~1990!; ~b! D.E. Smith and L. X. Dang, J. Chem. Phys.100, 3757~1994!.
Downloaded 05 Jun 2004 to 130.111.64.68. Redistribution subject to AIP
orm
d
-al
ds
6
.
:l
.
13~a! R. Rey and E. Guardia, J. Phys. Chem.96, 4712 ~1992!; ~b! E.Guardia, R. Rey, and J. A. Padro, Chem. Phys.155, 187 ~1991!; ~c! R.Rey, E. Guardia, and J. A. Padro, J. Chem. Phys.97, 1343~1992!.
14~a! M. Berkowitz, A. Kairim, J. A. McCammon, and P. J. Rossky, ChePhys. Lett.105, 577 ~1984!; ~b! A. C. Belch, M. Berkowitz, and J. A.McCammon, J. Am. Chem. Soc.108, 1755~1986!; ~c! O. A. Karim and J.A. McCammon,ibid. 108, 1762~1986!; ~d! O. A. Karim and J. A. Mac-Cammon, Chem. Phys. Lett.132, 219 ~1986!; ~e! J. A. MacCammon, O.A. Karim, T. P. Lybrand, and C. F. Wong, Ann. N.Y. Acad. Sci.482, 210~1986!.
15P. L. Geissler, G. Dellago, and D. Chandler, J. Phys. Chem.103, 3706~1999!.
16~a! M. Fisher, J. Stat. Phys.75, 1 ~1994!; ~b! J. Phys.: Condens. Matter.8,9103 ~1996!.
17G. Stell, J. Stat. Phys.78, 197 ~1995!.18J. M. H. Levelt Sengers and J. A. Given, Mol. Phys.80, 899 ~1993!.19M. A. Anisimov and J. V. Sengers, ‘‘Crossover critical phenomena
aqueous solutions,’’ in Proceedings of the 13th International Confereon the Properties of Water and Steam, Toronto, Canada, September,
20V. M. Nabutovskii, N. A. Memov, and Yu. G. Peisakovich, Sov. PhyJETP51, 1111~1980!.
21J. S. Ho”ye and G. Stell, J. Phys. Chem.94, 7899~1990!.22J. C. Rasaiah, J. P. Noworyta, and S. Koneshan, J. Am. Chem. Soc.~sub-
mitted!.23J. P. Noworyta, S. Koneshan, and J. C. Rasaiah, J. Am. Chem. Soc.~sub-
mitted!.24T. Driesner, T. M. Steward, and I. G. Tironi, Geochim. Cosmochim. A
62, 3096~1998!.25J. W. Tester, P. A. Marrone, M. M. DiPippo, K. Sako, M. T. Reagan,
Arias, and W. A. Peters, J. Supercrit. Fluids13, 225 ~1998!.26M. T. Reagan, J. G. Harris, and J. W. Tester, J. Phys. Chem. B103, 7936
~1999!.27~a! G. Hummer, D. M. Soumpasis, and M. Neumann, J. Phys.: Cond
Matter 6, A141 ~1994!; ~b! Mol. Phys.81, 115 ~1994!.28J. V. Sengers and J. M. H. Levelt-Sengers, Annu. Rev. Phys. Chem37,
189 ~1986!.29B. M. Pettit and P. J. Rossky, J. Chem. Phys.84, 5836~1986!.30M. L. Huggins and J. E. Mayer, J. Chem. Phys.1, 509 ~1933!.31~a! L. X. Dang, Chem. Phys. Lett.200, 21 ~1992!; ~b! L. X. Dang and B.
C. Garrett, J. Chem. Phys.99, 2972~1993!; ~c! L. X. Dang and P. Koll-mann, J. Phys. Chem.99, 55 ~1995!; ~d! L. X. Dang, J. Am. Chem. Soc.117, 6954~1995!; ~e! L. X. Dang, J. Chem. Phys.102, 3483~1995!.
32E. H. Oelkers and H. C. Helgeson, Science261, 888 ~1993b!, and refer-ences therein.
33S. H. Lee and J. C. Rasaiah, J. Phys. Chem.100, 1420~1996!.34S. Koneshan, J. C. Rasaiah, R. M. Lynden-Bell, and S. H. Lee, J. P
Chem.102, 4193~1998!.35S. Koneshan, J. C. Rasaiah, and R. M. Lynden-Bell, J. Am. Chem. S
120, 12041~1998!.36E. U. Franck, Phys. Chem.8, 92 ~1956!.37G. Ritzert and E. U. Frank, Ber. Bunsenges. Phys. Chem.72, 798 ~1968!.
license or copyright, see http://jcp.aip.org/jcp/copyright.jsp