The Economics of the Back End of the Nuclear Fuel … · 2017-07-14 · The Economics of the Back...
14
© 2016 Nuclear Energy Agency Nuclear Energy Agency The Economics of the Back End of the Nuclear Fuel Cycle Geoffrey ROTHWELL, PhD, Principal Economist Nuclear Energy Agency, Division of Nuclear Development Organisation for Economic Cooperation and Development [email protected] Topical Meeting under the Joint Convention Challenges and Responsibilities of Multinational Radioactive Waste Disposal Facilities International Atomic Energy Agency (IAEA), Vienna-VIC 5-7 September 2016
Transcript of The Economics of the Back End of the Nuclear Fuel … · 2017-07-14 · The Economics of the Back...

© 2016 Nuclear Energy Agency
Nuclear Energy Agency
The Economics of the Back End
of the Nuclear Fuel Cycle
Geoffrey ROTHWELL, PhD, Principal Economist
Nuclear Energy Agency, Division of Nuclear Development
Organisation for Economic Cooperation and Development
Topical Meeting under the Joint Convention
Challenges and Responsibilities of
Multinational Radioactive Waste Disposal Facilities
International Atomic Energy Agency (IAEA), Vienna-VIC
5-7 September 2016

© 2016 Nuclear Energy Agency
NEA, The Economics of the Back End of the
Nuclear Fuel Cycle (2013) Paris: OECD.
A study by the Division of Nuclear
Development of the Nuclear Energy Agency
of the OECD:
Chapter 1. Introduction: Management of
radioactive waste in NEA member countries
Chapter 2. Description of various options and
current SNF/HLW management policies
Chapter 3. Modelling the economics of back-end
options
3.1. Discussion of key quantitative economic
parameters and factors
3.2. High-level estimates of key cost
parameters for near-term, back-end strategies
3.3. Overview and comparison of existing
studies on the economics of the back end
Chapter 4. Other factors influencing back-end
options
Chapter 5. Summary, conclusions and
recommendations
http://www.oecd-
nea.org/ndd/pubs/2013/7061-
ebenfc.pdf/ 2

© 2016 Nuclear Energy Agency
3
Figure 3.4: Time profiles for implementing
direct disposal and partial recycling strategies
2010 2030 2050 2070 2090 2110 2130
Interim storage of spent MOX
Reprocessing of UOX
MOX fabricaiton
Encapsulation of spent MOX and REPUOX
HLW vitrification
Final disposal
Interim storage of spent UOX
Encapsulation
Final disposal
NPP operation
Rec
yclin
g of
SN
FD
irect
dis
posa
lN
PP
Construction of facilities Operation Closure/decommissioning

© 2016 Nuclear Energy Agency
4
• Overnight cost of facilities
• O&M costs
Input dataFunction
of capacity Data
parameterisationBack-end scenarios
per MWh, per kgHM
Levelised costs:
Generic front-end data:
• Cost of Uranium
• Enrichment cost, etc
Economic assumptions:
• Discount rate
• Size of the system, etc.
© 2016 Nuclear Energy Agency
Updated Objective and References
5
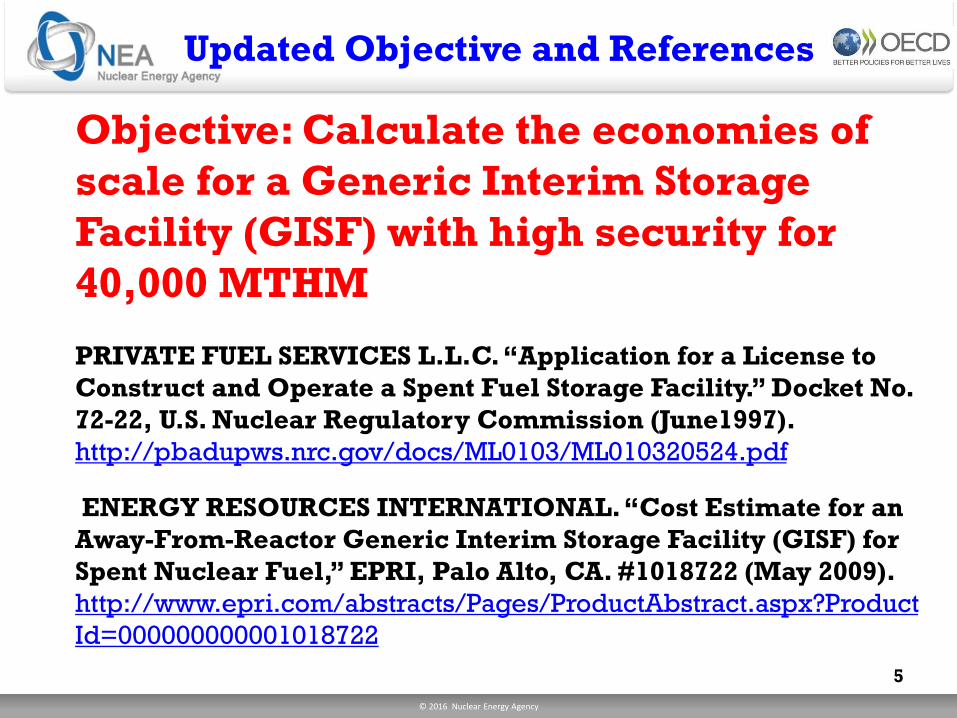
Objective: Calculate the economies of
scale for a Generic Interim Storage
Facility (GISF) with high security for
40,000 MTHM
PRIVATE FUEL SERVICES L.L.C. “Application for a License to
Construct and Operate a Spent Fuel Storage Facility.” Docket No.
72-22, U.S. Nuclear Regulatory Commission (June1997).
http://pbadupws.nrc.gov/docs/ML0103/ML010320524.pdf
ENERGY RESOURCES INTERNATIONAL. “Cost Estimate for an
Away-From-Reactor Generic Interim Storage Facility (GISF) for
Spent Nuclear Fuel,” EPRI, Palo Alto, CA. #1018722 (May 2009).
http://www.epri.com/abstracts/Pages/ProductAbstract.aspx?Product
Id=000000000001018722

© 2016 Nuclear Energy Agency
Private Fuel Services Facility
6
The following analysis is based on the Private Fuel Services Facility
(PFSF) in Skull Valley, Utah; see US NRC, Final Environmental Impact
Statement for the Construction and Operation of an Independent Spent
Fuel Storage Installation on the Reservation of the Skull Valley Band of
Goshute Indians and the Related Transportation Facility in Tooele County,
Utah, NUREG-1714, Office of Nuclear Material Safety and Safeguards,
Washington, DC (December 2001).
Much of the expected cost information is from PFS, “Private Fuel Storage
Facility License Application” (1999). PFS was owned by eight U.S.
electric utilities with its headquarters in La Crosse, Wisconsin.
On February 21, 2006, the US NRC issued a license to PFS to build and
operate a 40,000 Metric Tons of Heavy Metal (MTHM, 4,000-cask, 500-
pad) facility, where each cask holds 10 MTHM with a 100 m2 footprint
inside a 40 hectare storage area on approximately 360 hectares —>

© 2016 Nuclear Energy Agency
Artist Rendition of Private Storage Facility
7
http://www.deq.utah.gov/Pollutants/H/highlevelnw/opposition
/docs/2006/05May/LEG_PFS_051706.pdf

© 2016 Nuclear Energy Agency
GISF with high security
for 40,000 MTHM: Capital Costs
8
No No No
Access Access Access
40 hectares 40 hectares 40 hectares
No 40,000 MTHM No
Access in 4,000 casks Access
40 hectares on 40 hectares 40 hectares
rail access Secure Access No No
Guard House* Most Buildings Access Access
road access 40 hectares 40 hectares 40 hectares
Rothwell, “Scale Economies in a Series of Generic Interim SNF Storage Facilities,” Proceedings of the
International Congress on Advances in Nuclear Power Plants, ICAPP 2015, Nice, France (May 3-5, 2015).

© 2016 Nuclear Energy Agency
GISF Organizational Chart:
Operations and Maintenance Costs
9
Guidance Document for Measuring Employment Generated by the Nuclear Power Sector,
Nuclear Energy Agency, NEA, and International Atomic Energy Agency (September 2016).
"Administration" Sector = 17 "Protection" Sector = 35
12 Adm 4 Office 1 General 1 Quality 1 Quality
Staff Managers Manager Assurance Assurance
Officer Auditor
1 Lead 1 Lead 1 Chief 1 Radiation 1 Emergency 1 Security
Nuclear Instrument/ Mechanic Protection Prep Captain
Engineer Electrician Manager Coordinator
4 Nuclear 3 Shift 0 Chief 3 Shift 3 Shift
& other Supervisors Canister Supervisors Supervisors
Engineers Mechanic
Minimum
"Production" Total
Sector = 6 Instrument 12 Supervisors 6 Radiation Number of 18 Security
28 & Electrical and Protection Employees Guards
Technicians Mechanics Technicians 80

© 2016 Nuclear Energy Agency
Total and Average Cost
10
Total Cost = Fixed Cost (potential output)
+ Variable Cost (actual output)
Average Cost = Total Cost/Output
= Fixed Cost/Output + Variable Cost/Output
= Average Fixed Cost + Average Variable Cost
If Fixed Cost is zero, then unit cost is equal to Average
Variable Cost, and Average Cost is equal for each unit.
If Variable Cost is zero, then unit cost is equal to
Average Fixed Cost, and Average Cost declines with
each additional unit. This is the case for much of the
nuclear fuel cycle!

© 2016 Nuclear Energy Agency
Minimum Efficient Scale (MSE)
11
$0
$100
$200
$300
$400
$500
0 10 20 30 40 50 60 70 80 90 100 110 120
$/
un
it
Max Capacity
MES increases with fixed cost
Minimum Efficient Scale =
MES = where unit cost is within 10% of
hypothetical asymptotic value
10%

© 2016 Nuclear Energy Agency
GISF Scale Economies
12
Rothwell, “Scale Economies in a Series of Generic Interim SNF Storage Facilities,” Proceedings of the
International Congress on Advances in Nuclear Power Plants, ICAPP 2015, Nice, France (May 3-5, 2015).
$0
$100
$200
$300
$400
$500
0 10 20 30 40 50 60 70 80 90 100 110 120
$/
kg
Max MTHM
Levelized Cost (Average Cost) with High Security
Levelized Cost
without High Security
MES =50,000 MTHM
without High Security
$138
$148
MES =110,000 MTHM
with High Security
MES = Minimum Efficient Scale
MES < 90% x Asymptotic Value
© 2016 Nuclear Energy Agency
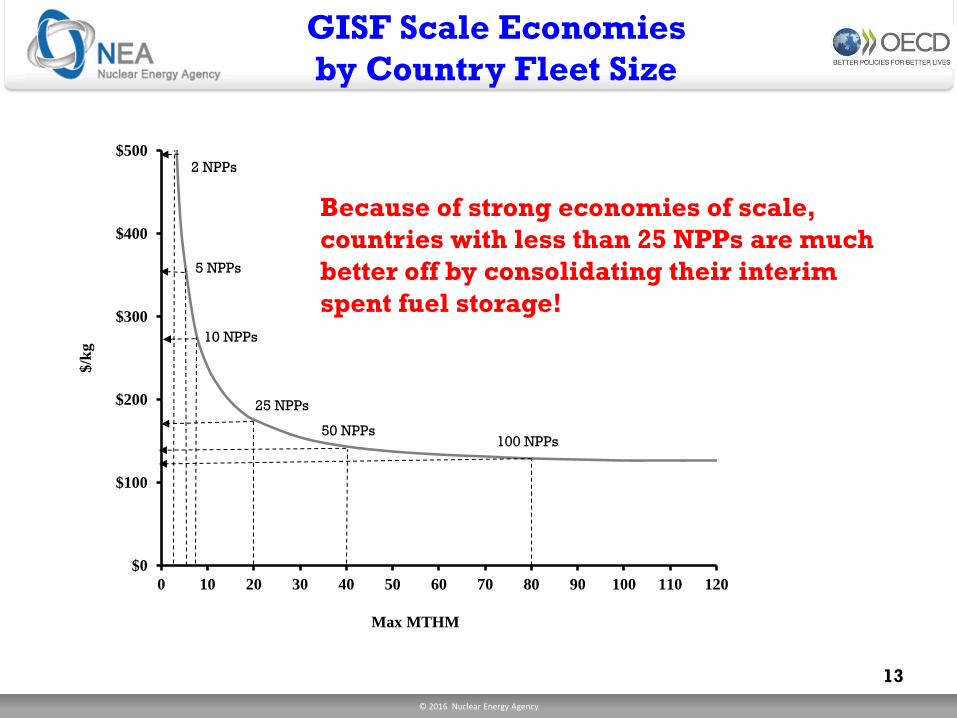
GISF Scale Economies
by Country Fleet Size
13
$0
$100
$200
$300
$400
$500
0 10 20 30 40 50 60 70 80 90 100 110 120
$/k
g
Max MTHM
5 NPPs
10 NPPs
2 NPPs
25 NPPs
50 NPPs 100 NPPs
Because of strong economies of scale,
countries with less than 25 NPPs are much
better off by consolidating their interim
spent fuel storage!

© 2016 Nuclear Energy Agency
The Economics of the Back End
of the Nuclear Fuel Cycle
This is only one segment in determining the total
economics of the back end of the nuclear fuel cycle!
Much of the back end (as well as the front end) is
capital intensive, hence there are high fixed costs
and positive economies of scale, implying that the
larger the facility, the lower are the per unit costs.
Beyond this analysis, we have the economic problem
of how to determine the value of the benefits. What
most analyses do, instead, is calculate the cost
difference between various back end options, such
as once-thru, twice-thru, or complete recycle.
What are these benefits? We need a consensus!