Nuclear Fuel Cycle Simulation System (VISTA) · 2007-03-20 · Nuclear Fuel Cycle Simulation System...
102
IAEA-TECDOC-1535 Nuclear Fuel Cycle Simulation System (VISTA) February 2007
Transcript of Nuclear Fuel Cycle Simulation System (VISTA) · 2007-03-20 · Nuclear Fuel Cycle Simulation System...

IAEA-TECDOC-1535
Nuclear Fuel Cycle Simulation System (VISTA)
February 2007
IAEA-TECDOC-1535
Nuclear Fuel Cycle Simulation System (VISTA)
February 2007
The originating Section of this publication in the IAEA was:
Nuclear Fuel Cycle and Materials Section International Atomic Energy Agency
Wagramer Strasse 5 P.O. Box 100
A-1400 Vienna, Austria
NUCLEAR FUEL CYCLE SIMULATION SYSTEM (VISTA) IAEA, VIENNA, 2007 IAEA-TECDOC-1535 ISBN 92–0–115806–8
ISSN 1011–4289 © IAEA, 2007
Printed by the IAEA in Austria February 2007

FOREWORD
As early as the 1970s, the International Atomic Energy Agency has seen the need to be able to estimate nuclear energy and its correlated needs for uranium and services required for different nuclear fuel cycle strategies. The early tools were able to provide estimates on uranium and fuel cycle service requirements, but were limited to the open nuclear fuel cycle strategy.
It was the international symposium Nuclear Fuel Cycle and Reactor Strategies: Adjusting to New Realities, held in 1997 (IAEA-TECDOC-990), which required additional estimates. Those were based on different reactor and fuel cycle strategies; most important is the inclusion of the reprocessing-recycling strategies. A new model has been developed and the Nuclear Fuel Cycle Simulation System (VISTA) was established.
The models and computer tools analyzing the nuclear fuel cycle in its different strategies and options, share the same basic information: the isotopic composition of spent nuclear fuels. One of the purposes of this publication is to describe the method used by the IAEA in obtaining this basic data. Isotopic composition in spent nuclear fuel is calculated by a module called Calculating Actinide Inventory (CAIN). The module is a simple fuel depletion code which requires a small number of input parameters to achieve the requested results.
The VISTA model will be disseminated through the internet as a standalone PC application to enable interested Member States to use it for their analysis. This publication will provide an introduction to the simulation system by giving the technical description of the model and its fuel depletion module CAIN. This publication also gives selected example scenarios and the comparative results for those scenarios in order to demonstrate the capabilities of the VISTA code to interested parties.
The IAEA wishes to thank the experts who took part in the preparation of this publication for their valuable contribution, especially R. Yoshioka from Japan for providing the CAIN code to the IAEA. The IAEA is also grateful to Member States and individual organizations for their generous support in providing experts to assist in this work. The IAEA officer responsible for this publication was M. Ceyhan of the Division of Nuclear Fuel Cycle and Waste Technology.

EDITORIAL NOTE
The use of particular designations of countries or territories does not imply any judgement by the publisher, the IAEA, as to the legal status of such countries or territories, of their authorities and institutions or of the delimitation of their boundaries.
The mention of names of specific companies or products (whether or not indicated as registered) does not imply any intention to infringe proprietary rights, nor should it be construed as an endorsement or recommendation on the part of the IAEA.

CONTENTS
1. INTRODUCTION ............................................................................................................ 1
1.1. Background......................................................................................................... 1 1.2. Objective............................................................................................................. 1 1.3. Scope .................................................................................................................. 2
2. VISTA MODELLING...................................................................................................... 2
2.1. General................................................................................................................ 2 2.2. VISTA information flow .................................................................................... 3 2.3. Nuclear fuel cycle ............................................................................................... 4 2.4. VISTA nuclear material flow model .................................................................. 6
2.4.1. Process losses.......................................................................................... 7 2.4.2. Process lead and lag times ...................................................................... 7 2.4.3. Calculation model ................................................................................... 7
2.5. Fuel depletion model .......................................................................................... 7 2.5.1. Need to track actinides............................................................................ 7 2.5.2. Selection of actinides ............................................................................ 10 2.5.3. Methods available ................................................................................. 12 2.5.4. Criteria for model selection .................................................................. 14 2.5.5. CAIN model.......................................................................................... 15 2.5.6. Inclusion of MOX recycling in VISTA ................................................ 19 2.5.7. Cross-sections used............................................................................... 23 2.5.8. Other constants ..................................................................................... 24 2.5.9. Isotopic composition of spent fuels ...................................................... 25
2.6. Validation and benchmarking........................................................................... 25 2.6.1. Validation of reactor model, CAIN ...................................................... 25 2.6.2. Validation of overall nuclear material flow calculations...................... 26
3. EXAMPLE SCENARIO WITH INPUT AND OUTPUT PARAMETERS .................. 27
3.1. Input parameters ............................................................................................... 27 3.1.1. Nuclear power....................................................................................... 27 3.1.2. Reactor type mixture............................................................................. 28 3.1.3. Load factors .......................................................................................... 28 3.1.4. LWR reprocessing scenario .................................................................. 29 3.1.5. MOX fuel ratio in LWR........................................................................ 30 3.1.6. Discharge burnups ................................................................................ 31 3.1.7. Initial enrichments ................................................................................ 31 3.1.8. Enrichment tail assay ............................................................................ 32 3.1.9. Process losses and process lag times .................................................... 33 3.1.10. Fuel residence times.............................................................................. 33
3.2. Scenario selection ............................................................................................. 33 3.3. Output parameters............................................................................................. 34
3.3.1. Electricity generation............................................................................ 34 3.3.2. Natural uranium requirements .............................................................. 35 3.3.3. Conversion requirements ...................................................................... 35 3.3.4. Enrichment requirements ...................................................................... 36 3.3.5. Fresh fuel fabrication requirements ...................................................... 36 3.3.6. LWR MOX fabrication requirements ................................................... 37 3.3.7. Spent fuel discharge amount................................................................. 37
3.3.8. Reprocessing requirements ................................................................... 37 3.3.9. Spent fuel storage requirements............................................................ 38 3.3.10. Total plutonium discharge .................................................................... 39 3.3.11. Separated Pu stocks .............................................................................. 39 3.3.12. Minor Actinide discharge ..................................................................... 40 3.3.13. Minor Actinide accumulation ............................................................... 40
4. SUMMARY AND CONCLUSIONS ............................................................................. 41
4.1. Summary........................................................................................................... 41 4.2. Conclusions ...................................................................................................... 42
APPENDIX I VISTA WEBSITE............................................................................................. 43
APPENDIX II VISTA CALCULATION MODEL................................................................. 49
APPENDIX III REACTION AND DECAY CHAINS............................................................ 53
APPENDIX IV CROSS-SECTIONS USED IN CALCULATIONS ...................................... 59
APPENDIX V ISOTOPIC COMPOSITIONS OF DISCHARGED SPENT FUELS ............. 65
APPENDIX VI VALIDATION AND BENCHMARKING OF CAIN MODEL.................... 73
REFERENCES......................................................................................................................... 91
GLOSSARY............................................................................................................................. 93
CONTRIBUTORS TO DRAFTING AND REVIEW ............................................................. 95

1. INTRODUCTION
1.1. Background
The international symposium on Nuclear Fuel Cycle and Reactor Strategies: Adjusting to New Realities was held in Vienna 3–6 June 1997 [1]. For the preparation of this symposium, an international steering group with representatives from twelve countries and three international organizations (IAEA, OECD/NEA and WNA) coordinated, from 1995, the work of six working groups. They studied different scenarios of energy consumption including nuclear electricity production. Nuclear electricity production and the associated nuclear fuel cycle requirements should then to be estimated.
Working Group 2 did a comparison of the existing calculation tools for that purpose. At that time, none of them were able to give simple and accurate estimations. Working Group 2, then asked the IAEA to adapt its old CYBA calculation database to take into account the two options for nuclear fuel back end strategy: direct disposal and reprocessing & recycling.
A new simulation system, named VISTA, was developed in 1996. It was then intensively used to quantify the different scenarios fixed by the Working Groups of the conference.
The VISTA model needs isotopic composition of spent nuclear fuel in order to make estimations of the material arisings from the nuclear reactor operation. For this purpose, in accordance with the requirements of the VISTA code, a new module called Calculating Actinide Inventory (CAIN) was developed. CAIN is a simple fuel depletion model which requires a small number of input parameters and gives results in a very short time.
VISTA has been used internally by the IAEA for the estimation of: spent fuel discharge from the reactors worldwide, Pu accumulation in the discharged spent fuel, minor actinides (MA) accumulation in the spent fuel, and in the high level waste (HLW) since its development. The IAEA decided to disseminate the VISTA tool to Member States using internet capabilities in 2003. The improvement and expansion of the simulation code and the development of the internet version was started in 2004. A website was developed to introduce the simulation system to the visitors providing a simple nuclear material flow calculation tool. This website has been made available to Member States in 2005 [2]. The development work for the full internet version is expected to be fully available to the interested parties from IAEA Member States in 2007 on its website.
Appendix I gives more information about the VISTA internet site.
1.2. Objective
VISTA is able to calculate, year by year over a long period, nuclear fuel cycle requirements for all types of reactors. Calculations are performed for a reactor, reactor park in a country or a worldwide nuclear power plant park. Natural uranium, conversion, enrichment and fuel fabrication requirements can be estimated. Furthermore, the quantities and qualities (isotopic composition) of discharged and/or stored fuels can be evaluated to let the user apply a recycling strategy if desired.
Data inputs are reduced to a few basic data in order to let non-nuclear fuel specialists develop different energy scenarios. The calculation speed of the system is fast enough to enable making comparisons of different scenarios in a considerably short time.
1
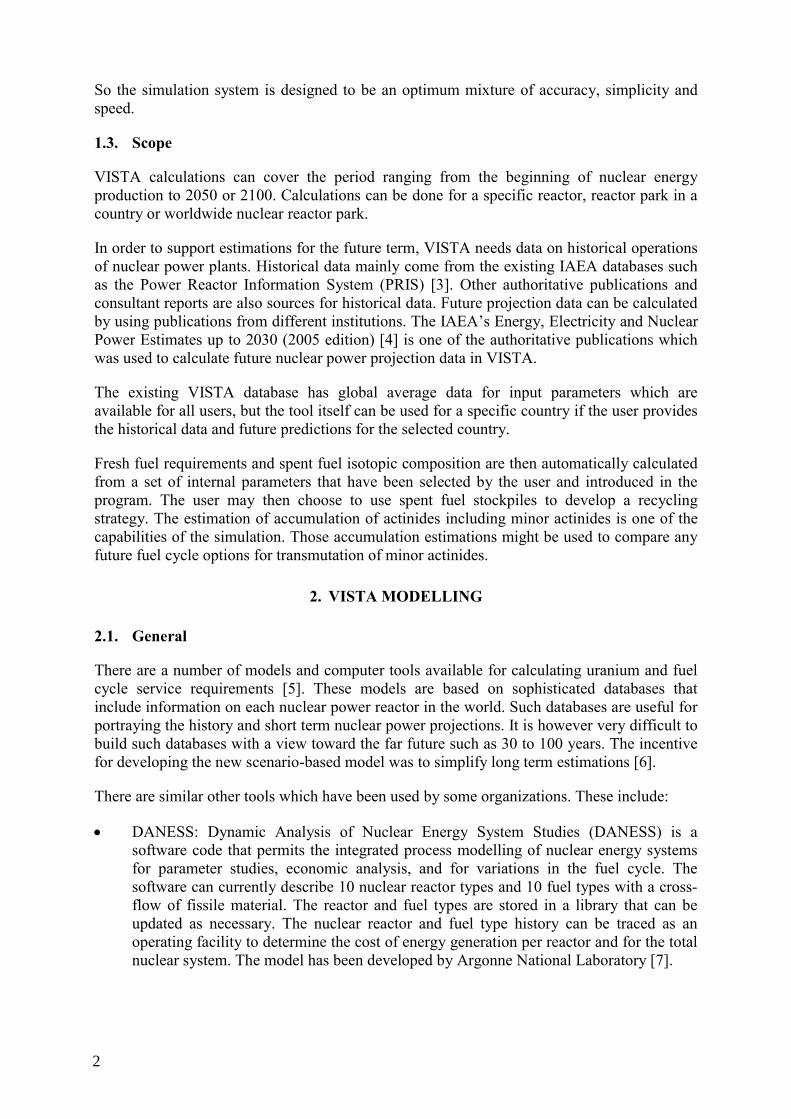
So the simulation system is designed to be an optimum mixture of accuracy, simplicity and speed.
1.3. Scope
VISTA calculations can cover the period ranging from the beginning of nuclear energy production to 2050 or 2100. Calculations can be done for a specific reactor, reactor park in a country or worldwide nuclear reactor park.
In order to support estimations for the future term, VISTA needs data on historical operations of nuclear power plants. Historical data mainly come from the existing IAEA databases such as the Power Reactor Information System (PRIS) [3]. Other authoritative publications and consultant reports are also sources for historical data. Future projection data can be calculated by using publications from different institutions. The IAEA’s Energy, Electricity and Nuclear Power Estimates up to 2030 (2005 edition) [4] is one of the authoritative publications which was used to calculate future nuclear power projection data in VISTA.
The existing VISTA database has global average data for input parameters which are available for all users, but the tool itself can be used for a specific country if the user provides the historical data and future predictions for the selected country.
Fresh fuel requirements and spent fuel isotopic composition are then automatically calculated from a set of internal parameters that have been selected by the user and introduced in the program. The user may then choose to use spent fuel stockpiles to develop a recycling strategy. The estimation of accumulation of actinides including minor actinides is one of the capabilities of the simulation. Those accumulation estimations might be used to compare any future fuel cycle options for transmutation of minor actinides.
2. VISTA MODELLING
2.1. General
There are a number of models and computer tools available for calculating uranium and fuel cycle service requirements [5]. These models are based on sophisticated databases that include information on each nuclear power reactor in the world. Such databases are useful for portraying the history and short term nuclear power projections. It is however very difficult to build such databases with a view toward the far future such as 30 to 100 years. The incentive for developing the new scenario-based model was to simplify long term estimations [6].
There are similar other tools which have been used by some organizations. These include:
• DANESS: Dynamic Analysis of Nuclear Energy System Studies (DANESS) is a software code that permits the integrated process modelling of nuclear energy systems for parameter studies, economic analysis, and for variations in the fuel cycle. The software can currently describe 10 nuclear reactor types and 10 fuel types with a cross-flow of fissile material. The reactor and fuel types are stored in a library that can be updated as necessary. The nuclear reactor and fuel type history can be traced as an operating facility to determine the cost of energy generation per reactor and for the total nuclear system. The model has been developed by Argonne National Laboratory [7].
2
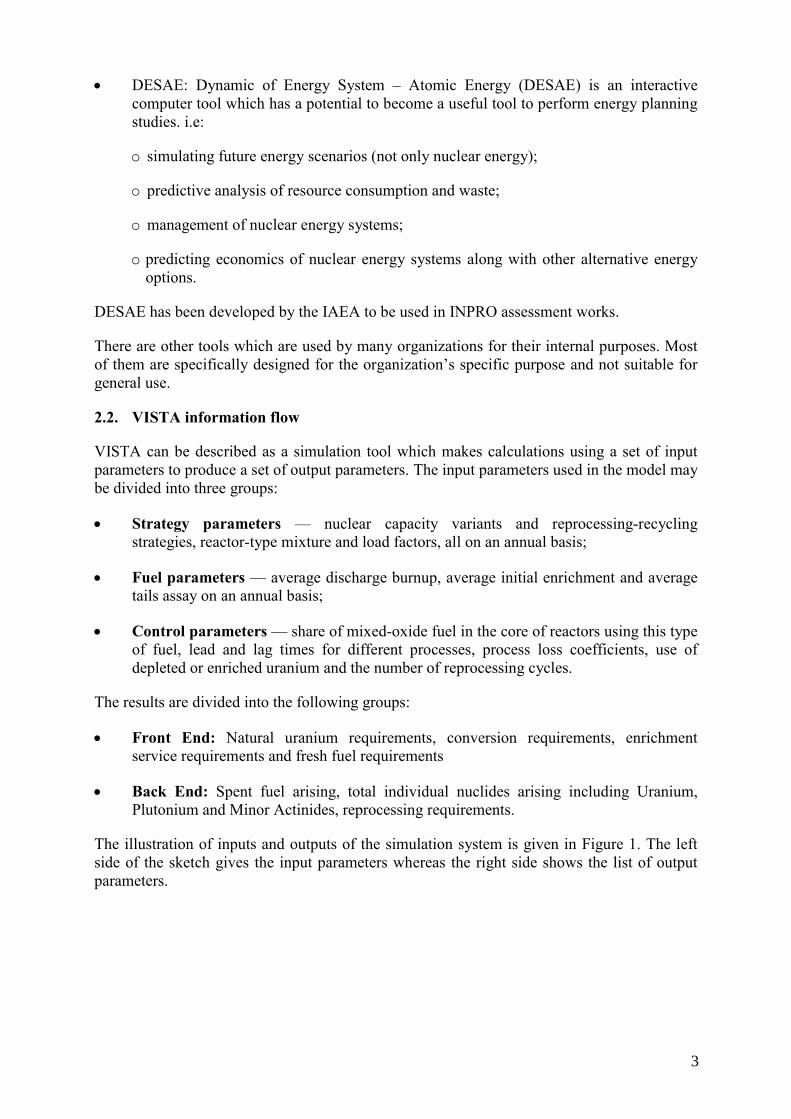
• DESAE: Dynamic of Energy System – Atomic Energy (DESAE) is an interactive computer tool which has a potential to become a useful tool to perform energy planning studies. i.e:
o simulating future energy scenarios (not only nuclear energy);
o predictive analysis of resource consumption and waste;
o management of nuclear energy systems;
o predicting economics of nuclear energy systems along with other alternative energy options.
DESAE has been developed by the IAEA to be used in INPRO assessment works.
There are other tools which are used by many organizations for their internal purposes. Most of them are specifically designed for the organization’s specific purpose and not suitable for general use.
2.2. VISTA information flow
VISTA can be described as a simulation tool which makes calculations using a set of input parameters to produce a set of output parameters. The input parameters used in the model may be divided into three groups:
• Strategy parameters — nuclear capacity variants and reprocessing-recycling strategies, reactor-type mixture and load factors, all on an annual basis;
• Fuel parameters — average discharge burnup, average initial enrichment and average tails assay on an annual basis;
• Control parameters — share of mixed-oxide fuel in the core of reactors using this type of fuel, lead and lag times for different processes, process loss coefficients, use of depleted or enriched uranium and the number of reprocessing cycles.
The results are divided into the following groups:
• Front End: Natural uranium requirements, conversion requirements, enrichment service requirements and fresh fuel requirements
• Back End: Spent fuel arising, total individual nuclides arising including Uranium, Plutonium and Minor Actinides, reprocessing requirements.
The illustration of inputs and outputs of the simulation system is given in Figure 1. The left side of the sketch gives the input parameters whereas the right side shows the list of output parameters.
3

Fig. 1. VISTA information flow.
2.3. Nuclear fuel cycle
Nuclear fuel cycle can be defined as the set of processes to make use of nuclear materials and to return it to final state. It starts with the mining of unused nuclear materials from nature and ends with the safe disposal of used nuclear materials in the nature. All the elements of a commercially available nuclear fuel cycle options are described in this section. See Figure 2 for a simplified nuclear fuel cycle diagram showing main processes in a recycle mode.
Fig. 2. Simplified diagram of the nuclear fuel cycle in recycle mode.
4

Mining & milling: Uranium is an element that is widely distributed within the earth’s crust as ores. Its principal use is as the primary fuel for nuclear power plants. The uranium ore needs to be mined and then processed (milled) before being usable. Uranium ore is mined by open-pit or underground mining methods and the uranium is extracted from the crushed ore in processing plants or mills using chemical methods. Sometimes it is possible to pass chemical solutions to the ore beds and dissolve the uranium from the ore directly. This process is known as in situ leaching. This is the first step in a nuclear fuel cycle. The feed for mining & milling process is uranium ore and the product is U3O8 concentrate, which is mostly called yellowcake due to its color and shape.
Conversion: The term conversion refers to the process of purifying the uranium concentrate and converting it to the chemical form required for the next stage of the nuclear fuel cycle. There are three such forms in common usage: metal, oxide (UO2 or UO3) and uranium hexafluoride (UF6). UF6 is the predominant product at this stage of the nuclear fuel cycle since it is easily converted to a gas for the enrichment stage, as employed in world’s most common reactor type (LWRs). For the PHWR fuel cycle, which generally uses natural uranium oxide as the fuel, conversion to the UF6 is not necessary. Uranium is purified and converted to UO2 or UO3 in this case. The Magnox fuel cycle uses natural uranium in metal form. The feed for this stage is U3O8 concentrate, and the products are UF6, oxide (UO2 or UO3) or metal, in applicability order.
Enrichment: Uranium naturally consists of about 0.7% of 235U isotope which is the main energy source in thermal reactors which are only commercially existing nuclear power plants in significant amounts. 99.3% of the natural uranium is 238U isotope. For LWR technology which is the most common reactor type in the world, it is impossible to build a LWR with the natural occurrence of 235U, so the 235U content should be increased with a special process. This process is called enrichment. There are two commercially available enrichment technologies: gaseous diffusion and centrifuge. Both techniques are based on the slight mass difference between 235U and 238U. So the enrichment is defined as the process of increasing the amount of 235U contained in a unit quantity of uranium. The feed for this stage is natural UF6 and the product is enriched UF6. The other output of the process is the uranium which has lower 235U content than the natural uranium. It is known as enrichment tail or depleted uranium.
Fuel fabrication: Enriched uranium in UF6 form is converted to UO2 powder to make fuel for LWR technology. This powder then is formed into pellets, sintered to achieve the desired density and ground to the required dimensions. Fuel pellets are loaded into tubes of zircaloy or stainless steel, which are sealed at both ends. These fuel rods are spaced in fixed parallel arrays to form the reactor fuel assemblies. The whole process is referred as fuel fabrication. The similar procedure is adopted for natural uranium oxide fuel for some reactor types. The feed of this process is enriched or natural uranium oxide powder and the product is fuel assembly. The feed for Magnox fuel is uranium metal.
Reactor: The reactor itself is irradiator for nuclear fuel. It burns the fuel, produces energy and spent fuel. There are currently 7 commercially available reactor types in the world (classification is based on VISTA assumptions): PWR, BWR, PHWR, RBMK, GCR, AGR and WWER. The feed for reactor is fresh fuel containing uranium or uranium/plutonium, in case of mixed oxide (MOX) fuel, for existing nuclear fuel cycle options. The product is the spent fuel consisting of newly generated nuclides such as fission products (Cs, I, …), minor actinides (Np, Am, Cm) and plutonium as well as the uranium. The biggest part of the spent fuel is still uranium (more than 95% for the most reactor types).
5

Reprocessing: The spent nuclear fuel still consists of significant amount of fissile material that can be used to produce energy. The considerable amount of 235U is still contained in the spent fuel and there are new fissile nuclides that were produced during normal operation of nuclear reactor such as 239Pu. Some nuclear fuel cycle options consider taking out those fissile material from the spent fuel, refabricating it as fuel and burning in the reactor. MOX fuel is the most common fuel that uses reprocessed material. Reprocessing process is based on chemical and physical processes to separate the required material from spent nuclear fuel. The feed of this process is spent fuel and the products are reusable material and high level wastes (HLW).
Spent fuel storage: The spent fuel, which is not reprocessed, could be stored temporarily for future use or could be stored indefinitely. Spent fuel could be stored in pools (wet type, temporarily) or in silos (dry type).
HLW storage: The waste from fuel fabrication and reprocessing facilities are classified as HLW and requires careful treating. HLW is stored in special storage facilities after proper treatment.
2.4. VISTA nuclear material flow model
VISTA simulation code is a two layer computer model to calculate the overall nuclear material flow in a nuclear fuel cycle option as well as the individual nuclide discharge and accumulation in the spent nuclear fuel. This section explains the overall nuclear material flow model of the VISTA whereas Section 2.5 explains the fuel depletion model which calculates individual nuclide discharge and accumulation in the spent nuclear fuel.
Overall material flow for a nuclear fuel cycle can be sketched by tracking the nuclear materials in each of the processes in the cycle. VISTA is capable of simulating different nuclear fuel cycle models with different reactor types and fuel types including non-existing fuel types (i.e. fuels with MA content) with the introduction of necessary libraries and data. For the purpose of this publication commercially existing nuclear fuel cycle options were simulated. These options are once through fuel cycle and U and Pu recycling in LWRs in the form of MOX fuel. Figure 3 shows the overall material flow diagram of the nuclear fuel cycle which is simulated in VISTA for this publication. Multi-recycling is possible in the system but the second fuel type must always have the same initial nuclide content as the fresh (first generation) MOX fuel.
The first fuel type in the model is uranium fuel from unused material whereas the second fuel type is the fuel from reprocessed material. The second fuel type in the system is MOX fuel type for the purpose of this publication since it is the only commercially available fuel from reprocessed material. Other fuel types such as fuels containing MA content could also be used to investigate future options.
6

Fig. 3. Overall material flow diagram simulated in VISTA.
2.4.1. Process losses
In each stage of the nuclear fuel cycle, the materials are processed in a facility. There are chemical and physical processes involved in those stages. Each stage has some losses in processed material. This should be taken into account when simulating the real situation. The VISTA simulation code is capable of having individual process loss coefficients in terms of percentage of processed material amount for each stage of the nuclear fuel cycle.
2.4.2. Process lead and lag times
Process lag time is defined as the time necessary to produce the output from the input of the process. Process lead time is defined as the time between the two processes. For example reprocessing can be done only after waiting certain period of time following the discharge of spent fuel from the reactor.
2.4.3. Calculation model
The VISTA fuel cycle simulation system is designed for estimating fuel cycle material and service requirements and material arisings year by year. The model calculates also, whenever relevant, cumulative amounts by summing annual amounts. All annual results represents yearly average amounts. The calculation method and algorithms are described in Appendix II in details.
2.5. Fuel depletion model
2.5.1. Need to track actinides
The actinide group includes elements from Th (Z=90) to Lr (Z=103), however major interest is given to the different isotopes of U and Pu (major components of fresh and spent nuclear fuel) and so-called minor actinides (MA - Np, Am and Cm) with extremely long life, high
7

alpha (with energy of alpha-particles of 4-6 MeV, major contributors to the residual heat of spent fuel) and gamma radioactivity.
Assessment of the worldwide inventories of these elements/isotopes in spent fuel is important due to non-proliferation issues (for fissile isotopes of U and Pu) and radiotoxicity of long lived MAs. The latter relates to open fuel cycle, when the safety of spent fuel storage and further final disposal should be justified and guaranteed, and to closed fuel cycle, when the same is applicable to immobilized high level waste (HLW) containing MAs.
Characteristics of major actinides (half life, mode of decay, presence of gamma-radiation, total and alpha activities) are presented in TABLE 1. Concentration of actinides and their specific activities are given for UO2 fuel with initial enrichment of 3.2% after irradiation in 900 MWe PWR until burnup of 33 MW·d/kg U and 5 years storage in the table.
It could be seen from TABLE 1 that about 90% of alpha-radioactivity of discharged spent fuel, or HLW in case of reprocessing, i.e. potential radiotoxicity, is contributed by 238Pu, 241Am and 244Cm (spent fuel) or 241Am and 244Cm (HLW).
During irradiation actinides migrate in Z+N (Z and N-number of protons and neutrons respectively) space due to competing processes: radioactive decay and neutron capture. Figure 4 shows the transmutation chain of actinides. Radioactive decay impacts on residual concentration of MAs and respectively - on potential radiotoxicity.
Potential radiotoxicity of actinides may be defined, without taking into account any barriers, by calculating a “source term” obtained by weighting the activity of each radionuclide by its specific toxicity coefficient (by ingestion or inhalation) and then by summing up the resulting values. TABLE 2 shows the evolution of the potential radiotoxicity of spent fuel and the contribution of each long lived actinide and total of FP (in Sieverts per ton of UO2 spent fuel or by TWhe produced). It could be seen that after decay of highly radioactive FPs (137Cs and 90Sr) during ~ 300 years, the major contribution is dealt with Pu, up to 106 years. Americium has a predominant position among the MAs between 102 and 105 years, Np - after 105 years, and Cm - before 104 years [8]. Uranium is predominant after 106 years.
For the long term storage or disposal of spent fuel or HLW the potential release of activity to the biosphere could be evaluated as consequence of degradation of engineering barriers and transfer of radionuclides through geological environment. With taking into account the solubility of actinides, the permissible concentrations in water and solids, the actinide hazard factors in spent fuel /HLW may be ranged as [8]:
)(237242243239240241 fuelspentCmNpPuAmPuPuAm →→→→→→ )(237239240243241 HLWCmNpPuPuAmAm →→→→→
In late 70s vast R&D programmes to increase fuel burnup were initiated in several countries in order to reduce uranium and separative work requirements, fuel cycle cost and the amount of discharged spent fuel. At present the reduction of the amount of discharged spent fuel and the nuclear fuel cycle costs are seen as major results of burnup extension programmes. The historical design batch average burnup of LWRs, around 30 MW·d/kg U, have been increased now up to 40-45 MW·d/kg U for PWRs and 36-42 MW·d/kg U for BWRs. Economic incentives exist for extending burnup even further, to at least ~ 60 MW·d/kg U batch average.
8
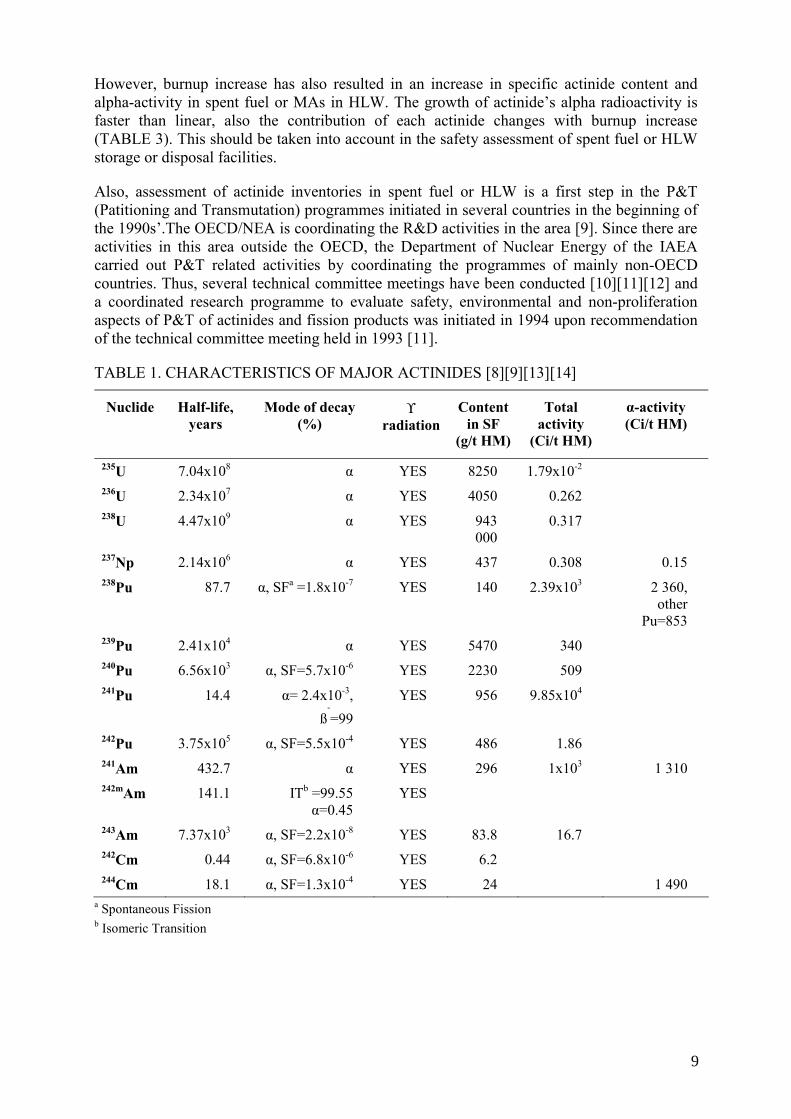
However, burnup increase has also resulted in an increase in specific actinide content and alpha-activity in spent fuel or MAs in HLW. The growth of actinide’s alpha radioactivity is faster than linear, also the contribution of each actinide changes with burnup increase (TABLE 3). This should be taken into account in the safety assessment of spent fuel or HLW storage or disposal facilities.
Also, assessment of actinide inventories in spent fuel or HLW is a first step in the P&T (Patitioning and Transmutation) programmes initiated in several countries in the beginning of the 1990s’.The OECD/NEA is coordinating the R&D activities in the area [9]. Since there are activities in this area outside the OECD, the Department of Nuclear Energy of the IAEA carried out P&T related activities by coordinating the programmes of mainly non-OECD countries. Thus, several technical committee meetings have been conducted [10][11][12] and a coordinated research programme to evaluate safety, environmental and non-proliferation aspects of P&T of actinides and fission products was initiated in 1994 upon recommendation of the technical committee meeting held in 1993 [11].
TABLE 1. CHARACTERISTICS OF MAJOR ACTINIDES [8][9][13][14]
Nuclide Half-life, years
Mode of decay (%)
ϒ radiation
Content in SF
(g/t HM)
Total activity
(Ci/t HM)
α-activity (Ci/t HM)
235U 7.04x10⁸ α YES 8250 1.79x10⁻² 236U 2.34x10⁷ α YES 4050 0.262 238U 4.47x10⁹ α YES 943
000 0.317
237Np 2.14x10⁶ α YES 437 0.308 0.15 238Pu 87.7 α, SFa =1.8x10⁻⁷ YES 140 2.39x10³ 2 360,
other Pu=853
239Pu 2.41x10⁴ α YES 5470 340 240Pu 6.56x10³ α, SF=5.7x10⁻⁶ YES 2230 509 241Pu 14.4 α= 2.4x10⁻³,
ß-=99
YES 956 9.85x10⁴
242Pu 3.75x10⁵ α, SF=5.5x10⁻⁴ YES 486 1.86 241Am 432.7 α YES 296 1x10³ 1 310 242mAm 141.1 ITb =99.55
α=0.45 YES
243Am 7.37x10³ α, SF=2.2x10⁻⁸ YES 83.8 16.7 242Cm 0.44 α, SF=6.8x10⁻⁶ YES 6.2 244Cm 18.1 α, SF=1.3x10⁻⁴ YES 24 1 490
a Spontaneous Fission b Isomeric Transition
9
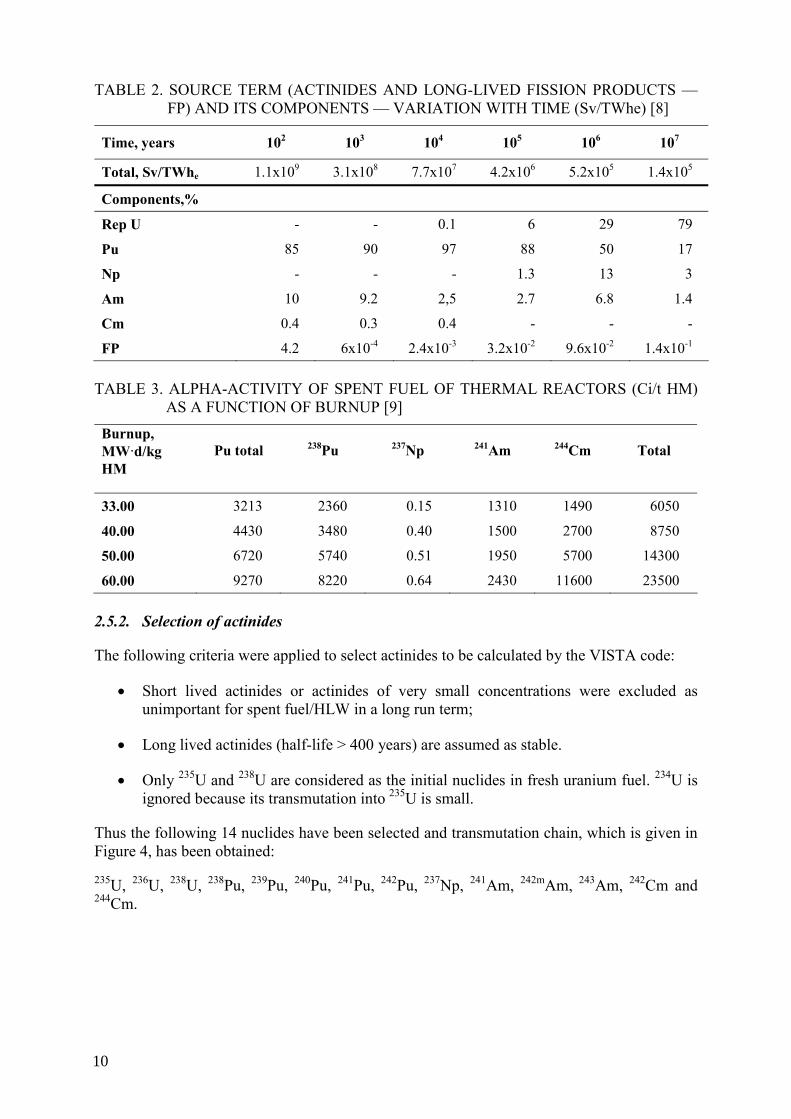
TABLE 2. SOURCE TERM (ACTINIDES AND LONG-LIVED FISSION PRODUCTS —FP) AND ITS COMPONENTS — VARIATION WITH TIME (Sv/TWhe) [8]
Time, years 102 103 104 105 106 107
Total, Sv/TWhe 1.1x10⁹ 3.1x10⁸ 7.7x10⁷ 4.2x10⁶ 5.2x10⁵ 1.4x10⁵
Components,%
Rep U - - 0.1 6 29 79
Pu 85 90 97 88 50 17
Np - - - 1.3 13 3
Am 10 9.2 2,5 2.7 6.8 1.4
Cm 0.4 0.3 0.4 - - -
FP 4.2 6x10⁻⁴ 2.4x10⁻³ 3.2x10⁻² 9.6x10⁻² 1.4x10⁻¹ TABLE 3. ALPHA-ACTIVITY OF SPENT FUEL OF THERMAL REACTORS (Ci/t HM)
AS A FUNCTION OF BURNUP [9] Burnup, MW·d/kg HM
Pu total
238Pu
237Np
241Am
244Cm
Total
33.00 3213 2360 0.15 1310 1490 6050
40.00 4430 3480 0.40 1500 2700 8750
50.00 6720 5740 0.51 1950 5700 14300
60.00 9270 8220 0.64 2430 11600 23500 2.5.2. Selection of actinides
The following criteria were applied to select actinides to be calculated by the VISTA code:
• Short lived actinides or actinides of very small concentrations were excluded as unimportant for spent fuel/HLW in a long run term;
• Long lived actinides (half-life > 400 years) are assumed as stable.
• Only 235U and 238U are considered as the initial nuclides in fresh uranium fuel. 234U is ignored because its transmutation into 235U is small.
Thus the following 14 nuclides have been selected and transmutation chain, which is given in Figure 4, has been obtained:
235U, 236U, 238U, 238Pu, 239Pu, 240Pu, 241Pu, 242Pu, 237Np, 241Am, 242mAm, 243Am, 242Cm and 244Cm.
10

Fig.
4. A
ctin
ide
tran
smut
atio
n ch
ain.
11

2.5.3. Methods available
2.5.3.1. Introduction
There are several computer programs available for the calculation of nuclide inventories in spent fuel. The overall procedure for the calculation is common to all. The programs differ in the detail with which each step in the calculation is carried out.
In general, actinide inventories are calculated by solving the equation that is obtained by taking a nuclide balance. This equation consists of terms that represent the production rate and removal rate of the nuclide. For the actinides, production consists of neutron capture or decay of a precursor nuclide. Removal may consist of neutron induced or spontaneous fission, neutron capture and radioactive decay.
The calculation of the reaction rates requires nuclide concentration and cross section data, the neutron flux level and energy spectrum in the fuel. As the energy spectrum in the fuel is dependent on the lattice structure and composition, such calculations involve repeated iterative solutions for the spectrum and cross sections. The extent to which this is carried out depends on the accuracy required of the final solution. After each burnup interval, the converged spectrum is used to obtain the neutron cross sections which are subsequently used for the calculation of the nuclide reaction rates.
The points to be considered in making an evaluation of the available methods are:
• nuclide cross section data • energy spectrum calculation • calculation of neutron flux level during irradiation, and • numerical solution of the burnup equations.
The treatment of these quantities in the several alternative codes has been examined. They are WIMS, ORIGEN and VISTA module CAIN. Each of the codes is described below.
2.5.3.2. The WIMS Code
WIMS [15] is a lattice code that uses neutron transport theory to solve the multienergy group neutron balance equations in one or two dimensions. Several cross section libraries are available as input. The current popular choice seems to be the ENDF/B libraries. The data in this library is condensed to 69 energy groups for use in WIMS.
The code includes the effect of the temperature of the lattice components (especially those with significant neutron scattering rates) on the neutron spectrum and subsequently on the nuclide inventories.
In order to make a meaningful comparison to ORIGEN and CAIN, the following features of WIMS should be noted:
• Since the cross section library has data for 69 energy groups, the option is available to calculate the nuclide reaction rates for each of these groups. (usually, between 14 to 33 energy groups are used, depending on the special requirements of the problem). The enrichment level affects the neutron spectrum; the detailed calculation of the neutron spectrum for a given reactor type, takes this into account.
12
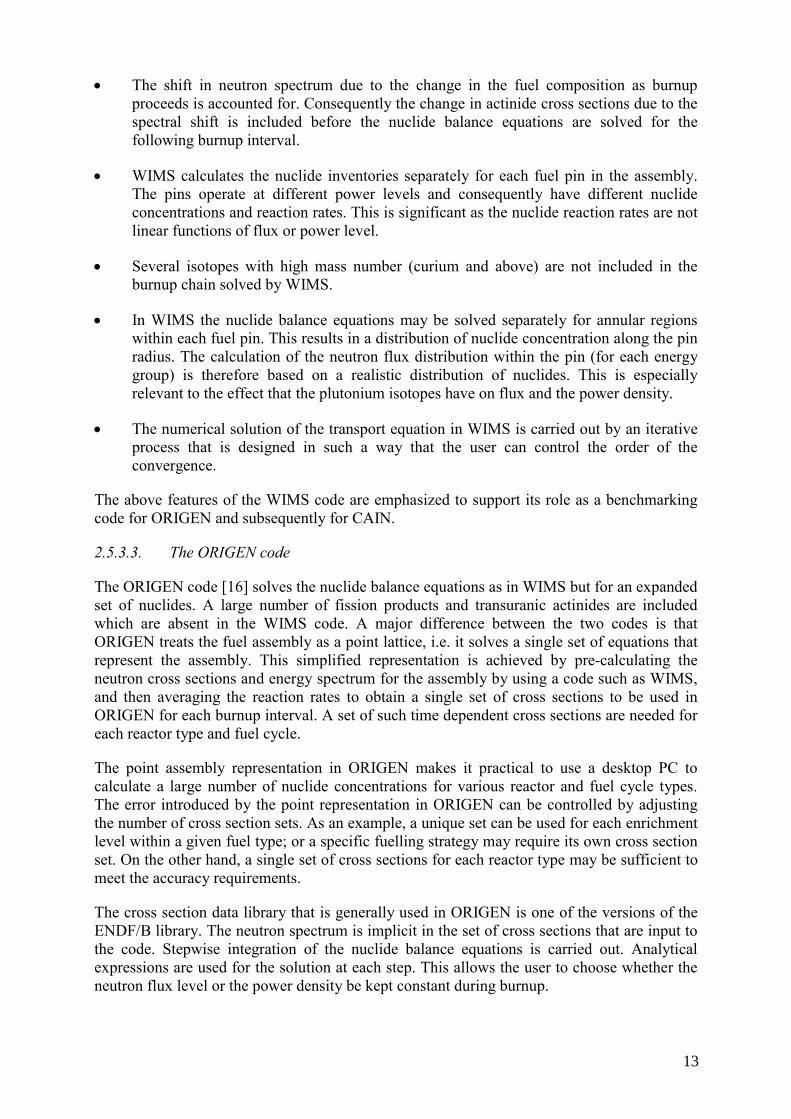
• The shift in neutron spectrum due to the change in the fuel composition as burnup proceeds is accounted for. Consequently the change in actinide cross sections due to the spectral shift is included before the nuclide balance equations are solved for the following burnup interval.
• WIMS calculates the nuclide inventories separately for each fuel pin in the assembly. The pins operate at different power levels and consequently have different nuclide concentrations and reaction rates. This is significant as the nuclide reaction rates are not linear functions of flux or power level.
• Several isotopes with high mass number (curium and above) are not included in the burnup chain solved by WIMS.
• In WIMS the nuclide balance equations may be solved separately for annular regions within each fuel pin. This results in a distribution of nuclide concentration along the pin radius. The calculation of the neutron flux distribution within the pin (for each energy group) is therefore based on a realistic distribution of nuclides. This is especially relevant to the effect that the plutonium isotopes have on flux and the power density.
• The numerical solution of the transport equation in WIMS is carried out by an iterative process that is designed in such a way that the user can control the order of the convergence.
The above features of the WIMS code are emphasized to support its role as a benchmarking code for ORIGEN and subsequently for CAIN.
2.5.3.3. The ORIGEN code
The ORIGEN code [16] solves the nuclide balance equations as in WIMS but for an expanded set of nuclides. A large number of fission products and transuranic actinides are included which are absent in the WIMS code. A major difference between the two codes is that ORIGEN treats the fuel assembly as a point lattice, i.e. it solves a single set of equations that represent the assembly. This simplified representation is achieved by pre-calculating the neutron cross sections and energy spectrum for the assembly by using a code such as WIMS, and then averaging the reaction rates to obtain a single set of cross sections to be used in ORIGEN for each burnup interval. A set of such time dependent cross sections are needed for each reactor type and fuel cycle.
The point assembly representation in ORIGEN makes it practical to use a desktop PC to calculate a large number of nuclide concentrations for various reactor and fuel cycle types. The error introduced by the point representation in ORIGEN can be controlled by adjusting the number of cross section sets. As an example, a unique set can be used for each enrichment level within a given fuel type; or a specific fuelling strategy may require its own cross section set. On the other hand, a single set of cross sections for each reactor type may be sufficient to meet the accuracy requirements.
The cross section data library that is generally used in ORIGEN is one of the versions of the ENDF/B library. The neutron spectrum is implicit in the set of cross sections that are input to the code. Stepwise integration of the nuclide balance equations is carried out. Analytical expressions are used for the solution at each step. This allows the user to choose whether the neutron flux level or the power density be kept constant during burnup.
13

Compared with WIMS and CAIN, ORIGEN has a larger number of nuclides in its database.
2.5.3.4. The CAIN code
The CAIN Code was written to meet the special requirements of the Nuclear Fuel Cycle Simulation System being developed at the IAEA [5]. It solves, essentially, the same equations as ORIGEN for a point assembly. The neutron spectrum is implicit in the set of cross sections that the user inputs to the code. Analytical expressions are available for the solution of the equations. This makes the code computationally very efficient. As with ORIGEN, the accuracy of the calculated nuclide inventories can be improved in CAIN by using cross sections that are pre-calculated by a lattice code that models the complete assembly and accounts for the detailed neutron spectrum in obtaining the nuclide cross sections. The number of cross section sets to be used is based on the user’s judgment to meet the accuracy requirements. At present, the code uses a set of cross sections for each reactor and fuel type.
2.5.4. Criteria for model selection
2.5.4.1. Accuracy requirements
Since the objective of VISTA is to predict for example the global amount of actinides in the discharged fuels from all civilian power reactors, it is not required to evaluate the actinides inventory for each specific reactor. Therefore, all power reactors are categorized to seven reactor types, which are PWR, BWR, PHWR, RBMK, AGR, GCR and WWER. These types represent almost all of the commercially existing reactor types in significant amounts.
Considering the future capability to implement the “CAIN” depletion model to VISTA, the CAIN model should be simple. But it should be accurate enough compared with other verified codes. Therefore, the Bateman’s Equation is adopted, because it is a theoretical burnup solution for a point reactor with one group neutron cross section.
Also, it is not required to calculate the inventory for short lived actinides or the actinide of very small concentration, because we are considering the actinide inventory of spent fuels in the long term. Therefore, the following 14 actinides are calculated: 235U, 236U, 238U, 238Pu, 239Pu, 240Pu, 241Pu, 242Pu, 237Np, 241Am, 242mAm, 243Am, 242Cm and 244Cm.
The detailed model of the CAIN code is explained in Section 2.5.5. Regarding the accuracy of the CAIN code, the results of validation and benchmarks are shown in Section 2.6.
2.5.4.2. Computational requirements
The computer software to develop the VISTA simulation system has been chosen in order to comply with the following requirements:
• Experts studying the global nuclear materials flow deduced from electricity generation capacity scenarios want to have on their personal computer a user-friendly tool to quickly test their hypotheses.
• The tool must be in accordance with nuclear physics principles and reflect nuclear industry realities.
• Data to be inputted by user should be kept to a minimum unlike the more sophisticated models.
14

• Formulae giving the isotopic composition of the different nuclear fuels, both before and after irradiation must be incorporated into the program. This will allow the size of the program to be reduced hence speeding up the calculation and also limit the amount of data to be inputted in order to evaluate the nuclear material flows and isotopic compositions.
2.5.5. CAIN model
2.5.5.1. Introduction
The calculation model of the actinide inventory in the discharged fuel which is described below is programmed as a computer code "CAIN" (Calculation of Actinide INventory). The data inputs for the CAIN (cross sections and other reactor constants) are explained in Section 2.5.7 and Section 2.5.8. The calculated isotopic compositions by the CAIN code are mentioned in Section 2.5.9. The results of verification for the CAIN code are discussed in Section 2.6.
2.5.5.2. Bateman's Equation and its solution
The Bateman’s Equation is adopted to be used in CAIN model. It is a theoretical burnup solution for a point reactor with one group neutron cross section, as explained below. In order to solve the Bateman’s Equation several parameters are needed to be known. Those parameters are listed in below sample solution.
The main expression for Bateman’s equation is given below:
where
iN - atomic content of isotope (i);
djiλ - decay constant, 1/s;
trjiσ - transmutation cross section from isotope i to isotope j, barn;
trijσ - transmutation cross section from isotope j to isotope i, barn;
ϕ - average neutron flux, n/(s⋅cm2);
jN - atomic content of isotope (j).
If the neutron flux and cross sections are constant on a time interval, the equation has a simple analytical solution.
15

An example to solve the transmutation chain starting from 238U up to 240Pu is shown below, using Bateman's Equation.
PuPuU 240239238 →→
321 AFAFAF LLLL
)10T(e)initial(AFAF 241t11
−⋅⋅⋅−⋅= Φσ
⎥⎦
⎤⎢⎣
⎡⋅
−+⋅
−⋅=
−− ⋅⋅⋅−⋅⋅⋅− )10T(
2t1t
1c)10T(
1t2t
1c12
242t
241t e)(e)()initial(AFAF ΦσΦσ
σσσ
σσσ
⎥⎥⎥⎥⎥⎥⎥⎥
⎦
⎤
⎢⎢⎢⎢⎢⎢⎢⎢
⎣
⎡
⋅−⋅−
⋅+
⋅−⋅−
⋅+
⋅−⋅−
⋅
⋅=
−
−
−
⋅⋅⋅−
⋅⋅⋅−
⋅⋅⋅−
)10T(
3t2t3t1t
2c1c
)10T(
2t1t2t3t
2c1c
)10T(
1t3t1t2t
2c1c
13
243t
242t
241t
e))()(
(
e))()(
(
e))()(
(
)initial(AFAF
Φσ
Φσ
Φσ
σσσσσσ
σσσσσσ
σσσσσσ
where
AFi = Atomic content of isotope(i) in the chain
=cσ Capture cross section (barns)
=fσ Fission cross section (barns)
=n2nσ (n,2n) cross section (barns)
=exσ Excited cross section (barns)
=tσ Total cross section (barns)
Φ
σ⋅⋅⋅⋅⋅
=24
2/1decay
10360024365T693.0
decayexfct σσσσσ +++=
=2/1T Half life (years)
=Φ Average flux (n/cm/cm/sec) , (0 to 10MeV total flux)
=T Irradiation time (sec)
360024KWKG
1000ET d
⋅⋅⋅
=
=dE Discharge burnup (GW·d/t)
=KWKG Specific power (KW/Kg or MW/tonne)
The equation solver first calculates the isotopic composition in atomic fraction. The obtained atomic fractions then are converted to the weight fractions.
16
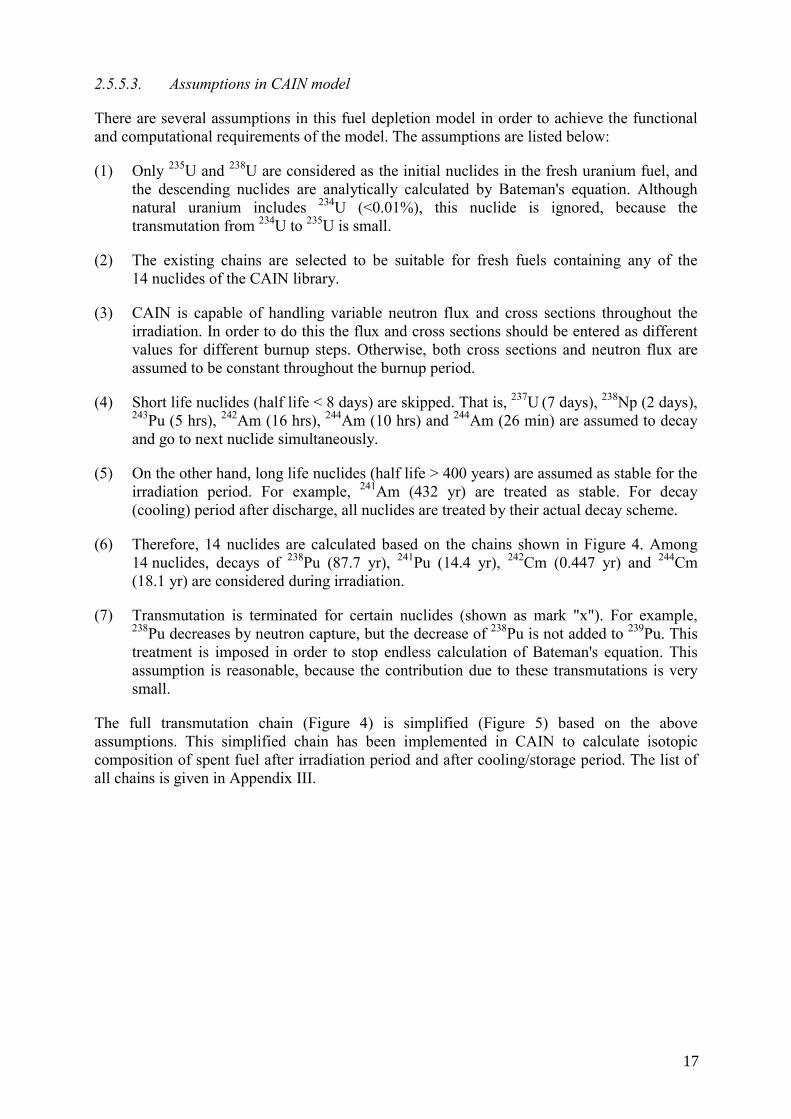
2.5.5.3. Assumptions in CAIN model
There are several assumptions in this fuel depletion model in order to achieve the functional and computational requirements of the model. The assumptions are listed below:
(1) Only 235U and 238U are considered as the initial nuclides in the fresh uranium fuel, and the descending nuclides are analytically calculated by Bateman's equation. Although natural uranium includes 234U (<0.01%), this nuclide is ignored, because the transmutation from 234U to 235U is small.
(2) The existing chains are selected to be suitable for fresh fuels containing any of the 14 nuclides of the CAIN library.
(3) CAIN is capable of handling variable neutron flux and cross sections throughout the irradiation. In order to do this the flux and cross sections should be entered as different values for different burnup steps. Otherwise, both cross sections and neutron flux are assumed to be constant throughout the burnup period.
(4) Short life nuclides (half life < 8 days) are skipped. That is, 237U (7 days), 238Np (2 days), 243Pu (5 hrs), 242Am (16 hrs), 244Am (10 hrs) and 244Am (26 min) are assumed to decay and go to next nuclide simultaneously.
(5) On the other hand, long life nuclides (half life > 400 years) are assumed as stable for the irradiation period. For example, 241Am (432 yr) are treated as stable. For decay (cooling) period after discharge, all nuclides are treated by their actual decay scheme.
(6) Therefore, 14 nuclides are calculated based on the chains shown in Figure 4. Among 14 nuclides, decays of 238Pu (87.7 yr), 241Pu (14.4 yr), 242Cm (0.447 yr) and 244Cm (18.1 yr) are considered during irradiation.
(7) Transmutation is terminated for certain nuclides (shown as mark "x"). For example, 238Pu decreases by neutron capture, but the decrease of 238Pu is not added to 239Pu. This treatment is imposed in order to stop endless calculation of Bateman's equation. This assumption is reasonable, because the contribution due to these transmutations is very small.
The full transmutation chain (Figure 4) is simplified (Figure 5) based on the above assumptions. This simplified chain has been implemented in CAIN to calculate isotopic composition of spent fuel after irradiation period and after cooling/storage period. The list of all chains is given in Appendix III.
17
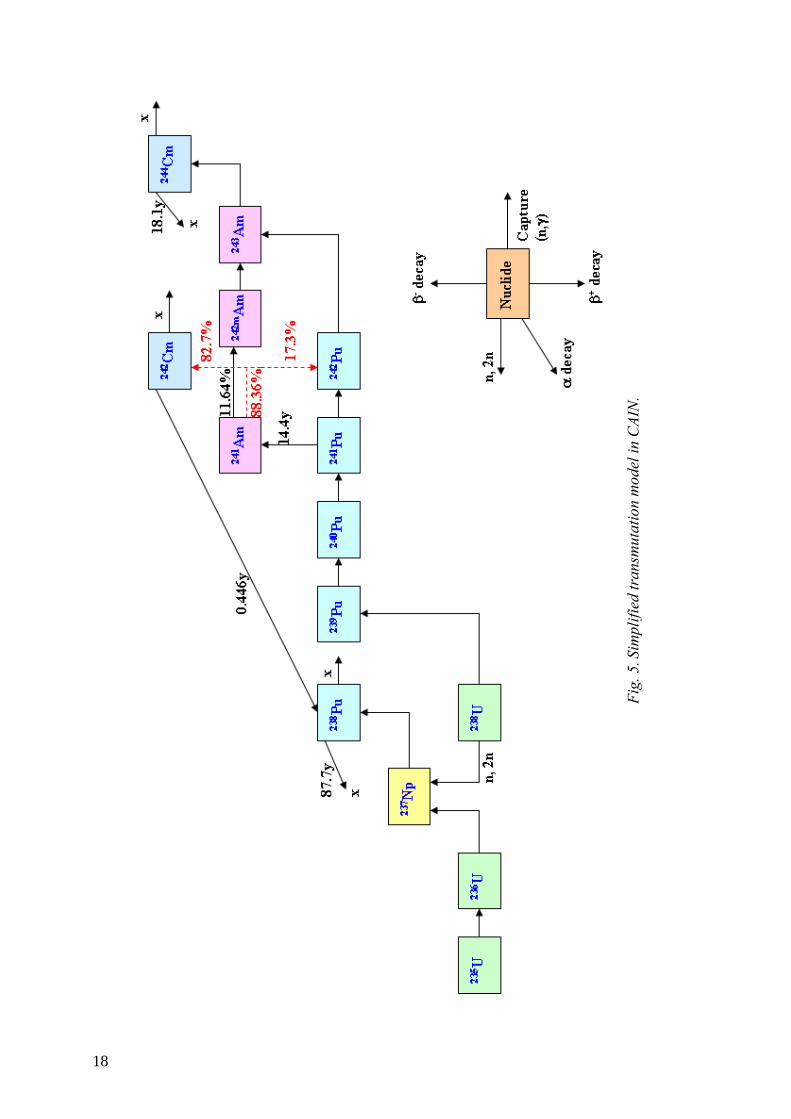
Fig.
5. S
impl
ified
tran
smut
atio
n m
odel
in C
AIN
.
18

2.5.6. Inclusion of MOX recycling in VISTA
In the first development phase of VISTA, MOX fuel was handled in a simple way. The composition of spent MOX fuel had been calculated by introducing a factor to composition of spent uranium fuel. This simplification was mainly due to the assumption of ignorance of MOX fuel reprocessing. But with the increased use of MOX fuel in several countries and with the concerns of radiotoxicity of spent nuclear fuel the multirecycling option became more possible. This brought a need for more accuracy in calculation of composition of spent MOX fuel. In order to do so, VISTA was expanded to handle MOX fuel to PWR, BWR and WWER. There are several modifications on VISTA, which are described in this section.
2.5.6.1. Chains for MOX
For uranium fuel, the initial nuclides are 235U and 238U only (VISTA assumption). But, for MOX fuel, there are more initial nuclides such as 238Pu/239Pu/240Pu/241Pu/242Pu. In some MOX fuel, there may exist 241Am, which decays from 241Pu with 14 years half-lifetime. So, new chains starting from the above Pu nuclides are necessary.
Also, in some countries, reprocessed uranium is used occasionally. This reprocessed UO2 includes 236U, which does not exist in the natural uranium, and it becomes necessary to include 236U as an initial nuclide for this fuel.
Finally, in order to handle the future fuels, which includes MA isotopes such as Np/Am/Cm, new chains starting from 237Np/241Am/242mAm/243Am/242Cm/244Cm are necessary. In here, 242mAm comes from neutron capture of 241Am, and goes to 243Am by another neutron capture. (Also, 242mAm decays to 242Cm, but its half-life is as long as 141 years.)
The new chains, added for MOX fuel modelling in CAIN, are listed in Appendix III.
2.5.6.2. Pu content for fresh MOX
In order to perform burnup calculation for MOX fuel in VISTA, we have to assume the initial composition of Pu in the fresh MOX fuel. The contents of each Pu isotope in the total Pu amount is often called “Pu Vector”. Pu vector which is used in VISTA is given in the first column of TABLE 4. This vector is calculated assuming that Pu comes from reprocessing of 3.3% enriched PWR fuel with 33 000 MW·d/t discharge burnup after 7 years of cooling and reprocessing time. If we assume the source fuel is 4.0% enriched PWR fuel at 45 000 MW·d/t discharge burnup after 7 years of cooling and reprocessing time the Pu vector becomes slightly different and this affects the fissile content in the total Pu. Current VISTA assumption is acceptable for the historical calculations since the most of the fuels which have already been reprocessed are in the first case (3.3%, 33 000 MW·d/t). But VISTA allows using of different Pu vectors. Figure 6 shows the Pu vector in the fresh MOX fuel for the above two cases.
19
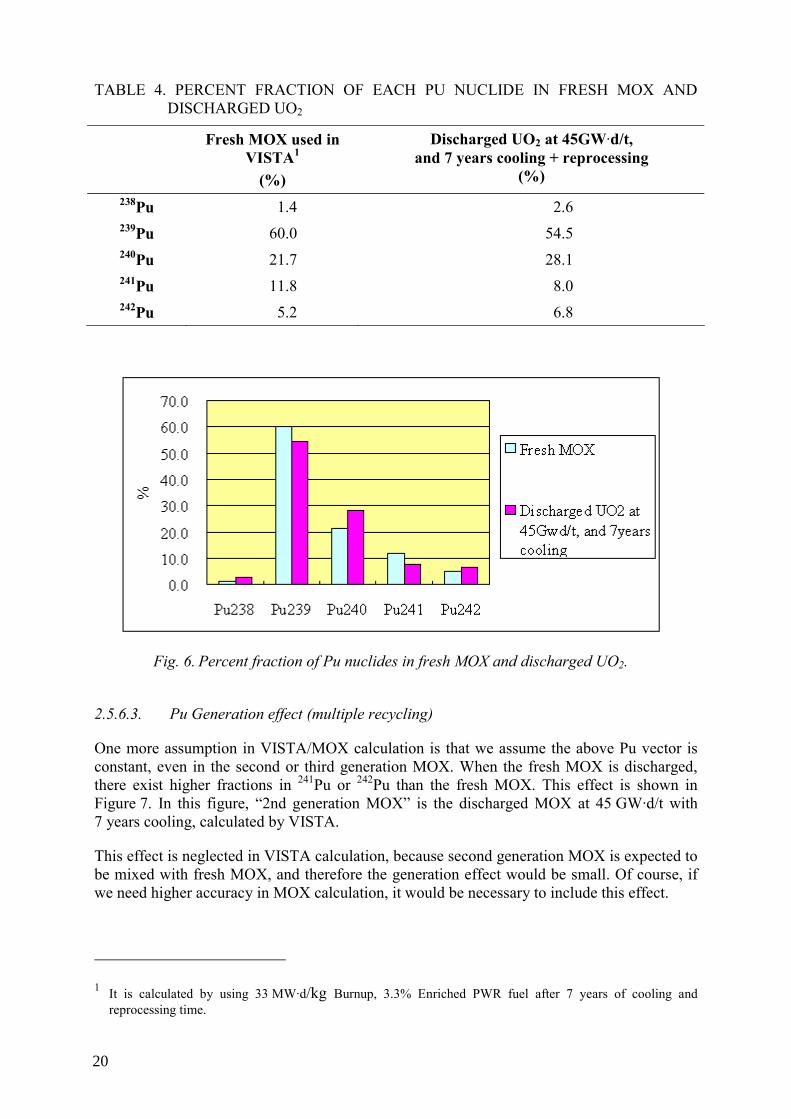
TABLE 4. PERCENT FRACTION OF EACH PU NUCLIDE IN FRESH MOX AND DISCHARGED UO2
Fresh MOX used in VISTA1
(%)
Discharged UO2 at 45GW·d/t, and 7 years cooling + reprocessing
(%) 238Pu 1.4 2.6 239Pu 60.0 54.5 240Pu 21.7 28.1 241Pu 11.8 8.0 242Pu 5.2 6.8
Fig. 6. Percent fraction of Pu nuclides in fresh MOX and discharged UO2.
2.5.6.3. Pu Generation effect (multiple recycling)
One more assumption in VISTA/MOX calculation is that we assume the above Pu vector is constant, even in the second or third generation MOX. When the fresh MOX is discharged, there exist higher fractions in 241Pu or 242Pu than the fresh MOX. This effect is shown in Figure 7. In this figure, “2nd generation MOX” is the discharged MOX at 45 GW·d/t with 7 years cooling, calculated by VISTA.
This effect is neglected in VISTA calculation, because second generation MOX is expected to be mixed with fresh MOX, and therefore the generation effect would be small. Of course, if we need higher accuracy in MOX calculation, it would be necessary to include this effect.
1 It is calculated by using 33 MW·d/kg Burnup, 3.3% Enriched PWR fuel after 7 years of cooling and reprocessing time.
20

Fig. 7. Percent fraction of Pu nuclides in fresh MOX and 2nd generation MOX.
2.5.6.4. Total Pu amount for fresh MOX
VISTA user can specify the burnup trend and corresponding enrichment trend as the future prediction, for both UO2 fuel and MOX fuel respectively. For the convenience to the user, corresponding sets of burnup and enrichment are supplied for both UO2 and MOX, which are described as follows.
Conversion factor from 235U enrichment to total Pu amount
Below equation is used in VISTA to calculate initial total plutonium amount in fresh MOX fuel. The equation is proposed by a French consultant for VISTA, based on their experience.
Initial Total Pu = 235Uenr * (1.6 + 0.23*(BU - 33)/10)
where 235Uenr is the enrichment of uranium fuel for the same discharge burnup, and BU is the discharge burnup.
This equation is verified by another approach. There is an open report from JAERI [17], which provides the Pu composition at the initial and discharge burnup of 33/45/60 GW·d/t uranium fuel.
Unfortunately, this MOX calculation assumes that the initial Pu vector is constant for any burnup. It assumes the Pu vector from 33 GW·d/t U fuel. So, it is assumed that 45 GW·d/t MOX uses discharged Pu from 45 GW·d/t U fuel. Also, for 60 GW·d/t MOX, Pu from 60 GW·d/t U fuel is used. Then, a little bit higher Pu-total enrichment for 45/60 GW·d/t MOX fuel is estimated. Using this corrected Pu-total, the ratio of Total Pu to 235U enrichment (Conversion Factor from 235U to Pu-total) is calculated. These values are shown in TABLE 5 and Figure 8.
21

TABLE 5. CONVERSION FACTOR FROM 235U ENRICHMENT TO TOTAL Pu IN FRESH MOX
Burnup (GW·d/t)
JAERI report [17]
VISTA
33 1.72 1.60
45 1.85 1.88
60 1.98 2.22
Fig. 8. Conversion factor from 235U enrichment to Total-Pu.
Even after the above correction, there is some difference between VISTA and current verification study. But, the difference is 10% or so in 60 GW·d/t. That JAERI report does not perform full core calculation for MOX. It uses assembly calculation, and estimates full core design, and there may be some error, especially for high burnup point. If the VISTA user has more accurate design value, it is possible to input that value, anytime. So, it is concluded that VISTA assumption is acceptable as an initial estimation or just a recommended value.
Figure 9 shows the relation between Pu-total content and burnup for MOX fuel. Also, the relation between 235U enrichment and burnup for UO2 is shown. Of course, these data are just the recommended values, and user can specify their own values.
22
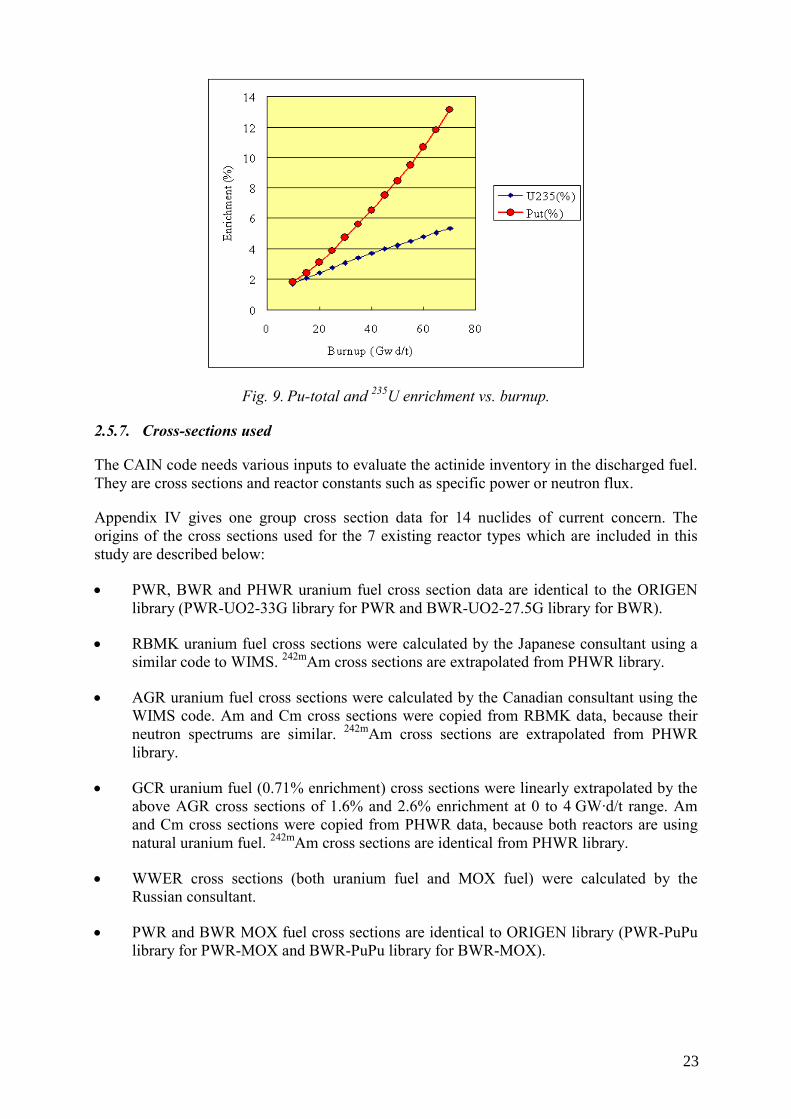
Fig. 9. Pu-total and 235U enrichment vs. burnup.
2.5.7. Cross-sections used
The CAIN code needs various inputs to evaluate the actinide inventory in the discharged fuel. They are cross sections and reactor constants such as specific power or neutron flux.
Appendix IV gives one group cross section data for 14 nuclides of current concern. The origins of the cross sections used for the 7 existing reactor types which are included in this study are described below:
• PWR, BWR and PHWR uranium fuel cross section data are identical to the ORIGEN library (PWR-UO2-33G library for PWR and BWR-UO2-27.5G library for BWR).
• RBMK uranium fuel cross sections were calculated by the Japanese consultant using a similar code to WIMS. 242mAm cross sections are extrapolated from PHWR library.
• AGR uranium fuel cross sections were calculated by the Canadian consultant using the WIMS code. Am and Cm cross sections were copied from RBMK data, because their neutron spectrums are similar. 242mAm cross sections are extrapolated from PHWR library.
• GCR uranium fuel (0.71% enrichment) cross sections were linearly extrapolated by the above AGR cross sections of 1.6% and 2.6% enrichment at 0 to 4 GW·d/t range. Am and Cm cross sections were copied from PHWR data, because both reactors are using natural uranium fuel. 242mAm cross sections are identical from PHWR library.
• WWER cross sections (both uranium fuel and MOX fuel) were calculated by the Russian consultant.
• PWR and BWR MOX fuel cross sections are identical to ORIGEN library (PWR-PuPu library for PWR-MOX and BWR-PuPu library for BWR-MOX).
23

2.5.8. Other constants
Other constants, which CAIN code requires are the specific power and the neutron flux and so on. The list of all constants which are required input parameters for CAIN code is given in TABLE 6.
The specific power (kW/kg) was calculated using the data in the Directory of Nuclear Power Plants in the World [18]. It may vary plant by plant, so the typical plant was selected. This constant is used to convert the discharge burnup to the irradiation time.
The neutron fluxes for PWR/BWR/PHWR are identical to the ORIGEN code. The neutron flux for RBMK was estimated using a similar code to WIMS by the Japanese consultant. The neutron fluxes for AGR/GCR are estimated to be proportional to kW/kg, using the proportional constant derived from PWR/BWR cases.
One more constant is reference enrichment. Since single cross section set is applied for different enrichment fuels, actual neutron flux can be modified in the CAIN code using the following formula. Although this adjustment has a very small effect on the results it might increase the speed of the calculation.
2/)1 ENR(a) /ENR(r) (x (r) (a) +Φ=Φ
where
flux neutron Actual: (a)Φ
flux neutron Reference : (r)Φ
enrichmentReference : ENR(r)
enrichment Actual: ENR(a)
TABLE 6. REACTOR CONSTANTS USED IN VISTA
Reactor Type Specific Power (KW/kg)
Reference Neutron Flux [n/(cm2.sec)]
Reference Enrichment (%)
PWR 37.5 2.99x10¹⁴ 4.0
BWR 25.9 1.997x10¹⁴ 4.0
PHWR 18.8 1.85x10¹⁴ 0.71
RBMK 15.75 1.48x10¹⁴ 1.8
AGR 10.9 8.75x10¹⁴ 2.6
GCR 3.33 2.66x10¹⁴ 0.71
WWER 45.8 3.747x10¹⁴ 4.36
24

2.5.9. Isotopic composition of spent fuels
Isotopic composition in the discharged spent fuel is calculated by the CAIN code using the above model and constants. In these calculations, initial enrichments which were supplied by the IAEA (Figure10) are used for corresponding discharge burnups. Since initial 235U burns and lower Pu saturates at discharged burnup, high accuracy for this relation is not required for burnup calculation. The isotopic composition results are given in Appendix V.
Fig. 10. Discharge burnup vs. enrichment.
2.6. Validation and benchmarking
Validation and benchmarking of VISTA simulation system with its reactor depletion model CAIN was performed in two steps. The first step involves the validation of reactor depletion model CAIN and the second step involves the validation of overall material flow model.
2.6.1. Validation of reactor model, CAIN
Validation of CAIN model was carried out separately for uranium fuels and MOX fuels. CAIN results were compared to the results of other well known computer programmes such as ORIGEN and WIMS and to the actual measurement results wherever possible. The details of the validation studies and the results are given in Appendix VI.
The results show that the results of CAIN model fits very well with the results of ORIGEN code. CAIN results show good agreement with also actual measurements. The CAIN results agree very well with WIMS code except some higher actinides. Considering that the CAIN is one group model and WIMS is multi-group model, the results are acceptable.
25
From the results of validation and benchmarking studies, it can be concluded that CAIN code can be used in VISTA simulation system in order to estimate the isotopic composition of spent nuclear fuel in discharge time and after cooling.
2.6.2. Validation of overall nuclear material flow calculations
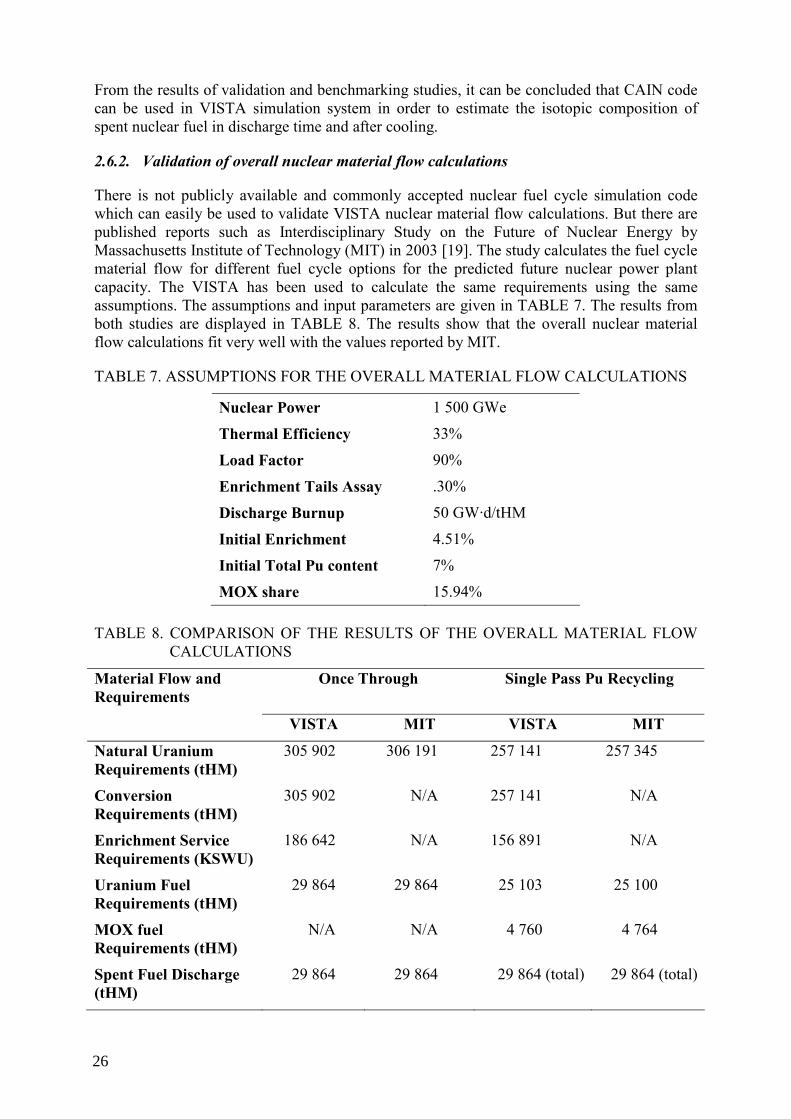
There is not publicly available and commonly accepted nuclear fuel cycle simulation code which can easily be used to validate VISTA nuclear material flow calculations. But there are published reports such as Interdisciplinary Study on the Future of Nuclear Energy by Massachusetts Institute of Technology (MIT) in 2003 [19]. The study calculates the fuel cycle material flow for different fuel cycle options for the predicted future nuclear power plant capacity. The VISTA has been used to calculate the same requirements using the same assumptions. The assumptions and input parameters are given in TABLE 7. The results from both studies are displayed in TABLE 8. The results show that the overall nuclear material flow calculations fit very well with the values reported by MIT.
TABLE 7. ASSUMPTIONS FOR THE OVERALL MATERIAL FLOW CALCULATIONS
Nuclear Power 1 500 GWe
Thermal Efficiency 33%
Load Factor 90%
Enrichment Tails Assay .30%
Discharge Burnup 50 GW·d/tHM
Initial Enrichment 4.51%
Initial Total Pu content 7%
MOX share 15.94% TABLE 8. COMPARISON OF THE RESULTS OF THE OVERALL MATERIAL FLOW
CALCULATIONS
Material Flow and Requirements
Once Through Single Pass Pu Recycling
VISTA MIT VISTA MIT
Natural Uranium Requirements (tHM)
305 902 306 191 257 141 257 345
Conversion Requirements (tHM)
305 902 N/A 257 141 N/A
Enrichment Service Requirements (KSWU)
186 642 N/A 156 891 N/A
Uranium Fuel Requirements (tHM)
29 864 29 864 25 103 25 100
MOX fuel Requirements (tHM)
N/A N/A 4 760 4 764
Spent Fuel Discharge (tHM)
29 864 29 864 29 864 (total) 29 864 (total)
26

3. EXAMPLE SCENARIO WITH INPUT AND OUTPUT PARAMETERS
In order to demonstrate the capabilities of the VISTA simulation code to the readers, a sample study was performed and a result set was obtained. The available scenarios, selection of scenarios, input parameters and outputs for the selected scenarios are given in following sections.
3.1. Input parameters
The VISTA input parameters contain datasets which are combination of historical actual data and estimations for future projections. The simulation system database contains historical data from the beginning of the commercial nuclear activities. The historical data has been retrieved from the actual reported data wherever possible. The data sources are usually well known databases such as IAEA PRIS database [3]. The other data sources include reports which are generated by consultant companies such as NAC International’s Nuclear Industry Status Report [20]. The data reported to the IAEA conferences or publications are also used in some cases.
For the purpose of this publication the simulation system has been used for the estimation of the world needs of fuel cycle material and services associated with several nuclear energy programmes and spent fuel policies up to 2050. The different reactor and fuel cycle characteristics and their evolution over the period up to 2050 were used in this simulation system. Although the raw database has reactor by reactor data for most of the input parameters, all datasets used in this study are realistic mean values for each reactor type worldwide. They do not reflect any country specific characteristics, or performance of reactors and fuel cycle facilities.
Scenario selection for this TECDOC is also described at the end of this section.
3.1.1. Nuclear power
Historical nuclear power data comes from IAEA PRIS database [3]. PRIS is one of the most comprehensive and commonly used databases on nuclear power plants and their operating experience in the world. Future nuclear power projection is based on the IAEA Energy, Electricity and Nuclear Power Estimates for the Period up to 2030, 2005 Edition [4]. Estimations from the publication are based on many factors and reflect the most realistic situation for the period that it covers. The publication provides estimations until year 2030. VISTA then extrapolates the estimations up to the year 2050 by linear extrapolation technique.
The publication gives two variants for the nuclear power evolution. One is low and the other is high variant. VISTA uses those two variants as well as their arithmetic averages. The low nuclear power capacity case is called P0, and the medium case is called P1 and the high case is called P2 in VISTA. The variation of the parameters is displayed in Figure 11.
27
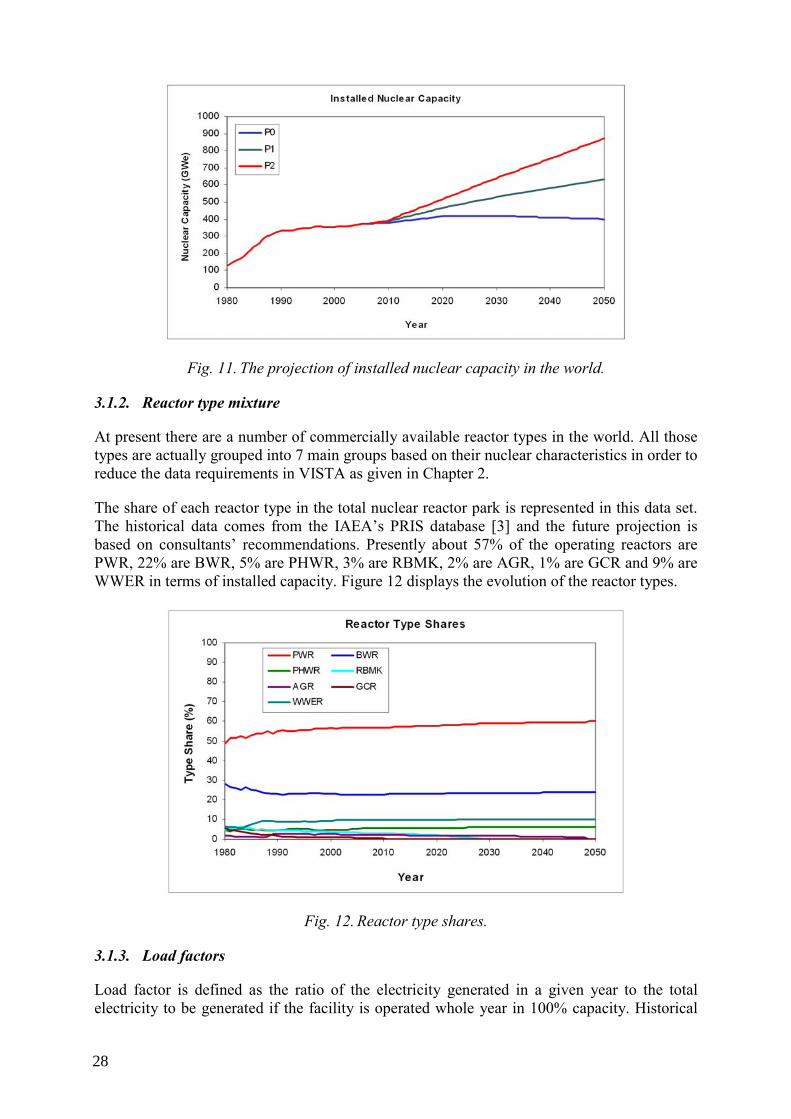
Fig. 11. The projection of installed nuclear capacity in the world.
3.1.2. Reactor type mixture
At present there are a number of commercially available reactor types in the world. All those types are actually grouped into 7 main groups based on their nuclear characteristics in order to reduce the data requirements in VISTA as given in Chapter 2.
The share of each reactor type in the total nuclear reactor park is represented in this data set. The historical data comes from the IAEA’s PRIS database [3] and the future projection is based on consultants’ recommendations. Presently about 57% of the operating reactors are PWR, 22% are BWR, 5% are PHWR, 3% are RBMK, 2% are AGR, 1% are GCR and 9% are WWER in terms of installed capacity. Figure 12 displays the evolution of the reactor types.
Fig. 12. Reactor type shares.
3.1.3. Load factors
Load factor is defined as the ratio of the electricity generated in a given year to the total electricity to be generated if the facility is operated whole year in 100% capacity. Historical
28

load factor values come from IAEA PRIS database [3] and the future projection is based on the trends in operating experience and performance of the current reactor park. Figure 13 shows average annual load factors.
Fig. 13. Average annual load factors.
3.1.4. LWR reprocessing scenario
Different countries chose different alternative fuel cycle options based on their specific policies and goals, taking into account the balance between their domestic energy resources and industrial capabilities. The choice also depends on the nuclear electricity generation growth. For some countries there would be incentives to reprocess spent fuel to recover and recycle fissile nuclear materials as a means of reducing natural uranium requirement. The recycling option can also be chosen as a means to address issues related to management of the back-end of the fuel cycle. This scenario assumes only uranium fuel from natural material is reprocessed although the VISTA is capable of having multi-cycling options with the introduction of proper data.
In the view of existing alternative fuel cycle options, VISTA has an input parameter to determine the amount of reprocessed material for each reactor type. The reprocessing ratio is defined as the ratio of the spent fuel to be reprocessed after a period of cooling time to the total spent fuel discharged in a given year. VISTA assumes that the reprocessing ratio for PWR and BWR types are same due to the lack of data for individual types. All GCR fuel is assumed to be reprocessed. There is no reprocessing for PHWR and RBMK in the selected scenario. Reprocessing data for AGR fuels were calculated from the historical reported values. Reprocessing ratio for WWER fuel is selected similar to PWR and BWR case for future projection.
VISTA has four different reprocessing scenarios in its database. First scenario assumes that reprocessing will decrease in time and there will be no reprocessing after year 2030 (R0 case). The second scenario assumes that the current reprocessing ratio will be kept at steady value through the period of calculation (R1 case). The third and the fourth scenario assume that more part of the spent fuel will be reprocessed in the future (R2 and R3 cases). The scenario chart is presented in Figure 14. The figure only shows the reprocessing ratio for PWR and BWR.
29
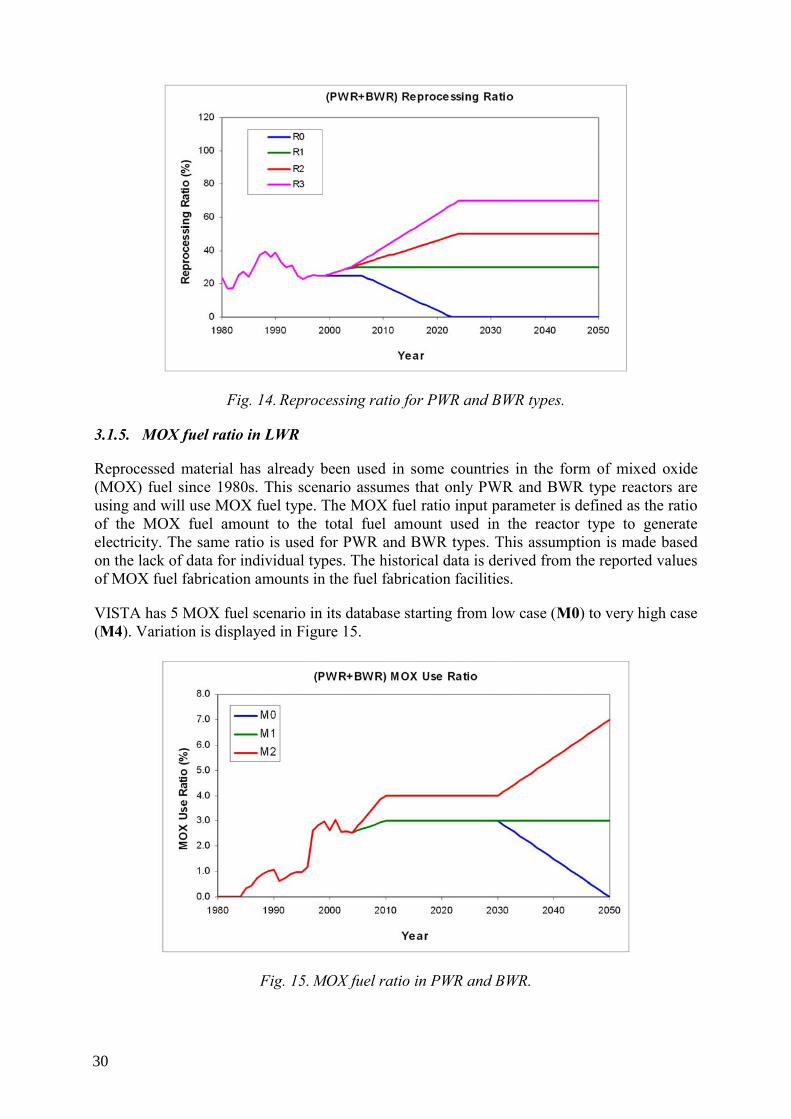
Fig. 14. Reprocessing ratio for PWR and BWR types.
3.1.5. MOX fuel ratio in LWR
Reprocessed material has already been used in some countries in the form of mixed oxide (MOX) fuel since 1980s. This scenario assumes that only PWR and BWR type reactors are using and will use MOX fuel type. The MOX fuel ratio input parameter is defined as the ratio of the MOX fuel amount to the total fuel amount used in the reactor type to generate electricity. The same ratio is used for PWR and BWR types. This assumption is made based on the lack of data for individual types. The historical data is derived from the reported values of MOX fuel fabrication amounts in the fuel fabrication facilities.
VISTA has 5 MOX fuel scenario in its database starting from low case (M0) to very high case (M4). Variation is displayed in Figure 15.
Fig. 15. MOX fuel ratio in PWR and BWR.
30

3.1.6. Discharge burnups
VISTA can use different burnup values for UOX and MOX fuel types (first and second fuel type in the fuel cycle model). However, due to the lack of historical information and simplicity of the calculation, we assumed both fuels have the same average discharge burnups. Average discharge burnup values for historical operations are calculated from the reactor by reactor data which is provided in NAC International reports [20]. The burnup projection is based on consultants’ recommendations and reflects the latest developments in fuel performance and power reactor operating experience [21][22]. Discharge burnup values are displayed in Figure 16.
Fig. 16. Average discharge burnups.
3.1.7. Initial enrichments
Average initial enrichment values for UOX fuels are calculated by using the relation between the discharge burnup and initial enrichment. This assumption is valid if the reactor fuel is burned effectively. In some cases, for some reasons, the fuel is discharged before its nominal burnup value but these are not significant amount and do not change worldwide averages so much. Calculated initial enrichment values are displayed in Figure 17. Total Pu amount for MOX fuel is calculated using the relation between the initial enrichment of UOX fuel and the total Pu amount in the same loading Figure 9.
31

Fig. 17. Initial enrichment values for uranium fuels.
3.1.8. Enrichment tail assay
Average enrichment tail assay is another parameter which can be selected from different options. VISTA has three scenarios for average tail assay values. T0 is the high case and assumes that the long-term average value will be kept constant in its 2000 value (=0.30%). T1 assumes that the average tail assay will drop to 0.25% in 2025 and will be constant at that level. T2 assumes that the average tail assay will drop to 0.20% in 2025 and will be constant afterwards. T2 scenario reflects the latest rapid increase in natural uranium prices. Figure 18 shows average enrichment tail assay values.
Fig. 18. Average enrichment tail assay.
32
3.1.9. Process losses and process lag times
In reality all processes have some material losses. VISTA has input parameters for conversion, enrichment, fuel fabrication and reprocessing loss coefficients. But this study assumes that the process loss coefficients are 0 (zero-loss) for all processes due to the lack of actual data.
All processes are assumed to occur in real time with no lags except the cooling period between the reactor discharge and reprocessing time and manufacturing of MOX fuel. For PWR and BWR spent uranium fuel, cooling time is assumed to be 6 years, reprocessing time is 1 year and the MOX fuel manufacturing time is assumed to be 1 year.
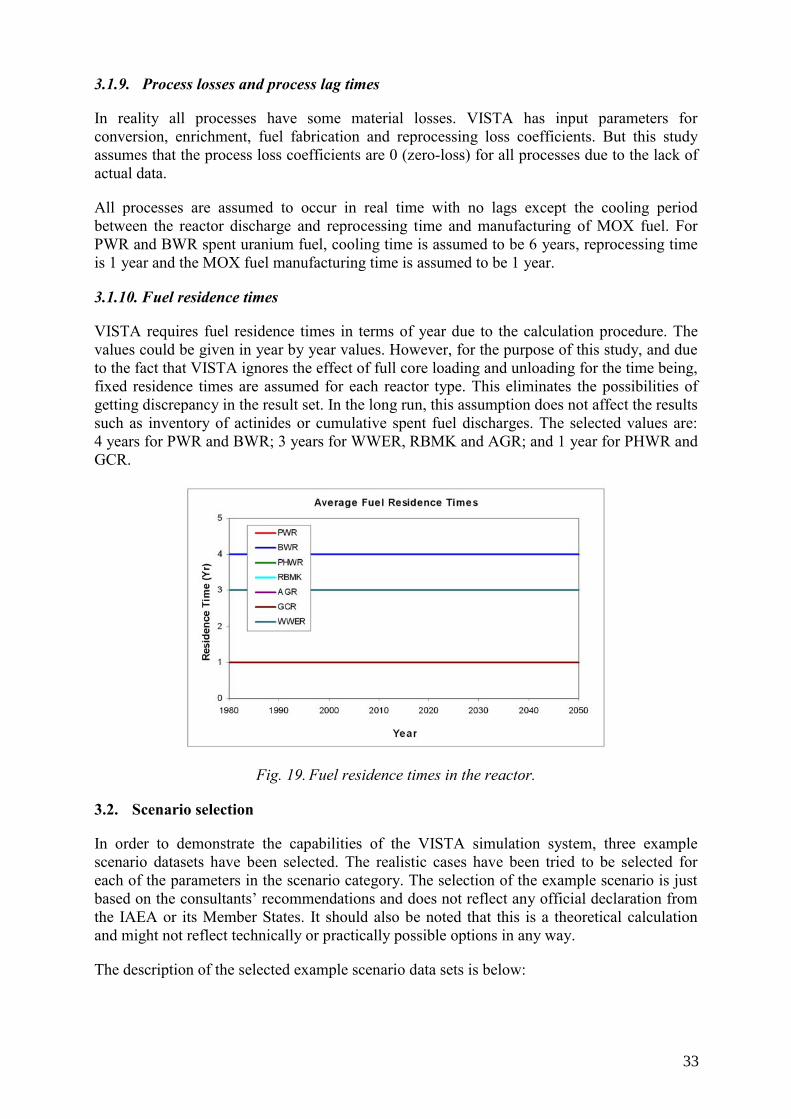
3.1.10. Fuel residence times
VISTA requires fuel residence times in terms of year due to the calculation procedure. The values could be given in year by year values. However, for the purpose of this study, and due to the fact that VISTA ignores the effect of full core loading and unloading for the time being, fixed residence times are assumed for each reactor type. This eliminates the possibilities of getting discrepancy in the result set. In the long run, this assumption does not affect the results such as inventory of actinides or cumulative spent fuel discharges. The selected values are: 4 years for PWR and BWR; 3 years for WWER, RBMK and AGR; and 1 year for PHWR and GCR.
Fig. 19. Fuel residence times in the reactor.
3.2. Scenario selection
In order to demonstrate the capabilities of the VISTA simulation system, three example scenario datasets have been selected. The realistic cases have been tried to be selected for each of the parameters in the scenario category. The selection of the example scenario is just based on the consultants’ recommendations and does not reflect any official declaration from the IAEA or its Member States. It should also be noted that this is a theoretical calculation and might not reflect technically or practically possible options in any way.
The description of the selected example scenario data sets is below:
33

• Low scenario: Low scenario is combination of low power capacity projection (P0), low reprocessing ratio (R0) and low MOX use ratio (M0). The scenario code is P0-R0-M0.
• Medium scenario: Medium scenario is combination of medium power capacity projection (P1), medium reprocessing ratio (R1) and medium MOX use ratio (M1). The scenario code is P1-R1-M1.
• High scenario: High scenario is combination of high power capacity projection (P2), high reprocessing ratio (R2) and high MOX use ratio (M2). The scenario code is P2-R2-M2.
• Enrichment tail assay: Low case has been selected (T2 in Figure 18) for all scenarios.
• All the other parameters use the basic data set, which is described in Section 3.1 of this TECDOC.
3.3. Output parameters
Several results have been selected out of complete result set from the VISTA simulation system. These results are believed to provide good overview of the capabilities of the VISTA. The results presented here focus on the material and service requirements for the main stages of the nuclear fuel cycle and total Pu discharge from the reactors. More results from the VISTA for different scenarios are presented in other publications such as [23][24][25] and [26].
Only cumulative results are presented in this TECDOC but annual results for all of the output parameters could be obtained from the VISTA code.
3.3.1. Electricity generation
First of all, the nuclear electricity generation will increase faster than the installed nuclear capacity (Figure 11) in the near future due to the better performance of the power plants. Average annual load factors have been increasing for almost all of the reactor types in the world for recent years (Figure 13). This trend is expected to continue, and the multiplication result of Figure 11 and Figure 12 is shown in Figure 20.
Fig. 20. Cumulative nuclear electricity production.
34
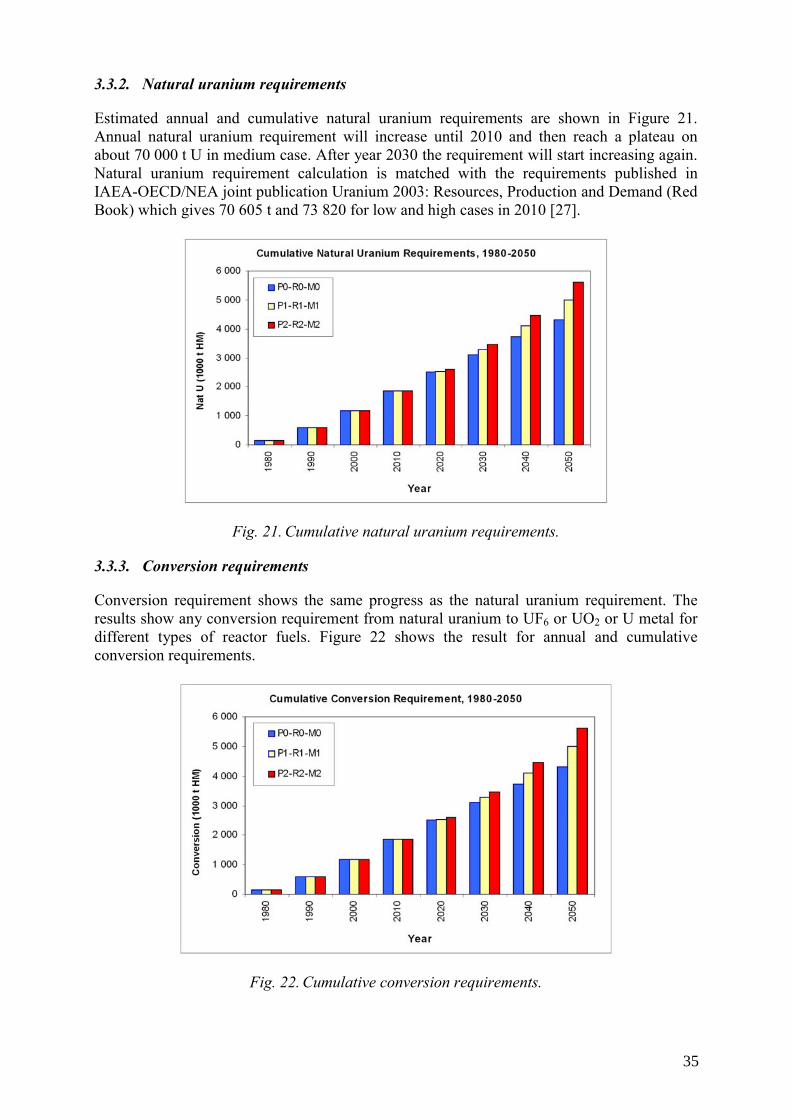
3.3.2. Natural uranium requirements
Estimated annual and cumulative natural uranium requirements are shown in Figure 21. Annual natural uranium requirement will increase until 2010 and then reach a plateau on about 70 000 t U in medium case. After year 2030 the requirement will start increasing again. Natural uranium requirement calculation is matched with the requirements published in IAEA-OECD/NEA joint publication Uranium 2003: Resources, Production and Demand (Red Book) which gives 70 605 t and 73 820 for low and high cases in 2010 [27].
Fig. 21. Cumulative natural uranium requirements.
3.3.3. Conversion requirements
Conversion requirement shows the same progress as the natural uranium requirement. The results show any conversion requirement from natural uranium to UF6 or UO2 or U metal for different types of reactor fuels. Figure 22 shows the result for annual and cumulative conversion requirements.
Fig. 22. Cumulative conversion requirements.
35
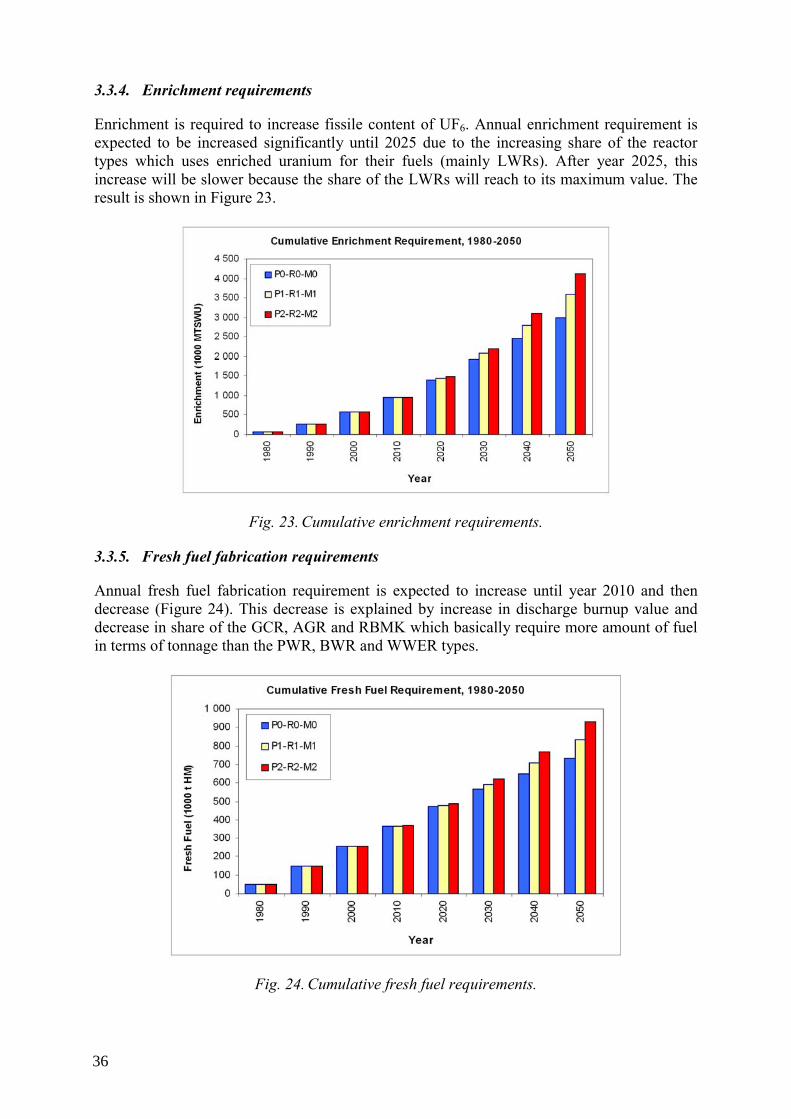
3.3.4. Enrichment requirements
Enrichment is required to increase fissile content of UF6. Annual enrichment requirement is expected to be increased significantly until 2025 due to the increasing share of the reactor types which uses enriched uranium for their fuels (mainly LWRs). After year 2025, this increase will be slower because the share of the LWRs will reach to its maximum value. The result is shown in Figure 23.
Fig. 23. Cumulative enrichment requirements.
3.3.5. Fresh fuel fabrication requirements
Annual fresh fuel fabrication requirement is expected to increase until year 2010 and then decrease (Figure 24). This decrease is explained by increase in discharge burnup value and decrease in share of the GCR, AGR and RBMK which basically require more amount of fuel in terms of tonnage than the PWR, BWR and WWER types.
Fig. 24. Cumulative fresh fuel requirements.
36

3.3.6. LWR MOX fabrication requirements
Figure 25 displays the annual and cumulative LWR MOX fuel fabrication requirements for the selected scenarios.
Fig. 25. Cumulative LWR MOX fuel fabrication requirements.
3.3.7. Spent fuel discharge amount
Discharged amount of spent fuel looks similar to the fresh fuel requirement with some lag time which actually equals to the fuel residence time in the reactor. The result is displayed in Figure 26.
Fig. 26. Cumulative spent fuel discharge amounts.
3.3.8. Reprocessing requirements
Reprocessing requirement heavily depends on the recycling strategies of the countries. For the medium case (R1), the annual reprocessing requirement will decrease until the year 2020 and
37
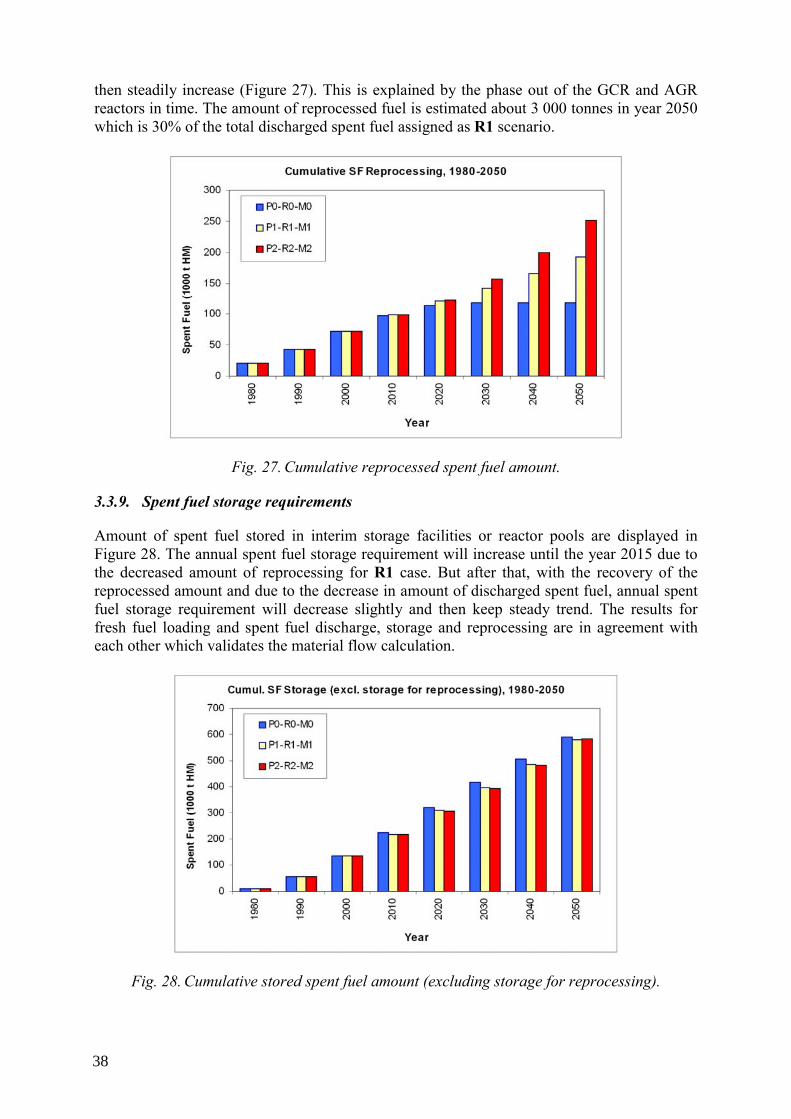
then steadily increase (Figure 27). This is explained by the phase out of the GCR and AGR reactors in time. The amount of reprocessed fuel is estimated about 3 000 tonnes in year 2050 which is 30% of the total discharged spent fuel assigned as R1 scenario.
Fig. 27. Cumulative reprocessed spent fuel amount.
3.3.9. Spent fuel storage requirements
Amount of spent fuel stored in interim storage facilities or reactor pools are displayed in Figure 28. The annual spent fuel storage requirement will increase until the year 2015 due to the decreased amount of reprocessing for R1 case. But after that, with the recovery of the reprocessed amount and due to the decrease in amount of discharged spent fuel, annual spent fuel storage requirement will decrease slightly and then keep steady trend. The results for fresh fuel loading and spent fuel discharge, storage and reprocessing are in agreement with each other which validates the material flow calculation.
Fig. 28. Cumulative stored spent fuel amount (excluding storage for reprocessing).
38
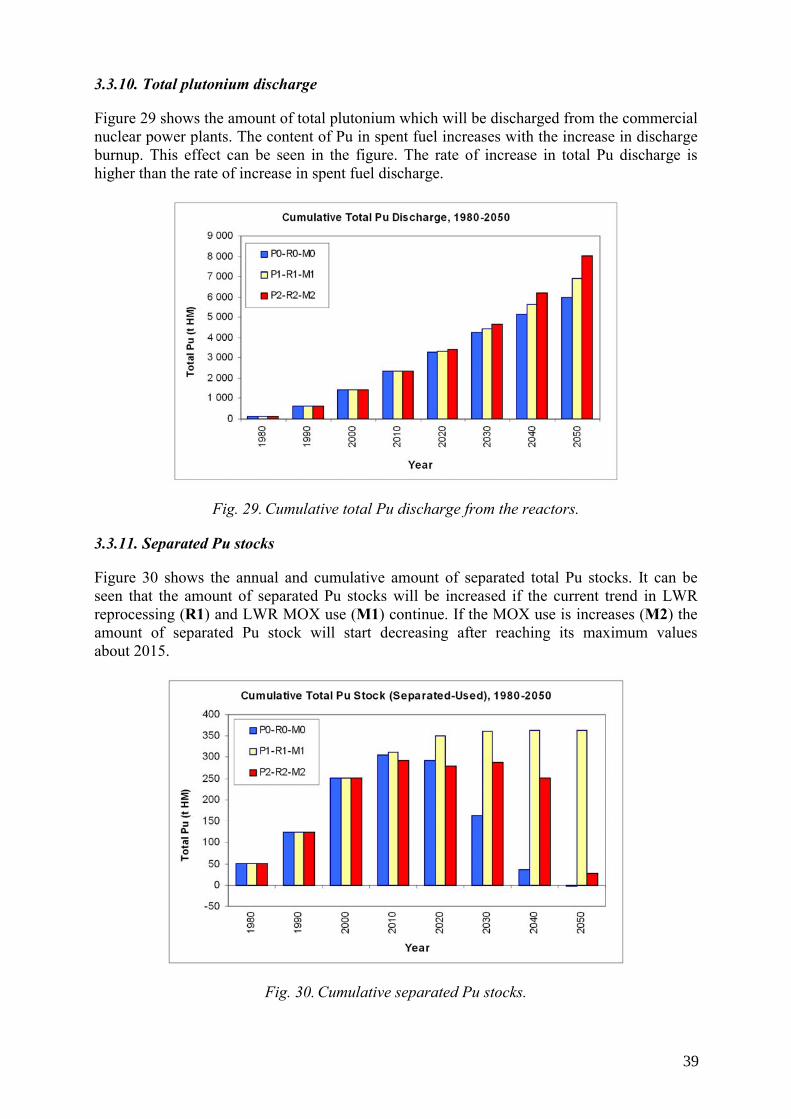
3.3.10. Total plutonium discharge
Figure 29 shows the amount of total plutonium which will be discharged from the commercial nuclear power plants. The content of Pu in spent fuel increases with the increase in discharge burnup. This effect can be seen in the figure. The rate of increase in total Pu discharge is higher than the rate of increase in spent fuel discharge.
Fig. 29. Cumulative total Pu discharge from the reactors.
3.3.11. Separated Pu stocks
Figure 30 shows the annual and cumulative amount of separated total Pu stocks. It can be seen that the amount of separated Pu stocks will be increased if the current trend in LWR reprocessing (R1) and LWR MOX use (M1) continue. If the MOX use is increases (M2) the amount of separated Pu stock will start decreasing after reaching its maximum values about 2015.
Fig. 30. Cumulative separated Pu stocks.
39

3.3.12. Minor Actinide discharge
Figure 31 displays the amount of total minor actinides (Am, Cm, Np) which will be discharged from the reactors in the next years.
Fig. 31. Cumulative total MA discharge from the reactors.
3.3.13. Minor Actinide accumulation
Figure 32 displays the amount of total minor actinides (Am, Cm, Np) which will be discharged from the reactors in the next years.
Fig. 32. Accumulated amount of MA at the end of 2005. This calculation considers the decay of all discharged material during the cooling and storage period.
40

4. SUMMARY AND CONCLUSIONS
4.1. Summary
The Nuclear Fuel Cycle Simulation System (VISTA) was developed by the IAEA to support The International Symposium on Nuclear Fuel Cycle and Reactors Strategies: Adjusting to New Realities held in Vienna, 3–6 June 1997. The objective of the code is to calculate for a period of year the nuclear fuel cycle material and service requirements and material arisings for the different fuel cycle options.
It was used by the IAEA intensively for its internal purposes since then. Starting year 2003, the IAEA decided to enable interested parties from Member States to use VISTA tool through a user interface which is accessible through the internet. For this purpose, the tool was expanded to include new and future reactor and fuel types.
VISTA consists of two modules. First one is the overall nuclear material flow module which is the main part of VISTA calculation and the second one is the fuel depletion module CAIN which calculates the spent fuel composition in discharge time and after a cooling period.
VISTA and CAIN has been validated against other available and well accepted codes such as ORIGEN and WIMS as well as the measurement results. Overall nuclear material flow was also compared with the reported values from other organizations.
As a result, we can summarize VISTA as:
• A series of algorithms linking electricity generation and nuclear fuel operating data to nuclear fuel cycle material and service requirements and spent fuel arisings;
• A simplification to nuclear fuel cycle requirements modelling, by not reflecting the actual fuelling pattern reactor by reactor. VISTA does not take into account commissioning and shutdown schedules for each reactor;
• A method to calculate reactor type average requirements. For this purpose existing nuclear power reactors are grouped into 7 types as explained in Section 2.4
• A system capable of simulating the evolution of key fuel cycle features for given parameters, e.g. load factors, fuel burnup and enrichment, tails assay, reprocessing fractions, and recycling related parameters. All parameters can be changed from reactor type to reactor type and from time period to time period.
• A tool to track the individual actinide content in any stage of the nuclear fuel cycle including in the discharged and stored spent fuel even after a period of time. So it can be used to evaluate different fuel cycle options in terms of their effectiveness in reducing the radiotoxicity of the spent fuel or reducing the natural nuclear material requirements.
• A tool designed for being an optimum mixture of accuracy, simplicity and speed.
The VISTA simulation system is available in the Integrated Nuclear Fuel Cycle Information Systems web site (http://www-nfcis.iaea.org/) [2]. Appendix I gives more information about the VISTA website.
41
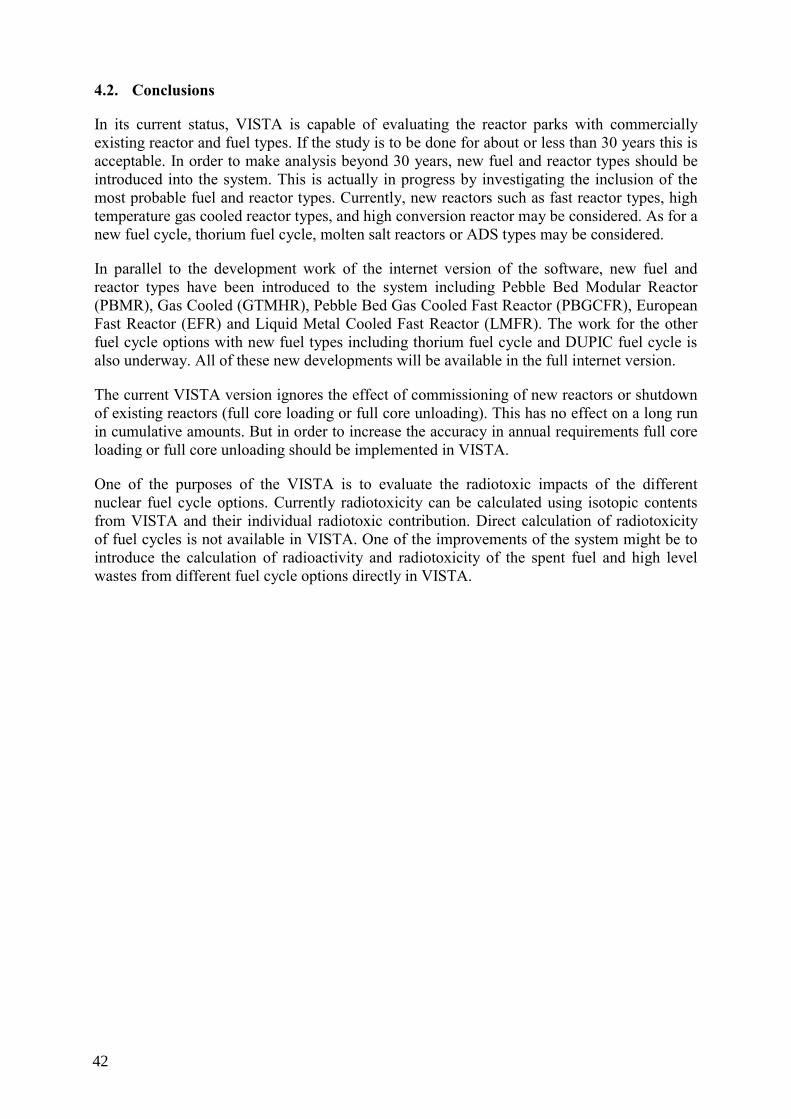
4.2. Conclusions
In its current status, VISTA is capable of evaluating the reactor parks with commercially existing reactor and fuel types. If the study is to be done for about or less than 30 years this is acceptable. In order to make analysis beyond 30 years, new fuel and reactor types should be introduced into the system. This is actually in progress by investigating the inclusion of the most probable fuel and reactor types. Currently, new reactors such as fast reactor types, high temperature gas cooled reactor types, and high conversion reactor may be considered. As for a new fuel cycle, thorium fuel cycle, molten salt reactors or ADS types may be considered.
In parallel to the development work of the internet version of the software, new fuel and reactor types have been introduced to the system including Pebble Bed Modular Reactor (PBMR), Gas Cooled (GTMHR), Pebble Bed Gas Cooled Fast Reactor (PBGCFR), European Fast Reactor (EFR) and Liquid Metal Cooled Fast Reactor (LMFR). The work for the other fuel cycle options with new fuel types including thorium fuel cycle and DUPIC fuel cycle is also underway. All of these new developments will be available in the full internet version.
The current VISTA version ignores the effect of commissioning of new reactors or shutdown of existing reactors (full core loading or full core unloading). This has no effect on a long run in cumulative amounts. But in order to increase the accuracy in annual requirements full core loading or full core unloading should be implemented in VISTA.
One of the purposes of the VISTA is to evaluate the radiotoxic impacts of the different nuclear fuel cycle options. Currently radiotoxicity can be calculated using isotopic contents from VISTA and their individual radiotoxic contribution. Direct calculation of radiotoxicity of fuel cycles is not available in VISTA. One of the improvements of the system might be to introduce the calculation of radioactivity and radiotoxicity of the spent fuel and high level wastes from different fuel cycle options directly in VISTA.
42
Appendix I VISTA WEBSITE
A web site has been developed to disseminate the VISTA to the Member States. The first phase of the web site included a detailed description of the simulation system including its fuel depletion model CAIN. A simple material flow calculation tool was also implemented in the first phase of the development.
The second phase of the VISTA web site development aimed at having an internet version of the VISTA tool with all capabilities: allowing users to create their own scenarios with their own data, creating the combination of the scenarios, selecting the requested result set. The web site is planned to have all the tools necessary to create and edit scenarios including data entry, chart displays.
The main internet address of the web site is http://www-nfcis.iaea.org/ which hosts actually more than VISTA. Some other IAEA databases which are related to the nuclear fuel cycle are also published in the same web site. The web site requires simple registration and login procedure only for statistical purposes. Everybody who has a valid email address can register and then use the system freely.
I.1. First phase of the development
The main purpose of the first phase of the VISTA web site development was to announce the system to interested parties. The development included the background information, the description of the model, an example study with inputs and outputs and a simple calculation tool which enables users to select their own fuel cycle parameters and make material flow calculation for a given year. Figure 33 shows web page which illustrates the information flow in the VISTA simulation system.
Figure 34 displays the page which is used for parameter entry by the users of the calculation tool. The form is filled with some default entries when it is first visited. The users, then, can either use those default data or freely enter the input parameters such as the nuclear capacity, or reactor type, or reprocessing ratio. After the selection and entrance of the material flow calculation is one-click away. When the user click the calculate button in just a few seconds, based on the speed of the internet connection of course, the results are displayed in diagram form in Figure 35.
43

Fig. 33. Description page from the VISTA web site.
Fig. 34. Data entry part of the simple material flow calculation too from VISTA web site.
44
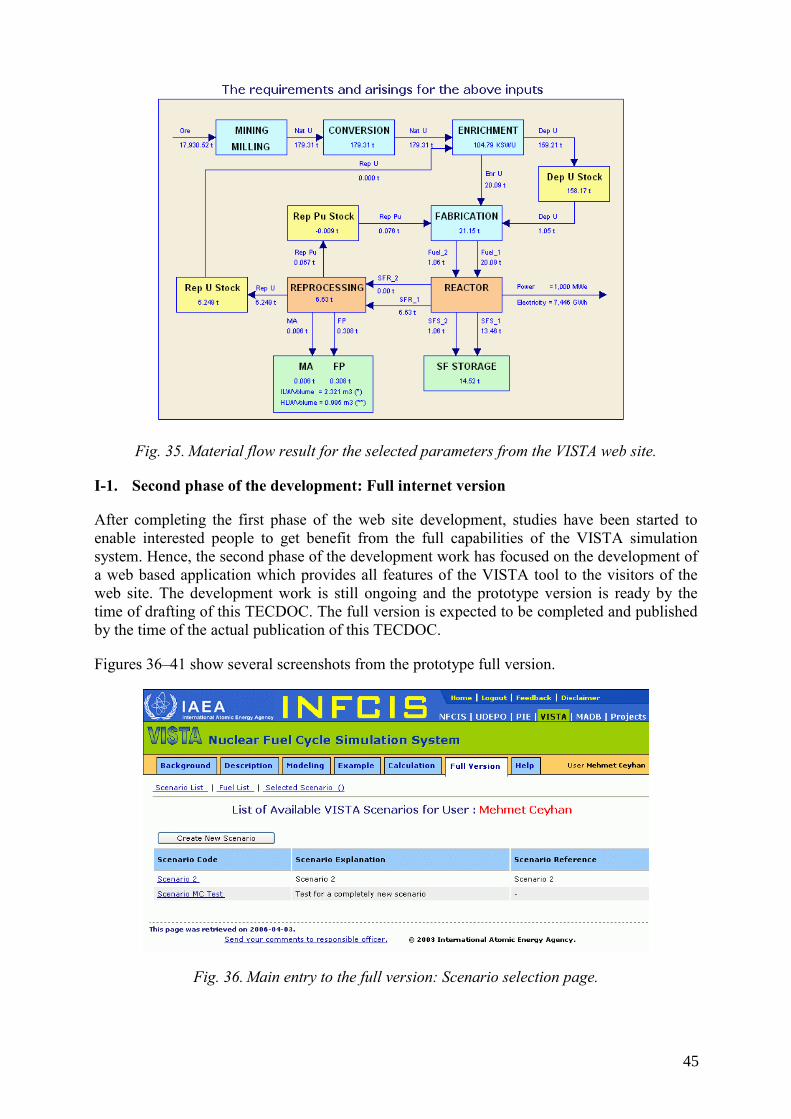
Fig. 35. Material flow result for the selected parameters from the VISTA web site.
I-1. Second phase of the development: Full internet version
After completing the first phase of the web site development, studies have been started to enable interested people to get benefit from the full capabilities of the VISTA simulation system. Hence, the second phase of the development work has focused on the development of a web based application which provides all features of the VISTA tool to the visitors of the web site. The development work is still ongoing and the prototype version is ready by the time of drafting of this TECDOC. The full version is expected to be completed and published by the time of the actual publication of this TECDOC.
Figures 36–41 show several screenshots from the prototype full version.
Fig. 36. Main entry to the full version: Scenario selection page.
45

Fig. 37. Description of the scenario and the selection of scenario parameters.
Fig. 38. Entering reactor types for the selected scenario.
46
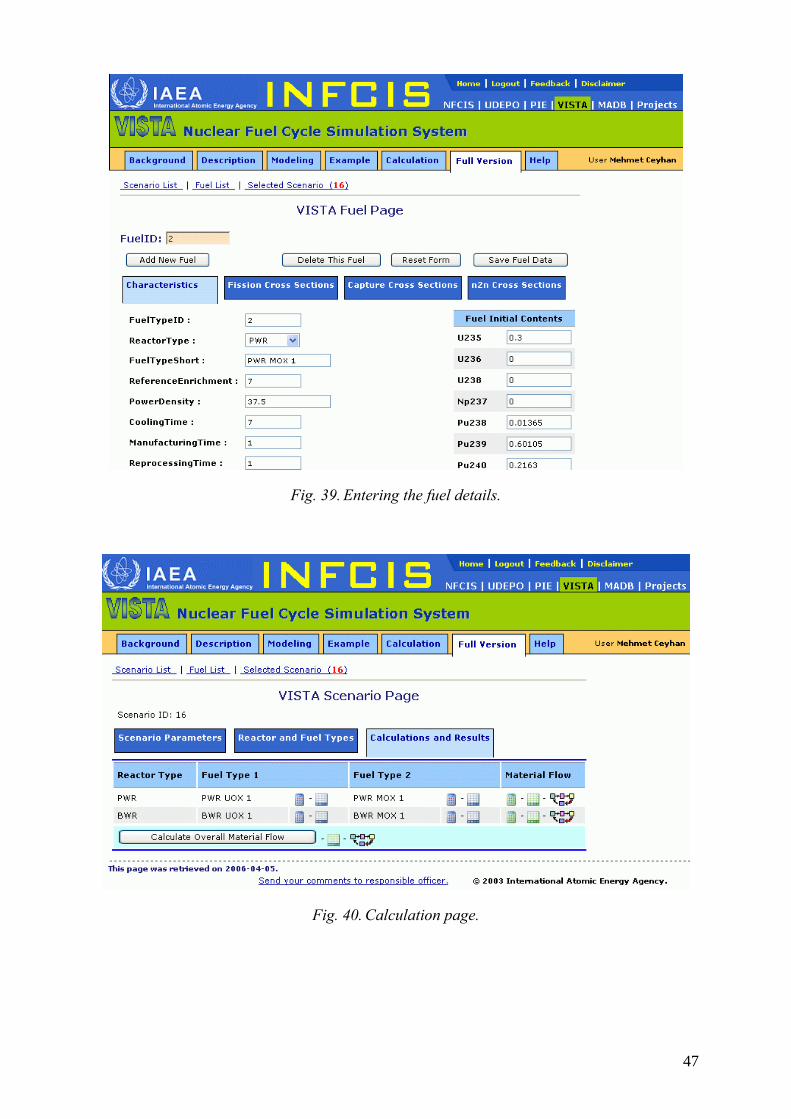
Fig. 39. Entering the fuel details.
Fig. 40. Calculation page.
47
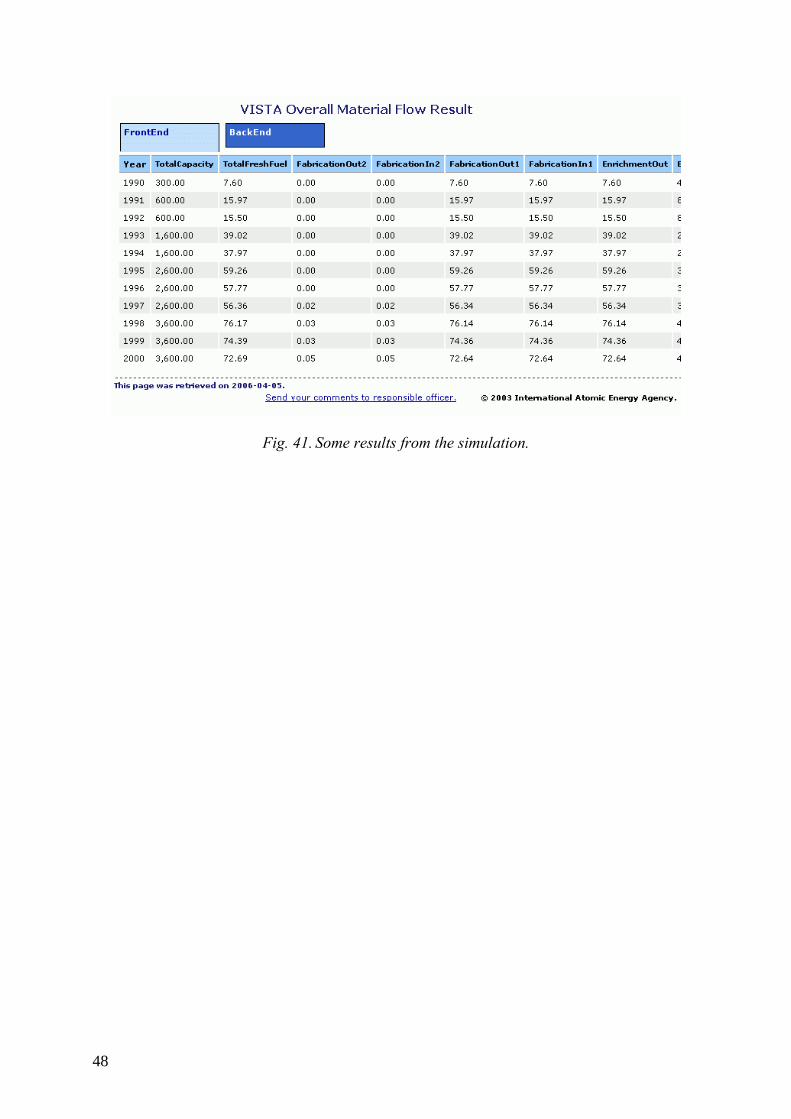
Fig. 41. Some results from the simulation.
48

Appendix II VISTA CALCULATION MODEL
The VISTA calculates annual average fuel cycle material and service requirements and material arisings and, whenever relevant, cumulative amounts by summing annual amounts. The mathematical model of the fuel cycle calculations has been developed by tracking the nuclear material from the beginning of the cycle to the end of cycle based on material balance principle.
The formulas which are given below in details are limited to the model used for this publication. Calculations are performed separately for each reactor type. The MOX fuel is produced by using the plutonium separated by reprocessing spent fuel and the depleted uranium from enrichment facilities. The lead times between fuel discharges, reprocessing and MOX fuel fabrication are taken into account in the calculations. Use of reprocessed uranium in uranium fuel is also eliminated from the calculation.
II.1. Definition of parameters (variable):
• Year : Calculation year
• Type : Reactor type
• Ft : Fuel type
• NuclearCapacity(year) : Total nuclear capacity by year
• ReactorMix(type,year) : Ratio of nuclear power by reactor type and year
• LoadFactor(type,year) : Average load factor by reactor type and year
• Efficiency(type,year) : Average thermal efficiency by reactor type and year
• Burnup(type,year,ft) : Average discharge burnup by reactor type, year and fuel type
• Share2Type(type,year,ft) : Ratio of second fuel type (ft=2 in all cases)
• Reprocessing(type,year,ft) : Reprocessing ratio by reactor type, year and fuel type
• Type2Uranium(type,year) : Uranium source for second type fuel (DepU, RepU or NatU) by reactor type and year (for this publication, uranium source for second fuel type is limited to DepU from enrichment process)
• Enrichment(type,year,ft) : Initial enrichment in fresh fuel by reactor type, year and fuel type (it is the amount of total Pu in case of U-Pu MOX fuel)
• Multirecycling : Multirecycling parameter; 0 for no-multirecycling, 1 for multi-recycling.
• Residence(type,year,ft) : Fuel residence time in core by reactor type, year and fuel type
• TailsAssay(year) : Average enrichment tails assay by year
49

• EnrichmentLoss, FabricationLoss, ReprocessingLoss, ConversionLoss : Process loss coefficients for each of the respective processes
• ReprocessingCooling(type,year,ft) : Cooling time before reprocessing by reactor type, year and fuel type
• FabricationTime(type,year,ft) : Fuel fabrication times by reactor type, year and fuel type
• ReprocessingTime(type,year,ft) : Reprocessing time by reactor type, year and fuel type
II.2. Mathematical Model
The calculation steps are given below and follow the order of actual algorithm for each reactor type. Process losses are ignored in the formulas for easy reading.
Net nuclear capacity by reactor type (GWe)
ity(year)TotalCapac* year)(type,ReactorMix year)ty(type,TypeCapaci =
Equilibrium core (tHM)
year))pe,(Burnup(ty* year)y(type,(Efficienc
year)(type,LoadFactor* year)type,Residence(* 365* year)ty(type,TypeCapaci year)ype,FullCore(t =
Annual fresh fuel requirements (tHM)
year)type,Residence( / year)ype,FullCore(t year)otal(type,FreshFuelT =
Annual fuel loading (tHM)
Two categories of fuel have to be considered to calculate annual fuel loading in reactors. Index ft in below formulas corresponds to the fuel types in the material flow model. 2 and 1 refers to fuel type 2 and fuel type 1 respectively (ft=2, ft=1).
If there is enough reprocessed material in the stockpile
year,2)(type,Share2Type*year)otal(type,FreshFuelT year,2)type,FreshFuel( =
else
0 year,2)type,FreshFuel( =
year,2)type,FreshFuel(-year)otal(type,FreshFuelT year,1)type,FreshFuel( =
Annual fuel unloading (tHM)
Annual fuel unloading is calculated for each fuel type taking into account the residence time of fuels in reactor. It means any fuel is discharged after burning in reactor for its residence time.
ft)ft),year,type,Residence(-yeartype,FreshFuel( ft)year,SFD(type, =
∑=ft
ft)year,SFD(type, year)ype,SFDTotal(t
50

Spent fuel route (tHM)
Unloaded spent fuel can be either reprocessed or disposed of directly, depending on the type of reactor and fuel, and on the strategy considered. Spent fuel of all reactor types except LWRs is never reprocessed according to the simulation. The shares of LWR fuels that are reprocessed vary depending on the strategy considered. Simulation considers that the initial content of the second fuel type is same and the fuel can be recycled unlimited times.
Spent fuel to be stored for recycling (tHM)
)ft,year,type(ngReprocessi*ft)year, SFD(type, ft)year,SFRS(type, =
∑=ft
year,ft)SFRS(type, type,year)SFRSTotal(
Spent fuel to be stored for future use (or for disposal) (tHM)
ft)year,SFRS(type,-ft)year, SFD(type, ft)year,SFS(type, =
∑=ft
ft)year,SFS(type, year)ype,SFSTotal(t
Reprocessing (tHM)
ft)year1,, SFRS(type ft)year,SFR(type, =
where
ft)year,e,ngTime(typReprocessift)year,type,ngCooling(Reprocessiyear2(ft) +=
year2(ft)-yearyear1(ft) =
∑=ft
ft)year,SFR(type, year)ype,SFRTotal(t
Availability of reprocessed material for fuel type 2 (Pu in case of MOX fuel) (tHM)
The availability of reprocessed material is calculated by calculating the isotopic content of spent fuel. The fuel depletion code CAIN is used to calculate isotopic content of spent fuel. There is also possibility to use actinide tables from other authoritative depletion codes such as ORIGEN. CAIN calculates isotopic composition of spent nuclear fuels for different initial fissile content, different discharge burnup and different cooling times.
)year2(ft))n,ft,year1(ft),(type,NucContent*ft)year,SFR(type, n)year,ype,NucStock(tft∑=
where
n)year,ype,NucStock(t is the available isotope n amount from reprocessing
year2(ft))n,ft,year1,(type,NucContent is the content of isotope n in spent fuel type ft after cooling time year2
ft)year,e,ngTime(typReprocessift)year,type,ngCooling(Reprocessiyear2(ft) +=
ear2(ft)y-yearyear1(ft) =
51
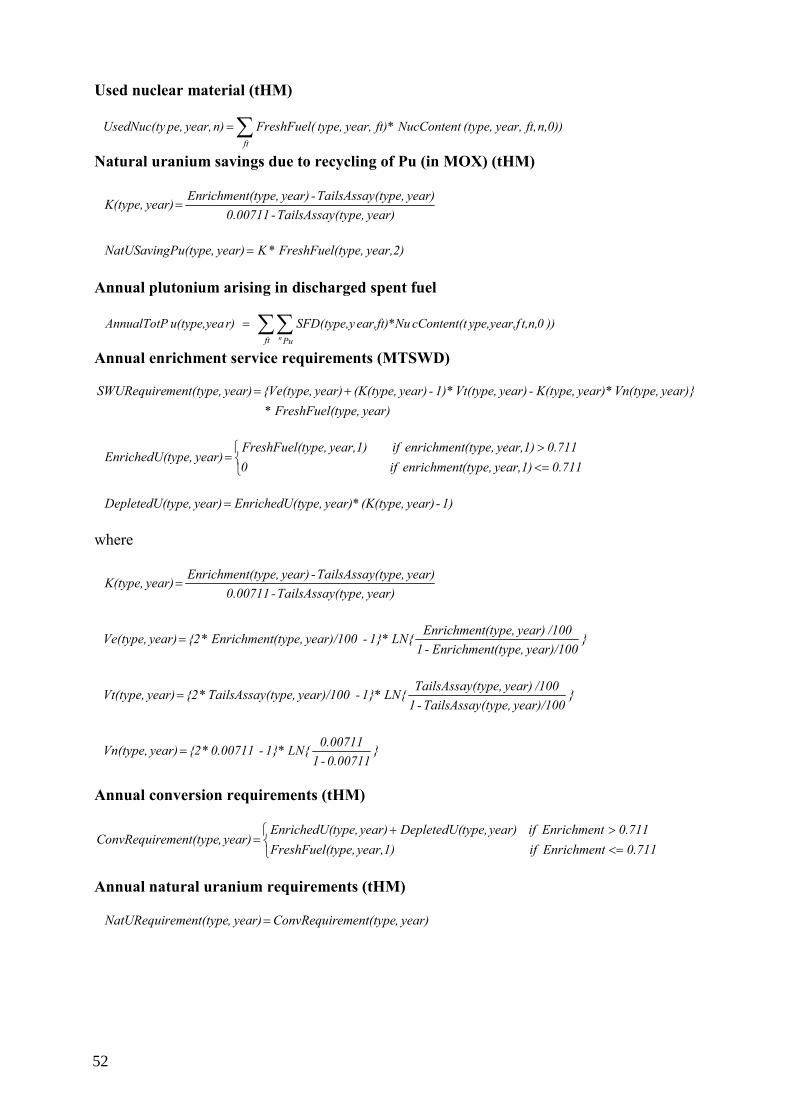
Used nuclear material (tHM)
∑=ft
n,0))ft,year,(type,NucContentft)*year,type,FreshFuel( n)year,pe,UsedNuc(ty
Natural uranium savings due to recycling of Pu (in MOX) (tHM)
year)(type,TailsAssay- 0.00711year)(type,TailsAssay- year)(type,Enrichment
year)K(type, =
year,2)ype,reshFuel(tF *K year)Pu(type,NatUSaving =
Annual plutonium arising in discharged spent fuel
∑∑=ft Pun
)) 0t,n,ype,year,fcContent(tear,ft)*NuSFD(type,y r) u(type,yeaAnnualTotP
Annual enrichment service requirements (MTSWD)
year)type,FreshFuel(* year)}Vn(type,* year)K(type, - year)Vt(type,* 1) - year)(K(type, year){Ve(type, year)ment(type,SWURequire +=
⎩⎨⎧
<=>
=0.711year,1)(type,enrichment if 0
0.711year,1)(type,enrichment if year,1)type,FreshFuel( year)type,EnrichedU(
1)-year)(K(type,*year)ype,nrichedU(tE year)type,DepletedU( =
where
year)(type,TailsAssay- 0.00711
year)(type,TailsAssay- year)(type,Enrichment year)K(type, =
}year)/100(type,Enrichment - 1
/100 year)(type,EnrichmentLN{* 1} - year)/100(type,Enrichment* {2 year)Ve(type, =
}year)/100(type,TailsAssay - 1
/100 year)(type,TailsAssayLN{* 1} - year)/100(type,TailsAssay* {2 year)Vt(type, =
}0.00711 - 1
0.00711LN{* 1} - 0.00711* {2 year)Vn(type, =
Annual conversion requirements (tHM)
0.711Enrichment if year,1)type,FreshFuel(
0.711Enrichment if year)type,DepletedU(year)type,EnrichedU( year),ement(typeConvRequir⎩⎨⎧
<=>+
=
Annual natural uranium requirements (tHM)
year),ement(typeConvRequir year),ement(typeNatURequir =
52
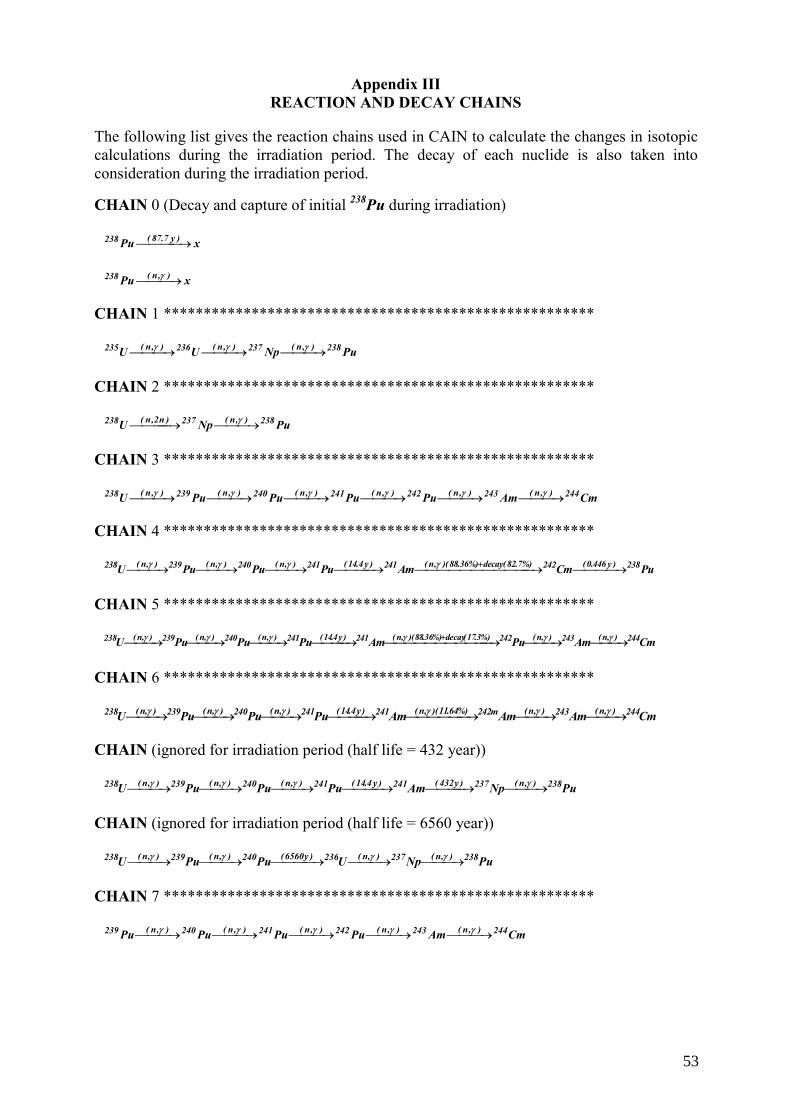
Appendix III REACTION AND DECAY CHAINS
The following list gives the reaction chains used in CAIN to calculate the changes in isotopic calculations during the irradiation period. The decay of each nuclide is also taken into consideration during the irradiation period.
CHAIN 0 (Decay and capture of initial 238Pu during irradiation)
xPu )y7.87(238 ⎯⎯⎯ →⎯
xPu ),n(238 ⎯⎯ →⎯ γ
CHAIN 1 ******************************************************
PuNpUU 238),n(237),n(236),n(235 ⎯⎯ →⎯⎯⎯ →⎯⎯⎯ →⎯ γγγ
CHAIN 2 ******************************************************
PuNpU 238),n(237)n2,n(238 ⎯⎯ →⎯⎯⎯⎯ →⎯ γ
CHAIN 3 ******************************************************
CmAmPuPuPuPuU 244),n(243),n(242),n(241),n(240),n(239),n(238 ⎯⎯ →⎯⎯⎯ →⎯⎯⎯ →⎯⎯⎯ →⎯⎯⎯ →⎯⎯⎯ →⎯ γγγγγγ
CHAIN 4 ******************************************************
PuCmAmPuPuPuU 238)y446.0(242%)7.82(decay%)36.88)(,n(241)y4.14(241),n(240),n(239),n(238 ⎯⎯⎯ →⎯⎯⎯⎯⎯⎯⎯⎯⎯⎯⎯ →⎯⎯⎯⎯ →⎯⎯⎯ →⎯⎯⎯ →⎯⎯⎯ →⎯ +γγγγ CHAIN 5 ******************************************************
CmAmPuAmPuPuPuU 244),n(243),n(242%)3.17(decay%)36.88)(,n(241)y4.14(241),n(240),n(239),n(238 ⎯⎯ →⎯⎯⎯ →⎯⎯⎯⎯⎯⎯⎯⎯⎯⎯⎯ →⎯⎯⎯⎯ →⎯⎯⎯ →⎯⎯⎯ →⎯⎯⎯ →⎯ + γγγγγγ
CHAIN 6 ******************************************************
CmAmAmAmPuPuPuU 244),n(243),n(m242%)64.11)(,n(241)y4.14(241),n(240),n(239),n(238 ⎯⎯ →⎯⎯⎯ →⎯⎯⎯⎯⎯⎯ →⎯⎯⎯⎯ →⎯⎯⎯ →⎯⎯⎯ →⎯⎯⎯ →⎯ γγγγγγ
CHAIN (ignored for irradiation period (half life = 432 year))
PuNpAmPuPuPuU 238),n(237)y432(241)y4.14(241),n(240),n(239),n(238 ⎯⎯ →⎯⎯⎯⎯ →⎯⎯⎯⎯ →⎯⎯⎯ →⎯⎯⎯ →⎯⎯⎯ →⎯ γγγγ
CHAIN (ignored for irradiation period (half life = 6560 year))
PuNpUPuPuU 238),n(237),n(236)y6560(240),n(239),n(238 ⎯⎯ →⎯⎯⎯ →⎯⎯⎯⎯ →⎯⎯⎯ →⎯⎯⎯ →⎯ γγγγ
CHAIN 7 ******************************************************
CmAmPuPuPuPu 244),n(243),n(242),n(241),n(240),n(239 ⎯⎯ →⎯⎯⎯ →⎯⎯⎯ →⎯⎯⎯ →⎯⎯⎯ →⎯ γγγγγ
53
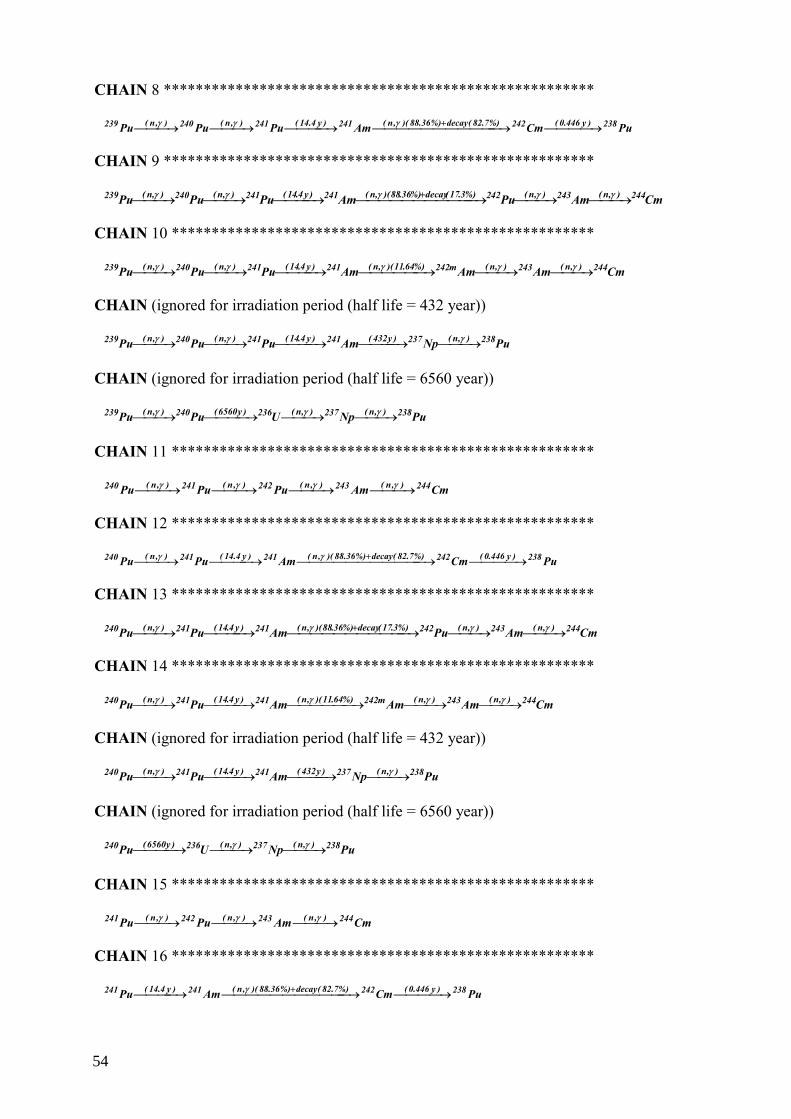
CHAIN 8 ******************************************************
PuCmAmPuPuPu 238)y446.0(242%)7.82(decay%)36.88)(,n(241)y4.14(241),n(240),n(239 ⎯⎯⎯ →⎯⎯⎯⎯⎯⎯⎯⎯⎯⎯⎯ →⎯⎯⎯⎯ →⎯⎯⎯ →⎯⎯⎯ →⎯ +γγγ
CHAIN 9 ******************************************************
CmAmPuAmPuPuPu 244),n(243),n(242%)3.17(decay%)36.88)(,n(241)y4.14(241),n(240),n(239 ⎯⎯ →⎯⎯⎯ →⎯⎯⎯⎯⎯⎯⎯⎯⎯⎯⎯ →⎯⎯⎯⎯ →⎯⎯⎯ →⎯⎯⎯ →⎯ + γγγγγ
CHAIN 10 *****************************************************
CmAmAmAmPuPuPu 244),n(243),n(m242%)64.11)(,n(241)y4.14(241),n(240),n(239 ⎯⎯ →⎯⎯⎯ →⎯⎯⎯⎯⎯⎯ →⎯⎯⎯⎯ →⎯⎯⎯ →⎯⎯⎯ →⎯ γγγγγ
CHAIN (ignored for irradiation period (half life = 432 year))
PuNpAmPuPuPu 238),n(237)y432(241)y4.14(241),n(240),n(239 ⎯⎯ →⎯⎯⎯⎯ →⎯⎯⎯⎯ →⎯⎯⎯ →⎯⎯⎯ →⎯ γγγ
CHAIN (ignored for irradiation period (half life = 6560 year))
PuNpUPuPu 238),n(237),n(236)y6560(240),n(239 ⎯⎯ →⎯⎯⎯ →⎯⎯⎯⎯ →⎯⎯⎯ →⎯ γγγ
CHAIN 11 *****************************************************
CmAmPuPuPu 244),n(243),n(242),n(241),n(240 ⎯⎯ →⎯⎯⎯ →⎯⎯⎯ →⎯⎯⎯ →⎯ γγγγ
CHAIN 12 *****************************************************
PuCmAmPuPu 238)y446.0(242%)7.82(decay%)36.88)(,n(241)y4.14(241),n(240 ⎯⎯⎯ →⎯⎯⎯⎯⎯⎯⎯⎯⎯⎯⎯ →⎯⎯⎯⎯ →⎯⎯⎯ →⎯ +γγ
CHAIN 13 *****************************************************
CmAmPuAmPuPu 244),n(243),n(242%)3.17(decay%)36.88)(,n(241)y4.14(241),n(240 ⎯⎯ →⎯⎯⎯ →⎯⎯⎯⎯⎯⎯⎯⎯⎯⎯⎯ →⎯⎯⎯⎯ →⎯⎯⎯ →⎯ + γγγγ
CHAIN 14 *****************************************************
CmAmAmAmPuPu 244),n(243),n(m242%)64.11)(,n(241)y4.14(241),n(240 ⎯⎯ →⎯⎯⎯ →⎯⎯⎯⎯⎯⎯ →⎯⎯⎯⎯ →⎯⎯⎯ →⎯ γγγγ
CHAIN (ignored for irradiation period (half life = 432 year))
PuNpAmPuPu 238),n(237)y432(241)y4.14(241),n(240 ⎯⎯ →⎯⎯⎯⎯ →⎯⎯⎯⎯ →⎯⎯⎯ →⎯ γγ
CHAIN (ignored for irradiation period (half life = 6560 year))
PuNpUPu 238),n(237),n(236)y6560(240 ⎯⎯ →⎯⎯⎯ →⎯⎯⎯⎯ →⎯ γγ
CHAIN 15 *****************************************************
CmAmPuPu 244),n(243),n(242),n(241 ⎯⎯ →⎯⎯⎯ →⎯⎯⎯ →⎯ γγγ
CHAIN 16 *****************************************************
PuCmAmPu 238)y446.0(242%)7.82(decay%)36.88)(,n(241)y4.14(241 ⎯⎯⎯ →⎯⎯⎯⎯⎯⎯⎯⎯⎯⎯⎯ →⎯⎯⎯⎯ →⎯ +γ
54

CHAIN 17 *****************************************************
CmAmPuAmPu 244),n(243),n(242%)3.17(decay%)36.88)(,n(241)y4.14(241 ⎯⎯ →⎯⎯⎯ →⎯⎯⎯⎯⎯⎯⎯⎯⎯⎯⎯ →⎯⎯⎯⎯ →⎯ + γγγ
CHAIN 18 *****************************************************
CmAmAmAmPu 244),n(243),n(m242%)64.11)(,n(241)y4.14(241 ⎯⎯ →⎯⎯⎯ →⎯⎯⎯⎯⎯⎯ →⎯⎯⎯⎯ →⎯ γγγ
CHAIN (ignored for irradiation period (half life = 432 year))
PuNpAmPu 238),n(237)y432(241)y4.14(241 ⎯⎯ →⎯⎯⎯⎯ →⎯⎯⎯⎯ →⎯ γ
CHAIN 19 *****************************************************
CmAmPu 244),n(243),n(242 ⎯⎯ →⎯⎯⎯ →⎯ γγ
CHAIN 20 *****************************************************
PuNp 238),n(237 ⎯⎯ →⎯ γ
CHAIN 21 *****************************************************
PuCmAm 238)y446.0(242%)7.82(decay%)36.88)(,n(241 ⎯⎯⎯ →⎯⎯⎯⎯⎯⎯⎯⎯⎯⎯⎯ →⎯ +γ
CHAIN (ignored for irradiation period (half life = 432 year))
PuNpAm 238),n(237)y432(241 ⎯⎯ →⎯⎯⎯⎯ →⎯ γ
CHAIN 22 *****************************************************
CmAmPuAm 244),n(243),n(242%)3.17(decay%)36.88)(,n(241 ⎯⎯ →⎯⎯⎯ →⎯⎯⎯⎯⎯⎯⎯⎯⎯⎯⎯ →⎯ + γγγ
CHAIN 23 *****************************************************
CmAmAmAm 244),n(243),n(m242%)64.11)(,n(241 ⎯⎯ →⎯⎯⎯ →⎯⎯⎯⎯⎯⎯ →⎯ γγγ
CHAIN 24 *****************************************************
CmAmAm 244),n(243),n(m242 ⎯⎯ →⎯⎯⎯ →⎯ γγ
CHAIN 25 *****************************************************
CmAm 244),n(243 ⎯⎯ →⎯ γ
CHAIN 26 *****************************************************
PuCm 238)y446.0(242 ⎯⎯⎯ →⎯
CHAIN 27 ****************************************************
xCm ),n(244 ⎯⎯ →⎯ γ
55
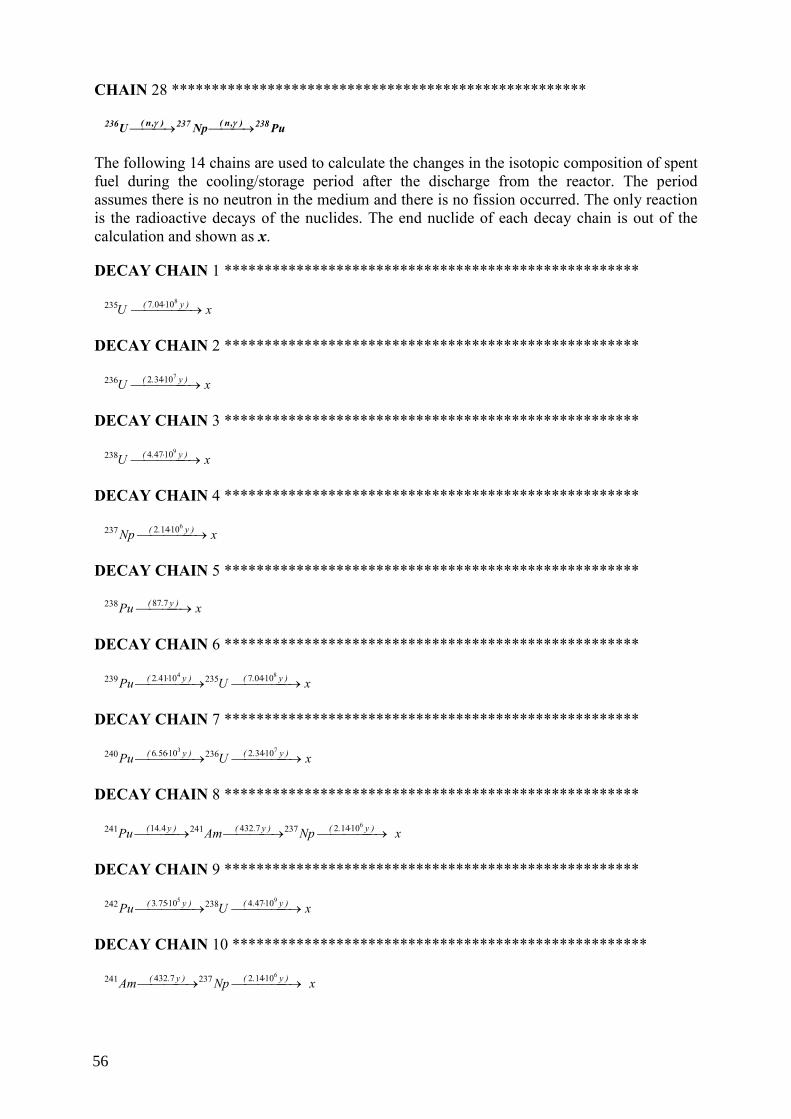
CHAIN 28 ****************************************************
PuNpU 238),n(237),n(236 ⎯⎯ →⎯⎯⎯ →⎯ γγ
The following 14 chains are used to calculate the changes in the isotopic composition of spent fuel during the cooling/storage period after the discharge from the reactor. The period assumes there is no neutron in the medium and there is no fission occurred. The only reaction is the radioactive decays of the nuclides. The end nuclide of each decay chain is out of the calculation and shown as x.
DECAY CHAIN 1 ****************************************************
xU )y.( ⎯⎯⎯⎯ →⎯ ⋅ 810047235
DECAY CHAIN 2 ****************************************************
xU )y.( ⎯⎯⎯⎯ →⎯ ⋅ 710342236
DECAY CHAIN 3 ****************************************************
xU )y.( ⎯⎯⎯⎯ →⎯ ⋅ 910474238
DECAY CHAIN 4 ****************************************************
xNp )y.( ⎯⎯⎯⎯ →⎯ ⋅ 610142237
DECAY CHAIN 5 ****************************************************
xPu )y.( ⎯⎯⎯ →⎯ 787238
DECAY CHAIN 6 ****************************************************
xUPu )y.()y.( ⎯⎯⎯⎯ →⎯⎯⎯⎯⎯ →⎯ ⋅⋅ 84 1004723510412239
DECAY CHAIN 7 ****************************************************
xUPu )y.()y.( ⎯⎯⎯⎯ →⎯⎯⎯⎯⎯ →⎯ ⋅⋅ 73 1034223610566240
DECAY CHAIN 8 ****************************************************
xNpAmPu )y.()y.()y.( ⎯⎯⎯⎯ →⎯⎯⎯⎯ →⎯⎯⎯⎯ →⎯ ⋅ 6101422377432241414241
DECAY CHAIN 9 ****************************************************
xUPu )y.()y.( ⎯⎯⎯⎯ →⎯⎯⎯⎯⎯ →⎯ ⋅⋅ 95 1047423810753242
DECAY CHAIN 10 ****************************************************
xNpAm )y.()y.( ⎯⎯⎯⎯ →⎯⎯⎯⎯ →⎯ ⋅ 6101422377432241
56
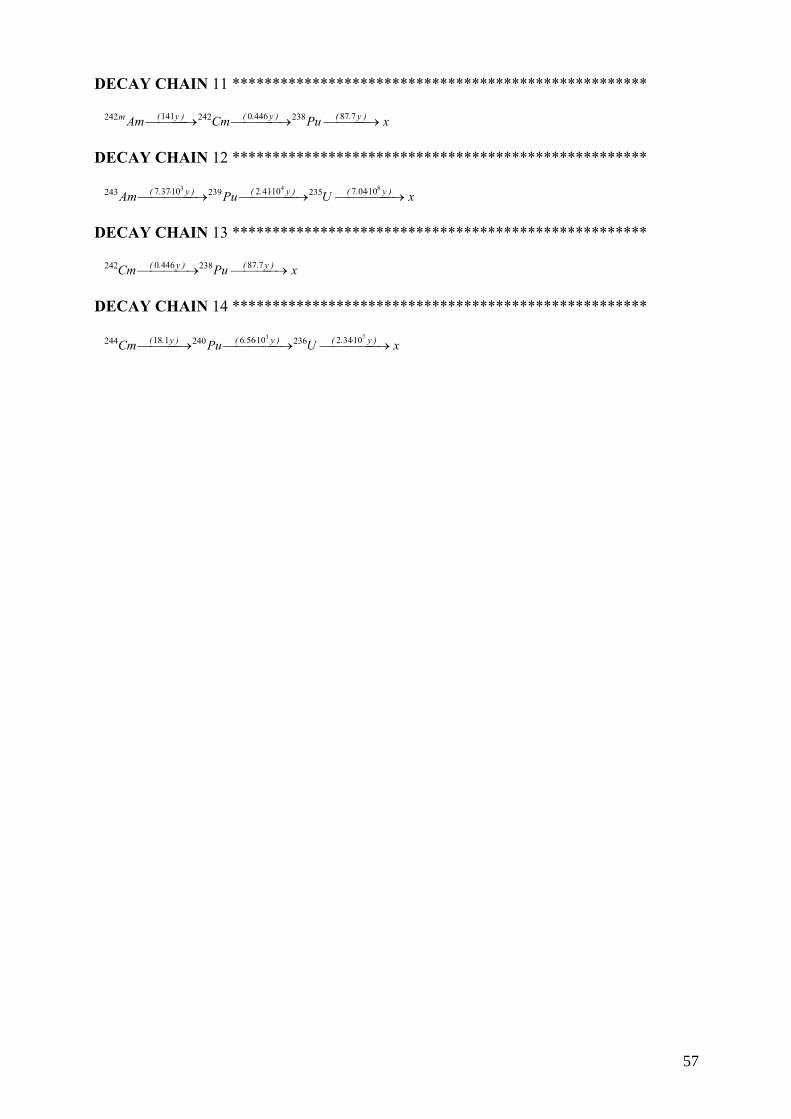
DECAY CHAIN 11 ****************************************************
xPuCmAm )y.()y.()y(m ⎯⎯⎯ →⎯⎯⎯⎯ →⎯⎯⎯⎯ →⎯ 7872384460242141242
DECAY CHAIN 12 ****************************************************
xUPuAm )y.()y.()y.( ⎯⎯⎯⎯ →⎯⎯⎯⎯⎯ →⎯⎯⎯⎯⎯ →⎯ ⋅⋅⋅ 843 100472351041223910377243
DECAY CHAIN 13 ****************************************************
xPuCm )y.()y.( ⎯⎯⎯ →⎯⎯⎯⎯ →⎯ 7872384460242
DECAY CHAIN 14 ****************************************************
xUPuCm )y.()y.()y.( ⎯⎯⎯⎯ →⎯⎯⎯⎯⎯ →⎯⎯⎯⎯ →⎯ ⋅⋅ 73 1034223610566240118244
57


Appendix IV CROSS-SECTIONS USED IN CALCULATIONS
VISTA is capable of using any reactor and fuel type if one group neutron cross sections are provided. For the purpose of this publication, 7 reactor types with 9 fuel types (7 uranium fuels and 2 MOX fuels) were introduced to the system. One group neutron cross sections of those 9 fuel types are given in TABLES 9–17.
TABLE 9. ONE GROUP NEUTRON CROSS-SECTIONS FOR PWR URANIUM FUEL (BARN)
Nuclide cσ (inc exσ ) fσ nn2σ T1/2(y) 235U 10.4600 46.7100 0.002696 7.04E+08 236U 7.5410 0.1975 0.002644 2.34E+07 238U 0.9021 0.1004 0.005525 4.47E+09
237Np 32.1200 0.5244 0.000275 2.14E+06 238Pu 34.6700 2.4650 0.000167 8.77E+01 239Pu 58.6100 106.2000 0.001120 2.41E+04 240Pu 104.0000 0.5840 0.000448 6.56E+03 241Pu 38.6800 118.1000 0.007518 1.44E+01 242Pu 31.7200 0.4146 0.002307 3.75E+05
241Am 118.8000 1.1230 0.000328 4.33E+02 242mAm 98.0400 466.2000 0.005670 1.41E+02 243Am 49.4870 0.3959 0.000207 7.37E+03 242Cm 5.8010 0.5591 0.000053 4.46E-01 244Cm 13.8200 0.8746 0.001048 1.81E+01
TABLE 10. ONE GROUP NEUTRON CROSS-SECTIONS FOR BWR URANIUM FUEL
(BARN)
Nuclide cσ (inc exσ ) fσ nn2σ T1/2(y) 235U 11.21000 50.00000 0.001969 7.04E+08 236U 8.24900 0.16480 0.001935 2.34E+07 238U 0.91900 0.08083 0.004039 4.47E+09
237Np 34.07000 0.46150 0.000210 2.14E+06 238Pu 37.27000 2.48800 0.000123 8.77E+01 239Pu 63.07000 114.10000 0.000818 2.41E+04 240Pu 111.10000 0.52660 0.000328 6.56E+03 241Pu 41.51000 126.30000 0.005496 1.44E+01 242Pu 33.07000 0.40380 0.002245 3.75E+05
241Am 121.30000 1.12500 0.000319 4.33E+02 242mAm 234.2638 1210.7879 0.004338 1.41E+02 243Am 51.58100 0.38520 0.000202 7.37E+03 242Cm 6.03300 0.55540 0.000052 4.46E-01 244Cm 14.39000 0.87090 0.001019 1.81E+01
59
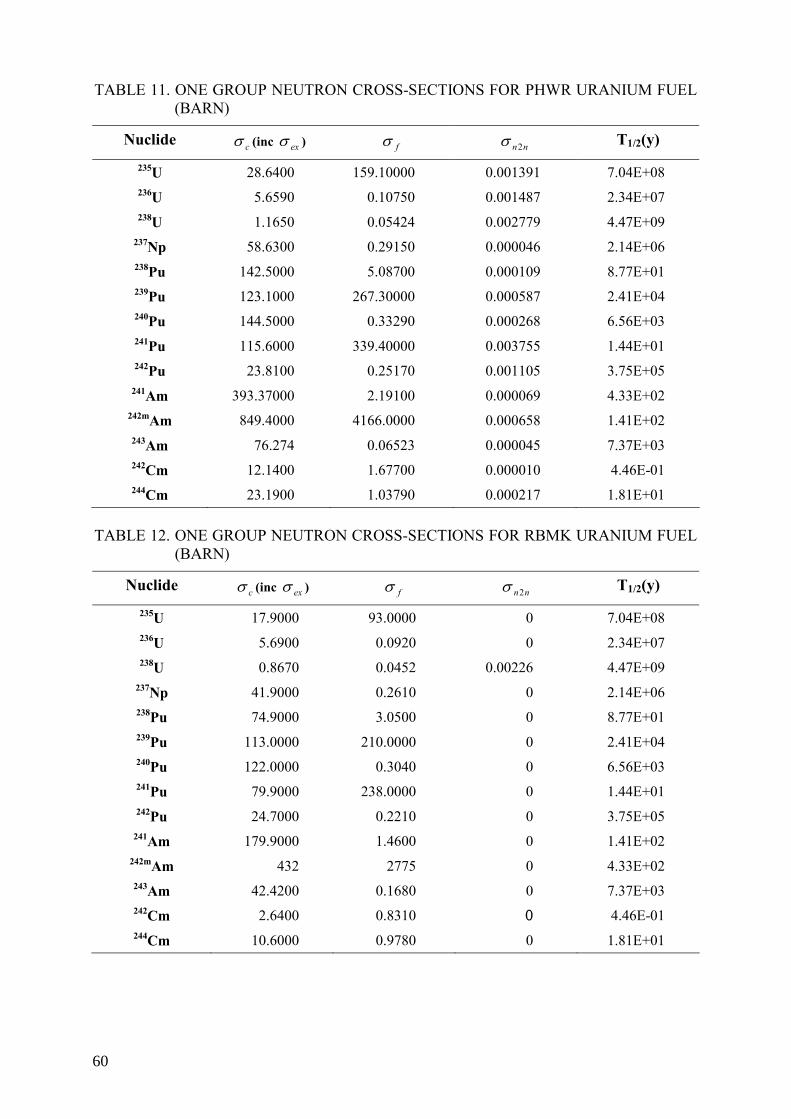
TABLE 11. ONE GROUP NEUTRON CROSS-SECTIONS FOR PHWR URANIUM FUEL (BARN)
Nuclide cσ (inc exσ ) fσ nn2σ T1/2(y) 235U 28.6400 159.10000 0.001391 7.04E+08 236U 5.6590 0.10750 0.001487 2.34E+07 238U 1.1650 0.05424 0.002779 4.47E+09
237Np 58.6300 0.29150 0.000046 2.14E+06 238Pu 142.5000 5.08700 0.000109 8.77E+01 239Pu 123.1000 267.30000 0.000587 2.41E+04 240Pu 144.5000 0.33290 0.000268 6.56E+03 241Pu 115.6000 339.40000 0.003755 1.44E+01 242Pu 23.8100 0.25170 0.001105 3.75E+05
241Am 393.37000 2.19100 0.000069 4.33E+02 242mAm 849.4000 4166.0000 0.000658 1.41E+02 243Am 76.274 0.06523 0.000045 7.37E+03 242Cm 12.1400 1.67700 0.000010 4.46E-01 244Cm 23.1900 1.03790 0.000217 1.81E+01
TABLE 12. ONE GROUP NEUTRON CROSS-SECTIONS FOR RBMK URANIUM FUEL
(BARN)
Nuclide cσ (inc exσ ) fσ nn2σ T1/2(y) 235U 17.9000 93.0000 0 7.04E+08 236U 5.6900 0.0920 0 2.34E+07 238U 0.8670 0.0452 0.00226 4.47E+09
237Np 41.9000 0.2610 0 2.14E+06 238Pu 74.9000 3.0500 0 8.77E+01 239Pu 113.0000 210.0000 0 2.41E+04 240Pu 122.0000 0.3040 0 6.56E+03 241Pu 79.9000 238.0000 0 1.44E+01 242Pu 24.7000 0.2210 0 3.75E+05
241Am 179.9000 1.4600 0 1.41E+02 242mAm 432 2775 0 4.33E+02 243Am 42.4200 0.1680 0 7.37E+03 242Cm 2.6400 0.8310 0 4.46E-01 244Cm 10.6000 0.9780 0 1.81E+01
60

TABLE 13. ONE GROUP NEUTRON CROSS-SECTIONS FOR AGR URANIUM FUEL (BARN)
Nuclide cσ (inc exσ ) fσ nn2σ T1/2(y) 235U 19.0000 84.0000 0 7.04E+08 236U 6.1700 0.1200 0 2.34E+07 238U 1.0600 0.05640 0.00226 4.47E+09
237Np 52.0400 0.3060 0 2.14E+06 238Pu 118.4000 4.4200 0 8.77E+01 239Pu 125.0000 240.0000 0 2.41E+04 240Pu 142.0000 0.3526 0 6.56E+03 241Pu 101.000 319.0000 0 1.44E+01 242Pu 31.2000 0.2650 0 3.75E+05
241Am 179.9000 1.4600 0 4.33E+02 242mAm 432 2775 0 1.41E+02 243Am 42.4200 0.1680 0 7.37E+03 242Cm 2.6400 0.8310 0 4.46E-01 244Cm 10.6000 0.978 0 1.81E+01
TABLE 14. ONE GROUP NEUTRON CROSS-SECTIONS FOR GCR URANIUM FUEL
(BARN)
Nuclide cσ (inc exσ ) fσ nn2σ T1/2(y) 235U 19.0000 96.0000 0 7.04E+08 236U 6.3000 0.13000 0 2.34E+07 238U 0.8800 0.06000 0.00278 4.47E+09
237Np 48.0000 0.30000 0 2.14E+06 238Pu 118.0000 4.00000 0 8.77E+01 239Pu 139.0000 249.00000 0 2.41E+04 240Pu 185.0000 0.38000 0 6.56E+03 241Pu 107.0000 255.00000 0 1.44E+01 242Pu 25.0000 0.30000 0 3.75E+05
241Am 391.7000 2.19100 0 4.33E+02 242mAm 849.4 4166 0 1.41E+02 243Am 75.8140 0.06523 0 7.37E+03 242Cm 12.1400 1.67700 0 4.46E-01 244Cm 23.1900 1.03790 0 1.81E+01
61
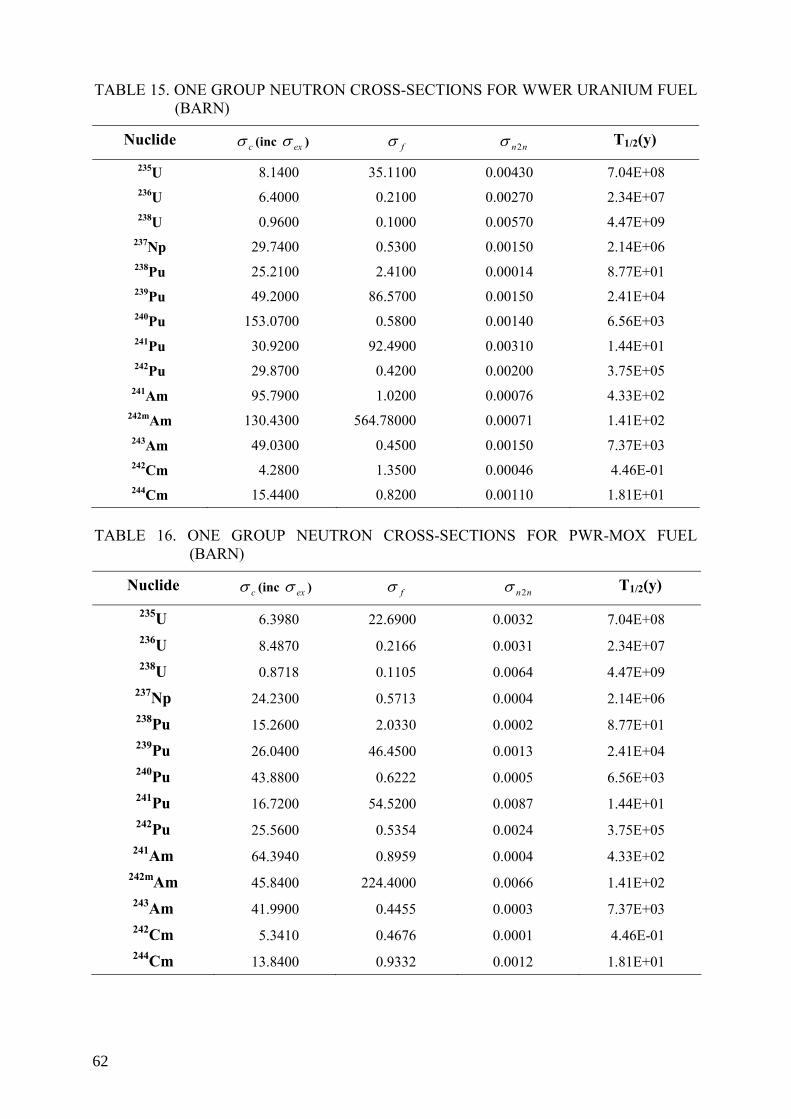
TABLE 15. ONE GROUP NEUTRON CROSS-SECTIONS FOR WWER URANIUM FUEL (BARN)
Nuclide cσ (inc exσ ) fσ nn2σ T1/2(y) 235U 8.1400 35.1100 0.00430 7.04E+08 236U 6.4000 0.2100 0.00270 2.34E+07 238U 0.9600 0.1000 0.00570 4.47E+09
237Np 29.7400 0.5300 0.00150 2.14E+06 238Pu 25.2100 2.4100 0.00014 8.77E+01 239Pu 49.2000 86.5700 0.00150 2.41E+04 240Pu 153.0700 0.5800 0.00140 6.56E+03 241Pu 30.9200 92.4900 0.00310 1.44E+01 242Pu 29.8700 0.4200 0.00200 3.75E+05
241Am 95.7900 1.0200 0.00076 4.33E+02 242mAm 130.4300 564.78000 0.00071 1.41E+02 243Am 49.0300 0.4500 0.00150 7.37E+03 242Cm 4.2800 1.3500 0.00046 4.46E-01 244Cm 15.4400 0.8200 0.00110 1.81E+01
TABLE 16. ONE GROUP NEUTRON CROSS-SECTIONS FOR PWR-MOX FUEL
(BARN)
Nuclide cσ (inc exσ ) fσ nn2σ T1/2(y)
235U 6.3980 22.6900 0.0032 7.04E+08 236U 8.4870 0.2166 0.0031 2.34E+07 238U 0.8718 0.1105 0.0064 4.47E+09
237Np 24.2300 0.5713 0.0004 2.14E+06 238Pu 15.2600 2.0330 0.0002 8.77E+01 239Pu 26.0400 46.4500 0.0013 2.41E+04 240Pu 43.8800 0.6222 0.0005 6.56E+03 241Pu 16.7200 54.5200 0.0087 1.44E+01 242Pu 25.5600 0.5354 0.0024 3.75E+05
241Am 64.3940 0.8959 0.0004 4.33E+02 242mAm 45.8400 224.4000 0.0066 1.41E+02 243Am 41.9900 0.4455 0.0003 7.37E+03 242Cm 5.3410 0.4676 0.0001 4.46E-01 244Cm 13.8400 0.9332 0.0012 1.81E+01
62

TABLE 17. ONE GROUP NEUTRON CROSS-SECTIONS FOR BWR-MOX FUEL (BARN)
Nuclide cσ (inc exσ ) fσ nn2σ T1/2(y)
235U 8.131000 32.0200 0.002190 7.04E+08 236U 8.624000 0.1792 0.002159 2.34E+07 238U 0.871900 0.0881 0.004502 4.47E+09
237Np 27.960000 0.4995 0.000230 2.14E+06 238Pu 22.650000 2.1590 0.000137 8.77E+01 239Pu 38.520000 69.2000 0.000910 2.41E+04 240Pu 52.630000 0.5540 0.000366 6.56E+03 241Pu 25.010000 78.7700 0.006098 1.44E+01 242Pu 26.200000 0.4607 0.001722 3.75E+05
241Am 86.790000 0.978 0.004741 4.33E+02 242mAm 66.720000 321.6000 0.000218 1.41E+02 243Am 46.200000 0.4163 0.000056 7.37E+03 242Cm 5.767000 0.4963 0.001102 4.46E-01 244Cm 14.520000 0.9094 0.000419 1.81E+01
63

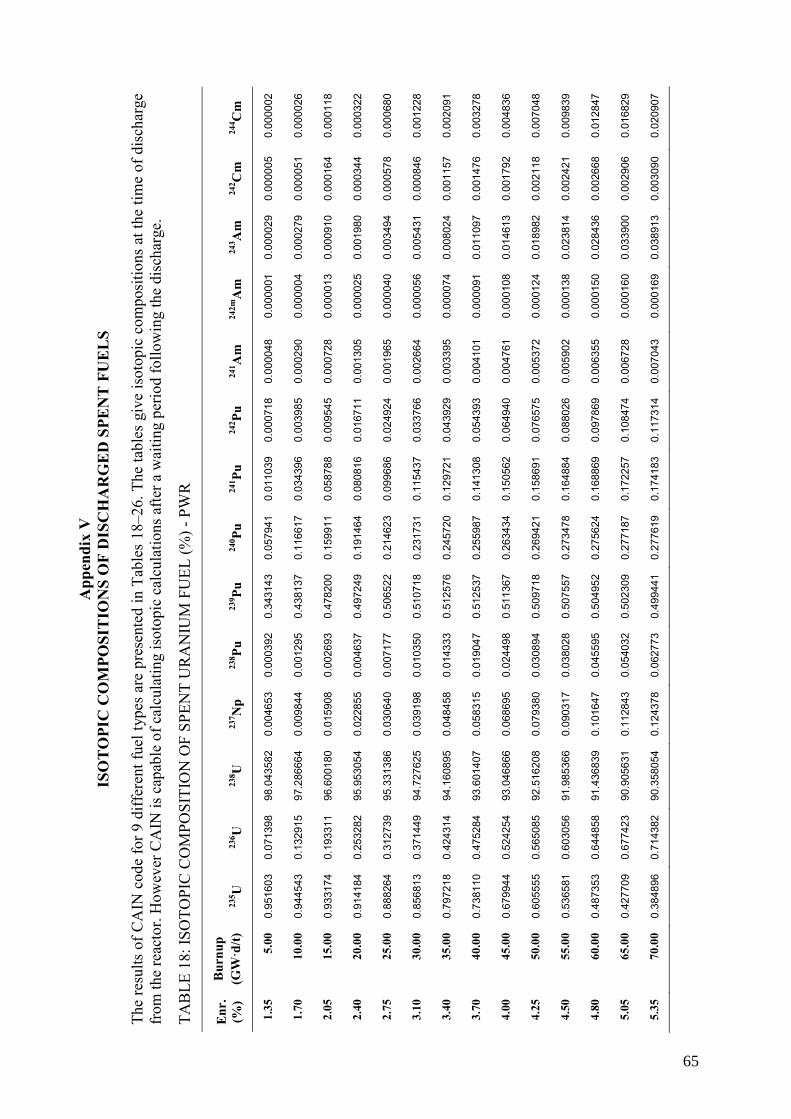
App
endi
x V
IS
OT
OPI
C C
OM
POSI
TIO
NS
OF
DIS
CH
AR
GE
D S
PEN
T F
UE
LS
The
resu
lts o
f CA
IN c
ode
for 9
diff
eren
t fue
l typ
es a
re p
rese
nted
in T
able
s 18
–26.
The
tabl
es g
ive
isot
opic
com
posi
tions
at t
he ti
me
of d
isch
arge
fr
om th
e re
acto
r. H
owev
er C
AIN
is c
apab
le o
f cal
cula
ting
isot
opic
cal
cula
tions
afte
r a w
aitin
g pe
riod
follo
win
g th
e di
scha
rge.
TAB
LE 1
8: IS
OTO
PIC
CO
MPO
SITI
ON
OF
SPEN
T U
RA
NIU
M F
UEL
(%) -
PW
R
Enr
. (%
) B
urnu
p(G
W·d
/t)
235 U
23
6 U
238 U
23
7 Np
238 Pu
23
9 Pu
240 Pu
24
1 Pu
242 Pu
24
1 Am
24
2mA
m
243 A
m
242 C
m
244 C
m
1.35
5.
00
0.95
1603
0.
0713
98
98.0
4358
2 0.
0046
53
0.00
0392
0.
3431
43
0.05
7941
0.
0110
39
0.00
0718
0.
0000
48
0.00
0001
0.
0000
29
0.00
0005
0.
0000
02
1.70
10
.00
0.94
4543
0.
1329
15
97.2
8666
4 0.
0098
44
0.00
1295
0.
4381
37
0.11
6617
0.
0343
96
0.00
3985
0.
0002
90
0.00
0004
0.
0002
79
0.00
0051
0.
0000
26
2.05
15
.00
0.93
3174
0.
1933
11
96.6
0018
0 0.
0159
08
0.00
2693
0.
4782
00
0.15
9911
0.
0587
88
0.00
9545
0.
0007
28
0.00
0013
0.
0009
10
0.00
0164
0.
0001
18
2.40
20
.00
0.91
4184
0.
2532
82
95.9
5305
4 0.
0228
55
0.00
4637
0.
4972
49
0.19
1464
0.
0808
16
0.01
6711
0.
0013
05
0.00
0025
0.
0019
80
0.00
0344
0.
0003
22
2.75
25
.00
0.88
8264
0.
3127
39
95.3
3138
6 0.
0306
40
0.00
7177
0.
5065
22
0.21
4623
0.
0996
86
0.02
4924
0.
0019
65
0.00
0040
0.
0034
94
0.00
0578
0.
0006
80
3.10
30
.00
0.85
6813
0.
3714
49
94.7
2762
5 0.
0391
98
0.01
0350
0.
5107
18
0.23
1731
0.
1154
37
0.03
3766
0.
0026
64
0.00
0056
0.
0054
31
0.00
0846
0.
0012
28
3.40
35
.00
0.79
7218
0.
4243
14
94.1
6089
5 0.
0484
58
0.01
4333
0.
5125
76
0.24
5720
0.
1297
21
0.04
3929
0.
0033
95
0.00
0074
0.
0080
24
0.00
1157
0.
0020
91
3.70
40
.00
0.73
8110
0.
4752
84
93.6
0140
7 0.
0583
15
0.01
9047
0.
5125
37
0.25
5987
0.
1413
08
0.05
4393
0.
0041
01
0.00
0091
0.
0110
97
0.00
1476
0.
0032
78
4.00
45
.00
0.67
9944
0.
5242
54
93.0
4686
6 0.
0686
95
0.02
4498
0.
5113
67
0.26
3434
0.
1505
62
0.06
4940
0.
0047
61
0.00
0108
0.
0146
13
0.00
1792
0.
0048
36
4.25
50
.00
0.60
5555
0.
5650
85
92.5
1620
8 0.
0793
80
0.03
0894
0.
5097
18
0.26
9421
0.
1586
91
0.07
6575
0.
0053
72
0.00
0124
0.
0189
82
0.00
2118
0.
0070
48
4.50
55
.00
0.53
6581
0.
6030
56
91.9
8536
6 0.
0903
17
0.03
8028
0.
5075
57
0.27
3478
0.
1648
84
0.08
8026
0.
0059
02
0.00
0138
0.
0238
14
0.00
2421
0.
0098
39
4.80
60
.00
0.48
7353
0.
6448
58
91.4
3683
9 0.
1016
47
0.04
5595
0.
5049
52
0.27
5624
0.
1688
69
0.09
7869
0.
0063
55
0.00
0150
0.
0284
36
0.00
2668
0.
0128
47
5.05
65
.00
0.42
7709
0.
6774
23
90.9
0563
1 0.
1128
43
0.05
4032
0.
5023
09
0.27
7187
0.
1722
57
0.10
8474
0.
0067
28
0.00
0160
0.
0339
00
0.00
2906
0.
0168
29
5.35
70
.00
0.38
4896
0.
7143
82
90.3
5805
4 0.
1243
78
0.06
2773
0.
4994
41
0.27
7619
0.
1741
83
0.11
7314
0.
0070
43
0.00
0169
0.
0389
13
0.00
3090
0.
0209
07
65

TAB
LE 1
9: IS
OTO
PIC
CO
MPO
SITI
ON
OF
SPEN
T U
RA
NIU
M F
UEL
(%) -
BW
R
Enr
. (%
) B
urnu
p(G
W·d
/t)
235 U
23
6 U
238 U
23
7 Np
Pu23
8 23
9 Pu
240 Pu
24
1 Pu
242 Pu
24
1 Am
24
2mA
m
243 A
m
242 C
m
244 C
m
1.35
5.
00
0.93
8595
0.
0736
95
98.0
6368
5 0.
0039
34
0.00
0329
0.
3332
43
0.05
8652
0.
0115
18
0.00
0785
0.
0000
72
0.00
0000
0.
0000
32
0.00
0007
0.
0000
02
1.70
10
.00
0.92
3093
0.
1364
74
97.3
2044
1 0.
0089
32
0.00
1174
0.
4218
85
0.11
6645
0.
0352
78
0.00
4295
0.
0004
35
0.00
0004
0.
0003
06
0.00
0070
0.
0000
29
2.05
15
.00
0.90
4600
0.
1977
40
96.6
4456
4 0.
0150
36
0.00
2581
0.
4582
10
0.15
8684
0.
0595
71
0.01
0200
0.
0010
81
0.00
0009
0.
0009
92
0.00
0217
0.
0001
30
2.40
20
.00
0.87
9487
0.
2582
56
96.0
0625
4 0.
0221
74
0.00
4630
0.
4749
56
0.18
8843
0.
0810
93
0.01
7736
0.
0019
23
0.00
0017
0.
0021
47
0.00
0437
0.
0003
54
2.75
25
.00
0.84
8149
0.
3179
85
95.3
9185
0 0.
0302
63
0.00
7385
0.
4827
87
0.21
0671
0.
0992
17
0.02
6310
0.
0028
75
0.00
0026
0.
0037
74
0.00
0708
0.
0007
46
3.10
30
.00
0.81
2019
0.
3766
93
94.7
9427
0 0.
0392
09
0.01
0886
0.
4860
69
0.22
6560
0.
1140
85
0.03
5481
0.
0038
73
0.00
0036
0.
0058
46
0.00
1006
0.
0013
44
3.40
35
.00
0.74
8850
0.
4291
72
94.2
3248
5 0.
0489
11
0.01
5322
0.
4872
91
0.23
9396
0.
1273
90
0.04
5993
0.
0049
05
0.00
0046
0.
0086
19
0.00
1339
0.
0022
85
3.70
40
.00
0.68
6935
0.
4794
57
93.6
7698
6 0.
0592
54
0.02
0601
0.
4868
67
0.24
8641
0.
1379
74
0.05
6759
0.
0058
89
0.00
0056
0.
0118
98
0.00
1669
0.
0035
80
4.00
45
.00
0.62
6760
0.
5274
42
93.1
2570
2 0.
0701
42
0.02
6710
0.
4854
82
0.25
5195
0.
1462
46
0.06
7545
0.
0067
97
0.00
0065
0.
0156
35
0.00
1981
0.
0052
76
4.25
50
.00
0.55
1784
0.
5668
25
92.5
9719
5 0.
0813
13
0.03
3871
0.
4837
04
0.26
0346
0.
1533
84
0.07
9405
0.
0076
21
0.00
0073
0.
0202
74
0.00
2295
0.
0076
86
4.50
55
.00
0.48
2776
0.
6030
45
92.0
6694
1 0.
0927
29
0.04
1845
0.
4815
06
0.26
3707
0.
1586
83
0.09
1031
0.
0083
21
0.00
0080
0.
0253
99
0.00
2576
0.
0107
32
4.80
60
.00
0.43
3699
0.
6430
06
91.5
1958
1 0.
1045
21
0.05
0238
0.
4789
46
0.26
5328
0.
1619
20
0.10
0902
0.
0089
11
0.00
0086
0.
0302
53
0.00
2793
0.
0139
87
5.05
65
.00
0.37
5611
0.
6732
77
90.9
8843
9 0.
1160
78
0.05
9534
0.
4763
69
0.26
6413
0.
1646
06
0.11
1498
0.
0093
80
0.00
0091
0.
0359
79
0.00
2998
0.
0182
95
5.35
70
.00
0.33
4034
0.
7079
25
90.4
4098
1 0.
1279
64
0.06
9096
0.
4736
08
0.26
6511
0.
1659
89
0.12
0237
0.
0097
73
0.00
0095
0.
0411
89
0.00
3148
0.
0226
77
66
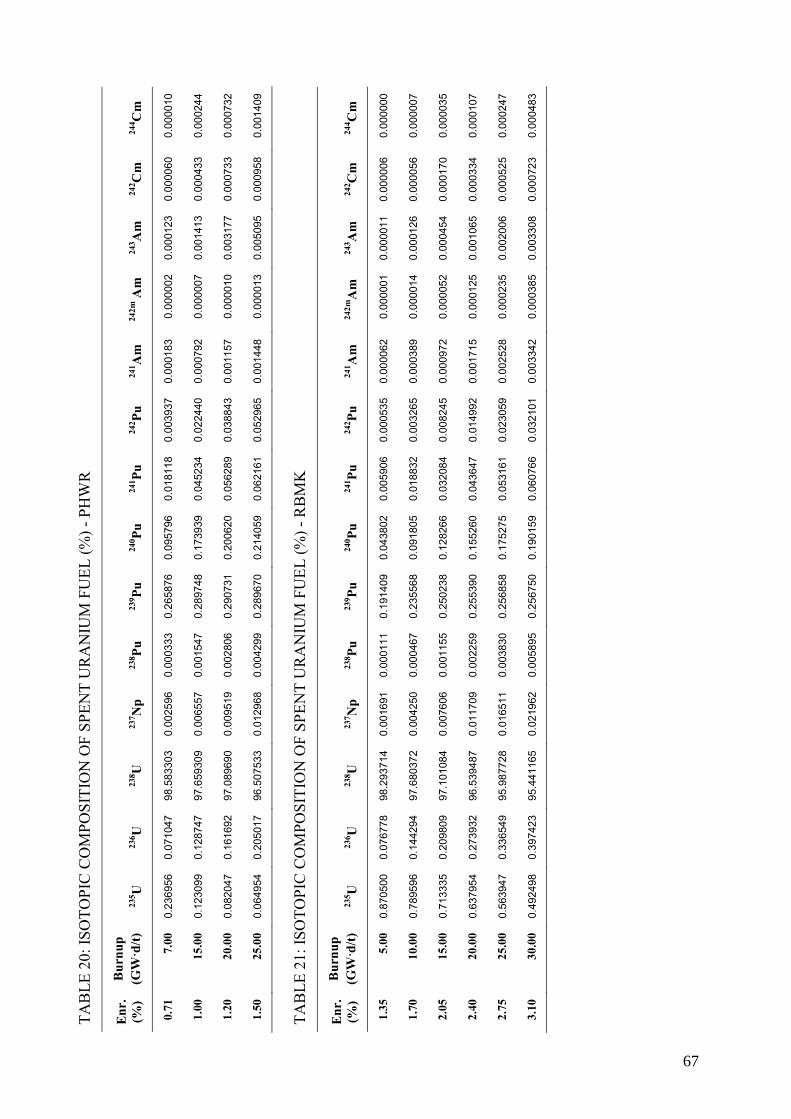
TAB
LE 2
0: IS
OTO
PIC
CO
MPO
SITI
ON
OF
SPEN
T U
RA
NIU
M F
UEL
(%) -
PH
WR
Enr
. (%
) B
urnu
p(G
W·d
/t)
235 U
23
6 U
238 U
23
7 Np
238 Pu
23
9 Pu
240 Pu
24
1 Pu
242 Pu
24
1 Am
24
2m A
m
243 A
m
242 C
m
244 C
m
0.71
7.
00
0.23
6956
0.
0710
47
98.5
8330
3 0.
0025
96
0.00
0333
0.
2658
76
0.09
5796
0.
0181
18
0.00
3937
0.
0001
83
0.00
0002
0.
0001
23
0.00
0060
0.
0000
10
1.00
15
.00
0.12
3099
0.
1287
47
97.6
5930
9 0.
0065
57
0.00
1547
0.
2897
48
0.17
3939
0.
0452
34
0.02
2440
0.
0007
92
0.00
0007
0.
0014
13
0.00
0433
0.
0002
44
1.20
20
.00
0.08
2047
0.
1616
92
97.0
8969
0 0.
0095
19
0.00
2806
0.
2907
31
0.20
0620
0.
0562
89
0.03
8843
0.
0011
57
0.00
0010
0.
0031
77
0.00
0733
0.
0007
32
1.50
25
.00
0.06
4954
0.
2050
17
96.5
0753
3 0.
0129
68
0.00
4299
0.
2896
70
0.21
4059
0.
0621
61
0.05
2965
0.
0014
48
0.00
0013
0.
0050
95
0.00
0958
0.
0014
09
TAB
LE 2
1: IS
OTO
PIC
CO
MPO
SITI
ON
OF
SPEN
T U
RA
NIU
M F
UEL
(%) -
RB
MK
Enr
. (%
) B
urnu
p(G
W·d
/t)
235 U
23
6 U
238 U
23
7 Np
238 Pu
23
9 Pu
240 Pu
24
1 Pu
242 Pu
24
1 Am
24
2mA
m
243 A
m
242 C
m
244 C
m
1.35
5.
00
0.87
0500
0.
0767
78
98.2
9371
4 0.
0016
91
0.00
0111
0.
1914
09
0.04
3802
0.
0059
06
0.00
0535
0.
0000
62
0.00
0001
0.
0000
11
0.00
0006
0.
0000
00
1.70
10
.00
0.78
9596
0.
1442
94
97.6
8037
2 0.
0042
50
0.00
0467
0.
2355
68
0.09
1805
0.
0188
32
0.00
3265
0.
0003
89
0.00
0014
0.
0001
26
0.00
0056
0.
0000
07
2.05
15
.00
0.71
3335
0.
2098
09
97.1
0108
4 0.
0076
06
0.00
1155
0.
2502
38
0.12
8266
0.
0320
84
0.00
8245
0.
0009
72
0.00
0052
0.
0004
54
0.00
0170
0.
0000
35
2.40
20
.00
0.63
7954
0.
2739
32
96.5
3948
7 0.
0117
09
0.00
2259
0.
2553
90
0.15
5260
0.
0436
47
0.01
4992
0.
0017
15
0.00
0125
0.
0010
65
0.00
0334
0.
0001
07
2.75
25
.00
0.56
3947
0.
3365
49
95.9
8772
8 0.
0165
11
0.00
3830
0.
2568
58
0.17
5275
0.
0531
61
0.02
3059
0.
0025
28
0.00
0235
0.
0020
06
0.00
0525
0.
0002
47
3.10
30
.00
0.49
2498
0.
3974
23
95.4
4116
5 0.
0219
62
0.00
5895
0.
2567
50
0.19
0159
0.
0607
66
0.03
2101
0.
0033
42
0.00
0385
0.
0033
08
0.00
0723
0.
0004
83
67

68
TAB
LE 2
2: IS
OTO
PIC
CO
MPO
SITI
ON
OF
SPEN
T U
RA
NIU
M F
UEL
(%) —
AG
R
Enr
. (%
) B
urnu
p(G
W·d
/t)
235 U
23
6 U
238 U
23
7 Np
238 Pu
23
9 Pu
240 Pu
24
1 Pu
242 Pu
24
1 Am
24
2mA
m
243 A
m
242 C
m
244 C
m
1.35
5.
00
0.90
0963
0.
0820
98
98.2
1767
8 0.
0017
85
0.00
0138
0.
2184
62
0.05
4468
0.
0078
66
0.00
0915
0.
0001
22
0.00
0002
0.
0000
25
0.00
0011
0.
0000
01
1.70
10
.00
0.85
0724
0.
1536
77
97.5
6366
7 0.
0044
37
0.00
0570
0.
2606
62
0.10
7144
0.
0221
83
0.00
4884
0.
0006
90
0.00
0025
0.
0002
38
0.00
0084
0.
0000
13
2.05
15
.00
0.79
9515
0.
2241
19
96.9
5343
2 0.
0078
82
0.00
1393
0.
2734
21
0.14
4512
0.
0351
41
0.01
1377
0.
0016
20
0.00
0086
0.
0007
86
0.00
0225
0.
0000
60
2.40
20
.00
0.74
4225
0.
2940
08
96.3
6670
9 0.
0120
58
0.00
2667
0.
2773
86
0.17
0831
0.
0454
56
0.01
9502
0.
0027
38
0.00
0196
0.
0017
31
0.00
0402
0.
0001
68
2.75
25
.00
0.68
5895
0.
3631
33
95.7
9431
6 0.
0169
01
0.00
4399
0.
2781
40
0.18
9547
0.
0533
39
0.02
8616
0.
0039
09
0.00
0355
0.
0030
94
0.00
0588
0.
0003
64
3.10
30
.00
0.62
6038
0.
4311
86
95.2
3095
3 0.
0223
54
0.00
6565
0.
2775
88
0.20
2960
0.
0592
61
0.03
8297
0.
0050
46
0.00
0561
0.
0048
77
0.00
0767
0.
0006
75
TAB
LE 2
3: IS
OTO
PIC
CO
MPO
SITI
ON
OF
SPEN
T U
RA
NIU
M F
UEL
(%) —
GC
R
Enr
. (%
) B
urnu
p(G
W·d
/t)
235 U
23
6 U
238 U
23
7 Np
238 Pu
23
9 Pu
240 Pu
24
1 Pu
242 Pu
24
1 Am
24
2mA
m
243 A
m
242 C
m
244 C
m
0.71
0.
01
0.70
8858
0.
0001
89
99.2
8869
2 0.
0000
04
0.00
0000
0.
0012
25
0.00
0001
0.
0000
00
0.00
0000
0.
0000
00
0.00
0000
0.
0000
00
0.00
0000
0.
0000
00
0.71
1.
00
0.61
3136
0.
0160
04
99.1
7067
9 0.
0004
05
0.00
0011
0.
0882
17
0.00
7843
0.
0005
80
0.00
0021
0.
0000
06
0.00
0000
0.
0000
00
0.00
0000
0.
0000
00
0.71
2.
00
0.53
7151
0.
0284
46
99.0
6317
0 0.
0008
49
0.00
0045
0.
1377
31
0.02
3067
0.
0030
56
0.00
0223
0.
0000
57
0.00
0001
0.
0000
03
0.00
0006
0.
0000
00
0.71
3.
00
0.47
3209
0.
0388
17
98.9
6029
2 0.
0013
28
0.00
0109
0.
1682
66
0.04
0314
0.
0073
20
0.00
0815
0.
0001
96
0.00
0007
0.
0000
15
0.00
0026
0.
0000
01
0.71
4.
00
0.41
7815
0.
0477
06
98.8
5934
1 0.
0018
39
0.00
0224
0.
1878
12
0.05
7494
0.
0128
65
0.00
1962
0.
0004
42
0.00
0023
0.
0000
49
0.00
0068
0.
0000
03
0.71
5.
00
0.36
9113
0.
0554
28
98.7
5894
7 0.
0023
76
0.00
0411
0.
2005
30
0.07
3643
0.
0191
73
0.00
3774
0.
0007
91
0.00
0053
0.
0001
19
0.00
0135
0.
0000
09
0.71
6.
00
0.32
6040
0.
0621
67
98.6
5853
6 0.
0029
35
0.00
0692
0.
2088
31
0.08
8285
0.
0257
88
0.00
6308
0.
0012
28
0.00
0103
0.
0002
39
0.00
0225
0.
0000
23
0.71
7.
00
0.28
7815
0.
0680
54
98.5
5772
9 0.
0035
09
0.00
1083
0.
2142
35
0.10
1244
0.
0323
58
0.00
9576
0.
0017
26
0.00
0176
0.
0004
27
0.00
0334
0.
0000
48
68
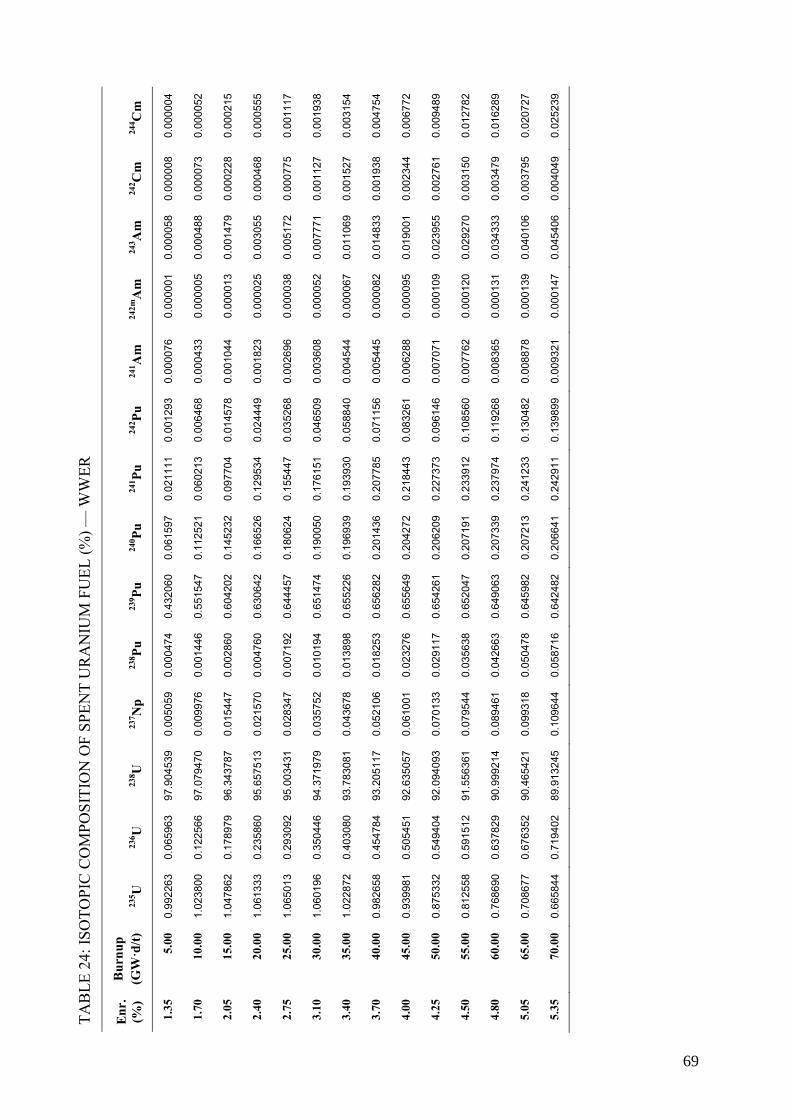
TAB
LE 2
4: IS
OTO
PIC
CO
MPO
SITI
ON
OF
SPEN
T U
RA
NIU
M F
UEL
(%) —
WW
ER
Enr
. (%
) B
urnu
p(G
W·d
/t)
235 U
23
6 U
238 U
23
7 Np
238 Pu
23
9 Pu
240 Pu
24
1 Pu
242 Pu
24
1 Am
24
2mA
m
243 A
m
242 C
m
244 C
m
1.35
5.
00
0.99
2263
0.
0659
63
97.9
0453
9 0.
0050
59
0.00
0474
0.
4320
60
0.06
1597
0.
0211
11
0.00
1293
0.
0000
76
0.00
0001
0.
0000
58
0.00
0008
0.
0000
04
1.70
10
.00
1.02
3800
0.
1225
66
97.0
7947
0 0.
0099
76
0.00
1446
0.
5515
47
0.11
2521
0.
0602
13
0.00
6468
0.
0004
33
0.00
0005
0.
0004
88
0.00
0073
0.
0000
52
2.05
15
.00
1.04
7862
0.
1789
79
96.3
4378
7 0.
0154
47
0.00
2860
0.
6042
02
0.14
5232
0.
0977
04
0.01
4578
0.
0010
44
0.00
0013
0.
0014
79
0.00
0228
0.
0002
15
2.40
20
.00
1.06
1333
0.
2358
60
95.6
5751
3 0.
0215
70
0.00
4760
0.
6306
42
0.16
6526
0.
1295
34
0.02
4449
0.
0018
23
0.00
0025
0.
0030
55
0.00
0468
0.
0005
55
2.75
25
.00
1.06
5013
0.
2930
92
95.0
0343
1 0.
0283
47
0.00
7192
0.
6444
57
0.18
0624
0.
1554
47
0.03
5268
0.
0026
96
0.00
0038
0.
0051
72
0.00
0775
0.
0011
17
3.10
30
.00
1.06
0196
0.
3504
46
94.3
7197
9 0.
0357
52
0.01
0194
0.
6514
74
0.19
0050
0.
1761
51
0.04
6509
0.
0036
08
0.00
0052
0.
0077
71
0.00
1127
0.
0019
38
3.40
35
.00
1.02
2872
0.
4030
80
93.7
8308
1 0.
0436
78
0.01
3898
0.
6552
26
0.19
6939
0.
1939
30
0.05
8840
0.
0045
44
0.00
0067
0.
0110
69
0.00
1527
0.
0031
54
3.70
40
.00
0.98
2658
0.
4547
84
93.2
0511
7 0.
0521
06
0.01
8253
0.
6562
82
0.20
1436
0.
2077
85
0.07
1156
0.
0054
45
0.00
0082
0.
0148
33
0.00
1938
0.
0047
54
4.00
45
.00
0.93
9981
0.
5054
51
92.6
3505
7 0.
0610
01
0.02
3276
0.
6556
49
0.20
4272
0.
2184
43
0.08
3261
0.
0062
88
0.00
0095
0.
0190
01
0.00
2344
0.
0067
72
4.25
50
.00
0.87
5332
0.
5494
04
92.0
9409
3 0.
0701
33
0.02
9117
0.
6542
61
0.20
6209
0.
2273
73
0.09
6146
0.
0070
71
0.00
0109
0.
0239
55
0.00
2761
0.
0094
89
4.50
55
.00
0.81
2558
0.
5915
12
91.5
5636
1 0.
0795
44
0.03
5638
0.
6520
47
0.20
7191
0.
2339
12
0.10
8560
0.
0077
62
0.00
0120
0.
0292
70
0.00
3150
0.
0127
82
4.80
60
.00
0.76
8690
0.
6378
29
90.9
9921
4 0.
0894
61
0.04
2663
0.
6490
63
0.20
7339
0.
2379
74
0.11
9268
0.
0083
65
0.00
0131
0.
0343
33
0.00
3479
0.
0162
89
5.05
65
.00
0.70
8677
0.
6763
52
90.4
6542
1 0.
0993
18
0.05
0478
0.
6459
82
0.20
7213
0.
2412
33
0.13
0482
0.
0088
78
0.00
0139
0.
0401
06
0.00
3795
0.
0207
27
5.35
70
.00
0.66
5844
0.
7194
02
89.9
1324
5 0.
1096
44
0.05
8716
0.
6424
82
0.20
6641
0.
2429
11
0.13
9899
0.
0093
21
0.00
0147
0.
0454
06
0.00
4049
0.
0252
39
69

70
TAB
LE 2
5: IS
OTO
PIC
CO
MPO
SITI
ON
OF
SPEN
T M
OX
FU
EL (%
) — P
WR
Tot
Pu
(%)
Bur
nup
(GW
·d/t)
23
5 U
236 U
23
8 U
237 N
p 23
8 Pu
239 Pu
24
0 Pu
241 Pu
24
2 Pu
241 A
m
242m
Am
24
3 Am
24
2 Cm
24
4 Cm
1.29
5.
00
0.23
5930
0.
0128
37
97.6
5642
3 0.
0047
63
0.01
5733
0.
9510
65
0.34
8543
0.
1682
95
0.07
4197
0.
0021
97
0.00
0037
0.
0121
30
0.00
0353
0.
0019
84
1.82
10
.00
0.20
3602
0.
0189
50
96.6
6470
2 0.
0076
05
0.02
1297
1.
1410
30
0.50
8893
0.
2520
52
0.11
0994
0.
0055
78
0.00
0118
0.
0261
25
0.00
1250
0.
0068
72
2.43
15
.00
0.18
2871
0.
0225
05
95.7
3425
0 0.
0095
21
0.02
8028
1.
2547
62
0.65
6236
0.
3415
49
0.15
4007
0.
0103
23
0.00
0238
0.
0426
30
0.00
2560
0.
0141
47
3.12
20
.00
0.16
8721
0.
0246
68
94.8
1980
0 0.
0108
31
0.03
6134
1.
3387
42
0.79
6572
0.
4342
61
0.20
2470
0.
0165
78
0.00
0402
0.
0614
34
0.00
4175
0.
0233
75
3.89
25
.00
0.15
8845
0.
0259
61
93.8
9821
9 0.
0117
08
0.04
5842
1.
4125
03
0.93
6265
0.
5301
65
0.25
5839
0.
0245
40
0.00
0613
0.
0821
93
0.00
6008
0.
0340
49
4.75
30
.00
0.15
1931
0.
0266
69
92.9
5417
9 0.
0122
64
0.05
7355
1.
4865
10
1.08
0874
0.
6301
82
0.31
3786
0.
0344
67
0.00
0879
0.
1045
58
0.00
7998
0.
0456
39
5.60
35
.00
0.14
6028
0.
0271
89
92.0
2965
0 0.
0127
31
0.06
9822
1.
5492
57
1.21
6881
0.
7257
56
0.37
1684
0.
0457
37
0.00
1186
0.
1275
75
0.01
0035
0.
0580
73
6.52
40
.00
0.14
1764
0.
0273
92
91.0
7351
5 0.
0130
18
0.08
4206
1.
6197
13
1.36
2130
0.
8258
63
0.43
3266
0.
0591
98
0.00
1552
0.
1516
02
0.01
2146
0.
0707
40
7.50
45
.00
0.13
8739
0.
0273
51
90.0
7903
2 0.
0131
73
0.10
0615
1.
7011
92
1.51
9580
0.
9313
73
0.49
8474
0.
0751
64
0.00
1984
0.
1764
19
0.01
4316
0.
0832
79
8.46
50
.00
0.13
5615
0.
0273
41
89.1
1088
1 0.
0133
79
0.11
7776
1.
7719
06
1.66
6938
1.
0305
43
0.56
1926
0.
0922
81
0.00
2453
0.
2012
80
0.01
6450
0.
0962
79
9.48
55
.00
0.13
3276
0.
0271
73
88.1
0624
4 0.
0135
17
0.13
6892
1.
8541
57
1.82
6472
1.
1345
21
0.62
8336
0.
1119
96
0.00
2990
0.
2266
32
0.01
8614
0.
1089
09
10.6
6 60
.00
0.13
2482
0.
0266
68
86.9
7841
9 0.
0134
88
0.15
9607
1.
9790
12
2.02
8905
1.
2577
42
0.70
3633
0.
1369
03
0.00
3649
0.
2528
55
0.02
0901
0.
1198
53
11.8
0 65
.00
0.13
1146
0.
0262
74
85.8
8355
4 0.
0135
85
0.18
2887
2.
0920
35
2.21
9327
1.
3730
07
0.77
6193
0.
1630
09
0.00
4345
0.
2788
15
0.02
3120
0.
1311
50
13.1
1 70
.00
0.13
0998
0.
0255
93
84.6
4638
7 0.
0135
84
0.21
0044
2.
2577
73
2.45
9831
1.
5091
33
0.85
8084
0.
1956
51
0.00
5190
0.
3052
77
0.02
5450
0.
1402
74
70
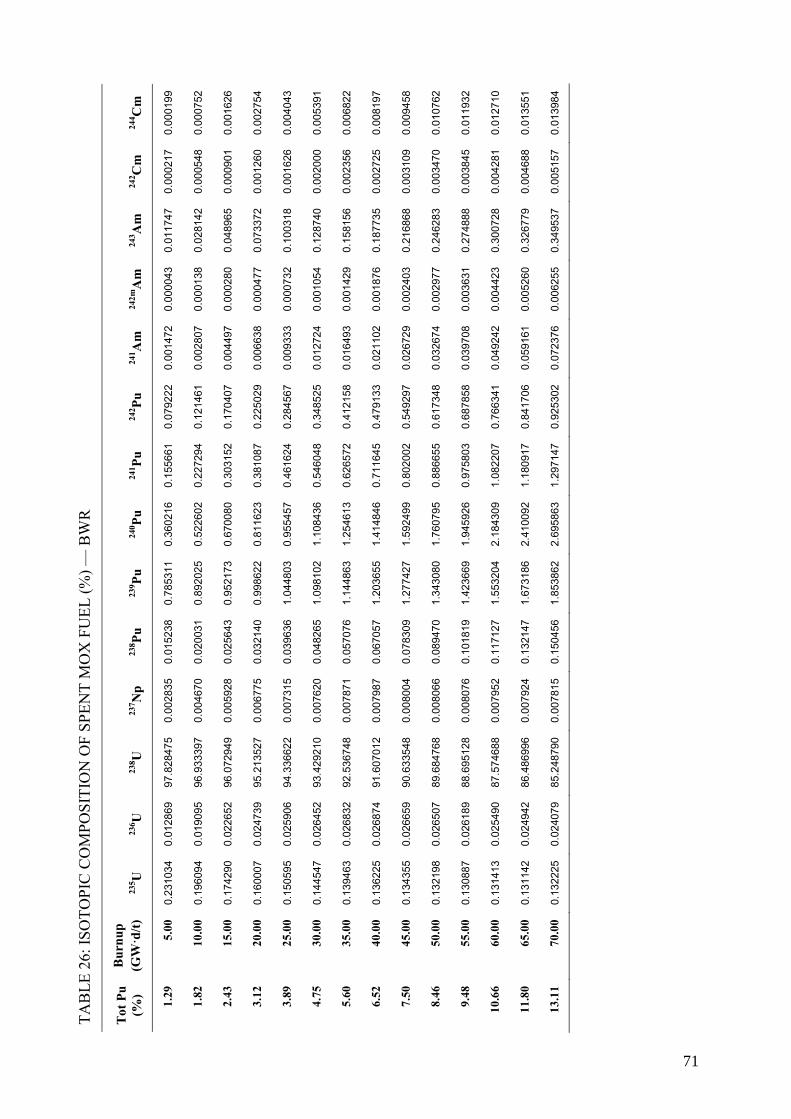
TAB
LE 2
6: IS
OTO
PIC
CO
MPO
SITI
ON
OF
SPEN
T M
OX
FU
EL (%
) — B
WR
Tot
Pu
(%)
Bur
nup
(GW
·d/t)
23
5 U
236 U
23
8 U
237 N
p 23
8 Pu
239 Pu
24
0 Pu
241 Pu
24
2 Pu
241 A
m
242m
Am
24
3 Am
24
2 Cm
24
4 Cm
1.29
5.
00
0.23
1034
0.
0128
69
97.8
2847
5 0.
0028
35
0.01
5238
0.
7853
11
0.36
0216
0.
1556
61
0.07
9222
0.
0014
72
0.00
0043
0.
0117
47
0.00
0217
0.
0001
99
1.82
10
.00
0.19
6094
0.
0190
95
96.9
3339
7 0.
0046
70
0.02
0031
0.
8920
25
0.52
2602
0.
2272
94
0.12
1461
0.
0028
07
0.00
0138
0.
0281
42
0.00
0548
0.
0007
52
2.43
15
.00
0.17
4290
0.
0226
52
96.0
7294
9 0.
0059
28
0.02
5643
0.
9521
73
0.67
0080
0.
3031
52
0.17
0407
0.
0044
97
0.00
0280
0.
0489
65
0.00
0901
0.
0016
26
3.12
20
.00
0.16
0007
0.
0247
39
95.2
1352
7 0.
0067
75
0.03
2140
0.
9986
22
0.81
1623
0.
3810
87
0.22
5029
0.
0066
38
0.00
0477
0.
0733
72
0.00
1260
0.
0027
54
3.89
25
.00
0.15
0595
0.
0259
06
94.3
3662
2 0.
0073
15
0.03
9636
1.
0448
03
0.95
5457
0.
4616
24
0.28
4567
0.
0093
33
0.00
0732
0.
1003
18
0.00
1626
0.
0040
43
4.75
30
.00
0.14
4547
0.
0264
52
93.4
2921
0 0.
0076
20
0.04
8265
1.
0981
02
1.10
8436
0.
5460
48
0.34
8525
0.
0127
24
0.00
1054
0.
1287
40
0.00
2000
0.
0053
91
5.60
35
.00
0.13
9463
0.
0268
32
92.5
3674
8 0.
0078
71
0.05
7076
1.
1448
63
1.25
4613
0.
6265
72
0.41
2158
0.
0164
93
0.00
1429
0.
1581
56
0.00
2356
0.
0068
22
6.52
40
.00
0.13
6225
0.
0268
74
91.6
0701
2 0.
0079
87
0.06
7057
1.
2036
55
1.41
4846
0.
7116
45
0.47
9133
0.
0211
02
0.00
1876
0.
1877
35
0.00
2725
0.
0081
97
7.50
45
.00
0.13
4355
0.
0266
59
90.6
3354
8 0.
0080
04
0.07
8309
1.
2774
27
1.59
2499
0.
8020
02
0.54
9297
0.
0267
29
0.00
2403
0.
2168
68
0.00
3109
0.
0094
58
8.46
50
.00
0.13
2198
0.
0265
07
89.6
8476
8 0.
0080
66
0.08
9470
1.
3430
80
1.76
0795
0.
8866
55
0.61
7348
0.
0326
74
0.00
2977
0.
2462
83
0.00
3470
0.
0107
62
9.48
55
.00
0.13
0887
0.
0261
89
88.6
9512
8 0.
0080
76
0.10
1819
1.
4236
69
1.94
5926
0.
9758
03
0.68
7858
0.
0397
08
0.00
3631
0.
2748
88
0.00
3845
0.
0119
32
10.6
6 60
.00
0.13
1413
0.
0254
90
87.5
7468
8 0.
0079
52
0.11
7127
1.
5532
04
2.18
4309
1.
0822
07
0.76
6341
0.
0492
42
0.00
4423
0.
3007
28
0.00
4281
0.
0127
10
11.8
0 65
.00
0.13
1142
0.
0249
42
86.4
8699
6 0.
0079
24
0.13
2147
1.
6731
86
2.41
0092
1.
1809
17
0.84
1706
0.
0591
61
0.00
5260
0.
3267
79
0.00
4688
0.
0135
51
13.1
1 70
.00
0.13
2225
0.
0240
79
85.2
4879
0 0.
0078
15
0.15
0456
1.
8538
62
2.69
5863
1.
2971
47
0.92
5302
0.
0723
76
0.00
6255
0.
3495
37
0.00
5157
0.
0139
84
71

Appendix VI VALIDATION AND BENCHMARKING OF CAIN MODEL
In order to use CAIN code in the VISTA simulation system, one needs to validate the CAIN code against the other available well known codes and measurement results. The validation study was performed for uranium fuels and MOX fuels separately since handling MOX fuels was added to the system later on.
VI.1. Validation of CAIN code for uranium fuels
Different methods and sources were used to validate CAIN code for uranium fuels. For PWR, BWR and PHWR uranium fuels CAIN results were compared with those given by ORIGEN code (Section VI.1.1). Both calculations used the same cross section set which is available in ORIGEN standard library. For AGR, GCR, RBMK and PHWR uranium fuels, validation against WIMS code was performed (Section VI.1.3). In addition, CAIN results are compared with available measurements (Section VI.1.2).
VI.1.1. CAIN vs. ORIGEN
The CAIN burnup calculation was compared with the ORIGEN code for 3 reactor types, which are PWR, BWR and PHWR. Since cross sections and the neutron flux are identical for both CAIN and ORIGEN, these two results should be identical except the small influence due to the assumptions listed in Section 2.5.5.3.
TABLES 27–29 show the comparisons of CAIN and ORIGEN results. The results show that the CAIN code agrees very well to the ORIGEN, and the errors are less than 1–2% for PWR and BWR cases. For PHWR case, the CAIN code also agrees very well to the ORIGEN within 1-5% error except 238Pu. 238Pu concentration calculated by the ORIGEN is 10% smaller, and this may be due to an inappropriate large 237U cross section in the ORIGEN.
Based on these results, it is concluded that the CAIN model gives essentially identical results to the ORIGEN.
73

TABLE 27: CAIN AND ORIGEN COMPARISON (PWR WITH 4.0% ENRICHMENT AT 45 MW·d/kg)
Isotope CAIN (wt%) ORIGEN (wt%) Error (%) 235U 0.679918 0.679800 0.02 236U 0.524208 0.524400 -0.04 238U 93.046956 93.050000 0.00
237Np 0.068681 0.068590 0.13 238Pu 0.024492 0.024040 1.88 239Pu 0.511364 0.518300 -1.34 240Pu 0.263429 0.265100 -0.63 241Pu 0.150552 0.151300 -0.49 242Pu 0.064934 0.065110 -0.27
241Am 0.004761 0.004772 -0.23 242mAm 0.000108 N/A N/A 243Am 0.014612 0.014530 0.56 242Cm 0.001791 0.001801 -0.53 244Cm 0.004835 0.004832 0.06
Total 95.360641 95.372575 -0.01 TABLE 28: CAIN AND ORIGEN COMPARISON (BWR WITH 4.0% ENRICHMENT AT
45 MW·d/kg)
Isotope CAIN (wt%) ORIGEN (wt%) Error (%) 235U 0.626722 0.625100 0.26 236U 0.527411 0.527700 -0.05 238U 93.125703 93.120000 0.01
237Np 0.070138 0.070180 -0.06 238Pu 0.026709 0.026630 0.30 239Pu 0.485480 0.491600 -1.24 240Pu 0.255193 0.256800 -0.63 241Pu 0.146241 0.146800 -0.38 242Pu 0.067542 0.067850 -0.45
241Am 0.006797 0.007037 -3.42 242mAm 0.000155 N/A N/A 243Am 0.015633 0.015590 0.27 242Cm 0.001981 0.002015 -1.69 244Cm 0.005273 0.005264 0.18
Total 95.360977 95.362566 0.00
74

TABLE 29: CAIN AND ORIGEN COMPARISON (PHWR WITH 0.71% ENRICH. AT 7 MW·D/KG)
Isotope CAIN (wt%) ORIGEN (wt%) Error (%) 235U 0.236956 0.232600 1.87 236U 0.071047 0.071830 -1.09 238U 98.583303 98.570000 0.01
237Np 0.002596 0.002576 0.76 238Pu 0.000333 0.000303 9.81 239Pu 0.265876 0.270100 -1.56 240Pu 0.095796 0.097760 -2.01 241Pu 0.018118 0.018670 -2.96 242Pu 0.003937 0.004132 -4.72
241Am 0.000183 0.000187 -2.37 242mAm 0.000002 N/A N/A 243Am 0.000123 0.000130 -4.82 242Cm 0.000060 0.000055 8.32 244Cm 0.000010 0.000011 -7.02
Total 99.278338 99.268354 0.01
VI.1.2. CAIN vs. measurement
Direct verification of the CAIN model was performed by comparing its results with the measurement on discharged fuels for PWR and BWR fuels.
There is one report of 220 pages [28], which compiles the results of the open data on the actinide measurement of the discharged fuels from both PWRs and BWRs. This report contains PIE (post irradiation experiment) data for the spent fuels from 7 PWRs and 6 BWRs. Unfortunately, most of the data are shown in the format of tables, and the only available graphs on 235U and Pu composition are shown here. Figures 42–48 are the comparison between CAIN results and the measured data for 235U, total Pu, and each Pu (239Pu, 240Pu, 241Pu, 242Pu, 238Pu) composition.
In order to verify the CAIN model, two calculations were performed for the 3% enrichment of PWR and BWR fuel. Based on the report, the actual enrichments vary from 2.5% to 3.4%, and this would affect the result slightly. But, in general, the CAIN model agrees very well with the measurement. As can be seen in the figures, there is very little difference between PWR and BWR. Actually, because of the similar neutron spectrum for both reactors, isotopic composition would become similar. Usually, PWR is using smaller fuel rod, and this will cause a little bit higher amount of plutonium due to larger resonance absorption for the same enrichment.
Regarding other actinides such as Np/Am/Cm, another report is available [29]. The comparison between the CAIN model and the PIE data is shown in Figures 49–51 on 237Np, 241Am, 243Am, 242Cm and 244Cm. The CAIN model also agrees well for these actinides. As for the content of 241Pu or 242Cm, the measurement may include the effect of the decay,
75
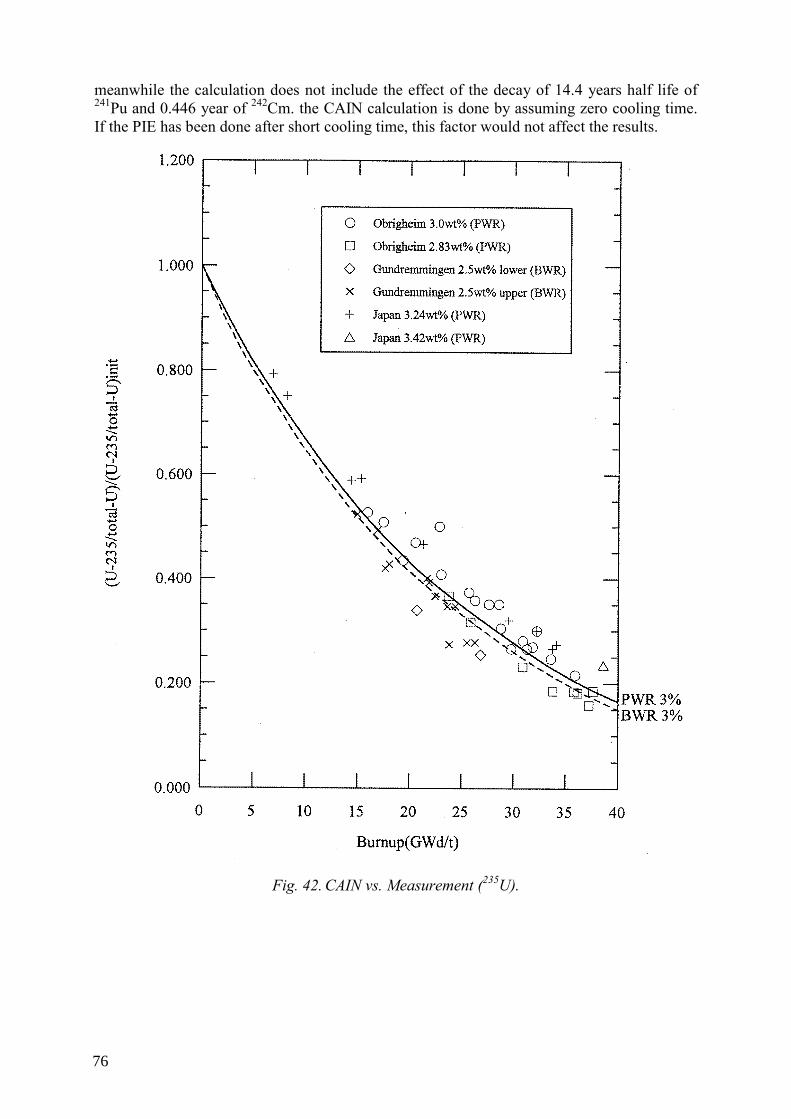
meanwhile the calculation does not include the effect of the decay of 14.4 years half life of 241Pu and 0.446 year of 242Cm. the CAIN calculation is done by assuming zero cooling time. If the PIE has been done after short cooling time, this factor would not affect the results.
Fig. 42. CAIN vs. Measurement (235U).
76

Fig. 43. CAIN vs. Measurement (Pu total).
77

Fig. 44. CAIN vs. Measurement (239Pu).
78

Fig. 45. CAIN vs. Measurement (240Pu).
79
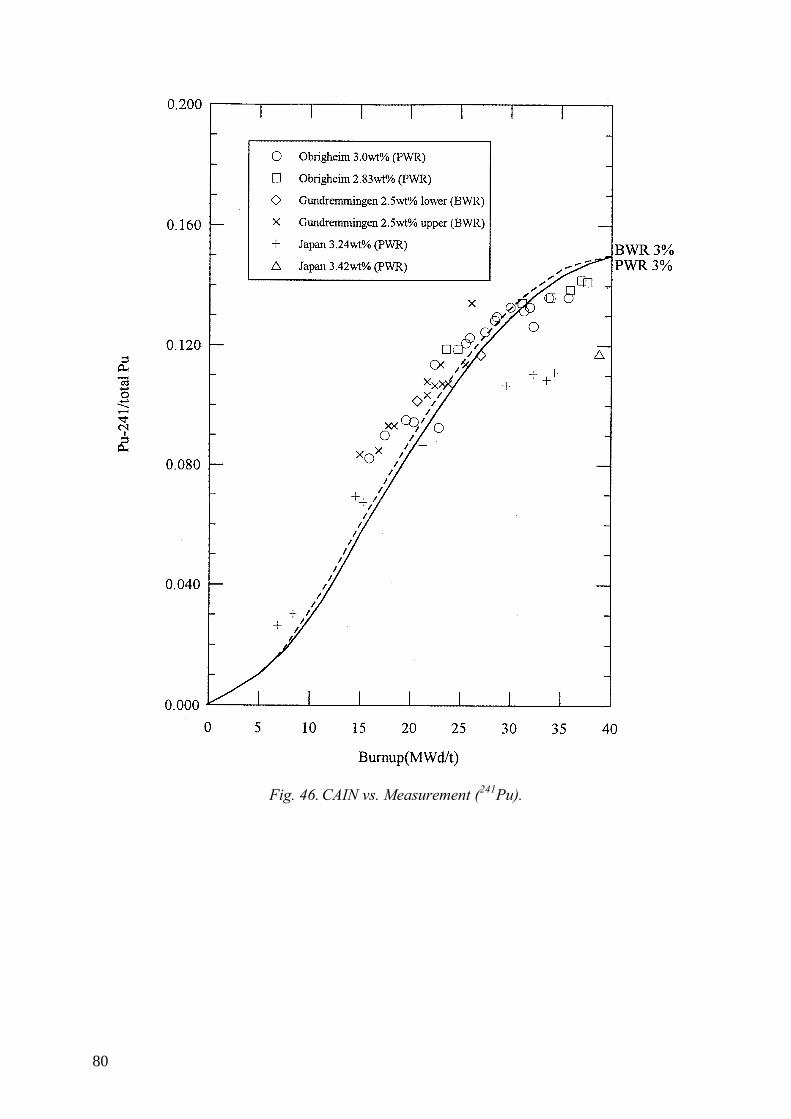
Fig. 46. CAIN vs. Measurement (241Pu).
80
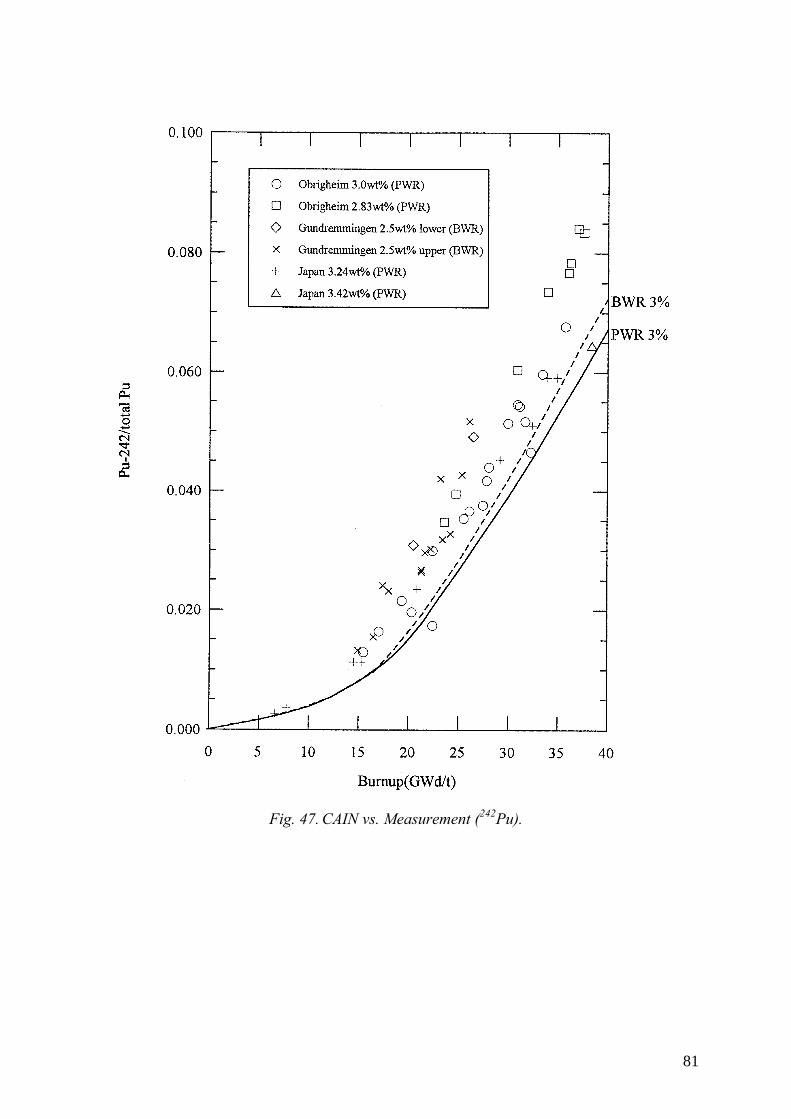
Fig. 47. CAIN vs. Measurement (242Pu).
81

Fig. 48. CAIN vs. Measurement (238Pu).
Fig. 49. CAIN vs. Measurement (237Np).
82
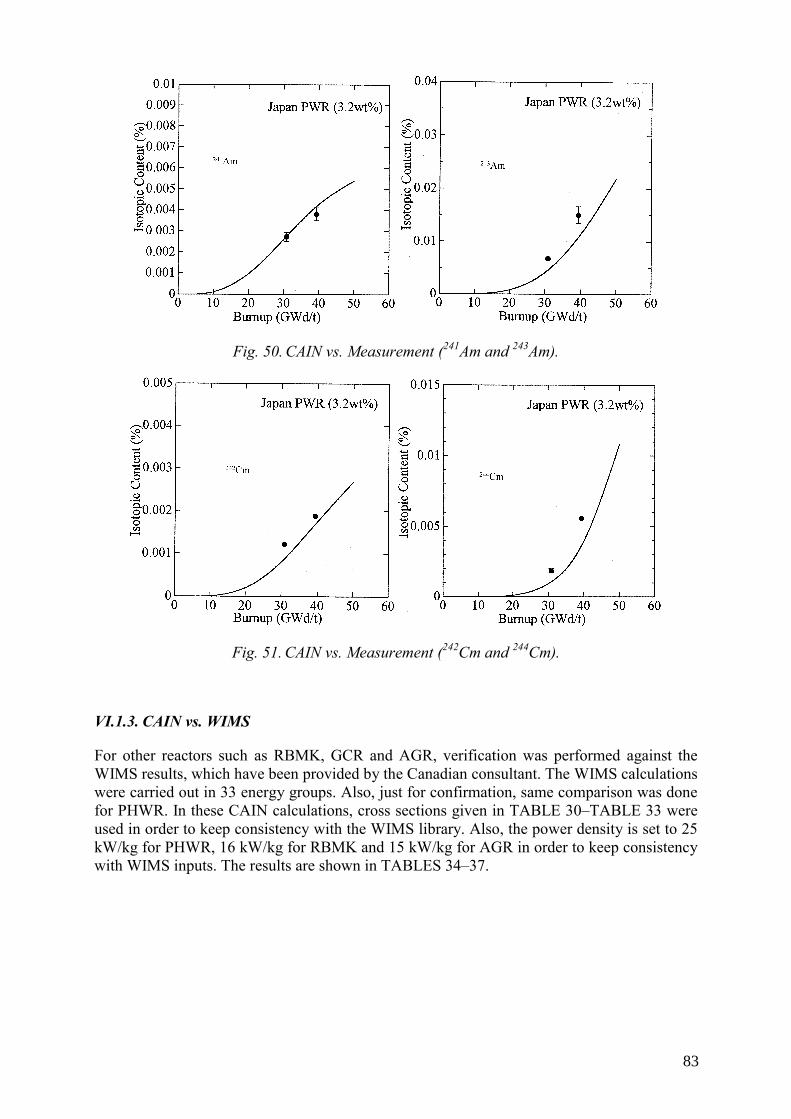
Fig. 50. CAIN vs. Measurement (241Am and 243Am).
Fig. 51. CAIN vs. Measurement (242Cm and 244Cm).
VI.1.3. CAIN vs. WIMS
For other reactors such as RBMK, GCR and AGR, verification was performed against the WIMS results, which have been provided by the Canadian consultant. The WIMS calculations were carried out in 33 energy groups. Also, just for confirmation, same comparison was done for PHWR. In these CAIN calculations, cross sections given in TABLE 30–TABLE 33 were used in order to keep consistency with the WIMS library. Also, the power density is set to 25 kW/kg for PHWR, 16 kW/kg for RBMK and 15 kW/kg for AGR in order to keep consistency with WIMS inputs. The results are shown in TABLES 34–37.
83

TABLE 30: CROSS SECTIONS (BARNS) AT MID-BURNUP
AGR, 24 MW·d/kg - 2.6% Fuel
Nuclide aσ fσ 235U 77.40 63.50 236U 5.17 0.16 238U 0.84 0.08
237Np 38.10 239Pu 250.00 160.00 240Pu 115.00 0.43 241Pu 236.00 168.00 242Pu 25.30
241Am 169.00 243Am 49.10
TABLE 31: CROSS SECTIONS (BARNS) AT MID-BURNUP
GGR, 4 MW·d/kg - 0.71% Fuel
Nuclide aσ fσ 235U 115.00 96.00 236U 6.43 0.13 238U 0.940 0.06
237Np 48.30 0.3 239Pu 388.00 249.00 240Pu 185.38 0.38 241Pu 362.00 255.00 242Pu 25.30 0.3
241Am 393.89 2.191 243Am 75.87 0.06523
84
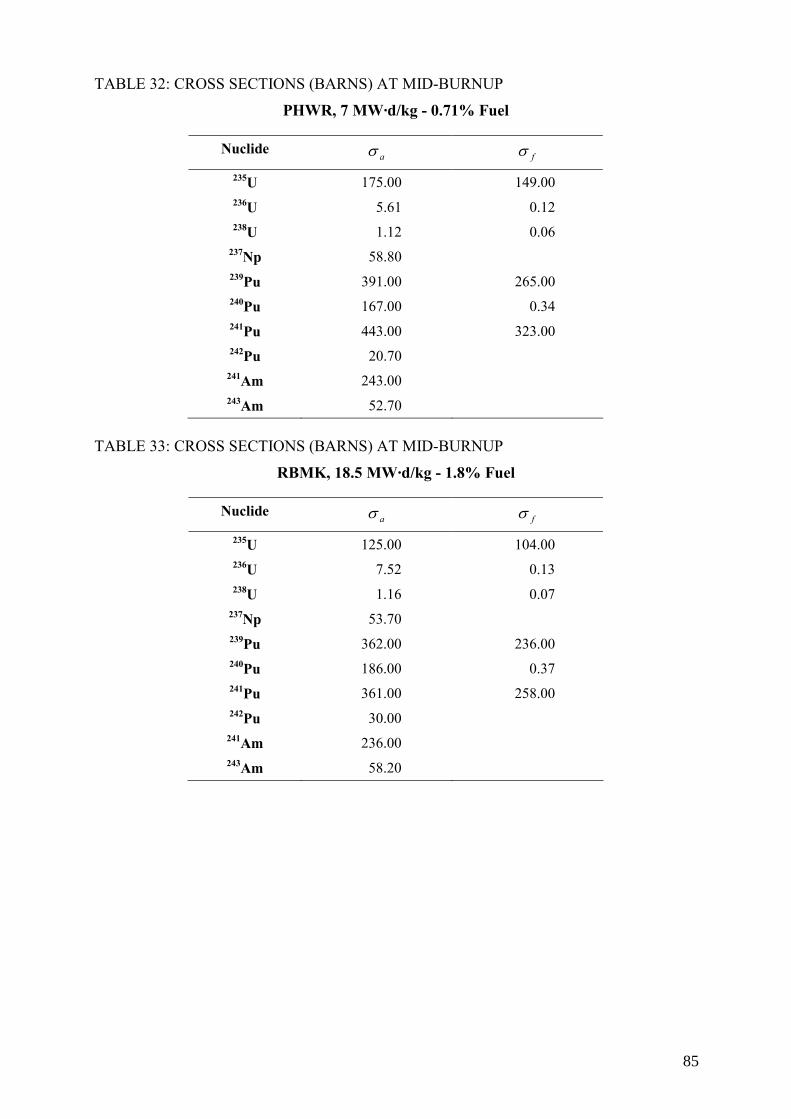
TABLE 32: CROSS SECTIONS (BARNS) AT MID-BURNUP
PHWR, 7 MW·d/kg - 0.71% Fuel
Nuclide aσ fσ
235U 175.00 149.00 236U 5.61 0.12 238U 1.12 0.06
237Np 58.80 239Pu 391.00 265.00 240Pu 167.00 0.34 241Pu 443.00 323.00 242Pu 20.70
241Am 243.00 243Am 52.70
TABLE 33: CROSS SECTIONS (BARNS) AT MID-BURNUP
RBMK, 18.5 MW·d/kg - 1.8% Fuel
Nuclide aσ fσ
235U 125.00 104.00 236U 7.52 0.13 238U 1.16 0.07
237Np 53.70 239Pu 362.00 236.00 240Pu 186.00 0.37 241Pu 361.00 258.00 242Pu 30.00
241Am 236.00 243Am 58.20
85
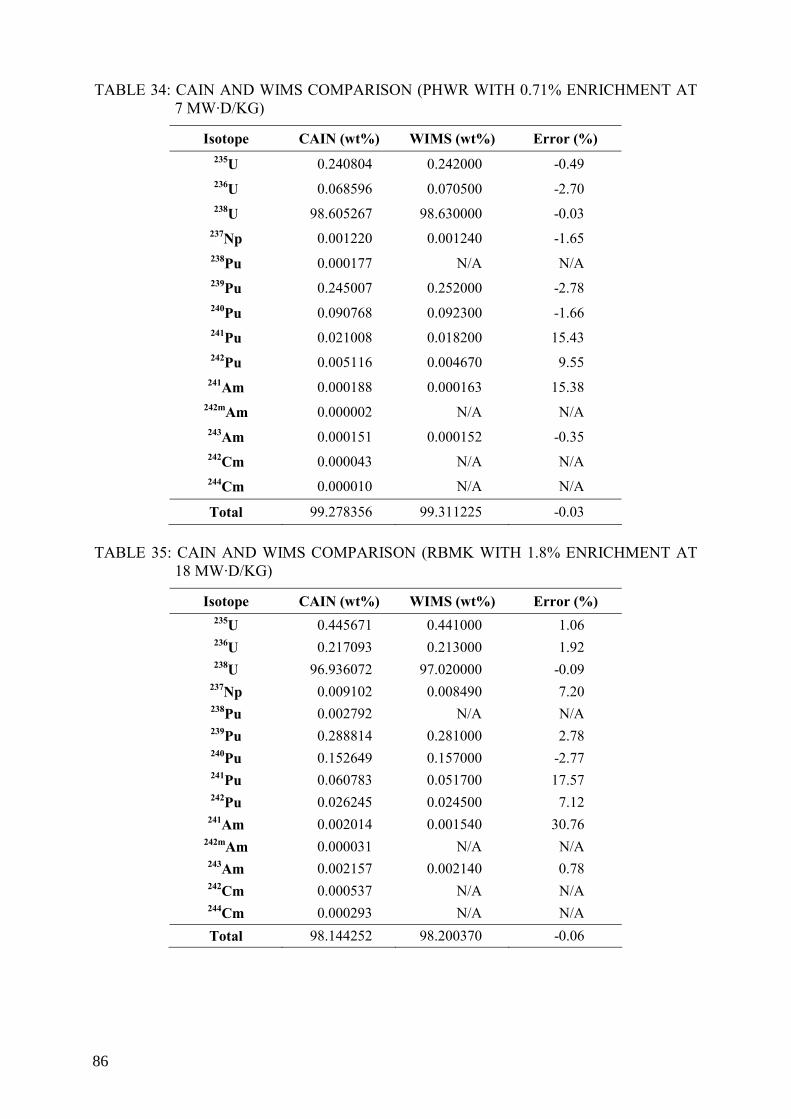
TABLE 34: CAIN AND WIMS COMPARISON (PHWR WITH 0.71% ENRICHMENT AT 7 MW·D/KG)
Isotope CAIN (wt%) WIMS (wt%) Error (%) 235U 0.240804 0.242000 -0.49 236U 0.068596 0.070500 -2.70 238U 98.605267 98.630000 -0.03
237Np 0.001220 0.001240 -1.65 238Pu 0.000177 N/A N/A 239Pu 0.245007 0.252000 -2.78 240Pu 0.090768 0.092300 -1.66 241Pu 0.021008 0.018200 15.43 242Pu 0.005116 0.004670 9.55
241Am 0.000188 0.000163 15.38 242mAm 0.000002 N/A N/A 243Am 0.000151 0.000152 -0.35 242Cm 0.000043 N/A N/A 244Cm 0.000010 N/A N/A
Total 99.278356 99.311225 -0.03
TABLE 35: CAIN AND WIMS COMPARISON (RBMK WITH 1.8% ENRICHMENT AT 18 MW·D/KG)
Isotope CAIN (wt%) WIMS (wt%) Error (%) 235U 0.445671 0.441000 1.06 236U 0.217093 0.213000 1.92 238U 96.936072 97.020000 -0.09
237Np 0.009102 0.008490 7.20 238Pu 0.002792 N/A N/A 239Pu 0.288814 0.281000 2.78 240Pu 0.152649 0.157000 -2.77 241Pu 0.060783 0.051700 17.57 242Pu 0.026245 0.024500 7.12
241Am 0.002014 0.001540 30.76 242mAm 0.000031 N/A N/A 243Am 0.002157 0.002140 0.78 242Cm 0.000537 N/A N/A 244Cm 0.000293 N/A N/A Total 98.144252 98.200370 -0.06
86
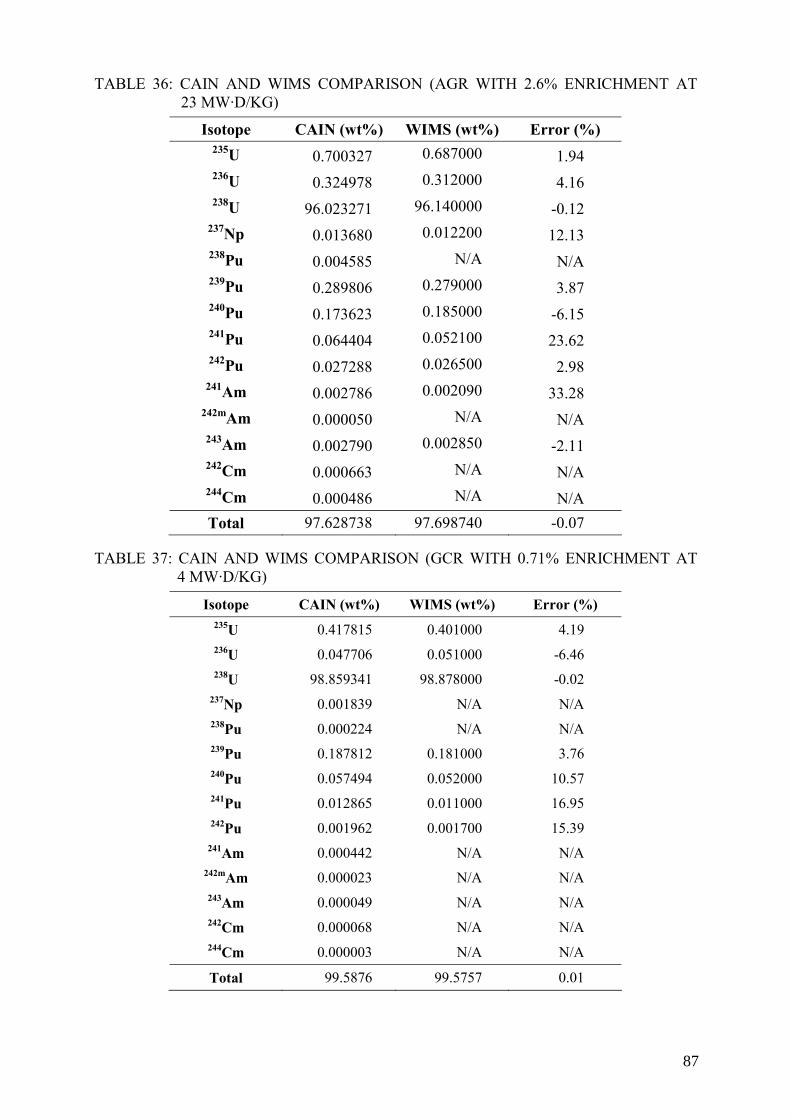
TABLE 36: CAIN AND WIMS COMPARISON (AGR WITH 2.6% ENRICHMENT AT 23 MW·D/KG)
Isotope CAIN (wt%) WIMS (wt%) Error (%) 235U 0.700327 0.687000 1.94 236U 0.324978 0.312000 4.16 238U 96.023271 96.140000 -0.12
237Np 0.013680 0.012200 12.13 238Pu 0.004585 N/A N/A 239Pu 0.289806 0.279000 3.87 240Pu 0.173623 0.185000 -6.15 241Pu 0.064404 0.052100 23.62 242Pu 0.027288 0.026500 2.98
241Am 0.002786 0.002090 33.28 242mAm 0.000050 N/A N/A 243Am 0.002790 0.002850 -2.11 242Cm 0.000663 N/A N/A 244Cm 0.000486 N/A N/A Total 97.628738 97.698740 -0.07
TABLE 37: CAIN AND WIMS COMPARISON (GCR WITH 0.71% ENRICHMENT AT
4 MW·D/KG)
Isotope CAIN (wt%) WIMS (wt%) Error (%) 235U 0.417815 0.401000 4.19 236U 0.047706 0.051000 -6.46 238U 98.859341 98.878000 -0.02
237Np 0.001839 N/A N/A 238Pu 0.000224 N/A N/A 239Pu 0.187812 0.181000 3.76 240Pu 0.057494 0.052000 10.57 241Pu 0.012865 0.011000 16.95 242Pu 0.001962 0.001700 15.39
241Am 0.000442 N/A N/A 242mAm 0.000023 N/A N/A 243Am 0.000049 N/A N/A 242Cm 0.000068 N/A N/A 244Cm 0.000003 N/A N/A
Total 99.5876 99.5757 0.01
87

As it can be seen from the tables, the CAIN code agrees very well with WIMS code except several higher actinides. Considering that the CAIN is a one group and one point model, it is concluded that the CAIN code has enough accuracy to meet the requirements of VISTA simulation model.
VI.2. MOX fuels
VI.2.1. Benchmark of PWR-MOX fuel
In the ORIGEN, there is only one PWR-MOX library. Cross sections used in VISTA which is given in TABLE 16 are identical to ORIGEN code. In the ORIGEN manual, minor modification to U/Pu cross sections due to burnup is proposed. But this modification is complex, and its effect on the isotopic concentration is in the order of several percent. So, the original library cross sections can be used in VISTA.
In order to compare the VISTA and ORIGEN results , constant flux is used in ORIGEN, that is, IRF=2.42E14 is used, instead of IRP=39.2 kW/kg. Also, in order to adjust to 45 GW·d/t, 1 155 days is used instead of 1 148 days as irradiation time.
The result is shown in TABLE 38. The maximum error is in 238Pu (5.3%), but this nuclide is the end of long chain, and the error is acceptable.
TABLE 38: COMPARISON BETWEEN ORIGEN AND VISTA/CAIN FOR PWR-MOX
BU=45 GW·d/t BU=0 gram
ORIGEN VISTA Error(%) 235U 2 780 1 380 1 362 -1.3 236U 0 282 274 -2.8 238U 924 421 902 600 902 272 0
237Np 0 131 132 0.8 238Pu 924 925 974 5.3 239Pu 43 672 16 800 16 512 -1.7 240Pu 15 765 14 800 14 677 -0.8 241Pu 8 558 9 100 9 050 -0.5 242Pu 3 821 4 860 4 870 0.2
241Am 0 700 719 2.7 242mAm 0 17 19 (2g) 243Am 0 1 720 1 750 1.7 242Cm 0 140 142 1.4 244Cm 0 826 851 3
Total 999 941 954 281 953 604 -0.1
88
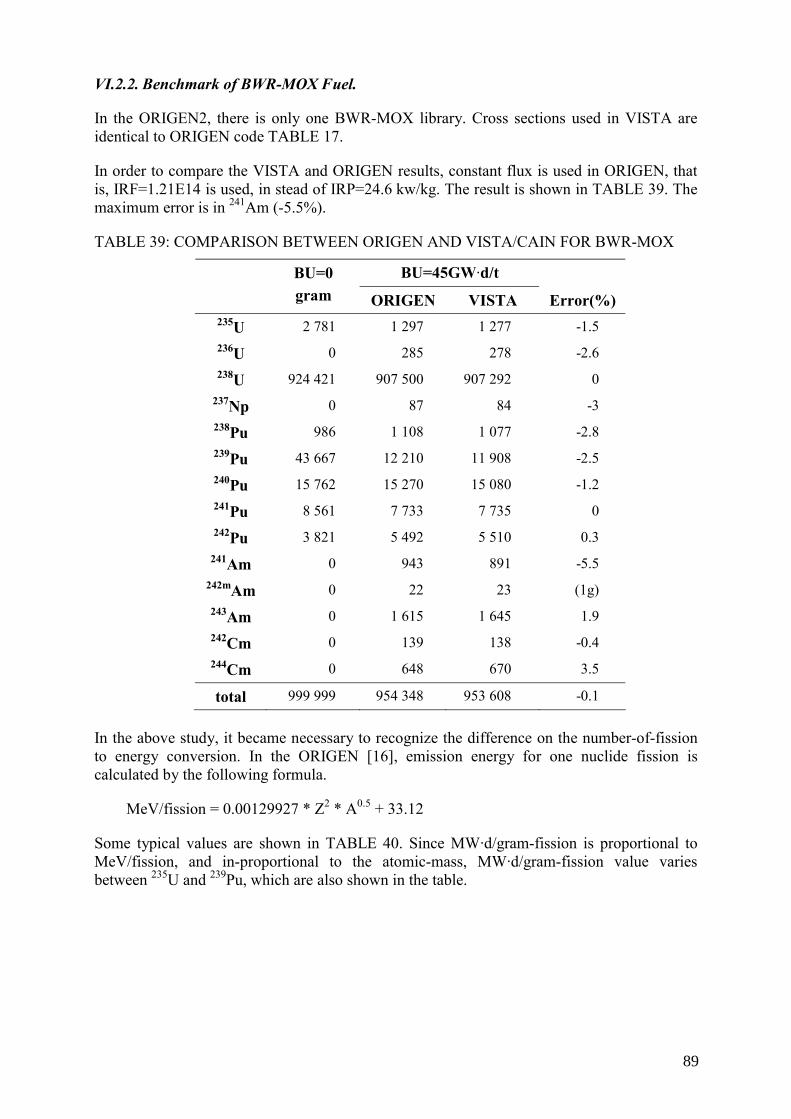
VI.2.2. Benchmark of BWR-MOX Fuel.
In the ORIGEN2, there is only one BWR-MOX library. Cross sections used in VISTA are identical to ORIGEN code TABLE 17.
In order to compare the VISTA and ORIGEN results, constant flux is used in ORIGEN, that is, IRF=1.21E14 is used, in stead of IRP=24.6 kw/kg. The result is shown in TABLE 39. The maximum error is in 241Am (-5.5%).
TABLE 39: COMPARISON BETWEEN ORIGEN AND VISTA/CAIN FOR BWR-MOX
BU=45GW·d/t BU=0 gram ORIGEN VISTA Error(%)
235U 2 781 1 297 1 277 -1.5 236U 0 285 278 -2.6 238U 924 421 907 500 907 292 0
237Np 0 87 84 -3 238Pu 986 1 108 1 077 -2.8 239Pu 43 667 12 210 11 908 -2.5 240Pu 15 762 15 270 15 080 -1.2 241Pu 8 561 7 733 7 735 0 242Pu 3 821 5 492 5 510 0.3
241Am 0 943 891 -5.5 242mAm 0 22 23 (1g) 243Am 0 1 615 1 645 1.9 242Cm 0 139 138 -0.4 244Cm 0 648 670 3.5
total 999 999 954 348 953 608 -0.1
In the above study, it became necessary to recognize the difference on the number-of-fission to energy conversion. In the ORIGEN [16], emission energy for one nuclide fission is calculated by the following formula.
MeV/fission = 0.00129927 * Z2 * A0.5 + 33.12
Some typical values are shown in TABLE 40. Since MW·d/gram-fission is proportional to MeV/fission, and in-proportional to the atomic-mass, MW·d/gram-fission value varies between 235U and 239Pu, which are also shown in the table.
89
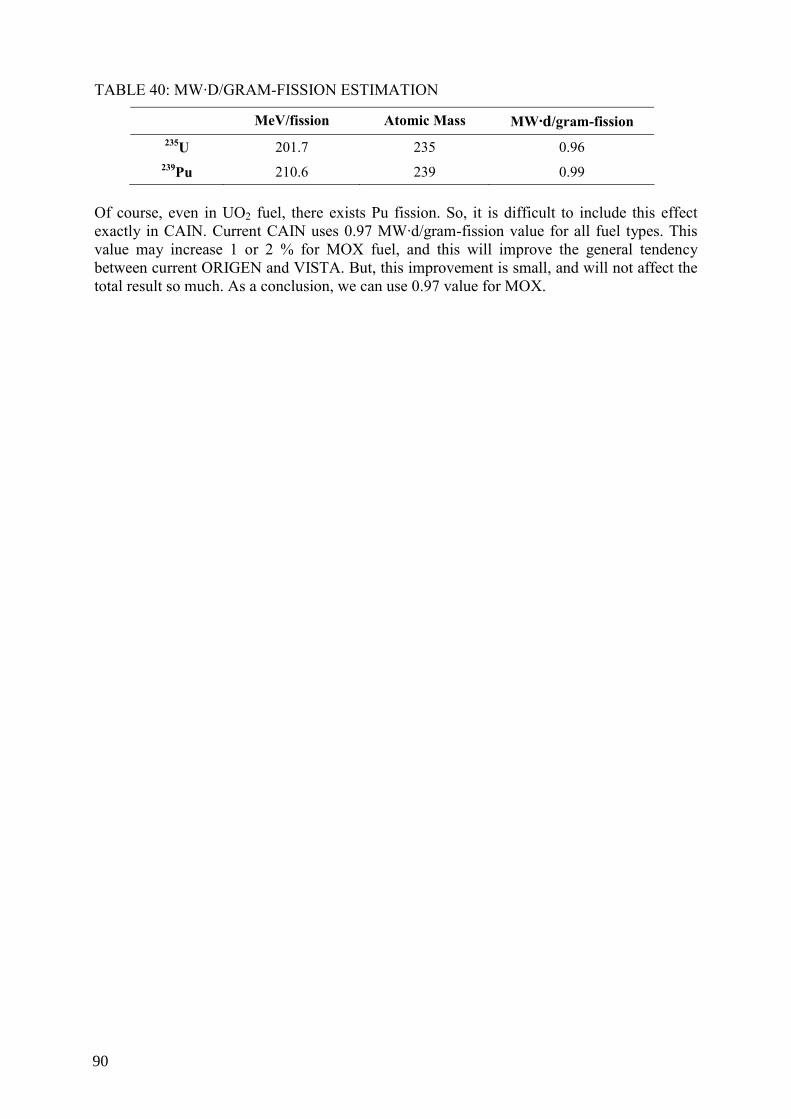
TABLE 40: MW·D/GRAM-FISSION ESTIMATION
MeV/fission Atomic Mass MW·d/gram-fission 235U 201.7 235 0.96
239Pu 210.6 239 0.99 Of course, even in UO2 fuel, there exists Pu fission. So, it is difficult to include this effect exactly in CAIN. Current CAIN uses 0.97 MW·d/gram-fission value for all fuel types. This value may increase 1 or 2 % for MOX fuel, and this will improve the general tendency between current ORIGEN and VISTA. But, this improvement is small, and will not affect the total result so much. As a conclusion, we can use 0.97 value for MOX.
90
REFERENCES
[1] INTERNATIONAL ATOMIC ENERGY AGENCY, Nuclear Fuel Cycle and Reactor Strategies: Adjusting to New Realities (Proc. Int. Symp. Vienna, 1997), IAEA, Vienna (1998).
[2] INTERNATIONAL ATOMIC ENERGY AGENCY, Integrated Nuclear Fuel Cycle Information Systems, INFCIS (http://www-nfcis.iaea.org).
[3] INTERNATIONAL ATOMIC ENERGY AGENCY, Power Reactor Information System, PRIS (http://www.iaea.org/programme/a2/).
[4] INTERNATIONAL ATOMIC ENERGY AGENCY, Energy, Electricity and Nuclear Power Estimates for the Period up to 2030, IAEA-RDS-1, IAEA, Vienna (2005).
[5] CHANTON, P., PECNIK, M., “Actinide Database and Fuel Cycle Balance”, 1993 Annual Meeting American Nuclear Society, June 20-24, 1993, San Diego, California , Trans. Am. Nucl. Soc. 68 (1993).
[6] SHANI, R., DEROUBAIX, D., “Estimates of Uranium and Fuel Cycle Service Requirements”, Reactor and Fuel Cycle Strategies: Adjusting to New Realities (Proc. Key Issue Papers, Int. Symp. Vienna, 1997), IAEA, Vienna (1997) Annex I.
[7] DANESS (Dynamic Analysis of Nuclear Energy System Strategies), Argonne National Laboratory, USA, (http://www.anl.gov/techtransfer/Software_Shop/Daness/DANESS.html).
[8] BAESTLE, L.H., DE RAEDT, C., “Comparative Assessment of Actinide-and Risk-Reduction Strategies by P&T Versus Direct Disposal”, GLOBAL ’95: Evaluation of Emerging Nuclear Fuel Cycle Systems (Proc. Int. Conf. Versailles, 1995), American Nuclear Society, LaGrange Park, IL 1 (1995) 149.
[9] BAESTLE, L.H., “Impact of High Burnup Irradiation and Minor Actinides on the Fuel Cycle Activities”, Actinide and FP P&T OECD/NEA (Proc. 3rd Inf. Exc. Mtg, Cadarache, 1994), Cadarache, France (1994).
[10] INTERNATIONAL ATOMIC ENERGY AGENCY, Use of Fast Reactors for Actinide Transmutation, (Proceedings of a Specialists Meeting, Obninsk, Russian Federation, 22–24 September 1992), IAEA-TECDOC-693, IAEA, Vienna (1993).
[11] INTERNATIONAL ATOMIC ENERGY AGENCY, Safety and Environmental Aspects of Partitioning and Transmutation of Actinides and Fission Products, IAEA-TECDOC-783, IAEA, Vienna (1995).
[12] INTERNATIONAL ATOMIC ENERGY AGENCY, Status Report on Actinide and Fission Product Studies, IAEA-TECDOC-948, IAEA, Vienna (1997).
[13] BAESTLE, L.H., “Limitations of Actinide Recycle and Waste Disposal Consequences A Global Analysis”, RECOD ’94: Nuclear Fuel Recycling, Conditioning and Disposal, (Proc. Int. Conf. 1994), Vol. 1, Session 7A, paper 5 (1994).
[14] INSTITUTE OF TRANSURANIUM ELEMENTS, Nuclide 2000 Software, Kalrsuhe, Germany.
[15] ASKEW, J. R., FAYERS, F. J., KEMSHELL, P. B., “A General Description of the Lattice Code WIMS”, J. British Nuclear Energy Society (1966) 564.
[16] BELL, M. J., “ORIGEN: The ORNL Isotope Generation and Depletion Code”, ORNL 4628 (1973).
[17] ANDO, Y., “Estimation of LWR Spent Fuel Composition”, JAERI-Research 99-004, JAERI, Tokyo (1999).
[18] JAPAN NUCLEAR ENERGY INFORMATION CENTER, Directory of Nuclear Power Plants in the World, Tokyo, Japan (1985) (in Japanese).
91
[19] MASSACHUSETTS INSTITUTE OF TECHNOLOGY, Interdisciplinary Study on “The Future of Nuclear Power”, MIT Report (2003) (http://web.mit.edu/nuclearpower/).
[20] NAC International, Nuclear Industry Status Report (2003). [21] INTERNATIONAL ATOMIC ENERGY AGENCY, Water Reactor Fuel
Extended Burnup Study, Technical Reports Series No. 343, IAEA, Vienna (1992). [22] ONOUFRIEV, V., MENUT, P., “Burnup Extension of Water Reactor Fuel: Status
and IAEA Activities”, paper presented at the 6th Int. Conf. on Nuclear Engineering, (1998).
[23] GANGULY, C., KOYAMA, K., “Summary of IAEA Technical Meeting on Fissile Material Strategies for Sustainable Nuclear Energy)”, paper presented at the GLOBAL’05, Tsukuba, Japan, (2005).
[24] CEYHAN, M., “Modeling for Nuclear Material Flows in Nuclear Fuel Cycle”, Fissile Material Management Strategies for Sustainable Nuclear Energy (Proc. Techn. Meeting, Vienna, 2005), IAEA, Vienna (2006) (in press).
[25] BAIRIOT, H., et al., “Fissile Materials Management Strategies for Sustainable Nuclear Energy: Back-end Fuel Cycle Options”, Fissile Material Management Strategies for Sustainable Nuclear Energy, Key Issue Paper 2 (Proc. Techn. Meeting, Vienna, 2005), IAEA, Vienna (2006) (in press).
[26] FUKUDA, K., CEYHAN, M., “Forecast of Fissile Material Inventories in Back-end Fuel Cycle”, Fissile Material Management Strategies for Sustainable Nuclear Energy (Proc. Techn. Meeting, Vienna, 2005), IAEA, Vienna (2006) (in press).
[27] OECD NUCLEAR ENERGY AGENCY, INTERNATIONAL ATOMIC ENERGY AGENCY, Uranium 2003: Resources, Production and Demand, OECD, Paris (2004).
[28] NAITO, Y., KUROSAWA, M., KANEKO, T., “Databook of the Isotopic Composition of Spent Fuel in Light Water Reactors”, JAERI-M/93-061, JAPAN ATOMIC ENERGY RESEARCH INSTITUTE, (1993) (in Japanese).
[29] ADACHI, T., NAKAHARA, Y., KOHNO, N., GUNJI, K., “Comparison of Calculated Values with Measured Values on the Amount TRU and FP Nuclides Accumulated in PWR Spent Fuels”, Journal of Nuclear Science and Technology, Tokyo, Vol 31, No 10, p. 1119, (1994).
92

GLOSSARY
AGR advanced gas cooled reactor
BWR boiling water reactor
FBR fast breeder reactor
FP fission product
GCR gas cooled reactor
GW·d/t gigawatt-days per tonne
HEU highly enriched uranium
HLW high level waste
LWR light water reactor
MA Minor actinide
MOX mixed oxide
PIE post-irradiation examination
P&T partitioning and transmutation
PHWR pressurized heavy water reactor
PWR pressurized water reactor
RBMK high-power channel-type reactor
SEU slightly enriched uranium
SWU separative work unit
WWER water cooled water moderated power reactor
93


CONTRIBUTORS TO DRAFTING AND REVIEW
Akbas T. Turkish Atomic Energy Authority, Turkey
Deroubaix D. AREVA, France
Dastour A. Atomic Energy of Canada Ltd (AECL), Canada
Kochetkov A. Institute of Physics and Power Engineering, Russian Federation
Onufriev V. International Atomic Energy Agency
Pichat C. AREVA, France
Tombakoglu M. Hacettepe University, Turkey
Yoshioka R. Japan Functional Safety Laboratory, Japan
Consultancy Meetings
Vienna, Austria: 21–23 May 2003, 17–19 March 2004, 18–20 May 2005, 5–7 April 2006.
95