The Daft.ie House Price Report - static.rasset.ie · The Daft.ie House Price Report ... The first...
23
The Daft.ie House Price Report An analysis of recent trends in the Irish residential sales market 2016 Q2 Introduction by Ronan Lyons, Assistant Professor at Trinity College Dublin and author of the Daft Report
Transcript of The Daft.ie House Price Report - static.rasset.ie · The Daft.ie House Price Report ... The first...
The Daft.ie HousePrice ReportAn analysis of recent trends in the Irish residential sales market2016 Q2
Introduction by Ronan Lyons, Assistant Professor at
Trinity College Dublin and author of the Daft Report

Accidental gentrification: the curious case of DublinThis latest Daft.ie House Price Report shows some signs of health in the market, amid a broader problem of a chronic lack of supply.

The first sign of slightly better health is that the total number of properties actively on the market at any one time has risen, compared to three months previously ( June compared to March).
This is only the second time in five years that this
was the case – the first was the same quarter last
year, so it remains to be seen whether this is merely
seasonal or the start of a bigger trend.
The second measure of slightly improved
conditions in the housing market comes from a
comparison of the asking and sale prices. Each
property registered as sold on the Property
Price Register is, where possible, matched up
with a listing in the Daft.ie archives. This allows
the inclusion of variables such as property type
and size and also enables the calculation of the
Transaction Price Index in the report. The trends
in this index confirm the more precisely estimated
trends in list prices in the 54 markets around the
country: largely stable prices in Dublin but still
increasing steadily elsewhere, albeit not as fast.
But this matching exercise also allows a comparison
of the initial listed price and the ultimate
transaction price. Where list prices are well above
the ultimate transaction prices, this clearly points
to a falling market – and this was indeed the case
from 2010 on to 2013 in Dublin and into 2014 or
2015 elsewhere. During 2014, however, transaction
prices in Dublin were typically more than 5% above
the initial listed price, highlighting the opposite
problem: a market where buyers have too little
choice and push up prices.
Currently, though, across the country as a whole,
there is only a 1.5% gap between the ultimate
transaction price and the property’s initial list price.
Coupled with a similar picture last quarter, this
represents the closest to healthy the market has
been since the start of the decade.
The third indicator of greater health is another
quarter where Dublin prices show very muted
house price growth. In a healthy housing market,
house prices will increase at roughly the same rate
as general inflation. In Ireland over the past decade,
general inflation has effectively been close to zero,
but house prices fell first by 55% before rising by
more than 40% in Dublin. Thus, policymakers and
others will welcome the fourth consecutive quarter
where the annual change in Dublin prices is less
than 3%. Indeed, the rate of inflation in Dublin
house price now is just 1.1%, the lowest since prices
started to rise nearly four years ago.
It is no coincidence that the rate of house price
inflation in Dublin fell from 25% to just 1% the time
the Central Bank brought in its macroprudential
measures, including minimum deposit
requirements and loan-to-income restrictions.
However, while the primary effect of these rules has
Ronan Lyons, Assistant Professorin Economics, TCD
The Daft.ie House Price Report – 2016 Q2 | 2

been to anchor house prices to real incomes – and
this is very much a move in the right direction –
there have been secondary effects also.
Perhaps the main secondary effect has been
to reshuffle demand from high-cost locations –
typically with sought-after amenities such as being
near good secondary schools or the coastline
– to lower-cost locations that still meet the basic
criteria of access to work. While much of this effect
has been to push buyers out of Dublin into its
commuter counties, there have been important
effects within Dublin also.
Annual change in prices, by Dublin postcode (from cheapest to most expensive)
The figure above shows the annual change in
average house prices by Dublin postcode. The 25
districts within Dublin are ranked from left to right
by how expensive a home is. What is clear is the
different trend emerging between the cheapest
and dearest areas. The strongest price growth is
being seen currently in previously unfashionable
postcodes – the market’s judgement not mine! –
such as Dublin 10 (Ballyfermot), Dublin 12 (Crumlin
and Walkinstown), Dublin 17 (Balgriffin) and Dublin
24 (Firhouse and Tallaght). At the other end of the
spectrum, five of the most expensive areas of the
city are seeing prices fall: Dublin 2, Dublin 6, Dublin
16, Dublin 18 and South County Dublin.
The link between incomes and house prices has
forced people to reconsider some of their implicit
assumptions about where to look when buying a
home – leading to what might be termed ‘accidental
gentrification’. This will undoubtedly have some
positive effects, not least if affluent Dubliners
become more familiar with the city they live in and
some of their purchasing power refreshes some
Dublin suburbs.
But there are clear risks also. Primary among
them is that lower-income households become
priced out of the entire city within the M50. When
it comes to housing, the Central Bank’s only real
responsibility is the financial stability of the system
as a whole. It has no remit to increase supply. But
without the rest of the policy system responding –
through for example relaxing land use restrictions
and lowering construction costs – the Central
Bank rules could combine with prohibitive site and
construction costs to make Dublin into an enclave
for the rich.
3 | The Daft.ie House Price Report – 2016 Q2
-6.0%
-2.0%
0%
4.0%
6.0%
8.0%
-4.0%
Dublin10 Dublin11 North Dublin Dublin 8
2.0%
Dublin3 Dublin 2 Dublin 6

Market SurveyEach quarter, Daft.ie surveys over 1,000 property market participants, asking them about their sense of the market as a whole, and their own intentions. Below are some of the headline results.
Continued fall in perceived value
The fraction of survey respondents believing current prices represent good value has fallen to a new low nationwide, with just over one in three respondents believing this to be the case.
Good value
Desired house price to income ratio remains stable
The typical prospective house-buyer estimates that their new home will cost slightly 4.5 times their household income in Dublin and just under 4 times elsewhere.
Planned house price-to-income ratio
Expected house price inflation reaches two-year high
The expected change in house prices over the coming 12 months rose to 4% in the second quarter of the year, the highest since the introduction of Central Bank rules.
Expected price change this year
National Dublin Ex-Dublin
Q4 2012 Q4 2013 Q2 2014 Q4 2015
National Dublin Ex-DublinNational Dublin Ex-Dublin
0%
10%
20%
30%
40%
50%
60%
70%
80%
Q4‘15
Q3‘15
Q2‘15
Q1‘15
Q4‘14
Q3‘14
Q2‘14
Q1‘14
Q4‘13
Q4‘12
Q4‘11
Q4‘15
Q3‘15
Q2‘15
Q1‘15
Q4‘14
Q3‘14
Q2‘14
Q1‘14
-15%
-5%
0%
5%
10%
15%
-10%
Q4‘13
Q4‘12
Q4‘11
10%
0%
20%
30%
40%
50%
60%
70%
Q1‘16
Q1‘16
Q1 2016
National Dublin Ex-Dublin
3.0
3.5
4.0
4.5
5.0
Q42015
Q32015
Q22015
Q12015
Q12014
Q12013
Q12012
Q12016
Q2‘16
Q2‘16
Q22016
National Dublin Ex-Dublin
Q4 2012 Q4 2013 Q2 2014 Q4 2015
National Dublin Ex-DublinNational Dublin Ex-Dublin
0%
10%
20%
30%
40%
50%
60%
70%
80%
Q4‘15
Q3‘15
Q2‘15
Q1‘15
Q4‘14
Q3‘14
Q2‘14
Q1‘14
Q4‘13
Q4‘12
Q4‘11
Q4‘15
Q3‘15
Q2‘15
Q1‘15
Q4‘14
Q3‘14
Q2‘14
Q1‘14
-15%
-5%
0%
5%
10%
15%
-10%
Q4‘13
Q4‘12
Q4‘11
10%
0%
20%
30%
40%
50%
60%
70%
Q1‘16
Q1‘16
Q1 2016
National Dublin Ex-Dublin
3.0
3.5
4.0
4.5
5.0
Q42015
Q32015
Q22015
Q12015
Q12014
Q12013
Q12012
Q12016
Q2‘16
Q2‘16
Q22016
The Daft.ie House Price Report – 2016 Q2 | 4

Cork City€234,585 | 11.2%
Limerick City€153,892 | 15.2%
Galway City€236,853 | 14.0%
Waterford City€138,771 | 17.4%
NationwideAverage asking prices and Y-on-Y change
DublinAverage asking prices and Y-on-Y change
North County€268,361 | 1.5%
South County€517,719 | -1.6%
West County€270,881 | 1.0%
South City€346,794 | 1.0%
City Centre€253,520 | 1.7%
North City€286,257 | 2.2%
MN€145,2679.4%
CN€137,70216.4%
WH€159,03613.4%
LD€104,2927.4%
LH€179,67912.5%
MH€222,21510.9%
KE€226,2549.0%
WW€283,1024.1%
WX€171,50510.4%
CW€149,6485.6%
KK€187,69613.5%
LS€147,01611.6%
OY€150,6986.6%
G€167,96513.3%
MO€136,13711.6%
SO€117,6884.2%
DL€138,30611.5%
RN€121,48813.5%
LM€118,59020.3%
CE€151,1499.2%
T€149,3535.1%
L€152,5316.2%
C€185,57112.0%
KY€168,8828.7%
W€182,8996.2%
5 | The Daft.ie House Price Report – 2016 Q2

Cork City€234,585 | 11.2%
Limerick City€153,892 | 15.2%
Galway City€236,853 | 14.0%
Waterford City€138,771 | 17.4%
NationwideAverage asking prices and Y-on-Y change
DublinAverage asking prices and Y-on-Y change
North County€268,361 | 1.5%
South County€517,719 | -1.6%
West County€270,881 | 1.0%
South City€346,794 | 1.0%
City Centre€253,520 | 1.7%
North City€286,257 | 2.2%
MN€145,2679.4%
CN€137,70216.4%
WH€159,03613.4%
LD€104,2927.4%
LH€179,67912.5%
MH€222,21510.9%
KE€226,2549.0%
WW€283,1024.1%
WX€171,50510.4%
CW€149,6485.6%
KK€187,69613.5%
LS€147,01611.6%
OY€150,6986.6%
G€167,96513.3%
MO€136,13711.6%
SO€117,6884.2%
DL€138,30611.5%
RN€121,48813.5%
LM€118,59020.3%
CE€151,1499.2%
T€149,3535.1%
L€152,5316.2%
C€185,57112.0%
KY€168,8828.7%
W€182,8996.2% Prices up 31% from their lowest point
Nationally, the average asking price reached its lowest point
in the third quarter of 2013 and has risen 30.9% - or just over
€50,700 - since then. In Dublin, however, the bottom was
reached in the second quarter of 2012 and prices have risen
by an average of 42.6% - or €94,000 - since that time. The last
part of the country to see prices level off was Limerick - in
both Limerick city and county, prices only reached their lowest
point in the final quarter of 2014 but prices have risen by 30%
in the city (and by 16% in the county) in the intervening period.
The Daft.ie House Price Report – 2016 Q2 | 6

2.2%Quarter-on-quarter change in average asking prices
Daft.ie Asking Price Index
2006 2007 2008 2009 2010 2011 2012 2013 2014 2015 2016
January 185.3 213.8 212.9 184.5 151.6 128.2 105.6 96.8 99.9 112.8 121.9
February 200.2 215.8 212.3 180.9 150.3 128.1 104.5 96.1 99.3 117.6 112.8
March 198.1 214.8 209.6 177.4 146.7 125.3 102.9 96.6 103.3 119.1 125.4
April 203.2 216.5 208.1 174.7 146.6 121.8 101.7 96.6 104.5 118.7 126.0
May 205.3 217.5 205.7 171.0 145.0 120.1 102.2 97.0 107.2 119.4 127.8
June 207.1 217.1 203.4 167.7 141.8 116.1 99.5 97.5 107.9 118.2
July 209.3 219.2 202.3 165.1 138.0 115.4 97.8 96.5 109.9 120.3
August 210.4 217.5 199.6 161.2 137.6 113.1 98.9 97.0 111.2 120.4
September 213.8 215.8 198.1 159.2 136.5 113.3 97.1 96.7 112.9 121.5
October 214.7 214.8 193.7 156.4 134.0 108.7 97.9 97.2 110.5 120.6
November 212.8 212.4 188.2 152.3 130.9 106.0 95.8 96.9 110.0 119.5
December 214.9 213.5 186.3 150.9 129.8 106.0 96.0 96.2 111.1 119.8
Quarter-on-quarter change in average asking prices(2012 average = 100)
7 | The Daft.ie House Price Report – 2016 Q2

Annual inflation in list prices increases to 6.3%The annual increase in average house prices currently stands at 6.3%, compared to 8.5% six months ago and 15.5% at the start of 2015.
Dublin house prices continue stable path
Having peaked at 24.5% in late 2014, annual inflation in Dublin house prices is now just 1.1%.
Speed of sales continues to improve
63% of properties find a buyer within four months, a slight rise on the same figure a year ago (59%) and the highest since the series started in 2012.
Stock of properties on Daft.ie(start of month) and flow of properties, 2007-2016
Stock (lhs) Inflow (rhs) Outflow (rhs)
0
2000
4000
6000
8000
10000
12000
14000
2009 2010 2011 2012 2013 2014 2015 2016 2008 2007
0
10000
20000
30000
40000
50000
60000
70000
Stock of properties on the market rallies slightly in Q2
There were just over 25,000 properties available for sale in June, slightly above the figure three months previously but still one of the lowest totals in 9 years.
The Daft.ie House Price Report – 2016 Q2 | 8
The Daft.ie Asking Price Index is based on asking prices for properties posted for sale on Daft.ie. An index based on asking price, as opposed to closing price, is a measure of sellers’ expectations. Figures are calculated from econometric regressions, which calculate changes in price that are independent of changes in observable measures of quality, such as location, or bedroom number.

1.4%Daft.ie Transaction Price Index
2010 2011 2012 2013 2014 2015 2016
January 151.8 132.0 100.0 92.8 104.7 120.0 135.6
February 145.5 127.8 99.9 94.3 100.1 125.0 129.4
March 145.0 120.9 102.5 95.3 103.2 120.6 131.1
April 146.2 122.0 102.3 97.9 107.4 123.0 134.1
May 137.9 117.0 98.3 98.1 110.1 128.5 131.9
June 142.6 115.8 97.4 100.1 111.4 130.8 135.7
July 139.1 119.6 101.8 101.1 113.4 128.6
August 138.1 114.0 99.5 101.5 119.1 132.0
September 133.6 111.9 101.7 100.2 119.2 123.6
October 130.2 108.0 98.0 103.5 120.8 133.9
November 134.4 108.4 98.0 104.3 121.2 129.2
December 133.9 108.3 100.6 106.5 118.1 130.8
Transaction Prices, Residential Sales(2012 average = 100)
9 | The Daft.ie House Price Report – 2016 Q2
Quarter-on-quarter change in average transaction prices (provisional)

Dublin inflation slows to 1% year-on-yearUsing transaction prices, the rate of inflation in Dublin house prices has slowed from more than 20% in early 2015 to just 1% in mid-2016.
Outside Dublin, inflation also eases back
House price inflation outside Dublin has fallen from more than 20% in mid-2015 to 8% a year later..
10% fall in transaction volumes
For the second quarter in a row, the total number of transactions nationwide was roughly 10% lower than a year previously: just over 9,600 in 2016Q1 compared to just over 10,600 a year previously.
Transaction prices on average 1.5% above list prices countrywide
Compared to the initial list price, final transaction prices are higher - ranging from less than 1% higher in Leinster and Munster (outside the cities) to 4% in the cities outside Dublin.
Number of transactions recorded on the price register 2010-2016
Q2‘10
Q3‘10
Q4‘10
Q12011
Q2‘11
Q3‘11
Q4‘11
Q12012
Q2‘12
Q3‘12
Q4‘12
Q12013
Q2‘13
Q3‘13
Q4‘13
Q12014
Q2‘14
Q3‘14
Q4‘14
Q12015
Q2‘15
Q3‘15
Q4‘15
0
2000
4000
6000
8000
10000
12000
14000
16000
Q12010
Q12016
Q2‘16
The Daft.ie House Price Report – 2016 Q2 | 10
The Daft.ie Price Register Index is based on prices for residential properties recorded on propertypriceregister.ie, for which matches were found in the daft.ie archives. Because these are entered with a lag by solicitors, figures for previous quarters are subject to revision. Figures are calculated from econometric regressions, which calculate changes in price that are independent of changes in observable measures of quality, such as location, type, or size.
* Latest quarter subject to significant revision

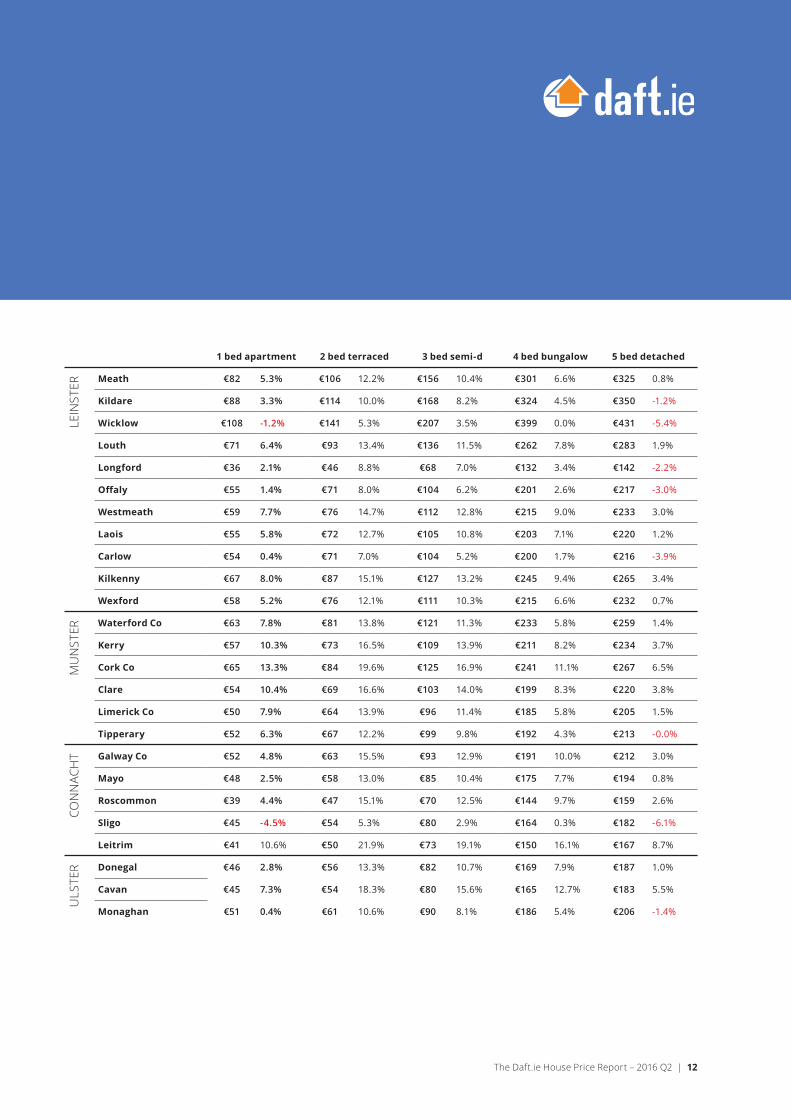
Asking prices nationwideAverage asking prices across Ireland (€000s), and annual change (%), 2016 Q2
11 | The Daft.ie House Price Report – 2016 Q2
OTH
ER C
ITIE
S
1 bed apartment 2 bed terraced 3 bed semi-d 4 bed bungalow 5 bed detached
Dublin 1 €174 9.2% €257 2.2% €354 0.9% €519 2.8% €661 5.4%
Dublin 2 €232 -12.5% €317 -6.4% €459 -1.7% €677 -2.9% €773 -8.3%
Dublin 3 €212 2.5% €292 0.8% €404 -1.5% €649 -0.7% €788 -2.1%
Dublin 4 €280 -7.8% €404 0.7% €597 1.2% €982 1.7% €1,207 1.3%
Dublin 5 €162 -3.7% €217 0.1% €320 -1.2% €516 0.9% €598 -5.3%
Dublin 6 €266 -9.6% €356 -6.1% €526 -7.3% €848 -5.4% €984 -11.1%
Dublin 6W €222 -2.3% €298 1.5% €440 0.2% €709 2.3% €823 -3.9%
Dublin 7 €165 -2.8% €221 1.0% €326 -0.3% €526 1.8% €610 -4.4%
Dublin 8 €169 -3.2% €226 0.5% €334 -0.7% €539 1.3% €625 -4.8%
Dublin 9 €168 -1.3% €226 2.6% €334 1.3% €538 3.4% €624 -2.9%
Dublin 10 €105 -0.5% €140 3.3% €207 2.0% €334 4.2% €387 -2.2%
Dublin 11 €126 1.5% €169 5.4% €249 4.1% €402 6.2% €466 -0.2%
Dublin 12 €143 -1.1% €192 2.7% €284 1.4% €457 3.6% €531 -2.7%
Dublin 13 €172 -3.0% €230 0.7% €340 -0.6% €547 1.5% €635 -4.7%
Dublin 14 €213 -3.0% €286 0.8% €423 -0.5% €681 1.6% €790 -4.6%
Dublin 15 €130 -3.8% €174 -0.1% €258 -1.4% €415 0.7% €482 -5.4%
Dublin 16 €185 -9.0% €248 -5.4% €366 -6.6% €591 -4.7% €686 -10.5%
Dublin 17 €115 -1.9% €154 1.9% €227 0.6% €366 2.7% €424 -3.5%
Dublin 18 €210 -7.5% €282 -3.9% €417 -5.2% €672 -3.2% €779 -9.1%
Dublin 20 €152 -1.2% €203 2.7% €300 1.4% €484 3.5% €561 -2.8%
Dublin 22 €108 -0.3% €145 3.6% €214 2.2% €346 4.4% €401 -2.0%
Dublin 24 €116 0.4% €156 4.3% €230 3.0% €371 5.1% €430 -1.3%
North Co Dublin €133 -3.6% €178 0.2% €263 -1.1% €424 1.0% €492 -5.2%
South Co Dublin €248 -6.4% €332 -2.8% €490 -4.0% €790 -2.0% €917 -7.9%
West Dublin €131 -3.8% €176 -0.0% €260 -1.3% €419 0.8% €487 -5.4%
Cork City €94 7.9% €125 19.7% €206 16.7% €358 18.2% €426 7.7%
Galway City €88 11.8% €117 24.0% €192 20.8% €335 22.3% €399 11.6%
Limerick City €65 12.3% €86 24.5% €141 21.4% €245 22.9% €292 12.1%
Waterford City €56 13.9% €74 26.3% €121 23.1% €211 24.6% €251 13.7%
DU
BLIN
Asking prices nationwideAverage asking prices across Ireland (€000s), and annual change (%), 2016 Q2
The Daft.ie House Price Report – 2016 Q2 | 12
LEIN
STER
MU
NST
ERCO
NN
ACH
TU
LSTE
R
1 bed apartment 2 bed terraced 3 bed semi-d 4 bed bungalow 5 bed detached
Meath €82 5.3% €106 12.2% €156 10.4% €301 6.6% €325 0.8%
Kildare €88 3.3% €114 10.0% €168 8.2% €324 4.5% €350 -1.2%
Wicklow €108 -1.2% €141 5.3% €207 3.5% €399 0.0% €431 -5.4%
Louth €71 6.4% €93 13.4% €136 11.5% €262 7.8% €283 1.9%
Longford €36 2.1% €46 8.8% €68 7.0% €132 3.4% €142 -2.2%
Offaly €55 1.4% €71 8.0% €104 6.2% €201 2.6% €217 -3.0%
Westmeath €59 7.7% €76 14.7% €112 12.8% €215 9.0% €233 3.0%
Laois €55 5.8% €72 12.7% €105 10.8% €203 7.1% €220 1.2%
Carlow €54 0.4% €71 7.0% €104 5.2% €200 1.7% €216 -3.9%
Kilkenny €67 8.0% €87 15.1% €127 13.2% €245 9.4% €265 3.4%
Wexford €58 5.2% €76 12.1% €111 10.3% €215 6.6% €232 0.7%
Waterford Co €63 7.8% €81 13.8% €121 11.3% €233 5.8% €259 1.4%
Kerry €57 10.3% €73 16.5% €109 13.9% €211 8.2% €234 3.7%
Cork Co €65 13.3% €84 19.6% €125 16.9% €241 11.1% €267 6.5%
Clare €54 10.4% €69 16.6% €103 14.0% €199 8.3% €220 3.8%
Limerick Co €50 7.9% €64 13.9% €96 11.4% €185 5.8% €205 1.5%
Tipperary €52 6.3% €67 12.2% €99 9.8% €192 4.3% €213 -0.0%
Galway Co €52 4.8% €63 15.5% €93 12.9% €191 10.0% €212 3.0%
Mayo €48 2.5% €58 13.0% €85 10.4% €175 7.7% €194 0.8%
Roscommon €39 4.4% €47 15.1% €70 12.5% €144 9.7% €159 2.6%
Sligo €45 -4.5% €54 5.3% €80 2.9% €164 0.3% €182 -6.1%
Leitrim €41 10.6% €50 21.9% €73 19.1% €150 16.1% €167 8.7%
Donegal €46 2.8% €56 13.3% €82 10.7% €169 7.9% €187 1.0%
Cavan €45 7.3% €54 18.3% €80 15.6% €165 12.7% €183 5.5%
Monaghan €51 0.4% €61 10.6% €90 8.1% €186 5.4% €206 -1.4%
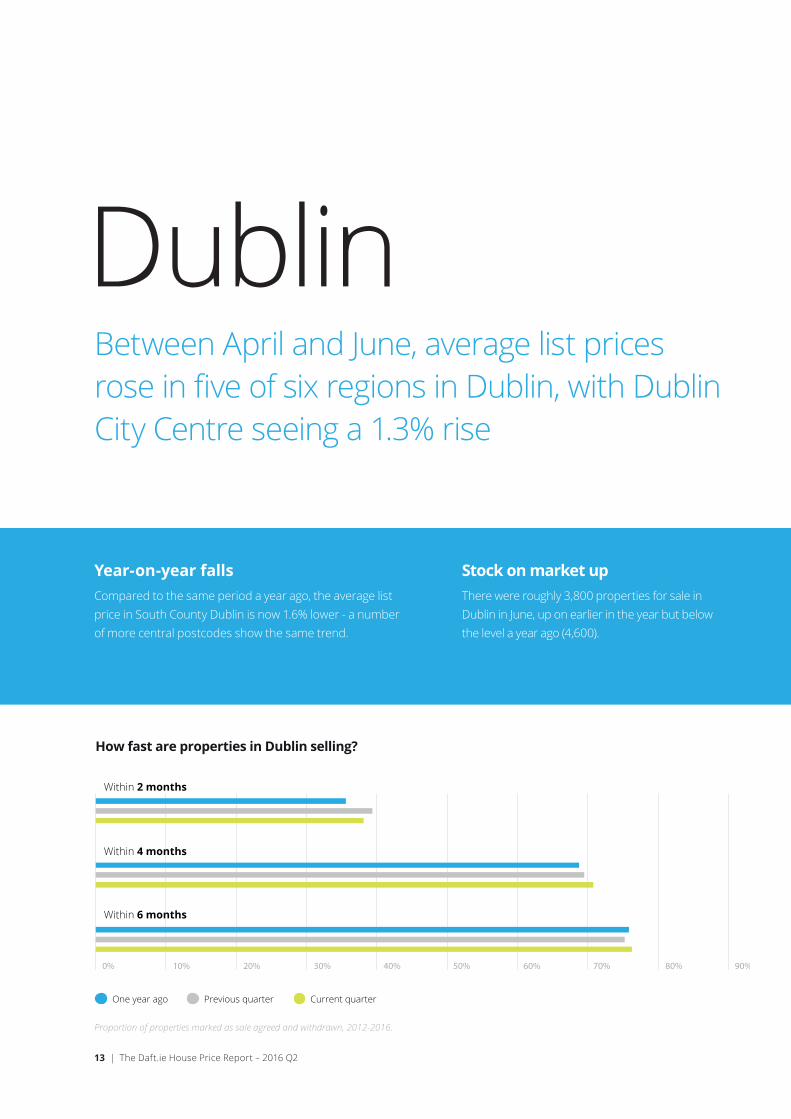
DublinBetween April and June, average list prices rose in five of six regions in Dublin, with Dublin City Centre seeing a 1.3% rise
One year ago Previous quarter Current quarter
Proportion of properties marked as sale agreed and withdrawn, 2012-2016.
0% 10% 20% 30% 40% 50% 60% 70% 80% 90%
Within 6 months
Within 4 months
Within 2 months
How fast are properties in Dublin selling?
13 | The Daft.ie House Price Report – 2016 Q2
Stock on market upThere were roughly 3,800 properties for sale in Dublin in June, up on earlier in the year but below the level a year ago (4,600).
Year-on-year fallsCompared to the same period a year ago, the average list price in South County Dublin is now 1.6% lower - a number of more central postcodes show the same trend.

North CityAverage price: €286,257Qtr-on-qtr change: 0.9%Year-on-year change: 2.2%Change from trough: 45.2%
City CentreAverage price: €253,520Qtr-on-qtr change: 1.3%Year-on-year change: 1.7%Change from trough: 51.2%
South CityAverage price: €346,794Qtr-on-qtr change: 0.2%Year-on-year change: 1.0%Change from trough: 42.5%
North CountyAverage price: €268,361Qtr-on-qtr change: 0.9%
Year-on-year change: 1.5%Change from trough: 31.7%
West CountyAverage price: €270,881Qtr-on-qtr change: 0.7%
Year-on-year change: 1.0%Change from trough: 45.8%
South CountyAverage price: €517,719
Qtr-on-qtr change: -0.4%Year-on-year change: -1.6%Change from trough: 49.6%
Average house price by area, 2006-2016.
How have house prices changed?
Dublin City Centre North Dublin City South Dublin City North County Dublin South County Dublin West County Dublin
€100,000
€200,000
€300,000
€400,000
€500,000
€600,000
€700,000
€800,000
Q12006
Q12007
Q12008
Q12009
Q12010
Q12011
Q12012
Q12013
Q12014
Q12015
Q12016
Q22016
The Daft.ie House Price Report – 2016 Q2 | 14
Three quarters sell in 4 months73% percent of properties find a buyer within four months in the capital - up on the same period a year ago (67%).
Transaction prices slightly above askThe average transaction price in Dublin is now 1.5% above its original list price, compared to 2.8% above a year ago.

LeinsterSignificant quarterly increases in Leinster prices
One year ago Previous quarter Current quarter
Proportion of properties marked as sale agreed and withdrawn, 2012-2016.
0% 10% 20% 30% 40% 50% 60% 70% 80% 90%
Within 6 months
Within 4 months
Within 2 months
How fast are properties in Leinster selling?
15 | The Daft.ie House Price Report – 2016 Q2
End to tighter supplyThere were nearly 6,000 properties on the market in Leinster outside Dublin in June, slightly up on the total three months previously (5,600).
Variation in trendsWhile prices in Kilkenny and Westmeath are more than 13% higher than a year ago, prices in Wicklow and Carlow are 4% and 6% up.

LouthAverage price: €179,679Qtr-on-qtr change: 5.0%Year-on-year change: 12,5%Change from trough: 40.9%
MeathAverage price: €222,215Qtr-on-qtr change: 5.3%Year-on-year change: 10.9%Change from trough: 48.0%
KildareAverage price: €226,254Qtr-on-qtr change: 4.3%Year-on-year change: 9.0%Change from trough: 44.2%
WicklowAverage price: €283,102Qtr-on-qtr change: 1.8%Year-on-year change: 4.1%Change from trough: 39.3%
WexfordAverage price: €171,505Qtr-on-qtr change: 3.6%Year-on-year change: 10.4%Change from trough: 37.2%
LongfordAverage price: €104292
Qtr-on-qtr change: 3.8%Year-on-year change: 7.4%
Change from trough: 23.8%
WestmeathAverage price: €159,036Qtr-on-qtr change: 5.3%
Year-on-year change: 13.4%Change from trough: 34.7%
OffalyAverage price: €150,698Qtr-on-qtr change: 4.2%
Year-on-year change: 11.6%Change from trough: 41.8%
LaoisAverage price: €149,648Qtr-on-qtr change: 3.8%
Year-on-year change: 5.6%Change from trough: 27.9%
KilkennyAverage price: €187,696Qtr-on-qtr change: 6.0%
Year-on-year change: 13.5%Change from trough: 41.8%
CarlowAverage price: €149,648Qtr-on-qtr change: 3.8%
Year-on-year change: 5.6%From trough: 27.9%
Average house price by area, 2006-2016.
How have house prices changed?
Dublin Commuter Counties West Leinster South-East Leinster
€100,000
€50,000
€150,000
€200,000
€250,000
€300,000
€350,000
€400,000
€450,000
Q12006
Q12007
Q12008
Q12009
Q12010
Q12011
Q12012
Q12013
Q12014
Q12015
Q12016
Q22016
The Daft.ie House Price Report – 2016 Q2 | 16
Three fifths sell in 4 monthsThe fraction of Leinster properties finding a buyer within four months is 58% now, slightly down on levels three and twelve months ago (61%).
Transaction prices match askThe average transaction price in Leinster is in line with (0.1% above) its original list price, compared to 2.1% above a year ago.

MunsterAfter big gains in early 2016, more modest increases in the second quarter
One year ago Previous quarter Current quarter
Proportion of properties marked as sale agreed and withdrawn, 2012-2016
0% 10% 20% 30% 40% 50% 60% 70% 80% 90%
Within 6 months
Within 4 months
Within 2 months
How fast are properties in Munster selling?
17 | The Daft.ie House Price Report – 2016 Q2
Availability improvesThere were 8,700 properties for sale in Munster in June, an increase compared to earlier in the year, which marked the lowest since early 2007.
Cork and Kerry increasesKerry and Cork county saw their second quarter of strong price growth, with substantial increases in Limerick and Waterford cities also.

TipperaryAverage price: €149,353Qtr-on-qtr change: 0.9%Year-on-year change: 5.1%Change from trough: 17.4%
Limerick CityAverage price: €153,892Qtr-on-qtr change: 2.8%Year-on-year change: 15.2%Change from trough: 29.6%
Waterford CountyAverage price: €182,899Qtr-on-qtr change: 0.4%Year-on-year change: 6.2%Change from trough: 27.2%
Waterford CityAverage price: €138,771Qtr-on-qtr change: 3.0%Year-on-year change: 17.4%Change from trough: 23.4%
ClareAverage price: €151,149Qtr-on-qtr change: 0.9%
Year-on-year change: 12.0%Change from trough: 29.6%
Limerick CountyAverage price: €152,531Qtr-on-qtr change: 0.7%
Year-on-year change: 6.2%Change from trough: 15.9%
KerryAverage price: €168,882Qtr-on-qtr change: 2.6%
Year-on-year change: 8.7%Change from trough: 20.3%
Cork CountyAverage price: €185,571Qtr-on-qtr change: 3.3%
Year-on-year change: 12.0%Change from trough: 29.6%
Cork CityAverage price: €234,585Qtr-on-qtr change: 1.1%
Year-on-year change: 11.2%Change from trough: 42.9%
Average house price by area, 2006-2016.
How have house prices changed?
Cork City Limerick City Waterford City Rest-of-Munster
Q12006
Q12007
Q12008
Q12009
Q12010
Q12011
Q12012
Q12013
Q12014
Q12015
Q12016
€50,000
€100,000
€150,000
€200,000
€250,000
€300,000
€350,000
€400,000
Q22016
The Daft.ie House Price Report – 2016 Q2 | 18
Half sell within 4 monthsHalf of all properties in Munster find a buyer within four months, up slightly from 47% both three and twelve months ago.
Prices now above askThe average transaction price in Munster is now 0.6% above the original list price, compared to 0.7% below a year ago.

Connacht/UlsterRapid growth in list prices continues
One year ago Previous quarter Current quarter
Proportion of properties marked as sale agreed and withdrawn, 2012-2016.
0% 10% 20% 30% 40% 50% 60% 70% 80% 90%
Within 6 months
Within 4 months
Within 2 months
How fast are properties in Counnacht/Ulster selling?
19 | The Daft.ie House Price Report – 2016 Q2
Supply levels offThere were nearly 6,900 properties for sale in Connacht and Ulster in June, up from the March figure, which was the lowest on record.
Second quarter of large gainsMayo and Roscommon saw increases of nearly 7% in average list prices between April and June, on top of 5% increases in list prices in the first quarter.

LeitrimAverage price: €118,590Qtr-on-qtr change: 5.5%Year-on-year change: 20.3Change from trough: 38.0%
MonaghanAverage price: €145,267Qtr-on-qtr change: 3.0%Year-on-year change: 9.4%Change from trough: 27.3%
CavanAverage price: €137.702Qtr-on-qtr change: 3.3%Year-on-year change: 16.4%Change from trough: 34.0%
RoscommonAverage price: €121,488Qtr-on-qtr change: 6.9%Year-on-year change: 13.5%Change from trough: 32.6%
DonegalAverage price: €138,306Qtr-on-qtr change: 4.3%
Year-on-year change: 11.5%Change from trough: 21.7%
SligoAverage price: €117,688Qtr-on-qtr change: 3.1%
Year-on-year change: 4.2%Change from trough: 12.0%
MayoAverage price: €135,137Qtr-on-qtr change: 6.8%
Year-on-year change: 11.6%Change from trough: 22.3%
Galway CityAverage price: €236,853Qtr-on-qtr change: 3.9%
Year-on-year change: 14.0%Change from trough: 47.5%
Galway CountyAverage price: €167,965Qtr-on-qtr change: 3.0%
Year-on-year change: 13.3%Change from trough: 32.7%
Average house price by area, 2006-2016.
How have house prices changed?
Galway City Connacht Ulster
€50,000
€100,000
€150,000
€200,000
€250,000
€300,000
€350,000
€400,000
Q12006
Q12007
Q12008
Q12009
Q12010
Q12011
Q12012
Q12013
Q12014
Q12015
Q12016
Q22016
The Daft.ie House Price Report – 2016 Q2 | 20
More than half sell in 4 monthsMore than half (54%) of all properties in Connacht-Ulster find a buyer within four months, up from 42% twelve months ago.
Prices now above askThe average transaction price in Connacht-Ulster is now 3.7% above the original list price, compared to just 0.3% above a year ago.

Over the last number of years, Daft.ie has collected a vast amount of data on the Irish property market. Each year tens of thousands of properties for sale or rent are advertised on the site.About the ReportThe goal of the Daft Report is to use this information to help all actors in the property market make informed decisions about buying and selling. In addition, because it is freely available, the Daft Report can help inform the media, the general public and policymakers about the latest developments in the property market.
This is the Daft.ie House Price Report, the partner to the Daft.ie Rental Report, which will be issued next month. Together, they give house-hunters and investors more information to help them make their decisions. These twin reports mean that Daft is the only objective monitor of trends in both rental and sales markets on a quarterly basis, making the report an essential barometer for anyone with an interest in the Irish property market.
The Daft Report was first launched in 2005. It has already become the definitive barometer of the Irish rental market and is being used by the Central Bank, mortgage institutions, financial analysts and the general public alike. The Daft.ie House Price report is Ireland’s longest-running house price report, combining information from the Daft.ie archives with data from Ireland’s Residential Property Price Register.
Methodology and Sample SizeThe statistics are based on properties advertised on Daft.ie for a given period. The regressions used are hedonic price regressions, accounting for all available and measurable attributes of properties, with a Cooks Distance filter for outliers.
The average monthly sample size for lettings properties is over 10,000. Indices are based on standard methods, holding the mix of characteristics constant, with the annual average of 2012 used as the base.
About Daft.ieDaft.ie is Ireland’s largest property website with over 2.21 million unique users of the site generating over 95 million page & screen views each month.
DisclaimerThe Daft.ie Report is prepared from information that we believe is collated with care, but we do not make any statement as to its accuracy or completeness. We reserve the right to vary our methodology and to edit or discontinue the indices, snapshots or analysis at any time for regulatory or other reasons. Persons seeking to place reliance on any information contained in this report for their own or third party commercial purposes do so at their own risk.
CreditsEconomic Analysis: Ronan LyonsMarketing and Communications: Martin ClancyLayout and Design: Sheila Rodgers, Derek Jones & Dara Gannon
21 | The Daft.ie House Price Report – 2016 Q2

Coming next:
The Daft.ie Rental Report 2016 Q2, in August 2016.The Daft.ie Rental Report will be published in August and will include a review of the performance of Ireland’s rental market as students plan their year ahead, plus all the usual indices, snapshots, trends and rental yield analysis, providing analysts, tenants, landlords, students and the public with the most up-to-date information on Ireland’s rental market.
All data is Copyright © Daft Media Limited. The information contained in this report may onlybe reproduced if the source is clearly credited. Please contact Daft.ie on 01-4218700 for further information.