The Daft.ie Rental Report · 2 | The Daft.ie Rental Report, 2014 Q2 I wish to open this Daft.ie...
12
Introduction by Domhnall McGlacken-Byrne, TCD Students’ Union President The Daft.ie Rental Report An analysis of recent trends in the Irish rental market 2014 Q2
Transcript of The Daft.ie Rental Report · 2 | The Daft.ie Rental Report, 2014 Q2 I wish to open this Daft.ie...

Introduction by Domhnall McGlacken-Byrne, TCD Students’ Union President
The Daft.ie Rental ReportAn analysis of recent trends in the Irish rental market
2014 Q2

Introductionby Domhnall McGlacken-Byrne, TCD Students’ Union President
An Analysis of Recent Trends in the Irish Rental Market
2 | The Daft.ie Rental Report, 2014 Q2
I wish to open this Daft.ie Quarterly Rental Report with a disclaimer: I am not an economist. I am a student. (I don’t even study economics.) That said, even the most complicated facets and recent trends of the Irish rental market can be crystallised into a few simple facts – facts whose consequences for the beleaguered occupants of the lowest rungs of the Irish rental ladder are very simple indeed: there is not nearly enough accommodation to house the growing number of students who will spend the coming weeks looking for a place to live in Dublin and our other cities.
As building regulations and planning costs grow, profit margins in the sector have fallen, impinging the appetite of lenders to lend and of investors to invest. Fewer homes are then built. Most simply of all: with demand going up, while supply is at best static, average rents have shot up with demand. Inevitably, panic grows among those scrambling for a home, serving to boost rent prices further.
My own baptism as incoming President of Trinity College Dublin Students’ Union has been focused on the development of TCDSU’s Accommodation Advisory Service. As such, the real-life influences of the top-down economic trends outlined in these pages are felt very keenly indeed by those who avail of our service and others like it. As such, I will frame these remarks around the three commonest ‘types’ of student who will pass through our doors in the greatest numbers over the coming weeks.
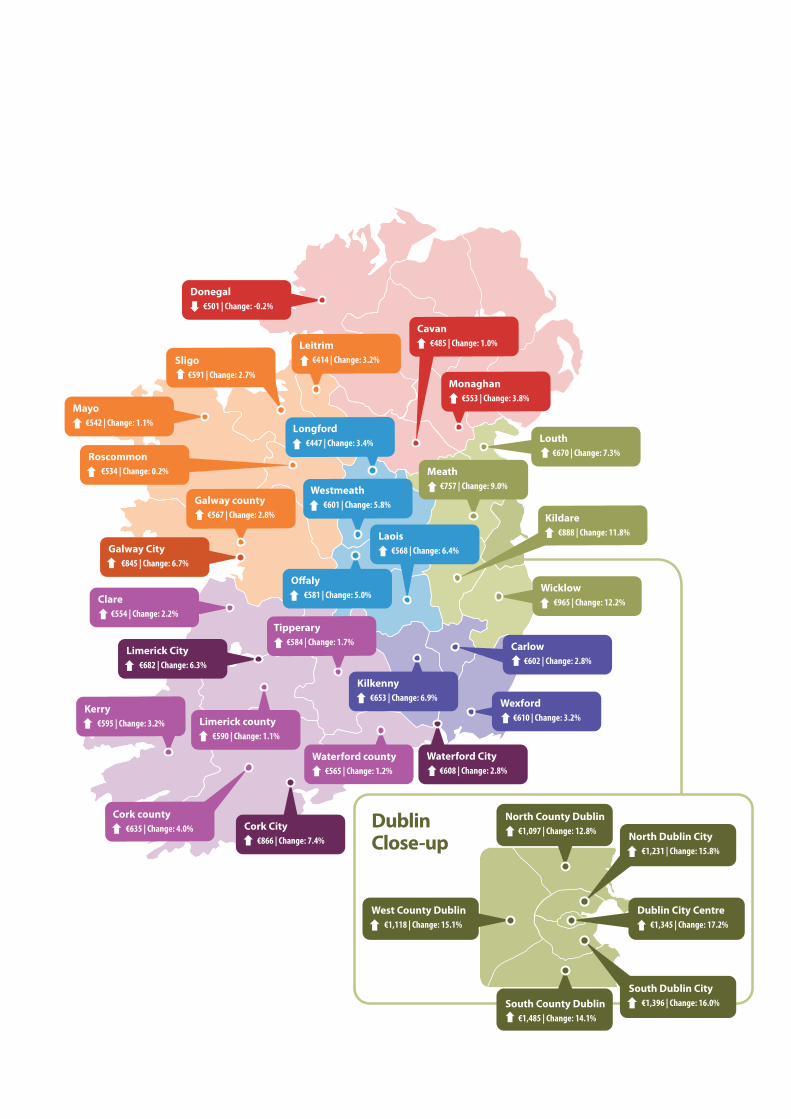
Firstly, let us consider the lot of the thousands of soon-to-be first-year students, for whom recent Leaving Cert results have necessitated a move to higher education institutions: average rent across Ireland has increased from €825 to €915 for a given property over the past year – or close to 11%, the steepest jump since 2007. This trend is most acute in the capital, where prices have jumped over the 15% in the last year alone. In the city centre, year-on-year rent increase stands at 17.2%.
Secondly, there is a student profile currently growing in number (and financial importance), contributing further to the demand-supply mismatch: students incoming from overseas. This added influx is contrasted by a fall in the absolute number of available properties in Ireland: just 6,800 are on the market as of August 2014, a 40% decline in one year. Unsurprisingly, students are being driven further afield in their search for a home: rents in Dublin’s commuter counties are over 10% greater than this time last year. Superimposed on growing rents, of course, is growing amounts of money and time lost trundling to and fro on a bus or train.
(Needless to say, such inconvenience is not likely to enforce a fee-paying student’s sense of value for money. Non-EU students might well choose to pursue their studies elsewhere – and take their ‘revenue generation’ with them.)
Continued on next page >
Domhnall McGlacken-Byrne, a twenty-one-year-old third-year medical student from Bray, is one of three candidates for the role of President of the Students’ Union this year. Currently the Health Sciences Faculty Convenor, McGlacken-Byrne has also served as Deputy Faculty Convenor and as a class rep. for two years.

This incoming cohort, who it is hoped will generate the revenue that will keep Ireland’s largest educational institutions afloat, lack the knowhow of their home-grown counterparts. This renders them much more susceptible to the exploitation and fraud that eagerly proliferate in a climate of uncertainty. Now more than ever, any prospective tenant must do his or her research and absolutely must be aware of basic tenants’ rights (avoiding cash payments is a good place to start!).
Thirdly and finally, there are the thousands of students across Ireland who depend on a government maintenance grant to attend college at all.
While the last year’s price hikes are certainly steep, Dublin city centre rents currently stand at a drastic 28% increase greater than this time three years ago. A city centre property costing its occupants €1048 each month during the 2011 trough can now be expected to fetch €1345, only 9% less than 2007’s peak rents. In the period since 2011, Dublin County as a whole exhibits a consistent 26% increase, affecting students across TCD, UCD, DIT and Dublin’s many smaller higher education institutions.
Meanwhile, the maintenance grant has stayed static or dwindled: the standard nonadjacent allocation for 2010/2011 stood at €3250 and has since been pared down to just €3025, a contraction of about 7%1. Crucially, in a context of spiralling rents and living costs, these bursaries are devaluated further in real cash terms. This superficially economic issue acquires a deeper urgency.
These abstract figures are easiest considered in the context of their translation to students’ lives. A 15% increase for the student formerly paying €500 a month for his or her share of a Dublin city centre home corresponds to €75 that must be conjured from somewhere: for example through a few extra evenings a week spent working a part-time job instead of studying. To think further downstream again, well-publicised doubts cast on the supposedly diminishing quality of the Irish graduate, by job-generating multinationals such as Google, come to mind: hours spent commuting or working on the side are hours lost from the library and lost from the lab. How can grades be expected not to decline, mental well-being not to suffer, all-important retention rates not to be damaged? One ultimately sees the far-reaching ramifications of these economic developments on the quality of the product of our higher education system, a product on which collective hopes for economic recovery are pinned.
While colleges’ accommodation offices and students’ unions will endeavour to alleviate some of the forthcoming pressure, inherently short-term fixes will at best defer a chronic problem. Stimulatory reform of the building regulatory environment appears to be needed. (As for the student market specifically, it is telling that in the government’s recently-published 70-page Construction Strategy 2020, the word ‘student’ is mentioned once in total.2)
In conclusion, the current state of the Irish rental market, coupled with preliminary indicators of the weeks to come, is a source of alarm for any prospective city tenant. The overview these remarks have sought to provide is provided from a perspective of grave concern at the unforeseen consequences of this accommodation shortage on our higher education system and by extension on our economy in general.
Introduction (cont’d)by Domhnall McGlacken-Byrne, TCD Students’ Union President
An Analysis of Recent Trends in the Irish Rental Market
3 | The Daft.ie Rental Report, 2014 Q2
1 http://www.studentfinance.ie/mp9552/grant-levels/index.html 2 Construction 2020: A Strategy for a Renewed Sector (May 2014)
Galway county €567 | Change: 2.8%
Sligo €591 | Change: 2.7%
Kerry €595 | Change: 3.2%
Cork county €635 | Change: 4.0%
Waterford county €565 | Change: 1.2%
Meath €757 | Change: 9.0%
Cork City €866 | Change: 7.4%
Laois €568 | Change: 6.4%
O�aly €581 | Change: 5.0%
Limerick county €590 | Change: 1.1%
Kilkenny €653 | Change: 6.9%
Waterford City €608 | Change: 2.8%
Galway City €845 | Change: 6.7%
Mayo €542 | Change: 1.1%
Donegal €501 | Change: -0.2%
Roscommon €534 | Change: 0.2%
Limerick City €682 | Change: 6.3%
Clare €554 | Change: 2.2%
Wicklow €965 | Change: 12.2%
Louth €670 | Change: 7.3%
Dublin City Centre €1,345 | Change: 17.2%
West County Dublin €1,118 | Change: 15.1%
North County Dublin €1,097 | Change: 12.8%
DublinClose-up North Dublin City
€1,231 | Change: 15.8%
South Dublin City €1,396 | Change: 16.0%
Wexford €610 | Change: 3.2%
Carlow €602 | Change: 2.8%
Kildare €888 | Change: 11.8%
Westmeath €601 | Change: 5.8%
Leitrim €414 | Change: 3.2%
Monaghan €553 | Change: 3.8%
Cavan €485 | Change: 1.0%
Longford €447 | Change: 3.4%
Tipperary €584 | Change: 1.7%
South County Dublin €1,485 | Change: 14.1%
!"#$%&'(%)*'(+&),+ -./012 ..32456,)7'!"#$%&'(%)* -./.1. .238496")7'!"#$%&'(%)* -./:22 .03.456,)7'(63'!"#$%& -./2:: 83:496")7'(63'!"#$%& -./:8; ..3;4<+=)'!"#$%& -./2:8 83>4(6,?'(%)* ->:. 1304@A$BA*'(%)* ->.1 1314C%D+,%E?'(%)* -;;. :3;4<A)+,F6,G'(%)* -H81 I23;4J+A)7 -K.K 13>4L%$GA,+ ->:2 K3.4<%E?$6B -820 K324C6")7 -;1. :384C6&MF6,G -1:K .3;4NFFA$* -H;: 03.4<+=)D+A)7 -H>: :3:4CA6%= -H1H :304(A,$6B -H8H 23.4L%$?+&&* -;0> :3K4<+OF6,G -H8> .3>4<A)+,F6,G'E6"&)* -HH: I.3:4L+,,* -H>. 0324(6,?'E6"&)* -;.1 2384($A,+ -H10 2324C%D+,%E?'E6"&)* -H>. I23>4P%QQ+,A,* -HKH .324@A$BA*'E6"&)* -H11 I.314JA*6 -H:0 I23:4R6=E6DD6& -H0> I23149$%M6 -HK> .3K4C+%),%D -12H 03K4!6&+MA$ -18> I.324(ASA& -1KK I2314J6&AM7A& -H1H :384

Average rent up €90 in a year The average rent nationwide rose by just under €90 between the second quarter of 2013 and the same period in 2014, the largest rise since early 2007.
Rents in Dublin up more than 15% year-on-yearAnnual inflation in Dublin rents was 15.6% in mid-2014, compared to 7.5% in mid-2013.
Stock on the market still very low There were 6,800 properties on the market in August 2014, almost 40% lower than a year previously.
-15.5
Daft.ie National Rental Index
10.8%Rents nationally were 10.8% higher on average in the second quarter of 2014 than a year previously. The average rent nationwide between April and June was €915, compared to €825 a year previously.
5 | The Daft.ie Rental Report, 2014 Q2
Daft.ie National Rental Index(2012 average = 100)
JanuaryFebruaryMarchAprilMayJuneJulyAugustSeptemberOctoberNovemberDecember
2002133.5132.8128.5131.2128.5125.8124.6125.4124.4121.5118.3115.9
2007129.1130.6132.4132.8134.5135.1135.5133.8134.3134.0128.0128.1
2008128.9126.3124.9124.3126.2125.0124.8127.2126.4123.6120.4117.3
116.3119.4119.5120.4116.3114.8115.1116.3115.8113.2110.7110.2
2003110.3111.1110.6111.3109.5109.3111.1113.4114.1113.7111.7111.5
2004112.7114.2115.3115.4113.6112.8114.3116.2116.0117.3117.2118.9
2005119.1119.5120.0121.2121.9122.4123.5126.6128.4129.1127.3127.1
2006 2010101.8101.3101.2100.5100.6
99.999.8
100.9100.5100.1
98.798.4
2009117.1114.6112.2110.2108.7107.1105.7105.8104.7103.2101.3100.3
201199.499.899.599.499.198.899.3
100.399.699.198.598.9
201299.299.499.399.199.099.099.9
100.8101.0100.9101.3100.9
2013101.5101.7102.6102.6103.6103.6103.7105.9106.6107.4108.5108.8
2014109.6111.0112.6113.8114.3115.2115.5
Stock of Properties to Rent (start-of-month) & Flow of New Properties to Rent (during entire month), 2006-2014
Nu
mb
er o
f Pro
per
ties
Stock Out FlowInflow
0
5000
10000
15000
20000
25000
2006 II III IV 2007 II III IV 2008 II III IV 2009 II III IV 2010 II III IV 2011 II III IV 2012 II III IV 2013 II III IV 2014 II
The index is based on asking rents for properties advertised to let on Daft.ie. Figures are calculated from econometric regressions, which calculate changes in price that are independent of changes in observable measures of quality, such as location, or bedroom number.

6 | The Daft.ie Rental Report, 2014 Q2
Daft.ie Snapshot of RentNationwideWhat can I ask for? Can I afford it?Average rents across Ireland, by postcode/region and bedroom number, Quarter 2, 2014 and % change on same period last year, where possible.
Daft.ie Snapshot of Rents Nationwide - with a focus on college areas
Dublin
Other regions
Collegetowns
1-Bed 2-Bed 3-Bed 4-Bed 5-BedSingle RoomRent
€452
€492
€380
€493
€341
€417
€373
€395
€417
€377
€361
€359
€364
€380
€406
€312
€377
€413
€320
€339
€329
€305
€427
€319
€277
€275
€231
€245
€304
€230
€274
€217
€230
€197
€314
€246
€233
€309
€201
€177
€219
€177
% Change
11%
-3%
12%
13%
14%
10%
15%
14%
12%
13%
-2%
20%
11%
26%
11%
12%
13%
12%
2%
13%
8%
-1%
11%
11%
4%
3%
4%
3%
10%
7%
6%
0%
12%
0%
12%
-5%
12%
5%
-13%
-8%
-1%
2%
Double RoomRent
€556
€646
€477
€608
€428
€523
€487
€479
€526
€457
€390
€434
€462
€462
€519
€437
€497
€528
€447
€416
€421
€433
€519
€434
€345
€333
€268
€308
€353
€255
€301
€256
€264
€243
€387
€306
€256
€310
€260
€247
€265
€231
% Change
9%
11%
7%
10%
6%
6%
10%
11%
12%
10%
4%
13%
16%
4%
11%
13%
8%
10%
9%
12%
6%
14%
9%
13%
4%
5%
2%
14%
4%
2%
3%
3%
3%
5%
5%
6%
-3%
-1%
3%
0%
4%
-7%
Rent
€1,040
€1,141
€940
€1,206
€886
€944
€917
€875
€922
€867
€866
€866
€877
€912
€1,099
€990
€900
€1,080
€1,021
€988
€857
€884
€1,052
€895
€648
€635
€474
€422
€613
€431
€445
€435
€403
€365
€864
€468
€487
€487
€465
€417
€492
€356
% Change
16%
13%
15%
8%
12%
16%
15%
20%
15%
11%
10%
8%
14%
11%
9%
11%
*
12%
11%
13%
9%
16%
13%
17%
5%
9%
2%
-2%
11%
2%
0%
5%
-1%
1%
35%
3%
8%
11%
7%
-3%
2%
0%
Rent
€1,328
€1,548
€1,225
€1,644
€1,208
€1,349
€1,324
€1,221
€1,244
€1,133
€1,025
€1,082
€1,119
€1,164
€1,411
€1,165
€1,310
€1,357
€1,158
€1,049
€1,064
€1,042
€1,422
€1,004
€829
€789
€620
€519
€775
€506
€554
€537
€484
€433
€951
€602
€589
€645
€584
€535
€621
€437
% Change
19%
10%
14%
15%
12%
13%
16%
19%
17%
11%
7%
15%
13%
12%
13%
17%
8%
11%
17%
15%
13%
14%
13%
15%
5%
6%
6%
0%
12%
4%
2%
2%
2%
1%
7%
5%
1%
9%
4%
3%
12%
3%
Rent
€1,804
€1,976
€1,509
€2,234
€1,374
€1,945
€1,631
€1,428
€1,563
€1,396
€1,250
€1,217
€1,293
€1,300
€1,649
€1,191
€1,541
€1,600
€1,133
€1,031
€1,206
€1,184
€1,843
€1,159
€934
€927
€753
€674
€859
€612
€643
€643
€614
€564
€1,227
€677
€674
€669
€660
€554
€683
€579
% Change
23%
6%
13%
10%
12%
19%
16%
13%
11%
15%
19%
13%
16%
9%
11%
19%
10%
11%
13%
14%
12%
10%
18%
14%
8%
7%
5%
4%
12%
4%
3%
2%
2%
1%
22%
3%
-1%
3%
5%
1%
2%
4%
Rent
*
*
€1,848
€3,126
€1,617
€2,748
€1,909
€1,739
€1,855
€1,546
*
€1,508
€1,368
€1,789
€2,052
€1,263
€1,899
€2,012
€1,422
€1,104
€1,389
€1,429
€2,394
€1,243
€1,186
€1,042
€882
€738
€1,009
€684
€723
€721
€647
€614
€1,486
€859
€754
€874
€700
€610
€868
€607
% Change
*
*
12%
11%
28%
21%
17%
17%
23%
8%
*
19%
1%
27%
9%
29%
20%
13%
*
15%
4%
-3%
3%
7%
13%
8%
5%
4%
10%
4%
3%
4%
0%
2%
10%
4%
2%
4%
0%
3%
7%
-2%
Rent
*
*
*
€3,816
€2,250
€3,773
€2,932
€2,175
*
€2,099
*
*
*
*
€2,814
€2,000
*
€3,146
*
*
*
€2,622
€2,824
*
€1,519
€1,125
€971
€952
€1,265
€789
€835
€864
€688
€655
€1,501
*
€1,011
*
€744
*
€1,011
€801
% Change
*
*
*
-7%
*
29%
13%
11%
*
25%
*
*
*
*
12%
29%
*
12%
*
*
*
12%
5%
*
5%
-1%
6%
21%
14%
3%
8%
12%
2%
2%
8%
23%
-4%
-3%
7%
Dublin 1
Dublin 2
Dublin 3
Dublin 4
Dublin 5
Dublin 6
Dublin 6W
Dublin 7
Dublin 8
Dublin 9
Dublin 10
Dublin 11
Dublin 12
Dublin 13
Dublin 14
Dublin 15
Dublin 16
Dublin 18
Dublin 20
Dublin 22
Dublin 24
North Co Dublin
South Co Dublin
West Dublin
Cork City
Galway City
Limerick City
Waterford City
Dublin Comm. Counties
West Leinster
South-East Leinster
Munster
Connacht
Ulster
Maynooth
Dundalk
Athlone
Carlow town
Tralee
Castlebar
Sligo town
Letterkenny

7 | The Daft.ie Rental Report, 2014 Q2
Rental trends in DublinFrom Quarter 1, 2006 to Quarter 2, 2014
Rent-a-room income trends
AreaAverage
rent% Yr/yr change
Dublin City Centre
North Dublin City
South Dublin City
North Co. Dublin
South Co. Dublin
West Co. Dublin
€ 573
€ 466
€ 534
€ 433
€ 519
€ 434
10.4%
11.2%
9.0%
14.2%
9.5%
12.7%
Averagerent
% Yr/yr change
€ 461
€ 374
€ 421
€ 305
€ 427
€ 319
6.7%
12.0%
12.3%
-1.0%
11.5%
10.8%
Single Room Double Room
Average rents by region, 2006-2014
Dublin City Centre North Dublin City South Dublin City North County Dublin South County Dublin West County Dublin
2006Q1
2006Q3
2007Q1
2007Q3
2008Q1
2008Q3
2009Q1
2009Q3
2010Q1
2010Q3
2011Q1
2011Q3
2013Q1
2013Q3
2014Q1
2014Q2
2014Q3
2012Q1
2012Q3
€800
€900
€1,000
€1,100
€1,200
€1,300
€1,400
€1,500
€1,600
€1,700
West County DublinAverage rent: €1,118 Quarter-on-quarter change: 3.9% Year-on-year change: 15.1% Change from trough: 23.7%
North County DublinAverage rent: €1,097 Quarter-on-quarter change: 3.1% Year-on-year change: 12.8% Change from trough: 21.5%
Dublin City CentreAverage rent: €1,345 Quarter-on-quarter change: 4.4% Year-on-year change: 17.2% Change from trough: 28.4%
North Dublin CityAverage rent: €1,231 Quarter-on-quarter change: 3.9% Year-on-year change: 15.8% Change from trough: 26.0%
South County DublinAverage rent: €1,485 Quarter-on-quarter change: 3.0% Year-on-year change: 14.1% Change from trough: 27.0%
South Dublin CityAverage rent: €1,396 Quarter-on-quarter change: 3.6% Year-on-year change: 16.0% Change from trough: 28.0%
There were 2,000 properties available to rent in Dublin on August 1, one sixth fewer than on the same date a year previously.
The price of a room has increased in most parts of Dublin by between 10% and 15%.
Across the capital, rents are up by 26% since 2011 and are now just 9% below peak values in 2007.
Rents continued to rise strongly in mid 2014, with increases of up to 4.4% across the capital, in line with increases in the first quarter.
8 | The Daft.ie Rental Report, 2014 Q2
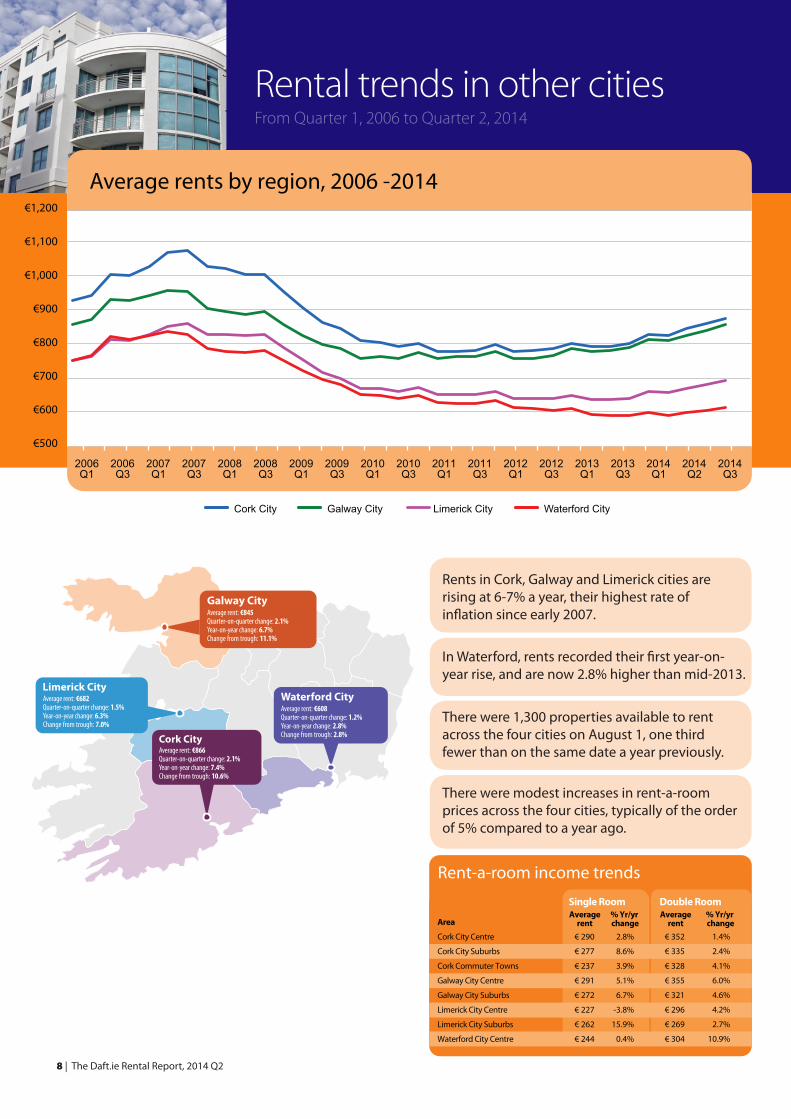
Rental trends in other citiesFrom Quarter 1, 2006 to Quarter 2, 2014
Cork City Galway City Limerick City Waterford City
Average rents by region, 2006 -2014
€500
€600
€700
€800
€900
€1,000
€1,100
€1,200
2006Q1
2006Q3
2007Q1
2007Q3
2008Q1
2008Q3
2009Q1
2009Q3
2010Q1
2010Q3
2011Q1
2011Q3
2013Q1
2013Q3
2014Q1
2014Q2
2014Q3
2012Q1
2012Q3
Rent-a-room income trends
AreaAverage
rent% Yr/yr change
Averagerent
% Yr/yr change
Cork City Centre
Cork City Suburbs
Cork Commuter Towns
Galway City Centre
Galway City Suburbs
Limerick City Centre
Limerick City Suburbs
Waterford City Centre
€ 290
€ 277
€ 237
€ 291
€ 272
€ 227
€ 262
€ 244
2.8%
8.6%
3.9%
5.1%
6.7%
-3.8%
15.9%
0.4%
€ 352
€ 335
€ 328
€ 355
€ 321
€ 296
€ 269
€ 304
1.4%
2.4%
4.1%
6.0%
4.6%
4.2%
2.7%
10.9%
Single Room Double Room
Cork City
Galway City
Limerick CityWaterford CityAverage rent: €682
Quarter-on-quarter change: 1.5% Year-on-year change: 6.3%Change from trough: 7.0%
Average rent: €608 Quarter-on-quarter change: 1.2% Year-on-year change: 2.8% Change from trough: 2.8%
Average rent: €845 Quarter-on-quarter change: 2.1% Year-on-year change: 6.7% Change from trough: 11.1%
Average rent: €866 Quarter-on-quarter change: 2.1% Year-on-year change: 7.4% Change from trough: 10.6%
Rents in Cork, Galway and Limerick cities are rising at 6-7% a year, their highest rate of inflation since early 2007.
In Waterford, rents recorded their first year-on- year rise, and are now 2.8% higher than mid-2013.
There were 1,300 properties available to rent across the four cities on August 1, one third fewer than on the same date a year previously.
There were modest increases in rent-a-room prices across the four cities, typically of the order of 5% compared to a year ago.
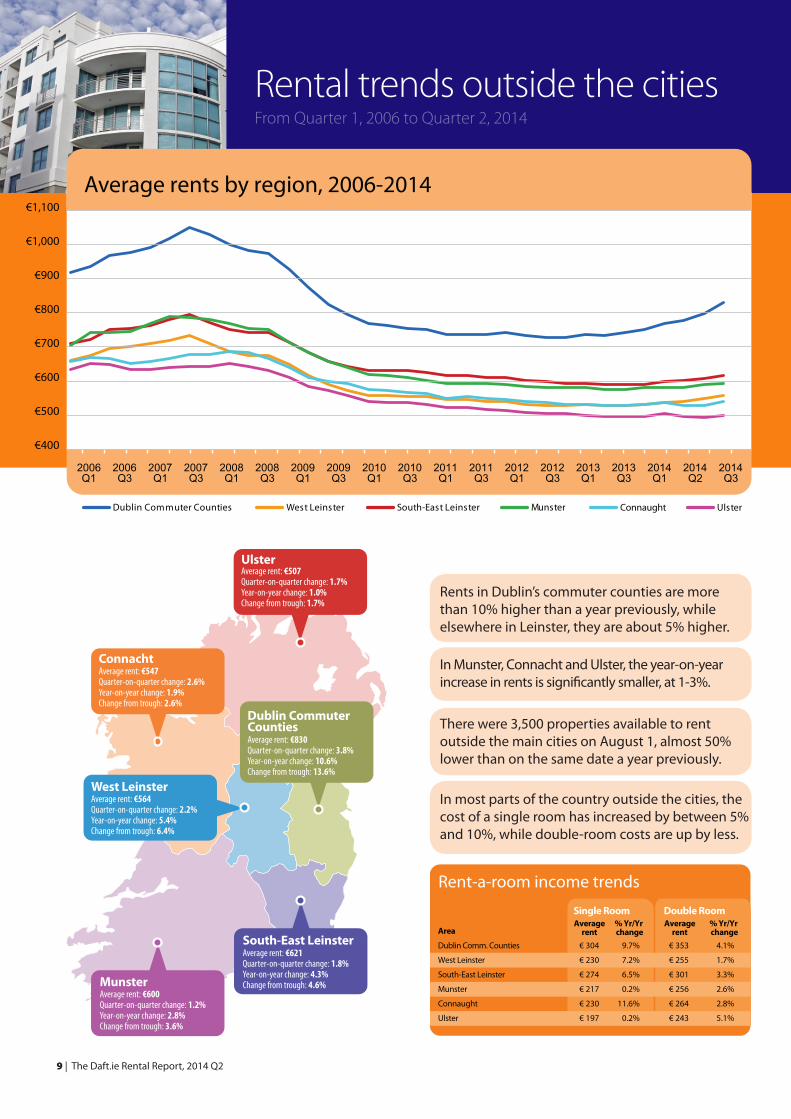
Rental trends outside the citiesFrom Quarter 1, 2006 to Quarter 2, 2014
9 | The Daft.ie Rental Report, 2014 Q2
Average rents by region, 2006-2014
Dublin Commuter Counties West Leinster South-East Leinster Munster Connaught Ulster
€400
€500
€600
€700
€800
€900
€1,000
€1,100
Dublin Commuter Counties West Leinster South-East Leinster Munster Connacht Ulster
2006Q1
2006Q3
2007Q1
2007Q3
2008Q1
2008Q3
2009Q1
2009Q3
2010Q1
2010Q3
2011Q1
2011Q3
2013Q1
2013Q3
2014Q1
2014Q2
2014Q3
2012Q1
2012Q3
Rent-a-room income trends
AreaAverage
rent% Yr/Yr change
Averagerent
% Yr/Yr change
Dublin Comm. Counties
West Leinster
South-East Leinster
Munster
Connaught
Ulster
€ 304
€ 230
€ 274
€ 217
€ 230
€ 197
9.7%
7.2%
6.5%
0.2%
11.6%
0.2%
€ 353
€ 255
€ 301
€ 256
€ 264
€ 243
4.1%
1.7%
3.3%
2.6%
2.8%
5.1%
Single Room Double Room
South-East LeinsterAverage rent: €621 Quarter-on-quarter change: 1.8%Year-on-year change: 4.3% Change from trough: 4.6%Munster
Average rent: €600 Quarter-on-quarter change: 1.2% Year-on-year change: 2.8% Change from trough: 3.6%
Connacht Average rent: €547 Quarter-on-quarter change: 2.6%Year-on-year change: 1.9% Change from trough: 2.6%
UlsterAverage rent: €507 Quarter-on-quarter change: 1.7%Year-on-year change: 1.0% Change from trough: 1.7%
West LeinsterAverage rent: €564 Quarter-on-quarter change: 2.2% Year-on-year change: 5.4% Change from trough: 6.4%
Dublin CommuterCountiesAverage rent: €830 Quarter-on-quarter change: 3.8% Year-on-year change: 10.6% Change from trough: 13.6%
In most parts of the country outside the cities, the cost of a single room has increased by between 5% and 10%, while double-room costs are up by less.
Rents in Dublin’s commuter counties are more than 10% higher than a year previously, while elsewhere in Leinster, they are about 5% higher.
In Munster, Connacht and Ulster, the year-on-year increase in rents is significantly smaller, at 1-3%.
There were 3,500 properties available to rent outside the main cities on August 1, almost 50% lower than on the same date a year previously.

First Time Buyer and Investor Information
Can we afford it?The mortgage cost, including mortgage interest relief and income from the rent-a-room scheme, by region and bedroom number.
10 | The Daft.ie Rental Report, 2014 Q2
*1.4%-2.0%1.0%-0.5%1.3%0.4%0.6%0.5%-0.3%0.2%0.4%-1.4%0.3%-0.7%0.3%
Investor Information: Snapshot of gross yields across the country (and year on year change, in percentage points)
Location \ Bedroom # AverageYr/yr
change 1-bed 2-bed 3-bed 4-bed 5-bed
Dublin City Centre
North Dublin City
South Dublin City
North Dublin County
South Dublin County
West Dublin County
Dublin Commuter Counties
West Leinster
South-East Leinster
Munster
Cork City
Limerick City
Waterford City
Connaught/Ulster
Galway City
Average
8.0%
6.1%
5.9%
5.9%
5.4%
6.6%
5.7%
5.9%
5.5%
5.2%
6.3%
7.2%
7.4%
5.7%
6.8%
5.7%
0.9%
-0.7%
-0.4%
-0.1%
0.0%
-0.7%
0.0%
0.3%
0.0%
0.3%
0.1%
0.9%
1.1%
0.2%
0.7%
0.1%
8.1%
7.9%
7.1%
7.6%
6.6%
9.8%
7.9%
8.8%
8.3%
5.9%
6.0%
10.6%
8.0%
5.2%
9.0%
7.2%
2.1%
-0.4%
-0.7%
1.6%
-0.2%
0.8%
0.0%
1.4%
1.8%
-0.1%
-1.5%
1.4%
-0.5%
-1.0%
1.8%
0.2%
7.8%
6.9%
6.3%
6.9%
6.2%
7.7%
7.7%
7.9%
7.4%
7.1%
8.6%
8.6%
8.3%
6.8%
8.0%
7.2%
0.1%
-0.7%
-0.8%
-0.6%
0.5%
-0.6%
0.2%
0.4%
-0.1%
0.6%
0.0%
0.8%
-0.2%
-0.3%
0.6%
-0.1%
8.0%
5.8%
5.8%
5.9%
5.7%
6.5%
6.0%
7.0%
6.0%
6.0%
6.4%
7.5%
8.5%
7.3%
7.9%
6.3%
-1.0%
-0.6%
0.0%
-0.4%
0.0%
-0.8%
-0.1%
0.2%
-0.2%
0.3%
0.1%
0.9%
1.5%
0.6%
1.1%
0.0%
*
4.8%
5.0%
4.7%
4.2%
5.2%
4.6%
5.0%
4.5%
4.2%
5.3%
5.7%
5.2%
5.3%
5.6%
4.8%
*
-1.2%
0.0%
0.2%
-0.4%
-0.3%
0.1%
0.1%
-0.1%
0.1%
0.2%
0.5%
1.1%
0.4%
0.4%
0.2%
*
5.0%
4.5%
4.5%
3.7%
4.2%
4.2%
4.1%
4.1%
4.0%
5.0%
6.3%
5.9%
3.9%
4.1%
4.1%
*
-0.7%
-1.3%
1.4%
-0.4%
-2.0%
0.2%
0.5%
0.4%
0.2%
0.4%
2.1%
2.5%
-0.3%
0.5%
0.1%
Yr/yr change
Yr/yr change
Yr/yr change
Yr/yr change
Yr/yr change
First-time buyer information: Mortgage versus rent comparison
Dublin City Centre
North Dublin City
South Dublin City
North Dublin County
South Dublin County
West Dublin County
Cork City
Galway City
Limerick City
Waterford City
Dublin Commuter Counties
West Leinster
South-East Leinster
Munster
Connaught/Ulster
€615
€504
€637
€529
€704
€410
€498
€327
€213
*
€362
€224
€250
€343
€362
€776
€637
€804
€668
€889
€518
€629
€413
€268
*
€457
€283
€315
€433
€457
€1,056
€867
€1,005
€745
€1,023
€754
€641
€601
€485
€434
€596
€390
€435
€419
€395
€819
€764
€1,013
€703
€993
€660
€445
€473
€336
€290
€466
€296
€346
€349
€336
€1,034
€965
€1,279
€887
€1,254
€833
€562
€597
€424
€367
€588
€374
€437
€441
€424
€1,272
€1,045
€1,211
€898
€1,233
€909
€727
€682
€551
€492
€676
€443
€494
€469
€437
€1,037
€1,086
€1,400
€953
€1,290
€891
€677
€563
€469
€372
€659
€404
€495
€497
€398
€1,310
€1,371
€1,768
€1,204
€1,629
€1,125
€855
€711
€592
€470
€832
€510
€625
€628
€502
€1,593
€1,308
€1,516
€1,125
€1,543
€1,138
€876
€822
€664
€593
€811
€531
€592
€580
€550
*
€1,641
€2,176
€1,464
€2,456
€1,289
€1,039
€888
€728
€700
€1,040
€650
€760
€801
€595
*
€2,072
€2,748
€1,849
€3,102
€1,628
€1,312
€1,121
€920
€884
€1,313
€820
€960
€1,012
€752
*
€1,596
€1,849
€1,372
€1,883
€1,388
€1,019
€957
€773
€691
€916
€600
€669
€631
€585
*
€1,895
€3,446
€2,553
€3,795
€2,122
€1,438
€1,327
€767
*
€1,426
€892
€1,003
€997
€848
*
€2,392
€4,351
€3,223
€4,792
€2,679
€1,816
€1,676
€968
*
€1,800
€1,127
€1,266
€1,259
€1,071
*
€1,910
€2,213
€1,642
€2,253
€1,661
€1,201
€1,128
€910
€814
€984
€645
€718
€674
€644
1-bed 2-bed 3-bed 4-bed 5-bedMortgage
(3.6%)Mortgage
+2%Current
rentMortgage
(3.6%)Mortgage
+2%Current
rentMortgage
(3.6%)Mortgage
+2%Current
rentMortgage
(3.6%)Mortgage
+2%Current
rentMortgage
(3.6%)Mortgage
+2%Current
rentLocation \ Bedroom #
Current mortgage repayments based off the following parameters: 3.6% variable mortgage, for a term of 30 years, with 85% LTV

About the Report
Over the last 10 years, Daft.ie has collected a vast amount of data on the Irish property market. In 2011 alone, more than 260,000 properties were advertised on the site.
The goal of the Daft Report is to use this information to help all actors in the property
market make informed decisions about buying and selling. In addition, because it is
freely available, the Daft Report can help inform the media, the general public and
policymakers about the latest developments in the property market.
The Daft.ie Rental Report was launched in 2005. It has already become the definitive
barometer of the Irish rental market and is being used by the Central Bank, mortgage
institutions, financial analysts and the general public alike. The Daft.ie House Price report
is Ireland’s longest-running house price report, combining information from the Daft.ie
archives with data from Ireland’s Residential Property Price Register.
Together, the two reports give house-hunters and investors more information to help
them make their decisions. These twin reports mean that Daft is the only objective
monitor of trends in both rental and sales markets on a monthly basis, making the report
an essential barometer for anyone with an interest in the Irish property market.
Methodology and Sample SizeThe statistics are based on properties advertised on Daft.ie for a given period. The
regressions used are hedonic price regressions, accounting for all available and
measurable attributes of properties, with a Cooks Distance filter for outliers.
The average monthly sample size for lettings properties is over 10,000. Indices are
based on standard methods, holding the mix of characteristics constant, with the annual
average of 2012 used as the base. For more on the methodology, please see
www.daft.ie/research.
About Daft.ieDaft.ie is Ireland’s largest property
website. The latest audited report
from ABC (Sep 2011) shows
monthly traffic of 130 million page
impressions (pages of information
received) and 1.976 million unique
users per month across Daft Media’s
property websites (daft.ie, rent.ie,
let.ie, property.ie). This makes Daft.
ie the biggest property website in
Ireland across all demographics.
11 | The Daft.ie Rental Report, 2014 Q2

DisclaimerThe Daft.ie Report is prepared
from information that we believe
is collated with care, but we do not
make any statement as to its accuracy
or completeness. We reserve the right
to vary our methodology and to edit
or discontinue the indices, snapshots
or analysis at any time for regulatory
or other reasons. Persons seeking to
place reliance on any information
contained in this report for their own
or third party commercial purposes
do so at their own risk.
CreditsEconomic Analysis:
Ronan Lyons Marketing & Communications:
Kieran Harte Layout and Design:
Ciara Mulvany
All data is Copyright © Daft Media
Limited. The information contained in
this report may only be reproduced if
the source is clearly credited.
Please contact Daft.ie on 01-4218700
for further information.
Coming Next…
The Daft.ie House Price Report 2014 Q3 In early October 2014 The Daft.ie House Price Report will be published in early July 2014 and
will provide a detailed regional analysis of asking prices and transaction prices
as well as all the usual indices, snapshots, trends and regional analysis, providing
the public with Ireland’s most up-to-date information on the housing market.