The Competitive Impact of Hypermarkets on Retail Gasoline ...
40
Munich Personal RePEc Archive The competitive impact of hypermarket retailers on gasoline prices Zimmerman, Paul R. US Federal Trade Commission 18 June 2009 Online at https://mpra.ub.uni-muenchen.de/20248/ MPRA Paper No. 20248, posted 26 Jan 2010 18:57 UTC
Transcript of The Competitive Impact of Hypermarkets on Retail Gasoline ...
Munich Personal RePEc Archive
The competitive impact of hypermarket
retailers on gasoline prices
Zimmerman, Paul R.
US Federal Trade Commission
18 June 2009
Online at https://mpra.ub.uni-muenchen.de/20248/
MPRA Paper No. 20248, posted 26 Jan 2010 18:57 UTC
The Competitive Impact of Hypermarket Retailers on Gasoline Prices
Paul R. Zimmerman†
Abstract
Hypermarkets are large retail suppliers of general merchandise or grocery items that also sell gasoline, often at very low margins. Using panel data for 1998-2002, this paper estimates the impact of hypermarkets on average state-level retail gasoline prices. The empirical results suggest a robust, economically (and statistically) significant effect of increased competition from hypermarkets. Furthermore, the results also suggest that refiners’ lower the delivered wholesale prices charged to their affiliated lessee-dealer and open-dealer stations in response to increased hypermarket competition, which in turn translates to lower retail (street) prices. The presence of a state motor fuel sales-below-cost (SBC) law may lessen the price-reducing effects from hypermarket competition by 40-67 percent while independently imparting no other offsetting price reductions. Finally, using recently published estimates of the short-run own price elasticity of demand for gasoline, consumer welfare is estimated to have increased in the neighborhood of $488 million over the sample period.
Keywords: Dealer tank wagon; Hypermarkets; Motor fuel SBC laws; Petroleum; Vertical integration
JEL Classification: L11; L22; L71; Q40
June 18, 2009
Copyright 2009 by Paul R. Zimmerman. All rights reserved. The author thanks Julie Carlson, Malcolm Coate, Douglas Herman, Louis Silvia, Nicholas Kreisle, and Christopher Taylor for helpful comments. Elisabeth Murphy provided excellent research assistance. The views expressed in this paper are not purported to reflect those of the FTC or its Chairman, Commissioners, or other staff. † U.S. Federal Trade Commission, Bureau of Economics, Antitrust I, 601 New Jersey Avenue NW, NJ-8100, Washington, DC, 20580. E-mail: <[email protected]>.
1
The Competitive Impact of Hypermarkets on Retail Gasoline Prices
Abstract
Hypermarkets are large retail suppliers of general merchandise or grocery items that also sell gasoline, often at very low margins. Using panel data for 1998-2002, this paper estimates the impact of hypermarkets on average state-level retail gasoline prices. The empirical results suggest a robust, economically (and statistically) significant effect of increased competition from hypermarkets. Furthermore, the results also suggest that refiners’ lower the delivered wholesale prices charged to their affiliated lessee-dealer and open-dealer stations in response to increased hypermarket competition, which in turn translates to lower retail (street) prices. The presence of a state motor fuel sales-below-cost (SBC) law may lessen the price-reducing effects from hypermarket competition by 40-67 percent while independently imparting no other offsetting price reductions. Finally, using recently published estimates of the short-run own price elasticity of demand for gasoline, consumer welfare is estimated to have increased in the neighborhood of $488 million over the sample period.
Keywords: Dealer tank wagon; Gasoline demand; Hypermarkets; Street-back pricing; Vertical integration
JEL Classification: L11; L22; L71; Q40
2
1. Introduction
Hypermarkets are large retail suppliers of general merchandise and/or grocery items that
also sell gasoline. Examples of hypermarkets include “club” or “box” stores such as Costco and
Sam’s Club, mass merchandisers (e.g., Wal-Mart), and grocery stores (e.g., Albertsons and
Safeway). Hypermarkets typically sell retail gasoline at substantial discounts relative to
“branded” (e.g., Chevron, Shell, and ExxonMobil) and even “unbranded” retailers (e.g., “mom &
pop” gas stations).1 Some hypermarkets sell five to ten times the volume of a traditional retailer
location within a given month.2 Nationwide, the proportion of gasoline sales made through
hypermarket channels in the U.S. was predicted to reach as high as 13.1 percent by the end of
2007.3
The ability of hypermarkets to sell discounted gasoline and move large volumes at their
retail locations (relative to traditional marketers) stems from a number of factors including lower
construction and operating costs, the receipt of large volume discounts on purchases of bulk
unbranded wholesale gasoline, and the use of unattended pumping stations (among others).4
Some hypermarkets may also have the incentive to sell gasoline at relatively lower margins
(possibly even negative ones) in order to stimulate consumer foot traffic into their
grocery/merchandise stores (e.g., pricing gasoline as a “loss leader”).5
The low-price/high-volume retail gasoline sales made through hypermarket channels may
allow these firms to affect the prices charged at traditional gasoline stations, and there is
anecdotal evidence suggesting as much. For instance, following the entry of a Sam’s Club in
Louisville, Kentucky, “nearby” competing stations lowered their prices below the levels
maintained by less proximate stations.6 A nearby branded station reduced its prices by $0.02-
1 Retail stations selling unbranded gasoline are also commonly referred to as “independent” dealers. 2 FTC (2004, p. 235). 3 Id. 4 Id., pp. 235-236. 5 Id., p. 235. 6 FTC (2005, p.108).
3
0.03 per gallon relative to stations of the same brand located farther away.7 Costco’s 1999 entry
as a gasoline retailer in San Diego, California (which began with a single fuel site) provides
another example suggestive of the competitive pricing pressure that hypermarket retailers can
impart;8 specifically, Costco was able to capture 3.1 percent of total gasoline sales in the area
despite having only seven stores in operation (i.e., less than 1.0 percent of all retail gasoline sites)
by 2000.9
On the other hand, certain factors might mitigate the impact of hypermarket gasoline
sales on prices charged at traditional stations. For example, club stores may require customers to
pay a membership fee in order to access their pumps, which might lower the degree to which a
hypermarket station is viewed as a viable substitute for a traditional outlet. Further, the majority
of gasoline sales in the U.S. are made through refiner-affiliated retail stations10 To the extent this
purchasing behavior reflects consumers’ relative preference for purchasing fuel at branded
stations, the sales made at hypermarket stations may be driven mainly by substitution away from
lower-priced unbranded outlets, thereby resulting in only a small overall impact on retail market
prices.
The competitive pressure exerted by hypermarket entry in the retail gasoline market may
also play a part in the recent decision of major integrated refiners to exit downstream gasoline
retailing by divesting their company-operated stations. For example, in June, 2006, Exxon Mobil
Corp. announced that it was selling its remaining 2200 gasoline stations (Poole, 2008). British
Petroleum plc also plans to sell its U.S. retail stations by the end of 2009, and in August, 2008,
ConocoPhillips announced its plans to divest its remaining 600 company-owned stations. These
7 Id. 8 FTC (2004, p. 236). 9 Id. 10 About two-thirds of all retail stations sell branded gasoline (U.S. Senate 2002, p. 303).
4
transactions are believed to be the result of “oil companies’ efforts to flee low-margin U.S. retail-
gasoline sales …” (Gold, 2008).11,12
To date, the competitive impact of hypermarkets on retail gasoline prices and margins has
been largely unexplored in the empirical economics literature on retail gasoline markets.13 Using
state-level panel data over the years 1998-2002 – a period in which there was rapid growth in
hypermarket sales, but which preceded the large-scale exit of branded retail players in the U.S.
mentioned above – this paper estimates the impact of hypermarket gasoline sales on branded
retail gasoline prices. Various economic, demographic, and regulatory factors that may influence
the level of retail gasoline prices are considered.
Section 2 discusses the data and empirical methodology. The extent of competition
exerted by hypermarkets is measured as the share of total statewide gasoline sales made through
these retailers (i.e., hypermarket “penetration”). The empirical results presented in Section 3
suggest that a one-standard-deviation increase in the proportion of state gasoline sales made by
hypermarkets decreases average branded retail gasoline prices by approximately $0.004 (or 0.4¢)
per gallon. This result is robust to a large number of variations in model specification. The
estimated effect is economically significant in terms of its implications for gross and net gasoline
retailing margins, which suggests that hypermarkets have in fact exerted a material competitive
impact on the pricing behavior of traditional gasoline retailers.
Section 4 then explores the causal pathway by which hypermarkets may lower retail
gasoline prices based upon the ownership structure of some branded retail stations. Specifically,
11 Gold (2008) also notes that: “Retail gasoline-sales are undergoing dramatic change. Giants such as Conoco Phillips and Exxon Mobil Corp. are exiting, and grocery chains Kroger Corp. and Wal-Mart Stores Inc. use fuel sales to lure shoppers.” 12 A similar impact of hypermarket competition on the exit of branded (and independent) retail gasoline stations has also been observed in Europe, especially France. See Gauthier-Villars (2004) (“Settling for ultrathin margins to lure customers, hypermarket franchises … have grabbed a bigger share of the French gasoline market and pushed thousands of traditional dealers out of business … Thousands of “white pumps,” gasoline dealers with no branded supplier, also have gone out of business.”). Gauthier-Villars also reports that hypermarkets accounted for 56% of retail gasoline sales in France in 2003 and 28% in the U.K., both of which are substantially higher than recent estimated hypermarket sales shares in the U.S. 13 Several studies consider the influence of large mass merchandiser entry or expansion, in particular Wal-Mart, on the price of consumer goods, but do not otherwise consider pricing outcomes in the gasoline industry. See, e.g., Basker (2005) and Volpe & Lavoie (2006).
5
this section considers the effect of hypermarket penetration rates on the wholesale prices of
gasoline charged by refiners to affiliated lessee-dealer and direct-supplied-open-dealer stations.
Refiners can directly affect the retail profit-margins realized at these stations by lowering their
input costs on delivered wholesale gasoline supplies. It is shown that increased hypermarket
competition is inversely correlated with the wholesale delivered prices paid by lessee-dealers and
direct-supplied-open-dealers, but uncorrelated with other types of wholesale gasoline prices. This
finding supports the notion that the estimated price effect of hypermarket entry is not being
spuriously generated by general wholesale pricing trends, but is in fact the result of localized
competitive pricing responses made by traditional gasoline retailers. Other evidence also
supports the view that hypermarkets impact retail gasoline prices through their effect on the
internal transfer or delivered-based prices set by refiners to some of their affiliated retail outlets.
Section 5 considers the effect of state motor fuels sales-below-costs laws and their
implications for the impact of hypermarket penetration on retail gasoline prices. Previous studies
of these laws (Anderson & Johnson 1999, Brannon & Kelly 1999, Fenili & Lane 1985, Skidmore
et al. 2005, Vita 2000) do not reach a general consensus – some have found a positive effect on
retail gasoline prices while others have found a negative effect (or no effect). The empirical
results presented below provide some evidence that the price-reducing effects of increased
hypermarket competition in the retail gasoline market may be substantially abated in the presence
of such laws. Specifically, the presence of such a state law is associated with a 40-67 percent
reduction in the price-reducing benefits arising from increased competition from hypermarket
retailers.
Section 6 provides an initial assessment of the gain in consumer surplus associated with
the estimated decrease in retail prices. Using recently published estimates of the short-run own
price elasticity of demand for gasoline that pertain to the sample period, the results suggest that
for each one-standard-deviation increase in the share of retail gasoline sales made by
6
hypermarkets consumer surplus increases by approximately $488 million (measured in constant
2002 dollars). Finally, Section 7 concludes and offers suggestions for further research.
2. Data and Empirical Model
Annual state-level data on grade-specific retail gasoline prices (excluding taxes) and
prime supplier sales volumes, both taken over the years 1998-2002, are used to define the
following retail price index:
s t G s t G s tGP w P, , ,= å , ,
(1)
where G = {regular, mid-grade, premium} denotes the grade of gasoline. The subscripts s and t
denote individual states and years, respectively. 14 The variable , ,
denotes the grade-specific proportion of prime-supplier sales of grade G gasoline to total state
prime-supplier gasoline sales and the corresponding grade-specific price.
G s tw , , (0,1)Î G s tGw , , 1=å
G s tP , ,15 By considering
all gasoline grade types and their respective consumption shares, the retail price index defined in
Eq. (1) serves as a proxy for the average state-level price of retail gasoline.
There are four ownership structures pertaining to refiner-affiliated (branded) retail
gasoline stations. Company-operated stations are directly owned and operated by the upstream
refiner and “purchase” branded wholesale gasoline from the refiner at an unobservable internal
transfer price.16 Lessee-dealer stations are operated by third-parties who pay rent for use of the
refiner’s property and brand-name and directly pay a delivered price to the refiner for branded
wholesale gasoline. Open-dealer stations are operated by an independent third-party who owns
the station property, but who purchases branded wholesale gasoline. These wholesale purchases
14 The data pertain to the 48 contiguous states. Following Vita (2000) and Chouinard & Perfloff (2007), the various grade-specific gasoline prices and volumes used throughout the analysis correspond to the averages measured across all formulation types (i.e., conventional, oxygenated, and reformulated). 15 A prime supplier is defined by the EIA as “a firm that produces, imports, or transports selected petroleum products across State boundaries and local marketing areas, and sells the product to local distributors, local retailers, or end users.” See < http://tonto.eia.doe.gov/dnav/pet/TblDefs/pet_cons_prim_tbldef2.asp>. 16 There are some retail stations that are company-owned and operated but not otherwise affiliated with a refiner (e.g., do not carry the refiner’s “brand” label), but the number of these stations is small relative to refiner-branded company-operated stations.
7
are acquired at either a distribution point (rack terminal) or delivered directly to the operator’s
retail station (in a similar fashion to a lessee-dealer station). Those open dealers receiving direct
wholesale gasoline shipments to their retail locations are referred to as “direct-supplied-open-
dealers.” Finally, jobber-supplied stations are owned and operated by a distributor (“jobber”)
who has entered into an arrangement with a refiner to purchase branded wholesale gasoline from
a distribution point (rack) in order to supply its own stations.17
The retail gasoline price and sales data used to construct Eq. (1) are from the
U.S. Energy Information Agency (“EIA”) surveys. The retail pricing data pertain to gasoline
“sold through retail outlets,”18 which includes both branded stations (of any ownership type) as
well as unbranded (independent) outlets. These data are not separately reported by the EIA in
terms of “branded” or “unbranded” retail prices. 19
While the data used in this analysis are measured at the state level, one might reasonably
argue that the relevant antitrust geographic market pertaining to retail gasoline may be much
smaller than the state. However, data on hypermarket penetration rates are publicly available
only at the state level, and as such, this study follows previous research that has considered
fluctuations in or the impact of state- or higher-level “interventions” (e.g., regional formulation
changes or taxes) on average state-level gasoline prices.20 There is also a potential benefit of
using state-level gasoline pricing data (as opposed to more geographically disaggregated data) in
that they may help avoid any potential bias stemming from consideration of any particular cities
or metropolitan areas (Skidmore et al. 2005). Finally, one of the objectives of this study is to
17 There are also “unbranded jobbers” that supply their own stations or open-dealer stations. 18 See <http://tonto.eia.doe.gov/dnav/pet/pet_pri_allmg_a_EPM0_PTA_cpgal_m.htm>. According to EIA sources, the retail price data are collected from a census of refiners (filing under survey form EIA-78A, which encompasses branded company-operated stations) and a sample of resellers/retailers (under form EIA-782B, which includes branded lessee-dealer, open-dealer, and jobber-supplied stations, in addition to independent outlets). Both sets of respondents can report in the retail outlets category, and as such, a volume-weighted average price measured across the two is what is actually published in the “through retail outlets” category. See E-mail from Tammy Heppner to author, U.S. Energy Information Administration (March 24, 2009) (on file). 19 Id. 20 See, e.g., Vita (2000), Skidmore et al. (2005), Chouinard & Perloff (2007), Deltas (2008), and Alm et al.
(2009).
8

obtain an initial estimate of hypermarket competition on aggregate consumer surplus. State-level
data are more apropos than data from a select set of more disaggregated areas for this purpose.
The following reduced-form demand equation specifies the relationship between the
retail price index and state hypermarket penetration:
s t s t s t s t s tP Hypermarket X, , 1 ,(% )a b q l e-= + + G + + + ,
. (2)
The variable a denotes the regression constant and the randomly-distributed error term. The
variables and denote vectors of state and year indicators, respectively. The covariate of
primary interest, , is the (once-lagged) estimate of the percent of total state
gasoline sales made through hypermarket retail channels. The source of the hypermarket share
(“penetration”) data is the NPD Group’s Motor Fuels Index.
ste
iq tl
%H , 1s typermarket -
21 These share estimates are derived
from a national survey of over 200,000 customers and are demographically and geographically
balanced to U.S. Census Bureau statistics. Due to the potential feedback from a “performance”
measure (e.g., price) to market structure (e.g., market shares, which are determined in part on
price),22 this variable is lagged one year (i.e., taken at year t -1) to mitigate any potential
simultaneity bias.
The variable is a vector of covariates typically included in reduced-form gasoline
demand models (per-capita disposable income, state population, a proxy of hourly retail-sector
wages, population density, registered motor vehicles per-capita, and the percent of the state
population ages 65 and over).
s tX ,
23 Refinery outages and environmental regulations can be
important determinants of retail gasoline prices. Rather than defining variables for each refinery
outage that occurred over the relevant period, an index of state volume-grade wholesale gasoline
“rack” prices is constructed analogously to the retail price index given in Eq. (1) and entered as a
covariate in Eq. (2). A rack refers to the wholesale distribution point in gasoline markets, i.e., the
21 See <http://www.npd.com/corpServlet?nextpage=automotive-mfi_s.html> for further information. 22 See Evans et al. (1993) for further discussion. 23 See Vita (2000) for discussion of the theoretical motivation behind these explanatory measures.
9

place where trucks obtain the gas that is subsequently delivered to retail stations. There are
separate rack prices posted for branded gasoline and unbranded gasoline.24 Presumably, the
independent effect of a refinery outage is to reduce the supply (raise the price) of wholesale
gasoline, and is thus expected to be positively correlated with the dependent variable.
Beginning in January, 2000, federal regulations mandated stricter reformulated gasoline
(“RFG”) specifications to specific metropolitan areas to curb the rate of air pollution.25 The
variable is an indicator taking a value of one for in those states containing
at least one metropolitan area under the Phase II program (and zero otherwise). According to the
U.S. Environmental Protection Agency (“EPA”), Phase II RFG costs one to two cents more per
gallon to produce than Phase I RFG. Thus,
s tRFG II , 2000t ³
s tRFG II , is expected to be positively correlated
with retail gasoline prices, all else equal.26
The main hypothesis to be tested by estimation of Eq. (2) follows.
Hypothesis 1. Increased hypermarket competition results in lower average retail gasoline prices, implying , all else equal. 0b < Table 1 presents descriptive statistics and data sources for each of the variables employed in the
analysis, while Figure 1 displays the average retail gasoline market share (measured across all
states in the sample) of hypermarkets from 1997 to 2002. There is a substantial amount of
variation in the hypermarket measure both across states and within states over time, which
facilitates identifying the impact of hypermarkets with these data. For example, the average
24 Branded rack prices are sold under the name of the refiner producing the gasoline (e.g., Chevron). Branded wholesale gasoline is purchased at the rack location (commonly referred to as a “terminal” – the point where wholesale gasoline is stored prior to its distribution to retail stations) by branded open-dealer and jobber-supplied stations. Unbranded rack prices apply to sales of “generic” gasoline that is supplied (often, but not always) by a refiner to independent gasoline retailers. Under normal market conditions (i.e., no wholesale price inversions) the posted branded rack price is above the posted unbranded rack price. 25 Reformulated gasoline was already mandated for several of these areas under the “Phase I” RFG program initiated under the Clean Air Act of 1970. The 2000 federal law is referred to as the “Phase II” RFG program. The Phase II RFG program was the only gasoline formulation change federally mandated over the sample period. California is not counted as participating in the Phase II RFG program since the state-mandated formulation already met the new Federal standards and was implemented before the beginning of the sample period. As such, the effect of California’s formulation standards is absorbed into the state’s dummy variable (intercept shifter) as a “fixed-effect.” 26 It is possible that changes in formulation regulations will already be reflected in the wholesale rack price (or other wholesale price series), and thus not exert a material independent effect on retail prices directly. Indeed, this result is borne in the estimates presented below.
10
hypermarket share across all sample states was only about 0.3 percent in 1997, but increased to
nearly 4.0 percent by 2001. The sample mean of the hypermarket measure is 1.5 percent with a
variance of 4.6 percent. Two states (Vermont and North Dakota) had no reported hypermarket
retail gasoline sales over the sample period. In 2001, the highest hypermarket share of any
individual state (Washington) was 11.2 percent.
3. Results
Table 2 presents the results of estimating Eq. (1) via ordinary least squares (“OLS”) and
employing the Newey and West (1987) autocorrelation- and heteroskedasticity-consistent
covariance matrix estimator.27 Column (1) presents a baseline model that controls only for lagged
hypermarket shares while Column (2) then adds the additional covariates. Each specification also
includes full sets of state and year indicators.28 The null hypothesis that the estimated slope
coefficients are jointly zero is rejected in both specifications.
The coefficient estimate on is -0.005 in Column (1) and -0.002 in
Column (2). These point estimates are statistically significant at convectional levels in a two-
tailed test. In terms of their economic significance, the midpoint of the two coefficient estimates
implies that a one-standard-deviation (or approximately 2.2 percent) increase in the retail market
share of hypermarkets (in year t - 1) decreases retail gasoline prices by approximately $0.004 per
gallon (in year t), all else equal.
, 1% s tHypermarket -
29 While $0.004, of course, constitutes only a small portion of the
27 The estimations consider the evolution of the errors over time as characterized by a first-order autoregressive process (AR(1)). Other regressions (available upon request) estimated the standard errors using the state-level clustering correction advocated by Bertrand et al. (2004). These latter results were not qualitatively different with regard to statistical inference from those presented herein (and nor were those obtained when estimating simple OLS standard errors). 28 An attempt was also made to estimate all models with state-specific linear time trends. However, due to the relatively short duration of the panel, the inclusion of these variables effectively removed all meaningful variation in the covariates. As such, these variables were not included in the final regression specifications. 29 Since most of the covariates in Column (2) exhibit little year-to-year variation they are highly correlated with the state-specific dummies (indeed, most of the estimated coefficients are not statistically different from zero). As such, the various point estimates from this model should be interpreted with caution, and as
11

total retail price of gasoline, it does constitute a non-trivial portion of the retail margin (i.e., retail
price minus relevant wholesale cost),30 which is arguably the most appropriate metric for
assessing the competitive viability of a retail gasoline station.31 Indeed, the average gross retail
margin (defined as the average retail price less the average wholesale-rack price) observed over
the sample is approximately $0.14 per gallon, which implies hypermarket retail gasoline sales
lowered the average gross retail margin by approximately 3.0 percent over the sample period.
The gross retail margin does not, however, account for other expenses incurred by
gasoline retailers (such as credit card fees, taxes, delivery costs, rental payments on property,
licensing fees, etc.), implying that estimated decrease in retail prices will likely exert a
substantially larger impact on net retail margins and, therefore, a larger effect of hypermarkets on
average incremental profits (i.e., “profit” or “net” margins) of traditional gasoline retailers.32
Although estimates of the net retail margins are not publicly available, the FTC reports that net
petroleum refining margins were on the order of four cents per gallon in the late 1990s.33
Assuming that the average net retail margin over the same period was also four cents per
gallon would imply that a one-standard-deviation increase in hypermarket penetration lowered
net retail margins by 10 percent, which in itself is an economically significant effect given the
thin margins characterizing the petroleum industry. Of course, this estimate is conservative if net
such, the average of the hypermarket share estimates in Columns (1) and (2) is taken herein as a conservative “preferred” estimate. 30 A Newey-West regression of Eq. (2) using the gross retail margin (defined as the retail price index given by Eq. (1) minus the rack price index) as the dependent variable and the full set of covariates (save for the
rack price index) resulted in a coefficient estimate on of -0.002 (t-statistic = -1.88). , 1% s tHypermarket -31 See infra note 33. 32 These findings are consistent with earlier industry reports that hypermarkets “contributed to an at least one-cent decline in U.S. retail gasoline profits [per gallon] from 1997 to 2001.” Reuters (2001) (emphasis added). Oller (2004) states: “In Atlanta, hypermarket share has increased 340% from 2001 to 2004. Although total annual fuel gallons sold have increased by 17.5% in that same time period, overall margins in that market have fallen by 1 cent a gallon …”). 33 See GAO (2004, p. 173) (presenting an FTC document stating: “The FTC has generally applied a one cent per gallon price increase as the standard for evaluating market definition in refined petroleum products, including gasoline. While a one cent per gallon increase is smaller than that generated under the 5% price increase rule that the FTC typically uses in evaluating mergers, a one cent per gallon increase is
extremely significant in this industry. The petroleum industry is characterized by large volumes and
relatively thin margins. For example, data from the Energy Information Association indicate that net
refinery margins (which reflect crude costs as well as refinery operating costs) were on the order of four
cents per gallon during the late 1990s.”) (emphasis added).
12
retail margins are lower than net refining margins, which is almost certainly the case. Indeed, the
aforementioned exit of traditional branded stations from retailing is at least consistent with this
notion. And other evidence also suggests the relative thinness of retail margins relative to
refining margins.
Horsley (2009) reports on a Shell station owner in California who earns a gross gasoline
retailing margin of $0.12-$0.14 per gallon (which is consistent with the average gross margins
observed over the sample period). From this, the owner must pay approximately four cents in
payroll expenses, four cents in credit card fees, and another four cents in rent. Assuming these
were the only additional expenses incurred by the station owner would imply a net retail margin
of between zero and two cents per gallon (i.e., which is equal to half of the net refining margin
reported by the FTC over the late 1990s or less).34
Further, according to the National Association of Convenience Stores (“NACS”): “[i]n
2006, a gasoline retailer’s average gross margin (before expenses) was 13.9 cents per gallon …
After expenses, typical net profits are per gallon are a few cents per gallon, at most … NACS
estimates that the average retailer had a net pretax profit of between one and two cents [per
gallon] in 2007.”35 These latter observations, the results in Table 1, and the fact that: (1) the
retail gasoline price data reported by the EIA are volume-weighted by branded versus unbranded
varieties;36 and (2) most gasoline is sold through refiner-affiliated outlets,37 support the Meyer &
Fischer (2004, p. 30) contention that: “Even though entry by hypermarkets often involves
unbranded gasoline, the substantial sales that hypermarkets enjoy in some areas suggests that they
can be an important competitive constraint [e.g., materially impact net gasoline retailing margins]
on major brands.”
34 Horsley (1999) also notes that these low margins on gasoline sales have increased the relative importance from convenience store operations to many gasoline retailers. 35 See <http://www.nacsonline.com/NACS/News/Campaigns/GasPrices_2008/Pages/HowToGetGas.aspx> (emphasis added). While these figures are not from the same years as those considered in the sample, they are likely to reflect the historical disparity between refining and retail margins that characterize the petroleum industry generally. 36 See supra note 18. 37 See supra note 10.
13

Turning to the other covariates in Column (2), the coefficient estimate on the rack price
index implies that 80 percent of wholesale price increases are passed-through to retail prices; the
magnitude of this effect is similar to that reported by Skidmore et al. (2005).38 None of the other
explanatory variables are statistically significant at conventional levels, although this is not
surprising since – as mentioned previously – these variables exhibit little year-to-year variation at
the state-level. Thus, some caution should be exercised in interpreting the individual point
estimates pertaining to these covariates. The F-statistics at the bottom of Table 2 indicate that the
state indicators, year indicators, and covariates in are jointly significant at the one percent
level.
s tX ,
Table 3 presents alternative regression specifications to examine the robustness of the
estimated effect of increased hypermarket sales to alternative estimation methods, additional
controls, and modifications of the data set. These include regressions excluding the states that
reported no hypermarket sales over the sample period, the state that reported the highest average
hypermarket share (Michigan) over the period, and the two largest states in terms of population
(California and Texas). Other regressions employ the grade-specific retail and wholesale prices
in the reduced-form demand model (i.e., as opposed to the retail and wholesale price indices).
Of the 12 alternative regression models presented in Table 3, only two find statistically
insignificant impacts of hypermarkets; specifically, those that use mid-grade or premium-grade
retail prices as the dependent variable and the corresponding grade-specific rack prices in the set
of independent variables. These results seem intuitive. After all, mid-grade and especially
premium-grade gasoline formulations tend to be purchased by consumers driving higher-
performance vehicles. These individuals may exhibit relatively stronger preferences for branded
gasoline, and as such, view the equivalent octane-grade sold by hypermarket retailers to be a
38 One might expect complete pass-through of wholesale costs to retail prices over the course of a year. As noted by Skidmore et al. (2005, note 35), including lagged values of the wholesale price measures would likely capture the remaining increase in retail prices in response to rising wholesale prices.
14
more differentiated in product space relative to consumers who purchase cheaper, regular-grade
gasoline.
Furthermore, to the extent that the consumption of higher-octane formulations correlates
with individuals’ income, consumers of these products may have a higher opportunity cost of
time, which might limit their willingness to drive out to a potentially remote hypermarket
location, wait in lines, and forgo the other amenities associated with a traditional gasoline outlet.
It is therefore not too surprising that in addition to being statistically insignificant, the estimated
coefficient in the premium-grade model has the lowest coefficient estimate ( = -0.001), which
suggests that hypermarket retailers have a less substantive competitive impact on the average
market price of the most expensive grade of gasoline.
Increased concentration in retail gasoline markets, such as affected through retail
mergers, may positively impact retail prices (i.e., absent offsetting merger efficiencies).39
Conversely, decreased concentration may entail lower retail prices. To the extent that any
downward trend in retail concentration is correlated with increased hypermarket shares, the
coefficient on the hypermarket share variable would tend to be biased downward (i.e., too
negative), which would imply a stronger competitive impact of hypermarkets exert on retail
gasoline prices than actually exists. In an attempt to control (albeit crudely) for such events, the
variable is entered into the regression model as an additional specification
check. This variable takes a value of one for years t in state s if the average number of
retail gasoline stations in s over the years 2000-2002 is greater than the average number over the
years 1997-1999 (and zero otherwise).
s,tRetailGrowth
2000³
40 The coefficient estimates on the station growth indicator
(not reported) and hypermarket penetration measures are negative and statistically significant,
39 But see Hendricks & McAfee (2006) (presenting a theoretical model wherein gasoline mergers are more likely to affect wholesale prices rather than retail prices) as well as Taylor & Hosken (2007) and Simpson & Taylor (2008) (both studies providing evidence that recent gasoline mergers have had negative or insignificant retail price effects and (at most) moderate wholesale (rack) price effects). 40 The source of the retail gasoline station counts data is FTC (2004, p. 239). The state-level retail station counts were not reported for individual state-years.
15

although the magnitude of the latter is smaller in comparison to those shown in Table 2. Further,
the estimated impact of hypermarkets across the various specifications presented in Table 3 is
always negative and, in the majority of instances, statistically significant at conventional levels.
The median point estimate is -0.003, which is close to the midpoint estimate from Table 2.
4. Exploring the Causal Mechanism by Which Hypermarket
Retailers Influence Retail Gasoline Prices
The estimations presented in Tables 2 and 3 suggest that the entry or presence of
hypermarket gasoline retailers lowers the aggregate price of gasoline sold to end users. At the
same time, recall that branded retail stations (which constitute the majority of retail sites) operate
under a number of vertical ownership arrangements with refiners. This section explores whether
increased hypermarket penetration affects refiners’ wholesale pricing decisions (which in turn
impact retail prices) and whether these decisions are influenced by the various ownership
structures under which their affiliated retail stations operate.
Upstream refiners supply branded gasoline on a wholesale delivered basis to lessee-
dealer and direct-supplied-open-dealer retail outlets at a contracted price known as the dealer
tank wagon (“DTW”). The DTW includes the cost of transporting the gasoline to the stations as
well as the premium reflecting the refiner/distributor brand name (GAO 2004, p. 73). Refiners
can apply a discount or rebate to the DTW in order to “help the outlets maintain a reasonable
profit margin and compete with the increasing number of retail outlets that price their gasoline
with little or no margin, such as hypermarkets” (U.S. Senate 2002, p. 302).41,42 Without any
discount or rebate applied to the DTW, lessee-dealer or direct-supplied-open-dealer outlets might
41 Meyer & Fischer (2004, p. 26) make a similar observation: “[I]f the Sam’s Club down the road from a lessee dealer puts in gasoline pumps and begins to undercut the branded station, the [refiner] can quickly lower DTW prices to that station, allowing it to remain competitive.” These authors also note that the refiner, because it is a residual claimant on the lessee-dealer’s operations, has an incentive to lower the DTW in such instances in order to protect the stream of lease (rental) payments on the refiner’s property and that doing so is likely to be less costly than an attempt to lower the lease payments. 42 Of course, as an alternative the refiner may simply terminate the retail outlet, although this action would probably constitute more of a long-run response.
16
be severely constrained in their ability to price competitively against hypermarkets (due to the
effect on their retail margins). An integrated refiner’s use of its downstream rivals’ retail prices
(which may be determined in part by the level of localized competition surrounding a given
station) to determine the DTW (and, subsequently, the retail prices and margins realized at its
branded lessee or direct-supplied open-dealer stations)43 is commonly referred to in the industry
as “street-back pricing.”
To examine whether the estimated effect of hypermarket shares on aggregate retail prices
may be working through its affect on (lowering) the DTW, the first three columns of Table 4
present the results of estimating regressions similar in form to Eq. (2) but where the dependent
variable is defined in terms of a “DTW index.” This index is constructed analogously to the retail
price index (i.e., each grade-specific DTW is weighted by its grade-specific share of total prime-
supplier gasoline sales by state). Column (1) of Table 4 only controls for the hypermarket share
variable (i.e., along with the state and year indicators), while Column (2) adds the remaining set
of covariates save for the rack price index. Column (3) then adds the rack price index to the
specification given in Column (2). The rack price index is included to proxy for the opportunity
cost faced by integrated-refiners in choosing to supply their own network of retail stations.
The coefficient estimate on the hypermarket variable is -0.005 in Columns (1) and (2)
and -0.003 in Column (3). These estimates are of the same magnitude as those given in Table 2,
which is consistent with the notion that the estimated retail price effect may be stemming in part
from the influence of hypermarkets on integrated-refiners setting of the DTW assessed to their
lessee and direct-supplied open-dealers.44 Further, each of these estimates is statistically
significant at conventional levels.
43 The margin guarantee can apply to all grades of branded gasoline sold to the lessee-dealer or just to unleaded-regular (U.S. Senate 2002, p. 303). 44 It is worth noting that the incentive for refiners to perturb the DTW charged to their affiliated lessee-dealers and direct-supplied-open-dealers in response to increased retail competition may parallel that pertaining to the internal transfer price on wholesale gasoline refiners assess to their company-operated stations. An investigation conducted by the Washington State Attorney General on potential anticompetitive refiner subsidization of company-operated outlets gathered data for all eight major oil
17
It may be the case, however, that the above findings simply reflect a correlation in the
movement between hypermarket shares and wholesale prices in general (which would cut against
Hypothesis 1). That is, the estimated effect of hypermarket shares on the DTW may simply
reflect an aggregate trend affecting wholesale gasoline prices generally and, therefore, be
spurious. This possibility can be further investigated by considering a counterfactual exercise
that relies on wholesale gasoline prices other than the DTW. The thought experiment underlying
this falsification test is as follows.
Hypothesis 2. Increased hypermarket competition should not exert any effect on wholesale gasoline prices that (unlike the DTW) are not set on a delivered basis.
The EIA reports price data on two types of wholesale gasoline that satisfy the criteria of
Hypothesis 2. The first is the aforementioned wholesale quantities that are sold on a rack basis.
The second is wholesale gasoline sold on a bulk supply basis. Again, rack prices correspond to
wholesale gasoline sales for which title transfers at the terminal. Branded wholesale rack gasoline
is purchased by open-dealers and jobbers, each of whom possess pricing flexibility with regard to
the retail prices assessed at their stations.45 Unbranded wholesale rack gasoline is purchased for
resale by independent outlets that also possess complete discretion in setting the retail prices
charged at their stations.
Bulk supply prices pertain to light (unbranded) petroleum products (e.g., gasoline, diesel,
and jet fuel) that are sold in very large quantities on term-contract or one-time “spot” (i.e.,
individual transaction) basis.46 Bulk shipments are typically transported from refineries to
product storage terminals (where the product is subsequently dispensed into trucks that deliver it
companies in the state over a three-year period and concluded that lessee-dealer outlets paid the same wholesale prices as company-operated stations more than 99% of the time. See Washington State Office of the Attorney General, Final Report to the Washington State Legislature on the Attorney General’s
Investigation of Retail Gasoline Marketing (August 12, 1987). 45 That is, the extent to which their retail prices is “determined” by refiners is less than the extent to which refiners attempt to set the retail prices at their branded company-owned outlets (where the refiner sets the retail prices directly) or their lessee/direct-supplied open-dealer outlets (where the refiner may indirectly “set” the stations’ retail prices through perturbation of the DTW). The EIA rack data (like its retail data) does not report separate branded and unbranded prices, only a volume-weighted average of the two. 46 It is worth noting that the quantity of bulk gasoline sold on a spot basis is small relative to that sold using term contracts.
18
to individual retail gasoline stations) in those markets where there is excess demand.47,48 Many
regions in the U.S. have either no or (at best) limited refining capacity, thereby mitigating the
extent to which these areas can supply enough product to satisfy local market demand
conditions.49 In these areas, bulk supplies of gasoline are transported from more distant refining
centers (most often located in the Gulf Coast region).50
As noted previously, integrated refiners may have some incentive to maintain the
operations of their affiliated lessee-dealers in order to retain the stream of rental payments lessee-
dealers provide for use of the refiners’ brand imaging and property.51 Alternatively, these
refiners might possess somewhat weaker incentives to “protect” the operations of independent or
jobber-supplied stations that compete downstream against their company-owned or branded
lessee-dealer/direct-supplied open-dealer stations. If this is the case, one might not expect the
(unbranded or branded) rack price to be adjusted downward by refiners in response competitive
hypermarket entry downstream (or, at the very least, not to the same extent).52
The price of most bulk supply shipments is determined through bilateral negotiations
between buyers and sellers, and is often determined (at least partially) with reference to
47 See First Amended Complaint of Preliminary Injunction Pursuant to Section 13(b) of the Federal Trade Commission Act, In re Federal Trade Commission v. Paul F. Foster, Western Refining, Inc. and Giant
Industries, Inc. (hereafter First Amended Complaint), Case No. 1:07-cv-00352-JB-ACT, at paragraph 13 (filed April 30, 2007). 48 FTC (2006, p. 29). 49 FTC (2004, p. 205). 50 Transporting wholesale bulk quantities of gasoline via delivery trucks would be prohibitively expensive due to the volume and weight of the product. First Amended Complaint, supra note 45, at paragraph 14. Bulk supply shipments typically involve volumes in excess of 5,000 barrels, and up to more than one million barrels via ocean-going tankers. Id. at paragraph 13. Pipeline shipments of wholesale bulk gasoline are generally in the range of 5,000 to 50,000 barrels. Id. In comparison, tanker trucks (e.g., which deliver wholesale gasoline purchased on a DTW basis to retail gasoline stations) are only capable of carrying about 9,000 gallons of gasoline, or the equivalent of about 200 barrels. Id. at paragraph 15. 51 If some refiner-affiliated retail sites do not generate sufficient profits for the refiner to cover the opportunity costs of maintaining the property, the refiner will have an incentive to sell the property and instead supply gasoline to hypermarkets or other more efficient retail distribution outlets (such as large convenience store chains). However, such behavior may be more of a long-term response. 52 Refiners do occasionally offer unobserved competitive allowances to jobbers, perhaps because jobbers may also face periods of elevated retail competition at their stations. However, it is unknown how extensive these allowances are (either in size or duration, although they are more likely than not to be short-term arrangements) and, in any event, they would not be reflected in the rack price reported by the EIA (since the allowances are typically discounts off the posted rack price).
19
(plus/minus) differentials relative to spot prices of petroleum products traded on futures markets.
As such, the market price of bulk supply gasoline is unlikely to share any direct relation with the
DTW save for common market-wide demand or cost shocks that affect both wholesale price
levels. All else equal, hypermarket penetration is unlikely to have a direct material impact on the
prices for bulk petroleum products.
Columns (4) and (5) of Table 4 present the rack price index and average bulk price
regressions, respectively. The coefficient estimate on in the rack price
regression is negative but smaller in magnitude (-0.002) than it is for either DTW index
regressions and not statistically significant at conventional levels. The estimated coefficient on
the hypermarket share variable is also statistically insignificant in the average bulk price
regression and takes a positive sign. One possible explanation for this finding may be that
hypermarkets, given their volumes, are likely to make frequent purchases of bulk wholesale
gasoline on various term contracts (with delivery taken at terminal sites). Thus the observed
positive (but still statistically insignificant) coefficient estimate may be the result of a demand-
enhancing effect of increased hypermarket penetration on bulk gasoline supplies. However, this
result and interpretation should be taken as tentative since bulk prices are only available for a
subset of states (which reduces the number of observations available for estimation by over half).
Keeping this caveat in mind, the results of these wholesale price regressions are taken as being
principally consistent with Hypothesis 2.
, 1% s tHypermarket -
Another way in which to test whether the estimated competitive influence of
hypermarkets is in fact operating through wholesale pricing changes at integrated retail stations is
considered in the following hypothesis.
Hypothesis 3. If increased hypermarket competition causes integrated stations to lower their prices, then there should be no independent effect of hypermarket penetration on retail gasoline prices when also controlling for the DTW.
The thought experiment behind Hypothesis 3 is similar to that underlying a test of the
“exogeneity” of an instrumental variable in a just-identified simultaneous equations model (i.e.,
20
one in which there is one instrument and one endogenous regressor). If the structural equation is
correctly specified, then the instrument should have no ability to explain variation in the
dependent variable that is not otherwise already explained by the endogenous variables in a
regression that controls for both sets of regressors (Davidson and MacKinnon 2003, p. 235). In
the present context, if the price-reducing effect of hypermarket penetration is being effectuated
(indirectly) through its impact on DTW pricing by integrated refiners, then changes in state
hypermarket shares are effectively functioning as an “instrument” in explaining variation in DTW
prices across states through time. Thus, in a regression that adds the DTW price index directly
into Eq. (1) the coefficient estimate should be zero. b̂
Column (6) of Table 4 presents the results of estimating the latter regression. When
controlling for the DTW price index, the coefficient estimate pertaining to the hypermarket
penetration variable is both small in magnitude (coefficient estimate = -0.001) and statistically
insignificant (t-statistic = 0.91). This finding supports Hypothesis 3 and provides further
evidence that the estimated competitive influence of hypermarket retailers may be effectuated
through the adjustment in the DTW by refiners in order to protect the margins of their
downstream retail affiliates.
Finally, lessee-dealer outlets comprise a relatively larger share of all retail gasoline
station types within states on the West Coast. In 2001, stations receiving wholesale gasoline on a
DTW-basis comprised 50.1 percent of all retail gasoline stations located within “PADD V”53
(which includes Alaska, Arizona, California, Hawaii, Nevada, Oregon, and Washington) versus
an unweighted average of 10.1 percent across all other PADDs.54 The considerable geographic
53 See FTC (2004, tbl. 9-2) (“Refiner Disposition of Gasoline by Class of Trade, 1994-2002 (% by Class)”). 54 The individual states comprising PADDs I-IV are as follows: PADD I (Connecticut, Delaware, District of Columbia, Florida, Georgia, Maine, Maryland, Massachusetts, New Hampshire, New Jersey, New York, North Carolina, Pennsylvania, Rhode Island, South Carolina, Vermont, Virginia, West Virginia); PADD II (Illinois, Indiana, Iowa, Kansas, Kentucky, Michigan, Minnesota, Missouri, Nebraska, North Dakota, Ohio, Oklahoma, South Dakota, Tennessee, Wisconsin); PADD III (Alabama, Arkansas, Louisiana, Mississippi, New Mexico, Texas); PADD IV (Colorado, Idaho, Montana, Utah, Wyoming). As of 2001, the proportion of DTW-taking stations within the remaining PADDs is as follows: PADD I (20.5%); PADD II (8.9%); PADD III (3.1%); PADD IV (7.7%). Id.
21

variation in the prevalence of DTW-taking stations across PADDs allows for another test of
whether the competitive impact of hypermarkets is operating through refiner-controlled DTW
levels. Consider the following regression:
s t s t s t
s t s t
s t s t
s t s t
s t s t
s t s t s t
DTW Hypermarket PADD I
Hypermarket PADD II
Hypermarket PADD III
Hypermarket PADD IV
Hypermarket PADD V
X
, 1 , 1
2 , 1
3 , 1
4 , 1
5 , 1
, ,
(% )
(% )
(% )
(% )
(% )
a x
x
x
x
x
q l e
-
-
-
-
-
= + ´
+ ´
+ ´
+ ´
+ ´
¢+G + + +
,
,
,
,
,
(3)
where s tDTW , denotes the aforementioned “DTW index” and , is an indicator
variable that takes a value of one for those states located in PADD Y, Y I . All other
variables are as defined previously. The coefficient parameters given by the terms in Eq.
s tPADD Y ,
= V{ , , }
x (3)
give the PADD-specific impacts of hypermarket penetration on the DTW.
Hypothesis 4. If increased hypermarket competition causes integrated stations to lower their
prices through changes in the DTW, then j5x x> for j 5< due to the relatively larger
proportion of DTW-taking stations in PADD V.
Table 5 presents the results of estimating Eq. (3). Column (1) includes only the five
hypermarket-PADD interaction variables while Column (2) adds the covariates in . Column
(3) then adds the variable to the set of independent variables in Column (2). Of
the 15 separate estimated coefficients on the hypermarket-PADD interaction variables, 10 (or 67
percent) carry the hypothesized negative sign. None of the positive coefficient estimates on these
terms is statistically significant at conventional levels (the largest corresponding t-statistic is only
0.58). As expected, the estimate of is negative, statistically significant, and the largest in
magnitude across the five interaction-term estimates in each specification.
s tX ,
s,tRetailGrowth
5x
It is also worth noting that the estimate is substantively (i.e., two- to roughly three-times)
larger than the (aggregate) estimates on presented in Columns (1)-(3) of s tHypermarkets , 1% -
22
Table 4. This result would be expected if hypermarkets did in fact influence retail prices by
affecting the wholesale delivered gasoline prices assessed by refiners to lessee-dealer/direct-
supplied-open-dealer stations – the effect on the DTW should be greater where these stations in a
given area comprise a higher share of all ownership types. As such, the results presented in Table
4 are taken as supporting Hypothesis 4.
A seemingly surprising result is that pertaining to PADD IV; the estimate of is always
statistically significant and ranges between -0.008 and -0.007. However, this result may be
attributable to the relatively high proportion of company-operated stations in PADD IV (21.3
percent), which (as of 2001, measured across all PADDs) is second only to PADD V (22.8
percent).
4x
55 Recall that the incentive for integrated refiners to lower the DTW to protect the retail
margins of their affiliated lessee-dealer or direct-supply-open-dealer stations may be similar to
their incentive to lower the unobservable transfer price on wholesale gasoline assessed on their
affiliated company-operated stations.56 Thus, despite the relatively low proportion of DTW-
taking stations in PADD IV, the relatively high proportion of company-operated stations located
therein might explain the estimated effects on the DTW.
5. Motor Fuel Sales-Below-Cost Laws and Hypermarket Retailers
Economists have traditionally been skeptical of the efficacy of predatory pricing schemes
to harm competition. Nonetheless, several states have passed statutes (some dating back to the
1930s and, in most instances, probably motivated primarily to protect small businesses) that
prohibit the so-called practice of “pricing below cost.” In some states, these laws pertain to
below-cost pricing generally, while other states subsequently adopted sales-below-cost (“SBC”)
laws that apply specifically to gasoline retailing.
55 Id. 56 See supra note 44.
23
Hypermarket retailers – in particular, mass merchandisers such as Wal-Mart – have been
sued on occasion under the allegation of pricing below cost to drive out smaller competing
retailers.57 Not surprisingly, these hypermarket retailers are among the strongest lobbyists
against the enactment of SBC laws, including those specifically related to gasoline retailing.58
Most studies on the competitive effects of motor fuel SBC laws have generally concluded that
they do not benefit consumers, i.e., they tend to raise retail gasoline prices (Fenili & Lane 1985,
Anderson & Johnson 1999, Brannon & Kelly 1999). One possible explanation for the price
increase is that firms engaging in low, non-predatory pricing may charge higher prices in order to
avoid the potential of risk of litigation.59 In contrast, Skidmore et al. (2005) find that motor fuel
SBC laws lower average retail prices by one cent five years after they are put into place. Vita
(2002), however, found that these laws had no significant impact on retail prices.
The results of the previous section suggest that hypermarket penetration benefits
consumers in that it lowers average retail gasoline prices. However, to the extent that motor fuel
SBC laws tend to raise retail gasoline prices, the beneficial effects of hypermarket competition
may be somewhat offset in those states with such laws in place. To explore this possibility,
consider the following regression:
, 1 , 1
2 , 1
3 ,
, ,
(% )
(% )
( )
s t s t
s t s t
s t
s t s t s t
P Hypermarket
Hypermarket Motor Fuel SBC Law
Motor Fuel SBC Law
X
a b
b
b
q l e
-
-
= +
+ ´
+
¢¢+G + + +
,
(4)
57 See, e.g., Wal-Mart Stores v. American Drugs Inc. No. 94-235, Supreme Court of Arkansas, 319 Ark. 214; 891 S.W. 2d 30; Crest Foods Sues Wal-Mart Claiming Predatory Pricing, THE OKLAHOMA CITY
JOURNAL RECORD, September 28, 2000, available at <http://findarticles.com/p/articles/mi_qn4182/ is_20000928/ai_n10138957/>; Newsrules.org, Wal-Mart Settles Predatory Pricing Charge, available at
<http://www.newrules.org/retail/news/walmart-settles-predatory-pricing-charge>. 58 See, e.g., Newsrules.org, Wal-Mart Joins Oil Refiner to Overturn Fla. Predatory Pricing Law, November 1, 2000, available at <http://www.newrules.org/retail/news/walmart-joins-oil-refiner-overturn-fla-predatory-pricing-law>. 59 Letter from Ted Cruz, Jerry Ellig, and Joseph Simons, U.S. Federal Trade Commission, to The Honorable Robert F. McDonnel, Commonwealth of Virginia (February 15, 2002) (on file).
24

where is an indicator of whether state s has a law in effect during year
.
s tMotor Fuel SBC Law ,
3b
t 60 All other variables are as defined as previously. The estimated value of gives the impact
of increased hypermarket penetration in those states that have adopted motor fuel SBC laws while
that of provides the independent impact of such laws on retail gasoline prices.
2b
Hypothesis 5. If motor fuel SBC laws tend to offset the benefits of increased hypermarket
penetration in those states that have enacted such laws, then and 1 0b < 2 0.b > The net effect of hypermarkets on retail gasoline prices (i.e., in states with motor fuel SBC laws)
is determined by the relative magnitudes of the estimated values of and . For example, if
, , and
1b 2b
1̂ 0b < 2̂ 0b > 1̂b = 2̂b
, then the net price-reducing effect from increased hypermarket
competition in the presence of such laws would be zero (all else equal). But, of course, even in
this case it may still be possible for motor fuel SBC laws to “directly” benefit consumers if they
themselves impart downward pressure on average retail gasoline prices (e.g., the law could also
affect the pricing behavior of non-hypermarket gasoline retailers), which would imply .3 0b < 61
Table 6 presents the results of estimating alternative specifications of Eq. (4). The
regressions presented in Columns (1)-(3) do not consider the potential independent effect of
motor fuels SBC laws (i.e., the variable is not included in these
specifications). Column (1) controls for only the hypermarket share measure and the interaction
term. Column (2) then adds the covariates in used in estimation of Eq. (1). Column (3) then
adds to the set of regressors in Column (2).
s tMotor Fuel SBC Law ,
s tX ,
s,tRetailGrowth
The estimated effects of largely mirror those found before. Without
controlling for any of the covariates in , the estimated value of is -0.005 , which falls to
-0.003 when the covariates are added. These coefficient estimates are always statistically
s tHypermarket , 1-
s tX , 1b
60 The dating of the enactment of state motor fuel SBC laws is taken from Skidmore et al. (2005). 61 A negative estimated coefficient on the stand-alone motor fuels SBC law indicator might reflect the long-run effect these mandates exert on preserving retail competition (i.e., preventing predatory behavior).
25
significant at conventional levels. The coefficient on in Column (3) is again
negative and statistically significant. The coefficient estimates on the interaction term in Eq.
s,tRetailGrowth
s tw ,
Motor Fuel SBC
(4),
while imprecisely estimated, are all positive. The magnitudes of the estimated interaction
coefficients imply that the benefits to hypermarket competition may be substantially mitigated in
states that adopt motor fuel SBC laws. Specifically, these laws could offset (on a per-gallon basis)
the consumer benefits of hypermarket competition by $0.002, or by 40 percent, in Column (1)
and by 67 percent in Columns (2) and (3). These findings are consistent with the fact that there is
a negative correlation between the extent of hypermarket penetration and the presence of a motor
fuel SBC law within a state.62
Columns (4)-(6) of Table 6 are similar in form to Columns (1)-(3), respectively, except
that they each add the variable . The estimated coefficients on the
hypermarket share and hypermarket-SBC law interaction measures are of the same magnitude as
before, with the former being statistically significant at conventional levels. Again, these results
provide some evidence that motor fuel SBC laws may dampen the benefits of increased
hypermarket competition. The coefficient estimate on is positive in
Column (4) but turns negative in Columns (5) and (6). However, in each instance the estimate is
statistically insignificant, with the t-statistics in the latter two specifications being particularly
low. These findings support Vita (2000), who found no effect of such laws on retail gasoline
prices.
Motor Fuel SBC La
s tLaw ,
6. Consumer Surplus
It is well understood that even small price change can have appreciable impacts on
consumer welfare if they occur in relatively “large” markets (such as gasoline retailing)
62 The simple correlation coefficient between the contemporaneous (lagged) hypermarket share and the motor fuels SBC law variable is -0.097 (-0.11). A Newey-West regression of the contemporaneous share on the law variable (while also controlling for state and year fixed effects) results in a coefficient estimate of -1.48 (t-statistic = -2.80).
26
(Borenstein and Gilbert 1993). Using aggregate national retail gasoline sales data from the EIA
for 2002, it is possible to estimate the increase in consumer surplus arising from the lower
average state-level retail gasoline prices stemming from increased hypermarket gasoline sales as
estimated above.
Formally, the change (gain) in aggregate consumer surplus resulting from a price
decrease from 0P to 1P is given by
1 0
0 0 1 10 0
( ) ( ) ( ) ( )Q Q
CS P P Q dQ P Q dQ PQ PQD = - + -ò ò (5)
where ( )P Q Q h-= denotes the (constant-elasticity) inverse market demand curve for retail
gasoline, h the absolute own-price elasticity of demand for retail gasoline, the quantity
of gasoline sold in the U.S. in ,
0 0Q >
2002t = 63 and 0 0P > the average value of the retail gasoline
price index described in Eq. (1) for . Based on the estimates from Table 1, a one-
standard-deviation increase in the retail hypermarket share is predicted to decrease the average
per gallon retail gasoline price by approximately $0.004. Let this effect be denoted by
2002t =
PD .
Then
1 0P P P P= + D < 0 (6)
denotes the average market price per gallon of gasoline prevailing after a one-standard deviation
increase in hypermarket retail share (i.e., measured relative to the “initial” average market price).
The change in the quantity of gasoline demanded associated with a (discrete) change of PD (i.e.,
away from the initial price of 0P ) is then
00
PQ
PhD
D = - Q
0
. (7)
The corresponding predicted change in the equilibrium quantity demanded is given by
. (8) 1 0Q Q Q Q= + D >
63 The aggregate quantities employed in the calculations correspond to the EIA’s prime supplier sales volumes, which are summed across all grades/formulations and measured in terms of total annual gallons sold per year.
27
A recent paper by Hughes et al. (2007) estimates the short-run price own price-elasticity
of demand for gasoline in the U.S. to lie between -0.034 and -0.077. For conservativeness, the
largest estimate is employed in the following calculations (i.e., = -0.077). Solving for Eqs. h (6)-
(8) and substituting the resulting values into Eq. (5) gives
( ) $ 487,623,687CS PD » .
Thus, a one-standard-deviation increase in state hypermarket share is estimated to result in a gain
to consumer surplus (measured in constant 2002 dollars) of approximately $488 million.64
7. Conclusion
Determining the impact of hypermarket gasoline retailing on market prices has gone
largely unexamined. The results presented herein suggest that a one-standard-deviation increase
in the share of state gasoline sales made through hypermarkets will result in gasoline prices that
are on average $0.004 per gallon lower and an increase in (average) annual consumer surplus of
at least $448 million. The estimates also imply a large effect on the net retail margins earned by
traditional stations, which is consistent with previous evidence on the industry-wide impact of
hypermarket competition. Further, it appears that the market-wide pricing pressure exerted by
hypermarkets at the retail level is effectuated in part by forcing refiners to lower the wholesale
delivered price of gasoline they assess to some of their affiliated retail outlets (in order to protect
retail margins). Finally, there is some evidence that hypermarket penetration is curbed by the
presence of state motor fuels SBC laws and that these laws reduce the competitive impact of
hypermarkets in the retail gasoline industry.
Future research would benefit by considering more granular data on particular incidents
of hypermarket entry, and the resultant impact on retail prices charged at surrounding gasoline
stations, in order to ascertain the more localized competitive impact of hypermarkets. It would
64 If the average estimate of -$0.003 from the alternative specification presented in Table 3 is used instead, the gain in consumer surplus would amount to roughly $364 million (in constant 2002 dollars).
28
also be useful to examine whether the imposition of membership fees by some hypermarkets
(e.g., club stores) exerts a differential price effect on competing outlets relative to hypermarkets
that do not impose such fees (e.g., grocery stores). More granular data could also be used to more
fully investigate the potential differential competitive impact of hypermarkets across traditional
unbranded and branded retail gasoline stations, and whether or not the presence of the amenities
made available but some traditional stations (e.g., service bays, convenience stores, car washes,
etc.) help to alleviate the business-stealing effect of hypermarkets and its apparent impact on
retail margins.
The competitive pressure exerted by hypermarkets in the retail gasoline industry may
have some role in the recent large-scale exit of branded marketers in the U.S. It would be
interesting to determine if this has led to further “long-run” reductions in aggregate prices if the
total proportion of sales made through hypermarket sales has increased as a result. On the other
hand, the loss of these branded (and possibly unbranded) competitors may provide hypermarkets
less incentive to price gasoline at their historically low levels. Alternatively, if there is little or
no long-run effect on hypermarket behavior, such a finding might support the notion that these
firms do in fact view gasoline primarily as a promotional device to stimulate higher-margin in-
store sales, a possibility that (at present) can only be regarded as speculative.
29
References
Alm, James, Edward Sennoga, and Mark Skidmore (2009), Perfect competition, urbanization, and tax incidence in the retail gasoline market, Economic Inquiry 47: 118-134.
Anderson, R. and R. Johnson (1999), Antitrust and sales-below-cost laws: The case of retail
gasoline, Review of Industrial Organization 14: 189-204. Basker, Emek (2005), Selling a cheaper mousetrap: Wal-Mart’s effect on retail prices, Journal of
Urban Economics 58: 203-229. Bertrand, Marianne; Esther Duflo; and Senhil Mullainathan (2004), How much should we
trust difference-in-difference estimates?, Quarterly Journal of Economics 109: 249-275. Borenstein, Severin and Richard Gilbert (1993), Uncle Sam at the gas pump: Causes and
consequences of regulating gasoline distribution, Regulation 16: 63-75.
Brannon, J. and F. Kelly (1999), Pumping up prices in Wisconsin: The effects of the unfair sales
act on retail gasoline prices in Wisconsin, Wisconsin Policy Research Institute Report. Chouinard, Hayley H. and Jeffery M. Perloff (2007), Gasoline price differences: Taxes,
pollution regulations, mergers, market power, and market conditions, Contributions to
Economic Analysis and Policy 7: article 8. Davidson, Russell and James G. MacKinnon (1993), Estimation and inference in econometrics,
Oxford University Press: New York. Deltas, George (2008), Asymmetries in retail gasoline price dynamics and local market
power, Journal of Industrial Economics LVI: 613-628. Evans, William N.; Luke M. Froeb; and Gregory J. Werden (1993), Endogeneity in the
concentration-price relationship: causes, consequences, and cures, Journal of Industrial
Economics 41: 431-438. Fenili, Robert N. and William C. Lane (1985), Thou shalt not cut prices! Sales-below-cost laws
for gas stations, Regulation 9: 31-35. FTC (2004), The petroleum industry: Mergers, structural change, and antitrust enforcement,
Bureau of Economics Staff Report, U.S. Federal Trade Commission: Washington, DC. FTC (2005), Gasoline price changes: The dynamics of supply, demand, and competition,
Staff Report, U.S. Federal Trade Commission: Washington, DC. FTC (2006), Investigation of gasoline price manipulation and post-Katrina gasoline price
increases, U.S. Federal Trade Commission: Washington, DC. GAO (2004), Effects of mergers and market concentration in the U.S. petroleum industry,
Report GAO-04-96, U.S. General Accounting Office: Washington, DC.
30

Gauthier-Villars, David (2004), Hypermarkets pump up the volume: Retailers’ rock-bottom
gasoline prices force big oil companies to shut service stations, WALL STREET JOURNAL
EUROPE (October 4, 2004), available at
<http://shellnews.net/2004 percent20Documents/nopodds/october_shell_news.htm>. Gold, Russel (2008), Conoco plans deal to sell rest of its gas stations, WALL STREET JOURNAL
ONLINE (August 27, 2008), available at
<http://www.vpcga.com/files/public/ConocoSellsGasStations.pdf>. Hendricks, Kenneth and R. Preston McAfee (2006), A theory of bilateral oligopoly, working
paper. Horsley, Scott (2009), Gas stations profit from more than just gas, available at
<http://www.npr.org/templates/story/story.php?storyId=10733468>. Hughes, Jonathan E., Christopher R. Knittel, and Daniel Sperling (2008), Evidence of a shift in
the short-run price elasticity of gasoline demand, Energy Journal 29: 93-114. Meyer, David W. and Jeffery H. Fischer (2004), The economics of price zones and territorial
restrictions in gasoline marketing, FTC Bureau of Economics Working Paper No. 271, available at < http://www.ftc.gov/be/workpapers/wp271.pdf>.
Newey, Whitney K. and Kenneth D. West (1987), A simple, positive definite, heteroskedasticity
and autocorrelation consistent covariance matrix, Econometrica 55: 703-708. Oller, Samantha (2004), Hypermarket update – Latest data demonstrates extent of the low-
margin, high volume onslaught, available at
<http://www.cspnet.com/Media/PublicationsArticle/hypermarket_update.pdf>. Poole, Lisa (2008), Exxon Mobil getting out of retail gas biz: Oil company plans to sell company-
owned stations to branded distributors (June 12, 2008), available at
<http://www.cbsnews.com/stories/2008/06/12/business/main4177867.shtml>. Reuters (2001), Gas stations facing threat from superstores (July 17, 2001), available at
<www.reuters.com>. Simpson, John and Christopher T. Taylor (2008), Do gasoline mergers affect consumers’ prices?
The Marathon-Ashland and UDS transaction, Journal of Law and Economics 51: 135-152.
Skidmore, Mark, James Peltier, and James Alm (2005), Do state motor fuel sales below-cost laws
lower prices? Journal of Urban Economics 57: 189-211. Taylor, Christopher T. and Daniel S. Hosken (2007), The economic effects of the Marathon-
Ashland joint venture: The importance of industry supply shocks and vertical market structure, Journal of Industrial Economics LV: 419-451.
U.S. Senate (2002), Gas prices: How are they really set?, Report Prepared by the Majority
Staff of the Permanent Subcommittee on Investigations: Washington, DC.
31

32
Vita, Michael G. (2000), Regulatory restrictions on vertical integration and control: The competitive impact of gasoline divorcement policies, Journal of Regulatory Economics 18: 217-233.
Volpe, Richard J. III and Nathalie Lavoie (2006), The effect of Wal-Mart supercenters on
grocery prices in New England, University of Massachusetts-Amherst, Department of Resource Economics, Working Paper No. 2006-8.

Source: NPD Motor Fuels Index.
Figure 1
Percent of Retail Gasoline Sales in the U.S. Made Through Hypermarket Channels
(1997 - 2002)
0.0%
1.0%
2.0%
3.0%
4.0%
5.0%
1997 1998 1999 2000 2001 2002
Year

Sample
Mean
Standard
Deviation Minimum Maximum Source
Retail Price Index 0.90 0.16 0.60 1.25 U.S. Energy Information
Adminstration (various
years)
% Hypermarket (t -1) 1.54 2.15 0.00 11.20 NPD Motor Fuels Index
(various years)
Rack Price Index 0.76 0.17 0.47 1.08 U.S. Energy Information
Adminstration (various
years)
Per-capita Income 24211.94 3449.23 17593.00 35801.00 U.S. Bureau of Economic
Analysis, Regional
Economic Information
System (various years)
Population 5.83E+06 6.21E+06 4.91E+05 3.50E+07 U.S. Bureau of Economic
Analysis, Regional
Economic Information
System (various years)
Wage 16.14 2.80 10.80 24.42 U.S. Bureau of Economic
Analysis, Regional
Economic Information
System (various years)
Per-capita Vehicles 0.83 0.13 0.48 1.21 U.S. Federal Highway
Administration, Highway
Statistics (various years)
Population Density 185.85 252.36 5.05 1156.22 U.S. Bureau of Economic
Analysis, Regional
Economic Information
System (various years)
[population]; U.S. Census
Bureau [land area]
% Ages 65+ 12.72 1.64 8.50 18.30 U.S. Census Bureau,
Statistical Abstract of the
United States (various
years)
RFG II 0.20 0.40 0.00 1.00 U.S. Environmental
Protection Agency
Table 1
Descriptive Statistics and Sources
Notes: Figures correspond to annual state-level observations over the years 1998-2002 (N = 240). The
notation (t -1) denotes the once-lagged value.
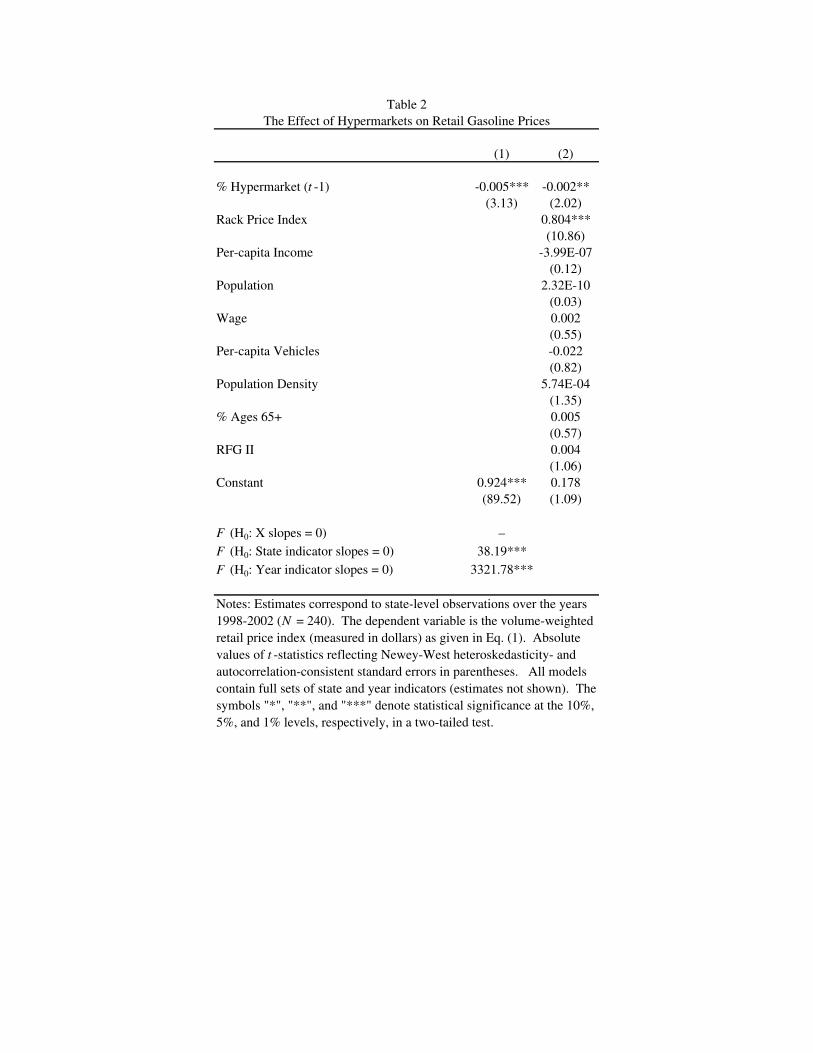
(1) (2)
% Hypermarket (t -1) -0.005*** -0.002**
(3.13) (2.02)
Rack Price Index 0.804***
(10.86)
Per-capita Income -3.99E-07
(0.12)
Population 2.32E-10
(0.03)
Wage 0.002
(0.55)
Per-capita Vehicles -0.022
(0.82)
Population Density 5.74E-04
(1.35)
% Ages 65+ 0.005
(0.57)
RFG II 0.004
(1.06)
Constant 0.924*** 0.178
(89.52) (1.09)
F (H0: X slopes = 0) –
F (H0: State indicator slopes = 0) 38.19***
F (H0: Year indicator slopes = 0) 3321.78***
Table 2
The Effect of Hypermarkets on Retail Gasoline Prices
Notes: Estimates correspond to state-level observations over the years
1998-2002 (N = 240). The dependent variable is the volume-weighted
retail price index (measured in dollars) as given in Eq. (1). Absolute
values of t -statistics reflecting Newey-West heteroskedasticity- and
autocorrelation-consistent standard errors in parentheses. All models
contain full sets of state and year indicators (estimates not shown). The
symbols "*", "**", and "***" denote statistical significance at the 10%,
5%, and 1% levels, respectively, in a two-tailed test.
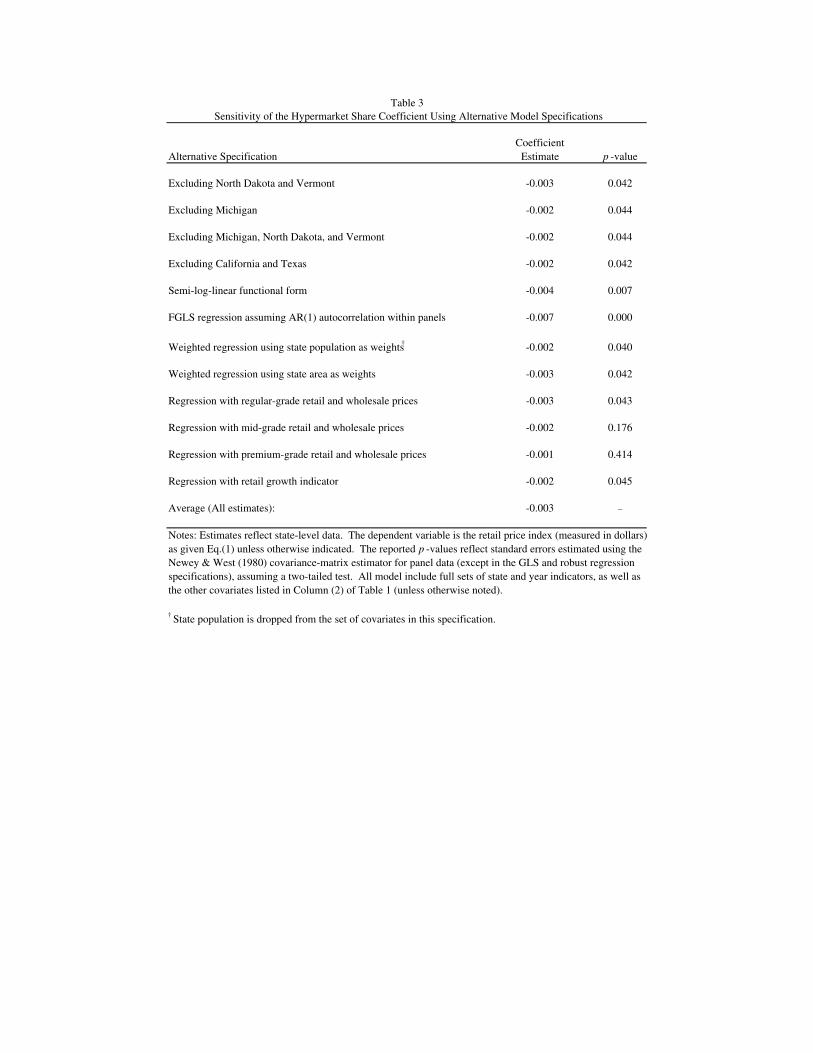
Alternative Specification
Coefficient
Estimate p -value
Excluding North Dakota and Vermont -0.003 0.042
Excluding Michigan -0.002 0.044
Excluding Michigan, North Dakota, and Vermont -0.002 0.044
Excluding California and Texas -0.002 0.042
Semi-log-linear functional form -0.004 0.007
FGLS regression assuming AR(1) autocorrelation within panels -0.007 0.000
Weighted regression using state population as weights†
-0.002 0.040
Weighted regression using state area as weights -0.003 0.042
Regression with regular-grade retail and wholesale prices -0.003 0.043
Regression with mid-grade retail and wholesale prices -0.002 0.176
Regression with premium-grade retail and wholesale prices -0.001 0.414
Regression with retail growth indicator -0.002 0.045
Average (All estimates): -0.003 –
† State population is dropped from the set of covariates in this specification.
Table 3
Sensitivity of the Hypermarket Share Coefficient Using Alternative Model Specifications
Notes: Estimates reflect state-level data. The dependent variable is the retail price index (measured in dollars)
as given Eq.(1) unless otherwise indicated. The reported p -values reflect standard errors estimated using the
Newey & West (1980) covariance-matrix estimator for panel data (except in the GLS and robust regression
specifications), assuming a two-tailed test. All model include full sets of state and year indicators, as well as
the other covariates listed in Column (2) of Table 1 (unless otherwise noted).

(1) (2) (3) (4) (5) (6)
DTW index DTW index DTW index Rack price index Average bulk price Retail price index
% Hypermarket (t -1) -0.005** -0.005** -0.003** -0.002 0.005 -0.001
(2.54) (2.36) (2.29) (1.34) (1.31) (0.91)
Per-capita Income -1.64E-06 -2.88E-06 1.21E-06 1.71E-05 1.97E-06
(0.35) (0.77) (0.38) (1.40) (0.58)
Population 6.55E-09 3.58E-09 3.34E-09 -9.77E-09 -8.09E-09
(0.53) (0.41) (0.31) (0.34) (1.02)
Wage -1.56E-03 -0.003 1.91E-03 -0.003 0.004
(0.31) (0.73) (0.54) (0.21) (1.29)
Per-capita Vehicles 0.01 -0.004 0.017 0.322* -0.017
(0.23) (0.11) (0.73) (1.81) (0.77)
Population Density -0.001* 5.41E-04 -0.002*** -8.28E-04 -2.32E-04
(1.87) (1.20) (5.16) (0.60) (0.66)
% Ages 65+ -8.02E-03 0.016* -2.541E-02*** 0.008 -0.014**
(0.72) (1.72) (3.30) (0.23) (2.04)
RFG II 0.029*** 0.013** 0.018*** 4.739E-04 0.003
(4.92) (2.57) (4.22) (0.03) (0.57)
Rack Price Index 0.874***
(10.09)
DTW Price Index 0.640***
(12.76)
Constant 0.867*** 1.079*** 0.037 1.170*** -0.381 0.516***
(133.80) (5.38) (0.19) (7.90) (0.67) (3.63)
N 237 237 237 240 100 237
F (H0: X slopes = 0) - 3.90*** 20.19*** 5.10*** 1.20 28.36***
F (H0: State indicator slopes = 0) 49.74*** 22.43*** 13.11*** 29.33*** 22.59*** 20.15***
F (H0: Year indicator slopes = 0) 3140.81*** 1205.52*** 5.06*** 2513.33*** 144.85*** 25.97***
Table 4
The Effect of Hypermarket Competition on Wholesale Gasoline Prices
Dependent Variable
Notes: Estimates correspond to state-level observations over the years 1998-2002 . The dependent variables are the volume-weighted price indices (measured in dollars) as
described in the text. Absolute values of t -statistics reflecting Newey-West heteroskedasticity- and autocorrelation-consistent standard errors in parentheses. All models
contain full sets of state and year indicators (estimates not shown). The symbols "*", "**", and "***" denote statistical significance at the 10%, 5%, and 1% levels,
respectively, in a two-tailed test.
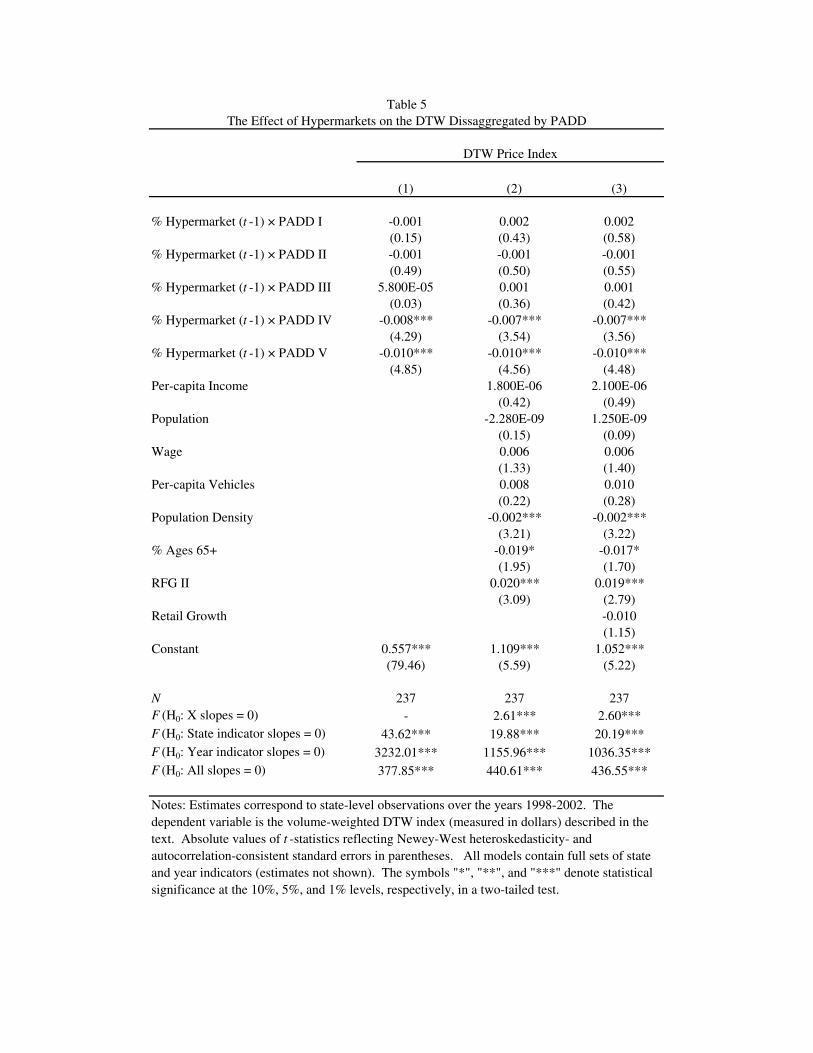
(1) (2) (3)
% Hypermarket (t -1) × PADD I -0.001 0.002 0.002
(0.15) (0.43) (0.58)
% Hypermarket (t -1) × PADD II -0.001 -0.001 -0.001
(0.49) (0.50) (0.55)
% Hypermarket (t -1) × PADD III 5.800E-05 0.001 0.001
(0.03) (0.36) (0.42)
% Hypermarket (t -1) × PADD IV -0.008*** -0.007*** -0.007***
(4.29) (3.54) (3.56)
% Hypermarket (t -1) × PADD V -0.010*** -0.010*** -0.010***
(4.85) (4.56) (4.48)
Per-capita Income 1.800E-06 2.100E-06
(0.42) (0.49)
Population -2.280E-09 1.250E-09
(0.15) (0.09)
Wage 0.006 0.006
(1.33) (1.40)
Per-capita Vehicles 0.008 0.010
(0.22) (0.28)
Population Density -0.002*** -0.002***
(3.21) (3.22)
% Ages 65+ -0.019* -0.017*
(1.95) (1.70)
RFG II 0.020*** 0.019***
(3.09) (2.79)
Retail Growth -0.010
(1.15)
Constant 0.557*** 1.109*** 1.052***
(79.46) (5.59) (5.22)
N 237 237 237
F (H0: X slopes = 0) - 2.61*** 2.60***
F (H0: State indicator slopes = 0) 43.62*** 19.88*** 20.19***
F (H0: Year indicator slopes = 0) 3232.01*** 1155.96*** 1036.35***
F (H0: All slopes = 0) 377.85*** 440.61*** 436.55***
Table 5
The Effect of Hypermarkets on the DTW Dissaggregated by PADD
DTW Price Index
Notes: Estimates correspond to state-level observations over the years 1998-2002. The
dependent variable is the volume-weighted DTW index (measured in dollars) described in the
text. Absolute values of t -statistics reflecting Newey-West heteroskedasticity- and
autocorrelation-consistent standard errors in parentheses. All models contain full sets of state
and year indicators (estimates not shown). The symbols "*", "**", and "***" denote statistical
significance at the 10%, 5%, and 1% levels, respectively, in a two-tailed test.
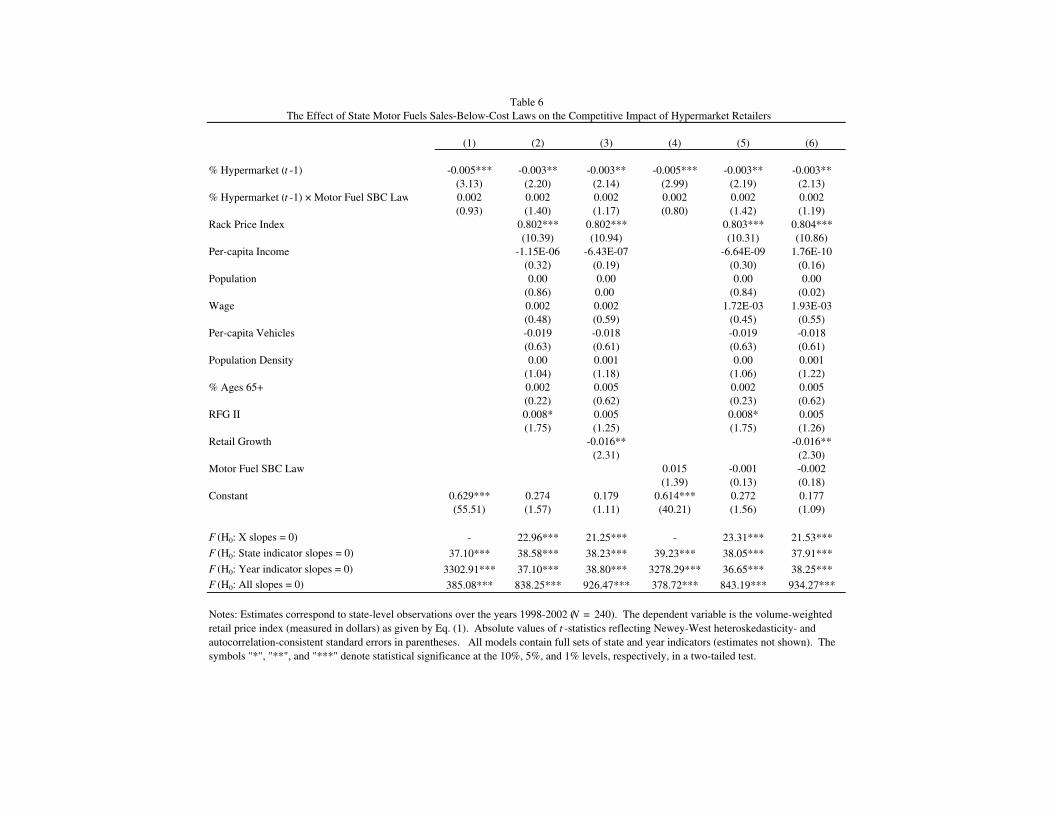
(1) (2) (3) (4) (5) (6)
% Hypermarket (t -1) -0.005*** -0.003** -0.003** -0.005*** -0.003** -0.003**
(3.13) (2.20) (2.14) (2.99) (2.19) (2.13)
% Hypermarket (t -1) × Motor Fuel SBC Law 0.002 0.002 0.002 0.002 0.002 0.002
(0.93) (1.40) (1.17) (0.80) (1.42) (1.19)
Rack Price Index 0.802*** 0.802*** 0.803*** 0.804***
(10.39) (10.94) (10.31) (10.86)
Per-capita Income -1.15E-06 -6.43E-07 -6.64E-09 1.76E-10
(0.32) (0.19) (0.30) (0.16)
Population 0.00 0.00 0.00 0.00
(0.86) 0.00 (0.84) (0.02)
Wage 0.002 0.002 1.72E-03 1.93E-03
(0.48) (0.59) (0.45) (0.55)
Per-capita Vehicles -0.019 -0.018 -0.019 -0.018
(0.63) (0.61) (0.63) (0.61)
Population Density 0.00 0.001 0.00 0.001
(1.04) (1.18) (1.06) (1.22)
% Ages 65+ 0.002 0.005 0.002 0.005
(0.22) (0.62) (0.23) (0.62)
RFG II 0.008* 0.005 0.008* 0.005
(1.75) (1.25) (1.75) (1.26)
Retail Growth -0.016** -0.016**
(2.31) (2.30)
Motor Fuel SBC Law 0.015 -0.001 -0.002
(1.39) (0.13) (0.18)
Constant 0.629*** 0.274 0.179 0.614*** 0.272 0.177
(55.51) (1.57) (1.11) (40.21) (1.56) (1.09)
F (H0: X slopes = 0) - 22.96*** 21.25*** - 23.31*** 21.53***
F (H0: State indicator slopes = 0) 37.10*** 38.58*** 38.23*** 39.23*** 38.05*** 37.91***
F (H0: Year indicator slopes = 0) 3302.91*** 37.10*** 38.80*** 3278.29*** 36.65*** 38.25***
F (H0: All slopes = 0) 385.08*** 838.25*** 926.47*** 378.72*** 843.19*** 934.27***
Table 6
The Effect of State Motor Fuels Sales-Below-Cost Laws on the Competitive Impact of Hypermarket Retailers
Notes: Estimates correspond to state-level observations over the years 1998-2002 (N = 240). The dependent variable is the volume-weighted
retail price index (measured in dollars) as given by Eq. (1). Absolute values of t -statistics reflecting Newey-West heteroskedasticity- and
autocorrelation-consistent standard errors in parentheses. All models contain full sets of state and year indicators (estimates not shown). The
symbols "*", "**", and "***" denote statistical significance at the 10%, 5%, and 1% levels, respectively, in a two-tailed test.