
The Co-operative Revolution has begun
61
The Co-operative Revolution has begun –and you are part of it! OSCA November 10, 2012
Transcript of The Co-operative Revolution has begun
The Co-operative Revolution has begun –and you are part of it!
OSCA November 10, 2012
Your Presenter
Peter Cameron
Co-op Development Manager
Ontario Co-operative Association
www.ontario.coop
1-888-745-5521
519-763-8271 ext. 23
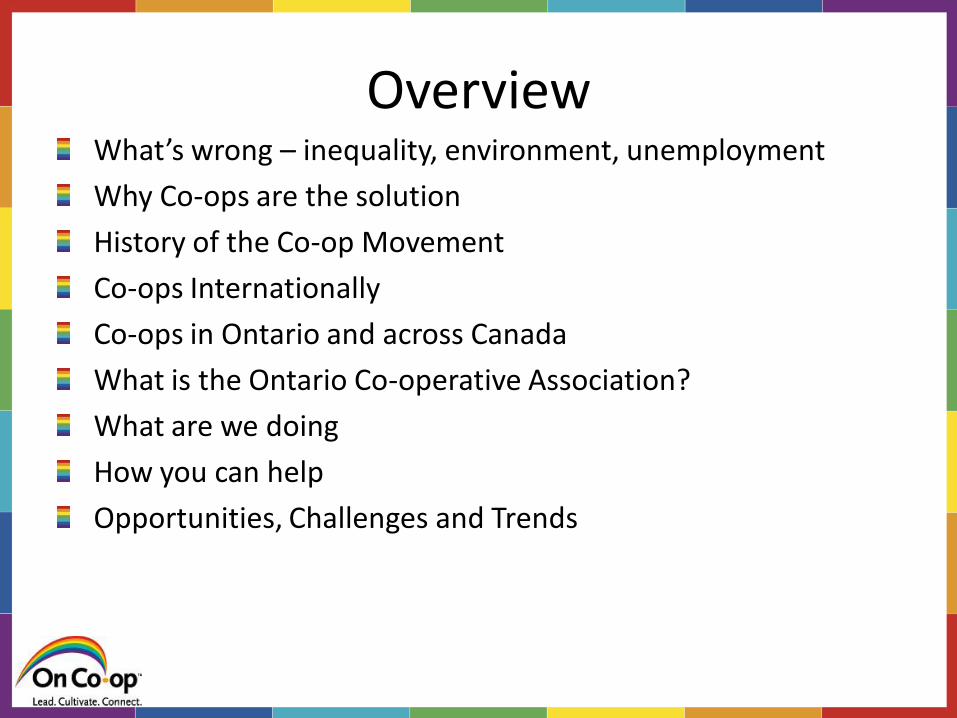
Overview What’s wrong – inequality, environment, unemployment
Why Co-ops are the solution
History of the Co-op Movement
Co-ops Internationally
Co-ops in Ontario and across Canada
What is the Ontario Co-operative Association?
What are we doing
How you can help
Opportunities, Challenges and Trends

Editorial cartoon by Brian Gable
(The Globe and Mail, June 4, 2012)


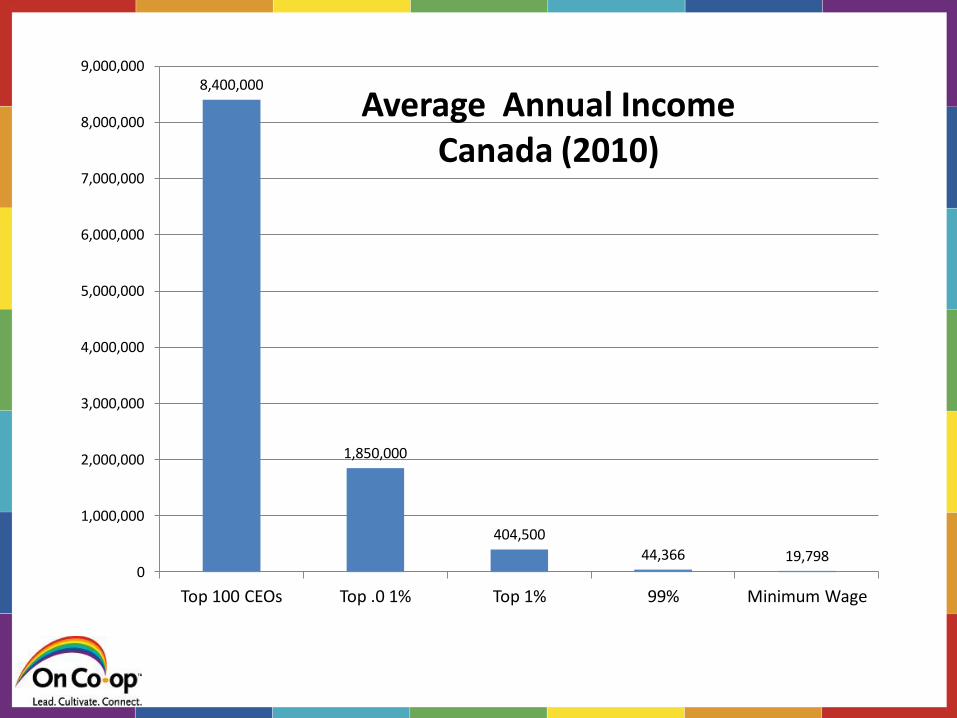
8,400,000
1,850,000
404,500
44,366 19,798 0
1,000,000
2,000,000
3,000,000
4,000,000
5,000,000
6,000,000
7,000,000
8,000,000
9,000,000
Top 100 CEOs Top .0 1% Top 1% 99% Minimum Wage
Average Annual Income Canada (2010)

The lowest stage of humanity is experienced when the individual must labour for a small pittance of wages from others.
Robert Owen (1771 to 1858)
From a Paper Dedicated to the Governments of
Great Britain, Austria, Russia, France, Prussia and
the United States of America, London (1841)

Source: Economic Policy Institute, “Wages and Compensation Stagnating,”
2011, based on US Bureau of Labor Statistics data. Figures are for production and non-supervisory workers.
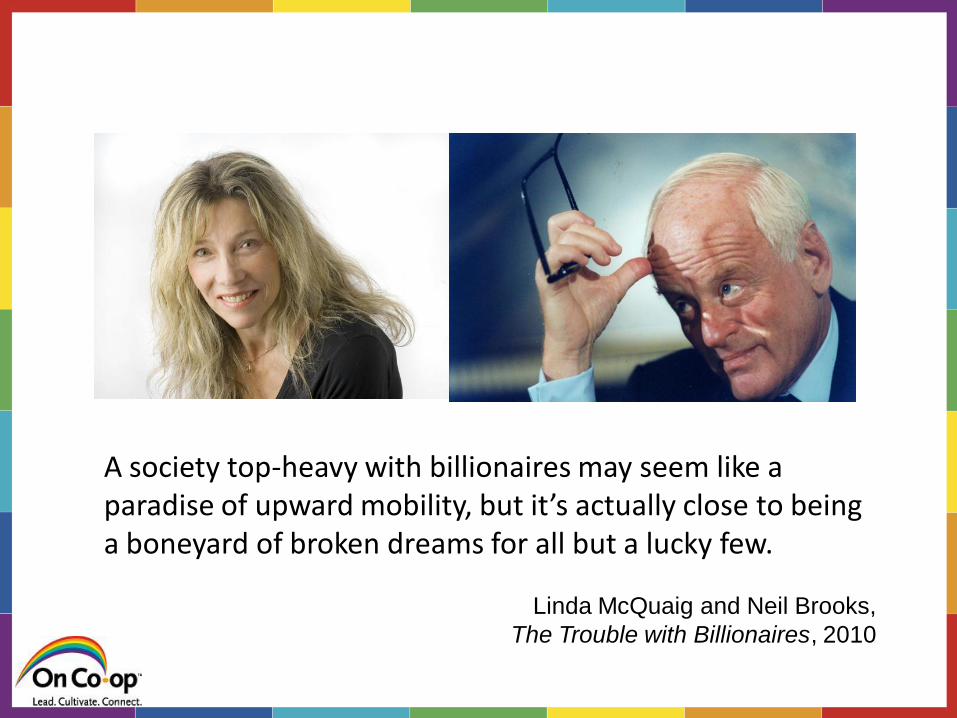
A society top-heavy with billionaires may seem like a paradise of upward mobility, but it’s actually close to being a boneyard of broken dreams for all but a lucky few.
Linda McQuaig and Neil Brooks,
The Trouble with Billionaires, 2010

0
5
10
15
20
25
30
19
20
19
23
19
26
19
29
19
32
19
35
19
38
19
41
19
44
19
47
19
50
19
53
19
56
19
59
19
62
19
65
19
68
19
71
19
74
19
77
19
80
19
83
19
86
19
89
1992
19
95
19
98
20
01
2004
20
07
20
10
Top 1% Income Share (Percentage of national income)
Canada
USA
Sweden

1,200,000
18,880 18,260
0
200,000
400,000
600,000
800,000
1,000,000
1,200,000
1,400,000
Top 100 CEO Pension Public Pension Low income cut-off
Average Annual Pension $ CAN
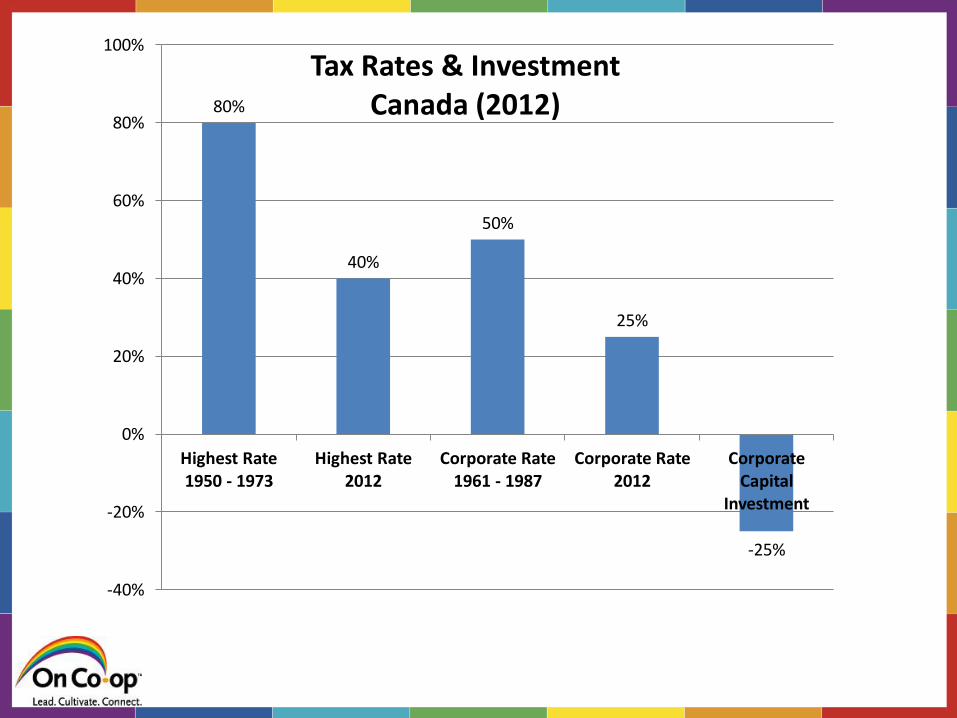
80%
40%
50%
25%
-25%
-40%
-20%
0%
20%
40%
60%
80%
100%
Highest Rate 1950 - 1973
Highest Rate 2012
Corporate Rate 1961 - 1987
Corporate Rate 2012
Corporate Capital
Investment
Tax Rates & Investment Canada (2012)
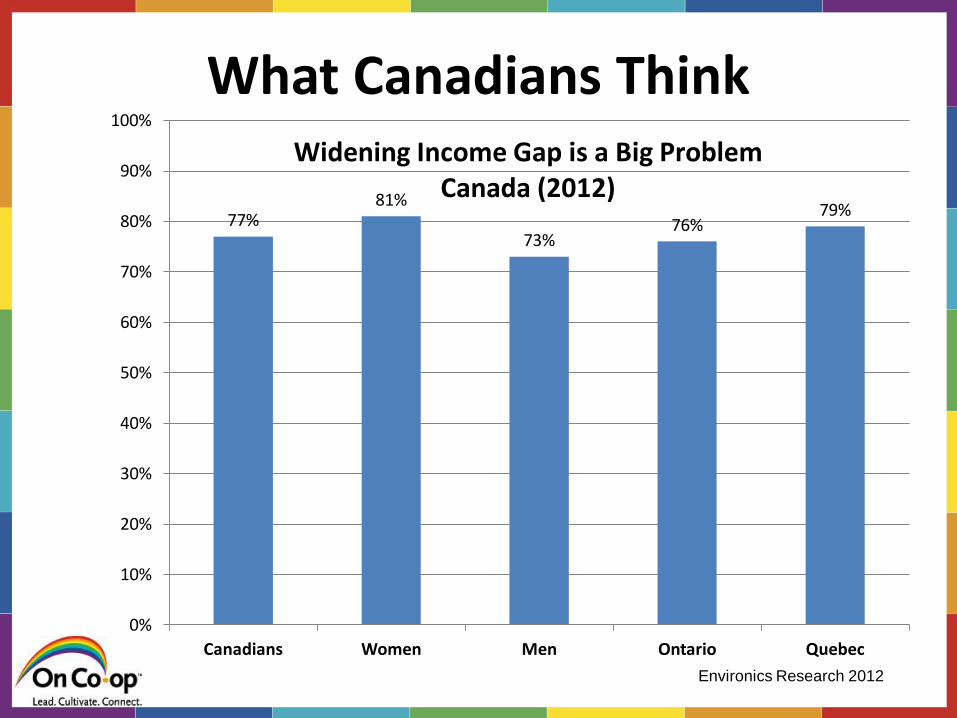
77% 81%
73% 76%
79%
0%
10%
20%
30%
40%
50%
60%
70%
80%
90%
100%
Canadians Women Men Ontario Quebec
Widening Income Gap is a Big Problem Canada (2012)
Environics Research 2012
What Canadians Think
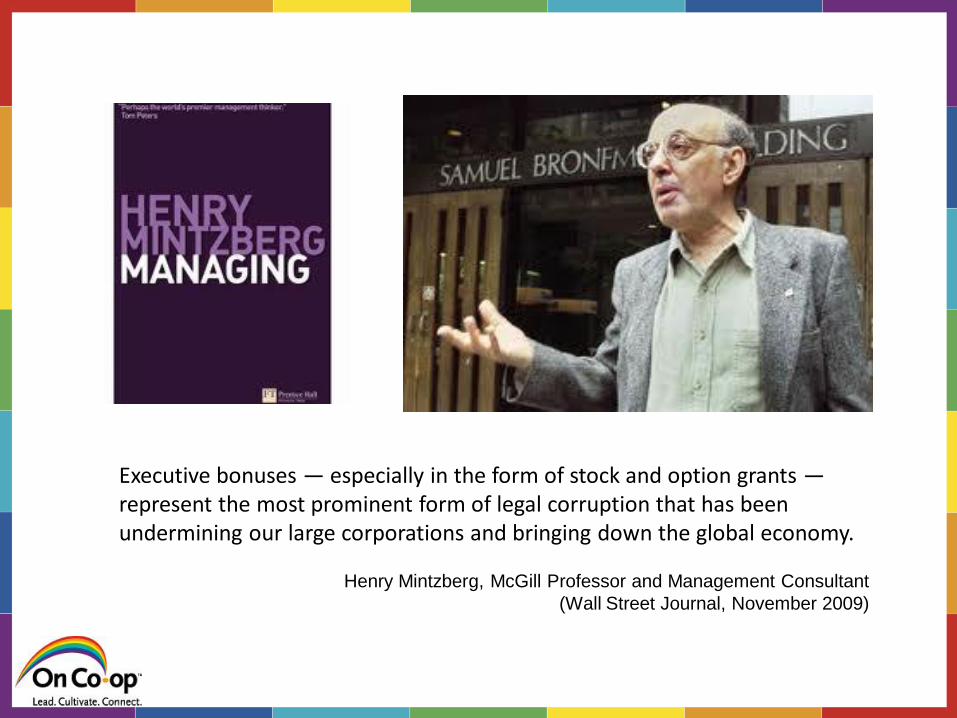
Executive bonuses — especially in the form of stock and option grants —represent the most prominent form of legal corruption that has been undermining our large corporations and bringing down the global economy.
Henry Mintzberg, McGill Professor and Management Consultant
(Wall Street Journal, November 2009)
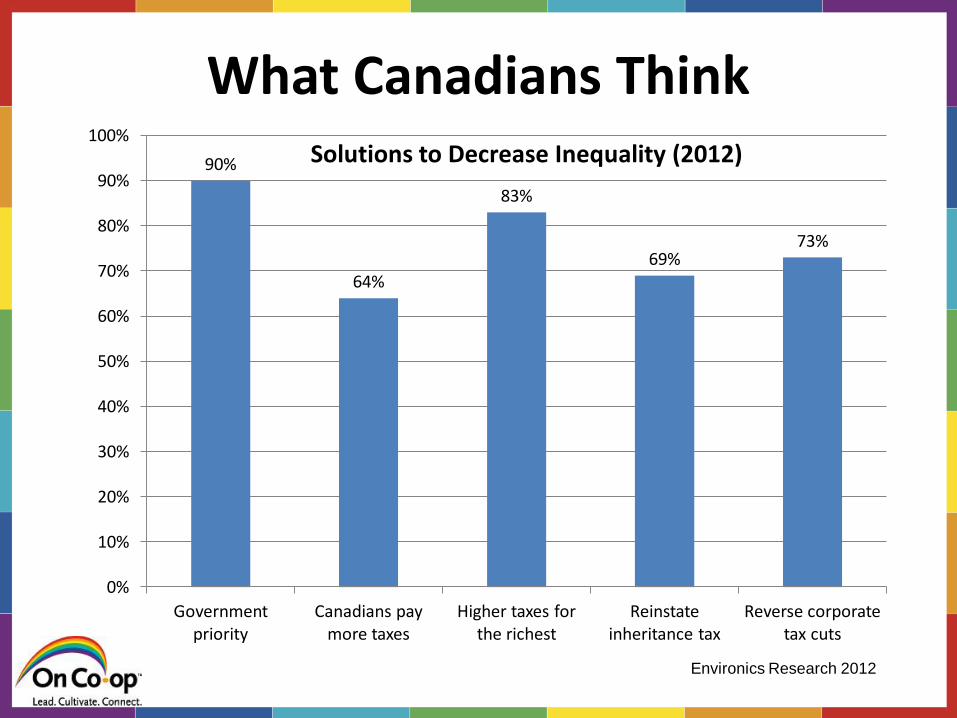
90%
64%
83%
69% 73%
0%
10%
20%
30%
40%
50%
60%
70%
80%
90%
100%
Government priority
Canadians pay more taxes
Higher taxes for the richest
Reinstate inheritance tax
Reverse corporate tax cuts
Solutions to Decrease Inequality (2012)
Environics Research 2012
What Canadians Think

The hard fact is that our tax system is in such ill repair and ill repute that avoiding or evading tax has become respectable.
Tom Kent served as principal assistant to
Prime Minister Lester Pearson
(Globe and Mail, January 8, 2010)
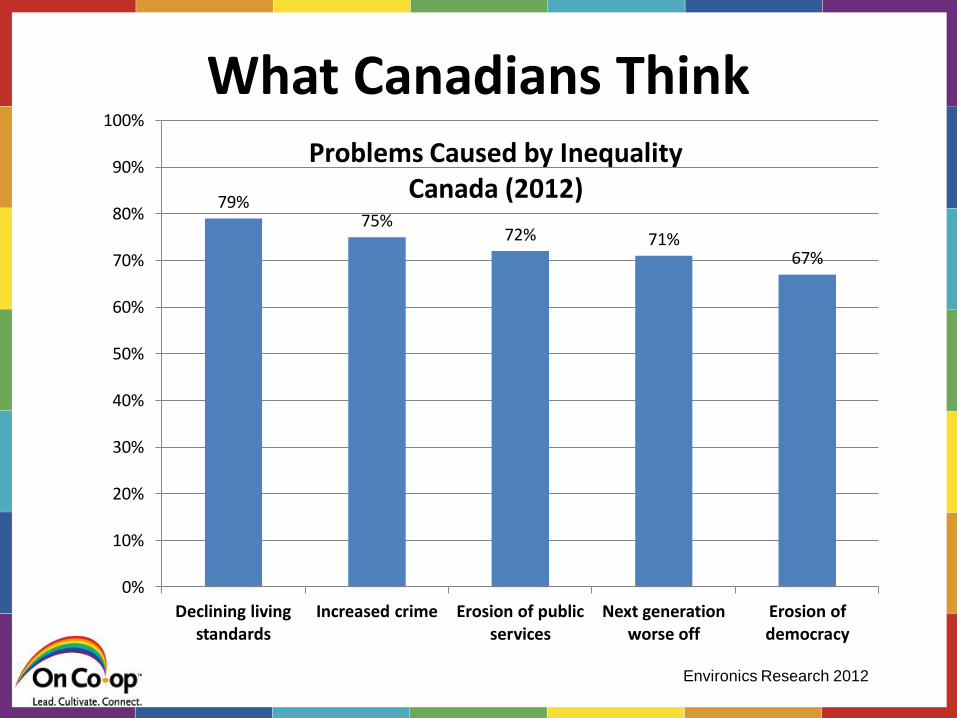
79% 75%
72% 71% 67%
0%
10%
20%
30%
40%
50%
60%
70%
80%
90%
100%
Declining living standards
Increased crime Erosion of public services
Next generation worse off
Erosion of democracy
Problems Caused by Inequality Canada (2012)
Environics Research 2012
What Canadians Think

Robert Gumpertz (USA., 2012)
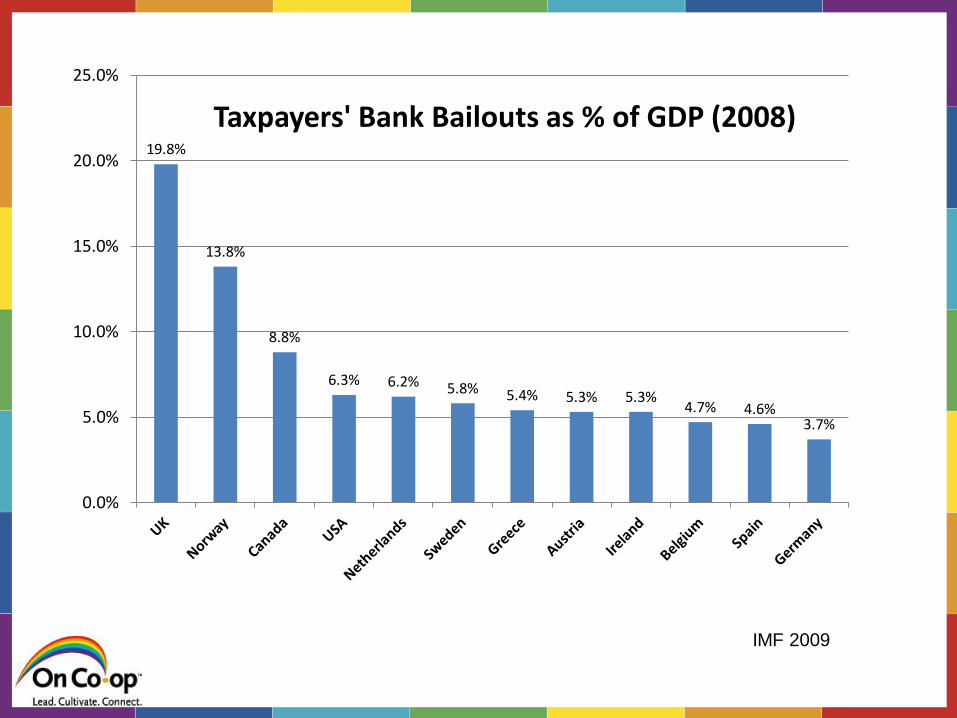
IMF 2009
19.8%
13.8%
8.8%
6.3% 6.2% 5.8% 5.4% 5.3% 5.3% 4.7% 4.6%
3.7%
0.0%
5.0%
10.0%
15.0%
20.0%
25.0%
Taxpayers' Bank Bailouts as % of GDP (2008)
Globe and Mail Report on Business, 2012
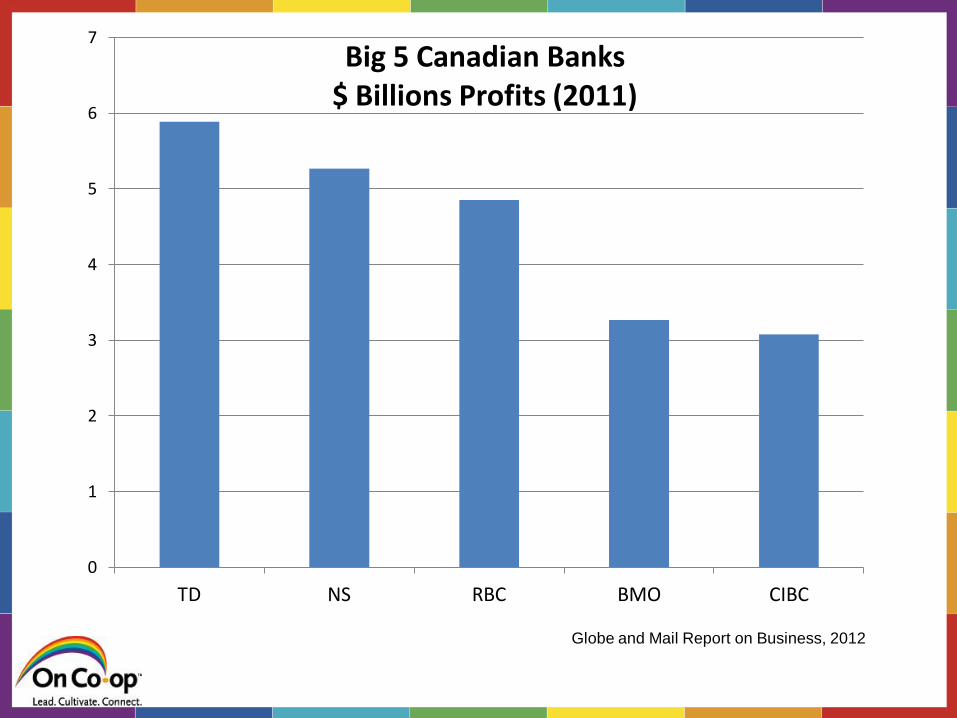
0
1
2
3
4
5
6
7
TD NS RBC BMO CIBC
Big 5 Canadian Banks $ Billions Profits (2011)

Report by the Commission on the Measurement of Economic Performance and Social Progress (Sept. 14, 2009)
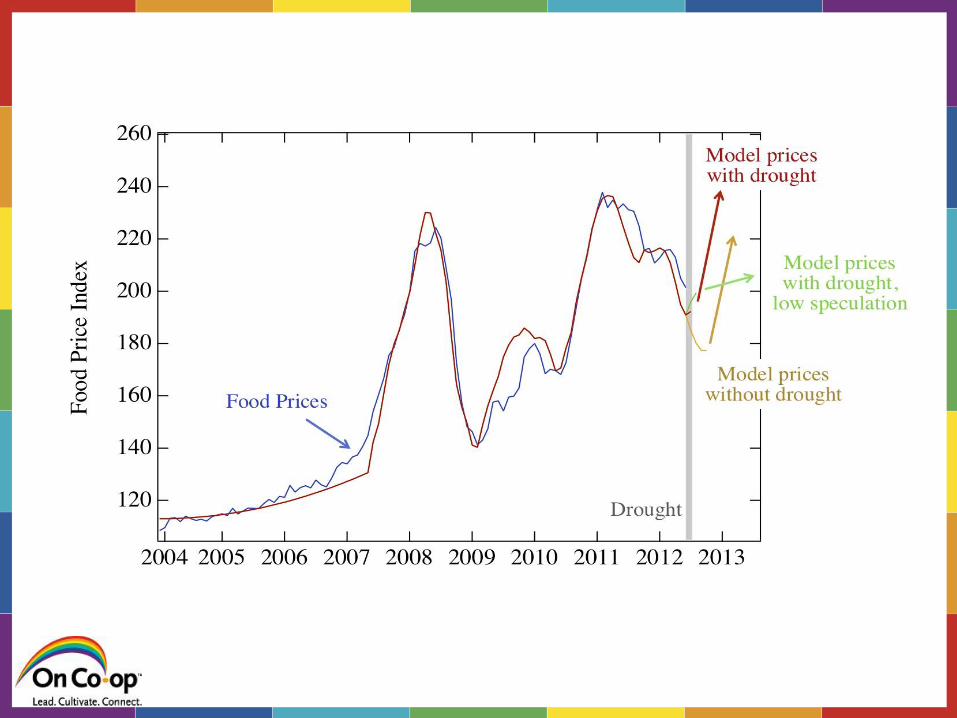
We are now living one of the worst financial, economic and social crises in post-war history. The whole Commission is convinced that the crisis is teaching us a very important lesson: those attempting to guide the economy and our societies are like pilots trying to steer a course without a reliable compass. We are also facing a looming environmental crisis, especially associated with global warming. Market prices are distorted by the fact that there is no charge imposed on carbon emissions; and no account is made of the cost of these emissions in standard national income accounts. The key message, and unifying theme of the report, is that the time is ripe for our measurement system to shift emphasis from measuring economic production to measuring people’s well-being. And measures of well-being should be put in a context of sustainability.
Joseph Stigliz,
Nobel Prize Winning Economist

S. Ashmarin (Russia, 2008)

Spruce bark beetle damage in Alaska
caused by climate chaos drought
Images: Gary Braasch ©
Argentina's Upsala Glacier Rhone glacier in Valais, Switzerland
Cape Hatteras in North Carolina;
Hurricane & higher water level
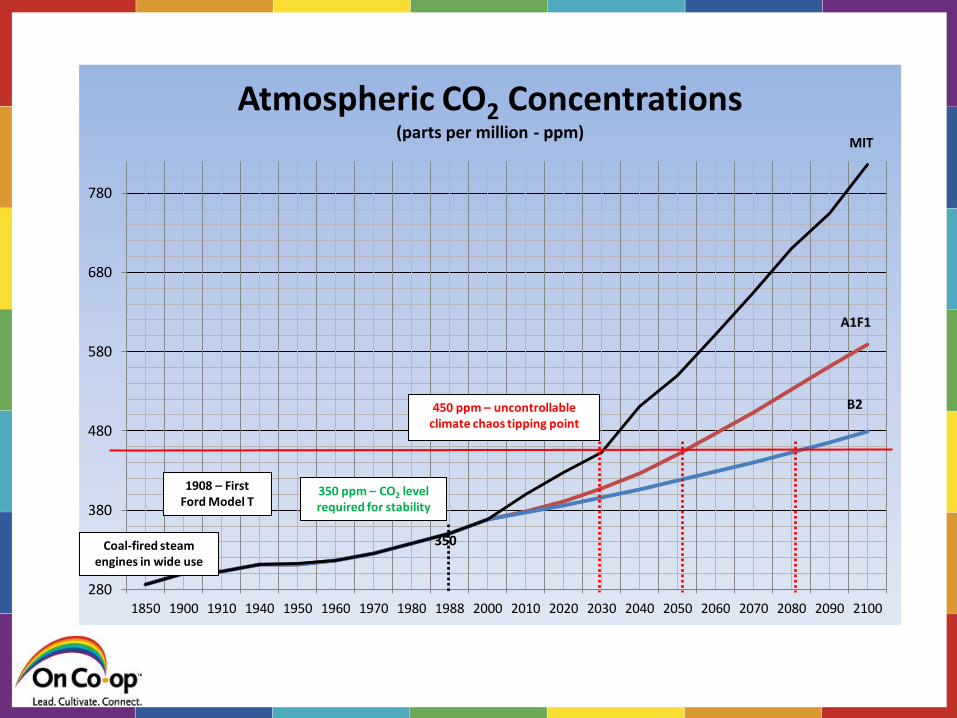
546 ppm – CO2 level estimated by US EIA
450 ppm – uncontrollable climate chaos tipping point
350 ppm – CO2 level required for stability
1908 – First Ford Model T
Coal-fired steam engines in wide use
280
380
480
580
680
780
1850 1900 1910 1940 1950 1960 1970 1980 1988 2000 2010 2020 2030 2040 2050 2060 2070 2080 2090 2100
Atmospheric CO2 Concentrations (parts per million - ppm)
450 ppm – uncontrollable climate chaos tipping point
350 ppm – CO2 level required for stability
1908 – First Ford Model T
Coal-fired steam engines in wide use
350
MIT
A1F1
B2

Climate Chaos Scenarios
MIT Scenarios Uses the world’s current development path and determines the associated energy and climate implications. Incorporates 2020 emissions reduction targets G20 nations made at the 2009 UN Framework Convention on Climate Change (i.e. Copenhagen pledges), showing how far these pledges take us, and what is at risk if we fail to push beyond these goals. A1FI Emissions Scenarios A future world of very rapid economic growth, low population growth and rapid introduction of new and more efficient technology. Major underlying themes are economic and cultural convergence and capacity building, with a substantial reduction in regional differences in per capita income. In this world, people pursue personal wealth rather than environmental quality. B2 Emissions Scenarios A world in which the emphasis is on local solutions to economic, social, and environmental sustainability. It is again a heterogeneous world with less rapid, and more diverse technological change but a strong emphasis on community initiative and social innovation to find local, rather than global solutions.

As Charles Darwin said, “The economy shown by Nature in her resources is striking. All wealth comes from Nature. Without it, there wouldn't be any economics.”
Margaret Atwood,
Payback: Debt and the
Shadow Side of Wealth
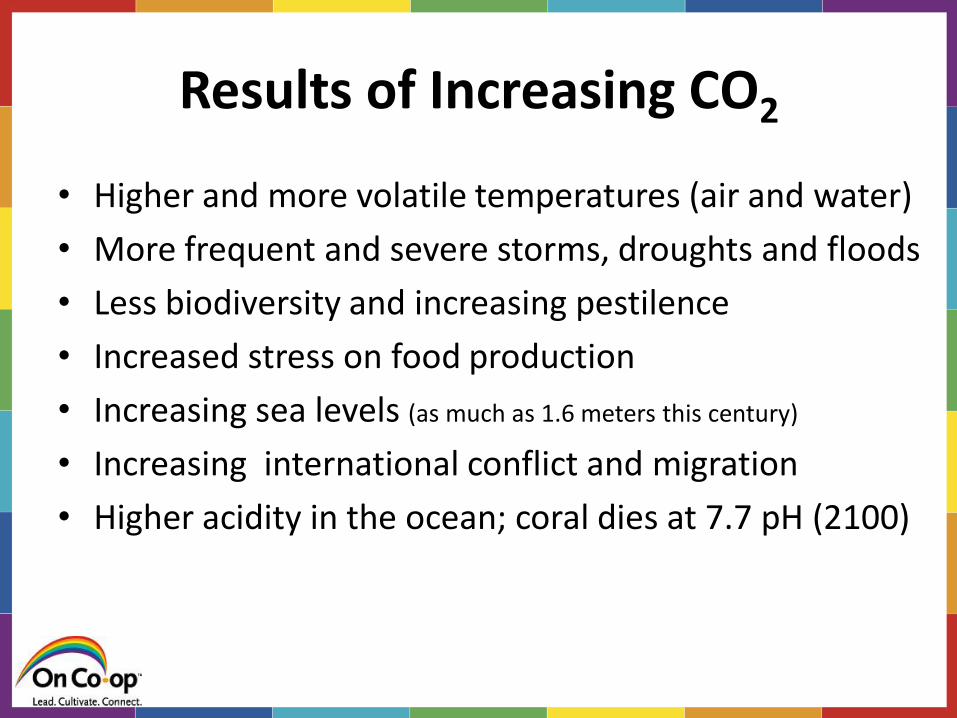
Results of Increasing CO2
• Higher and more volatile temperatures (air and water)
• More frequent and severe storms, droughts and floods
• Less biodiversity and increasing pestilence
• Increased stress on food production
• Increasing sea levels (as much as 1.6 meters this century)
• Increasing international conflict and migration
• Higher acidity in the ocean; coral dies at 7.7 pH (2100)

Co-ops Are Making a Difference !

A Co-operative is . . .
An autonomous association of persons united voluntarily to meet their common economic, social, and cultural needs and aspirations through a jointly-owned and democratically-controlled enterprise.
Co-ops Around the World
One billion people
25% increase since 2007
Driven by principles and values
100 million jobs
Examples of Co-ops - Co-operators Insurance
- Desjardins Credit Union
- Mountain Equipment Co-op
- Gay Lea Dairy
- Organic Meadow Dairy
- OSCA – Student Co-ops!
- La Siembra –Cocoa Camino Fair Trade Co-op
- Co-op Cabs
-Co-operative Housing Federation of Canada
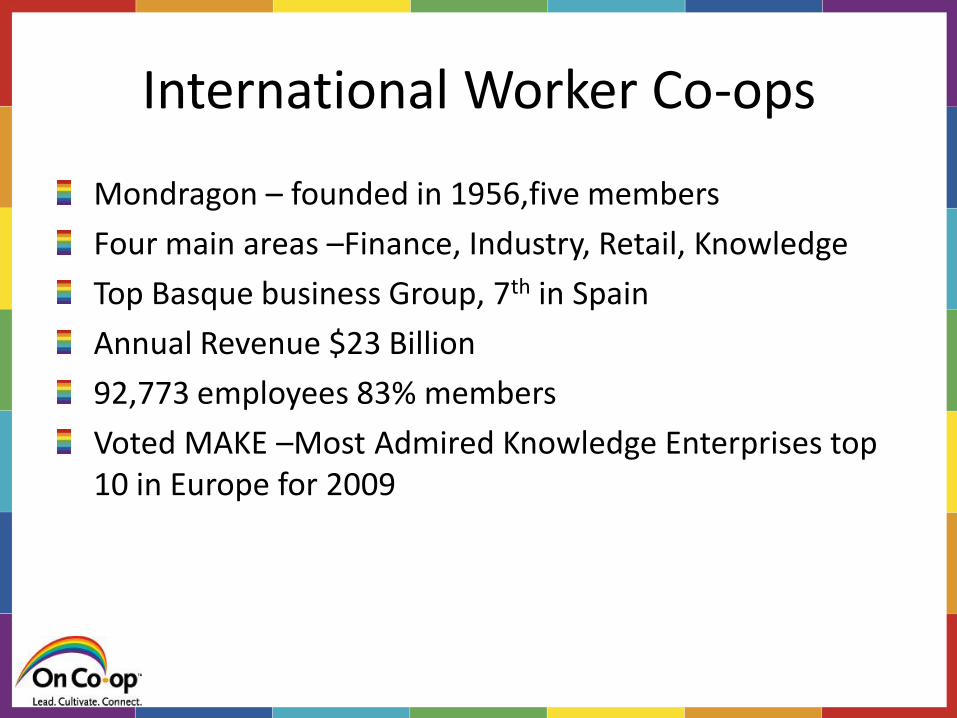
International Worker Co-ops
Mondragon – founded in 1956,five members
Four main areas –Finance, Industry, Retail, Knowledge
Top Basque business Group, 7th in Spain
Annual Revenue $23 Billion
92,773 employees 83% members
Voted MAKE –Most Admired Knowledge Enterprises top 10 in Europe for 2009
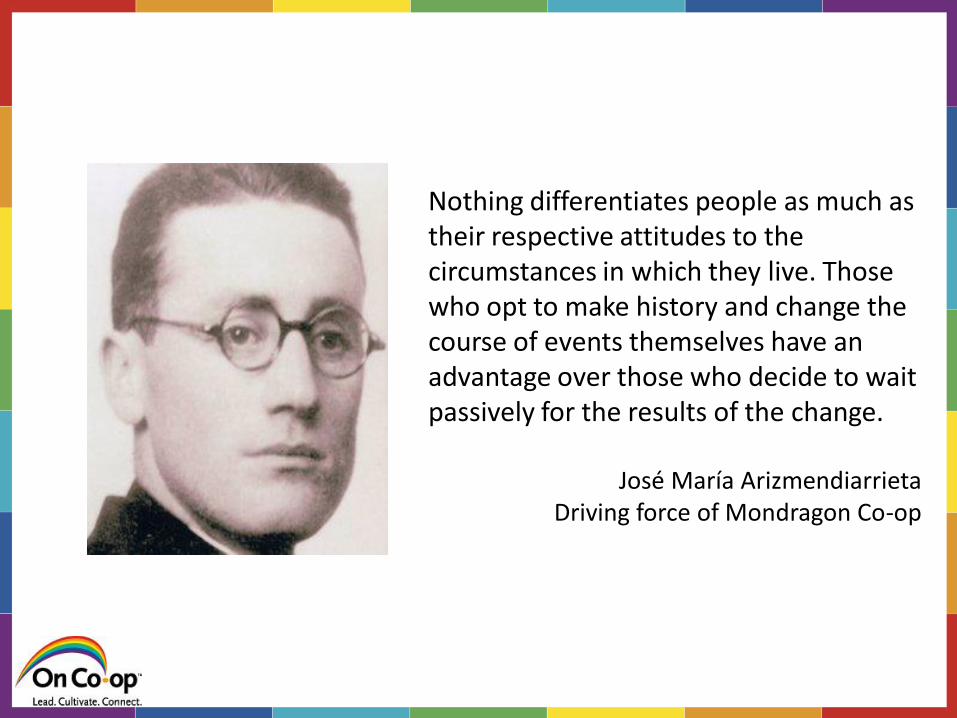
Nothing differentiates people as much as their respective attitudes to the circumstances in which they live. Those who opt to make history and change the course of events themselves have an advantage over those who decide to wait passively for the results of the change.
José María Arizmendiarrieta Driving force of Mondragon Co-op
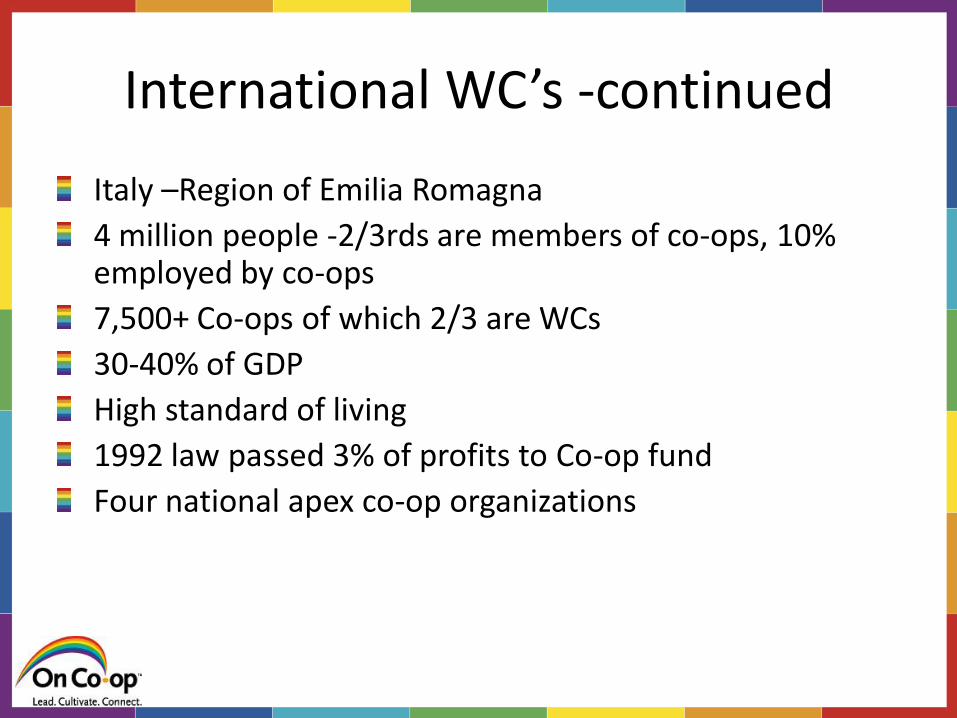
International WC’s -continued
Italy –Region of Emilia Romagna
4 million people -2/3rds are members of co-ops, 10% employed by co-ops
7,500+ Co-ops of which 2/3 are WCs
30-40% of GDP
High standard of living
1992 law passed 3% of profits to Co-op fund
Four national apex co-op organizations
Constitution of the Italian Republic (1947), Article 45:
"The Republic recognizes the social function of co-operation with a mutual and non-profit character. The law promotes and favors its growth by the most suitable means and ensures, by appropriate controls, that its character and purposes are respected.”
A BRIEF HISTORY OF CO-OPS
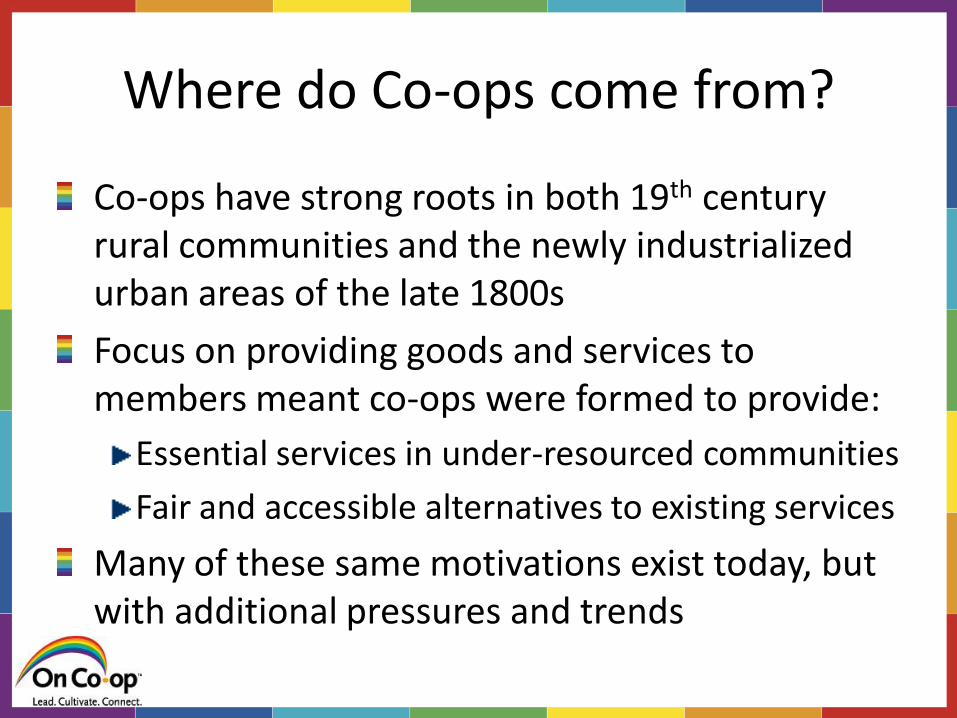
Where do Co-ops come from?
Co-ops have strong roots in both 19th century rural communities and the newly industrialized urban areas of the late 1800s
Focus on providing goods and services to members meant co-ops were formed to provide:
Essential services in under-resourced communities
Fair and accessible alternatives to existing services
Many of these same motivations exist today, but with additional pressures and trends
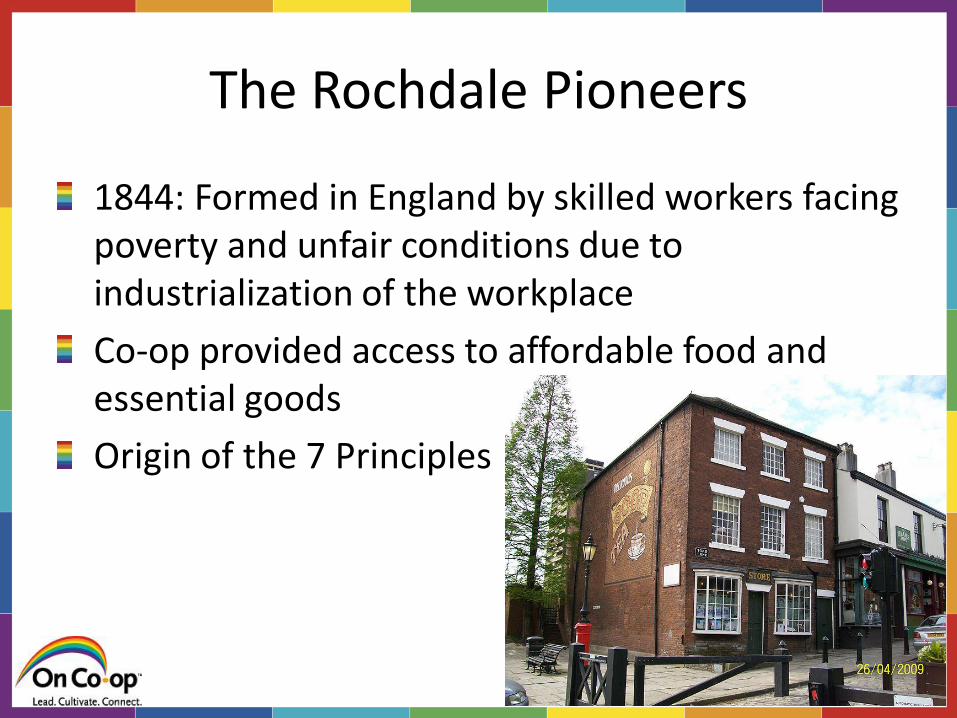
The Rochdale Pioneers
1844: Formed in England by skilled workers facing poverty and unfair conditions due to industrialization of the workplace
Co-op provided access to affordable food and essential goods
Origin of the 7 Principles
Antigonish Movement Maritime-based co-operative movement spearheaded by priests and educators: Moses Coady, Jimmy Thompkins, Hugh MacPherson
Advocated for as a way for Nova Scotians to lift themselves out of poverty and achieve greater freedom and self-realization
1860s-1890s: farmer co-ops started in great numbers but high failure rates
by 1910s co-ops were more successful and widespread
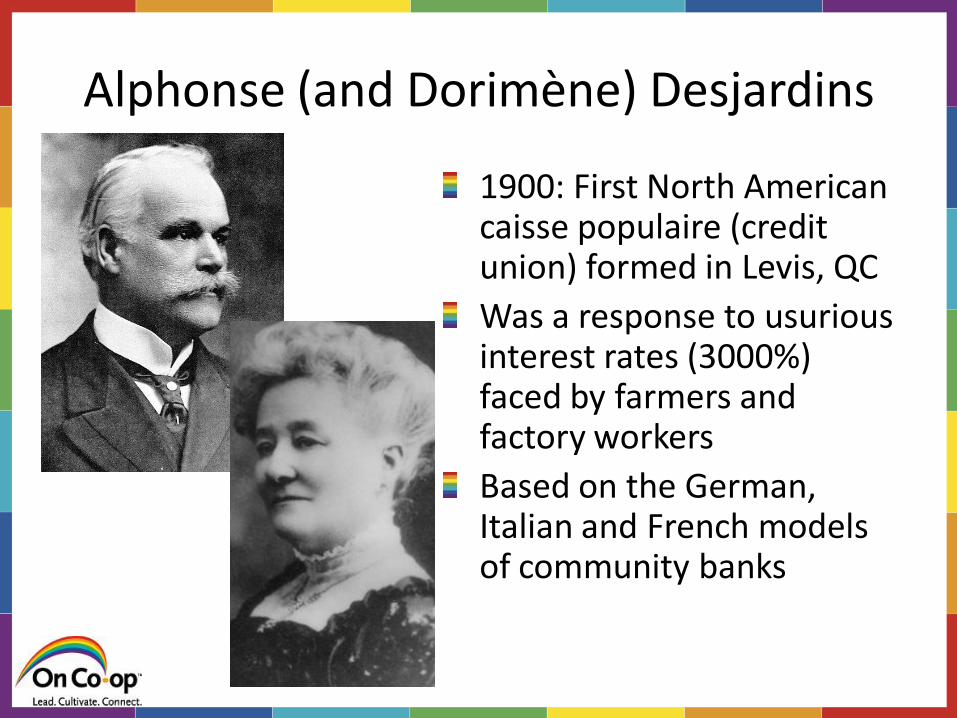
Alphonse (and Dorimène) Desjardins
1900: First North American caisse populaire (credit union) formed in Levis, QC
Was a response to usurious interest rates (3000%) faced by farmers and factory workers
Based on the German, Italian and French models of community banks

United Nations
0.0%
10.0%
20.0%
30.0%
40.0%
50.0%
60.0%
70.0%
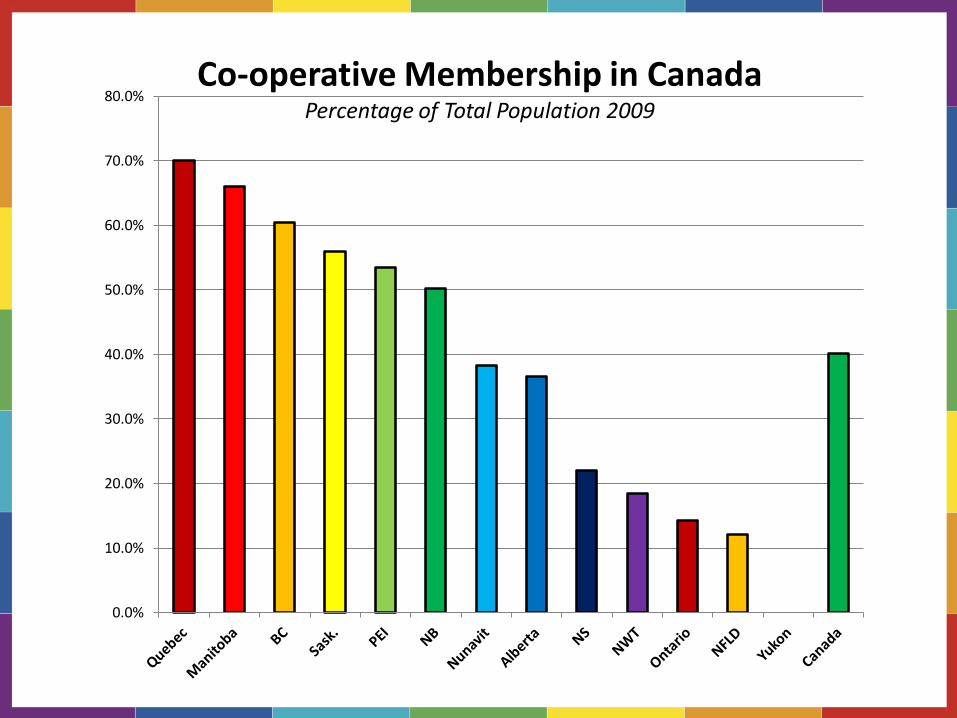
80.0% Co-operative Membership in Canada
Percentage of Total Population 2009
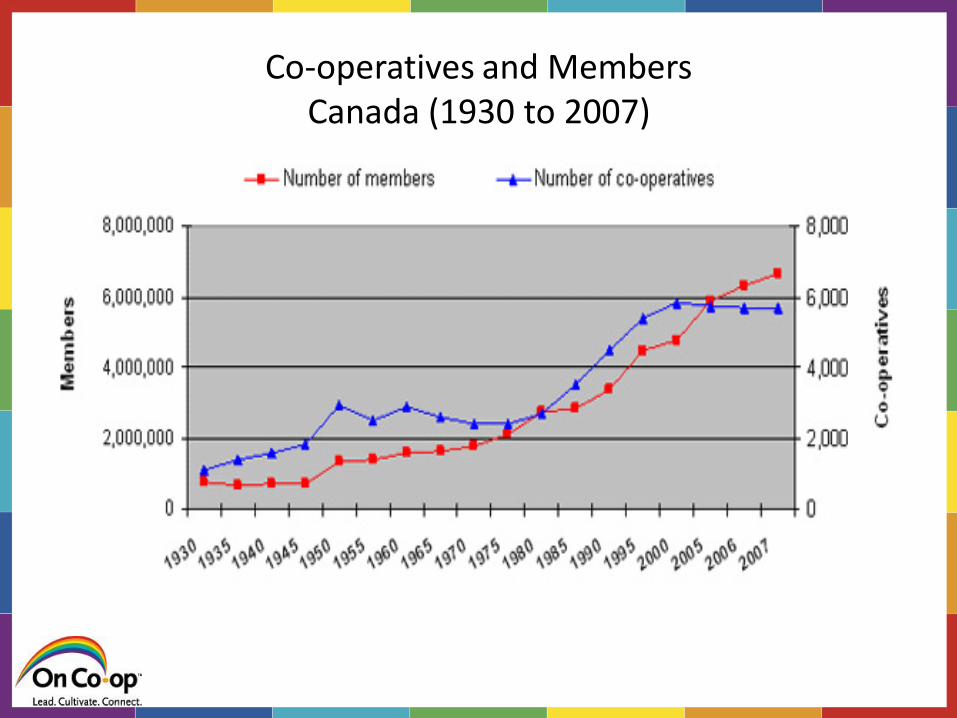
Co-operatives and Members Canada (1930 to 2007)
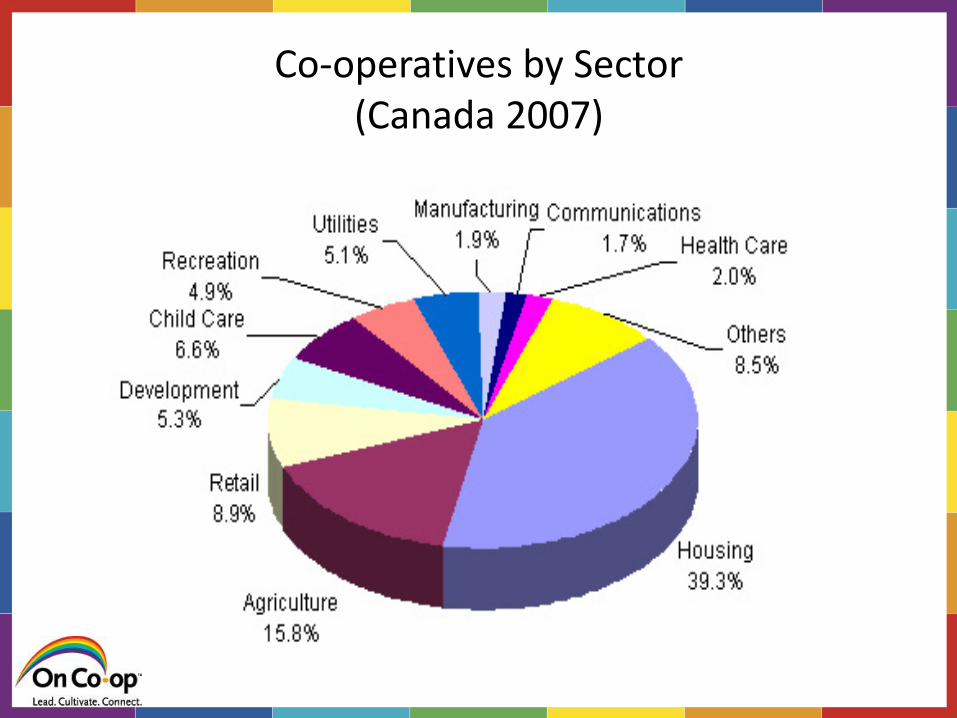
Co-operatives by Sector (Canada 2007)

Top 50 Co-ops (Canada 2010)
4.9 million members (up 6.7%)
38,700 employees
$25 billion in revenue (up 3.4%)
$11 billion in assets (up 6.6%)
$640 million in patronage dividends

Credit Unions & Caisses Populaires
197 million members worldwide
11% increase since 2007
$1.6 trillion in assets
32% increase since 2007
0% of government bailouts
10.7 million members (Canada)
3,162 locations
$278 billion in assets

0
100
200
300
400
500
600
700
800
RBC TD NS BMO CIBC CUs & CPs National HSBC Laurentian Western
Assets of Top 10 Banks & Credit Unions (2011) Billions CAN $
Credit Union Firsts
ATMs & on-line banking
Daily interest savings
Open mortgages
Home equity lines of credit
RESPs
First in overall service excellence
Ontario Co-operative Association
Vision: An Ontario where co-operatives contribute to the sustainability and growth of our economy and communities.
Mission: To lead, cultivate and connect the
co-operative sector.
Co-operative Principles
1. Voluntary and open membership 2. Democratic member control 3. Member economic participation 4. Autonomy and independence 5. Education, training and information sharing 6. Co-operation among co-operatives 7. Concern for community
Elaborated in 1995 by the International Co-operative Alliance
Co-op Values
Co-operatives are based on the values of
self-help, self-responsibility, democracy, equality, equity and solidarity.
In the tradition of their founders, co-operative members believe in the ethical values of honesty, openness, social responsibility and caring for others.


Local Organic Food Co-ops
1. Bringing local farmers and eaters together directly.
2. Growing and supplying fresh, healthy food locally.
3. Keeping money in the community.
4. Trading fairly.
5. Saving energy, building the soil, and protecting water.
6. Celebrating good food, culture and community.
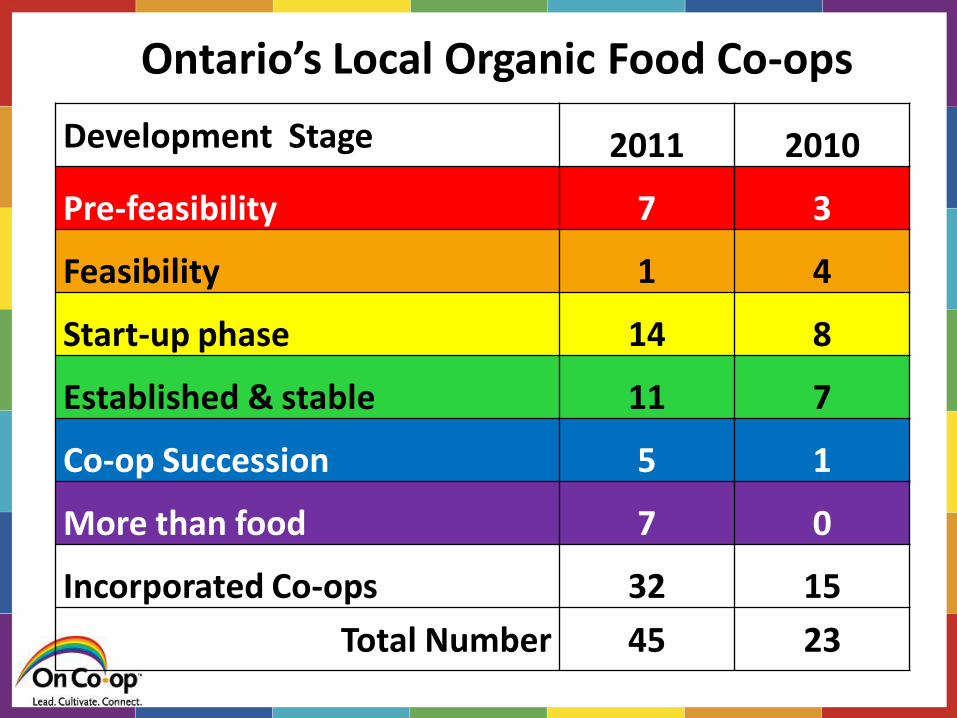
Development Stage 2011 2010
Pre-feasibility 7 3
Feasibility 1 4
Start-up phase 14 8
Established & stable 11 7
Co-op Succession 5 1
More than food 7 0
Incorporated Co-ops 32 15
Total Number 45 23
Ontario’s Local Organic Food Co-ops
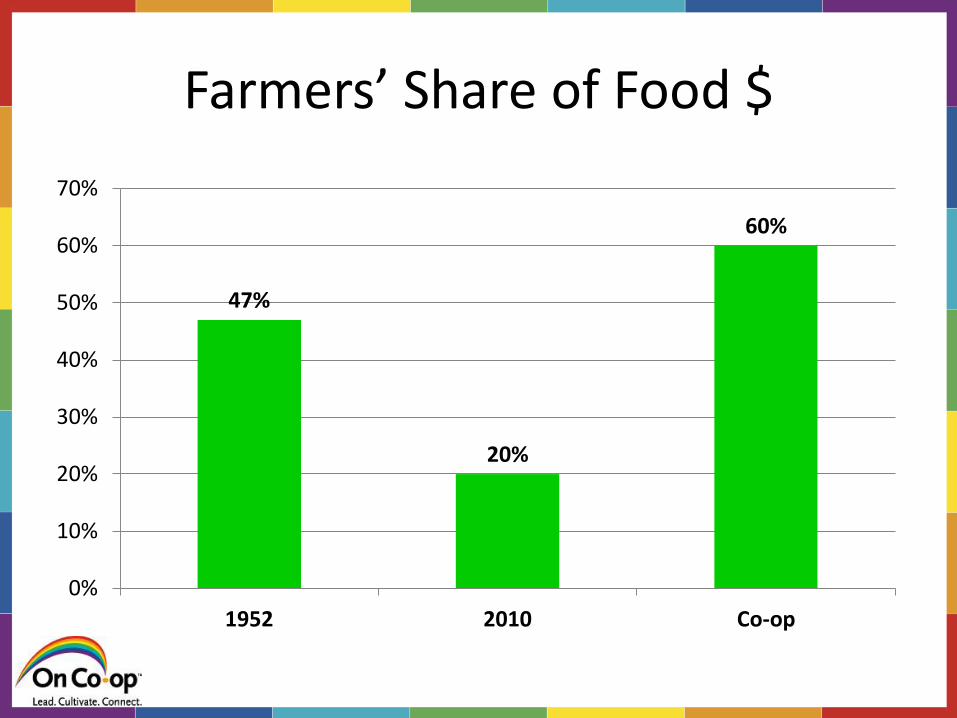
Farmers’ Share of Food $
47%
20%
60%
0%
10%
20%
30%
40%
50%
60%
70%
1952 2010 Co-op
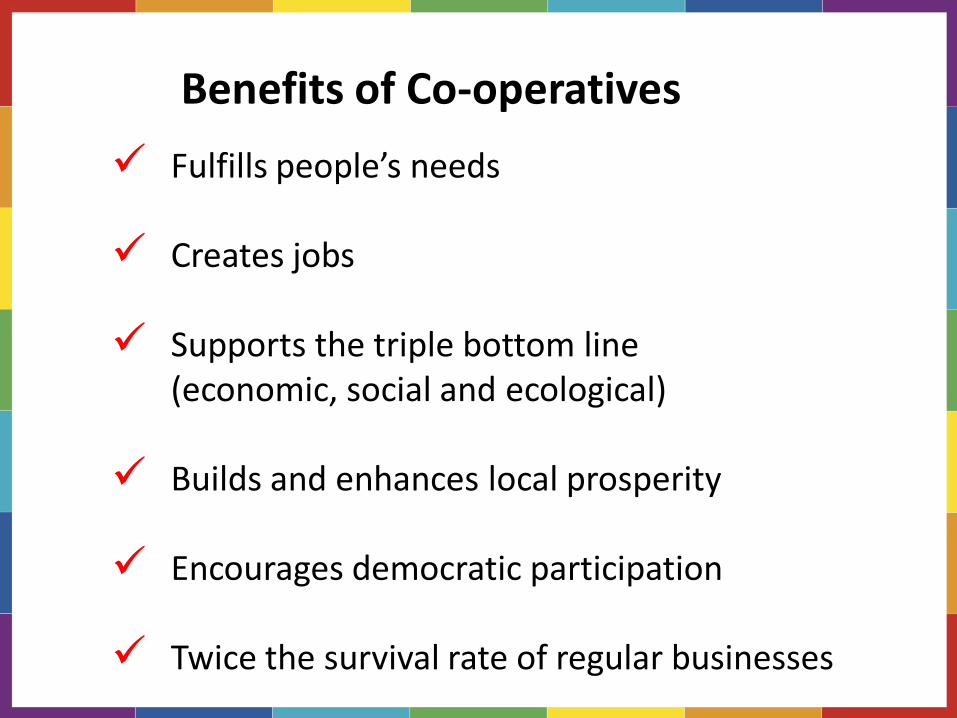
Benefits of Co-operatives
Fulfills people’s needs
Creates jobs Supports the triple bottom line (economic, social and ecological) Builds and enhances local prosperity Encourages democratic participation Twice the survival rate of regular businesses
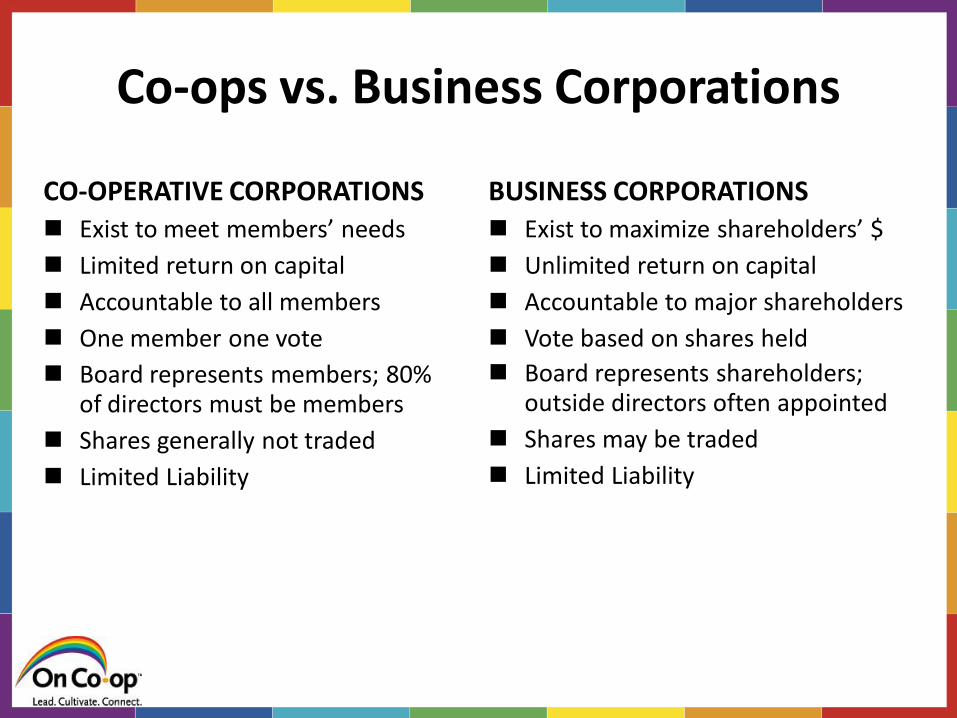
Co-ops vs. Business Corporations
CO-OPERATIVE CORPORATIONS
Exist to meet members’ needs
Limited return on capital
Accountable to all members
One member one vote
Board represents members; 80% of directors must be members
Shares generally not traded
Limited Liability
BUSINESS CORPORATIONS
Exist to maximize shareholders’ $
Unlimited return on capital
Accountable to major shareholders
Vote based on shares held
Board represents shareholders; outside directors often appointed
Shares may be traded
Limited Liability
Co-operative Opportunities
Local and organic food
Business succession
Rural Infrastructure
Social Sectors
Renewable energy

Questions / Comments