Th e Honorable Th omas V. “Mike” Miller and the Senate of ...
143
Transcript of Th e Honorable Th omas V. “Mike” Miller and the Senate of ...


January 23, 2015
Th e Honorable Th omas V. “Mike” Miller and the Senate of Maryland
Th e Honorable Michael E. Busch and the Maryland House of Delegates
Th e People of Maryland
Dear Mr. President, Mr. Speaker, Members of the Maryland General Assembly and Fellow Marylanders:
As one of my fi rst responsibilities as the 62nd Governor of the State of Maryland, I present you the state budget for Fiscal Year 2016. Th is past November, the people of our great state decided they wanted a more effi cient and more cost eff ective government – a government that meets its obligations while fostering an environment that encourages economic growth and provides more opportunity. To achieve these goals, we must begin by returning our state government to fi scal soundness.
In the past, the state has addressed budget shortfalls with short-term solutions including increased borrowing. As a result, our state budget is driven by unsustainable obligations, most of which are mandated by law. Th e fact is, debt repayments, pension contributions, and statutorily mandated funding formulas consume more than 80 percent of the operating budget.
In addition to the decrease in state revenues due to our stagnant state economy, the shrinking presence of the federal government forces us to reconsider our reliance on it to support state operations. Th ough our revenues are projected to grow, they will not grow at the rate of historical spending. Th at is why this budget reins in that spending to a more sustainable level.
Very simply, this budget attempts to reverse the unsustainable fi scal path we have been following and breaks the cycle that this state has found itself in year aft er year. Most importantly, it will begin the rehabilitation of our capital debt program within aff ordable limits and is the fi rst step in an essential turnaround and a multi-year eff ort that will require the perseverance of all of us in state government.
By reducing the amount of new debt authorization, we will be able to meet most of our capital needs and reduce the projected growth of our state debt, which is approaching the limits established by the state’s capital debt aff ordability process. We can still meet most of our capital needs, but just not as quickly. We must manage our state debt prudently and within the debt aff ordability guidelines the state has recognized for nearly four decades.

Excluding payments to the reserve fund, PAYGO capital, and debt service, this budget increases general spending by only 0.5 percent while the rate of revenue growth is 3.5 percent – an important step that will begin to bring the budget into a prudent balance. Th e capital budget also has been carefully reduced in scope to achieve sustainability in the near term and to address the unsustainable growth in our debt service payments. Both budgets have been prepared to respond to the needs of our citizens, while taking steps to repair and support our economy.
Th e presentation of this budget is just a start. We will have much more to do in the days ahead to redirect our state’s fi scal course. Programs must be examined. New debt must be managed prudently. Agencies must be consolidated. Mandates must become aff ordable. In short, the government must become effi cient and practice fi scal integrity.
More importantly, we must put our state economy back on track, attract new businesses, and create jobs for the long-term stability of our budget. Maryland is too special of a place and has too many natural advantages to be experiencing this kind of continued economic downturn. I know that Maryland can once again be a leader for job creation and a state that other states look to as an example of where businesses can grow and succeed.
Th is is not an easy process but I believe that as we proceed and certainly when this process is substantially complete, we will have put Maryland on a path that will ensure long-term fi scal strength and increase state government’s ability to serve our citizens. More importantly, Marylanders will be grateful that we have done our best to assure a brighter future for the people we represent and the state that we all love.
Th ank you for your commitment to the citizens of Maryland.
Sincerely,
Lawrence J. Hogan, Jr.
Governor

Budget in Brief: Fiscal Restraint
Economic and Workforce Development
Education
Health and Safety Net
Public Safety
Natural Resources and Environment
Capital Budget
Capital Budget for Transportation
Supporting Local Government
Appendices
Some totals and percentages in this book may not add due to rounding.
8
11
12
14
15
16
17
20
22
35
Contents

6
Revenues
Revenues ($ millions)
Percent Change Percent Total($ in millions) FY 2014 FY 2015 FY 2016 ‘16 over ‘15 Revenues Individual Income Tax 7,774 8,168 8,629 6% 21%Corporate Income Tax 983 991 1,061 7% 3%Sales Tax 4,143 4,396 4,602 5% 11%Lottery 578 575 558 -3% 1%Fuel Taxes 811 877 1,023 17% 3%Transportation Revenues 3,024 3,412 3,748 10% 9%Higher Education Revenues 4,117 4,025 4,114 2% 10%Fund Transfers 74 160 55 -65% 0%Other General Funds 1,922 1,931 1,853 -4% 5%Other Special Funds 4,043 4,348 4,217 -3% 10%Federal Fund Revenue (excludes Transportation) 9,623 10,931 10,615 -3% 26%Total Revenues 37,093 39,815 40,475 2% 100% Changes in general fund balances and reversions 451 147 (144) Budget bill adjustments 0 0 (46) Total Available 37,544 39,962 40,285 1% Totals and percentages may not add due to rounding.
Individual Income Tax 21% Corporate
Income Tax 3%
Sales Tax 11%
Lottery 1%
Fuel Taxes 3%
Transportation Revenues
9%
Higher Education Revenues 10%
Fund Transfers
0%
Other General Funds
5%
Other Special Funds 10%
Federal Fund Revenue 26%
Note: Th e electronic version of this page has been updated from the printed version and is correct as of 1/23/15.

7
Expenditures
Percentage change Percent TotalExpenditures ($ in millions) FY 2014 FY 2015 FY 2016 ‘16 over ‘15 Expenditures Health 11,058 12,827 12,496 -3% 31%Elementary and Secondary Education 7,271 7,451 7,513 1% 19%Higher Education 5,619 5,855 5,954 2% 15%Transportation 4,006 4,481 4,960 11% 12%Human Resources 2,928 3,090 2,981 -4% 7%Public Safety 2,020 2,093 2,151 3% 5%Natural Resources and Environment 763 792 776 -2% 2%Legislative, Judicial, Legal 661 716 765 7% 2%Public Debt 981 1,039 1,131 9% 3%Other 1,528 1,605 1,602 0% 4% Estimated reversions (30) (30) Voluntary separation program (8) (30) Total (less reserve fund) 36,835 39,949 40,328 1% 100%Reserve Fund 55 15 150 915% <1% Net Total 36,890 39,964 40,479 1%
Figures refl ect the January 2015 actions of the Board of Public Works, as well as proposed defi ciencies, contingent reductions, and back-of-the-bill reductions. Totals and percentages may not add due to rounding.
Health 31%
Elementary and Secondary Education 19%
Higher Education 15%
Transportation 12%
Human Resources 7%
Public Safety 5%
Natural Resources & Environment
2%
Legislative, Judicial, Legal, 2%
Public Debt, 3%
Other, 4%
Note: Th e electronic version of this page has been updated from the printed version and is correct as of 1/23/15.

8
Dual Budget ChallengesIn preparing the FY 2016 budget, the Hogan Administration faced a budget gap of $1.25 billion over two years -- $423 million in FY 2015 and $802 million in FY 2016.• Th e two primary drivers of the FY 2015 budget
gap are:• Weaker than anticipated revenue growth
in the current year – resulting in revenue revisions of $300 million – caused by slow employment and personal income growth from a stagnant local economy, overly dependent upon the federal government.
• Faster than anticipated growth in Medicaid enrollment requiring $200 million in additional funding.
• Th e FY 2016 gap represents a continuation of the FY 2015 shortfall exacerbated by:• General fund spending – primarily driven
by mandates and entitlements – growing faster than revenues.
• Two-thirds of estimated FY 2016 spending growth was the result of statutory mandates and another twenty percent was driven by entitlements
• Most notable was debt service, which is estimated to grow from $140 million in the current year to $274 million in FY 2016.
• Continued weakness in revenue.
Th e Governor’s $1.3 billion budget balancing plan addresses the current and projected budget shortfall, leaves a comfortable surplus in FY 2016, constrains spending, and achieves structural balance.• Reductions in spending account for nearly $1.1
billion of the overall budget solution.
FY 2016 General Fund Budget Constrains Spending GrowthIn the FY 2016 budget as introduced, general funding spending growth is held well below the rate
Budget in Brief: Fiscal Restraint
3.8%
3.5%
5.0%
1.5%
0.0%
1.0%
2.0%
3.0%
4.0%
5.0%
FY 16 Baseline FY 16 Budget
Perc
ent G
row
th
Revenues
Expenditures AfterPayments to Reserves
Spending growth more than halved
Reining in Spending

9
of growth in revenues – a 1.5% growth in general fund spending (excluding payments to reserves)compared to 3.5% in revenues.• Spending growth is less than half that projected
in the baseline budget – 1.5% in the Governor’s budget compared to 5.0% in the baseline budget.
• Th e FY 2016 general fund budget, aft er contingent reductions, totals $16.4 billion, a $381 million increase over FY 2015.
• Almost 80% of general fund spending growth is attributable to just two things: the appropriation to the Reserve Fund ($135 million) and debt service ($134 million).
• Excluding these two requirements and PAYGO capital, general fund spending grows by only one-half of one percent (0.5%).
• State agency spending declines by 1% from the original FY 2015 appropriation.
Overview of the Budget Solution Th e FY 2015 general fund budget balancing plan totals $459 million and is comprised primarily of spending cuts ($300 million). Transfers account for $143 million, $100 million of which is to be repaid in FY 2016, and additional revenues account for $16 million of the FY 2015 solution.
Th e FY 2016 budget balancing plan totals $842 million – of this total, $766 million is achieved by constraining spending.
• Rates for most providers are reduced to FY 2014 levels, saving $160 million.
• State employee salaries are rebased and frozen, saving $156 million, and full-year savings from the FY 2015 Voluntary Separation Program total $30 million.
• Education growth is constrained by freezing infl ationary growth and reducing Geographic Cost of Education Index funding by 50%, saving $143 million.
• Agency spending is reduced by 2%, saving $118 million.
• Other reductions to Medicaid and various fund swaps save $50 million.• R e p e a l i n g repayment of a prior year transfer from Program Open Space saves $50 million.• Growth in local aid programs is constrained, saving $35 million. • Th e FY 2016 budget solution also includes $72 million in revenues
from redirecting transfer tax and Chesapeake Bay 2010 Trust Fund revenues to the general fund and implementing tax compliance and fraud initiatives. Fund transfers total $4 million.
• Most importantly, the Governor’s FY 2016 budget achieves something that has not been seen in Maryland in a decade – it aligns general fund spending with available general fund revenues - a structurally balanced budget.
Budget in Brief: Fiscal Restraint

10
Funding Maryland’s PrioritiesWhile rebasing spending and solving the budget gap, the Governor’s budget does include additional spending on programs important to Marylanders including:• A record $6.1 billion for K-12 education.• Almost $1 billion, an increase of 8 percent, to
provide community services for individuals with developmental disabilities.
• More than $1.3 billion to support Maryland’s Department of Public Safety and Correctional Services.
• An increase of 11 percent in school nutrition programs, to $355 million in FY 2016.
An Eye for the FutureNot only does the Governor structurally balance the FY 2016 budget, but he is recommending and implementing reforms to help ensure that the budget remains in balance into the future by:• Limiting the size of the State’s capital budget
to help slow the runaway debt service budget. Th e Governor’s Capital Improvement Program results in lower debt service costs of $32 million by FY 2020.
• Proposing legislation to limit growth in mandated spending to a more manageable level that can be supported within the State’s existing revenue sources. Th e Governor’s proposed mandate relief legislation reduces spending growth by almost $100 million annually. By FY 2020, the cumulative savings from this proposal will exceed $300 million.
Budget in Brief: Fiscal Restraint
$12,500
$13,500
$14,500
$15,500
$16,500
$17,500
$18,500
$19,500
$20,500
2007 2008 2009 2010 2011 2012 2013 2014 2015 2016 2017 2018 2019 2020
Projected Revenues DLS Projected Spending Governor Hogan Spending Plan
Previous Budget Gap: $700 million
Ongoing General Fund Revenue vs. Ongoing SpendingFiscal 2007-2020
(In millions)
11
Th e economic development strategy of the Hogan-Rutherford Administration builds on Maryland’s strengths and prepares the State for accelerated economic growth.
Expanding Opportunities for Businesses • Th e FY 2016 allowance includes $20 million for
the Maryland Economic Development Assistance Authority and Fund to expand existing and attract new business to priority funding areas in Maryland.
• Th e FY 2016 allowance includes $10.6 million to support small, minority, and women-owned businesses and $6.3 million to promote small businesses owned by economically and socially disadvantaged entrepreneurs.
• The Mar yland Agricultural Resource-Based Industry Development Corporation (MARBIDCO) receives $2.9 million, after contingent reductions, to offer a variety of fi nancing programs that assist rural businesses and support entrepreneurship.
• The budget also includes $300,000 for the Military Personnel and Veteran-Owned Small Business No-Interest Loan Program to expand access to credit for those who have served our country.
Advancing Technology in Maryland• Th e FY 2016 allowance includes $12 million in
biotechnology tax credits to leverage investment for life science companies, $9.4 million to further develop stem cell technology, and $2.5 million, aft er contingent reductions, in investments and tax credits to promote cybersecurity research.
• The allowance also includes $9.0 million in research and development tax credits, $8.5 million to create endowed research chairs at universities, and $4.9 million to commercialize research conducted at participating universities through the Maryland Innovation Initiative.
Developing a World-Class Workforce• Th e FY 2016 allowance includes more than $30
million for the 12 Workforce Investment Areas which provide occupational skills, on-the-job, and entrepreneurial training, along with job search assistance.
• Th e budget includes $16.9 million for job centers across the State which provide assistance to job seekers through training referrals, career counseling, and job listings.
• Th e allowance maintains $4.5 million in funding for the Employment Advance Right Now (EARN) program, an industry-led workforce development initiative to help develop the skilled workforce businesses need to remain competitive.
• Th e budget also includes $2.8 million for adult instructional services and General Educational Development (GED) testing programs as well as $1.2 million for the Conservation Jobs Corps to teach green jobs skills to at-risk youth.
Preparing Individuals for Employment• Th e FY 2016 budget includes $33.3 million for the
Work Opportunities program to help transition recipients of public assistance to employment.
• Th e budget helps prepare inmates for employment by providing $19.8 million for occupational and transition training services at State correctional institutions.
Promoting Tourism, the Arts, and Maryland’s Unique Cultural Assets• Th e FY 2016 allowance provides $15.9 million,
aft er contingent reductions, for the Maryland State Arts Council as well as $2.0 million to fund our distinctive cultural arts organizations.
• Th e budget also includes $12.4 million for tourism development and promotion.
• The budget includes $9.0 million for the Sustainable Communities Tax Credit to leverage private investment and revitalize our State’s cities and towns as well as $1.1 million to provide fi nancing to new and expanding small businesses in those communities.
Economic and Workforce Development

12
The State continues to make investments in education at the pre-kindergarten through higher education levels to ensure Maryland citizens receive a top ranked education and our economy benefi ts from a well-educated citizenry.
K-12 Education Aid Funding
• Th e budget includes a $45.3 million increase in State aid to public schools, aft er contingent reductions, bringing the FY 2016 total to $6.1 billion.
• To provide stipends for teachers who obtain higher levels of education and certification, $10.6 million in additional funding will be available for Quality Teacher Incentives in FY 2016.
Public School Construction
Th e FY 2016 capital budget provides $290.7 million for K-12 education projects:
• $280 million for the Public School Construction Program, including $6.5 million for a new academic building and dormitory at the Maryland School for the Blind;
• $6.1 million for the Aging Schools Program; and • $4.6 million in Qualifi ed Zone Academy Bonds.
Early Childhood Education
• Th e budget maintains $4.3 million in State funds for prekindergarten education, leveraging $15 million in new federal grant funds that will provide free prekindergarten to an additional 3,000 low-income students in FY 2016.
• Child Care Subsidy federal funding grows by $9.5 million over FY 2015. Total funding of $92.5 million in FY 2016 is estimated to provide free or reduced-priced child care to 18,120 children.
Other Education Programs
• The Division of Rehabilitation Services (DORS), which promotes the employment and independence of individuals with disabilities, is budgeted at $109.5 million in FY 2016, an increase of 6% over FY 2015.
• Th e budget includes $35.1 million in additional federal funds for school lunch and breakfast programs, bringing the total for school nutrition programs to $354.9 million in FY 2016.
• Maryland Meals for Achievement, a State program that provides free breakfast in the classroom at 462 low-income schools throughout Maryland, is funded at $6.9 million.
• $18.2 million is provided for the Autism Waiver, enabling 1,000 children diagnosed with severe autism to receive services in their community rather than in more restrictive and expensive institutional settings.
Education

13
Higher Education
• The University System of Maryland (USM) receives $1.2 billion in State funding, a $15.4 million, or 1.3%, increase from last year. USM’s total FY 2016 budget is $5.10 billion.
• Morgan State University receives $85 million in State funding, an $813,893, or 1%, increase from last year. Morgan’s total FY 2016 budget is $227.3 million.
• Independent colleges and universities receive $41.4 million after adjusting for contingent reductions.
• St. Mary’s College of Maryland (SMCM) receives $23.5 million in State funding, an increase of 5.8% from FY 2015. SMCM’s total budget for FY 2016 is $72.8 million.
• Baltimore City Community College receives $41.8 million in State funding, an increase of 4% from FY 2015, bringing the total funding in FY 2016 to $89.7 million.
• Local community colleges receive $235.4 million in direct aid after adjusting for contingent reductions and $58.9 million for retirement benefi ts, a total increase of 1.3% from last fi scal year.
• Th e budget includes $112.8 million to provide State fi nancial aid and grants to more than 70,000 Maryland students, 70% of whom obtain aid on the basis of fi nancial need.
• Th e Maryland Higher Education Commission’s budget includes $4.9 mil l ion to fund enhancements at Maryland’s four historically black colleges and universities.
Higher Education Capital Projects
• The capital budget includes $347.6 million for modernizing and replacing aging facilities at State-operated campuses. This represents approximately 30% of the State’s capital budget.
• Major projects include:• An $81.6 million health sciences facility at the University of Maryland Baltimore;• A $65.7 million learning center at the University of Maryland College Park; and• A $39.7 million natural sciences center at Bowie State University.
• The capital budget includes $58 million for sixteen projects at eleven local community colleges.
• $8 million is allocated for capital projects at three private colleges and universities.
Education

14
Th e Hogan-Rutherford Administration is committed to the well-being of Maryland’s families. Th e FY 2016 budget provides funding for basic health coverage and treatment for addiction and substance abuse for income-eligible Marylanders, the Developmental Disabilities Administration, long term services and supports for older Marylanders and safety-net services for Maryland’s most vulnerable families.
Access to Health Care• Th e FY 2016 budget includes $9.6 billion for
Maryland’s Medicaid program, which currently provides basic health coverage for more than 1.1 million income-eligible Marylanders.
• The Maryland Children’s Health Insurance Program receives $217.6 million in FY 2016 to provide access to health care for nearly 115,000 children.
• Th e FY 2016 budget provides $39.6 million for continued operation of the Maryland Health Benefit Exchange and $36.6 million for the Maryland Health Benefit Exchange information technology system.
Behavioral Health • Th e FY 2016 budget supports services for an
estimated 250,000 individuals with mental health needs and 72,000 individuals in need of substance abuse addiction treatment.
• Th e FY 2016 budget provides $8.4 million for substance abuse prevention programs and $132.4 million for substance abuse treatment, including $4.1 million in funding from casino-related revenue for problem gambling treatment.
• Funding to treat the behavioral health needs of veterans totals $4.5 million.
Developmental Disabilities Administration (DDA)• Th e FY 2016 budget provides $1.02 billion aft er
contingent reductions for the Developmental Disabilities Administration, an increase of 8% from the prior year.
• Th e FY 2016 budget includes approximately $6.5 million to upgrade the Developmental Disabilities Administration’s financial system and related provider payment processes.
• To ensure appropriate services are provided to individuals, the FY 2016 budget includes $3.2 million to transition to a new comprehensive set of needs assessment tools.
Programs for Older Marylanders• Th e FY 2016 budget provides $148,817 in additional funds to administer Maryland Access Point, a statewide gateway for information and assistance about long-term services and supports.• The FY 2016 budget also includes $18.1 million to provide
prescription drug assistance to income-eligible Medicare Part D recipients.
Vulnerable Families and Children• Th e FY 2016 allowance includes $1.2 billion in
federal supplemental nutrition assistance program (SNAP) benefi ts for 405,000 households.
• Th e budget funds $125.7 million in heating and electricity assistance benefi t awards to more than 260,000 low-income households.
• Th e budget includes $40.1 million to provide cash, medical and housing benefi ts to approximately 18,000 individuals with disabilities.
• An additional $2.5 million in the FY 2016 budget will ensure that combined Temporary Cash Assistance and SNAP benefi ts meet 61% of the Maryland Minimum Living Level.
Health and Safety Net

15
The Hogan-Rutherford Administration’s FY 2016 budget funds a variety of important law enforcement and public safety programs and functions that are necessary for the safety and security of the public, correctional facilities, and juvenile detention centers.
Public Safety and Correctional Services• Th e FY 2016 budget for the Department of Public
Safety and Correctional Services (DPSCS) totals $1.36 billion, funding the State’s correctional facilities, parole and probation programs, and a number of drug treatment and rehabilitation programs both in and outside of facility walls.
• Th e allowance includes $819 million to house and rehabilitate a population of over 20,000 inmates, $121 million to supervise over 50,000 individuals in the community, and $177 million to detain arrestees and house pretrial off enders.
• Additional funding is provided to purchase inmate transportation vehicles to replace an aging fleet ($800,000), to develop a new enterprise resource planning computer system for Maryland Correctional Enterprises ($750,000), and to replace aging security cameras at a number of facilities ($500,000).
• Funding and personnel to open the second phase of the Dorsey Run Correctional Facility in late FY 2016 are realigned from partially closing an old and ineffi cient facility.
Supporting Law Enforcement• Police aid to local governments and municipalities
totals $67.3 million aft er contingent reductions. Local law enforcement grants are level-funded at $26.4 million.
• An additional $2 million in FY 2015 defi ciency funding is provided to the Maryland State Police to begin a new Trooper Cadet Class in January 2015 to bring new troopers to the fi eld.
• Th e FY 2016 budget includes an additional $1.3 million for aircraft operations and maintenance, software maintenance, and training for the Maryland State Police Aviation Command’s new AW-139 helicopters.
• An additional $675,261 is included in FY 2016 to support 17 new Natural Resource Police (NRP) offi cers in the spring 2016 Academy Class, as well as $640,000 to replace aging vehicles in the NRP fl eet.
Supporting our Troops• Th e FY 2016 allowance includes $114.6 million for
the Maryland Military Department to maintain Maryland’s Army and Air National Guard strength at more than 8,000 members.
• The budget also includes $28.2 million for the Maryland Department of Veterans Aff airs to deliver services and programs to assist veterans, their families, and survivors.
• Th e FY 2016 capital budget includes $34.2 million to build Readiness Center facilities in Talbot, Howard, and Harford counties.
Preventing Juvenile Crime• Th e FY 2016 budget aft er contingent reductions
provides $291 million for community and residential operations providing direct care services to youth in facilities and those housed in the community while under Department of Juvenile Services’ supervision.
• Th e FY 2016 allowance includes $425,000 in Byrne Memorial Justice Assistance Grant funding towards initial planning for a modernized case management tracking system.
• Modest funding increases are provided for the Violence Prevention Initiative to support the most intensive level of community supervision ($387,978) and for community-based interventions for youth with mental illness ($320,951).
Public Safety
16
The FY 2016 budget supports efforts to restore the Chesapeake Bay, to protect Maryland’s natural resources and environment, to assist farmers, and to promote energy effi ciency.
Chesapeake Bay Restoration
• With investment in strategies outlined in the Watershed Implementation Plan (WIP) Phase II, the State of Maryland is on track to meet 2017 pollution reduction targets set by the U.S. Environmental Protection Agency.
• The FY 2016 allowance after a contingent reduction includes $39.4 million for the Chesapeake and Atlantic Coastal Bays 2010 Trust Fund to support non-point source pollution control projects.
• The FY 2016 capital budget includes $120.5 million in funding for wastewater treatment plant and septic systems upgrades ($94.0 million funded by the Bay Restoration Fund) to reduce nitrogen and phosphorus pollution into the Bay.
• Capital funding for oyster restoration activities totals $7.6 million.
• The Cover Crop program, which provides payments to farmers who plant cover crops on their farmlands to reduce nutrient runoff into the Chesapeake Bay, receives $22.5 million in FY 2016.
Agriculture and Natural Resources
• To increase enforcement of natural resource and conservation laws and regulations, the FY 2016 allowance includes $675,261 to support 17 new Natural Resource Police (NRP) offi cers in the spring 2016 Academy Class, as well as $640,000 to replace aging vehicles in the NRP fl eet.
• Funding for the Fisheries Service, which regulates recreational and commercial fi shing activities and ensures the sustainability of
Maryland’s fi shing resources, totals $24.2 million.• Th e budget includes $6.0 million for the Tobacco
Transition program to help shift Maryland farmers from tobacco production to other crops and products.
• Th e FY 2016 allowance includes $12.4 million for the Wildlife and Heritage Service to promote the long term conservation of the native ecosystems and natural communities that comprise the biological integrity of Maryland.
Energy and Environmental Quality
• Th e FY 2016 allowance for the Maryland Energy Administration (MEA) includes $19.9 million for Renewable and Clean Energy Programs and Initiatives; $19.6 million for Energy Effi ciency and Conservation Programs; and $4.1 million for the Jane E. Lawton Conservation Loan Program and State Agency Loan.
• Th e Department of Housing and Community Development receives $41.2 million for weatherization and energy effi ciency programs.
• Th e FY 2016 allowance includes $20.6 million for the Air and Radiation Management Administration, which oversees air quality compliance, permitting and planning activities; as well as asbestos and radiological health programs.
Natural Resources and Environment

17
Maryland’s Five-Year Capital Improvement Program($ millions)
Five-Year FY 2016 FY 2017 FY 2018 FY 2019 FY 2020 Total General 1,421 1,387 1,431 1,553 1,520 7,312 Transportation 2,897 3,159 2,676 2,438 2,148 13,318 Total 4,318 4,546 4,107 3,991 3,668 20,630
*Th e State Highway Administration Watershed Implementation Plan is counted in the General Capital, not the Transportation total.
Maryland’s FY 2016 capital budget totals just over $4 billion. Th e capital budget funds the construction of assets such as schools, health facilities, roads, bridges, water treatment plants, and other essential buildings. Projects funded by the capital budget include new construction, renovations of older buildings, purchases of long-lasting equipment or other assets, and other investments in Maryland’s future.
Overview
Most of the capital budget is spent on transportation-related projects, funded through fuel taxes and other transportation-related sources. Typically, these projects restore roadways, improve safety, reduce traffi c congestion, support public transit options, and invest in mobility.
Th e rest of the capital budget, totaling $1.4 billion, is set aside for projects that focus on education, environmental quality, community revitalization, health, and public safety. In order to return to sustainable borrowing levels, State general obligation bonds (GO bonds) total less than $1 billion. Consequently, the State will remain within its target ratio for debt payments as a share of State revenues and protect its AAA credit rating.
Education
Education projects remain a priority in the FY 2016 capital budget. In total, $726 million is allocated for projects at schools, community colleges, and higher education campuses. Highlights include:• $280 million for public school construction,
$6 million for aging schools, and $5 million in Qualifi ed Zone Academic Bonds (QZABs). Apart from the state capital budget, renovations are planned to begin in several Baltimore City Public Schools funded through a financing plan in partnership with the Maryland Stadium Authority.
• $348 million for projects at State institutions of higher learning, including $301 million for the University System of Maryland, $36 million for Morgan State University, and $10.5 million for St. Mary’s College. New facilities include the Health Sciences Facility at UM Baltimore ($81.6 million), a new Academic Commons building for Salisbury University ($53.2 million), and a new Behavioral and Social Sciences Center at Morgan State University ($31.1 million).
• $58 million for 16 projects at 11 community colleges, including renovation of the Queen Anne Academic Center at Prince George’s
Maryland’s Capital Budget

18
Community College ($16 million), a new Science Engineering and Technology building at Howard Community College ($16 million), a new Science and Applied Studies building at Montgomery College ($6 million), and technology infrastructure for the College of Southern Maryland ($4 million).
• $8 million for projects at three private universities.• $16.9 million for the State Library Resource
Center (Pratt Central Library) and $5 million for 8 local library projects.
Environment
In FY 2016, $390 million in capital funding is allocated for environmental programs and land preservation, including: • $279 million for water quality improvement
projects; and• $84 million for land preservation under Pro-
gram Open Space, Rural Legacy, and Agricul-tural Land Preservation.
Community Revitalization and Housing
Th e capital budget directs $104 million to address the needs of aff ordable housing and community revitalization. Funding highlights include:• $10 million for Rental Housing Works—lever-
aging local and private funds to create aff ord-able housing and jobs;
• $13.7 million for homeownership programs;• $5 million for Strategic Demolition and the
Smart Growth Impact Project Fund; and• $1.68 million for the Baltimore Regional
Neighborhoods Initiative.
Safer Communities and Public Safety
Th e FY 2016 capital budget provides $68 million for public safety-related projects, including: • $21.6 million for construction of a modern
detention center to house youth charged as adults;
• $4.2 million toward design of a new detention center for female youth and equipping the new youth detention center in Prince George’s County; and
• $30 million to improve the State’s public safety radio infrastructure.
Health
Th e FY 2016 capital budget allocates $48 million for improvements to Maryland’s health infra-structure, including: • $30 million toward development of a new
regional medical center in Prince George’s County; and
• $9 million toward a new Labor and Delivery Suite, Neonatal Intensive Care facility, and a Shock Trauma Center project at the Univer-sity of Maryland Medical System.
Other Investments
Beyond these categories, the capital budget also funds several miscellaneous projects that will nonetheless have a signifi cant impact on the lives of Marylanders. Highlights include:• $5 million for the Maryland Zoo in Balti-
more;• $3.5 million for the Maryland Food Bank;• $2.5 million for continued development
around the East Baltimore Biotechnology Park; and
• $36 million in state and federal funds for Maryland National Guard projects.
Maryland’s Capital Budget

19
General Capital Improvement Program Fiscal Year 2016($ millions)
General General Revenue*EDUCATION Obligation Bonds Funds Bonds Other** TotalPublic School Construction 260.7 30.0 290.7Public Colleges & Universities 313.1 34.5 347.6Community Colleges 57.9 57.9Private Colleges & Universities 8.0 8.0State Library Resource Center 16.9 16.9Public Library Grants 5.0 5.0Subtotal 661.6 30.0 34.5 726.1
ENVIRONMENTChesapeake Bay Restoration 62.0 217.2 279.2Drinking Water 5.7 21.0 26.7Land Preservation 69.2 14.3 83.5Environmental Cleanup 0.7 0.7Subtotal 136.9 0.7 252.5 390.1
COMMUNITY REVITALIZATION AND HOUSINGRental Housing Programs 10.0 27.8 37.8Homeownership Programs 11.8 1.9 13.7Other Housing 13.4 4.6 17.9Smart Growth Deconstruction/Demolition 5.0 5.0Community Development Projects 3.6 3.6Other Community and Neighborhood Devt 11.2 14.6 25.7Subtotal 54.9 48.8 103.7
SAFER COMMUNITIES AND PUBLIC SAFETYPublic Safety and Corrections 33.5 33.5Juvenile Services 4.2 4.2Public Safety Communications System 30.0 30.0Local Detention Centers 0.8 0.8Subtotal 68.4 68.4
Economic Development, Tourism, and Arts 11.5 11.5Health 48.2 48.2Others 26.7 0.1 55.6 82.4
TOTAL 1,008.2 30.8 34.5 356.9 1,430.3Less: Deauthorizations (9.0) (9.0) Net New Authorizations 999.2 30.8 34.5 356.9 1,421.4
Note: Totals may not add due to rounding. * “Revenue Bonds” are University System of Maryland Academic Revenue Bonds** “Other” includes special funds and federal funds.
Maryland’s Capital Budget

20
Th e proposed FY 2016 capital budget for Department of Transportation projects totals $2.9 billion. Th e transportation capital budget is primarily funded through State sources and federal aid. Th e State sources consist of taxes, fees, and bonds totaling $1.7 billion of the capital budget, or 59.7 percent. Federal aid for highways, mass transit, aviation, and port security makes up $928 million, or 32.0 percent. Other sources of funding, including user fees and federal funds received directly by the Washington Metropolitan Area Transit Authority comprise $240 million or 8.3 percent.
Th e Secretary’s Offi ce (TSO)TSO’s FY 2016 capital budget totals $88.1 million and includes $4.5 million for the Bikeways Network Program, $10 million for a federal High Speed Intercity Passenger Rail Grant to Amtrak to study a new Susquehanna River freight bridge, and $26.4 million in a similar federal grant for engineering work for the B&P Tunnel.
State Highway Administration (SHA)SHA projects constitute $1.40 billion, the largest share of the FY 2016 capital program. Th e SHA capital program is funded with $869.7 million in State sources and $526.6 million in federal aid. Major projects by region include:• Western Maryland: $2.0 million to start
widening and rehabilitating the I-81 bridge over the Potomac River in Washington County and $5.0 million for the replacement of the Keyser’s Ridge maintenance facility in Garrett County.
• Eastern Shore: $18.1 million to replace the Dover bridge in Caroline and Talbot counties, $13.5 million to construct a new interchange at US 301/MD 304 in Queen Anne’s County, and $25.5 million for right of way acquisition and construction for widening of US 113 in Worcester County
• Suburban Washington Region: $16.1 million to construct a new interchange on US 15 at Monocacy Blvd. in Frederick County; $15.8 million for a new interchange at MD 97 and
Randolph Rd. and $27.6 million to construct a new interchange on I-270 at Watkins Mill Rd. in Montgomery County; and $21.3 million to construct a new interchange on MD 210 at Kerby Hill/Livingston Rds. in Prince George’s County.
• Southern Maryland: $8.7 million to replace the MD 261 bridge over Fishing Creek in Calvert County and $4.3 million to start engineering for the MD 4 Th omas Johnson Bridge replacement between Calvert and St. Mary’s counties.
• Baltimore Region: $31.9 million for BRAC improvements near Ft. Meade in Anne Arundel County and APG in Harford County; $55.1 million for various bridge and widening improvements along I-695 in Baltimore County , and $13.3 million for various improvements and studies along US 29 in Howard County.
• Watershed Implementation Plan (WIP): $92.5 million has been allocated for various WIP projects. Th e Department of Transportation will assume the cost of WIP activities in FY 2016.
Motor Vehicle Administration (MVA)MVA’s FY 2016 capital budget totals $27.2 million. Approximately $6.0 million of this funding is for building improvements, $2.3 million is for the e-MVA service delivery system and $10.6 million is for upgrading MVA IT systems.
Maryland Aviation Administration (MAA)MAA’s FY 2016 capital budget totals $215.0 million and includes the following major projects for BWI/Th urgood Marshall Airport: • $4.9 million for the parking revenue control
system;• $88.4 million for the runway safety area/
pavement management program; and• $68.8 million for improvements to accommodate
increased international service.
Maryland Port Administration (MPA)MPA’s FY 2016 capital budget totals $159.5 million, including $84.5 million for projects related to dredging for the Port of Baltimore.
Capital Budget for Transportation

21
Department of TransportationTotal Program FY 2016 - 2020 ($ millions)
2016 2017 2018 2019 2020 5 Year Total Th e Secretary’s Offi ce 88.1 61.3 16.8 16.6 15.0 197.8Motor Vehicle Admin. 27.2 17.8 15.3 15.5 16.0 91.8Maryland Aviation Admin.1 215.0 110.6 36.6 35.6 34.2 432.0Maryland Port Admin. 159.5 277.2 146.0 176.8 114.5 874.0Maryland Transit Admin. 773.1 1,129.5 1,034.9 801.6 726.9 4,466.0Wash-Metro Area Transit 2 238.2 246.2 262.0 271.5 279.6 1,297.6State Highway Admin. 1,396.3 1,316.7 1,164.2 1,120.9 961.2 5,959.3 Total Capital Spending 2,897.4 3,159.3 2,675.9 2,438.5 2,147.4 13,318.5 Sources of Funds: Special Funds 1,729.2 1,909.0 1,593.9 1,513.1 1,322.7 8,067.9 Federal Funds 2 928.0 973.9 878.2 703.2 664.3 4,147.6 Other Funds 3 240.2 276.3 203.8 222.2 160.5 1,103.0 Total 2,897.4 3,159.2 2,675.9 2,438.5 2,147.5 13,318.5
1 Th e Department is using Passenger Facility Charge (PFC) revenue, Customer Facility Charge (CFC) revenue, and Maryland Transportation Authority (MdTA) bond fi nancing to fund several projects identifi ed in this program. Th e PFC, CFC, and MdTA eligible project costs are included in the totals above. 2 Does not include federal funds received directly by WMATA that are not included in MDOT’s budget.3 Includes other funding sources (PFCs, CFCs, COPs, and MdTA funds for MAA projects).Notes: Projection does not account for the fact that MDOT will assume the cost of the Watershed Implementation Plan. Totals may not add due to rounding.
Maryland Transit Administration (MTA)MTA’s FY 2016 capital budget totals $773.1 million, with $332.7 million coming from federal sources. Major projects include:• MARC commuter rail improvements include
$14.4 million for various improvements on the Camden, Brunswick and Penn lines and $22.2 million for coach and locomotive overhauls and the purchase of new rolling stock.
• Improvements in the Baltimore area include $19.7 million for mid-life overhaul of light rail cars, $20.1 million for bus procurement, $19.6 million for Phase 1 of the Kirk bus facility replacement, $41.8 million for other bus facility and systems upgrades, and $106.2 million for the Red Line project pending review and re-evaluation.
• Improvements in the Washington area include $312.8 million for the Purple Line project pending review and re-evaluation, $18.9 million
for engineering the Corridor Cities Transitway, and $4.3 million to fi nish the Takoma/Langley Park Transit Center.
• Improvements in the Southern Maryland area include $2.9 million for a Commuter Bus initiative and $3.6 million for a Mass Transportation Analysis.
• $34.2 million is provided to assist a variety of locally operated transit systems around the state.
Washington Metropolitan Area Transit Authority (WMATA)WMATA’s FY 2016 capital budget totals $238.2 million. WMATA also receives $106.1 million in federal funds paid directly to WMATA. Approximately $173.4 million of Maryland’s share is for the WMATA capital improvement program, and $53.3 million is for Maryland’s match to the Passenger Rail Investment and Improvement Act of 2008.
Capital Budget for Transportation

22
Summary of Aid by Category($ in thousands)
Totals and percentages may not add due to rounding.
the fiscal year 2016 budget increases aid to local governments by $24.1 million.
Th e fi scal year 2016 budget provides $7 billion in aid to local governments – $24.1 million over fi scal year 2015. Th e primary increases include an additional $45.3 million for K-12 education aid, $2.5 million for libraries, and $3.7 million for community colleges.
2015 2016 $ % Appropriation Allowance Change ChangeTotal Aid (includes Retirement) Primary & Secondary Education 6,064,013 6,109,356 45,342 0.7%Libraries 69,298 71,761 2,463 3.6%Community Colleges 290,526 294,267 3,741 1.3%Transportation 192,919 176,537 -16,382 -8.5%Public Safety 116,200 117,908 1,708 1.5%Disparity Grants 127,738 127,709 -30 0.0%Public Health 41,743 41,743 0 0.0%Natural Resources 30,563 16,000 -14,563 -47.6%Other 79,362 81,230 1,868 2.4% Total State Aid 7,012,362 7,036,511 24,149 0.3% 2015 2016 $ % Appropriation Allowance Change ChangeDirect Aid Primary & Secondary Education 5,325,438 5,341,882 16,444 0.3%Libraries 50,769 52,019 1,249 2.5%Community Colleges 250,233 250,121 -112 0.0%Transportation 192,919 176,537 -16,382 -8.5%Public Safety 116,200 117,908 1,708 1.5%Disparity Grants 127,738 127,709 -30 0.0%Public Health 41,743 41,743 0 0.0%Natural Resources 30,563 16,000 -14,563 -47.6%Other 79,362 81,230 1,868 2.4% Total Direct State Aid 6,214,966 6,205,149 -9,817 -0.2% Retirement Contributions 797,396 831,362 33,966 4.3%Total State Aid 7,012,362 7,036,511 24,149 0.3%
Supporting Local Government

23
Summary of Total Aid by Subdivision (includes Retirement Payments)($ in thousands)
Totals and percentages may not add due to rounding.
2015 2016 % $ % Appropriation Allowance of Total Change Change
Allegany 106,976 106,568 1.5% -408 -0.4%Anne Arundel 465,472 472,490 6.7% 7,019 1.5%Baltimore City 1,254,267 1,213,024 17.2% -41,243 -3.3%Baltimore County 761,774 782,784 11.1% 21,010 2.8%Calvert 103,869 101,003 1.4% -2,866 -2.8%Caroline 60,226 61,301 0.9% 1,075 1.8%Carroll 172,383 166,705 2.4% -5,678 -3.3%Cecil 128,642 127,016 1.8% -1,625 -1.3%Charles 199,185 198,127 2.8% -1,058 -0.5%Dorchester 47,323 49,496 0.7% 2,173 4.6%Frederick 287,779 283,871 4.0% -3,908 -1.4%Garrett 32,930 32,510 0.5% -420 -1.3%Harford 256,889 253,956 3.6% -2,933 -1.1%Howard 309,415 317,427 4.5% 8,012 2.6%Kent 13,730 13,542 0.2% -188 -1.4%Montgomery 870,075 881,129 12.5% 11,054 1.3%Prince George’s 1,207,162 1,242,687 17.7% 35,524 2.9%Queen Anne’s 43,954 44,054 0.6% 99 0.2%St. Mary’s 117,961 119,339 1.7% 1,378 1.2%Somerset 39,713 39,603 0.6% -109 -0.3%Talbot 20,987 21,173 0.3% 186 0.9%Washington 202,326 200,076 2.8% -2,250 -1.1%Wicomico 160,640 163,793 2.3% 3,153 2.0%Worcester 34,664 34,234 0.5% -430 -1.2%Statewide/Unallocated 114,020 110,603 1.6% -3,416 -3.0% Total 7,012,362 7,036,511 100.0% 24,149 0.3%
Total Aid to Local Government: $7 billion
24
Totals and percentages may not add due to rounding.
Summary of Direct Aid by Subdivision (excludes Retirement Payments)($ in thousands)
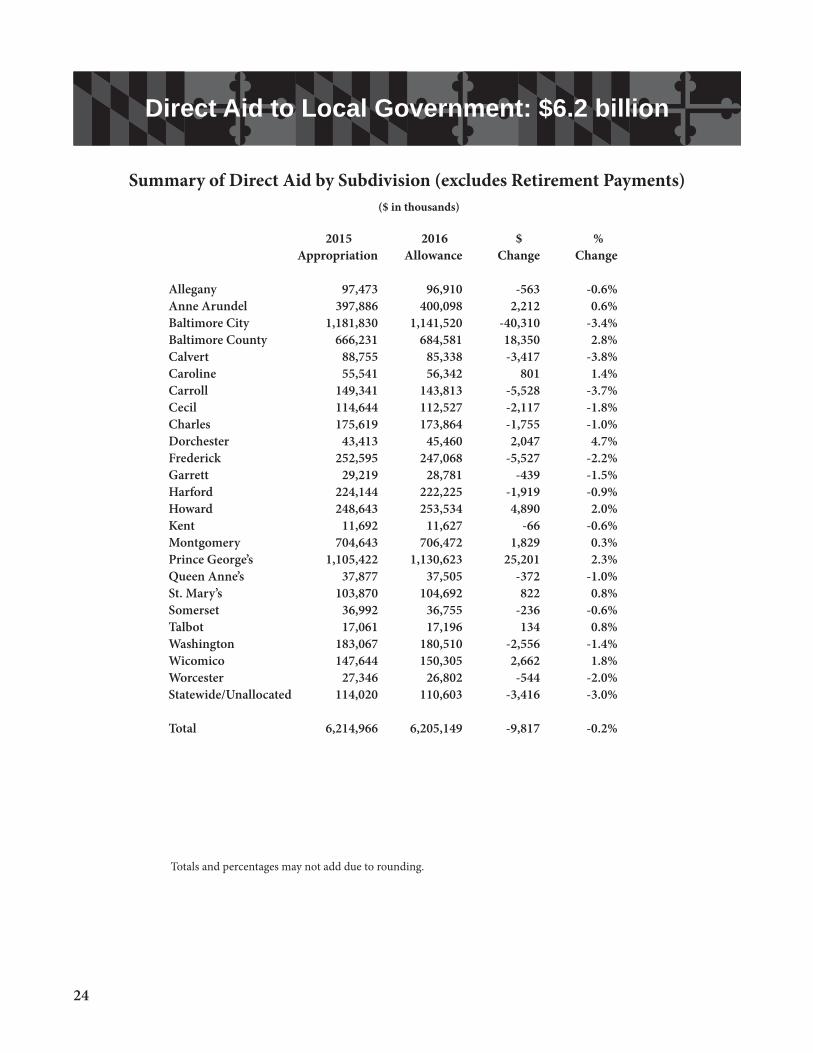
2015 2016 $ % Appropriation Allowance Change Change Allegany 97,473 96,910 -563 -0.6%Anne Arundel 397,886 400,098 2,212 0.6%Baltimore City 1,181,830 1,141,520 -40,310 -3.4%Baltimore County 666,231 684,581 18,350 2.8%Calvert 88,755 85,338 -3,417 -3.8%Caroline 55,541 56,342 801 1.4%Carroll 149,341 143,813 -5,528 -3.7%Cecil 114,644 112,527 -2,117 -1.8%Charles 175,619 173,864 -1,755 -1.0%Dorchester 43,413 45,460 2,047 4.7%Frederick 252,595 247,068 -5,527 -2.2%Garrett 29,219 28,781 -439 -1.5%Harford 224,144 222,225 -1,919 -0.9%Howard 248,643 253,534 4,890 2.0%Kent 11,692 11,627 -66 -0.6%Montgomery 704,643 706,472 1,829 0.3%Prince George’s 1,105,422 1,130,623 25,201 2.3%Queen Anne’s 37,877 37,505 -372 -1.0%St. Mary’s 103,870 104,692 822 0.8%Somerset 36,992 36,755 -236 -0.6%Talbot 17,061 17,196 134 0.8%Washington 183,067 180,510 -2,556 -1.4%Wicomico 147,644 150,305 2,662 1.8%Worcester 27,346 26,802 -544 -2.0%Statewide/Unallocated 114,020 110,603 -3,416 -3.0% Total 6,214,966 6,205,149 -9,817 -0.2%
Direct Aid to Local Government: $6.2 billion

25
Th e fi scal year 2016 budget includes $76.0 million in reductions to Primary and Secondary Education Aid contingent on legisla-tion which (a) freezes the per pupil foundation amount at the FY 2015 level and (b) delays the phased-in change in the calculation of wealth (net taxable income) used in education aid funding formulas by one year.
Foundation Program: Th e foundation program is the largest single local aid program. Under the Foundation program, aid is distributed on the basis of public school enrollment and equalized for taxable wealth so that jurisdictions with smaller per pupil tax bases receive proportionately more aid.
Compensatory Education: Th e Compensatory Education program is directed toward the education of children who are eco-nomically and environmentally disadvantaged. Th e Bridge to Excellence Act directs the aid according to the number of students receiving free or reduced price meals. Special Education: Aid for special education is provided to school systems to help cover the additional cost of educating students with needs for special services. Th ese funds are allocated on a formula basis for students in local schools and to support children placed in nonpublic special education schools. Th e fi scal year 2016 budget refl ects the State’s share at 70 percent of the cost of nonpublic placements over a certain amount.
Student Transportation: Th e Bridge to Excellence Act re-based the grant for the transportation of students to and from school and provides aid for transporting special needs students.
Other Education Aid: Other education aid includes $214.3 million to support students with limited English profi ciency and $55 million for the Guaranteed Tax Base program, which provides grants to those subdivisions that have less than 80 percent of the statewide average wealth per pupil and that provide local education funding above the local share required by the foundation program.
State Retirement System: In addition to direct aid for education, the State pays a portion of pension and retirement benefi ts for teachers, principals, administrators, and other eligible employees on behalf of each board of education.
Primary and Secondary Education

26
Primary and Secondary Education ($ in thousands)
Totals and percentages may not add due to rounding.
Compen- State Foundation satory Special Student Total $ Change % Change Retirement $ Change % Change Program Ed. Ed. Trans. Other Direct from 2015 from 2015 System TOTAL from 2015 from 2015Allegany 40,116 20,927 6,920 4,586 4,344 76,893 515 0.7% 7,709 84,602 480 0.6%Anne Arundel 207,248 67,120 25,259 22,801 12,789 335,218 5,491 1.7% 65,959 401,177 9,365 2.4%Baltimore City 413,670 317,851 69,390 19,504 55,825 876,241 -35,562 -3.9% 69,177 945,418 -36,575 -3.7%Baltimore County 372,401 142,193 47,946 29,834 20,016 612,390 19,053 3.2% 88,580 700,970 21,241 3.1%Calvert 56,745 10,345 4,403 5,690 1,330 78,512 -3,144 -3.9% 14,846 93,358 -2,665 -2.8%Caroline 26,931 13,896 2,556 2,635 3,626 49,644 1,058 2.2% 4,583 54,227 1,321 2.5%Carroll 93,880 14,370 9,676 9,658 1,806 129,389 -4,352 -3.3% 21,079 150,468 -4,597 -3.0%Cecil 62,670 21,752 7,652 5,062 1,830 98,966 -1,729 -1.7% 13,482 112,447 -1,295 -1.1%Charles 107,576 29,852 8,962 10,548 3,015 159,954 -1,347 -0.8% 22,411 182,365 -799 -0.4%Dorchester 21,517 11,364 1,663 2,463 2,660 39,667 2,342 6.3% 3,790 43,457 2,446 6.0%Frederick 159,098 33,146 15,270 12,192 8,622 228,328 -3,432 -1.5% 34,304 262,632 -2,009 -0.8%Garrett 10,751 4,639 999 2,936 1,212 20,537 -128 -0.6% 3,141 23,678 -156 -0.7%Harford 134,485 33,251 18,837 12,451 2,737 201,761 -1,056 -0.5% 28,218 229,979 -2,196 -0.9%Howard 159,725 27,356 14,208 16,504 8,858 226,650 4,334 1.9% 58,664 285,314 6,925 2.5%Kent 3,630 2,590 803 1,553 1,050 9,626 95 1.0% 1,749 11,375 -36 -0.3%Montgomery 335,323 134,863 54,392 39,787 64,099 628,465 4,829 0.8% 161,948 790,413 12,816 1.6%Prince George’s 557,911 277,305 63,377 39,146 92,049 1,029,788 28,735 2.9% 104,646 1,134,433 38,501 3.5%Queen Anne’s 21,612 5,070 2,103 3,312 1,486 33,585 -212 -0.6% 6,125 39,709 243 0.6%St. Mary’s 68,065 16,770 4,838 6,797 1,619 98,088 1,075 1.1% 13,850 111,938 1,570 1.4%Somerset 13,311 8,758 2,243 1,855 2,399 28,566 177 0.6% 2,671 31,237 295 1.0%Talbot 4,498 4,825 1,003 1,610 1,545 13,482 590 4.6% 3,582 17,064 631 3.8%Washington 97,353 42,274 8,002 7,101 9,168 163,898 -1,320 -0.8% 17,541 181,440 -1,107 -0.6%Wicomico 69,876 39,539 7,355 5,242 10,456 132,468 3,916 3.0% 12,555 145,023 4,356 3.1%Worcester 6,443 7,277 1,764 2,981 985 19,450 10 0.0% 6,864 26,314 84 0.3%Statewide/Unallocated 0 0 23,926 0 26,390 50,316 -3,495 -6.5% 0 50,316 -3,495 -6.5%Total 3,044,833 1,287,334 403,550 266,247 339,919 5,341,882 16,444 0.3% 767,473 6,109,356 45,342 0.7%
27
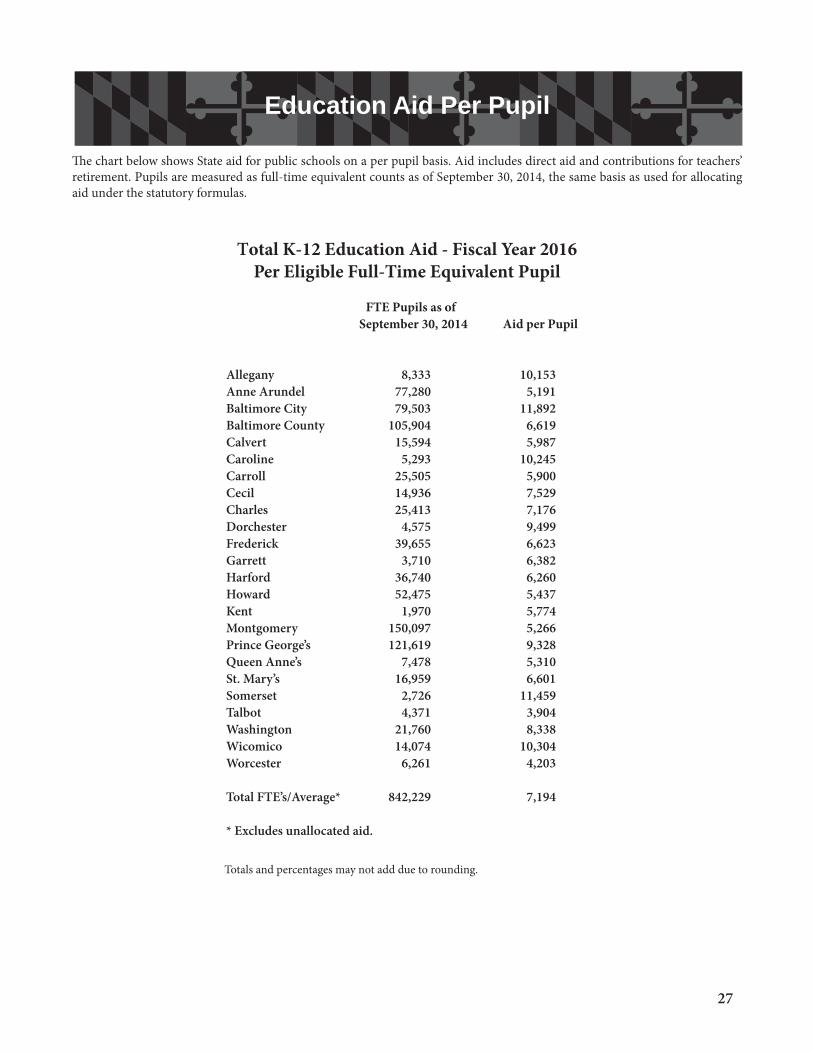
Total K-12 Education Aid - Fiscal Year 2016Per Eligible Full-Time Equivalent Pupil
Totals and percentages may not add due to rounding.
Th e chart below shows State aid for public schools on a per pupil basis. Aid includes direct aid and contributions for teachers’ retirement. Pupils are measured as full-time equivalent counts as of September 30, 2014, the same basis as used for allocating aid under the statutory formulas.
FTE Pupils as of September 30, 2014 Aid per Pupil Allegany 8,333 10,153 Anne Arundel 77,280 5,191 Baltimore City 79,503 11,892 Baltimore County 105,904 6,619 Calvert 15,594 5,987 Caroline 5,293 10,245 Carroll 25,505 5,900 Cecil 14,936 7,529 Charles 25,413 7,176 Dorchester 4,575 9,499 Frederick 39,655 6,623 Garrett 3,710 6,382 Harford 36,740 6,260 Howard 52,475 5,437 Kent 1,970 5,774 Montgomery 150,097 5,266 Prince George’s 121,619 9,328 Queen Anne’s 7,478 5,310 St. Mary’s 16,959 6,601 Somerset 2,726 11,459 Talbot 4,371 3,904 Washington 21,760 8,338 Wicomico 14,074 10,304 Worcester 6,261 4,203 Total FTE’s/Average* 842,229 7,194 * Excludes unallocated aid.
Education Aid Per Pupil

28
($ in thousands)
Totals and percentages may not add due to rounding.
Library Aid Formula: Th e State supports the current operating and capital expenses of local library systems. Aid is distributed on the basis of population and is equalized so that jurisdictions with smaller per capita tax bases receive more aid per capita. During the 2014 Legislative Session, legislation passed increasing the per capita calculation for library aid and phasing in this change through FY 2019. Th e Administration has introduced legislation to phase-in the increase over 10 years.
State Library Network: Th e library network program provides aid for the State Library Resource Center at the Enoch Pratt Cen-tral Library in Baltimore and the three regional resource centers in non-metropolitan areas. Th e Administration has introduced legislation to phase-in the increase over 10 years.
State Retirement System: In addition to direct aid for libraries, the State pays the entire cost of pension and retirement benefi ts for eligible librarians and other employees on behalf of the library systems. Th ere is an exception for Montgomery County where librarians have elected to remain in the Montgomery County Retirement System rather than in the State system, in which case the State remits the lesser of the cost of retirement for the county or the State systems.
State Retirement $ Change Formula Network System TOTAL from 2015 Allegany 752 0 177 929 20Anne Arundel 2,138 0 1,698 3,836 337Baltimore City 6,096 0 2,327 8,423 124Baltimore County 5,545 0 2,663 8,208 387Calvert 410 0 406 815 45Caroline 278 0 141 420 8Carroll 929 0 881 1,809 90Cecil 740 0 425 1,165 40Charles 967 0 439 1,406 10Dorchester 263 0 71 335 25Frederick 1,360 0 887 2,248 90Garrett 138 0 103 241 21Harford 1,483 0 1,362 2,844 104Howard 869 0 2,100 2,969 173Kent 83 0 81 164 7Montgomery 2,902 0 2,201 5,103 122Prince George’s 6,965 0 2,085 9,051 394Queen Anne’s 144 0 163 307 20St. Mary’s 636 0 347 983 41Somerset 277 0 73 350 12Talbot 108 0 148 256 6Washington 1,206 0 486 1,692 53Wicomico 971 0 212 1,183 27Worcester 147 0 266 413 18Statewide/Unallocated 0 16,613 0 16,613 290Total 35,406 16,613 19,742 71,761 2,463
Libraries
29
($ in thousands)
Totals may not add due to rounding.
Current Expense Formula: Th e current expense formula bases funding on a percentage of the appropriation per FTE student at four-year public higher education institutions. Th e fi scal year 2016 budget includes a reduction of $13 million contingent upon the enactment of legislation reducing the community college formula.
Unrestricted Grants and Special Programs: Th e budget includes $6.0 million to fund a statewide program for out-of-county or out-of-State students in regional or health manpower shortage programs, $5.6 million for the English for Speakers of Other Languages program, $4 million for small community colleges, $600,000 for Appalachian Mountain Grants, and $421,697 for other out-of-county and out-of-State student agreements.
Optional Retirement: Th e State distributes funds directly to the community colleges to reimburse them for the employer cost of members of the Optional Retirement System, a vendor operated, defi ned contribution plan off ered as an alternative to the State’s defi ned benefi t pension and retirement systems.
State Retirement System: In addition to direct aid to community colleges, the State pays the entire cost of pension and retirement benefi ts for eligible teachers, administrators, and other employees on behalf of each community college.
Unrestricted Grants and State Special Optional Retirement $ Change Formula Programs Retirement System TOTAL from 2015Allegany 4,593 1,160 191 1,772 7,717 11Anne Arundel 27,461 507 1,471 4,735 34,174 -918Baltimore City * 0 0 0 0 0 0Baltimore County 38,157 664 2,217 6,960 47,998 124Calvert 2,349 0 135 413 2,897 55Caroline 1,403 154 87 234 1,878 33Carroll 7,195 442 522 932 9,092 77Cecil 4,964 409 463 583 6,419 29Charles 8,041 1 462 1,414 9,917 269Dorchester 1,046 114 65 175 1,400 18Frederick 8,795 223 728 1,611 11,358 10Garrett 2,516 1,106 130 486 4,238 -13Harford 10,755 45 460 2,152 13,411 103Howard 15,643 489 1,204 3,130 20,466 1,320Kent 509 56 32 85 681 17Montgomery 39,680 2,296 4,802 10,507 57,286 2,064Prince George’s 25,800 1,046 847 5,333 33,027 1,196Queen Anne’s 1,566 171 97 261 2,096 -46St. Mary’s 2,560 0 147 450 3,158 -37Somerset 617 393 26 103 1,139 -306Talbot 1,486 163 92 248 1,988 -4Washington 7,501 837 297 1,538 10,173 5Wicomico 4,301 260 179 721 5,461 -205Worcester 1,805 109 75 302 2,292 -61Statewide/Unallocated 0 6,000 0 0 6,000 0Total 218,745 16,646 14,730 44,146 294,267 3,741 * Th e State assumes the cost of Baltimore City Community College, which is not refl ected on this chart.
Community Colleges

30
Education - Primary and Secondary, Libraries and Community Colleges(excluding four-year colleges and universities)
($ in thousands)
Totals may not add due to rounding.
Primary & Secondary Libraries Community Colleges $ Change % Change Direct Retirement Direct Retirement Direct Retirement TOTAL from 2015 from 2015 Allegany 76,893 7,709 752 177 5,944 1,964 93,439 510 0.5%Anne Arundel 335,218 65,959 2,138 1,698 29,439 6,206 440,658 8,784 2.0%Baltimore City * 876,241 69,177 6,096 2,327 0 0 953,841 -36,451 -3.7%Baltimore County 612,390 88,580 5,545 2,663 41,038 9,177 759,394 21,752 2.9%Calvert 78,512 14,846 410 406 2,484 548 97,205 -2,566 -2.6%Caroline 49,644 4,583 278 141 1,644 321 56,612 1,362 2.5%Carroll 129,389 21,079 929 881 8,159 1,455 161,891 -4,430 -2.7%Cecil 98,966 13,482 740 425 5,836 1,046 120,493 -1,226 -1.0%Charles 159,954 22,411 967 439 8,504 1,875 194,149 -520 -0.3%Dorchester 39,667 3,790 263 71 1,225 240 45,256 2,489 5.8%Frederick 228,328 34,304 1,360 887 9,746 2,339 276,965 -1,910 -0.7%Garrett 20,537 3,141 138 103 3,753 616 28,288 -148 -0.5%Harford 201,761 28,218 1,483 1,362 11,259 2,612 246,695 -1,989 -0.8%Howard 226,650 58,664 869 2,100 17,336 4,334 309,954 8,418 2.8%Kent 9,626 1,749 83 81 596 117 12,251 -13 -0.1%Montgomery 628,465 161,948 2,902 2,201 46,778 15,309 857,604 15,002 1.8%Prince George’s 1,029,788 104,646 6,965 2,085 27,694 6,180 1,177,358 40,091 3.5%Queen Anne’s 33,585 6,125 144 163 1,834 359 42,209 218 0.5%St. Mary’s 98,088 13,850 636 347 2,708 597 116,226 1,575 1.4%Somerset 28,566 2,671 277 73 1,036 129 32,752 2 0.0%Talbot 13,482 3,582 108 148 1,740 340 19,401 633 3.4%Washington 163,898 17,541 1,206 486 8,635 1,836 193,602 -1,049 -0.5%Wicomico 132,468 12,555 971 212 4,741 900 151,846 4,177 2.8%Worcester 19,450 6,864 147 266 1,990 378 29,094 41 0.1%Statewide/Unallocated 50,316 0 16,613 0 6,000 0 72,929 -3,205 -4.2%
Total 5,341,882 767,473 52,019 19,742 250,121 58,876 6,490,114 51,547 0.8%
* Th e State assumes the cost of Baltimore City Community College.

31
($ in thousands)
Totals and percentages may not add due to rounding.
Aid for Police Protection: Th e State gives grants to the subdivisions to help provide for police protection services, which are distributed through a formula based on population and population density. Grants are shared between counties and munici-palities on the basis of expenditures, and municipalities receive an additional grant based on the number of police offi cers. Th e Administration has introduced legislation to limit the FY 2015 and FY 2016 grants to the lesser of (a) the grant calculations for those fi scal years, or (b) the FY 2014 grant amount.
Aid for Fire, Rescue and Ambulance Systems: Counties and municipalities receive grants for fi re, rescue, and ambulance equip-ment, and capital renovations.
Special Grants: Th e budget includes funding to Baltimore City for foot patrol, violent crime grants, community policing, the War Room, and a $2.5 million grant to the Baltimore City State’s Attorney’s offi ce. In Prince George’s County, funds are provided for drug enforcement, violent crime prevention grant programs, and $1.5 million for the State’s Attorney’s offi ce. Additional general funds are provided for STOP Gun Violence grants and the domestic violence unit. Also included are special funds awarded by the Vehicle Th eft Prevention Council, grants from the State’s telephone surcharge for the “911” emergency system, and grants to help enforce school bus safety laws.
Police Fire & Special $ Change Aid Rescue Grants TOTAL from 2015 Allegany 867 303 0 1,170 37Anne Arundel 6,850 1,100 0 7,950 150Baltimore City 0 1,234 10,368 11,601 163Baltimore County 9,929 1,554 0 11,484 206Calvert 775 268 0 1,043 34Caroline 337 276 0 613 33Carroll 1,589 348 0 1,937 48Cecil 997 281 0 1,278 40Charles 1,301 338 0 1,639 49Dorchester 382 295 0 677 51Frederick 2,358 493 0 2,851 66Garrett 227 268 0 495 33Harford 2,812 512 0 3,324 68Howard 3,567 542 0 4,109 73Kent 203 274 0 477 34Montgomery 15,555 1,754 0 17,309 233Prince George’s 14,307 1,521 5,261 21,089 199Queen Anne’s 425 268 0 693 34St. Mary’s 919 200 0 1,119 -34Somerset 244 278 0 522 34Talbot 425 332 0 757 30Washington 1,468 307 0 1,774 40Wicomico 1,087 310 0 1,396 30Worcester 653 346 0 999 45Statewide/Unallocated 0 0 21,602 21,602 9Total 67,277 13,400 37,231 117,908 1,708
Police, Fire and Public Safety

32
($ in thousands)
Totals and percentages may not add due to rounding.
Highway User Revenues: Th e motor vehicle fuel tax, motor vehicle registration fees, a share of the motor vehicle titling tax, and a share of the corporate income tax are designated as Highway User Revenues. Th e State shares these revenues with the counties and municipalities to help fund the construction and maintenance of local roads. Baltimore City receives 7.7% in fi scal year 2016.
Th e remaining counties and municipalities receive 1.5% and 0.4% respectively in fi scal year 2016. Th e distribution is made ac-cording to a formula based on locally maintained road mileage and vehicle registrations
Elderly and Disabled Transportation: Grants are provided to fund local transportation services for elderly and disabled persons, with 60 percent of the money distributed equally among the counties and Baltimore City and 40 percent based on the distribution of the elderly and disabled populations. In addition, funding is included to help defray the cost of providing paratransit services required under the federal Americans with Disabilities Act.
Transportation
Highway Elderly & $ Change % Change Users Disabled TOTAL from 2015 from 2015 Allegany 813 210 1,023 -818 -44.4%Anne Arundel 3,132 662 3,794 -715 -15.9%Baltimore City 135,796 379 136,175 -306 -0.2%Baltimore County 3,987 396 4,383 -17 -0.4%Calvert 700 203 903 -200 -18.1%Caroline 513 160 673 -284 -29.7%Carroll 1,494 151 1,645 -928 -36.1%Cecil 828 134 962 -469 -32.8%Charles 1,031 313 1,345 -267 -16.6%Dorchester 571 173 744 -333 -30.9%Frederick 2,083 619 2,702 -1,770 -39.6%Garrett 626 120 746 -266 -26.3%Harford 1,684 211 1,895 -782 -29.2%Howard 1,532 593 2,125 0 0.0%Kent 294 120 415 -171 -29.2%Montgomery 4,719 379 5,098 -2,541 -33.3%Prince George’s 4,259 779 5,038 -3,276 -39.4%Queen Anne’s 560 122 682 -111 -14.0%St. Mary’s 783 266 1,049 -73 -6.5%Somerset 326 214 540 -124 -18.7%Talbot 515 120 635 -434 -40.6%Washington 1,308 335 1,643 -1,059 -39.2%Wicomico 1,023 231 1,254 -890 -41.5%Worcester 727 341 1,068 -550 -34.0%Statewide/Unallocated 0 0 0 0 Total 169,304 7,233 176,537 -16,382 -8.5%

33
($ in thousands)
Totals and percentages may not add due to rounding.
Local Health Grants: Th is program funds a wide range of preventive health services such as family planning, maternity and child care assistance, cancer control, and AIDS education and outreach. Th e Administration has introduced legislation to limit the FY 2015 and FY 2016 grants to the FY 2014 fi scal year grant amount.
Disparity Grants: Grants are distributed to subdivisions whose per capita income tax revenues are less than 75 percent of the statewide average. Beginning in fi scal year 2011, funding to any county is not required to exceed the fi scal year 2010 grant. Th e formula was modifi ed during the 2013 legislative session to add a minimum grant amount based on the local tax eff ort of eligible counties and increase the local income tax rate required to be eligible to receive a grant from 2.4% to 2.6%. Th e Administration has introduced legislation to limit the FY 2015 and FY 2016 grants to the lesser of (a) the grant calculations for those fi scal years or (b) the FY 2014 grant amount.
Program Open Space: Th is program provides for the acquisition and development of parks and other conservation areas.
Program VLT Local Disparity Open Impact $ Change Health Grant Space Aid Other TOTAL from 2015 Allegany 1,051 7,299 160 987 1,632 11,128 -138Anne Arundel 3,507 0 1,704 16,273 75 21,559 -1,201Baltimore City 7,449 79,052 3,028 10,786 11,091 111,406 -4,649Baltimore County 4,812 0 1,928 0 3,000 9,740 -931Calvert 426 0 169 0 1,392 1,986 -135Caroline 597 2,132 75 0 685 3,489 -36Carroll 1,371 0 383 0 0 1,754 -367Cecil 899 299 197 3,351 0 4,746 29Charles 1,109 0 347 0 0 1,456 -320Dorchester 488 2,023 64 0 309 2,883 -34Frederick 1,685 0 396 0 0 2,081 -295Garrett 495 2,131 79 0 406 3,111 -40Harford 1,936 0 567 0 0 2,503 -230Howard 1,359 0 1,005 80 0 2,444 -480Kent 383 0 48 0 0 431 -38Montgomery 3,388 0 2,532 0 0 5,920 -1,641Prince George’s 5,599 21,695 2,178 948 9,629 40,049 -1,490Queen Anne’s 465 0 102 0 0 567 -41St. Mary’s 900 0 192 0 0 1,092 -90Somerset 479 4,908 46 0 382 5,815 -21Talbot 365 0 107 0 0 472 -43Washington 1,536 1,516 302 0 0 3,354 -182Wicomico 1,053 6,654 201 0 1,568 9,476 -164Worcester 393 0 190 2,565 0 3,148 34Statewide/Unallocated 0 0 0 0 16,072 16,072 -220Total 41,743 127,709 16,000 34,989 46,241 266,682 -12,724
Miscellaneous

34
Totals and percentages may not add due to rounding.
($ in thousands)
Under this statutory program the State pays, on behalf of each county board of education, a portion of pension and retirement benefi ts for eligible teachers, principals and other eligible school employees. Th e State pays the entire cost of pension and retire-ment benefi ts on behalf of community colleges and the library system. Th ere is an exception for Montgomery County where librarians have elected to remain in the Montgomery County Retirement System rather than in the State system, in which case the State remits the lesser of the cost of retirement for the county or the State systems.
Th ere is no distribution of funds directly to the subdivisions, but rather lump sum payments are made to the State’s retirement board. Each subdivision’s share of the State’s retirement appropriation, however, can be estimated based on county-by-county salary data.
Boards of Community $ Change % Change Education Libraries Colleges TOTAL over 2015 over 2015 Allegany 7,709 177 1,772 9,659 155 1.6%Anne Arundel 65,959 1,698 4,735 72,393 4,807 7.1%Baltimore City 69,177 2,327 0 71,504 -933 -1.3%Baltimore County 88,580 2,663 6,960 98,203 2,660 2.8%Calvert 14,846 406 413 15,664 551 3.6%Caroline 4,583 141 234 4,959 274 5.8%Carroll 21,079 881 932 22,892 -150 -0.7%Cecil 13,482 425 583 14,490 492 3.5%Charles 22,411 439 1,414 24,264 697 3.0%Dorchester 3,790 71 175 4,036 126 3.2%Frederick 34,304 887 1,611 36,803 1,619 4.6%Garrett 3,141 103 486 3,730 18 0.5%Harford 28,218 1,362 2,152 31,731 -1,014 -3.1%Howard 58,664 2,100 3,130 63,894 3,122 5.1%Kent 1,749 81 85 1,915 -122 -6.0%Montgomery 161,948 2,201 10,507 174,657 9,225 5.6%Prince George’s 104,646 2,085 5,333 112,064 10,323 10.1%Queen Anne’s 6,125 163 261 6,549 471 7.8%St. Mary’s 13,850 347 450 14,647 556 3.9%Somerset 2,671 73 103 2,848 127 4.7%Talbot 3,582 148 248 3,978 52 1.3%Washington 17,541 486 1,538 19,566 306 1.6%Wicomico 12,555 212 721 13,488 491 3.8%Worcester 6,864 266 302 7,432 114 1.6%Statewide/Unallocated 0 0 0 0 0
Total 767,473 19,742 44,146 831,362 33,966 4.3%
Retirement Contributions

35
Appropriation DetailAll Budgeted Funds as Proposed (in thousands of $)
Note: Th ese totals diff er from those on the individual department summaries because these fi gures exclude reimbursable funds.
(continued on next page)
Fiscal Years 2014 2015 2016HEALTH AND MENTAL HYGIENE 10,650,727 12,475,574 12,307,607EDUCATION 7,240,225 7,417,939 7,479,896UNIVERSITY SYSTEM OF MARYLAND 4,789,472 4,998,122 5,192,308TRANSPORTATION 4,005,922 4,480,845 4,960,287HUMAN RESOURCES 2,575,966 2,711,911 2,596,416PUBLIC SAFETY AND CORRECTIONAL SERVICES 1,297,685 1,334,404 1,358,540PUBLIC DEBT 980,738 1,039,422 1,130,855JUDICIARY 450,228 495,793 534,327HIGHER EDUCATION COMMISSION 468,048 473,081 462,577ENVIRONMENT 359,305 377,762 382,826HOUSING AND COMMUNITY DEVELOPMENT 347,680 373,226 380,201LABOR, LICENSING, AND REGULATION 339,022 378,295 359,605STATE POLICE 306,323 340,144 339,755JUVENILE SERVICES 287,734 290,244 290,747NATURAL RESOURCES 227,859 247,030 241,901PAYMENTS TO CIVIL DIVISIONS 155,467 155,467 155,367STATE RESERVE FUND 55,256 14,786 150,000BUSINESS AND ECONOMIC DEVELOPMENT 140,646 170,115 139,799ASSESSMENTS AND TAXATION 129,491 136,021 136,892MORGAN STATE UNIVERSITY 211,020 221,786 136,166BOARDS, COMMISSIONS AND OFFICES 127,006 127,422 131,608MILITARY 84,109 76,263 114,557COMPTROLLER OF MARYLAND 96,473 103,182 107,688LOTTERY AND GAMING CONTROL AGENCY 151,748 145,030 103,370OFFICE OF THE PUBLIC DEFENDER 97,779 97,110 97,560BALTIMORE CITY COMMUNITY COLLEGE 85,280 89,960 89,656LEGISLATIVE 78,353 82,328 84,313HEALTH BENEFIT EXCHANGE 152,452 162,409 76,211AGRICULTURE 98,550 73,264 73,099ST. MARY’S COLLEGE OF MARYLAND 65,038 71,571 72,799GENERAL SERVICES 66,193 65,543 65,501BUDGET AND MANAGEMENT 25,541 41,521 64,464STADIUM AUTHORITY 34,891 36,837 52,175ENERGY ADMINISTRATION 49,743 66,392 50,536AGING 48,687 47,879 48,318OFFICE OF THE ATTORNEY GENERAL 26,784 32,824 40,189PUBLIC SERVICE COMMISSION 42,528 46,324 38,602MAJOR I.T. DEVELOPMENT PROJECT FUND 20,101 23,366 37,452INSURANCE ADMINISTRATION 28,932 32,697 31,994SCHOOL FOR THE DEAF 29,312 30,866 31,569PUBLIC BROADCASTING COMMISSION 24,795 27,972 30,902
Appendix I
Th e electronic version of this page has been updated from the printed version and is correct as of 1/23/15.

36
Appropriation DetailAll Budgeted Funds as Proposed (in thousands of $)
Fiscal Years 2014 2015 2016BOARD OF PUBLIC WORKS - CAPITAL 28,950 1,100 30,000INFORMATION TECHNOLOGY 32,095 26,176 29,175VETERANS AFFAIRS 28,485 27,215 28,179PLANNING 27,470 27,922 28,092MARYLAND HEALTH INSURANCE PROGRAM 171,612 97,367 19,950BOARD OF ELECTIONS 18,203 15,180 19,354INSTITUTE FOR EMERGENCY MEDICAL SERVICES 15,947 24,826 18,746TECHNOLOGY DEVELOPMENT CORPORATION 18,388 18,692 18,516RETIREMENT AND PENSION SYSTEMS 17,347 18,162 18,192WORKERS’ COMPENSATION COMMISSION 13,055 14,515 14,221DISABILITIES 5,547 11,113 11,881EXECUTIVE DEPARTMENT - GOVERNOR’S OFFICE 10,692 11,999 11,581STATE ARCHIVES 8,363 12,742 9,801BOARD OF PUBLIC WORKS 7,729 8,305 7,171STATE TREASURER’S OFFICE 6,080 6,919 7,114OFFICE OF THE PEOPLE’S COUNSEL 3,657 3,889 3,952HISTORIC ST. MARY’S CITY COMMISSION 2,850 3,012 3,237COMMISSION ON CIVIL RIGHTS 2,887 3,224 3,131SECRETARY OF STATE 2,305 2,364 2,445SUBSEQUENT INJURY FUND 2,118 2,195 2,239COMMISSION FOR SCHOOL CONSTRUCTION 1,747 1,827 1,984AFRICAN AMERICAN MUSEUM CORPORATION 2,000 1,960 1,959GOVERNOR’S OFFICE FOR CHILDREN 1,479 1,776 1,698SUPPLEMENTAL RETIREMENT PLANS 1,522 1,667 1,662UNINSURED EMPLOYERS’ FUND 1,268 1,524 1,506OFFICE OF THE STATE PROSECUTOR 1,340 1,407 1,402PROPERTY TAX ASSESSMENT APPEALS BOARD 969 1,046 1,047BOARD OF CONTRACT APPEALS 643 655 666MARYLAND TAX COURT 568 597 608CANAL PLACE 557 590 542OFFICE OF THE DEAF AND HARD OF HEARING 348 373 82OFFICE OF ADMINISTRATIVE HEARINGS 1,066 1,201 44 Total 36,890,396 39,964,268 40,478,811 Additional reversions from State agencies (30,012) (30,000)Voluntary Separation Program (7,500) (30,000) Adjusted Total 36,890,396 39,926,756 40,418,811 Figures refl ect the January 2015 actions of the Board of Public Works, as well as proposed defi ciencies, planned reversions, contingent reductions, and back-of-the-bill reductions. Totals may not add due to rounding.
Appendix IAppendix I
Note: Th e electronic version of this page has been updated from the printed version and is correct as of 1/23/15.

37
Appropriation DetailGeneral Funds as Proposed (in thousands of $)
Totals may not add due to rounding.
Fiscal Years 2014 2015 2016
EDUCATION 5,789,217 5,957,433 5,988,725HEALTH AND MENTAL HYGIENE 4,060,596 4,131,129 4,163,675SUPPORT FOR INSTITUTIONS OF HIGHER EDUCATION 1,205,003 1,287,894 1,305,490PUBLIC SAFETY AND CORRECTIONAL SERVICES 1,137,521 1,165,572 1,186,397HUMAN RESOURCES 652,142 621,244 627,697JUDICIARY 400,305 429,946 468,398HIGHER EDUCATION COMMISSION 437,791 445,202 450,142JUVENILE SERVICES 275,597 278,135 278,592PUBLIC DEBT 83,000 140,000 274,000STATE POLICE 226,204 244,595 245,202PAYMENTS TO CIVIL DIVISIONS 155,467 155,467 155,367STATE RESERVE FUND 55,256 14,786 150,000ASSESSMENTS AND TAXATION 102,820 107,770 107,954BOARDS, COMMISSIONS AND OFFICES 101,432 102,785 102,877OFFICE OF THE PUBLIC DEFENDER 97,523 96,897 97,367COMPTROLLER OF MARYLAND 75,117 82,258 85,043LEGISLATIVE 78,353 82,328 84,313BUSINESS AND ECONOMIC DEVELOPMENT 64,902 72,066 72,302GENERAL SERVICES 61,637 61,252 60,943NATURAL RESOURCES 49,415 72,777 54,031LABOR, LICENSING, AND REGULATION 42,711 44,597 44,591BUDGET AND MANAGEMENT 14,475 17,052 41,750MAJOR I.T. DEVELOPMENT PROJECT FUND 20,101 21,235 35,607ENVIRONMENT 36,568 33,445 33,490SCHOOL FOR THE DEAF 28,465 30,002 30,724BOARD OF PUBLIC WORKS - CAPITAL 28,950 1,100 30,000AGRICULTURE 26,707 27,077 27,012LOTTERY AND GAMING CONTROL AGENCY 81,648 71,381 24,997PLANNING 22,296 21,228 21,802AGING 20,507 21,035 21,381INFORMATION TECHNOLOGY 15,784 17,919 19,404TECHNOLOGY DEVELOPMENT CORPORATION 18,388 18,692 18,516OFFICE OF THE ATTORNEY GENERAL 16,476 17,059 17,669MILITARY 11,876 11,931 12,194STADIUM AUTHORITY 14,891 16,837 12,175
Appendix I
Note: Th e electronic version of this page has been updated from the printed version and is correct as of 1/23/15.

38
Appropriation DetailGeneral Funds as Proposed (in thousands of $)
Totals may not add due to rounding.
Fiscal Years 2014 2015 2016
EXECUTIVE DEPARTMENT - GOVERNOR’S OFFICE 10,692 11,999 11,581PUBLIC BROADCASTING COMMISSION 7,618 8,254 8,003VETERANS AFFAIRS 7,300 8,242 7,881BOARD OF PUBLIC WORKS 7,729 8,305 7,171BOARD OF ELECTIONS 9,065 6,178 5,781STATE TREASURER’S OFFICE 4,989 4,993 5,091HOUSING AND COMMUNITY DEVELOPMENT 6,680 8,101 4,639DISABILITIES 2,728 3,028 3,105STATE ARCHIVES 2,006 2,089 2,509COMMISSION ON CIVIL RIGHTS 2,368 2,461 2,463HISTORIC ST. MARY’S CITY COMMISSION 2,096 2,114 2,305COMMISSION FOR SCHOOL CONSTRUCTION 1,747 1,827 1,984AFRICAN AMERICAN MUSEUM CORPORATION 2,000 1,960 1,959SECRETARY OF STATE 1,897 1,906 1,929GOVERNOR’S OFFICE FOR CHILDREN 1,479 1,776 1,698OFFICE OF THE STATE PROSECUTOR 1,340 1,407 1,402PROPERTY TAX ASSESSMENT APPEALS BOARD 969 1,046 1,047BOARD OF CONTRACT APPEALS 643 655 666MARYLAND TAX COURT 568 597 608CANAL PLACE 63 155 102OFFICE OF THE DEAF AND HARD OF HEARING 348 373 82HEALTH BENEFIT EXCHANGE 19,340 20,727 0 Total 15,602,806 16,018,319 16,421,832 Additional reversions from State agencies (30,012) (30,000)Voluntary Separation Program (7,500) (30,000) Adjusted Total 15,602,806 15,980,808 16,361,832 Figures refl ect the January 2015 actions of the Board of Public Works, as well as proposed defi ciencies, planned reversions, contingent reductions, and back-of-the-bill reductions.
Appendix I
Note: Th e electronic version of this page has been updated from the printed version and is correct as of 1/23/15.

39
Position SummaryFull-Time Equivalent Positions
Totals may not add due to rounding.
(continued on next page)
Fiscal Years 2014 2015 2016 Auth. Contr. Auth. Contr. Auth. Contr.
UNIVERSITY SYSTEM OF MARYLAND 23,310 5,877 23,531 5,272 23,531 5,321 PUBLIC SAFETY AND CORRECTIONAL SERVICES 11,046 272 11,126 400 11,123 398 TRANSPORTATION 8,819 131 9,179 41 9,179 41 HEALTH AND MENTAL HYGIENE 6,407 1,050 6,394 1,096 6,428 1,113 HUMAN RESOURCES 6,529 146 6,532 83 6,509 74 JUDICIARY 3,639 446 3,733 431 3,966 334 STATE POLICE 2,425 26 2,446 57 2,446 68 JUVENILE SERVICES 2,078 161 2,062 142 2,062 143 LABOR, LICENSING, AND REGULATION 1,628 258 1,641 276 1,640 294 EDUCATION 1,446 175 1,458 215 1,459 174 NATURAL RESOURCES 1,295 370 1,302 445 1,329 438 MORGAN STATE UNIVERSITY 1,149 473 1,138 479 1,138 479 COMPTROLLER OF MARYLAND 1,121 39 1,130 39 1,128 29 ENVIRONMENT 937 25 955 53 958 48 OFFICE OF THE PUBLIC DEFENDER 925 5 923 9 923 10 LEGISLATIVE 748 - 749 - 749 - ASSESSMENTS AND TAXATION 616 18 614 18 622 15 GENERAL SERVICES 594 15 585 24 585 24 BALTIMORE CITY COMMUNITY COLLEGE 451 264 451 238 451 175 ST. MARY’S COLLEGE OF MARYLAND 434 31 423 31 424 30 AGRICULTURE 383 42 383 40 384 43 HOUSING AND COMMUNITY DEVELOPMENT 337 48 339 80 345 55 BUDGET AND MANAGEMENT 308 15 316 12 320 10 SCHOOL FOR THE DEAF 320 100 320 94 320 97 LOTTERY AND GAMING CONTROL AGENCY 310 8 309 7 318 7 MILITARY 320 59 317 15 316 27 INSURANCE ADMINISTRATION 266 18 266 18 266 18 OFFICE OF THE ATTORNEY GENERAL 249 17 249 27 258 28 BUSINESS AND ECONOMIC DEVELOPMENT 222 18 221 18 221 18 RETIREMENT AND PENSION SYSTEMS 192 16 192 17 204 10 PLANNING 152 12 151 19 151 19 PUBLIC BROADCASTING COMMISSION 144 21 149 17 149 18 PUBLIC SERVICE COMMISSION 139 9 139 15 140 12 INFORMATION TECHNOLOGY 134 2 140 4 138 1 WORKERS’ COMPENSATION COMMISSION 121 7 121 11 121 11
Appendix II
40
Position SummaryFull-Time Equivalent Positions
Totals may not add due to rounding.
Fiscal Years 2014 2015 2016 Auth. Contr. Auth. Contr. Auth. Contr.
OFFICE OF ADMINISTRATIVE HEARINGS 118 6 120 12 120 9 BOARDS, COMMISSIONS AND OFFICES 97 20 97 20 97 24 INSTITUTE FOR EMERGENCY MEDICAL SERVICES 94 10 95 15 96 20 EXECUTIVE DEPARTMENT - GOVERNOR’S OFFICE 89 0 88 - 88 - VETERANS AFFAIRS 76 4 79 5 79 4 HEALTH BENEFIT EXCHANGE 72 - 69 1 69 - STATE TREASURER’S OFFICE 57 0 59 - 59 - HIGHER EDUCATION COMMISSION 56 7 57 13 59 7 STATE ARCHIVES 56 40 58 23 58 22 AGING 52 23 52 26 52 26 BOARD OF ELECTIONS 42 2 42 - 42 1 ENERGY ADMINISTRATION 30 13 34 11 34 11 COMMISSION ON CIVIL RIGHTS 35 - 35 - 34 - HISTORIC ST. MARY’S CITY COMMISSION 32 13 32 16 29 17 DISABILITIES 24 7 26 8 26 5 SECRETARY OF STATE 24 1 24 1 25 1 COMMISSION FOR SCHOOL CONSTRUCTION 18 - 19 - 21 - OFFICE OF THE PEOPLE’S COUNSEL 19 - 19 - 19 - SUBSEQUENT INJURY FUND 17 - 17 - 17 - GOVERNOR’S OFFICE FOR CHILDREN 17 - 17 - 17 - UNINSURED EMPLOYERS’ FUND 14 - 14 - 14 - OFFICE OF THE STATE PROSECUTOR 13 0 13 1 13 1 SUPPLEMENTAL RETIREMENT PLANS 13 - 13 - 13 - BOARD OF PUBLIC WORKS 9 - 9 - 9 - PROPERTY TAX ASSESSMENT APPEALS BOARD 9 - 9 - 9 - MARYLAND TAX COURT 8 0 8 0 8 0 MARYLAND HEALTH INSURANCE PROGRAM 9 - 9 - 8 - BOARD OF CONTRACT APPEALS 5 - 5 - 5 - OFFICE OF THE DEAF AND HARD OF HEARING 3 1 3 1 3 1 CANAL PLACE 3 - 3 - 3 - Total 80,299 10,318 81,104 9,891 81,422 9,724 Totals may not add due to rounding. 2015 fi gures refl ect defi ciency requests.
Appendix II

A. General Fund Budget Summary for Fiscal Years 2015 and 2016
B. Estimated Revenues for Fiscal Years Ending June 30, 2015 and 2016
C. Summary of Operating Budgets for the Fiscal Years Ending June 30, 2015 and 2016
D. Summary of Operating Budgets by Object Classifications for Fiscal Years 2015 and 2016
E. Personnel Detail
F. Fiscal Year 2014 - 2020 Forecast
G. Spending Affordability
H. Budget Bill Contingent and Restrictive Language
I. Recoveries of Indirect Costs for Fiscal Year 2014
J. Statewide Central Services Cost Allocation Plan for Fiscal Year 2014(based on Fiscal Year 2012 actual expenditures)
K. Share of the State Budget Providing Services to Children, Youth and Families
L. Summary of Budgeted Federal Revenues by Major Federal Sources
M. Cigarette Restitution Fund Fiscal Years 2014 - 2016
N. Maryland Information Technology Development Projects
O. Health Plan Revenues and Expenditures for Fiscal Years 2014 - 2016
P. Maryland Emergency Medical System Operations Fund
Q. Share of State Budget for Public Safety and Security Programs
R. Share of State Budget for Workforce Development Programs
S. Chesapeake Bay Restoration Activities Funded in the Budget
T. Strategic Energy Investment Fund Budgets for Fiscal Years 2014 - 2016
U. Maryland Coordination and Analysis Center Personnel and Operations Budget for Fiscal Year 2015
APPENDICES

2014 General Funds Reserved for 2015 Operations 147,557,417
2015 Estimated Revenues (Bd. of Revenue Estimates - December, 2014) 15,691,891,844Other (see detail): 16,556,920
Subtotal Revenues15,708,448,764
Transfer from Other Funds (see detail) 143,924,741
Reimbursement from reserves for Tax Credits 17,560,000
2015 General Fund Appropriations:Appropriated by the 2014 General Assembly for State Operations 16,091,776,186Deficiency Appropriations 254,434,775Voluntary Separation Program/Vacant Positions (7,500,000)Contingent Reductions (see detail) (49,073,964)Board of Public Works - July 2, 2014 (75,945,041)Board of Public Works - January 7, 2015 (197,805,188)Specific reversions (see detail) (5,078,538)Estimated agency reversions (30,000,000)
Subtotal Appropriations 15,980,808,230
2015 General Fund Unappropriated Balance 36,682,692
2015 General Funds Reserved for 2016 Operations 36,682,692
2016 Estimated Revenues (Bd. of Revenue Estimates - December, 2014) 16,245,199,325Transfer Tax 37,712,700Other revenue (see detail) 34,097,879
Subtotal Revenues 16,317,009,904
Reimbursement from reserves for Tax Credits 17,396,619
Transfer from the Revenue Stabilization Account 34,000,000
Transfers from other funds (see detail) 4,000,000
2016 General Fund Appropriations 16,909,490,878Reductions contingent upon Legislation (see detail) (208,607,719)Back of the Bill Reductions (see detail) (267,901,924)Voluntary Separation Program/Vacant Positions (30,000,000)Specific Reversions (see detail) (11,149,000)Estimated agency reversions (30,000,000)
Subtotal Appropriations 16,361,832,235
2016 General Fund Unappropriated Balance 47,256,980
APPENDIX AGENERAL FUND BUDGET SUMMARY ($)
Fiscal Year 2015
Fiscal Year 2016
A.1

2015 2016Adjustments to Revenues - Other
Maryland Stadium Authority 3,000,000Maryland Environmental Service 642,304DHMH - Early Medical Loss Ratio payment 10,000,000Lottery - Revenue Adjustment 456,116 1,428,458DLLR - SAEF Funding (July 2014 BPW) 1,630,000Sunny Day Repayment Diversion 828,500 1,842,750Comptroller - Unclaimed property advertisements 580,000Health Benefit Exchange Reductions - Premium Tax 1,498,276Office of the Attorney General - Medicaid Fraud and Securities Division 5,300,000Comptroller - Tax Compliance Initiatives 12,000,000Veteran's Cemetary Funding 125,000DBED - Unallocated Film Tax Credit 683,763Comptroller - Limit REITC to in-state individuals 2,000,000Chesapeake Bay 2010 Trust Fund 8,639,632
16,556,920 34,097,879Specific Reversions
MDP - Heritage Areas 209,000MDP - Sustainable Communities Tax Credit operating revenue 58,000MGA - Salary Plan Adjustment 938,000Judiciary - Increment Eliminated 6,605,000Judiciary - Salary Plan Adjustment 3,606,000MSDE - Montgomery County Teacher Retirement Costs 500,000Office of Administrative Hearings (July 2014 BPW) 5,769State Retirement - (July 2014 BPW) 5,769MSDE - Out of county placements (July 2014 BPW) 600,000MSDE - Austism Waiver (July 2014 BPW) 2,800,000MSDE - Out of county placements 900,000
5,078,538 11,149,000Transfers from other funds
DPSCS - Maryland Correctional Enterprise (2014 session) 1,000,000 DNR - Program Open Space Unencumbered Balance 10,500,000MEA - Strategic Energy Investment Fund 6,000,000Baltimore Community College 4,000,000State Unemployment Trust Fund 4,000,000 4,000,000MEA - Jane E. Lawton Conservation Loan Fund 3,000,000DLLR - Mortage Lender Orginator Fund 3,000,000DHMH - Board of Nursing 2,500,000DHMH - Board of Physcians 1,800,000DHMH - Board of Pharmacists 1,600,000DHMH - Spinal Cord Trust Fund 1,000,000DNR - Waterway Improvement Fund 2,180,000MHEC - Health Personnel Shortage Incentive Fund 1,700,000MDA - Bay Restoration Fund 1,375,000DGS - Helicopter Replacement Fund 269,741Local Income Tax Reserve Fund 100,000,000
143,924,741 4,000,000
APPENDIX AGENERAL FUND BUDGET SUMMARY (cont.)
Detail - Fiscal Years 2015 and 2016
A.2

2015 2016Reductions to allowance contingent upon legislation
Level Fund the Disparity Grant to FY 2014 2,111,335BOC - Level fund Police Aid Grant to FY 2014 3,720,710MHIP - Allow non-federal fund balance for Medicaid expenditures 45,000,000DNR - Eliminate Payments in Lieu of Taxes 2,498,953DNR - Waterway Improvement Fund Swap 875,000MDA - Level fund MARBIDCO to FY 2015 1,125,000DHMH - Reduce CRF funding for Academic Health Centers 7,200,000DHMH - Level fund local health grants to FY 2014 7,841,378DHMH - Halve provider rates in the Developmental Disabilities Administration 9,152,894DHMH - Delay reducing Medicaid Deficit Assessment from hospital savings 14,500,000MSDE Aid - Level fund per pupil Foundation 63,915,440MSDE Aid - Reduce SEED school funding 139,007MSDE FEO - Reduce Maryland School for the Blind 199,591MSDE Aid - Phase-in implementation of 2014 session Library Aid legislation 2,319,544MSDE HQ - Delay Deaf Culture Digital Library legislation 232,672MSDE HQ - Phase-in Maryland Library for the Blind legislation 1,940,983MSDE Aid - Increased ETF revenues by reducing VLT local impact aid 4,073,964 3,887,697MSDE Aid - Freeze the phase-in of Net Taxable Income 12,062,805MHEC - Reduce private college funding 6,461,675MHEC - Reduce funding to community colleges 13,045,513MSD - Maryland School for the Deaf to reflect level funding 309,290DHCD - Housing Counseling Fund use expansion 2,400,000DBED - Reduce CyberMaryland Investment Incentive Tax Credit 500,000DBED - Level fund Arts Council to FY 2014 1,361,571DJS - Level fund Provider Rates to FY 2014 level 806,661Dedicated Purpose - Repeal Program Open Space Repayment 50,000,000
49,073,964 208,607,719
Back of the Bill Reductions
Statewide - Statewide Salary Plan Adjustment 68,690,000Statewide - Eliminate Increment/Merit 81,219,924Statewide - 2% Across the Board Agency Reduction 117,992,000
267,901,924
APPENDIX AGENERAL FUND BUDGET SUMMARY (cont.)
Detail - Fiscal Years 2015 and 2016
A.3

GENERAL SPECIAL FEDERAL TOTAL GENERAL SPECIAL FEDERAL TOTAL
FUNDS FUNDS FUNDS FUNDS FUNDS FUNDS FUNDS FUNDS
PROPERTY TAXES
PROPERTY TAXES 725,753,986 725,753,986 740,839,571 740,839,571
PROPERTY TRANSFER TAXES 144,189,000 161,016,000 305,205,000 77,654,000 174,541,000 252,195,000
Over/(Under) attainment from prior years 9,101,966 9,101,966 (13,016,331) (13,016,331)
Transfer to the General Fund (144,189,000) (144,189,000) (77,654,000) (77,654,000)
FRANCHISE AND CORPORATION TAXES
FRANCHISE TAX ON GROSS RECEIPTS 144,000,781 144,000,781 145,317,369 145,317,369
ORGANIZATION AND CAPITALIZATION FEES 2,036,878 2,036,878 2,099,624 2,099,624
RECORDING FEES 10,574,622 10,574,622 10,900,376 10,900,376
CORPORATION FILING FEES 86,275,918 86,275,918 88,305,588 88,305,588
DEATH TAXES
COLLATERAL INHERITANCE TAX 50,982,132 50,982,132 51,708,002 51,708,002
DIRECT INHERITANCE TAX 150,000 150,000 150,000 150,000
MARYLAND ESTATE TAX 188,234,193 188,234,193 164,413,040 164,413,040
ALCOHOLIC BEVERAGE TAXES AND LICENSES
TAX ON LIQUOR 16,163,136 16,163,136 16,303,000 16,303,000
TAX ON WINE 6,300,104 6,300,104 6,449,000 6,449,000
TAX ON BEER 8,812,376 8,812,376 8,641,000 8,641,000
LICENSES 348,187 348,187 356,892 356,892
ALCOHOLIC BEVERAGE LICENSES 1,328,000 1,328,000 1,355,000 1,355,000
INCOME TAXES
CORPORATION INCOME TAXES 767,581,141 223,430,720 991,011,861 822,141,157 239,313,000 1,061,454,157
Less: Payment to Higher Education Investment Trust Fund (59,460,715) (59,460,715) (63,687,234) (63,687,234)
INDIVIDUAL INCOME TAXES 8,168,396,302 8,168,396,302 8,628,706,564 8,628,706,564
HIGHER EDUCATION INVESTMENT FUND 59,460,715 59,460,715 63,687,234 63,687,234
Less: Appropriations Over/(Under) Revenue Estimates 1,210,059 1,210,059 (160) (160)
RETAIL SALES AND USE TAXES 4,334,793,321 60,801,801 4,395,595,122 4,529,454,764 72,853,000 4,602,307,764
Less: Payment to Chesapeake Bay 2010 Trust Fund (29,278,801) (29,278,801) (40,069,120) (40,069,120)
CHESAPEAKE BAY 2010 TRUST FUND
RETAIL SALES AND USE TAX 29,278,801 29,278,801 40,069,120 40,069,120
MOTOR FUEL TAX 7,954,295 7,954,295 8,011,313 8,011,313
Less: Appropriations Over/(Under) Revenue Estimates 2,207,705 2,207,705 6,633 6,633
TOBACCO TAX AND LICENSES
TOBACCO TAX 359,428,000 359,428,000 357,633,000 357,633,000
TAX ON OTHER TOBACCO PRODUCTS 33,793,417 33,793,417 33,962,384 33,962,384
INSURANCE COMPANY TAXES, LICENSES, AND FEES 312,863,272 312,863,272 301,477,969 301,477,969
HORSE RACING TAXES AND LICENSES 3,061,000 3,061,000 3,061,000 3,061,000
DISTRICT COURT FEES AND COSTS 78,524,150 78,524,150 78,859,200 78,859,200
INTEREST ON INVESTMENTS 20,361,000 1,000,000 21,361,000 31,199,000 2,000,000 33,199,000
HOSPITAL PATIENT RECOVERIES
2015 Appropriation 2016 Allowance
Appendix B
ESTIMATED REVENUES FOR THE FISCAL YEAR ENDING JUNE 30, 2015 AND JUNE 30, 2016
Note: The electronic version of this page has been updated from the printed version and is correct as of 1/23/15.
B.1

GENERAL SPECIAL FEDERAL TOTAL GENERAL SPECIAL FEDERAL TOTAL
FUNDS FUNDS FUNDS FUNDS FUNDS FUNDS FUNDS FUNDS
2015 Appropriation 2016 Allowance
Appendix B
ESTIMATED REVENUES FOR THE FISCAL YEAR ENDING JUNE 30, 2015 AND JUNE 30, 2016
STATE HOSPITAL RECOVERIES - MEDICAID 20,941,427 20,941,427 21,164,970 21,164,970
STATE HOSPITAL RECOVERIES - MEDICARE 10,417,332 10,417,332 10,635,531 10,635,531
STATE HOSPITAL RECOVERIES - INSURANCE & SPONSORS 5,140,947 5,140,947 4,676,110 4,676,110
DISPROPORTIONATE SHARE PAYMENTS 26,788,447 26,788,447 26,788,447 26,788,447
MISCELLANEOUS TAXES, FEES AND OTHER REVENUES
EXCESS FEES OF OFFICE 1,207,000 1,207,000 1,233,000 1,233,000
UNCLAIMED PROPERTY REVENUE 84,000,000 84,000,000 80,000,000 80,000,000
LOCAL SHARE OF COST OF INCOME TAX ADMINISTRATION 13,442,647 13,442,647 13,695,991 13,695,991
UNINSURED MOTORIST PENALTY FEES 53,126,000 53,126,000 53,657,000 53,657,000
FEDERAL RETIREE DRUG SUBSIDY 13,900,000 13,900,000 14,000,000 14,000,000
STATE ADMISSIONS AND AMUSEMENT TAX 8,250,000 8,250,000
TOBACCO CONVERSION PROGRAM BOND REPAYMENT 3,323,000 3,323,000 3,823,000 3,823,000
MISCELLANEOUS 988,000 988,000 988,000 988,000
ANNUITY BOND FUND MISCELLANEOUS REVENUES 162,178,371 11,489,645 173,668,016 104,538,355 11,477,263 116,015,618
Less: Property Transfer Tax (6,270,207) (6,270,207) (6,422,430) (6,422,430)
BUDGETED TOBACCO SETTLEMENT RECOVERIES 189,651,375 189,651,375 188,543,090 188,543,090
EDUCATION TRUST FUND 393,755,048 393,755,048 394,006,600 394,006,600
LEGISLATIVE 41,000 41,000 42,000 42,000
JUDICIAL REVIEW AND LEGAL
JUDICIARY
COURT OF APPEALS 908,929 908,929 161,145 161,145
ADMINISTRATIVE OFFICE OF THE COURTS 17,500,000 684,730 18,184,730 17,500,000 17,500,000
STATE LAW LIBRARY 9,400 9,400 9,400 9,400
JUDICIAL INFORMATION SYSTEMS 7,147,972 7,147,972 7,644,749 7,644,749
CLERKS OF THE CIRCUIT COURT 36,607,466 18,714,724 28,557 55,350,747 35,389,599 19,811,696 55,201,295
FAMILY LAW DIVISION 124,600 124,600
MAJOR TECHNOLOGY DEVELOPMENT PROJECTS 20,728,765 20,728,765 20,802,239 20,802,239
OFFICE OF THE PUBLIC DEFENDER 1,968,000 213,643 2,181,643 2,008,000 194,245 2,202,245
OFFICE OF THE ATTORNEY GENERAL 28,351,000 12,442,439 3,322,649 44,116,088 28,707,000 19,193,779 3,544,189 51,444,968
PUBLIC SERVICE COMMISSION 692,000 45,929,938 393,586 47,015,524 350,000 38,494,796 540,820 39,385,616
OFFICE OF THE PEOPLE'S COUNSEL 3,888,578 3,888,578 4,020,025 4,020,025
SUBSEQUENT INJURY FUND 12,000 2,195,126 2,207,126 12,000 2,293,795 2,305,795
UNINSURED EMPLOYERS' FUND - 1,524,460 1,524,460 - 1,546,090 1,546,090
WORKERS' COMPENSATION COMMISSION 55,000 14,514,727 14,569,727 55,000 14,533,455 14,588,455
Less: Tobacco Settlement Recoveries (Office of the Atty General) (893,286) (893,286) (906,573) (906,573)
TOTAL 67,685,466 143,916,486 5,463,051 217,065,003 66,521,599 145,137,696 4,246,154 215,905,449
EXECUTIVE AND ADMINISTRATIVE CONTROL
BOARD OF PUBLIC WORKS 1,000 1,000 1,000 1,000
DEPARTMENT OF DISABILITIES 26,000 182,884 7,901,554 8,110,438 27,000 176,273 8,625,346 8,828,619
MARYLAND ENERGY ADMINISTRATION 55,000 65,026,039 1,366,150 66,447,189 56,000 48,370,470 2,267,210 50,693,680
EXECUTIVE DEPT - BOARDS, COMMISSIONS AND OFFICES 102,000 3,107,564 21,529,385 24,738,949 104,000 2,989,020 25,804,625 28,897,645
SECRETARY OF STATE 2,086,000 457,882 2,543,882 2,141,000 520,154 2,661,154
HISTORIC ST. MARY'S CITY COMMISSION 898,117 898,117 934,573 934,573
DEPARTMENT OF AGING 26,000 481,329 26,362,438 26,869,767 27,000 527,507 26,468,834 27,023,341
COMMISSION ON CIVIL RIGHTS 4,000 762,738 766,738 4,000 686,008 690,008
MARYLAND STADIUM AUTHORITY 20,000,000 20,000,000 40,000,000 40,000,000
Note: The electronic version of this page has been updated from the printed version and is correct as of 1/23/15.
B.2

GENERAL SPECIAL FEDERAL TOTAL GENERAL SPECIAL FEDERAL TOTAL
FUNDS FUNDS FUNDS FUNDS FUNDS FUNDS FUNDS FUNDS
2015 Appropriation 2016 Allowance
Appendix B
ESTIMATED REVENUES FOR THE FISCAL YEAR ENDING JUNE 30, 2015 AND JUNE 30, 2016
STATE BOARD OF ELECTIONS 7,638,383 100,000 7,738,383 13,044,595 535,819 13,580,414
DEPARTMENT OF PLANNING 4,643,861 1,762,130 6,405,991 4,817,190 1,525,013 6,342,203
MILITARY DEPARTMENT 63,000 14,986,967 49,344,814 64,394,781 64,000 16,686,967 86,164,735 102,915,702
MD INSTITUTE FOR EMERGENCY MEDICAL SERVICES SYSTEM 23,540,098 1,285,500 24,825,598 16,072,477 2,949,776 19,022,253
DEPARTMENT OF VETERANS AFFAIRS 400,000 985,481 17,987,917 19,373,398 - 836,735 19,489,859 20,326,594
STATE ARCHIVES 10,568,741 84,169 10,652,910 7,303,273 95,837 7,399,110
MARYLAND HEALTH BENEFIT EXCHANGE 12,967,846 128,713,803 141,681,649 35,000,000 42,761,416 77,761,416
MARYLAND HEALTH INSURANCE PLAN 97,236,662 129,893 97,366,555 19,889,850 78,654 19,968,504
MARYLAND INSURANCE ADMINISTRATION 2,781,000 31,413,842 1,283,162 35,478,004 2,837,000 31,428,325 1,249,796 35,515,121
CANAL PLACE PRESERVATION AND DEVELOPMENT AUTHORITY 434,246 434,246 444,664 444,664
OFFICE OF ADMINISTRATIVE HEARINGS 2,632,000 1,200,724 3,832,724 2,685,000 43,500 2,728,500
Less: Property Transfer Tax (Department of Planning) (3,000,000) (3,000,000) (3,000,000) (3,000,000)
TOTAL 8,176,000 292,770,666 258,613,653 559,559,319 7,946,000 236,085,573 218,702,928 462,733,501
FINANCIAL AND REVENUE ADMINISTRATION
COMPTROLLER OF THE TREASURY 5,491,000 19,923,946 25,414,946 6,054,000 23,610,537 29,664,537
STATE TREASURER 7,080,000 1,926,262 9,006,262 7,000,000 2,028,386 9,028,386
STATE DEPARTMENT OF ASSESSMENTS AND TAXATION 53,367 28,251,052 28,304,419 53,367 29,745,341 29,798,708
STATE LOTTERY AGENCY 500,777,188 70,654,800 571,431,988 477,480,716 78,717,559 556,198,275
TOTAL 513,401,555 120,756,060 634,157,615 490,588,083 134,101,823 624,689,906
DEPARTMENT OF BUDGET AND MANAGEMENT 5,286,304 20,040,602 4,428,808 29,755,714 4,398,000 19,748,196 3,260,852 27,407,048
DEPARTMENT OF INFORMATION TECHNOLOGY 6,500,000 8,263,901 968,642 15,732,543 - 11,004,835 632,267 11,637,102
RETIREMENT PROGRAMS
MARYLAND STATE RETIREMENT AGENCY 18,161,517 18,161,517 18,532,251 18,532,251
TEACHERS AND EMPLOYEES SUPPLEMENTAL RETIREMENT PLANS 1,666,697 1,666,697 1,693,123 1,693,123
TOTAL 19,828,214 19,828,214 20,225,374 20,225,374
DEPARTMENT OF GENERAL SERVICES 75,000 3,101,772 1,189,493 4,366,265 77,000 3,318,560 1,276,153 4,671,713
DEPARTMENT OF TRANSPORTATION
MOTOR VEHICLE FUEL TAXES 877,394,000 877,394,000 1,022,820,000 1,022,820,000
MOTOR VEHICLE TITLING TAX 786,000,000 786,000,000 805,700,000 805,700,000
MOTOR VEHICLE REGISTRATION 371,400,000 371,400,000 371,000,000 371,000,000
MOTOR VEHICLE ADMINISTRATION FEES 370,160,000 370,160,000 372,243,120 372,243,120
SALES TAX ON ONLINE SALES 42,700,000 42,700,000
PORT ADMINISTRATION 46,621,000 46,621,000 47,283,000 47,283,000
MASS TRANSIT ADMINISTRATION 142,690,000 142,690,000 168,508,000 168,508,000
AVIATION ADMINISTRATION 217,164,000 217,164,000 212,999,000 212,999,000
BOND PROCEEDS 490,000,000 490,000,000 875,000,000 875,000,000
GO BONDS - WATERSHED IMPLEMENTATION PLAN 45,000,000 45,000,000
CAPITAL REIMBURSEMENT 11,000,000 11,000,000 11,000,000 11,000,000
MISCELLANEOUS 27,300,000 27,300,000 37,400,000 37,400,000
REVENUE TRANSFERS TO OTHER FUNDS
FUEL TAX (COMPTROLLER) (9,127,225) (9,127,225) (9,373,584) (9,373,584)
FUEL TAX (CHESAPEAKE BAY 2010 FUND) (7,591,000) (7,591,000) (8,011,313) (8,011,313)
Note: The electronic version of this page has been updated from the printed version and is correct as of 1/23/15.
B.3

GENERAL SPECIAL FEDERAL TOTAL GENERAL SPECIAL FEDERAL TOTAL
FUNDS FUNDS FUNDS FUNDS FUNDS FUNDS FUNDS FUNDS
2015 Appropriation 2016 Allowance
Appendix B
ESTIMATED REVENUES FOR THE FISCAL YEAR ENDING JUNE 30, 2015 AND JUNE 30, 2016
FUEL TAX (GENERAL FUND) 5,000,000 (5,000,000) - 4,625,000 (4,625,000) -
GASOLINE AND MOTOR VEHICLE REVENUES (DEPT OF ENVIRON) (532,000) (532,000) (547,000) (547,000)
GASOLINE AND MOTOR VEHICLE REVENUES (STATE POLICE) (34,254,397) (34,254,397) (35,322,051) (35,322,051)
GASOLINE AND MOTOR VEHICLE REVENUES (RAD - CORP ADMIN) (1,336,964) (1,336,964) (1,459,776) (1,459,776)
EMS OPERATIONS FUND (MED-EVAC SURCHARGE) (71,077,000) (71,077,000) (71,000,000) (71,000,000)
PHYSICIANS TRAUMA SURCHARGE (12,090,000) (12,090,000) (12,077,000) (12,077,000)
WATERWAY IMPROVEMENT FUND (2,737,000) (2,737,000) (2,747,000) (2,747,000)
DOT ADJUSTMENT FOR REVENUE ESTIMATES (414) (414) 1,026,411 1,026,411
TRANSFER (TO)/FROM TRANSPORTATION TRUST FUND RESERVE 132,751,393 132,751,393 (79,740,199) (79,740,199)
OTHER FEDERAL FUNDS 910,617,991 910,617,991 1,023,055,991 1,023,055,991
TOTAL TRANSPORTATION 5,000,000 3,373,734,393 910,617,991 4,289,352,384 4,625,000 3,742,776,608 1,023,055,991 4,770,457,599
DEPARTMENT OF NATURAL RESOURCES 192,000 170,068,880 34,556,158 204,817,038 194,000 196,507,116 29,986,396 226,687,512
Less: Property Transfer Tax (16,658,759) (16,658,759) (64,617,805) (64,617,805)
Chesapeake Bay 2010 Trust Fund (39,440,801) (39,440,801) (48,087,066) (48,087,066)
Racing Revenue (16,000) (16,000) (16,000) (16,000)
Net Total 192,000 113,953,320 34,556,158 148,701,478 194,000 83,786,245 29,986,396 113,966,641
DEPARTMENT OF AGRICULTURE 129,000 41,871,315 4,247,122 46,247,437 132,000 52,135,747 4,014,044 56,281,791
Less: Racing Revenue (1,460,000) (1,460,000) (1,460,000) (1,460,000)
Property Transfer Tax (9,830,434) (9,830,434)
Tobacco Settlement Recoveries (6,539,000) (6,539,000) (6,041,000) (6,041,000)
Net Total 129,000 33,872,315 4,247,122 38,248,437 132,000 34,804,313 4,014,044 38,950,357
DEPARTMENT OF HEALTH AND MENTAL HYGIENE 48,099,343 1,337,709,085 6,999,187,625 8,384,996,053 48,457,872 1,331,198,036 6,830,316,544 8,209,972,452
Less: Tobacco Settlement Recoveries (176,103,212) (176,103,212) (175,486,517) (175,486,517)
Net Total 48,099,343 1,161,605,873 6,999,187,625 8,208,892,841 48,457,872 1,155,711,519 6,830,316,544 8,034,485,935
DEPARTMENT OF HUMAN RESOURCES 763,787 120,949,357 1,957,563,294 2,079,276,438 770,187 112,911,839 1,862,700,128 1,976,382,154
DEPARTMENT OF LABOR, LICENSING, AND REGULATION 12,280,050 143,670,936 194,100,501 350,051,487 12,464,180 135,513,069 186,587,841 334,565,090
Less: Racing Revenue (1,585,000) (1,585,000) (1,585,000) (1,585,000)
Net Total 12,280,050 142,085,936 194,100,501 348,466,487 12,464,180 133,928,069 186,587,841 332,980,090
DEPARTMENT OF PUBLIC SAFETY AND CORRECTIONAL SERVICES 10,604,880 141,005,857 27,426,198 179,036,935 10,679,257 144,254,190 29,177,043 184,110,490
STATE DEPARTMENT OF EDUCATION 9,500,000 425,607,571 1,051,323,723 1,486,431,294 505,000 412,899,666 1,080,870,573 1,494,275,239
Less: Education Trust Fund (393,755,048) (393,755,048) (394,006,600) (394,006,600)
Tobacco Settlement Recoveries (6,115,877) (6,115,877) (6,109,000) (6,109,000)
Net Total 9,500,000 25,736,646 1,051,323,723 1,086,560,369 505,000 12,784,066 1,080,870,573 1,094,159,639
MARYLAND PUBLIC BROADCASTING COMMISSION 18,746,506 971,566 19,718,072 19,204,162 3,999,323 23,203,485
UNIVERSITY SYSTEM OF MARYLAND 762,000 762,000 770,000 770,000
MARYLAND HIGHER EDUCATION COMMISSION 3,580,700 24,307,134 3,572,013 31,459,847 3,616,000 9,680,138 2,764,634 16,060,772
SUPPORT FOR STATE OPERATED INST OF HIGHER EDUCATION 68,747,771 68,747,771 71,848,333 71,848,333
Less: Higher Education Investment Trust Fund (60,670,779) (60,670,779) (63,686,840) (63,686,840)
Net Total 8,076,992 8,076,992 8,161,493 8,161,493
Note: The electronic version of this page has been updated from the printed version and is correct as of 1/23/15.
B.4

GENERAL SPECIAL FEDERAL TOTAL GENERAL SPECIAL FEDERAL TOTAL
FUNDS FUNDS FUNDS FUNDS FUNDS FUNDS FUNDS FUNDS
2015 Appropriation 2016 Allowance
Appendix B
ESTIMATED REVENUES FOR THE FISCAL YEAR ENDING JUNE 30, 2015 AND JUNE 30, 2016
MARYLAND SCHOOL FOR THE DEAF 220,200 324,934 539,160 1,084,294 222,400 325,654 522,174 1,070,228
DEPARTMENT OF HOUSING AND COMMUNITY DEVELOPMENT 445,000 101,838,595 263,286,399 365,569,994 449,400 114,273,320 262,220,422 376,943,142
DEPARTMENT OF BUSINESS AND ECONOMIC DEVELOPMENT 280,000 87,944,610 10,104,568 98,329,178 282,800 66,162,476 1,540,716 67,985,992
DEPARTMENT OF THE ENVIRONMENT 826,400 267,490,185 76,526,503 344,843,088 841,800 271,534,497 79,612,807 351,989,104
DEPARTMENT OF JUVENILE SERVICES 4,965,931 7,142,467 12,108,398 4,906,381 7,384,471 12,290,852
DEPARTMENT OF STATE POLICE 21,382,433 92,955,872 2,593,435 116,931,740 3,867,770 95,524,410 1,172,439 100,564,619
APPENDIX B SUBTOTAL NO. 1 15,691,891,844 8,118,935,276 11,825,912,015 35,636,738,135 16,245,199,325 8,410,972,078 11,645,521,163 36,301,691,566
BOARD OF PUBLIC WORKS ACTION
STATEWIDE ACADEMIC HEALTH CENTERS (7,450,000) (7,450,000)
APPENDIX B SUBTOTAL NO. 2 15,691,891,844 8,111,485,276 11,825,912,015 35,629,288,135
DEFICIENCY APPROPRIATIONS AND CONTINGENT REDUCTIONS
STATE BOARD OF ELECTIONS 1,264,458 1,264,458
DEPARTMENT OF PLANNING (300,000) 587,979 287,979
HEALTH BENEFIT EXCHANGE (1,498,276) (1,498,276)
COMPTROLLER OF MARYLAND 1,000,000 1,000,000 (580,000) (580,000)
STATE LOTTERY AND GAMING CONTROL AGENCY 2,994,688 2,994,688
DEPARTMENT OF INFORMATION TECHNOLOGY 1,155,458 1,155,458
DEPARTMENT OF NATURAL RESOURCES (32,154,457) 1,782,445 (30,372,012) (8,639,632) (8,639,632)
DEPARTMENT OF AGRICULTURE 68,614 68,614
DEPARTMENT OF HEALTH AND MENTAL HYGIENE 14,150,000 848,372 14,998,372 (7,206,181) (7,259,616) (14,465,797)
DEPARTMENT OF HUMAN RESOURCES 12,154,903 12,154,903
DEPARTMENT OF LABOR, LICENSING, AND REGULATION (4,073,964) (4,073,964) (3,887,697) (3,887,697)
DEPARTMENT OF PUBLIC SAFETY AND CORRECTIONAL SERVICES 400,000 400,000
STATE DEPARTMENT OF EDUCATION (16,426,036) (16,426,036)
DEPARTMENT OF THE ENVIRONMENT 300,000 300,000
DEPARTMENT OF JUVENILE SERVICES (44,916) (59,924) (104,840)
APPENDIX B SUBTOTAL NO. 3 15,691,891,844 8,079,864,037 11,841,285,714 35,613,040,595 16,245,199,325 8,389,115,376 11,638,201,623 36,272,515,324
ADJUSTMENTS TO REVENUES
MARYLAND STADIUM AUTHORITY 3,000,000 3,000,000
MARYLAND ENVIRONMENTAL SERVICE 642,304 642,304
DHMH - MCO MEDICAL LOSS RATIO PAYMENT 10,000,000 10,000,000
LOTTERY REVENUE ADJUSTMENTS 456,116 456,116 1,428,458 1,428,458
DLLR - SAEF FUNDING (JULY 2014 BPW ITEM) 1,630,000 1,630,000
DIVERT SUNNY DAY REPAYMENT 828,500 828,500 1,842,750 1,842,750
OAG - MEDICAID FRAUD AND SECURITIES DIVISION 5,300,000 5,300,000
COMPTROLLER - TAX COMPLIANCE INITIATIVES 12,000,000 12,000,000
VETERAN'S CEMETERY FUNDING 125,000 125,000
DBED - UNALLOCATED FILM TAX CREDIT 683,763 683,763
COMPTROLLER - UNCLAIMED PROPERTY ADVERTISEMENTS 580,000 580,000
HEALTH BENEFIT EXCHANGE REDUCTIONS - PREMIUM TAX 1,498,276 1,498,276
COMPTROLLER - LIMIT REITC TO IN-STATE INDIVIDUALS 2,000,000 2,000,000
CHESAPEAKE BAY 2010 TRUST FUND 8,639,632 8,639,632
Note: The electronic version of this page has been updated from the printed version and is correct as of 1/23/15.
B.5

GENERAL SPECIAL FEDERAL TOTAL GENERAL SPECIAL FEDERAL TOTAL
FUNDS FUNDS FUNDS FUNDS FUNDS FUNDS FUNDS FUNDS
2015 Appropriation 2016 Allowance
Appendix B
ESTIMATED REVENUES FOR THE FISCAL YEAR ENDING JUNE 30, 2015 AND JUNE 30, 2016
PROPERTY TRANSFER TAX 37,712,700 (37,712,700) -
APPENDIX B SUBTOTAL NO. 4 15,708,448,764 8,079,864,037 11,841,285,714 35,629,597,515 16,317,009,904 8,351,402,676 11,638,201,623 36,306,613,203
BUDGET BILL ADJUSTMENTS
STATEWIDE - SALARY SCALE ADJUSTMENT (15,585,000) (9,331,000) (24,916,000)
STATEWIDE - INCREMENT/MERIT (12,914,334) (8,386,038) (21,300,372)
APPENDIX B SUBTOTAL NO. 5 15,708,448,764 8,079,864,037 11,841,285,714 35,629,597,515 16,317,009,904 8,322,903,342 11,620,484,585 36,260,396,831
Note: The electronic version of this page has been updated from the printed version and is correct as of 1/23/15.
B.6

CURRENT CURRENT CURRENT CURRENT
UNRESTRICTED RESTRICTED TOTAL UNRESTRICTED RESTRICTED TOTAL
FUND FUND FUND FUND FUND FUND
HIGHER EDUCATION:
UNIVERSITY OF MARYLAND, BALTIMORE 590,650,833 482,551,462 1,073,202,295 603,997,451 486,006,675 1,090,004,126
UNIVERSITY OF MARYLAND, COLLEGE PARK 1,432,297,240 429,082,648 1,861,379,888 1,492,413,404 442,024,934 1,934,438,338
BOWIE STATE UNIVERSITY 95,240,898 22,000,000 117,240,898 99,632,696 22,000,000 121,632,696
TOWSON UNIVERSITY 406,304,474 50,172,050 456,476,524 422,710,981 50,172,050 472,883,031
UNIVERSITY OF MARYLAND EASTERN SHORE 107,004,877 33,544,781 140,549,658 110,683,634 33,678,947 144,362,581
FROSTBURG STATE UNIVERSITY 96,944,311 12,360,000 109,304,311 101,331,829 12,360,000 113,691,829
COPPIN STATE UNIVERSITY 72,864,186 18,000,000 90,864,186 75,511,004 18,000,000 93,511,004
UNIVERSITY OF BALTIMORE 112,718,279 25,454,034 138,172,313 116,837,251 25,102,610 141,939,861
SALISBURY UNIVERSITY 167,438,842 13,000,000 180,438,842 176,026,049 13,000,000 189,026,049
UNIVERSITY OF MARYLAND UNIVERSITY COLLEGE 351,735,870 35,274,732 387,010,602 358,864,573 35,274,732 394,139,305
UNIVERSITY OF MARYLAND BALTIMORE COUNTY 322,706,505 82,200,000 404,906,505 335,794,513 83,815,935 419,610,448
UNIVERSITY OF MARYLAND CENTER FOR ENVIRONMENTAL SCIENCE28,678,777 18,115,369 46,794,146 30,378,209 18,115,369 48,493,578
UNIVERSITY SYSTEM OF MARYLAND OFFICE 28,515,738 3,595,335 32,111,073 30,332,285 3,595,335 33,927,620
BALTIMORE CITY COMMUNITY COLLEGE 68,515,117 22,568,640 91,083,757 67,995,776 21,660,117 89,655,893
ST. MARY'S COLLEGE OF MARYLAND 68,828,624 4,200,000 73,028,624 68,599,470 4,200,000 72,799,470
MORGAN STATE UNIVERSITY 177,478,605 46,571,246 224,049,851 184,134,720 48,538,950 232,673,670
SUBTOTAL - HIGHER EDUCATION 4,127,923,176 1,298,690,297 5,426,613,473 4,275,243,845 1,317,545,654 5,592,789,499
DEFICIENCY APPROPRIATION FOR FY 2015
ST. MARY'S COLLEGE OF MARYLAND (931,000) (931,000)
HIGHER EDUCATION AND DEFICIENCY SUBTOTAL 5,425,682,473
LESS: GENERAL & SPECIAL FUNDS IN HIGHER EDUCATION
GENERAL FUNDS 1,332,136,294 1,407,350,293
HIGHER EDUCATION INVESTMENT FUNDS 60,670,779 63,686,840
OTHER SPECIAL FUNDS 8,076,992 8,161,493
TOTAL HIGHER EDUCATION 4,024,798,408 4,113,590,873
GRAND TOTAL FOR APPENDIX B 39,654,395,923 40,373,987,704
Appendix B
ESTIMATED REVENUES FOR THE FISCAL YEAR ENDING JUNE 30, 2015 AND JUNE 30, 2016
2015 Appropriation 2016 Allowance
Note: The electronic version of this page has been updated from the printed version and is correct as of 1/23/15.
B.7

GENERAL SPECIAL FEDERAL TOTAL GENERAL SPECIAL FEDERAL TOTALFUNDS FUNDS FUNDS FUNDS FUNDS FUNDS FUNDS FUNDS
PAYMENTS TO CIVIL DIVISIONS OF THE STATEDISPARITY GRANTS 135,797,164 - - 135,797,164 129,819,872 - - 129,819,872 TEACHER RETIREMENT SUPPLEMENTAL GRANTS 27,658,662 - - 27,658,662 27,658,662 - - 27,658,662 TOTAL DISPARITY GRANTS 163,455,826 - - 163,455,826 157,478,534 - - 157,478,534
GENERAL ASSEMBLY OF MARYLANDSENATE 12,215,120 - - 12,215,120 12,675,116 - - 12,675,116 HOUSE OF DELEGATES 22,606,378 - - 22,606,378 23,846,549 - - 23,846,549 GENERAL LEGISLATIVE EXPENSES 1,018,978 - - 1,018,978 1,026,097 - - 1,026,097 OFFICE OF THE EXECUTIVE DIRECTOR 11,223,272 - - 11,223,272 11,559,403 - - 11,559,403 OFFICE OF LEGISLATIVE AUDITS 13,220,467 - - 13,220,467 13,627,031 - - 13,627,031 OFFICE OF LEGISLATIVE INFORMATION SYSTEMS 5,178,013 - - 5,178,013 5,210,551 - - 5,210,551 OFFICE OF POLICY ANALYSIS 16,866,177 - - 16,866,177 17,306,465 - - 17,306,465 TOTAL GENERAL ASSEMBLY OF MARYLAND 82,328,405 - - 82,328,405 85,251,212 - - 85,251,212
JUDICIARYCOURT OF APPEALS 11,184,107 - 908,929 12,093,036 11,224,318 - 161,145 11,385,463 COURT OF SPECIAL APPEALS 10,535,044 - - 10,535,044 12,147,700 - - 12,147,700 CIRCUIT COURT JUDGES 60,864,691 - - 60,864,691 64,889,535 - - 64,889,535 DISTRICT COURT 168,638,971 - - 168,638,971 183,052,360 - - 183,052,360 MARYLAND JUDICIAL CONFERENCE 210,750 - - 210,750 230,750 - - 230,750 ADMINISTRATIVE OFFICE OF THE COURTS 53,860,674 17,500,000 684,730 72,045,404 70,036,614 17,500,000 - 87,536,614 COURT RELATED AGENCIES 2,930,879 - - 2,930,879 3,149,674 - - 3,149,674 STATE LAW LIBRARY 2,872,723 9,400 - 2,882,123 3,148,507 9,400 - 3,157,907 JUDICIAL INFORMATION SYSTEMS 36,408,441 7,147,972 - 43,556,413 40,364,047 7,644,749 - 48,008,796 CLERKS OF THE CIRCUIT COURT 82,439,330 18,714,724 28,557 101,182,611 90,365,551 19,811,696 - 110,177,247 FAMILY LAW DIVISION - - 124,600 124,600 - - - - MAJOR INFORMATION TECHNOLOGY DEVELOPMENT PROJECTS - 20,728,765 - 20,728,765 - 20,802,239 - 20,802,239 TOTAL JUDICIARY 429,945,610 64,100,861 1,746,816 495,793,287 478,609,056 65,768,084 161,145 544,538,285
OFFICE OF THE PUBLIC DEFENDERGENERAL ADMINISTRATION 6,447,122 - - 6,447,122 7,226,483 - - 7,226,483 DISTRICT OPERATIONS 82,325,704 213,643 - 82,539,347 86,882,227 194,245 - 87,076,472 APPELLATE AND INMATE SERVICES 6,247,595 - - 6,247,595 6,470,375 - - 6,470,375 INVOLUNTARY INSTITUTIONALIZATION SERVICES 1,336,036 - - 1,336,036 1,415,348 - - 1,415,348 TOTAL OFFICE OF THE PUBLIC DEFENDER 96,356,457 213,643 - 96,570,100 101,994,433 194,245 - 102,188,678
OFFICE OF THE ATTORNEY GENERALLEGAL COUNSEL AND ADVICE 5,116,807 531,358 - 5,648,165 5,251,529 478,068 - 5,729,597 SECURITIES DIVISION 2,341,917 99,757 - 2,441,674 2,711,395 - - 2,711,395 CONSUMER PROTECTION DIVISION - 5,109,069 413,235 5,522,304 - 5,377,192 96,640 5,473,832 ANTITRUST DIVISION 889,265 - - 889,265 924,634 - - 924,634 MEDICAID FRAUD CONTROL UNIT 967,955 - 2,909,414 3,877,369 1,140,944 - 3,447,549 4,588,493 PEOPLE'S INSURANCE COUNSEL DIVISION - 585,663 - 585,663 - 591,133 - 591,133 JUVENILE JUSTICE MONITORING PROGRAM 543,563 - - 543,563 575,682 - - 575,682 CIVIL LITIGATION DIVISION 2,313,008 474,439 - 2,787,447 2,451,975 478,505 - 2,930,480 CRIMINAL APPEALS DIVISION 2,733,206 - - 2,733,206 2,870,415 - - 2,870,415 CRIMINAL INVESTIGATION DIVISION 1,752,208 - - 1,752,208 1,821,709 - - 1,821,709 EDUCATIONAL AFFAIRS DIVISION 440,619 - - 440,619 463,951 - - 463,951 CORRECTIONAL LITIGATION DIVISION 308,667 - - 308,667 325,177 - - 325,177 CONTRACT LITIGATION DIVISION - - - - - - - - MORTGAGE FORECLOSURE SETTLEMENT PROGRAM - 5,642,153 - 5,642,153 - 12,268,881 - 12,268,881 TOTAL OFFICE OF THE ATTORNEY GENERAL 17,407,215 12,442,439 3,322,649 33,172,303 18,537,411 19,193,779 3,544,189 41,275,379
OFFICE OF THE STATE PROSECUTORGENERAL ADMINISTRATION 1,435,438 - - 1,435,438 1,466,087 - - 1,466,087
MARYLAND TAX COURTADMINISTRATION AND APPEALS 609,330 - - 609,330 630,973 - - 630,973
PUBLIC SERVICE COMMISSIONGENERAL ADMINISTRATION AND HEARINGS - 38,498,609 77,234 38,575,843 - 30,889,895 - 30,889,895 TELECOMMUNICATIONS, GAS AND WATER DIVISION - 452,913 - 452,913 - 437,156 - 437,156 ENGINEERING INVESTIGATIONS - 1,451,055 316,352 1,767,407 - 1,498,727 540,820 2,039,547 ACCOUNTING INVESTIGATIONS - 644,140 - 644,140 - 677,876 - 677,876 COMMON CARRIER INVESTIGATIONS - 1,474,825 - 1,474,825 - 1,530,603 - 1,530,603 WASHINGTON METROPOLITAN AREA TRANSIT COMMISSION - 375,227 - 375,227 - 382,141 - 382,141 ELECTRICITY DIVISION - 458,499 - 458,499 - 518,190 - 518,190 HEARING EXAMINER DIVISION - 761,961 - 761,961 - 828,645 - 828,645 STAFF COUNSEL - 950,550 - 950,550 - 1,001,396 - 1,001,396 ENERGY ANALYSIS AND PLANNING DIVISION - 862,159 - 862,159 - 730,167 - 730,167 TOTAL PUBLIC SERVICE COMMISSION - 45,929,938 393,586 46,323,524 - 38,494,796 540,820 39,035,616
SUMMARY OF OPERATING BUDGETS FOR FISCAL YEARS ENDING JUNE 30, 2015 AND 2016APPENDIX C
2015 APPROPRIATION 2016 ALLOWANCE
C.1

GENERAL SPECIAL FEDERAL TOTAL GENERAL SPECIAL FEDERAL TOTALFUNDS FUNDS FUNDS FUNDS FUNDS FUNDS FUNDS FUNDS
SUMMARY OF OPERATING BUDGETS FOR FISCAL YEARS ENDING JUNE 30, 2015 AND 2016APPENDIX C
2015 APPROPRIATION 2016 ALLOWANCE
OFFICE OF THE PEOPLE'S COUNSELGENERAL ADMINISTRATION - 3,888,578 - 3,888,578 - 4,020,025 - 4,020,025
SUBSEQUENT INJURY FUNDGENERAL ADMINISTRATION - 2,195,126 - 2,195,126 - 2,293,795 - 2,293,795
UNINSURED EMPLOYERS' FUNDGENERAL ADMINISTRATION - 1,524,460 - 1,524,460 - 1,546,090 - 1,546,090
WORKERS' COMPENSATION COMMISSIONGENERAL ADMINISTRATION - 14,514,727 - 14,514,727 - 14,533,455 - 14,533,455
BOARD OF PUBLIC WORKSADMINISTRATION OFFICE 949,034 - - 949,034 912,470 - - 912,470 CONTINGENT FUND 500,000 - - 500,000 500,000 - - 500,000 WETLANDS ADMINISTRATION 210,432 - - 210,432 212,767 - - 212,767 MISCELLANEOUS GRANTS TO PRIVATE NON-PROFIT GROUP 6,086,475 - - 6,086,475 5,730,068 - - 5,730,068 PAYMENTS OF JUDGMENTS AGAINST THE STATE 524,308 - - 524,308 - - - - TOTAL BOARD OF PUBLIC WORKS 8,270,249 - - 8,270,249 7,355,305 - - 7,355,305
BOARD OF PUBLIC WORKS - CAPITAL APPROPRIATIONPUBLIC WORKS CAPITAL APPROPRIATION 1,100,000 - - 1,100,000 30,000,000 - - 30,000,000
EXECUTIVE DEPARTMENTGENERAL EXECUTIVE DIRECTION AND CONTROL 12,243,737 - - 12,243,737 12,092,428 - - 12,092,428
OFFICE OF THE DEAF AND HARD OF HEARINGEXECUTIVE DIRECTION 363,066 - - 363,066 409,697 - - 409,697
DEPARTMENT OF DISABILITIESGENERAL ADMINISTRATION 3,090,073 182,884 7,901,554 11,174,511 3,222,166 176,273 8,625,346 12,023,785
MARYLAND ENERGY ADMINISTRATIONGENERAL ADMINISTRATION - 6,717,299 843,737 7,561,036 - 5,874,701 778,286 6,652,987 THE JANE E. LAWTON CONSERVATION LOAN PROGRAM-CAP A - 1,750,000 - 1,750,000 - 1,750,000 - 1,750,000 STATE AGENCY LOAN PROGRAM-CAPITAL APPROPRIATION - 1,200,000 - 1,200,000 - 1,200,000 1,200,000 2,400,000 ENERGY EFFICIENCY AND CONSERVATION PROGRAMS, LOW/MODERATE INCOME SECTOR - 10,605,000 204,000 10,809,000 - 10,605,000 87,948 10,692,948 ENERGY EFFICIENCY AND CONSERVATION PROGRAMS, ALL OTHER SECTORS - 12,605,240 318,413 12,923,653 - 9,030,206 200,976 9,231,182 RENEWABLE AND CLEAN ENERGY PROGRAMS AND INITIATIVES - 32,148,500 - 32,148,500 - 19,910,563 - 19,910,563 TOTAL MARYLAND ENERGY ADMINISTRATION - 65,026,039 1,366,150 66,392,189 - 48,370,470 2,267,210 50,637,680
EXECUTIVE DEPARTMENT-BOARDS, COMMISSIONS AND OFFICESSURVEY COMMISSIONS 110,000 - - 110,000 118,000 - - 118,000 OFFICE OF MINORITY AFFAIRS 1,371,042 10,000 - 1,381,042 1,444,709 10,000 - 1,454,709 GOVERNOR'S OFFICE OF COMMUNITY INITIATIVES 2,370,956 282,400 3,936,897 6,590,253 2,468,323 303,006 4,419,830 7,191,159 STATE ETHICS COMMISSION 823,083 307,718 - 1,130,801 875,914 318,408 - 1,194,322 HEALTH CARE ALTERNATIVE DISPUTE RESOLUTION OFFICE 357,647 46,132 - 403,779 381,899 46,151 - 428,050 GOVERNOR'S OFFICE OF CRIME CONTROL AND PREVENTION 97,323,737 2,406,314 17,592,488 117,322,539 100,575,889 2,281,455 21,384,795 124,242,139 STATE COMMISSION ON CRIMINAL SENTENCING POLICY 460,000 - - 460,000 488,000 - - 488,000 GOVERNOR'S GRANTS OFFICE 346,616 55,000 - 401,616 315,306 30,000 - 345,306 STATE LABOR RELATIONS BOARD 363,908 - - 363,908 383,372 - - 383,372 TOTAL EXECUTIVE DEPARTMENT-BOARDS, COMMISSIONS AND OFFICES 103,526,989 3,107,564 21,529,385 128,163,938 107,051,412 2,989,020 25,804,625 135,845,057
SECRETARY OF STATEOFFICE OF THE SECRETARY OF STATE 1,945,051 457,882 - 2,402,933 2,050,000 520,154 - 2,570,154
HISTORIC ST. MARY'S CITY COMMISSIONADMINISTRATION 2,156,846 898,117 - 3,054,963 2,338,997 934,573 - 3,273,570
GOVERNOR'S OFFICE FOR CHILDRENGOVERNOR'S OFFICE FOR CHILDREN 1,898,176 - - 1,898,176 1,787,308 - - 1,787,308
INTERAGENCY COMMITTEE ON SCHOOL CONSTRUCTIONGENERAL ADMINISTRATION 1,822,548 - - 1,822,548 2,077,668 - - 2,077,668 AGING SCHOOLS PROGRAM 42,102 - - 42,102 - - - - TOTAL INTERAGENCY COMMITTEE ON SCHOOL CONSTRUCTION 1,864,650 - - 1,864,650 2,077,668 - - 2,077,668
C.2

GENERAL SPECIAL FEDERAL TOTAL GENERAL SPECIAL FEDERAL TOTALFUNDS FUNDS FUNDS FUNDS FUNDS FUNDS FUNDS FUNDS
SUMMARY OF OPERATING BUDGETS FOR FISCAL YEARS ENDING JUNE 30, 2015 AND 2016APPENDIX C
2015 APPROPRIATION 2016 ALLOWANCE
DEPARTMENT OF AGINGGENERAL ADMINISTRATION 2,250,350 481,329 3,717,596 6,449,275 2,749,255 527,507 3,823,992 7,100,754 SENIOR CITIZENS ACTIVITIES CENTERS OPERATING FUND 500,000 - - 500,000 500,000 - - 500,000 COMMUNITY SERVICES 18,289,662 - 22,644,842 40,934,504 18,618,739 - 22,644,842 41,263,581 TOTAL DEPARTMENT OF AGING 21,040,012 481,329 26,362,438 47,883,779 21,867,994 527,507 26,468,834 48,864,335
MARYLAND COMMISSION ON CIVIL RIGHTSGENERAL ADMINISTRATION 2,511,163 - 762,738 3,273,901 2,625,359 - 686,008 3,311,367
MARYLAND STADIUM AUTHORITYMARYLAND STADIUM FACILITIES FUND - 20,000,000 - 20,000,000 - 20,000,000 - 20,000,000 BALTIMORE CONVENTION CENTER 9,016,587 - - 9,016,587 6,462,731 - - 6,462,731 OCEAN CITY CONVENTION CENTER 2,780,353 - - 2,780,353 3,013,599 - - 3,013,599 MONTGOMERY COUNTY CONFERENCE CENTER 1,556,000 - - 1,556,000 1,558,250 - - 1,558,250 HIPPODROME PERFORMING ARTS CENTER 1,393,060 - - 1,393,060 1,392,420 - - 1,392,420 BALTIMORE CITY PUBLIC SCHOOL CONSTRUCTION FINANCING - - - - - 20,000,000 - 20,000,000 TOTAL MARYLAND STADIUM AUTHORITY 14,746,000 20,000,000 - 34,746,000 12,427,000 40,000,000 - 52,427,000
STATE BOARD OF ELECTIONSGENERAL ADMINISTRATION 4,159,296 168,851 - 4,328,147 4,144,666 190,545 - 4,335,211 HELP AMERICA VOTE ACT 2,276,960 5,408,047 100,000 7,785,007 1,867,738 5,960,751 535,819 8,364,308 MAJOR INFORMATION TECHNOLOGY DEVELOPMENT PROJECTS PROJECTS - 2,061,485 - 2,061,485 - 6,893,299 - 6,893,299 TOTAL STATE BOARD OF ELECTIONS 6,436,256 7,638,383 100,000 14,174,639 6,012,404 13,044,595 535,819 19,592,818
MARYLAND STATE BOARD OF CONTRACT APPEALSCONTRACT APPEALS RESOLUTION 668,775 - - 668,775 694,872 - - 694,872
DEPARTMENT OF PLANNINGADMINISTRATION 2,746,412 - - 2,746,412 2,894,210 - - 2,894,210 COMMUNICATIONS AND INTERGOVERNMENTAL AFFAIRS 1,052,938 - - 1,052,938 1,185,930 - - 1,185,930 PLANNING DATA SERVICES 2,487,355 146,862 - 2,634,217 2,530,644 207,464 - 2,738,108 PLANNING SERVICES 1,967,627 - 50,092 2,017,719 2,140,030 - 50,129 2,190,159 MANAGEMENT PLANNING AND EDUCATIONAL OUTREACH 1,233,883 3,192,972 1,079,197 5,506,052 1,148,589 3,210,206 717,207 5,076,002 MUSEUM SERVICES 1,916,950 652,565 80,665 2,650,180 1,979,642 564,379 150,610 2,694,631 RESEARCH SURVEY AND REGISTRATION 944,699 83,590 325,613 1,353,902 946,950 105,460 363,625 1,416,035 PRESERVATION SERVICES 585,497 367,872 226,563 1,179,932 617,276 429,681 243,442 1,290,399 HISTORIC PRESERVATION - CAPITAL APPROPRIATION - 200,000 - 200,000 - 300,000 - 300,000 SUSTAINABLE COMMUNITIES TAX CREDIT 10,000,000 - - 10,000,000 9,000,000 - - 9,000,000 TOTAL DEPARTMENT OF PLANNING 22,935,361 4,643,861 1,762,130 29,341,352 22,443,271 4,817,190 1,525,013 28,785,474
MILITARY DEPARTMENTADMINISTRATIVE HEADQUARTERS 2,699,248 39,976 115,256 2,854,480 3,144,536 39,976 195,753 3,380,265 AIR OPERATIONS AND MAINTENANCE 682,891 - 4,245,990 4,928,881 752,437 - 4,529,880 5,282,317 ARMY OPERATIONS AND MAINTENANCE 3,866,923 121,991 8,884,292 12,873,206 4,024,421 121,991 9,289,255 13,435,667 CAPITAL APPROPRIATION - - 1,950,000 1,950,000 - - 34,200,000 34,200,000 STATE OPERATIONS 2,634,034 - 2,958,992 5,593,026 2,613,145 - 2,814,001 5,427,146 MARYLAND EMERGENCY MANAGEMENT AGENCY 2,291,437 14,825,000 31,190,284 48,306,721 2,151,461 16,525,000 35,135,846 53,812,307 TOTAL MILITARY DEPARTMENT OPERATIONS AND MAINTENANCE 12,174,533 14,986,967 49,344,814 76,506,314 12,686,000 16,686,967 86,164,735 115,537,702
MARYLAND INSTITUTE FOR EMERGENCY MEDICAL SERVICES SYSTEMS
GENERAL ADMINISTRATION - 23,540,098 1,285,500 24,825,598 - 16,072,477 2,949,776 19,022,253
DEPARTMENT OF VETERANS AFFAIRSSERVICE PROGRAM 1,202,594 - - 1,202,594 1,383,218 - - 1,383,218 CEMETERY PROGRAM 1,485,954 785,481 1,537,957 3,809,392 1,704,499 746,474 1,475,529 3,926,502 MEMORIALS AND MONUMENTS PROGRAM 410,160 - - 410,160 473,275 - - 473,275 CEMETERY PROGRAM-CAPITAL APPROPRIATION 400,000 - 2,980,000 3,380,000 80,000 - 3,811,000 3,891,000 VETERANS HOME PROGRAM 3,622,352 100,000 13,469,960 17,192,312 3,264,478 90,261 14,203,330 17,558,069 VETERANS HOME PROGRAM-CAPITAL APPROPRIATION - - - - - - - - EXECUTIVE DIRECTION 1,045,692 100,000 - 1,145,692 1,059,285 - - 1,059,285 OUTREACH AND ADVOCACY 197,446 - - 197,446 203,245 - - 203,245 TOTAL DEPARTMENT OF VETERANS AFFAIRS 8,364,198 985,481 17,987,917 27,337,596 8,168,000 836,735 19,489,859 28,494,594
STATE ARCHIVESARCHIVES 1,781,738 10,509,436 84,169 12,375,343 2,247,874 7,258,760 95,837 9,602,471 ARTISTIC PROPERTY 349,729 59,305 - 409,034 369,235 44,513 - 413,748 TOTAL STATE ARCHIVES 2,131,467 10,568,741 84,169 12,784,377 2,617,109 7,303,273 95,837 10,016,219
C.3

GENERAL SPECIAL FEDERAL TOTAL GENERAL SPECIAL FEDERAL TOTALFUNDS FUNDS FUNDS FUNDS FUNDS FUNDS FUNDS FUNDS
SUMMARY OF OPERATING BUDGETS FOR FISCAL YEARS ENDING JUNE 30, 2015 AND 2016APPENDIX C
2015 APPROPRIATION 2016 ALLOWANCE
MARYLAND HEALTH BENEFIT EXCHANGEMARYLAND HEALTH BENEFIT EXCHANGE 7,395,387 6,109,497 48,862,589 62,367,473 - 23,690,073 17,444,873 41,134,946 MAJOR INFORMATION TECHNOLOGY DEVELOPMENT PROJECTS 8,118,495 6,858,349 79,851,214 94,828,058 - 11,309,927 25,316,543 36,626,470 TOTAL MARYLAND HEALTH BENEFIT EXCHANGE 15,513,882 12,967,846 128,713,803 157,195,531 - 35,000,000 42,761,416 77,761,416
MARYLAND HEALTH INSURANCE PLANHEALTH INSURANCE SAFETY NET PROGRAMSMHIP HIGH-RISK POOLS - 78,003,599 129,893 78,133,492 - 1,816,367 78,654 1,895,021 SENIOR PRESCRIPTION DRUG ASSISTANCE PROGRAM - 19,233,063 - 19,233,063 - 18,073,483 - 18,073,483 TOTAL MARYLAND HEALTH INSURANCE PLAN - 97,236,662 129,893 97,366,555 - 19,889,850 78,654 19,968,504
MARYLAND INSURANCE ADMINISTRATIONADMINISTRATION AND OPERATIONS - 29,623,842 1,283,162 30,907,004 - 31,023,825 1,249,796 32,273,621 MAJOR INFORMATION TECHNOLOGY DEVELOPMENT PROJECTS - 1,790,000 - 1,790,000 - 404,500 - 404,500 TOTAL INSURANCE ADMINISTRATION - 31,413,842 1,283,162 32,697,004 - 31,428,325 1,249,796 32,678,121
CANAL PLACE PRESERVATION AND DEVELOPMENT AUTHORITYGENERAL ADMINISTRATION 116,211 434,246 - 550,457 103,983 444,664 - 548,647
OFFICE OF ADMINISTRATIVE HEARINGSGENERAL ADMINISTRATION - 1,200,724 - 1,200,724 - 43,500 - 43,500
COMPTROLLER OF MARYLANDOFFICE OF THE COMPTROLLEREXECUTIVE DIRECTION 3,347,908 592,060 - 3,939,968 3,609,379 642,567 - 4,251,946 FINANCIAL AND SUPPORT SERVICES 2,320,870 392,033 - 2,712,903 2,521,412 437,813 - 2,959,225 TOTAL OFFICE OF THE COMPTROLLER 5,668,778 984,093 - 6,652,871 6,130,791 1,080,380 - 7,211,171
GENERAL ACCOUNTING DIVISIONACCOUNTING CONTROL AND REPORTING 5,377,691 - - 5,377,691 5,704,305 - - 5,704,305
BUREAU OF REVENUE ESTIMATESESTIMATING OF REVENUES 830,112 - - 830,112 926,976 - - 926,976
REVENUE ADMINISTRATION DIVISIONREVENUE ADMINISTRATION 27,452,576 4,498,601 - 31,951,177 28,077,244 4,796,022 - 32,873,266 MAJOR INFORMATION TECHNOLOGY DEVELOPMENT PROJECTS - - - - - 1,090,308 - 1,090,308 TOTAL REVENUE ADMINISTRATION DIVISION 27,452,576 4,498,601 - 31,951,177 28,077,244 5,886,330 - 33,963,574
COMPLIANCE DIVISIONCOMPLIANCE ADMINISTRATION 23,016,029 8,800,859 - 31,816,888 26,188,195 10,835,122 - 37,023,317
FIELD ENFORCEMENT DIVISIONFIELD ENFORCEMENT ADMINISTRATION 2,622,278 2,789,959 - 5,412,237 2,605,736 2,888,948 - 5,494,684
CENTRAL PAYROLL BUREAUPAYROLL MANAGEMENT 2,456,151 177,356 - 2,633,507 2,611,001 187,820 - 2,798,821
INFORMATION TECHNOLOGY DIVISIONCOMPTROLLER IT SERVICES 16,451,121 2,673,078 - 19,124,199 16,492,015 2,731,937 - 19,223,952
TOTAL COMPTROLLER OF MARYLAND 83,874,736 19,923,946 - 103,798,682 88,736,263 23,610,537 - 112,346,800
STATE TREASURER'S OFFICETREASURY MANAGEMENT 4,970,418 610,787 - 5,581,205 5,248,142 680,586 - 5,928,728
BOND SALE EXPENSES - - TOTAL BOND SALE EXPENSES 25,000 1,315,475 - 1,340,475 35,000 1,347,800 - 1,382,800
TOTAL STATE TREASURER'S OFFICE 4,995,418 1,926,262 - 6,921,680 5,283,142 2,028,386 - 7,311,528
STATE DEPARTMENT OF ASSESSMENTS AND TAXATIONOFFICE OF THE DIRECTOR 2,601,013 143,724 - 2,744,737 2,906,458 132,961 - 3,039,419 REAL PROPERTY VALUATION 17,377,110 17,373,152 - 34,750,262 18,130,089 18,139,051 - 36,269,140 OFFICE OF INFORMATION TECHNOLOGY 2,588,871 2,588,653 - 5,177,524 2,717,913 2,720,540 - 5,438,453 BUSINESS PROPERTY VALUATION 1,718,903 1,718,471 - 3,437,374 1,844,454 1,844,794 - 3,689,248 TAX CREDIT PAYMENTS 81,963,260 - - 81,963,260 81,731,000 - - 81,731,000 PROPERTY TAX CREDIT PROGRAMS 1,963,184 1,128,773 - 3,091,957 1,887,734 1,225,556 - 3,113,290 CHARTER UNIT 80,643 5,298,279 - 5,378,922 86,549 5,682,439 - 5,768,988 TOTAL STATE DEPARTMENT OF ASSESSMENTS AND TAXATION 108,292,984 28,251,052 - 136,544,036 109,304,197 29,745,341 - 139,049,538
C.4

GENERAL SPECIAL FEDERAL TOTAL GENERAL SPECIAL FEDERAL TOTALFUNDS FUNDS FUNDS FUNDS FUNDS FUNDS FUNDS FUNDS
SUMMARY OF OPERATING BUDGETS FOR FISCAL YEARS ENDING JUNE 30, 2015 AND 2016APPENDIX C
2015 APPROPRIATION 2016 ALLOWANCE
STATE LOTTERY AND GAMING CONTROL AGENCYADMINISTRATION AND OPERATIONS - 56,251,625 - 56,251,625 - 69,159,559 - 69,159,559 VIDEO LOTTERY TERMINAL AND GAMING OPERATIONS 71,204,643 14,403,175 - 85,607,818 25,820,899 9,558,000 - 35,378,899 TOTAL STATE LOTTERY AND GAMING CONTROL AGENCY 71,204,643 70,654,800 - 141,859,443 25,820,899 78,717,559 - 104,538,458
PROPERTY TAX ASSESSMENT APPEALS BOARDSPROPERTY TAX ASSESSMENT APPEALS BOARDS 1,067,450 - - 1,067,450 1,096,182 - - 1,096,182
DEPARTMENT OF BUDGET AND MANAGEMENTOFFICE OF THE SECRETARYEXECUTIVE DIRECTION 1,810,724 - - 1,810,724 1,788,503 - - 1,788,503 DIVISION OF FINANCE AND ADMINISTRATION 1,171,498 - - 1,171,498 1,053,119 - - 1,053,119 CENTRAL COLLECTION UNIT - 13,107,412 - 13,107,412 - 13,972,429 - 13,972,429 DIVISION OF PROCUREMENT POLICY AND ADMINISTRATION 2,161,233 - - 2,161,233 2,323,106 - - 2,323,106 TOTAL OFFICE OF THE SECRETARY 5,143,455 13,107,412 - 18,250,867 5,164,728 13,972,429 - 19,137,157
OFFICE OF PERSONNEL SERVICES AND BENEFITSEXECUTIVE DIRECTION 1,999,548 - - 1,999,548 2,179,131 - - 2,179,131 DIVISION OF PERSONNEL SERVICES 1,284,812 - - 1,284,812 1,527,995 - - 1,527,995 DIVISION OF CLASSIFICATION AND SALARY 2,230,704 - - 2,230,704 2,406,503 - - 2,406,503 DIVISION OF RECRUITMENT AND EXAMINATION 1,397,592 - - 1,397,592 1,543,960 - - 1,543,960 STATEWIDE EXPENSES 1,546,381 6,933,190 4,428,808 12,908,379 25,489,713 5,775,767 3,260,852 34,526,332 TOTAL OFFICE OF PERSONNEL SERVICES AND BENEFITS 8,459,037 6,933,190 4,428,808 19,821,035 33,147,302 5,775,767 3,260,852 42,183,921
OFFICE OF BUDGET ANALYSISBUDGET ANALYSIS AND FORMULATION 2,798,682 - - 2,798,682 3,065,302 - - 3,065,302
OFFICE OF CAPITAL BUDGETINGCAPITAL BUDGET ANALYSIS AND FORMULATION 998,416 - - 998,416 1,130,313 - - 1,130,313
TOTAL DEPARTMENT OF BUDGET AND MANAGEMENT 17,399,590 20,040,602 4,428,808 41,869,000 42,507,645 19,748,196 3,260,852 65,516,693
DEPARTMENT OF INFORMATION TECHNOLOGYMAJOR INFORMATION TECHNOLOGY DEVELOPMENT PROJECTS PROJECT FUND 21,668,423 975,560 - 22,643,983 35,606,996 1,844,542 - 37,451,538
OFFICE OF INFORMATION TECHNOLOGYSTATE CHIEF OF INFORMATION TECHNOLOGY 2,422,402 82,453 968,642 3,473,497 3,237,149 92,741 632,267 3,962,157 ENTERPRISE INFORMATION SYSTEMS 3,607,398 - - 3,607,398 4,708,058 - - 4,708,058 APPLICATION SYSTEMS MANAGEMENT 7,658,107 - - 7,658,107 7,800,063 - - 7,800,063 NETWORKS DIVISION - 429,442 - 429,442 - 897,000 - 897,000 STRATEGIC PLANNING 2,734,116 - - 2,734,116 2,587,749 - - 2,587,749 MAJOR INFORMATION TECHNOLOGY DEVELOPMENT PROJECTS PROJECTS - 1,654,416 - 1,654,416 - 3,173,055 - 3,173,055 WEB SYSTEMS 2,213,401 - - 2,213,401 2,686,698 - - 2,686,698 TELECOMMUNICATIONS ACCESS OF MARYLAND - 5,122,030 - 5,122,030 - 4,997,497 - 4,997,497 TOTAL OFFICE OF INFORMATION TECHNOLOGY 18,635,424 7,288,341 968,642 26,892,407 21,019,717 9,160,293 632,267 30,812,277
TOTAL DEPARTMENT OF INFORMATION TECHNOLOGY 40,303,847 8,263,901 968,642 49,536,390 56,626,713 11,004,835 632,267 68,263,815
MARYLAND STATE RETIREMENT AND PENSION SYSTEMSSTATE RETIREMENT AGENCYSTATE RETIREMENT AGENCY - 18,161,517 - 18,161,517 - 18,532,251 - 18,532,251
TEACHERS AND STATE EMPLOYEES SUPPLEMENTAL RETIREMENTMARYLAND SUPPLEMENTAL RETIREMENT PLAN BOARD AND STAFF - 1,666,697 - 1,666,697 - 1,693,123 - 1,693,123
DEPARTMENT OF GENERAL SERVICESOFFICE OF THE SECRETARYEXECUTIVE DIRECTION 1,585,683 - - 1,585,683 1,560,183 - - 1,560,183 ADMINISTRATION 3,458,863 - - 3,458,863 2,481,110 - - 2,481,110 TOTAL OFFICE OF THE SECRETARY 5,044,546 - - 5,044,546 4,041,293 - - 4,041,293
OFFICE OF FACILITIES SECURITYFACILITIES SECURITY 7,161,764 81,564 260,865 7,504,193 8,167,294 86,929 295,074 8,549,297
OFFICE OF FACILITIES OPERATION AND MAINTENANCEFACILITIES OPERATION AND MAINTENANCE 31,135,003 575,077 928,628 32,638,708 31,793,978 709,160 981,079 33,484,217 SARATOGA STATE CENTER - - - - - - - - REIMBURSABLE LEASE MANAGEMENT - - - - - - - - PARKING FACILITIES 1,710,312 - - 1,710,312 1,683,621 - - 1,683,621 TOTAL OFFICE OF FACILITIES OPERATION AND MAINTENANCE 32,845,315 575,077 928,628 34,349,020 33,477,599 709,160 981,079 35,167,838
OFFICE OF PROCUREMENT AND LOGISTICSC.5

GENERAL SPECIAL FEDERAL TOTAL GENERAL SPECIAL FEDERAL TOTALFUNDS FUNDS FUNDS FUNDS FUNDS FUNDS FUNDS FUNDS
SUMMARY OF OPERATING BUDGETS FOR FISCAL YEARS ENDING JUNE 30, 2015 AND 2016APPENDIX C
2015 APPROPRIATION 2016 ALLOWANCE
PROCUREMENT AND LOGISTICS 3,447,581 1,886,062 - 5,333,643 3,669,598 1,733,742 - 5,403,340
OFFICE OF REAL ESTATEREAL ESTATE MANAGEMENT 1,923,142 134,244 - 2,057,386 1,653,512 361,801 - 2,015,313
OFFICE OF FACILITIES PLANNING, DESIGN AND CONSTRUCTIONFACILITIES PLANNING, DESIGN AND CONSTRUCTION 12,079,646 424,825 - 12,504,471 12,307,931 426,928 - 12,734,859
TOTAL DEPARTMENT OF GENERAL SERVICES 62,501,994 3,101,772 1,189,493 66,793,259 63,317,227 3,318,560 1,276,153 67,911,940
DEPARTMENT OF TRANSPORTATIONTHE SECRETARY'S OFFICEEXECUTIVE DIRECTION - 27,762,209 - 27,762,209 - 28,604,689 - 28,604,689 OPERATING GRANTS-IN-AID - 6,500,170 8,906,409 15,406,579 - 4,094,947 8,906,409 13,001,356 FACILITIES AND CAPITAL EQUIPMENT - 65,142,144 14,251,000 79,393,144 - 48,263,047 38,807,000 87,070,047 WASHINGTON METROPOLITAN AREA TRANSIT-OPERATING - 285,621,000 - 285,621,000 - 320,422,000 - 320,422,000 WASHINGTON METROPOLITAN AREA TRANSIT-CAPITAL - 169,345,000 - 169,345,000 - 132,091,000 - 132,091,000 OFFICE OF TRANSPORTATION TECHNOLOGY SERVICES - 40,902,095 - 40,902,095 - 42,069,974 - 42,069,974 MAJOR INFORMATION TECHNOLOGY DEVELOPMENT PROJECTS - 3,221,856 - 3,221,856 - 258,953 - 258,953 TOTAL THE SECRETARY'S OFFICE - 598,494,474 23,157,409 621,651,883 - 575,804,610 47,713,409 623,518,019
DEBT SERVICE REQUIREMENTSDEBT SERVICE REQUIREMENTS - 255,369,913 - 255,369,913 - 282,666,738 - 282,666,738
STATE HIGHWAY ADMINISTRATIONSTATE SYSTEM CONSTRUCTION AND EQUIPMENT - 634,881,000 526,857,000 1,161,738,000 - 860,073,000 456,360,000 1,316,433,000 STATE SYSTEM MAINTENANCE - 228,053,756 10,500,874 238,554,630 - 242,633,259 10,855,048 253,488,307 COUNTY AND MUNICIPALITY CAPITAL FUNDS - 4,900,000 53,100,000 58,000,000 - 4,900,000 65,900,000 70,800,000 HIGHWAY SAFETY OPERATING PROGRAM - 6,314,059 3,833,120 10,147,179 - 6,676,390 3,838,826 10,515,216 COUNTY AND MUNICIPALITY FUNDS - 169,686,144 - 169,686,144 - 169,304,256 - 169,304,256 MAJOR INFORMATION TECHNOLOGY DEVELOPMENT PROJECTS PROJECTS - 5,127,000 4,800,000 9,927,000 - 4,690,000 4,320,000 9,010,000 TOTAL STATE HIGHWAY ADMINISTRATION - 1,048,961,959 599,090,994 1,648,052,953 - 1,288,276,905 541,273,874 1,829,550,779
MARYLAND PORT ADMINISTRATIONPORT OPERATIONS - 48,741,126 - 48,741,126 - 51,300,442 - 51,300,442 PORT FACILITIES AND CAPITAL EQUIPMENT - 93,935,000 3,354,000 97,289,000 - 155,467,745 4,049,000 159,516,745 TOTAL MARYLAND PORT ADMINISTRATION - 142,676,126 3,354,000 146,030,126 - 206,768,187 4,049,000 210,817,187
MOTOR VEHICLE ADMINISTRATIONMOTOR VEHICLE OPERATIONS - 182,064,202 178,911 182,243,113 - 192,190,795 178,911 192,369,706 FACILITIES AND CAPITAL EQUIPMENT - 29,045,472 2,209,000 31,254,472 - 24,575,709 574,000 25,149,709 MARYLAND HIGHWAY SAFETY OFFICE - 1,137,716 12,781,031 13,918,747 - 1,176,402 12,786,666 13,963,068 MAJOR INFORMATION TECHNOLOGY DEVELOPMENT PROJECTS PROJECTS - 2,127,000 - 2,127,000 - 2,100,000 - 2,100,000 TOTAL MOTOR VEHICLE ADMINISTRATION - 214,374,390 15,168,942 229,543,332 - 220,042,906 13,539,577 233,582,483
MARYLAND TRANSIT ADMINISTRATIONTRANSIT ADMINISTRATION - 53,129,874 - 53,129,874 - 56,069,046 - 56,069,046 BUS OPERATIONS - 301,421,788 31,800,000 333,221,788 - 323,010,236 20,129,902 343,140,138 RAIL OPERATIONS - 210,947,937 13,823,450 224,771,387 - 214,387,284 18,713,450 233,100,734 FACILITIES AND CAPITAL EQUIPMENT - 359,110,000 178,203,000 537,313,000 - 387,804,000 332,744,000 720,548,000 STATEWIDE PROGRAMS OPERATIONS - 107,150,702 11,111,196 118,261,898 - 102,371,243 18,999,279 121,370,522 MAJOR INFORMATION TECHNOLOGY DEVELOPMENT PROJECTS PROJECTS - 2,995,000 - 2,995,000 - 20,989,000 - 20,989,000 TOTAL MARYLAND TRANSIT ADMINISTRATION - 1,034,755,301 234,937,646 1,269,692,947 - 1,104,630,809 390,586,631 1,495,217,440
MARYLAND AVIATION ADMINISTRATIONAIRPORT OPERATIONS - 179,981,230 776,000 180,757,230 - 187,004,421 645,500 187,649,921 AIRPORT FACILITIES AND CAPITAL EQUIPMENT - 92,108,000 34,133,000 126,241,000 - 83,083,912 25,248,000 108,331,912 MAJOR INFORMATION TECHNOLOGY DEVELOPMENT PROJECTS - 3,506,000 - 3,506,000 - 4,908,000 - 4,908,000 TOTAL MARYLAND AVIATION ADMINISTRATION - 275,595,230 34,909,000 310,504,230 - 274,996,333 25,893,500 300,889,833
TOTAL DEPARTMENT OF TRANSPORTATION - 3,570,227,393 910,617,991 4,480,845,384 - 3,953,186,488 1,023,055,991 4,976,242,479
C.6

GENERAL SPECIAL FEDERAL TOTAL GENERAL SPECIAL FEDERAL TOTALFUNDS FUNDS FUNDS FUNDS FUNDS FUNDS FUNDS FUNDS
SUMMARY OF OPERATING BUDGETS FOR FISCAL YEARS ENDING JUNE 30, 2015 AND 2016APPENDIX C
2015 APPROPRIATION 2016 ALLOWANCE
DEPARTMENT OF NATURAL RESOURCESOFFICE OF THE SECRETARYSECRETARIAT 1,467,517 1,554,640 98,600 3,120,757 1,656,392 1,520,144 93,800 3,270,336 OFFICE OF THE ATTORNEY GENERAL 565,285 1,048,274 - 1,613,559 671,756 1,074,085 - 1,745,841 FINANCE AND ADMINISTRATIVE SERVICES 2,958,406 2,915,558 155,428 6,029,392 3,463,573 2,936,239 143,281 6,543,093 HUMAN RESOURCE SERVICE 371,196 487,934 40,300 899,430 522,530 531,428 38,600 1,092,558 INFORMATION TECHNOLOGY SERVICE 1,398,682 3,124,801 112,300 4,635,783 1,537,485 2,593,298 106,800 4,237,583 OFFICE OF COMMUNICATIONS 466,890 470,364 - 937,254 531,701 503,203 - 1,034,904 TOTAL OFFICE OF THE SECRETARY 7,227,976 9,601,571 406,628 17,236,175 8,383,437 9,158,397 382,481 17,924,315
FOREST SERVICEFOREST SERVICE 840,491 8,960,275 1,709,971 11,510,737 1,091,211 8,707,858 1,679,539 11,478,608
WILDLIFE AND HERITAGE SERVICEWILDLIFE AND HERITAGE SERVICE 261,215 5,705,155 5,773,658 11,740,028 351,461 5,937,606 5,949,031 12,238,098
MARYLAND PARK SERVICESTATE-WIDE OPERATIONS 840,784 38,171,052 426,451 39,438,287 5,026,898 33,557,265 134,484 38,718,647 REVENUE OPERATIONS - 1,870,000 - 1,870,000 50,000 1,653,294 - 1,703,294 TOTAL MARYLAND PARK SERVICE 840,784 40,041,052 426,451 41,308,287 5,076,898 35,210,559 134,484 40,421,941
LAND ACQUISITION AND PLANNINGLAND ACQUISITION AND PLANNING - 5,245,595 - 5,245,595 - 4,960,014 - 4,960,014 OUTDOOR RECREATION LAND LOAN - 11,927,796 2,962,650 14,890,446 - 35,291,423 3,000,000 38,291,423 TOTAL LAND ACQUISITION AND PLANNING - 17,173,391 2,962,650 20,136,041 - 40,251,437 3,000,000 43,251,437
LICENSING AND REGISTRATION SERVICELICENSING AND REGISTRATION SERVICE - 3,798,580 - 3,798,580 - 3,958,501 - 3,958,501
NATURAL RESOURCES POLICEGENERAL DIRECTION 7,128,337 1,002,967 3,670,457 11,801,761 7,708,195 1,002,077 3,246,257 11,956,529 FIELD OPERATIONS 20,783,218 6,455,380 2,835,709 30,074,307 22,929,683 6,792,645 1,973,631 31,695,959 TOTAL NATURAL RESOURCES POLICE 27,911,555 7,458,347 6,506,166 41,876,068 30,637,878 7,794,722 5,219,888 43,652,488
ENGINEERING AND CONSTRUCTIONGENERAL DIRECTION - 4,248,995 - 4,248,995 101,000 4,370,281 - 4,471,281 OCEAN CITY MAINTENANCE - 500,000 - 500,000 - 500,000 - 500,000 TOTAL ENGINEERING AND CONSTRUCTION - 4,748,995 - 4,748,995 101,000 4,870,281 - 4,971,281
CRITICAL AREA COMMISSIONCRITICAL AREA COMMISSION 2,054,110 - - 2,054,110 2,116,454 - - 2,116,454
BOATING SERVICESBOATING SERVICES - 6,443,250 489,900 6,933,150 - 6,637,760 491,000 7,128,760 WATERWAY IMPROVEMENT CAPITAL PROJECTS - 4,000,000 1,000,000 5,000,000 - 6,000,000 587,000 6,587,000 TOTAL BOATING SERVICES - 10,443,250 1,489,900 11,933,150 - 12,637,760 1,078,000 13,715,760
RESOURCE ASSESSMENT SERVICEPOWER PLANT ASSESSMENT PROGRAM - 6,173,076 - 6,173,076 - 6,290,665 - 6,290,665 MONITORING AND ECOSYSTEM ASSESSMENT 2,229,994 2,327,640 1,536,698 6,094,332 2,559,345 2,188,341 1,722,189 6,469,875 MARYLAND GEOLOGICAL SURVEY 1,352,949 508,651 111,174 1,972,774 1,385,966 604,885 177,513 2,168,364 TOTAL RESOURCE ASSESSMENT SERVICE 3,582,943 9,009,367 1,647,872 14,240,182 3,945,311 9,083,891 1,899,702 14,928,904
MARYLAND ENVIRONMENTAL TRUSTMARYLAND ENVIRONMENTAL TRUST 632,275 10,985 - 643,260 599,900 5,846 - 605,746
CHESAPEAKE AND COASTAL SERVICECHESAPEAKE AND COASTAL SERVICE 1,521,089 41,981,412 7,720,498 51,222,999 1,681,444 48,780,948 5,644,875 56,107,267
FISHERIES SERVICEFISHERIES SERVICE 6,141,607 11,136,500 5,912,364 23,190,471 6,467,862 10,109,310 4,998,396 21,575,568
TOTAL DEPARTMENT OF NATURAL RESOURCES 51,014,045 170,068,880 34,556,158 255,639,083 60,452,856 196,507,116 29,986,396 286,946,368
C.7

GENERAL SPECIAL FEDERAL TOTAL GENERAL SPECIAL FEDERAL TOTALFUNDS FUNDS FUNDS FUNDS FUNDS FUNDS FUNDS FUNDS
SUMMARY OF OPERATING BUDGETS FOR FISCAL YEARS ENDING JUNE 30, 2015 AND 2016APPENDIX C
2015 APPROPRIATION 2016 ALLOWANCE
DEPARTMENT OF AGRICULTUREOFFICE OF THE SECRETARYEXECUTIVE DIRECTION 1,370,581 - - 1,370,581 1,442,176 - - 1,442,176 ADMINISTRATIVE SERVICES 2,608,905 - - 2,608,905 2,743,314 - - 2,743,314 CENTRAL SERVICES 1,036,595 - 350,000 1,386,595 1,168,178 - 350,000 1,518,178 MARYLAND AGRICULTURAL COMMISSION 80,259 - - 80,259 93,397 - - 93,397 MARYLAND AGRICULTURAL LAND PRESERVATION FOUNDATION - 1,712,546 - 1,712,546 - 1,661,050 - 1,661,050 CAPITAL APPROPRIATION - 9,596,966 - 9,596,966 - 18,930,434 - 18,930,434 TOTAL OFFICE OF THE SECRETARY 5,096,340 11,309,512 350,000 16,755,852 5,447,065 20,591,484 350,000 26,388,549
OFFICE OF MARKETING, ANIMAL INDUSTRIES, AND CONSUMER SERVICESOFFICE OF THE ASSISTANT SECRETARY 204,087 - - 204,087 218,000 - - 218,000 WEIGHTS AND MEASURES 319,382 1,765,878 - 2,085,260 357,558 1,879,296 - 2,236,854 FOOD QUALITY ASSURANCE 155,061 1,597,181 115,257 1,867,499 165,201 1,688,529 134,315 1,988,045 MARYLAND AGRICULTURAL STATISTICS SERVICES 21,000 - - 21,000 21,000 - - 21,000 ANIMAL HEALTH 2,165,576 400,008 547,434 3,113,018 2,268,151 452,038 526,636 3,246,825 STATE BOARD OF VETERINARY MEDICAL EXAMINERS - 646,088 - 646,088 - 674,598 - 674,598 MARYLAND HORSE INDUSTRY BOARD - 345,340 - 345,340 - 320,612 - 320,612 MARKETING AND AGRICULTURE DEVELOPMENT 628,695 5,199,701 1,537,817 7,366,213 644,304 5,990,162 1,413,838 8,048,304 MARYLAND AGRICULTURAL FAIR BOARD - 1,459,868 - 1,459,868 - 1,460,000 - 1,460,000 TOBACCO TRANSITION PROGRAM - 2,216,000 - 2,216,000 - 868,000 - 868,000 RURAL MARYLAND COUNCIL 166,999 - - 166,999 167,984 - - 167,984 MD AGRICULTURAL EDUCATION AND RURAL DEVELOPMENT ASSISTANCE FUND 167,000 - - 167,000 167,000 - - 167,000 MD AGRICULTURAL AND RESOURCE-BASED INDUSTRY DEVELOPMENT CORPORATION 2,875,000 - - 2,875,000 4,000,000 - - 4,000,000 TOTAL OFFICE OF MARKETING, ANIMAL INDUSTRIES, AND CONSUMER SERVICES 6,702,800 13,630,064 2,200,508 22,533,372 8,009,198 13,333,235 2,074,789 23,417,222
OFFICE OF PLANT INDUSTRIES AND PEST MANAGEMENTOFFICE OF THE ASSISTANT SECRETARY 192,834 - - 192,834 206,469 - - 206,469 FOREST PEST MANAGEMENT 1,171,134 177,818 180,643 1,529,595 917,639 178,462 263,928 1,360,029 MOSQUITO CONTROL 1,004,280 1,651,274 - 2,655,554 1,063,564 1,615,014 - 2,678,578 PESTICIDE REGULATION - 717,259 298,887 1,016,146 - 734,956 436,555 1,171,511 PLANT PROTECTION AND WEED MANAGEMENT 1,057,610 253,435 254,608 1,565,653 1,110,328 247,670 303,179 1,661,177 TURF AND SEED 817,632 289,450 - 1,107,082 842,218 305,801 - 1,148,019 STATE CHEMIST - 2,759,285 128,400 2,887,685 - 2,842,710 51,076 2,893,786 TOTAL OFFICE OF PLANT INDUSTRIES AND PEST MANAGEMENT 4,243,490 5,848,521 862,538 10,954,549 4,140,218 5,924,613 1,054,738 11,119,569
OFFICE OF RESOURCE CONSERVATIONOFFICE OF THE ASSISTANT SECRETARY 209,460 - - 209,460 226,261 - - 226,261 PROGRAM PLANNING AND DEVELOPMENT 413,752 - - 413,752 439,910 - - 439,910 RESOURCE CONSERVATION OPERATIONS 8,321,318 89,177 308,274 8,718,769 8,234,335 29,980 - 8,264,315 RESOURCE CONSERVATION GRANTS 776,910 10,961,648 - 11,738,558 813,741 12,146,142 - 12,959,883 NUTRIENT MANAGEMENT 1,555,886 32,393 - 1,588,279 1,660,819 110,293 - 1,771,112 WATERSHED IMPLEMENTATION 248,008 - 525,802 773,810 261,947 - 534,517 796,464 TOTAL OFFICE OF RESOURCE CONSERVATION 11,525,334 11,083,218 834,076 23,442,628 11,637,013 12,286,415 534,517 24,457,945
TOTAL DEPARTMENT OF AGRICULTURE 27,567,964 41,871,315 4,247,122 73,686,401 29,233,494 52,135,747 4,014,044 85,383,285
DEPARTMENT OF HEALTH AND MENTAL HYGIENEOFFICE OF THE SECRETARYEXECUTIVE DIRECTION 10,702,202 5,000 2,182,725 12,889,927 11,137,563 - 2,370,457 13,508,020 OPERATIONS 13,252,791 - 13,682,644 26,935,435 15,294,221 - 13,791,789 29,086,010 MAJOR INFORMATION TECHNOLOGY DEVELOPMENT PROJECTS PROJECTS - 570,000 238,050 808,050 - 684,000 - 684,000 TOTAL OFFICE OF THE SECRETARY 23,954,993 575,000 16,103,419 40,633,412 26,431,784 684,000 16,162,246 43,278,030
REGULATORY SERVICESOFFICE OF HEALTH CARE QUALITY 11,358,059 343,749 7,316,397 19,018,205 12,215,657 343,505 7,535,653 20,094,815 HEALTH PROFESSIONAL BOARDS AND COMMISSIONS 386,978 14,427,475 - 14,814,453 1,492,234 16,239,162 - 17,731,396 BOARD OF NURSING - 8,747,486 - 8,747,486 - 9,788,045 - 9,788,045 MARYLAND BOARD OF PHYSICIANS - 9,286,451 - 9,286,451 - 9,637,636 - 9,637,636 TOTAL REGULATORY SERVICES 11,745,037 32,805,161 7,316,397 51,866,595 13,707,891 36,008,348 7,535,653 57,251,892
DEPUTY SECRETARY FOR PUBLIC HEALTH SERVICESEXECUTIVE DIRECTION 5,056,160 395,000 655,643 6,106,803 5,355,249 363,320 717,649 6,436,218
HEALTH SYSTEMS AND INFRASTRUCTURE ADMINISTRATIONHEALTH SYSTEMS AND INFRASTRUCTURE SERVICES 1,556,229 15,000 4,256,610 5,827,839 1,637,416 15,000 9,049,950 10,702,366 CORE PUBLIC HEALTH SERVICES 47,666,874 - 4,493,000 52,159,874 49,584,587 - 4,493,000 54,077,587 TOTAL HEALTH SYSTEMS AND INFRASTRUCTURE ADMINISTRATION 49,223,103 15,000 8,749,610 57,987,713 51,222,003 15,000 13,542,950 64,779,953
C.8
GENERAL SPECIAL FEDERAL TOTAL GENERAL SPECIAL FEDERAL TOTALFUNDS FUNDS FUNDS FUNDS FUNDS FUNDS FUNDS FUNDS
SUMMARY OF OPERATING BUDGETS FOR FISCAL YEARS ENDING JUNE 30, 2015 AND 2016APPENDIX C
2015 APPROPRIATION 2016 ALLOWANCE
PREVENTION AND HEALTH PROMOTION ADMINISTRATIONINFECTIOUS DISEASE AND ENVIRONMENTAL HEALTH SERVICES 15,231,197 36,592,400 63,067,074 114,890,671 15,506,847 44,277,804 59,121,824 118,906,475 FAMILY HEALTH AND CHRONIC DISEASE SERVICES 38,949,289 47,136,517 154,398,381 240,484,187 21,825,047 46,798,346 147,154,169 215,777,562 TOTAL PREVENTION AND HEALTH PROMOTION ADMINISTRATION 54,180,486 83,728,917 217,465,455 355,374,858 37,331,894 91,076,150 206,275,993 334,684,037
OFFICE OF THE CHIEF MEDICAL EXAMINERPOST MORTEM EXAMINING SERVICES 11,510,549 - - 11,510,549 11,921,435 - - 11,921,435
OFFICE OF PREPAREDNESS AND RESPONSEOFFICE OF PREPAREDNESS AND RESPONSE 363,000 - 15,061,312 15,424,312 366,600 - 15,882,496 16,249,096
WESTERN MARYLAND CENTERSERVICES AND INSTITUTIONAL OPERATIONS 23,180,048 1,234,918 - 24,414,966 24,378,105 912,401 - 25,290,506
DEER'S HEAD CENTERSERVICES AND INSTITUTIONAL OPERATIONS 20,383,124 3,207,396 - 23,590,520 21,460,153 3,223,214 - 24,683,367
LABORATORIES ADMINISTRATIONLABORATORY SERVICES 40,455,073 535,700 2,847,363 43,838,136 43,861,211 586,920 2,784,373 47,232,504
DEPUTY SECRETARY FOR BEHAVIORAL HEALTHEXECUTIVE DIRECTION 2,044,321 - - 2,044,321 2,145,027 - - 2,145,027
BEHAVIORAL HEALTH ADMINISTRATIONPROGRAM DIRECTION 13,657,895 73,450 3,955,961 17,687,306 16,891,730 54,812 3,859,981 20,806,523 COMMUNITY SERVICES 147,312,733 28,448,425 72,505,186 248,266,344 146,612,159 29,190,047 64,125,854 239,928,060 COMMUNITY SERVICES FOR MEDICAID STATE FUND RECIPIENTS 54,949,562 - 4,400,000 59,349,562 59,986,311 - - 59,986,311 TOTAL BEHAVIORAL HEALTH ADMINISTRATION 215,920,190 28,521,875 80,861,147 325,303,212 223,490,200 29,244,859 67,985,835 320,720,894
THOMAS B. FINAN HOSPITAL CENTERSERVICES AND INSTITUTIONAL OPERATIONS 18,116,960 1,327,048 - 19,444,008 19,295,988 1,467,382 - 20,763,370
REGIONAL INSTITUTE FOR CHILDREN & ADOLESCENTS-BALTIMORE CITYSERVICES AND INSTITUTIONAL OPERATIONS 11,508,837 1,980,671 76,871 13,566,379 12,328,205 2,042,602 73,612 14,444,419
EASTERN SHORE HOSPITAL CENTERSERVICES AND INSTITUTIONAL OPERATIONS 18,993,533 6,688 - 19,000,221 20,066,784 5,009 - 20,071,793
SPRINGFIELD HOSPITAL CENTERSERVICES AND INSTITUTIONAL OPERATIONS 72,926,898 831,422 - 73,758,320 77,182,780 525,752 - 77,708,532
SPRING GROVE HOSPITAL CENTERSERVICES AND INSTITUTIONAL OPERATIONS 76,325,021 3,051,584 20,039 79,396,644 80,642,676 2,904,151 20,093 83,566,920
CLIFTON T. PERKINS HOSPITAL CENTERSERVICES AND INSTITUTIONAL OPERATIONS 61,199,709 126,658 - 61,326,367 64,402,759 117,433 - 64,520,192
JOHN L. GILDNER REGIONAL INSTITUTE FOR CHILDREN AND ADOLESCENTSSERVICES AND INSTITUTIONAL OPERATIONS 10,570,696 183,254 52,373 10,806,323 11,217,535 577,761 52,270 11,847,566
BEHAVIORAL HEALTH ADMINISTRATION FACILITY MAINTENANCESERVICES AND INSTITUTIONAL OPERATIONS 1,855,707 409,410 - 2,265,117 1,412,998 465,224 - 1,878,222
DEVELOPMENTAL DISABILITIES ADMINISTRATIONPROGRAM DIRECTION 5,191,899 - 3,334,778 8,526,677 5,678,985 - 3,740,062 9,419,047 COMMUNITY SERVICES 521,473,402 2,851,796 415,182,871 939,508,069 559,748,116 5,861,143 461,236,708 1,026,845,967 TOTAL DEVELOPMENTAL DISABILITIES ADMINISTRATION 526,665,301 2,851,796 418,517,649 948,034,746 565,427,101 5,861,143 464,976,770 1,036,265,014
HOLLY CENTERSERVICES AND INSTITUTIONAL OPERATIONS 17,623,469 134,790 - 17,758,259 18,672,642 87,314 - 18,759,956
DDA COURT INVOLVED SERVICE DELIVERY SYSTEMSERVICES AND INSTITUTIONAL OPERATIONS 8,925,081 - - 8,925,081 9,182,891 - - 9,182,891
POTOMAC CENTERSERVICES AND INSTITUTIONAL OPERATIONS 12,494,507 5,000 - 12,499,507 13,057,251 5,000 - 13,062,251
DEVELOPMENTAL DISABILITIES ADMINISTRATION FACILITYSERVICES AND INSTITUTIONAL OPERATIONS 1,071,783 728,714 - 1,800,497 503,644 550,894 - 1,054,538
C.9

GENERAL SPECIAL FEDERAL TOTAL GENERAL SPECIAL FEDERAL TOTALFUNDS FUNDS FUNDS FUNDS FUNDS FUNDS FUNDS FUNDS
SUMMARY OF OPERATING BUDGETS FOR FISCAL YEARS ENDING JUNE 30, 2015 AND 2016APPENDIX C
2015 APPROPRIATION 2016 ALLOWANCE
MEDICAL CARE PROGRAMS ADMINISTRATIONDEPUTY SECRETARY FOR HEALTH CARE FINANCING 1,335,212 - 1,535,472 2,870,684 1,522,663 - 1,736,041 3,258,704 OFFICE OF SYSTEMS, OPERATIONS AND PHARMACY 7,185,405 - 16,228,679 23,414,084 7,673,503 - 17,060,534 24,734,037 MEDICAL CARE PROVIDER REIMBURSEMENTS 2,370,523,406 950,528,748 5,518,924,737 8,839,976,891 2,464,366,005 937,007,802 5,076,047,831 8,477,421,638 OFFICE OF HEALTH SERVICES 11,157,776 25,949 15,861,432 27,045,157 9,798,883 1,079,504 21,181,752 32,060,139 OFFICE OF FINANCE 1,495,924 - 1,556,790 3,052,714 1,537,465 - 1,698,156 3,235,621 KIDNEY DISEASE TREATMENT SERVICES 2,923,765 2,308,229 - 5,231,994 5,039,129 271,851 - 5,310,980 MARYLAND CHILDREN'S HEALTH PROGRAM 72,429,548 7,731,504 145,581,447 225,742,499 33,276,953 6,279,679 178,017,211 217,573,843 MAJOR INFORMATION TECHNOLOGY DEVELOPMENT PROJECTS - - 72,506,557 72,506,557 - - 58,491,715 58,491,715 OFFICE OF ELIGIBILITY SERVICES 5,005,122 - 8,119,016 13,124,138 4,898,671 - 9,332,015 14,230,686 MEDICAID BEHAVIORAL HEALTH PROVIDER REIMBURSEMENT 323,120,289 11,114,687 448,013,799 782,248,775 360,302,378 11,114,687 670,513,231 1,041,930,296 TOTAL MEDICAL CARE PROGRAMS ADMINISTRATION 2,795,176,447 971,709,117 6,228,327,929 9,995,213,493 2,888,415,650 955,753,523 6,034,078,486 9,878,247,659
HEALTH REGULATORY COMMISSIONSMARYLAND HEALTH CARE COMMISSION - 35,372,646 3,132,418 38,505,064 - 29,983,912 228,118 30,212,030 HEALTH SERVICES COST REVIEW COMMISSION - 159,813,824 - 159,813,824 - 160,425,684 - 160,425,684 MARYLAND COMMUNITY HEALTH RESOURCES COMMISSION - 8,157,496 - 8,157,496 - 8,311,040 - 8,311,040 TOTAL HEALTH REGULATORY COMMISSIONS - 203,343,966 3,132,418 206,476,384 - 198,720,636 228,118 198,948,754
TOTAL DEPARTMENT OF HEALTH AND MENTAL HYGIENE 4,091,470,033 1,337,709,085 6,999,187,625 12,428,366,743 4,243,480,456 1,331,198,036 6,830,316,544 12,404,995,036
DEPARTMENT OF HUMAN RESOURCESOFFICE OF THE SECRETARYOFFICE OF THE SECRETARY 6,366,570 - 7,463,212 13,829,782 7,684,659 - 7,164,915 14,849,574 CITIZENS REVIEW BOARD FOR CHILDREN 722,601 - 164,181 886,782 850,882 - 69,090 919,972 MARYLAND COMMISSION FOR WOMEN 204,194 - - 204,194 239,756 - - 239,756 MARYLAND LEGAL SERVICES PROGRAM 9,806,525 - 3,668,681 13,475,206 12,157,193 - 1,922,962 14,080,155 TOTAL OFFICE OF THE SECRETARY 17,099,890 - 11,296,074 28,395,964 20,932,490 - 9,156,967 30,089,457
SOCIAL SERVICES ADMINISTRATIONGENERAL ADMINISTRATION-STATE 12,166,610 - 17,608,234 29,774,844 8,479,505 - 18,026,424 26,505,929
OPERATIONS OFFICEDIVISION OF BUDGET, FINANCE AND PERSONNEL 12,266,307 - 9,288,296 21,554,603 13,176,003 - 8,015,572 21,191,575 DIVISION OF ADMINISTRATIVE SERVICES 4,960,361 - 5,692,083 10,652,444 4,954,562 - 5,983,320 10,937,882 TOTAL OPERATIONS OFFICE 17,226,668 - 14,980,379 32,207,047 18,130,565 - 13,998,892 32,129,457
OFFICE OF TECHNOLOGY FOR HUMAN SERVICESMAJOR INFORMATION TECHNOLOGY DEVELOPMENT PROJECTS - - 1,250,020 1,250,020 - - 676,500 676,500 GENERAL ADMINISTRATION 29,662,500 1,427,682 37,192,561 68,282,743 31,909,091 1,427,682 38,804,831 72,141,604 TOTAL OFFICE OF TECHNOLOGY FOR HUMAN SERVICES 29,662,500 1,427,682 38,442,581 69,532,763 31,909,091 1,427,682 39,481,331 72,818,104
LOCAL DEPARTMENT OPERATIONSFOSTER CARE MAINTENANCE PAYMENTS 223,061,299 5,494,730 90,640,640 319,196,669 192,959,820 4,835,798 98,660,940 296,456,558 LOCAL FAMILY INVESTMENT PROGRAM 43,992,118 2,366,897 103,158,311 149,517,326 44,447,075 2,476,983 115,623,426 162,547,484 CHILD WELFARE SERVICES 138,895,126 1,489,381 79,023,344 219,407,851 171,367,246 1,517,566 54,774,257 227,659,069 ADULT SERVICES 9,616,043 1,295,498 33,690,889 44,602,430 9,513,647 1,737,793 36,323,056 47,574,496 GENERAL ADMINISTRATION 22,365,614 2,601,907 17,719,232 42,686,753 26,748,239 2,593,370 15,543,237 44,884,846 LOCAL CHILD SUPPORT ENFORCEMENT ADMINISTRATION 16,111,404 526,341 31,422,015 48,059,760 16,906,055 552,775 32,901,027 50,359,857 ASSISTANCE PAYMENTS 73,913,585 18,575,059 1,353,068,303 1,445,556,947 76,413,585 16,618,898 1,259,526,265 1,352,558,748 WORK OPPORTUNITIES - - 34,919,145 34,919,145 - - 33,331,529 33,331,529 TOTAL LOCAL DEPARTMENT OPERATIONS 527,955,189 32,349,813 1,743,641,879 2,303,946,881 538,355,667 30,333,183 1,646,683,737 2,215,372,587
CHILD SUPPORT ENFORCEMENT ADMINISTRATIONSUPPORT ENFORCEMENT-STATE 2,533,949 10,169,723 27,864,630 40,568,302 2,646,019 10,396,772 29,673,058 42,715,849
FAMILY INVESTMENT ADMINISTRATIONDIRECTOR'S OFFICE 9,103,753 335,209 22,322,445 31,761,407 8,989,148 370,588 22,890,069 32,249,805 MARYLAND OFFICE FOR REFUGEES AND ASYLEES - - 14,622,476 14,622,476 - - 14,410,177 14,410,177 OFFICE OF HOME ENERGY PROGRAMS - 76,666,930 65,607,205 142,274,135 - 70,383,614 67,204,544 137,588,158 OFFICE OF GRANTS MANAGEMENT 11,788,433 - 1,177,391 12,965,824 11,982,828 - 1,174,929 13,157,757 TOTAL FAMILY INVESTMENT ADMINISTRATION 20,892,186 77,002,139 103,729,517 201,623,842 20,971,976 70,754,202 105,679,719 197,405,897
TOTAL DEPARTMENT OF HUMAN RESOURCES 627,536,992 120,949,357 1,957,563,294 2,706,049,643 641,425,313 112,911,839 1,862,700,128 2,617,037,280
C.10
GENERAL SPECIAL FEDERAL TOTAL GENERAL SPECIAL FEDERAL TOTALFUNDS FUNDS FUNDS FUNDS FUNDS FUNDS FUNDS FUNDS
SUMMARY OF OPERATING BUDGETS FOR FISCAL YEARS ENDING JUNE 30, 2015 AND 2016APPENDIX C
2015 APPROPRIATION 2016 ALLOWANCE
DEPARTMENT OF LABOR, LICENSING, AND REGULATIONOFFICE OF THE SECRETARYEXECUTIVE DIRECTION 5,534,888 518,835 1,151,045 7,204,768 5,282,615 545,391 959,977 6,787,983 PROGRAM ANALYSIS AND AUDIT 62,034 70,043 257,654 389,731 67,644 77,124 286,097 430,865 LEGAL SERVICES 1,207,805 1,400,665 1,187,303 3,795,773 1,280,055 1,456,260 1,357,133 4,093,448 OFFICE OF FAIR PRACTICES 49,693 56,661 210,183 316,537 52,109 59,423 220,459 331,991 GOVERNOR'S WORKFORCE INVESTMENT BOARD 277,239 - - 277,239 287,909 - - 287,909 BOARD OF APPEALS - 51,563 1,709,524 1,761,087 - 57,354 1,406,130 1,463,484 LOWER APPEALS - 53,949 7,055,633 7,109,582 - 60,009 6,834,061 6,894,070 TOTAL OFFICE OF THE SECRETARY 7,131,659 2,151,716 11,571,342 20,854,717 6,970,332 2,255,561 11,063,857 20,289,750
DIVISION OF ADMINISTRATIONOFFICE OF BUDGET AND FISCAL SERVICES 747,443 969,082 3,015,346 4,731,871 1,030,458 1,137,632 3,476,675 5,644,765 OFFICE OF GENERAL SERVICES 717,815 1,088,975 3,037,455 4,844,245 768,915 1,000,359 3,254,534 5,023,808 OFFICE OF INFORMATION TECHNOLOGY 395,669 1,120,890 5,200,079 6,716,638 597,978 1,867,378 5,037,403 7,502,759 OFFICE OF HUMAN RESOURCES 333,145 382,392 1,415,592 2,131,129 356,435 406,437 1,507,752 2,270,624 TOTAL DIVISION OF ADMINISTRATION 2,194,072 3,561,339 12,668,472 18,423,883 2,753,786 4,411,806 13,276,364 20,441,956
DIVISION OF FINANCIAL REGULATIONFINANCIAL REGULATION 1,500,542 8,301,145 - 9,801,687 1,535,799 8,924,968 - 10,460,767
DIVISION OF LABOR AND INDUSTRYGENERAL ADMINISTRATION 65,507 444,025 218,368 727,900 69,023 467,805 230,067 766,895 EMPLOYMENT STANDARDS 791,777 952,345 - 1,744,122 919,092 1,021,886 - 1,940,978 RAILROAD SAFETY AND HEALTH - 393,327 - 393,327 - 408,783 - 408,783 SAFETY INSPECTION - 4,991,008 - 4,991,008 - 5,289,140 - 5,289,140 APPRENTICESHIP AND TRAINING 192,609 263,468 - 456,077 212,972 269,505 - 482,477 PREVAILING WAGE 987,731 - - 987,731 1,046,882 - - 1,046,882 OCCUPATIONAL SAFETY AND HEALTH ADMINISTRATION - 4,791,496 4,791,194 9,582,690 - 5,076,927 5,090,222 10,167,149 TOTAL DIVISION OF LABOR AND INDUSTRY 2,037,624 11,835,669 5,009,562 18,882,855 2,247,969 12,534,046 5,320,289 20,102,304
DIVISION OF RACINGMARYLAND RACING COMMISSION 440,547 52,326,848 - 52,767,395 453,896 49,931,129 - 50,385,025 RACETRACK OPERATION 1,741,574 500,000 - 2,241,574 1,737,220 500,000 - 2,237,220 SHARE OF RACING REVENUE TO LOCAL SUBDIVISIONS - 1,251,800 - 1,251,800 - - - - MARYLAND FACILITY REDEVELOPMENT PROGRAM - 7,851,098 - 7,851,098 - 6,869,213 - 6,869,213 SHARE OF VLT REVENUE FOR LOCAL IMPACT GRANTS - 40,739,641 - 40,739,641 - 38,876,975 - 38,876,975 TOTAL DIVISION OF RACING 2,182,121 102,669,387 - 104,851,508 2,191,116 96,177,317 - 98,368,433
DIVISION OF OCCUPATIONAL AND PROFESSIONAL LICENSINGOCCUPATIONAL AND PROFESSIONAL LICENSING 3,281,534 5,494,313 - 8,775,847 3,258,020 5,735,962 - 8,993,982
DIVISION OF WORKFORCE DEVELOPMENT AND ADULT LEARNINGWORKFORCE DEVELOPMENT 2,190,000 2,410,595 70,428,679 75,029,274 2,190,000 2,275,534 65,257,562 69,723,096 ADULT EDUCATION AND LITERACY PROGRAM 1,218,124 147,897 1,574,005 2,940,026 1,164,975 79,262 1,584,191 2,828,428 ADULT CORRECTIONS PROGRAM 15,338,242 - 233,976 15,572,218 16,130,582 - - 16,130,582 AID TO EDUCATION 8,433,622 - 7,749,423 16,183,045 8,433,622 - 7,607,481 16,041,103 TOTAL DIVISION OF WORKFORCE DEVELOPMENT AND ADULT LEARNING 27,179,988 2,558,492 79,986,083 109,724,563 27,919,179 2,354,796 74,449,234 104,723,209
DIVISION OF UNEMPLOYMENT INSURANCEOFFICE OF UNEMPLOYMENT INSURANCE - 7,098,875 72,447,542 79,546,417 - 3,118,613 73,998,227 77,116,840 MAJOR INFORMATION TECHNOLOGY DEVELOPMENT PROJECTS - - 12,417,500 12,417,500 - - 8,479,870 8,479,870 TOTAL DIVISION OF UNEMPLOYMENT INSURANCE - 7,098,875 84,865,042 91,963,917 - 3,118,613 82,478,097 85,596,710
TOTAL DEPARTMENT OF LABOR, LICENSING, AND REGULATION 45,507,540 143,670,936 194,100,501 383,278,977 46,876,201 135,513,069 186,587,841 368,977,111
DEPARTMENT OF PUBLIC SAFETY AND CORRECTIONAL SERVICESOFFICE OF THE SECRETARYGENERAL ADMINISTRATION 36,945,658 490,000 - 37,435,658 34,969,287 540,000 - 35,509,287 INFORMATION TECHNOLOGY AND COMMUNICATIONS DIVISION 28,052,187 4,822,268 650,000 33,524,455 29,681,824 6,090,136 900,000 36,671,960 INTELLIGENCE AND INVESTIGATIVE DIVISION 5,056,596 - - 5,056,596 5,444,317 - - 5,444,317 9-1-1 EMERGENCY NUMBER SYSTEMS - 59,396,132 - 59,396,132 - 59,420,576 - 59,420,576 CAPITAL APPROPRIATION - - - - - - - - DIV OF CAP CONSTRUCTION AND FACILITIES MAINTENANCE 3,231,363 - - 3,231,363 3,728,123 - - 3,728,123 MAJOR INFORMATION TECHNOLOGY DEVELOPMENT PROJECTS - 850,000 - 850,000 - 750,000 - 750,000 TOTAL OFFICE OF THE SECRETARY 73,285,804 65,558,400 650,000 139,494,204 73,823,551 66,800,712 900,000 141,524,263
C.11

GENERAL SPECIAL FEDERAL TOTAL GENERAL SPECIAL FEDERAL TOTALFUNDS FUNDS FUNDS FUNDS FUNDS FUNDS FUNDS FUNDS
SUMMARY OF OPERATING BUDGETS FOR FISCAL YEARS ENDING JUNE 30, 2015 AND 2016APPENDIX C
2015 APPROPRIATION 2016 ALLOWANCE
DEPUTY SECRETARY FOR OPERATIONSADMINISTRATIVE SERVICES 10,134,094 - - 10,134,094 14,077,284 800,000 - 14,877,284 COMMUNITY SUPERVISION SUPPORT 25,169,940 166,650 - 25,336,590 24,676,366 160,000 - 24,836,366 PROGRAMS AND SERVICES 5,561,156 727,828 - 6,288,984 6,341,643 221,824 - 6,563,467 SECURITY OPERATIONS 33,259,971 - - 33,259,971 35,111,537 - - 35,111,537 TOTAL DEPUTY SECRETARY FOR OPERATIONS 74,125,161 894,478 - 75,019,639 80,206,830 1,181,824 - 81,388,654
MARYLAND CORRECTIONAL ENTERPRISESMARYLAND CORRECTIONAL ENTERPRISES - 55,682,220 - 55,682,220 - 57,839,262 - 57,839,262
MARYLAND PAROLE COMMISSIONGENERAL ADMINISTRATION AND HEARINGS 6,027,545 - - 6,027,545 6,191,863 - - 6,191,863
INMATE GRIEVANCE OFFICEGENERAL ADMINISTRATION - 1,001,779 - 1,001,779 - 1,091,309 - 1,091,309
POLICE AND CORRECTIONAL TRAINING COMMISSIONSGENERAL ADMINISTRATION 7,954,894 384,000 324,947 8,663,841 8,231,155 413,400 291,102 8,935,657
CRIMINAL INJURIES COMPENSATION BOARDADMINISTRATION AND AWARDS - 3,507,398 1,500,000 5,007,398 - 3,471,024 1,700,000 5,171,024
MARYLAND COMMISSION ON CORRECTIONAL STANDARDSGENERAL ADMINISTRATION 579,234 - - 579,234 536,728 - - 536,728
GENERAL ADMINISTRATION - NORTHGENERAL ADMINISTRATION 3,727,115 - - 3,727,115 3,917,261 - - 3,917,261
CORRECTIONS - NORTHMARYLAND CORRECTIONAL INSTITUTION-HAGERSTOWN 70,060,253 410,909 - 70,471,162 70,967,778 462,444 - 71,430,222 MARYLAND CORRECTIONAL TRAINING CENTER 71,149,082 959,919 - 72,109,001 75,817,744 815,514 - 76,633,258 ROXBURY CORRECTIONAL INSTITUTION 50,104,367 374,243 - 50,478,610 53,630,527 437,028 - 54,067,555 WESTERN CORRECTIONAL INSTITUTION 54,641,406 449,802 - 55,091,208 58,342,522 437,009 - 58,779,531 NORTH BRANCH CORRECTIONAL INSTITUTION 57,667,172 272,834 - 57,940,006 63,064,600 317,352 - 63,381,952 PATUXENT INSTITUTION 50,820,275 211,215 299,514 51,331,004 53,304,794 142,977 300,000 53,747,771 TOTAL CORRECTIONS - NORTH 354,442,555 2,678,922 299,514 357,420,991 375,127,965 2,612,324 300,000 378,040,289
COMMUNITY SUPERVISION - NORTHCOMMUNITY SUPERVISION 17,346,404 2,715,445 - 20,061,849 18,835,039 2,582,320 - 21,417,359
GENERAL ADMINISTRATION - SOUTHGENERAL ADMINISTRATION 6,469,119 - - 6,469,119 6,905,060 - - 6,905,060
CORRECTIONS - SOUTHJESSUP CORRECTIONAL INSTITUTION 67,417,494 542,564 - 67,960,058 73,016,367 493,162 - 73,509,529 MARYLAND CORRECTIONAL INSTITUTION-JESSUP 39,799,522 346,436 - 40,145,958 42,117,095 342,921 - 42,460,016 MARYLAND CORRECTIONAL INSTITUTION FOR WOMEN 37,989,549 364,359 - 38,353,908 39,928,570 298,345 - 40,226,915 BROCKBRIDGE CORRECTIONAL FACILITY 22,742,169 43,691 - 22,785,860 24,307,284 176,980 - 24,484,264 SOUTHERN MARYLAND PRE-RELEASE UNIT 4,897,705 200,576 - 5,098,281 5,354,337 183,622 - 5,537,959 EASTERN PRE-RELEASE UNIT 5,131,719 157,176 - 5,288,895 5,472,442 156,560 - 5,629,002 EASTERN CORRECTIONAL INSTITUTION 104,600,879 905,757 1,250,000 106,756,636 111,428,358 985,989 1,120,000 113,534,347 DORSEY RUN CORRECTIONAL FACILITY 16,931,139 129,247 - 17,060,386 19,060,422 121,100 - 19,181,522 TOTAL CORRECTIONS - SOUTH 299,510,176 2,689,806 1,250,000 303,449,982 320,684,875 2,758,679 1,120,000 324,563,554
COMMUNITY SUPERVISION - SOUTHCOMMUNITY SUPERVISION 24,533,422 2,225,169 - 26,758,591 25,500,100 2,163,395 - 27,663,495
GENERAL ADMINISTRATION - CENTRALGENERAL ADMINISTRATION 4,293,833 - - 4,293,833 4,345,983 - - 4,345,983
CORRECTIONS - CENTRALMETROPOLITAN TRANSITION CENTER 41,173,977 454,810 - 41,628,787 44,501,084 592,115 - 45,093,199 MD RECEPTION, DIAGNOSTIC AND CLASSIFICATION CENTER 39,214,014 100,000 - 39,314,014 36,890,360 119,000 - 37,009,360 BALTIMORE PRE-RELEASE UNIT 4,990,633 300,105 - 5,290,738 - - - - BALTIMORE CITY CORRECTIONAL CENTER 14,088,931 70,000 - 14,158,931 14,512,800 274,000 - 14,786,800 CENTRAL MARYLAND CORRECTIONAL FACILITY 14,272,506 196,090 - 14,468,596 15,299,208 170,539 - 15,469,747 TOTAL CORRECTIONS - CENTRAL 113,740,061 1,121,005 - 114,861,066 111,203,452 1,155,654 - 112,359,106
C.12

GENERAL SPECIAL FEDERAL TOTAL GENERAL SPECIAL FEDERAL TOTALFUNDS FUNDS FUNDS FUNDS FUNDS FUNDS FUNDS FUNDS
SUMMARY OF OPERATING BUDGETS FOR FISCAL YEARS ENDING JUNE 30, 2015 AND 2016APPENDIX C
2015 APPROPRIATION 2016 ALLOWANCE
COMMUNITY SUPERVISION - CENTRALCOMMUNITY SUPERVISION 36,757,579 1,485,902 - 38,243,481 38,894,549 1,412,633 - 40,307,182 PRETRIAL RELEASE SERVICES 6,004,708 - - 6,004,708 6,334,869 - - 6,334,869 TOTAL COMMUNITY SUPERVISION - CENTRAL 42,762,287 1,485,902 - 44,248,189 45,229,418 1,412,633 - 46,642,051
DETENTION - CENTRALCHESAPEAKE DETENTION FACILITY - 70,000 23,015,902 23,085,902 - 56,000 24,860,941 24,916,941 BALTIMORE CITY DETENTION CENTER 84,585,766 799,187 385,835 85,770,788 89,544,743 537,345 5,000 90,087,088 BALTIMORE CENTRAL BOOKING AND INTAKE CENTER 62,914,515 192,146 - 63,106,661 62,173,185 178,309 - 62,351,494 TOTAL DETENTION - CENTRAL 147,500,281 1,061,333 23,401,737 171,963,351 151,717,928 771,654 24,865,941 177,355,523
TOTAL DEPARTMENT OF PUBLIC SAFETY AND CORRECTIONAL SERVICES 1,176,297,891 141,005,857 27,426,198 1,344,729,946 1,232,457,208 144,254,190 29,177,043 1,405,888,441
STATE DEPARTMENT OF EDUCATIONHEADQUARTERSOFFICE OF THE STATE SUPERINTENDENT 6,369,187 745,881 33,865,550 40,980,618 6,161,505 403,748 5,552,843 12,118,096 DIVISION OF BUSINESS SERVICES 1,997,882 42,935 5,967,196 8,008,013 1,701,286 22,212 6,301,260 8,024,758 DIVISION OF ACADEMIC POLICY AND INNOVATION 774,604 - 68,756 843,360 492,261 - 74,845 567,106 DIVISION OF ACCOUNTABILITY AND ASSESSMENT 29,000,931 299,826 8,087,654 37,388,411 35,465,346 564,583 7,276,324 43,306,253 OFFICE OF INFORMATION TECHNOLOGY 3,688,810 45,297 2,334,755 6,068,862 3,608,306 - 2,696,076 6,304,382 MAJOR INFORMATION TECHNOLOGY DEVELOPMENT PROJECTS - - 2,097,564 2,097,564 - - 300,000 300,000 OFFICE OF SCHOOL AND COMMUNITY NUTRITION PROGRAMS 265,100 - 6,171,827 6,436,927 264,741 21,853 8,062,070 8,348,664 DIVISION OF EARLY CHILDHOOD DEVELOPMENT 12,938,067 - 40,604,872 53,542,939 13,366,557 - 40,521,828 53,888,385 DIVISION OF CURRICULUM, ASSESSMENT AND ACCOUNTABILITY 1,765,586 1,903,128 2,313,547 5,982,261 2,092,290 1,604,388 2,384,902 6,081,580 DIVISION OF STUDENT, FAMILY AND SCHOOL SUPPORT 1,877,090 25,877 4,443,623 6,346,590 2,027,293 38,103 4,856,112 6,921,508 DIVISION OF SPECIAL EDUCATION/EARLY INTERVENTION SERVICES 621,218 783,716 14,847,303 16,252,237 706,730 1,031,028 11,313,010 13,050,768 DIVISION OF CAREER AND COLLEGE READINESS 1,167,084 - 2,005,947 3,173,031 1,204,729 - 1,939,294 3,144,023 JUVENILE SERVICES EDUCATION PROGRAM 13,065,052 - 940,344 14,005,396 13,894,381 - 1,342,882 15,237,263 DIVISION OF LIBRARY DEVELOPMENT AND SERVICES 548,098 - 1,865,171 2,413,269 3,120,087 - 2,309,087 5,429,174 DIVISION OF CERTIFICATION AND ACCREDITATION 2,490,110 211,693 182,472 2,884,275 2,584,477 229,770 155,199 2,969,446 DIV OF REHABILITATION SERVICES-HEADQUARTERS 1,578,632 90,580 8,711,154 10,380,366 1,717,528 87,413 9,556,414 11,361,355 DIV OF REHABILITATION SERVICES-CLIENT SERVICES 10,019,907 - 28,674,143 38,694,050 9,699,480 - 22,819,065 32,518,545 DIV OF REHABILITATION SERVICES-WORKFORCE AND TECHNOLOGY CENTER 1,596,584 - 7,708,448 9,305,032 1,720,695 - 8,012,219 9,732,914 DIV OF REHABILITATION SERVICES-DISABILITY DETERMINATION SERVICES - - 36,641,279 36,641,279 - - 46,997,186 46,997,186 DIV OF REHABILITATION SERVICES-BLINDNESS AND VISION SERVICES 956,332 3,241,156 3,955,150 8,152,638 1,589,554 3,254,968 4,084,079 8,928,601 TOTAL HEADQUARTERS 90,720,274 7,390,089 211,486,755 309,597,118 101,417,246 7,258,066 186,554,695 295,230,007
AID TO EDUCATIONSTATE SHARE OF FOUNDATION PROGRAM 2,681,914,859 407,287,482 - 3,089,202,341 2,703,614,751 394,006,600 - 3,097,621,351 COMPENSATORY EDUCATION 1,251,675,638 - - 1,251,675,638 1,305,132,944 - - 1,305,132,944 AID FOR LOCAL EMPLOYEE FRINGE BENEFITS 757,603,298 - - 757,603,298 787,215,491 - - 787,215,491 CHILDREN AT RISK 10,146,460 4,400,000 17,364,453 31,910,913 10,285,467 4,800,000 18,142,500 33,227,967 FORMULA PROGRAMS FOR SPECIFIC POPULATIONS 3,881,000 - - 3,881,000 3,000,000 - - 3,000,000 MARYLAND PREKINDERGARTEN EXPANSION PROGRAM 4,300,000 - - 4,300,000 4,300,000 - 14,250,000 18,550,000 STUDENTS WITH DISABILITIES 405,053,968 - - 405,053,968 425,548,409 - - 425,548,409 ASSISTANCE TO STATE FOR EDUCATING STUDENTS WITH DISABILITIES - - 201,898,733 201,898,733 - - 202,365,484 202,365,484 GIFTED AND TALENTED - - 916,850 916,850 - - - - EDUCATIONALLY DEPRIVED CHILDREN - - 207,414,579 207,414,579 - - 204,840,000 204,840,000 INNOVATIVE PROGRAMS 12,898,945 - 186,028 13,084,973 7,992,000 - 220,000 8,212,000 LANGUAGE ASSISTANCE - - 9,820,000 9,820,000 - - 9,363,356 9,363,356 CAREER AND TECHNOLOGY EDUCATION - - 12,800,461 12,800,461 - - 13,056,307 13,056,307 LIMITED ENGLISH PROFICIENT 197,658,807 - - 197,658,807 217,180,270 - - 217,180,270 GUARANTEED TAX BASE 59,390,154 - - 59,390,154 53,762,142 - - 53,762,142 FOOD SERVICES PROGRAM 11,236,664 25,000 308,611,100 319,872,764 11,236,664 - 343,709,680 354,946,344 PUBLIC LIBRARIES 34,446,212 - 600,000 35,046,212 37,199,438 - 600,000 37,799,438 STATE LIBRARY NETWORK 16,323,271 - - 16,323,271 17,139,051 - - 17,139,051 TRANSPORTATION 258,379,692 - - 258,379,692 266,246,924 - - 266,246,924 SCIENCE AND MATHEMATICS EDUCATION INITIATIVE 2,621,230 - 1,455,000 4,076,230 2,000,000 - 1,475,247 3,475,247 TEACHER DEVELOPMENT 13,000,000 300,000 33,500,000 46,800,000 23,600,000 300,000 31,650,000 55,550,000 TRANSITIONAL EDUCATION FUNDING PROGRAM 10,575,000 165,000 - 10,740,000 10,575,000 495,000 - 11,070,000 HEAD START 1,800,000 - - 1,800,000 1,800,000 - - 1,800,000 CHILD CARE SUBSIDY PROGRAM 37,847,835 - 45,106,764 82,954,599 37,847,835 - 54,643,304 92,491,139 TOTAL AID TO EDUCATION 5,770,753,033 412,177,482 839,673,968 7,022,604,483 5,925,676,386 399,601,600 894,315,878 7,219,593,864
FUNDING FOR EDUCATIONAL ORGANIZATIONSMARYLAND SCHOOL FOR THE BLIND 19,365,845 - - 19,365,845 19,620,767 - - 19,620,767 BLIND INDUSTRIES AND SERVICES OF MD 531,115 - - 531,115 531,115 - - 531,115 OTHER INSTITUTIONS 6,181,446 - - 6,181,446 6,181,446 - - 6,181,446 AID TO NON-PUBLIC SCHOOLS - 6,040,000 - 6,040,000 - 6,040,000 - 6,040,000 TOTAL FUNDING FOR EDUCATIONAL ORGANIZATIONS 26,078,406 6,040,000 - 32,118,406 26,333,328 6,040,000 - 32,373,328
C.13

GENERAL SPECIAL FEDERAL TOTAL GENERAL SPECIAL FEDERAL TOTALFUNDS FUNDS FUNDS FUNDS FUNDS FUNDS FUNDS FUNDS
SUMMARY OF OPERATING BUDGETS FOR FISCAL YEARS ENDING JUNE 30, 2015 AND 2016APPENDIX C
2015 APPROPRIATION 2016 ALLOWANCE
CHILDREN'S CABINET INTERAGENCY FUNDCHILDREN'S CABINET INTERAGENCY FUND 21,439,072 - - 21,439,072 23,020,000 - - 23,020,000
MARYLAND LONGITUDINAL DATA SYSTEM CENTERMARYLAND LONGITUDINAL DATA SYSTEM CENTER 2,161,395 - 163,000 2,324,395 2,211,074 - - 2,211,074
TOTAL STATE DEPARTMENT OF EDUCATION 5,911,152,180 425,607,571 1,051,323,723 7,388,083,474 6,078,658,034 412,899,666 1,080,870,573 7,572,428,273
MARYLAND PUBLIC BROADCASTING COMMISSIONEXECUTIVE DIRECTION AND CONTROL - 811,236 - 811,236 - 884,767 - 884,767 ADMINISTRATION AND SUPPORT SERVICES 8,044,694 1,257,582 - 9,302,276 8,420,775 744,237 3,000,000 12,165,012 BROADCASTING - 10,860,592 478,721 11,339,313 - 11,871,325 440,013 12,311,338 CONTENT ENTERPRISES - 5,817,096 492,845 6,309,941 - 5,703,833 559,310 6,263,143 TOTAL MARYLAND PUBLIC BROADCASTING COMMISSION 8,044,694 18,746,506 971,566 27,762,766 8,420,775 19,204,162 3,999,323 31,624,260
MARYLAND HIGHER EDUCATION COMMISSIONGENERAL ADMINISTRATION 5,082,567 1,053,326 472,013 6,607,906 5,218,737 943,266 534,634 6,696,637 COLLEGE PREP/INTERVENTION PROGRAM 750,000 - - 750,000 750,000 - - 750,000 JOSEPH A. SELLINGER FORMULA FOR AID TO NON-PUBLIC INSTITUTIONS OF HIGHER EDUCATION 41,422,240 - - 41,422,240 47,883,915 - - 47,883,915 SENATOR JOHN A. CADE FUNDING FORMULA FOR DIST. OF FUNDS TO COMMUNITY COLLEGES 242,732,222 - - 242,732,222 248,436,368 - - 248,436,368 AID TO COMMUNITY COLLEGES - FRINGE BENEFITS 54,593,676 - - 54,593,676 58,876,199 - - 58,876,199 EDUCATIONAL GRANTS 9,660,250 136,605 3,100,000 12,896,855 7,760,250 - 2,230,000 9,990,250 EDUCATIONAL EXCELLENCE AWARDS 77,008,868 3,000,000 - 80,008,868 80,009,603 - - 80,009,603 SENATORIAL SCHOLARSHIPS 6,486,000 - - 6,486,000 6,486,000 - - 6,486,000 EDWARD T. CONROY MEMORIAL SCHOLARSHIP PROGRAM 570,474 250,000 - 820,474 570,474 - - 570,474 DELEGATE SCHOLARSHIPS 5,625,000 - - 5,625,000 5,906,250 - - 5,906,250 CHARLES W. RILEY FIRE AND EMERGENCY MEDICAL SERVICES TUITION REIMBURSEMENT PROGRAM - 358,000 - 358,000 - 358,000 - 358,000 GRADUATE AND PROFESSIONAL SCHOLARSHIP PROGRAM 1,174,473 - - 1,174,473 1,174,473 - - 1,174,473 DISTINGUISHED SCHOLAR PROGRAM 771,000 - - 771,000 - - - - JACK F. TOLBERT MEMORIAL STUDENT GRANT PROGRAM 200,000 - - 200,000 200,000 - - 200,000 JANET L. HOFFMAN LOAN ASSISTANCE REPAYMENT PROGRAM 1,492,895 240,000 - 1,732,895 1,492,895 75,000 - 1,567,895 MARYLAND LOAN ASSISTANCE REPAYMENT PROGRAM FOR PHYSICIANS - 1,032,282 - 1,032,282 - 1,032,282 - 1,032,282 PRIVATE DONATION INCENTIVE GRANTS - - - - - - - - PART-TIME GRANT PROGRAM 5,087,780 - - 5,087,780 5,087,780 - - 5,087,780 WORKFORCE SHORTAGE STUDENT ASSISTANCE GRANTS 1,254,775 - - 1,254,775 1,254,775 - - 1,254,775 VETERANS OF THE AFGHANISTAN AND IRAQ CONFLICTS SCHOLARSHIPS 750,000 750,000 - 1,500,000 750,000 - - 750,000 NURSE SUPPORT PROGRAM II - 15,486,921 - 15,486,921 - 6,521,590 - 6,521,590 HEALTH PERSONNEL SHORTAGE INCENTIVE GRANT PROGRAM - 2,000,000 - 2,000,000 - 750,000 - 750,000 TOTAL MARYLAND HIGHER EDUCATION COMMISSION 454,662,220 24,307,134 3,572,013 482,541,367 471,857,719 9,680,138 2,764,634 484,302,491
SUPPORT FOR STATE OPERATED INSTITUTIONS OF HIGHER EDUCATIONSUPPORT FOR STATE OPERATED INSTITUTIONS OF HIGHER EDUCATION 1,332,136,294 68,747,771 - 1,400,884,065 1,407,350,293 71,848,333 - 1,479,198,626
MARYLAND SCHOOL FOR THE DEAFMARYLAND SCHOOL FOR THE DEAF-FREDERICK CAMPUSSERVICES AND INSTITUTIONAL OPERATIONS 20,604,486 208,816 171,615 20,984,917 21,128,696 200,145 265,759 21,594,600
MARYLAND SCHOOL FOR THE DEAF-COLUMBIA CAMPUSSERVICES AND INSTITUTIONAL OPERATIONS 9,397,631 116,118 367,545 9,881,294 10,347,169 125,509 256,415 10,729,093
TOTAL MARYLAND SCHOOL FOR THE DEAF 30,002,117 324,934 539,160 30,866,211 31,475,865 325,654 522,174 32,323,693
DEPARTMENT OF HOUSING AND COMMUNITY DEVELOPMENTOFFICE OF THE SECRETARYOFFICE OF THE SECRETARY - 2,030,855 1,570,966 3,601,821 - 2,672,636 1,108,647 3,781,283 OFFICE OF MANAGEMENT SERVICES - 2,245,470 1,753,639 3,999,109 - 4,330,015 1,853,974 6,183,989 TOTAL OFFICE OF THE SECRETARY - 4,276,325 3,324,605 7,600,930 - 7,002,651 2,962,621 9,965,272
DIVISION OF CREDIT ASSURANCEMARYLAND HOUSING FUND - 439,968 - 439,968 - 464,335 - 464,335 ASSET MANAGEMENT - 5,044,036 57,500 5,101,536 - 5,073,610 - 5,073,610 MARYLAND BUILDING CODES - 820,968 - 820,968 - 839,931 - 839,931 TOTAL DIVISION OF CREDIT ASSURANCE - 6,304,972 57,500 6,362,472 - 6,377,876 - 6,377,876
DIVISION OF NEIGHBORHOOD REVITALIZATIONNEIGHBORHOOD REVITALIZATION 4,910,000 11,264,399 11,906,993 28,081,392 4,910,000 11,057,201 11,949,161 27,916,362 NEIGHBORHOOD REVITALIZATION-CAPITAL APPROPRIATION - 1,950,000 10,000,000 11,950,000 - 1,050,000 10,000,000 11,050,000 TOTAL DIVISION OF NEIGHBORHOOD REVITALIZATION 4,910,000 13,214,399 21,906,993 40,031,392 4,910,000 12,107,201 21,949,161 38,966,362
DIVISION OF DEVELOPMENT FINANCEADMINISTRATION - 3,095,528 25,000 3,120,528 - 3,271,459 25,000 3,296,459 HOUSING DEVELOPMENT PROGRAM - 4,599,997 445,000 5,044,997 - 4,716,105 445,000 5,161,105
C.14

GENERAL SPECIAL FEDERAL TOTAL GENERAL SPECIAL FEDERAL TOTALFUNDS FUNDS FUNDS FUNDS FUNDS FUNDS FUNDS FUNDS
SUMMARY OF OPERATING BUDGETS FOR FISCAL YEARS ENDING JUNE 30, 2015 AND 2016APPENDIX C
2015 APPROPRIATION 2016 ALLOWANCE
SINGLE FAMILY HOUSING - 4,977,476 396,111 5,373,587 - 4,987,524 419,246 5,406,770 HOUSING AND BUILDING ENERGY PROGRAMS - 28,784,382 7,047,926 35,832,308 - 36,143,300 3,581,510 39,724,810 RENTAL SERVICES PROGRAMS - 50,000 219,100,629 219,150,629 - 50,000 223,115,108 223,165,108 RENTAL HOUSING PROGRAMS-CAPITAL APPROPRIATION - 24,275,000 3,225,000 27,500,000 - 24,750,000 3,000,000 27,750,000 HOMEOWNERSHIP PROGRAMS-CAPITAL APPROPRIATION - 1,000,000 700,000 1,700,000 - 1,200,000 700,000 1,900,000 SPECIAL LOAN PROGRAMS-CAPITAL APPROPRIATION - 800,000 3,000,000 3,800,000 - 1,550,000 3,000,000 4,550,000 MARYLAND BRAC PRESERVATION LOAN FUND-CAPITAL APPROPRIATION - 3,000,000 - 3,000,000 - 3,500,000 - 3,500,000 TOTAL DIVISION OF DEVELOPMENT FINANCE - 70,582,383 233,939,666 304,522,049 - 80,168,388 234,285,864 314,454,252
DIVISION OF INFORMATION TECHNOLOGYINFORMATION TECHNOLOGY 240,000 2,220,322 1,524,199 3,984,521 149,207 2,709,214 1,600,773 4,459,194
DIVISION OF FINANCE AND ADMINISTRATIONFINANCE AND ADMINISTRATION 4,556,075 5,240,194 2,533,436 12,329,705 2,139,312 5,907,990 1,422,003 9,469,305
TOTAL DEPARTMENT OF HOUSING AND COMMUNITY DEVELOPMENT 9,706,075 101,838,595 263,286,399 374,831,069 7,198,519 114,273,320 262,220,422 383,692,261
MARYLAND AFRICAN AMERICAN MUSEUM CORPORATIONGENERAL ADMINISTRATION 2,000,000 - - 2,000,000 2,000,000 - - 2,000,000
DEPARTMENT OF BUSINESS AND ECONOMIC DEVELOPMENTOFFICE OF THE SECRETARYSECRETARIAT SERVICES 2,000,943 270,587 32,050 2,303,580 2,003,547 233,926 53,000 2,290,473 OFFICE OF THE ATTORNEY GENERAL 91,664 1,764,064 5,564 1,861,292 91,664 1,834,306 8,564 1,934,534 MARYLAND ENTERPRISE INVESTMENT FUND ADMINISTRATION - 1,343,326 - 1,343,326 - 1,350,502 - 1,350,502 BIOMARYLAND CENTER 3,779,009 - - 3,779,009 3,791,358 - - 3,791,358 OFFICE OF ADMINISTRATION AND TECHNOLOGY 3,956,753 855,866 71,436 4,884,055 4,135,345 891,543 120,060 5,146,948 TOTAL OFFICE OF THE SECRETARY 9,828,369 4,233,843 109,050 14,171,262 10,021,914 4,310,277 181,624 14,513,815
DIVISION OF MARKETING AND COMMUNICATIONSDIVISION OF MARKETING AND COMMUNICATIONS 2,482,242 786,114 - 3,268,356 2,773,092 797,950 - 3,571,042
DIVISION OF BUSINESS AND ENTERPRISE DEVELOPMENTASSISTANT SECRETARY OF BUSINESS AND ENTERPRISE 554,578 36,895 - 591,473 585,950 39,571 - 625,521 OFFICE OF INTERNATIONAL INVESTMENT AND TRADE 2,667,372 105,468 - 2,772,840 2,688,066 105,468 - 2,793,534 MD SMALL BUSINESS DEVELOPMENT FINANCING AUTHOR - 1,827,716 - 1,827,716 - 1,827,716 - 1,827,716 OFFICE OF BUSINESS DEVELOPMENT 3,120,761 766,749 - 3,887,510 3,043,960 770,874 - 3,814,834 OFFICE OF STRATEGIC INDUSTRIES AND INNOVATION 2,624,524 433,725 - 3,058,249 2,640,241 450,617 - 3,090,858 PARTNERSHIP FOR WORKFORCE QUALITY - 100,000 - 100,000 - - - - OFFICE OF FINANCE PROGRAMS - 3,793,965 - 3,793,965 - 4,057,138 - 4,057,138 MD SMALL BUSINESS DEVELOPMENT FINANCING AUTHORITY-BUSINESS ASSISTANCE 1,500,000 4,755,000 - 6,255,000 1,500,000 4,755,000 - 6,255,000 MARYLAND NOT-FOR-PROFIT DEVELOPMENT FUND - 110,000 - 110,000 - 110,000 - 110,000 MD BIOTECH INVESTMENT TAX CREDIT RESERVE FUND 12,000,000 - - 12,000,000 12,000,000 - - 12,000,000 OFFICE OF MILITARY AFFAIRS 854,050 98,203 1,146,490 2,098,743 881,938 103,288 746,673 1,731,899 SMALL, MINORITY, AND WOMEN-OWNED BUSINESS INVESTMENT ACCOUNT - 11,110,811 - 11,110,811 - 10,602,811 - 10,602,811 ECONOMIC DEVELOPMENT OPPORTUNITY FUND - 1,071,429 - 1,071,429 - - - - MARYLAND ENTERPRISE INVESTMENT FUND AND CHALLENGE PROGRAMS - 29,887,926 7,270,706 37,158,632 - 15,055,000 - 15,055,000 MILITARY PERSONNEL AND SERVICE-DISABLED VETERANS LOAN PROGRAM 300,000 - - 300,000 300,000 - - 300,000 CYBERMARYLAND INVESTMENT INCENTIVE TAX CREDIT 4,000,000 - - 4,000,000 2,000,000 - - 2,000,000 MARYLAND E-NNOVATION INITIATIVE - - - - 500,000 8,000,000 - 8,500,000 MARYLAND ECONOMIC ADJUSTMENT FUND - 400,000 - 400,000 - - - - MARYLAND ECONOMIC DEVELOPMENT ASSISTANCE AUTHORITY AND FUND 7,423,234 19,076,766 - 26,500,000 7,423,234 12,576,766 - 20,000,000 MARYLAND INDUSTRIAL DEVELOPMENT FINANCING AUTHORITY - - 500,000 500,000 - - - - TOTAL DIVISION OF BUSINESS AND ENTERPRISE DEVELOPMENT 35,044,519 73,574,653 8,917,196 117,536,368 33,563,389 58,454,249 746,673 92,764,311
DIVISION OF TOURISM, FILM AND THE ARTSOFFICE OF THE ASSISTANT SECRETARY 801,348 - - 801,348 753,477 - - 753,477 OFFICE OF TOURISM DEVELOPMENT 3,541,742 - - 3,541,742 3,716,422 - - 3,716,422 MARYLAND TOURISM DEVELOPMENT BOARD 10,500,000 300,000 501,865 11,301,865 8,157,767 300,000 - 8,457,767 MARYLAND STATE ARTS COUNCIL 16,208,984 300,000 576,457 17,085,441 16,780,513 300,000 612,419 17,692,932 FILM PRODUCTION REBATE PROGRAM - 7,500,000 - 7,500,000 - - - - PRESERVATION OF CULTURAL ARTS PROGRAM - 1,250,000 - 1,250,000 - 2,000,000 - 2,000,000 TOTAL DIVISION OF TOURISM, FILM AND THE ARTS 31,052,074 9,350,000 1,078,322 41,480,396 29,408,179 2,600,000 612,419 32,620,598
TOTAL DEPARTMENT OF BUSINESS AND ECONOMIC DEVELOPMENT 78,407,204 87,944,610 10,104,568 176,456,382 75,766,574 66,162,476 1,540,716 143,469,766
C.15

GENERAL SPECIAL FEDERAL TOTAL GENERAL SPECIAL FEDERAL TOTALFUNDS FUNDS FUNDS FUNDS FUNDS FUNDS FUNDS FUNDS
SUMMARY OF OPERATING BUDGETS FOR FISCAL YEARS ENDING JUNE 30, 2015 AND 2016APPENDIX C
2015 APPROPRIATION 2016 ALLOWANCE
MARYLAND TECHNOLOGY DEVELOPMENT CORPORATIONTECHNOLOGY DEVELOPMENT, TRANSFER AND COMMERCIALIZATION 3,673,192 - - 3,673,192 3,623,192 - - 3,623,192 MARYLAND STEM CELL RESEARCH FUND 10,400,000 - - 10,400,000 9,400,000 - - 9,400,000 MARYLAND INNOVATION INITIATIVE 5,000,000 - - 5,000,000 4,900,000 - - 4,900,000 CYBERSECURITY INVESTMENT FUND 1,000,000 - - 1,000,000 1,000,000 - - 1,000,000 TOTAL MARYLAND TECHNOLOGY DEVELOPMENT CORPORATION 20,073,192 - - 20,073,192 18,923,192 - - 18,923,192
DEPARTMENT OF THE ENVIRONMENTOFFICE OF THE SECRETARYOFFICE OF THE SECRETARY 1,006,220 377,182 826,440 2,209,842 1,081,213 561,340 898,816 2,541,369 CAPITAL APPROPRIATION-WATER QUALITY REVOLVING LOAN FUND - 91,250,000 32,291,000 123,541,000 - 89,308,000 33,910,000 123,218,000 CAPITAL APPROPRIATION-HAZARDOUS SUBSTANCE CLEAN-UP PROGRAM 1,000,000 - - 1,000,000 700,000 - - 700,000 CAPITAL APPROPRIATION-DRINKING WATER REVOLVING LOAN FUND - 10,370,000 9,016,000 19,386,000 - 10,038,000 10,959,000 20,997,000 CAPITAL APPROPRIATION-BAY RESTORATION FUND-WASTEWATER - 81,000,000 - 81,000,000 - 80,000,000 - 80,000,000 CAPITAL APPROPRIATION-BAY RESTORATION FUND-SEPTIC SYSTEMS - 15,000,000 - 15,000,000 - 14,000,000 - 14,000,000 TOTAL OFFICE OF THE SECRETARY 2,006,220 197,997,182 42,133,440 242,136,842 1,781,213 193,907,340 45,767,816 241,456,369
OPERATIONAL SERVICES ADMINISTRATIONOPERATIONAL SERVICES ADMINISTRATION 5,326,774 2,036,085 1,400,690 8,763,549 5,345,096 2,361,758 1,429,055 9,135,909
WATER MANAGEMENT ADMINISTRATIONWATER MANAGEMENT ADMINISTRATION 13,928,774 8,896,850 7,758,333 30,583,957 14,024,542 9,515,738 7,568,686 31,108,966
SCIENCE SERVICES ADMINISTRATIONSCIENCE SERVICES ADMINISTRATION 5,119,409 1,265,027 6,534,616 12,919,052 5,318,869 1,024,593 6,781,500 13,124,962
LAND MANAGEMENT ADMINISTRATIONLAND MANAGEMENT ADMINISTRATION 2,794,759 21,255,390 10,117,998 34,168,147 2,941,169 20,977,060 11,145,070 35,063,299
AIR AND RADIATION MANAGEMENT ADMINISTRATIONAIR AND RADIATION MANAGEMENT ADMINISTRATION 1,262,074 11,859,859 3,891,412 17,013,345 999,451 13,061,290 3,831,642 17,892,383
COORDINATING OFFICESCOORDINATING OFFICES 4,261,987 14,479,792 4,690,014 23,431,793 4,528,753 16,186,718 3,089,038 23,804,509 BAY RESTORATION FUND DEBT SERVICE - 9,700,000 - 9,700,000 - 14,500,000 - 14,500,000 TOTAL COORDINATING OFFICES 4,261,987 24,179,792 4,690,014 33,131,793 4,528,753 30,686,718 3,089,038 38,304,509
TOTAL DEPARTMENT OF THE ENVIRONMENT 34,699,997 267,490,185 76,526,503 378,716,685 34,939,093 271,534,497 79,612,807 386,086,397
DEPARTMENT OF JUVENILE SERVICESOFFICE OF THE SECRETARYOFFICE OF THE SECRETARY 4,035,203 - - 4,035,203 3,614,951 - - 3,614,951
DEPARTMENTAL SUPPORTDEPARTMENTAL SUPPORT 24,332,040 250,000 225,129 24,807,169 25,820,190 196,103 240,188 26,256,481
RESIDENTIAL AND COMMUNITY OPERATIONSRESIDENTIAL AND COMMUNITY OPERATIONS 3,873,937 50,230 618,668 4,542,835 4,348,324 67,689 575,205 4,991,218
BALTIMORE CITY REGIONBALTIMORE CITY REGION OPERATIONS 65,698,090 1,178,934 1,469,892 68,346,916 63,812,528 1,153,510 1,390,401 66,356,439
CENTRAL REGIONCENTRAL REGION OPERATIONS 36,549,516 490,464 653,624 37,693,604 37,379,300 484,037 662,156 38,525,493
WESTERN REGIONWESTERN REGION OPERATIONS 41,664,560 1,237,925 1,227,524 44,130,009 45,436,739 1,310,913 1,310,926 48,058,578
EASTERN SHORE REGIONEASTERN SHORE REGION OPERATIONS 21,922,225 454,374 657,192 23,033,791 23,787,322 369,025 683,091 24,839,438
SOUTHERN REGIONSOUTHERN REGION OPERATIONS 24,422,596 396,962 519,328 25,338,886 27,219,411 405,852 792,641 28,417,904
METRO REGIONMETRO REGION OPERATIONS 61,519,036 907,042 1,771,110 64,197,188 59,983,613 919,252 1,729,863 62,632,728
TOTAL DEPARTMENT OF JUVENILE SERVICES 284,017,203 4,965,931 7,142,467 296,125,601 291,402,378 4,906,381 7,384,471 303,693,230
C.16

GENERAL SPECIAL FEDERAL TOTAL GENERAL SPECIAL FEDERAL TOTALFUNDS FUNDS FUNDS FUNDS FUNDS FUNDS FUNDS FUNDS
SUMMARY OF OPERATING BUDGETS FOR FISCAL YEARS ENDING JUNE 30, 2015 AND 2016APPENDIX C
2015 APPROPRIATION 2016 ALLOWANCE
DEPARTMENT OF STATE POLICEMARYLAND STATE POLICEOFFICE OF THE SUPERINTENDENT 19,884,639 - - 19,884,639 20,943,227 - - 20,943,227 FIELD OPERATIONS BUREAU 115,592,954 88,778,730 - 204,371,684 124,410,938 93,203,601 - 217,614,539 CRIMINAL INVESTIGATION BUREAU 45,632,918 428,737 - 46,061,655 44,837,789 309,746 - 45,147,535 SUPPORT SERVICES BUREAU 58,457,931 40,000 2,593,435 61,091,366 60,657,677 40,000 1,172,439 61,870,116 VEHICLE THEFT PREVENTION COUNCIL - 1,976,684 - 1,976,684 - 1,971,063 - 1,971,063 MAJOR INFORMATION TECHNOLOGY DEVELOPMENT PROJECTS - 1,731,721 - 1,731,721 - - - - TOTAL MARYLAND STATE POLICE 239,568,442 92,955,872 2,593,435 335,117,749 250,849,631 95,524,410 1,172,439 347,546,480
FIRE PREVENTION COMMISSION AND FIRE MARSHALFIRE PREVENTION SERVICES 7,977,425 - - 7,977,425 8,032,330 - - 8,032,330
TOTAL DEPARTMENT OF STATE POLICE 247,545,867 92,955,872 2,593,435 343,095,174 258,881,961 95,524,410 1,172,439 355,578,810
PUBLIC DEBTREDEMPTION AND INTEREST ON STATE BONDSREDEMPTION AND INTEREST ON STATE BONDS 140,000,000 887,932,357 11,489,645 1,039,422,002 274,000,000 845,377,926 11,477,263 1,130,855,189
STATE RESERVE FUNDREVENUE STABILIZATION ACCOUNT 19,713,999 - - 19,713,999 50,000,000 - - 50,000,000
DEDICATED PURPOSE ACCOUNTDEDICATED PURPOSE ACCOUNT - - - - 150,000,000 - - 150,000,000
TOTAL STATE RESERVE FUND 19,713,999 - - 19,713,999 200,000,000 - - 200,000,000
TOTAL OPERATING EXPENDITURES 16,015,831,145 8,118,935,276 11,825,912,015 35,960,678,436 16,909,490,878 8,410,972,078 11,645,521,163 36,965,984,119
JANUARY 2015 BPW COST CONTAINMENT (197,805,188) (7,450,000) - (205,255,188) CONTINGENT REDUCTIONS (45,000,000) (45,000,000) (208,607,719) (59,569,402) (7,319,540) (275,496,661) ACROSS THE BOARD REDUCTION - - - - (117,992,000) - - (117,992,000) SALARY SCALE ADJUSTMENT - - - - (68,690,000) (15,585,000) (9,331,000) (93,606,000) ELIMINATION OF INCREMENT/MERIT - - - - (81,219,924) (12,914,334) (8,386,038) (102,520,296) VOLUNTARY SEPARATION PROGRAM (7,500,000) - - (7,500,000) (30,000,000) - - (30,000,000) ESTIMATED REVERSIONS (35,078,538) - - (35,078,538) (41,149,000) - - (41,149,000)
APPENDIX C SUBTOTAL NO. 1 15,730,447,419 8,111,485,276 11,825,912,015 35,667,844,710 16,361,832,235 8,322,903,342 11,620,484,585 36,305,220,162
-
C.17

GENERAL SPECIAL FEDERAL TOTAL GENERAL SPECIAL FEDERAL TOTALFUNDS FUNDS FUNDS FUNDS FUNDS FUNDS FUNDS FUNDS
SUMMARY OF OPERATING BUDGETS FOR FISCAL YEARS ENDING JUNE 30, 2015 AND 2016APPENDIX C
2015 APPROPRIATION 2016 ALLOWANCE
DEFICIENCY APPROPRIATIONS FOR FY 2015 -
OFFICE OF THE PUBLIC DEFENDERDISTRICT OPERATIONS 2,467,341 - - 2,467,341
BOARD OF PUBLIC WORKSADMINISTRATION OFFICE 200,000 - - 200,000
OFFICE OF THE DEAF AND HARD OF HEARINGEXECUTIVE DIRECTION 17,000 - - 17,000
DEPARTMENT OF AGINGCOMMUNITY SERVICES 416,133 - - 416,133
MARYLAND STADIUM AUTHORITYBALTIMORE CONVENTION CENTER 2,386,223 - - 2,386,223
STATE BOARD OF ELECTIONSGENERAL ADMINISTRATION - 109,000 - 109,000 MAJOR INFORMATION TECHNOLOGY DEVELOPMENT PROJECTS - 1,155,458 - 1,155,458 TOTAL STATE BOARD OF ELECTIONS - 1,264,458 - 1,264,458
DEPARTMENT OF PLANNINGMANAGEMENT PLANNING AND EDUCATIONAL OUTREACH - (300,000) 587,979 287,979 MUSEUM SERVICES 150,000 - - 150,000 SUSTAINABLE COMMUNITIES TAX CREDIT (1,000,000) - - (1,000,000) TOTAL DEPARTMENT OF PLANNING (850,000) (300,000) 587,979 (562,021)
DEPARTMENT OF VETERANS AFFAIRSCEMETERY PROGRAM-CAPITAL APPROPRIATION 45,000 - - 45,000
MARYLAND HEALTH BENEFIT EXCHANGEMARYLAND HEALTH BENEFIT EXCHANGE 3,200,000 - - 3,200,000 MAJOR INFORMATION TECHNOLOGY DEVELOPMENT PROJECTS 2,323,727 - - 2,323,727 TOTAL MARYLAND HEALTH BENEFIT EXCHANGE 5,523,727 - - 5,523,727
- CANAL PLACE PRESERVATION AND DEVELOPMENT AUTHORITY - GENERAL ADMINISTRATION 41,572 - - 41,572
- COMPLIANCE DIVISION - COMPLIANCE ADMINISTRATION 60,923 1,000,000 - 1,060,923
- STATE TREASURER'S OFFICE - TREASURY MANAGEMENT - TREASURY MANAGEMENT 97,503 - - 97,503
- STATE LOTTERY AND GAMING CONTROL AGENCY - ADMINISTRATION AND OPERATIONS - 2,994,688 - 2,994,688 VIDEO LOTTERY TERMINAL AND GAMING OPERATIONS 1,600,000 - - 1,600,000 TOTAL STATE LOTTERY AND GAMING CONTROL AGENCY 1,600,000 2,994,688 - 4,594,688
- MAJOR INFORMATION TECHNOLOGY DEVELOPMENT PROJECTS PROJECT FUND - MAJOR INFORMATION TECHNOLOGY DEVELOPMENT PROJECTS - 1,155,458 - 1,155,458
- DEPARTMENT OF NATURAL RESOURCES - MARYLAND PARK SERVICE - STATE-WIDE OPERATIONS 22,783,636 (24,900,636) - (2,117,000) REVENUE OPERATIONS - (140,000) - (140,000) TOTAL MARYLAND PARK SERVICE 22,783,636 (25,040,636) - (2,257,000)
- LAND ACQUISITION AND PLANNING - OUTDOOR RECREATION LAND LOAN - (7,123,821) 723,700 (6,400,121)
- CHESAPEAKE AND COASTAL SERVICE - CHESAPEAKE AND COASTAL SERVICE - 10,000 - 10,000
- FISHERIES SERVICE - FISHERIES SERVICE - - 1,058,745 1,058,745
- TOTAL DEPARTMENT OF NATURAL RESOURCES 22,783,636 (32,154,457) 1,782,445 (7,588,376)
- DEPARTMENT OF AGRICULTURE -
C.18

GENERAL SPECIAL FEDERAL TOTAL GENERAL SPECIAL FEDERAL TOTALFUNDS FUNDS FUNDS FUNDS FUNDS FUNDS FUNDS FUNDS
SUMMARY OF OPERATING BUDGETS FOR FISCAL YEARS ENDING JUNE 30, 2015 AND 2016APPENDIX C
2015 APPROPRIATION 2016 ALLOWANCE
OFFICE OF MARKETING, ANIMAL INDUSTRIES, AND CONSUMER SERVICES - RURAL MARYLAND COUNCIL - 14,610 - 14,610
- OFFICE OF RESOURCE CONSERVATION - NUTRIENT MANAGEMENT - 54,004 - 54,004
- TOTAL DEPARTMENT OF AGRICULTURE - 68,614 - 68,614
- DEPARTMENT OF HEALTH AND MENTAL HYGIENE - REGULATORY SERVICES - OFFICE OF HEALTH CARE QUALITY 89,737 - 29,911 119,648
- DEVELOPMENTAL DISABILITIES ADMINISTRATION - PROGRAM DIRECTION 1,104,272 - 818,461 1,922,733 COMMUNITY SERVICES - 2,700,000 - 2,700,000 TOTAL DEVELOPMENTAL DISABILITIES ADMINISTRATION 1,104,272 2,700,000 818,461 4,622,733
- MEDICAL CARE PROGRAMS ADMINISTRATION - MEDICAL CARE PROVIDER REIMBURSEMENTS 147,300,000 11,450,000 - 158,750,000
- TOTAL DEPARTMENT OF HEALTH AND MENTAL HYGIENE 148,494,009 14,150,000 848,372 163,492,381
- DEPARTMENT OF HUMAN RESOURCES - LOCAL DEPARTMENT OPERATIONS - FOSTER CARE MAINTENANCE PAYMENTS (215,000) - - (215,000) LOCAL FAMILY INVESTMENT PROGRAM 500,000 - 1,500,000 2,000,000 ASSISTANCE PAYMENTS - - 11,454,903 11,454,903 WORK OPPORTUNITIES - - (800,000) (800,000)
- TOTAL DEPARTMENT OF HUMAN RESOURCES 285,000 - 12,154,903 12,439,903
- DEPARTMENT OF LABOR, LICENSING, AND REGULATION - DIVISION OF RACING - SHARE OF VLT REVENUE FOR LOCAL IMPACT GRANTS - (4,073,964) - (4,073,964)
- DEPARTMENT OF PUBLIC SAFETY AND CORRECTIONAL SERVICES - DEPUTY SECRETARY FOR OPERATIONS - ADMINISTRATIVE SERVICES - 400,000 - 400,000
CORRECTIONS - NORTH - MARYLAND CORRECTIONAL INSTITUTION-HAGERSTOWN 1,500,000 - - 1,500,000 NORTH BRANCH CORRECTIONAL INSTITUTION 1,333,333 - - 1,333,333 TOTAL CORRECTIONS - NORTH 2,833,333 - - 2,833,333
CORRECTIONS - SOUTH - JESSUP CORRECTIONAL INSTITUTION 8,300,000 - - 8,300,000
DETENTION - CENTRAL - BALTIMORE CITY DETENTION CENTER 1,666,667 - - 1,666,667
TOTAL DEPARTMENT OF PUBLIC SAFETY AND CORRECTIONAL SERVICES 12,800,000 400,000 - 13,200,000 -
STATE DEPARTMENT OF EDUCATION - HEADQUARTERS - DIVISION OF ACCOUNTABILITY AND ASSESSMENT 16,769,449 - - 16,769,449
AID TO EDUCATION - STATE SHARE OF FOUNDATION PROGRAM 16,426,036 (16,426,036) - - STUDENTS WITH DISABILITIES 10,423,005 - - 10,423,005 TEACHER DEVELOPMENT 10,600,000 - - 10,600,000 TOTAL AID TO EDUCATION 37,449,041 (16,426,036) - 21,023,005
MARYLAND LONGITUDINAL DATA SYSTEM CENTER - MARYLAND LONGITUDINAL DATA SYSTEM CENTER (304,153) - - (304,153)
TOTAL STATE DEPARTMENT OF EDUCATION 53,914,337 (16,426,036) - 37,488,301 - -
MARYLAND PUBLIC BROADCASTING COMMISSION - CONTENT ENTERPRISES 370,115 - - 370,115
-
C.19

GENERAL SPECIAL FEDERAL TOTAL GENERAL SPECIAL FEDERAL TOTALFUNDS FUNDS FUNDS FUNDS FUNDS FUNDS FUNDS FUNDS
SUMMARY OF OPERATING BUDGETS FOR FISCAL YEARS ENDING JUNE 30, 2015 AND 2016APPENDIX C
2015 APPROPRIATION 2016 ALLOWANCE
DEPARTMENT OF BUSINESS AND ECONOMIC DEVELOPMENT - DIVISION OF TOURISM, FILM AND THE ARTS - MARYLAND STATE ARTS COUNCIL (790,042) - - (790,042)
- MARYLAND TECHNOLOGY DEVELOPMENT CORPORATION - MARYLAND STEM CELL RESEARCH FUND (1,000,000) - - (1,000,000)
- DEPARTMENT OF THE ENVIRONMENT - AIR AND RADIATION MANAGEMENT ADMINISTRATION - AIR AND RADIATION MANAGEMENT ADMINISTRATION (300,000) 300,000 - -
- DEPARTMENT OF JUVENILE SERVICES - BALTIMORE CITY REGION - BALTIMORE CITY REGION OPERATIONS (75,583) - - (75,583)
WESTERN REGION - WESTERN REGION OPERATIONS (54,741) - - (54,741)
METRO REGION - METRO REGION OPERATIONS (71,342) - - (71,342)
TOTAL DEPARTMENT OF JUVENILE SERVICES (201,666) - - (201,666) -
DEPARTMENT OF STATE POLICE - MARYLAND STATE POLICE - FIELD OPERATIONS BUREAU 2,000,000 - - 2,000,000
TOTAL DEFICIENCIES 250,360,811 (31,621,239) 15,373,699 234,113,271
APPENDIX C SUBTOTAL NO. 2 15,980,808,230 8,079,864,037 11,841,285,714 35,901,957,981
C.20

CURRENT CURRENT CURRENT CURRENTUNRESTRICTED RESTRICTED TOTAL UNRESTRICTED RESTRICTED TOTAL
FUND FUND FUND FUND FUND FUND
HIGHER EDUCATION:UNIVERSITY OF MARYLAND, BALTIMORE 590,650,833 482,551,462 1,073,202,295 603,997,451 486,006,675 1,090,004,126
UNIVERSITY OF MARYLAND, COLLEGE PARK 1,432,297,240 429,082,648 1,861,379,888 1,492,413,404 442,024,934 1,934,438,338
BOWIE STATE UNIVERSITY 95,240,898 22,000,000 117,240,898 99,632,696 22,000,000 121,632,696
TOWSON UNIVERSITY 406,304,474 50,172,050 456,476,524 422,710,981 50,172,050 472,883,031
UNIVERSITY OF MARYLAND EASTERN SHORE 107,004,877 33,544,781 140,549,658 110,683,634 33,678,947 144,362,581
FROSTBURG STATE UNIVERSITY 96,944,311 12,360,000 109,304,311 101,331,829 12,360,000 113,691,829
COPPIN STATE UNIVERSITY 72,864,186 18,000,000 90,864,186 75,511,004 18,000,000 93,511,004
UNIVERSITY OF BALTIMORE 112,718,279 25,454,034 138,172,313 116,837,251 25,102,610 141,939,861
SALISBURY UNIVERSITY 167,438,842 13,000,000 180,438,842 176,026,049 13,000,000 189,026,049
UNIVERSITY OF MARYLAND UNIVERSITY COLLEGE 351,735,870 35,274,732 387,010,602 358,864,573 35,274,732 394,139,305
UNIVERSITY OF MARYLAND BALTIMORE COUNTY 322,706,505 82,200,000 404,906,505 335,794,513 83,815,935 419,610,448
UNIVERSITY OF MARYLAND CENTER FOR ENVIRONMENTAL SCIENCE 28,678,777 18,115,369 46,794,146 30,378,209 18,115,369 48,493,578
UNIVERSITY SYSTEM OF MARYLAND OFFICE 28,515,738 3,595,335 32,111,073 30,332,285 3,595,335 33,927,620
BALTIMORE CITY COMMUNITY COLLEGE 68,515,117 22,568,640 91,083,757 67,995,776 21,660,117 89,655,893
ST. MARY'S COLLEGE OF MARYLAND 68,828,624 4,200,000 73,028,624 68,599,470 4,200,000 72,799,470
MORGAN STATE UNIVERSITY 177,478,605 46,571,246 224,049,851 184,134,720 48,538,950 232,673,670
SUBTOTAL - HIGHER EDUCATION 4,127,923,176 1,298,690,297 5,426,613,473 4,275,243,845 1,317,545,654 5,592,789,499
DEFICIENCY APPROPRIATION FOR FY 2015ST. MARY'S COLLEGE OF MARYLAND (931,000) (931,000)
HIGHER EDUCATION AND DEFICIENCY SUBTOTAL 5,425,682,473
LESS: GENERAL & SPECIAL FUNDS IN HIGHER EDUCATIONGENERAL FUNDS 1,332,136,294 1,407,350,293
HIGHER EDUCATION INVESTMENT FUNDS 60,670,779 63,686,840
OTHER SPECIAL FUNDS 8,076,992 8,161,493
TOTAL HIGHER EDUCATION 4,024,798,408 4,113,590,873
GRAND TOTAL FOR APPENDIX C 39,926,756,389 40,418,811,035
APPENDIX CSUMMARY OF OPERATING BUDGETS FOR FISCAL YEARS ENDING JUNE 30, 2015 AND 2016
FY 2015 APPROPRIATION FY 2016 ALLOWANCE
C.21

FY 2015 FY 2016 INCREASE/OBJECT CLASSIFICATION APPROPRIATION ALLOWANCE (DECREASE)
01 SALARIES AND WAGES 7,757,397,190 8,202,168,149 444,770,959 02 TECHNICAL AND SPECIAL FEES 376,359,974 373,475,054 (2,884,920) 03 COMMUNICATIONS 134,166,670 138,805,350 4,638,680 04 TRAVEL 97,256,422 98,868,465 1,612,043 06 FUEL AND UTILITIES 310,533,674 335,188,517 24,654,843 07 MOTOR VEHICLE OPERATION 261,536,297 251,286,960 (10,249,337) 08 CONTRACTUAL SERVICES 15,045,882,336 15,107,759,426 61,877,090 09 SUPPLIES AND MATERIALS 451,781,394 449,364,510 (2,416,884) 10 EQUIPMENT-REPLACEMENT 70,696,105 59,285,534 (11,410,571) 11 EQUIPMENT-ADDITIONAL 185,418,269 139,436,519 (45,981,750) 12 GRANTS, SUBSIDIES AND
CONTRIBUTIONS 13,603,813,766 13,899,107,294 295,293,528 13 FIXED CHARGES 1,793,931,429 1,928,010,766 134,079,337 14 LAND AND STRUCTURES 1,670,243,587 1,927,310,666 257,067,079 TOTAL 41,759,017,113 42,910,067,210 1,151,050,097
TOTAL DEFICIENCIES 233,182,271 -JAN 2015 BPW COST CONTAINMENT (205,255,188) - CONTINGENT REDUCTIONS (45,000,000) (275,496,661) ACROSS THE BOARD REDUCTION - (117,992,000) SALARY SCALE ADJUSTMENT - (93,606,000) ELIMINATION OF INCREMENT/MERIT - (102,520,296) VOLUNTARY SEPARATION PROGRAM (7,500,000) (30,000,000) ESTIMATED REVERSIONS (35,078,538) (41,149,000)
TOTAL 41,699,365,658 42,249,303,253 549,937,595
GENERAL FUNDS 15,980,808,230 16,361,832,235 381,024,005 SPECIAL FUNDS 8,079,864,037 8,322,903,342 243,039,305 FEDERAL FUNDS 11,841,285,714 11,620,484,585 (220,801,129) REIMBURSABLE FUNDS 371,725,204 351,293,592 (20,431,612) CURRENT UNRESTRICTED FUNDS 4,126,992,176 4,275,243,845 148,251,669 CURRENT RESTRICTED FUNDS 1,298,690,297 1,317,545,654 18,855,357 TOTAL 41,699,365,658 42,249,303,253 549,937,595
LESS: FUNDS IN HIGHER EDUCATION 1,400,884,065 1,479,198,626 78,314,561 LESS: REIMBURSABLE FUNDS 371,725,204 351,293,592 (20,431,612)
GRAND TOTAL 39,926,756,389 40,418,811,035 492,054,646
APPENDIX DSUMMARY OF OPERATING BUDGETS BY OBJECT
CLASSIFICATIONS FOR FISCAL YEARS 2015 AND 2016TOTAL FUNDS
D.1

Beginning of FY 2015
Adjust- ments
Approved by BPW
Agency Abolitions
Agency Transfers Deficiencies
FY 2015 Approp.
BudgetTransfers Abolitions New
FY 2016 Allowance
GENERAL ASSEMBLY OF MARYLAND 748.00 1.00 - - - - 749.00 - - - 749.00JUDICIARY 3,732.50 - - - - - 3,732.50 - - 233.00 3,965.50
LEGISLATIVE AND JUDICIAL BRANCHES SUBTOTAL 4,480.50 1.00 - - - - 4,481.50 - - 233.00 4,714.50
OFFICE OF THE PUBLIC DEFENDER 923.00 - - - - - 923.00 - - - 923.00
OFFICE OF THE ATTORNEY GENERAL 248.50 - - - - - 248.50 - - 9.00 257.50
OFFICE OF THE STATE PROSECUTOR 13.00 - - - - - 13.00 - - - 13.00
MARYLAND TAX COURT 8.00 - - - - - 8.00 - - - 8.00
PUBLIC SERVICE COMMISSION 139.00 - - - - - 139.00 - - 1.00 140.00
OFFICE OF THE PEOPLE'S COUNSEL 19.00 - - - - - 19.00 - - - 19.00
SUBSEQUENT INJURY FUND 17.00 - - - - - 17.00 - - - 17.00
UNINSURED EMPLOYERS' FUND 14.00 - - - - - 14.00 - - - 14.00
WORKERS' COMPENSATION COMMISSION 121.00 - - - - - 121.00 - - - 121.00
BOARD OF PUBLIC WORKS 9.00 - - - - - 9.00 - - - 9.00
EXECUTIVE DEPARTMENT - GOVERNOR 89.10 - - - (1.00) - 88.10 - - - 88.10
OFFICE OF THE DEAF AND HARD OF HEARING 3.00 - - - - - 3.00 - - - 3.00
DEPARTMENT OF DISABILITIES 25.80 - - - - - 25.80 - - - 25.80
MARYLAND ENERGY ADMINISTRATION 34.00 - - - - - 34.00 - - - 34.00
EXECUTIVE DEPT-BOARDS, COMMISSIONS AND OFFICES 97.10 - - - - - 97.10 - - - 97.10
SECRETARY OF STATE 24.00 - - - - - 24.00 - - 1.00 25.00
HISTORIC ST. MARY'S CITY COMMISSION 32.00 - - - - - 32.00 - (3.00) - 29.00
GOVERNOR'S OFFICE FOR CHILDREN 16.50 - - - - - 16.50 - - - 16.50
INTERAGENCY COMMITTEE ON SCHOOL CONSTRUCTION 19.00 - - - - - 19.00 - - 2.00 21.00
DEPARTMENT OF AGING 51.70 - - - - - 51.70 - - - 51.70
MARYLAND COMMISSION ON CIVIL RIGHTS 34.50 - - - - - 34.50 - (0.50) - 34.00
STATE BOARD OF ELECTIONS 41.60 - 0.20 - - - 41.80 - - - 41.80
MARYLAND STATE BOARD OF CONTRACT APPEALS 5.00 - - - - - 5.00 - - - 5.00
DEPARTMENT OF PLANNING 152.00 - (1.00) - - - 151.00 - - - 151.00
MILITARY DEPARTMENT OPERATIONS AND MAINTENANCE 318.50 - (2.00) - - - 316.50 (1.00) - - 315.50
APPENDIX EPERSONNEL DETAIL TABLE 1: AUTHORIZED POSITIONS FROM JULY 1, 2014 TO THE FY 2016 ALLOWANCE
E.1

Beginning of FY 2015
Adjust- ments
Approved by BPW
Agency Abolitions
Agency Transfers Deficiencies
FY 2015 Approp.
BudgetTransfers Abolitions New
FY 2016 Allowance
APPENDIX EPERSONNEL DETAIL TABLE 1: AUTHORIZED POSITIONS FROM JULY 1, 2014 TO THE FY 2016 ALLOWANCE
MD INSTITUTE FOR EMERGENCY MEDICAL SERVICES SYSTEMS 94.10 - 0.90 - - - 95.00 - - 1.00 96.00
DEPARTMENT OF VETERANS AFFAIRS 79.00 - - - - - 79.00 - - - 79.00
STATE ARCHIVES 57.50 - - - - - 57.50 - - - 57.50
MARYLAND HEALTH BENEFIT EXCHANGE 69.00 - - - - - 69.00 - - - 69.00
HEALTH INSURANCE SAFETY NET PROGRAMS 9.00 - - - - - 9.00 - (1.00) - 8.00
INSURANCE ADMINISTRATION AND REGULATION 266.00 - - - - - 266.00 - - - 266.00
CANAL PLACE PRESERVATION AND DEVELOPMENT AUTHORITY 3.00 - - - - - 3.00 - - - 3.00
OFFICE OF ADMINISTRATIVE HEARINGS 120.00 - - - - - 120.00 - - - 120.00
OFFICE OF THE COMPTROLLER 69.00 - - - 5.00 - 74.00 - - - 74.00GENERAL ACCOUNTING DIVISION 44.00 - - - 1.00 - 45.00 - - - 45.00BUREAU OF REVENUE ESTIMATES 5.00 - - - - - 5.00 - - - 5.00REVENUE ADMINISTRATION DIVISION 375.60 - - - (1.00) - 374.60 - (1.60) - 373.00COMPLIANCE DIVISION 389.30 - - - (2.00) 12.00 399.30 - (0.50) - 398.80FIELD ENFORCEMENT DIVISION 55.00 - - - - - 55.00 - - - 55.00CENTRAL PAYROLL BUREAU 32.10 - - - - - 32.10 - - - 32.10INFORMATION TECHNOLOGY DIVISION 148.00 - - - (3.00) - 145.00 - - - 145.00COMPTROLLER OF MARYLAND 1,118.00 - - - - 12.00 1,130.00 - (2.10) - 1,127.90
TREASURY MANAGEMENT 38.00 - 2.00 - - - 40.00 - - - 40.00INSURANCE PROTECTION 19.00 - - - - - 19.00 - - - 19.00STATE TREASURER'S OFFICE 57.00 - 2.00 - - - 59.00 - - - 59.00
STATE DEPARTMENT OF ASSESSMENTS AND TAXATION 614.30 - - - - - 614.30 - - 8.00 622.30
STATE LOTTERY AND GAMING CONTROL AGENCY 308.60 - - - - - 308.60 - - 9.00 317.60
PROPERTY TAX ASSESSMENT APPEALS BOARDS 9.00 - - - - - 9.00 - - - 9.00
OFFICE OF THE SECRETARY 162.80 - - - - - 162.80 - - 2.00 164.80OFFICE OF PERSONNEL SERVICES AND BENEFITS 118.50 - - - - - 118.50 - - 2.00 120.50OFFICE OF BUDGET ANALYSIS 25.00 - - - - - 25.00 - - - 25.00OFFICE OF CAPITAL BUDGETING 10.00 - - - - - 10.00 - - - 10.00DEPARTMENT OF BUDGET AND MANAGEMENT 316.30 - - - - - 316.30 - - 4.00 320.30
OFFICE OF INFORMATION TECHNOLOGY 134.00 - - - 6.00 - 140.00 - (4.00) 2.00 138.00
STATE RETIREMENT AGENCY 192.00 - - - - - 192.00 - - 12.00 204.00
TEACHERS AND STATE EMPLOYEES SUPP'L RETIREMENT PLANS 13.00 - - - - - 13.00 - - - 13.00
OFFICE OF THE SECRETARY 38.50 - (2.00) - (5.00) - 31.50 - - - 31.50OFFICE OF FACILITIES SECURITY 173.00 - - - - - 173.00 - - - 173.00OFFICE OF FACILITIES OPERATION AND MAINTENANCE 207.00 - - - - - 207.00 - - - 207.00OFFICE OF PROCUREMENT AND LOGISTICS 66.00 - - - 1.00 - 67.00 - - - 67.00OFFICE OF REAL ESTATE 26.00 - - - - - 26.00 - - - 26.00OFFICE OF FACILITIES PLANNING, DESIGN AND CONSTRUCTION 81.00 - - - (1.00) - 80.00 - - - 80.00DEPARTMENT OF GENERAL SERVICES 591.50 - (2.00) - (5.00) - 584.50 - - - 584.50
E.2

Beginning of FY 2015
Adjust- ments
Approved by BPW
Agency Abolitions
Agency Transfers Deficiencies
FY 2015 Approp.
BudgetTransfers Abolitions New
FY 2016 Allowance
APPENDIX EPERSONNEL DETAIL TABLE 1: AUTHORIZED POSITIONS FROM JULY 1, 2014 TO THE FY 2016 ALLOWANCE
THE SECRETARY'S OFFICE 309.50 - - - (1.00) - 308.50 - - - 308.50STATE HIGHWAY ADMINISTRATION 3,085.50 - - - (1.00) - 3,084.50 - - - 3,084.50MARYLAND PORT ADMINISTRATION 224.00 - - - - - 224.00 - - - 224.00MOTOR VEHICLE ADMINISTRATION 1,735.50 - - - - - 1,735.50 - - - 1,735.50MARYLAND TRANSIT ADMINISTRATION 3,327.50 - - - - - 3,327.50 - - - 3,327.50MARYLAND AVIATION ADMINISTRATION 496.50 - - - 2.00 - 498.50 - - - 498.50DEPARTMENT OF TRANSPORTATION 9,178.50 - - - - - 9,178.50 - - - 9,178.50
OFFICE OF THE SECRETARY 127.50 - - - - - 127.50 - (1.00) - 126.50FOREST SERVICE 84.00 - - - (1.00) - 83.00 - - 2.00 85.00WILDLIFE AND HERITAGE SERVICE 84.00 - - - - - 84.00 - - 1.00 85.00MARYLAND PARK SERVICE 245.50 - - - 1.00 - 246.50 - - - 246.50LAND ACQUISITION AND PLANNING 30.50 - - - (1.00) - 29.50 - - - 29.50LICENSING AND REGISTRATION SERVICE 34.00 - - - - - 34.00 - - - 34.00NATURAL RESOURCES POLICE 312.00 - - - - - 312.00 - - 17.00 329.00ENGINEERING AND CONSTRUCTION 41.00 - - - - - 41.00 - - - 41.00CRITICAL AREA COMMISSION 15.00 - - - - - 15.00 - - - 15.00BOATING SERVICES 40.00 - - - - - 40.00 - - 1.00 41.00RESOURCE ASSESSMENT SERVICE 82.00 - - - - - 82.00 - - 2.00 84.00MARYLAND ENVIRONMENTAL TRUST 9.00 - - - - - 9.00 - (1.00) - 8.00CHESAPEAKE AND COASTAL SERVICE 49.90 - - - 2.00 - 51.90 - - 2.00 53.90FISHERIES SERVICE 147.10 - - - (1.00) - 146.10 - - 4.00 150.10DEPARTMENT OF NATURAL RESOURCES 1,301.50 - - - - - 1,301.50 - (2.00) 29.00 1,328.50
OFFICE OF THE SECRETARY 54.50 - - - - - 54.50 - - - 54.50OFFICE OF MARKETING, ANIMAL INDUSTRIES & CONSUMER SERVICES 92.10 - (1.00) - (1.00) - 90.10 - - - 90.10OFFICE OF PLANT INDUSTRIES AND PEST MANAGEMENT 96.00 - (1.00) - 1.00 - 96.00 - - 1.00 97.00OFFICE OF RESOURCE CONSERVATION 142.50 - - - - - 142.50 - - - 142.50DEPARTMENT OF AGRICULTURE 385.10 - (2.00) - - - 383.10 - - 1.00 384.10
OFFICE OF THE SECRETARY 353.00 - - - 0.60 - 353.60 - - - 353.60REGULATORY SERVICES 459.40 - - - - 5.00 464.40 - - 18.50 482.90DEPUTY SECRETARY FOR PUBLIC HEALTH SERVICES 64.50 - - - (1.00) - 63.50 - - - 63.50HEALTH SYSTEMS AND INFRASTRUCTURE ADMINISTRATION 10.00 - - - 4.00 - 14.00 - - 5.00 19.00PREVENTION AND HEALTH PROMOTION ADMINISTRATION 358.80 - - - 1.00 - 359.80 - - - 359.80OFFICE OF THE CHIEF MEDICAL EXAMINER 82.40 - - - - - 82.40 - - - 82.40OFFICE OF PREPAREDNESS AND RESPONSE 22.00 - - - 1.00 - 23.00 - - - 23.00WESTERN MARYLAND CENTER 268.50 - - - - - 268.50 - - - 268.50DEER'S HEAD CENTER 244.30 - - - - - 244.30 - - - 244.30LABORATORIES ADMINISTRATION 233.00 - - - (5.00) - 228.00 - - - 228.00DEPUTY SECY FOR BEHAVIORAL HEALTH 16.00 - - - (1.00) - 15.00 - - - 15.00BEHAVIORAL HEALTH ADMINISTRATION 145.00 - - - 1.40 - 146.40 - - 0.50 146.90THOMAS B. FINAN HOSPITAL CENTER 189.00 - - - - - 189.00 - - - 189.00REGIONAL INSTITUTE FOR CHILDREN & ADOLESCENTS-BALTIMORE 118.00 - - - - - 118.00 - - - 118.00EASTERN SHORE HOSPITAL CENTER 175.10 - - - 1.00 - 176.10 - - - 176.10SPRINGFIELD HOSPITAL CENTER 771.50 - - - - - 771.50 - - - 771.50SPRING GROVE HOSPITAL CENTER 772.50 - - - - - 772.50 - - - 772.50CLIFTON T. PERKINS HOSPITAL CENTER 603.25 - - - - - 603.25 - - - 603.25JOHN L. GILDNER REGIONAL INSTITUTION FOR CHILDREN AND ADOLESCENTS 133.10 - - - - - 133.10 - - - 133.10BEHAVIORAL HEALTH ADMINISTRATION FACILITY MAINTENANCE 3.00 - - - (1.00) - 2.00 - - - 2.00DEVELOPMENTAL DISABILITIES ADMINISTRATION 154.00 - - - 3.00 - 157.00 - - - 157.00HOLLY CENTER 251.50 - - - (15.00) - 236.50 - - - 236.50DDA COURT INVOLVED SERVICE DELIVERY SYSTEM 101.00 - - - - - 101.00 - - - 101.00POTOMAC CENTER 134.00 - - - 8.00 - 142.00 - - - 142.00DEVELOPMENTAL DISABILITIES ADMINISTRATION FACILITY 2.00 - - - - - 2.00 - - - 2.00MEDICAL CARE PROGRAMS ADMINISTRATION 620.00 - - - 3.00 - 623.00 - - 10.00 633.00HEALTH REGULATORY COMMISSIONS 102.70 - 1.00 - - - 103.70 - - - 103.70DEPARTMENT OF HEALTH AND MENTAL HYGIENE 6,387.55 - 1.00 - - 5.00 6,393.55 - - 34.00 6,427.55
E.3

Beginning of FY 2015
Adjust- ments
Approved by BPW
Agency Abolitions
Agency Transfers Deficiencies
FY 2015 Approp.
BudgetTransfers Abolitions New
FY 2016 Allowance
APPENDIX EPERSONNEL DETAIL TABLE 1: AUTHORIZED POSITIONS FROM JULY 1, 2014 TO THE FY 2016 ALLOWANCE
OFFICE OF THE SECRETARY 154.00 - - - (4.00) - 150.00 - - - 150.00SOCIAL SERVICES ADMINISTRATION 118.00 - - - 6.00 - 124.00 - - - 124.00OPERATIONS OFFICE 192.00 - - - 2.00 - 194.00 - - - 194.00OFFICE OF TECHNOLOGY FOR HUMAN SERVICES 114.00 - - - (1.00) - 113.00 - - - 113.00LOCAL DEPARTMENT OPERATIONS 5,597.93 - 45.00 - (16.00) - 5,626.93 - (23.00) - 5,603.93CHILD SUPPORT ENFORCEMENT ADMINISTRATION 76.30 - - - 1.00 - 77.30 - - - 77.30FAMILY INVESTMENT ADMINISTRATION 234.87 - - - 12.00 - 246.87 - - - 246.87DEPARTMENT OF HUMAN RESOURCES 6,487.10 - 45.00 - - - 6,532.10 - (23.00) - 6,509.10
OFFICE OF THE SECRETARY 121.60 - - - 6.00 - 127.60 - - - 127.60DIVISION OF ADMINISTRATION 185.00 - - - 3.00 - 188.00 - - - 188.00DIVISION OF FINANCIAL REGULATION 85.60 - - - - - 85.60 - - - 85.60DIVISION OF LABOR AND INDUSTRY 198.00 - - - (1.00) - 197.00 - - - 197.00DIVISION OF RACING 7.00 - - - - - 7.00 - - - 7.00DIVISION OF OCCUPATIONAL AND PROFESSIONAL LICENSING 69.50 - - - - - 69.50 - - - 69.50DIVISION OF WORKFORCE DEVELOPMENT AND ADULT LEARNING 422.20 - - - (1.00) - 421.20 (1.00) - - 420.20DIVISION OF UNEMPLOYMENT INSURANCE 552.39 - - - (7.00) - 545.39 - - - 545.39DEPARTMENT OF LABOR, LICENSING, AND REGULATION 1,641.29 - - - - - 1,641.29 (1.00) - - 1,640.29
OFFICE OF THE SECRETARY 535.50 - - - (40.00) - 495.50 - - - 495.50DEPUTY SECRETARY FOR OPERATIONS 667.00 - - - 46.00 - 713.00 - - - 713.00MARYLAND CORRECTIONAL ENTERPRISES 190.00 - - - - - 190.00 - - - 190.00MARYLAND PAROLE COMMISSION 76.00 - - - - - 76.00 - - - 76.00INMATE GRIEVANCE OFFICE 7.00 - - - - - 7.00 - - - 7.00POLICE AND CORRECTIONAL TRAINING COMMISSIONS 76.80 - - - - - 76.80 - - - 76.80CRIMINAL INJURIES COMPENSATION BOARD 12.00 - - - - - 12.00 - - - 12.00MARYLAND COMMISSION ON CORRECTIONAL STANDARDS 4.00 - - - - - 4.00 - - - 4.00GENERAL ADMINISTRATION - NORTH 57.00 - - - - - 57.00 - - - 57.00CORRECTIONS - NORTH 3,121.50 - - - (8.00) - 3,113.50 - - - 3,113.50COMMUNITY SUPERVISION - NORTH 233.00 - - - - - 233.00 - (1.00) - 232.00GENERAL ADMINISTRATION - SOUTH 91.00 - - - 1.00 - 92.00 - - - 92.00CORRECTIONS - SOUTH 2,583.00 - - - 3.00 - 2,586.00 - - - 2,586.00COMMUNITY SUPERVISION - SOUTH 330.00 - - - - - 330.00 - (1.00) - 329.00GENERAL ADMINISTRATION - CENTRAL 47.00 - - - (1.00) - 46.00 - - - 46.00CORRECTIONS - CENTRAL 1,030.60 - - - 2.00 - 1,032.60 - - - 1,032.60COMMUNITY SUPERVISION - CENTRAL 535.00 - - - - - 535.00 - (1.00) - 534.00DETENTION - CENTRAL 1,530.00 - - - (3.00) - 1,527.00 - - - 1,527.00DEPARTMENT OF PUBLIC SAFETY AND CORRECTIONAL SERVICES 11,126.40 - - - - - 11,126.40 - (3.00) - 11,123.40
HEADQUARTERS 1,444.90 - - - - - 1,444.90 - - 1.00 1,445.90MARYLAND LONGITUDINAL DATA SYSTEM CENTER 13.50 - - - - - 13.50 - - - 13.50STATE DEPARTMENT OF EDUCATION 1,458.40 - - - - - 1,458.40 - - 1.00 1,459.40
MARYLAND PUBLIC BROADCASTING COMMISSION 145.00 - 4.00 - - - 149.00 - - - 149.00
MARYLAND HIGHER EDUCATION COMMISSION 56.60 - - - - - 56.60 1.00 - 1.00 58.60
MARYLAND SCHOOL FOR THE DEAF-FREDERICK CAMPUS 210.00 - - - 0.50 - 210.50 - - - 210.50MARYLAND SCHOOL FOR THE DEAF-COLUMBIA CAMPUS 109.50 - - - (0.50) - 109.00 - - - 109.00MARYLAND SCHOOL FOR THE DEAF 319.50 - - - - - 319.50 - - - 319.50
OFFICE OF THE SECRETARY 57.00 - - - - - 57.00 1.00 - - 58.00DIVISION OF CREDIT ASSURANCE 53.00 - - - 1.00 - 54.00 - - 1.00 55.00DIVISION OF NEIGHBORHOOD REVITALIZATION 33.00 - - - 1.00 - 34.00 (1.00) - - 33.00DIVISION OF DEVELOPMENT FINANCE 137.00 - - - (1.00) - 136.00 - - 2.00 138.00DIVISION OF INFORMATION TECHNOLOGY 16.00 - - - - - 16.00 - - - 16.00DIVISION OF FINANCE AND ADMINISTRATION 43.00 - - - (1.00) - 42.00 - - 3.00 45.00DEPARTMENT OF HOUSING AND COMMUNITY DEVELOPMENT 339.00 - - - - - 339.00 - - 6.00 345.00
E.4

Beginning of FY 2015
Adjust- ments
Approved by BPW
Agency Abolitions
Agency Transfers Deficiencies
FY 2015 Approp.
BudgetTransfers Abolitions New
FY 2016 Allowance
APPENDIX EPERSONNEL DETAIL TABLE 1: AUTHORIZED POSITIONS FROM JULY 1, 2014 TO THE FY 2016 ALLOWANCE
OFFICE OF THE SECRETARY 84.00 - - - - - 84.00 - - - 84.00DIVISION OF MARKETING AND COMMUNICATIONS 26.00 - - - (1.00) - 25.00 - - - 25.00DIVISION OF BUSINESS AND ENTERPRISE DEVELOPMENT 69.00 - 2.00 - 1.00 - 72.00 - - - 72.00DIVISION OF TOURISM, FILM AND THE ARTS 40.00 - - - - - 40.00 - (2.00) 2.00 40.00DEPARTMENT OF BUSINESS AND ECONOMIC DEVELOPMENT 219.00 - 2.00 - - - 221.00 - (2.00) 2.00 221.00
OFFICE OF THE SECRETARY 14.00 - - - - - 14.00 - - - 14.00OPERATIONAL SERVICES ADMINISTRATION 43.00 - - - 1.00 - 44.00 1.00 - - 45.00WATER MANAGEMENT ADMINISTRATION 271.50 - - - - - 271.50 - - 3.00 274.50SCIENCE SERVICES ADMINISTRATION 86.00 - - - (1.00) - 85.00 - - - 85.00LAND MANAGEMENT ADMINISTRATION 247.00 - - - (1.00) - 246.00 - - - 246.00AIR AND RADIATION MANAGEMENT ADMINISTRATION 171.00 - - - 1.00 - 172.00 (1.00) - - 171.00COORDINATING OFFICES 122.50 - - - - - 122.50 - - - 122.50DEPARTMENT OF THE ENVIRONMENT 955.00 - - - - - 955.00 - - 3.00 958.00
OFFICE OF THE SECRETARY 38.00 - - - (5.00) - 33.00 - - - 33.00DEPARTMENTAL SUPPORT 132.75 - - - 5.00 - 137.75 - - - 137.75RESIDENTIAL AND COMMUNITY OPERATIONS 39.00 - - - - - 39.00 - - - 39.00BALTIMORE CITY REGION 461.60 - (4.00) - (10.00) - 447.60 - - - 447.60CENTRAL REGION 284.50 - (3.00) - 6.00 - 287.50 - - - 287.50WESTERN REGION 404.00 - (1.00) - - - 403.00 - - - 403.00EASTERN SHORE REGION 168.70 - - - - - 168.70 - - - 168.70SOUTHERN REGION 167.50 - (2.00) - (1.00) - 164.50 - - - 164.50METRO REGION 378.00 - (2.00) - 5.00 - 381.00 - - - 381.00DEPARTMENT OF JUVENILE SERVICES 2,074.05 - (12.00) - - - 2,062.05 - - - 2,062.05
MARYLAND STATE POLICE 2,374.00 - - - 1.00 - 2,375.00 - - - 2,375.00FIRE PREVENTION COMMISSION AND FIRE MARSHAL 70.50 - - - - - 70.50 - - - 70.50DEPARTMENT OF STATE POLICE 2,444.50 - - - 1.00 - 2,445.50 - - - 2,445.50
LESS: SECTION 23, 500 POSITION ABOLITION (500.00)
EXECUTIVE BRANCH SUBTOTAL 51,025.09 - 36.10 - 1.00 17.00 51,079.19 (1.00) (40.60) 126.00 50,663.59
UNIVERSITY OF MARYLAND, BALTIMORE 4,870.88 29.76 (8.00) - - - 4,892.64 - - - 4,892.64UNIVERSITY OF MARYLAND, COLLEGE PARK 8,731.64 103.16 (14.00) - - - 8,820.80 - - - 8,820.80BOWIE STATE UNIVERSITY 516.00 17.00 (1.00) - - - 532.00 - - - 532.00TOWSON UNIVERSITY 2,085.00 41.00 (3.00) - - - 2,123.00 - - - 2,123.00UNIVERSITY OF MARYLAND EASTERN SHORE 795.82 - (1.00) - - - 794.82 - - - 794.82FROSTBURG STATE UNIVERSITY 734.00 6.00 (1.00) - - - 739.00 - - - 739.00COPPIN STATE UNIVERSITY 457.50 - (1.00) - - - 456.50 - - - 456.50UNIVERSITY OF BALTIMORE 704.50 23.00 (1.00) - - - 726.50 - - - 726.50SALISBURY UNIVERSITY 1,007.00 24.00 (1.00) - - - 1,030.00 - - - 1,030.00UNIVERSITY OF MARYLAND UNIVERSITY COLLEGE 1,039.71 - (2.00) - - - 1,037.71 - - - 1,037.71UNIVERSITY OF MARYLAND BALTIMORE COUNTY 1,940.89 57.34 (3.00) - - - 1,995.23 - - - 1,995.23UNIV OF MD CENTER FOR ENVIRONMENTAL SCIENCE 272.86 - - - - - 272.86 - - - 272.86UNIVERSITY SYSTEM OF MARYLAND OFFICE 110.00 - - - - - 110.00 - - - 110.00UNIVERSITY SYSTEM OF MARYLAND 23,265.80 301.26 (36.00) - - - 23,531.06 - - - 23,531.06
MORGAN STATE UNIVERSITY 1,147.00 - (6.00) (3.00) - - 1,138.00 - - - 1,138.00ST. MARY'S COLLEGE OF MARYLAND 418.00 5.00 - - - - 423.00 - - 1.00 424.00BALTIMORE CITY COMMUNITY COLLEGE 451.00 - - - - - 451.00 - - - 451.00
HIGHER EDUCATION SUBTOTAL 25,281.80 306.26 (42.00) (3.00) - - 25,543.06 - - 1.00 25,544.06
GRAND TOTAL TABLE 1 80,787.39 307.26 (5.90) (3.00) 1.00 17.00 81,103.75 (1.00) (40.60) 360.00 80,922.15
E.5
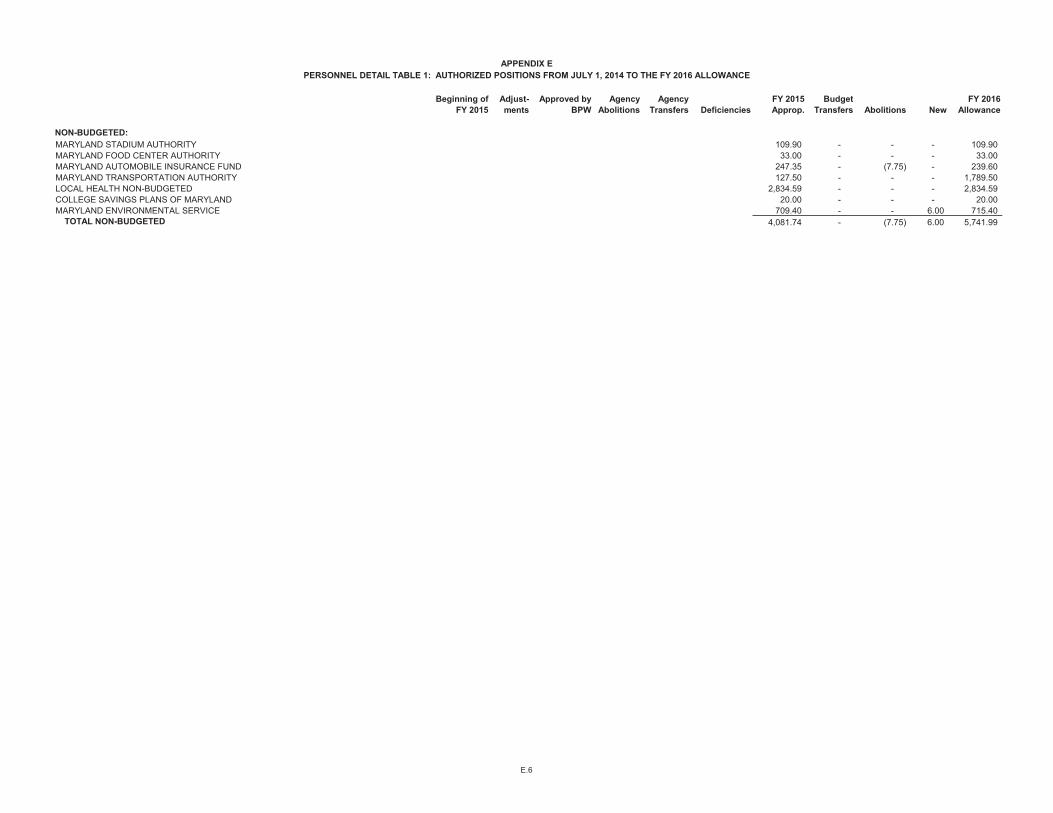
Beginning of FY 2015
Adjust- ments
Approved by BPW
Agency Abolitions
Agency Transfers Deficiencies
FY 2015 Approp.
BudgetTransfers Abolitions New
FY 2016 Allowance
APPENDIX EPERSONNEL DETAIL TABLE 1: AUTHORIZED POSITIONS FROM JULY 1, 2014 TO THE FY 2016 ALLOWANCE
NON-BUDGETED:MARYLAND STADIUM AUTHORITY 109.90 - - - 109.90MARYLAND FOOD CENTER AUTHORITY 33.00 - - - 33.00MARYLAND AUTOMOBILE INSURANCE FUND 247.35 - (7.75) - 239.60MARYLAND TRANSPORTATION AUTHORITY 127.50 - - - 1,789.50LOCAL HEALTH NON-BUDGETED 2,834.59 - - - 2,834.59COLLEGE SAVINGS PLANS OF MARYLAND 20.00 - - - 20.00MARYLAND ENVIRONMENTAL SERVICE 709.40 - - 6.00 715.40
TOTAL NON-BUDGETED 4,081.74 - (7.75) 6.00 5,741.99
E.6
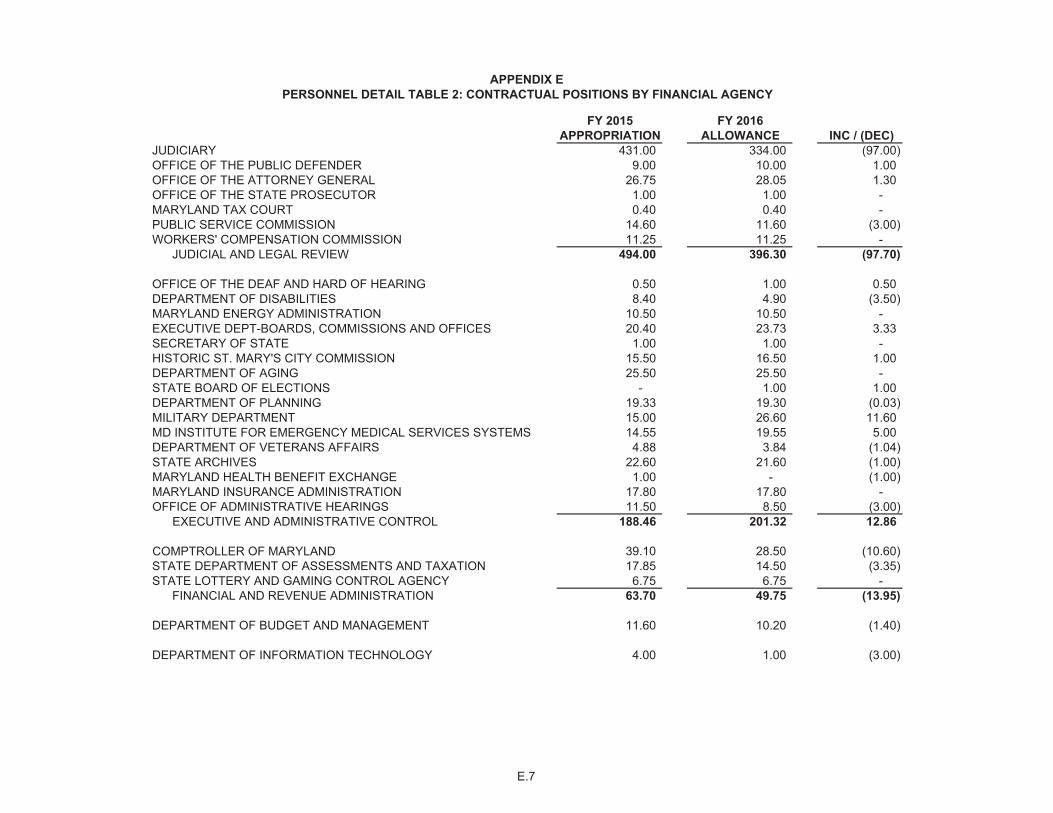
FY 2015 FY 2016APPROPRIATION ALLOWANCE INC / (DEC)
JUDICIARY 431.00 334.00 (97.00) OFFICE OF THE PUBLIC DEFENDER 9.00 10.00 1.00 OFFICE OF THE ATTORNEY GENERAL 26.75 28.05 1.30 OFFICE OF THE STATE PROSECUTOR 1.00 1.00 - MARYLAND TAX COURT 0.40 0.40 - PUBLIC SERVICE COMMISSION 14.60 11.60 (3.00) WORKERS' COMPENSATION COMMISSION 11.25 11.25 -
JUDICIAL AND LEGAL REVIEW 494.00 396.30 (97.70)
OFFICE OF THE DEAF AND HARD OF HEARING 0.50 1.00 0.50 DEPARTMENT OF DISABILITIES 8.40 4.90 (3.50) MARYLAND ENERGY ADMINISTRATION 10.50 10.50 - EXECUTIVE DEPT-BOARDS, COMMISSIONS AND OFFICES 20.40 23.73 3.33 SECRETARY OF STATE 1.00 1.00 - HISTORIC ST. MARY'S CITY COMMISSION 15.50 16.50 1.00 DEPARTMENT OF AGING 25.50 25.50 - STATE BOARD OF ELECTIONS - 1.00 1.00 DEPARTMENT OF PLANNING 19.33 19.30 (0.03) MILITARY DEPARTMENT 15.00 26.60 11.60 MD INSTITUTE FOR EMERGENCY MEDICAL SERVICES SYSTEMS 14.55 19.55 5.00 DEPARTMENT OF VETERANS AFFAIRS 4.88 3.84 (1.04) STATE ARCHIVES 22.60 21.60 (1.00) MARYLAND HEALTH BENEFIT EXCHANGE 1.00 - (1.00) MARYLAND INSURANCE ADMINISTRATION 17.80 17.80 - OFFICE OF ADMINISTRATIVE HEARINGS 11.50 8.50 (3.00)
EXECUTIVE AND ADMINISTRATIVE CONTROL 188.46 201.32 12.86
COMPTROLLER OF MARYLAND 39.10 28.50 (10.60) STATE DEPARTMENT OF ASSESSMENTS AND TAXATION 17.85 14.50 (3.35) STATE LOTTERY AND GAMING CONTROL AGENCY 6.75 6.75 -
FINANCIAL AND REVENUE ADMINISTRATION 63.70 49.75 (13.95)
DEPARTMENT OF BUDGET AND MANAGEMENT 11.60 10.20 (1.40)
DEPARTMENT OF INFORMATION TECHNOLOGY 4.00 1.00 (3.00)
APPENDIX EPERSONNEL DETAIL TABLE 2: CONTRACTUAL POSITIONS BY FINANCIAL AGENCY
E.7

FY 2015 FY 2016APPROPRIATION ALLOWANCE INC / (DEC)
APPENDIX EPERSONNEL DETAIL TABLE 2: CONTRACTUAL POSITIONS BY FINANCIAL AGENCY
MARYLAND STATE RETIREMENT AND PENSION SYSTEMS 16.50 9.50 (7.00)
DEPARTMENT OF GENERAL SERVICES 23.53 23.53 -
DEPARTMENT OF TRANSPORTATION 40.70 40.70 -
DEPARTMENT OF NATURAL RESOURCES 444.69 437.68 (7.01)
DEPARTMENT OF AGRICULTURE 39.80 42.80 3.00
DEPARTMENT OF HEALTH AND MENTAL HYGIENE 1,096.04 1,112.70 16.66
DEPARTMENT OF HUMAN RESOURCES 82.90 74.40 (8.50)
DEPARTMENT OF LABOR, LICENSING, AND REGULATION 276.40 293.60 17.20
DEPARTMENT OF PUBLIC SAFETY & CORRECTIONAL SERVICES 399.57 398.03 (1.54)
STATE DEPARTMENT OF EDUCATION 214.80 174.29 (40.51) MORGAN STATE UNIVERSITY 479.00 479.00 - ST. MARY'S COLLEGE OF MARYLAND 31.39 30.35 (1.04) MARYLAND PUBLIC BROADCASTING COMMISSION 17.22 17.60 0.38 UNIVERSITY SYSTEM OF MARYLAND 5,272.49 5,320.61 48.12 MARYLAND HIGHER EDUCATION COMMISSION 13.00 6.83 (6.17) BALTIMORE CITY COMMUNITY COLLEGE 238.00 175.00 (63.00) MARYLAND SCHOOL FOR THE DEAF 94.20 97.30 3.10
PUBLIC EDUCATION 6,360.10 6,300.98 (59.12)
DEPARTMENT OF HOUSING AND COMMUNITY DEVELOPMENT 79.50 54.50 (25.00)
DEPARTMENT OF BUSINESS AND ECONOMIC DEVELOPMENT 18.25 17.95 (0.30)
DEPARTMENT OF THE ENVIRONMENT 53.00 48.00 (5.00)
DEPARTMENT OF JUVENILE SERVICES 141.65 143.00 1.35
DEPARTMENT OF STATE POLICE 57.02 68.02 11.00
GRAND TOTAL TABLE 2 9,891.41 9,723.96 (167.45)
E.8

APPENDIX F FY 2014 - 2020 FORECAST
F.1
General Fund Summary All projections of revenues and expenditures are based on existing State laws and the current economic outlook unless otherwise noted. Revenues from Video Lottery Terminals and spending from the Education Trust Fund are not included in the General Fund forecast as they are considered Special Fund revenues and expenditures, respectively. Revenues from Video Lottery Terminals deposited into the Education Trust Fund are expected to total $394 million in both FY 2015 and FY 2016 before increasing to $553 million in FY 2020. Additional savings from the transfer in the ownership of VLT machines are assumed beginning in FY 2015. The forecast is adjusted to reflect the actions of the Board of Public Works to reduce $198 million in spending on January 7, 2015. Revenues - Projections are based on the December 2014 Board of Revenue Estimates (BRE) report. Overall, the BRE expects revenues to increase by $586 million, or 3.9%, in FY 2015 before increasing $553 million, or 3.5%, in FY 2016. Outyear revenue growth is estimated to be 4.0%, 3.7%, 3.1% and 3.8% for FY 2017 through 2020, respectively. The forecast assumes $72 million in additional revenue in FY 2016, which includes $17 million from the implementation of new tax compliance and fraud control measures. The FY 2015 budget includes $144 in fund balance transfers, the largest of which ($100 million) is being repaid in FY 2016. The FY 2016 budget only assumes $4 million in transfers. Finally, amounts also include reimbursements from tax credit reserves and transfers from the State Reserve Fund. Expenditures - Expenditures are categorized by: general obligation bond debt service payments, local aid programs, entitlements, State operations, and Capital (PAYGO) projects. Overall, budget growth for FY 2016 totals $351 million or 2.2% more than FY 2015. Excluding appropriations to the State Reserve Fund, budget growth is only 1.3%. The FY 2016 budget includes almost $209 million in reductions contingent on the enactment of legislation, the largest of which reduces $64 million from freezing the per pupil foundation amount at the FY 2015 level. Debt service payments total $274 million in FY 2016, an increase of $134 million or 96% over FY 2015. Debt service is the fastest growing category of expenditure in the out-years growing by an average of almost 18% per year and reaching $529 million in FY 2020. Aid to Local Governments is expected to increase by $39 million, or 0.6%, in FY 2016. Assistance is funded at the FY 2015 level in most areas, with the exception of Education Aid, which grows $36 million. For FY 2017 through 2020, local aid, including education aid, is expected to grow by 1.8% annually. Growth is slower than in prior forecasts as the result of legislation to slow the increase in mandated expenditures. Entitlements, including Foster Care Payments and Medicaid, are expected to decline 1.1% in FY 2016. The decline in Medicaid in FY 2016 is primarily driven by savings from reductions in provider rates, including Managed Care Organizations. Growth in entitlement spending for the FY 2017 through 2020 period will average 7.3% a year. The rate of growth in Medicaid accelerates in future years because of rate adjustments and an increase in the State share of the cost of the Medicaid expansion population. Growth in other entitlements is expected to be modest. Mandated State operations include funding for the legislative and judicial branches of government, St. Mary's College of Maryland and Baltimore City Community College, several scholarship programs, the Maryland School for the Deaf, Historic St. Mary's City Commission, and tourism/arts programs. Only about a third of the general fund budget is actually devoted to non-mandated, ongoing State operations. These include public safety, health, human resources, and higher education. Spending on State agencies actually declines when compared to the original FY 2015 appropriation, but some growth occurs related to adjustments for health insurance and retirement rates. Higher education institutions are expected to receive an average increase in State support of 4% per year for FY 2017 through FY 2020. Adjustments are included throughout the forecast period for the opening of new facilities. The fiscal year 2016 budget includes no funding for a cost-of-living adjustment, employee pay increments, or deferred compensation. Additionally, the FY 2016 budget includes a pay plan adjustment reducing employee salaries. Increases for employee pay increments are included in the out-year forecast period. Other than health insurance and retirement rate contribution adjustments, no inflation has been included for the out-years. Finally, the out-year forecast assumes that the Maryland Department of Transportation will cover its costs tied to the Watershed Implementation Plan. The budget includes a net general fund deficiency appropriation, after contingent reductions, of $205 million for fiscal year 2015. The largest deficiency appropriation is in the Department of Health & Mental Hygiene for the Medicaid program. Other large deficiencies are included for the Departments Education and Public Safety.

APPENDIX FFY 2014 - 2020 FORECAST
GENERAL FUND SUMMARY ($ in millions)
FY 2014 FY 2015 FY 2016 Annual % FY 2017 FY 2018 FY 2019 FY 2020 Annual %
Actual Appr. + Def. Allowance FY 15-16 Projection Projection Projection Projection FY 16-20
Opening Fund Balance 501.9 148 37 n/a 47 55 9 n/a n/a
Revenues (BRE) 15,106 15,692 16,245 3.5% 16,889 17,515 18,051 18,733 3.6%
Adjustments to Revenues 0 17 72 333.5% 23 23 23 23 -24.9%
Reimbursement - Tax Credits 16 18 17 -0.9% 20 23 24 23 7.2%
Transfers from Reserves 0 0 34 -- 35 36 41 35 0.7%
Other Transfers 62 144 4 -97.2% 0 0 0 0 -100.0%
Total GF Revenues 15,184 15,870 16,372 3.2% 16,967 17,597 18,138 18,813 3.5%
Debt Service (inc. Educ.) 83 140 274 95.7% 419 474 492 529 17.9%
Education (K-12/Libraries) 5,594 5,770 5,806 0.6% 5,822 5,979 6,161 6,254 1.9%
Community Colleges 281 291 294 1.3% 303 311 318 322 2.3%
Other Local Aid 290 291 291 0.0% 294 297 299 300 0.8%
Local Aid 6,165 6,352 6,391 0.6% 6,418 6,586 6,777 6,876 1.8%
Foster Care Maintenance 231 223 193 -13.4% 199 205 211 217 3.0%
TCA / Other Public Asst. 66 74 76 3.4% 74 73 73 74 -0.9%
Property Tax Credits 78 82 82 -0.3% 83 84 85 86 1.3%
Medicaid (+Kidney Dialysis) 2,836 2,849 2,841 -0.3% 3,149 3,386 3,606 3,854 7.9%
Entitlements 3,211 3,227 3,192 -1.1% 3,504 3,748 3,975 4,231 7.3%
Legislature 78 82 85 3.5% 89 92 96 100 4.0%
Judiciary 400 430 479 11.3% 503 528 554 582 5.0%
Reserves/Dedications 65 24 159 568.5% 59 59 59 59 -22.0%
H. E. Grants/SMCM/BCCC 115 113 117 3.5% 119 122 125 128 2.3%
Other Mandated St. Ops 58 60 59 -1.2% 60 62 64 65 2.4%
Mandated State Ops 718 709 899 26.8% 830 863 897 934 1.0%
Non-Mandated State Ops 4,250 4,356 4,374 0.4% 4,524 4,657 4,807 4,969 3.2%
Higher Education (USM & MSU) 1,144 1,230 1,243 1.1% 1,292 1,344 1,398 1,454 4.0%
GF Capital (PAYGO) 33 3 31 1109.4% 1 1 1 1 -57.5%
Prior/Current Yr. Reversions -64 -35 -41 n/a -30 -30 -30 -30 n/a
Total GF Expenditures 15,539 15,981 16,362 2.4% 16,959 17,643 18,317 18,964 3.8%
Closing Fund Balance 148 37 47 n/a 55 9 -169 -150 n/a
Category
F.2

APPENDIX F FY 2014 – FY 2020 FORECAST
Higher Education Fund Summary
Reporting of revenues and expenditures utilize uniform standards of the National Association of College and University Business Officers (NACUBO) and the American Institute of Certified Public Accountants (AICPA). Standardized fund accounting facilitates comparisons with other public and private institutions. Financial accounting for non-profit education entities provides information about resources and obligations rather than tracking net income.
There are multiple fund classifications as to purpose and source: Current, Loan, Endowment, Annuity, Plant, and Agency. Only Current Funds, Unrestricted and Restricted, are considered in the operating budget appropriation process and utilized in the five-year projections. Unless "restricted" by an outside donor, grantor or contractor, all other funds support missions through single-year operations.
Tuition and Fees – FY 2016 undergraduate resident tuition rates are projected to increase by 5% at most University System of Maryland (USM) institutions along with Morgan State University. St. Mary’s College of Maryland’s (SMCM) tuition rates remain largely unchanged from FY 2015 rates. The FY 2016 budget does include fee increases at some institutions and assumes flat enrollment with FY 2015. Tuition and fee revenues from FY 2017 through FY 2020 are projected to increase 4% per year. This plan expects non-residents to pay at least 100% of "educational" costs per student. Similar relationships have been developed for part-time student rates.
State Appropriations –The State appropriation includes Higher Education Investment Fund (HEIF) special funds and general funds. There is a total of $63.7 million in HEIF special funds in the FY 2016 budget. General Fund adjustments to the State appropriation comprise $44.2 million in January 7, 2015 Board of Public Works FY 2015 reductions and $101.9 million in FY 2016 back-of-the-bill reductions. After accounting for these adjustments, the FY 2016 budget provides a 1.3% increase to USM and a 1% increase to Morgan. USM and Morgan’s budgets for FY 2017 through FY 2020 assume an average increase in additional State appropriations of 4% per year. After accounting for adjustments, Baltimore City Community College’s State appropriation in FY 2016 increases by 4% from the FY 2015 level and is projected to grow by an average of 3.8% in out years. SMCM receives a 5.8% increase; out years reflect projected increases of the statutory economic deflator averaging 2.8% per year.
Grants and Contracts – Because of the recent slowdown in federal spending, Federal Grants and Contracts are projected to be flat in out-years. Grants and contracts from state and local governments and private donors are assumed to grow by an average of 1% per year.
Other Unrestricted Funds - Sales and Services of Auxiliary Enterprises are projected to increase 3% per year due to both the rates charged and the population served by dorms and dining halls. Sales and Services of Educational Activities are projected to grow by an average of 1% per year. Other Sources are projected to remain flat in out-years.
Transfers (to) / from Fund Balance - This category includes reserves and revenues from one year's operations being used for expenditures in another year. For example, it is common for fund balances to differ from actual year to current year because of the carryover of unfinished business because higher education uses accrual accounting versus the State’s cash accounting.
Fund Balance - Most of the fund balances are from other than State-supported operations. For example, auxiliary enterprises are normally self-supported through revenues other than general funds. Operating "reserves" equivalent to outstanding debt is recommended to maintain favorable bond ratings. Finally, long-term facility renewal and replacement require a set-aside for future projects, even though no major uses are reported.
Restricted Funds – Because of the uncertainty regarding federal sequestration, Federal Grants and Contracts are assumed to remain flat in out-years. All other sources of restricted funds are assumed to grow by an average of 1% per year.
F.3

Higher Education Fund Summary ($ in millions)
FY 2014 FY 2015 FY 2016 Annual % FY 2017 FY 2018 FY 2019 FY 2020 Annual %Category Actual BB. App. Allowance FY15-FY16 Projection Projection Projection Projection FY16-FY20
Opening Fund Balance 932 946 959 977 995 1,014 1,032Fund Balance Reversion to State -33Revised Fund Balance 899 946 959 977 995 1,014 1,032
Tuition & Fees 1,533 1,559 1,604 2.9% 1,653 1,702 1,753 1,806 3.0%State Appropriation 1,275 1,393 1,471 5.6% 1,528 1,589 1,652 1,719 4.0%
Less FY 2015 & FY 2016 Adjustments* -44 -102 130.2% -102 -102 -102 -102 0.0%Federal Grants & Contracts 127 123 123 -0.1% 123 123 123 123 0.0%Private Gifts, Grants & Contracts 44 46 46 0.0% 47 47 48 48 1.0%State & Local Grants & Contracts 16 16 15 -8.5% 15 15 16 16 1.0%Sales & Services-Educational 215 226 237 4.9% 239 242 244 247 1.0%Sales & Services-Auxiliary 662 688 709 3.0% 730 752 775 798 3.0%Other Sources 81 89 89 -0.4% 89 89 89 89 0.0%Transfers (to) / from Fund Balance -47 -13 -18 42.9% -18 -18 -18 -18 0.0%
Current Unrestricted Revenues 3,906 4,084 4,173 2.2% 4,303 4,438 4,578 4,724 3.1%Current Restricted Revenues 1,245 1,299 1,318 1.5% 1,323 1,328 1,334 1,339 0.4%Total Revenues 5,151 5,382 5,491 2.0% 5,625 5,766 5,912 6,063 2.5%
University of Maryland Baltimore 1,019 1,073 1,090 1.6% 1,108 1,128 1,147 1,167 1.7%University of Maryland College Park 1,783 1,861 1,934 3.9% 1,980 2,028 2,077 2,128 2.4%Bowie State University 109 117 122 3.7% 125 129 132 136 2.9%Towson University 431 456 473 3.6% 487 501 516 531 2.9%University of Maryland Eastern Shore 122 141 144 2.7% 148 152 156 160 2.6%Frostburg State University 104 109 114 4.0% 117 121 124 128 3.1%Coppin State University 82 91 94 2.9% 96 99 102 105 3.0%University of Baltimore 127 138 142 2.7% 146 150 154 159 2.9%Salisbury University 172 180 189 4.8% 195 201 207 214 3.1%University of Maryland University College 372 387 394 1.8% 405 416 428 440 2.8%University of Maryland Baltimore County 394 405 420 3.6% 431 442 454 466 2.7%University of Maryland Center for Environmental Scienc 44 47 48 3.6% 50 51 52 53 2.1%University System of Maryland Office 30 32 34 5.7% 35 36 37 38 3.0%
University System of Maryland 4,789 5,038 5,198 3.2% 5,323 5,453 5,587 5,726 2.4%Baltimore County Community College 85 91 90 -1.6% 90 93 95 99 2.5%St. Mary's College of Maryland 65 73 73 -0.3% 75 77 79 81 2.7%Morgan State University 211 224 233 3.8% 239 246 252 259 2.7%
Less FY 2015 & FY 2016 Adjustments* -44 -102 130.2% -102 -102 -102 -102 0.0%
Total Expenditures 5,151 5,382 5,491 2.0% 5,625 5,766 5,912 6,063 2.5%
Closing Fund Balance 946 959 977 995 1,014 1,032 1,051
*Adjustments to higher education institutions' budgets comprise $44.2 million in January 7, 2015 Board of Public Works FY 2015 reductions and $101.9 million in FY 2016 back-of-the bill reductio
F.4

APPENDIX F FY 2014 – 2020 FORECAST
Transportation Trust Fund Summary
The Department’s revenue and operating cost projections are based on a long-term “moderate growth” scenario for the nation’s economy. The major trends and assumptions are as follows: Bond interest rates are projected to fluctuate from 4% to 5%; inflation rates will vary from 1.8% to 2.5% annually. The normal “business cycles” that slowly began to resume in calendar year 2010, have continued through 2014. There are no major changes in law, operating responsibilities or external events other than those changes enacted in the 2013 Legislative Session.
Revenues – Motor Fuel Tax is projected to reach $5.8 billion over the six-year period. This projection includes both the base rates on gasoline (23.5 cents/gallon) and diesel fuel (24.25 cents/gallon) and the revenue components provided by the Transportation Infrastructure Investment Act of 2013. The Consumer Price Index (CPI effect is estimated to average 2.2 cents per gallon over the program period. The sales and use tax equivalent piece will be phased in. The rate effective January 1, 2015 is 6 cents per gallon. When fully implemented, it is estimated to average 9.6 cents per gallon. Growth in motor fuel usage is expected to average 0.5%, reflecting increasing fuel efficiency of vehicles and slower growth in vehicle miles traveled.
Motor Vehicle Titling Tax is projected to yield $4.7 billion from the 6% of fair market value, less an allowance for trade-in, paid on the sale of all new and used vehicles as well as on new residents’ vehicles. Following the recent down cycle, vehicle sales have stabilized, and titling tax revenues are starting to recover. It is projected that this six-year planning period will follow a normal business cycle around an underlying upward trend. Motor Vehicle Registration, Miscellaneous and other fees are projected to generate $3.6 billion based mainly on an average 1.5% biennial increase in revenues from vehicles registered. This amount also includes the rental vehicle sales tax.
Transportation’s share of Corporate Income Tax revenues is expected to be $917 million. Federal Aid is projected to contribute $5.5 billion for operating and capital programs, excluding the $643 million received directly by Washington Metropolitan Area Transit Authority. The majority of federal aid supports the capital program.
Operating Revenues should provide a six-year total of $2.7 billion. MTA revenues ($1.1 billion) primarily include rail and bus fares. MPA revenues ($300 million) include terminal operations, the World Trade Center, and other port-related revenues. MAA revenues ($1.3 billion) include flight activities, rent and user fees, parking, airport concessions, and other aviation-related fees.
Bond Proceeds are assumed at $3.6 billion from issuances in the six-year period based on the supporting net revenues of the Department. The remaining sources should provide $743 million from trust fund investment income, reimbursements, and other miscellaneous revenues.
Expenditures - Normal expenditure projections utilize the CPI plus 1.0% for growth unless otherwise noted.
Debt Service reflects payment cycles of the planned bond issuances as of FY 2015 and thereafter. In FY 2016, the budget for modal operations increases by approximately $59 million (4%). The growth is due to higher costs related to funding standard operating cost increases in Maryland’s transportation systems.
The capital expenditures shown are in agreement with the Department’s six-year Consolidated Transportation Program (CTP). Capital expenditures also are directly related to the level of revenues available for bond sale coverage. The bond outstanding ceiling is controlled by legislation and is adjusted when and as appropriate.
Closing Fund Balances – The Department’s goal is to transition to a $150 million fund balance over the program period to accommodate working cash-flow requirements during the year.
F.5

APPENDIX FFY 2014 - 2020 FORECAST
TRANSPORTATION TRUST FUND SUMMARY ($ in millions)FY 2014 FY 2015 FY 2016 Annual % FY 2017 FY 2018 FY 2019 FY 2020 Annual %Actual Appr. Allowance* FY 15-16 Projection**Projection**Projection**Projection** FY 16-20
Opening Fund Balance 218 255 100 125 125 125 150
RevenuesTaxes and Fees 2,339 2,457 2,681 9.1% 2,882 2,961 3,051 3,118 3.8%Operating Revenues 410 407 429 5.4% 456 471 491 503 4.1%Federal Funds - Operating 91 94 95 1.1% 95 95 95 95 0.0%Federal Funds - Capital 800 817 928 13.6% 974 878 703 664 -8.0%Capital Reimbursements 27 56 11 n/a 96 111 111 11 n/aOther Revenues 31 28 39 n/a 45 45 23 35 n/aBond Proceeds 345 490 875 n/a 850 545 465 365 n/aTransfers between GF & TTF 0 0 0 n/a 0 0 0 0 n/aAllowance for Revenue Changes 0 (28) (30) n/a (33) (34) (35) (35) n/a
Total Revenues 4,043 4,321 5,028 16.4% 5,365 5,072 4,904 4,756 3.4%
OperatingDebt Service 200 220 283 28.6% 351 378 374 391 8.4%County/Municipality Funds 162 167 169 1.2% 171 172 175 178 1.3%Office of the Secretary 76 84 84 0.0% 87 90 93 96 3.4%WMATA 268 286 320 11.9% 323 351 355 385 4.7%State Highway Administration 327 249 264 6.0% 275 285 295 304 3.6%Maryland Port Administration 45 49 51 4.1% 53 55 57 59 3.7%Motor Vehicle Administration 185 197 207 5.1% 215 224 233 240 3.8%Maryland Transit Administration 752 729 754 3.4% 782 811 840 868 3.6%Maryland Aviation Administration 190 181 188 3.9% 194 201 208 215 3.4%Allowance for Contingencies 0 32 26 n/a 31 33 33 33 n/a
Subtotal Operating 2,205 2,194 2,346 6.9% 2,482 2,600 2,663 2,769 4.2%
CapitalState Capital 1,001 1,465 1,729 18.0% 1,909 1,594 1,513 1,323 2.2%Federal Capital 800 817 928 13.6% 974 878 703 664 1.0%
Subtotal Capital 1,801 2,282 2,657 16.4% 2,883 2,472 2,216 1,987 1.8%
Total Expenditures 4,006 4,476 5,003 11.8% 5,365 5,072 4,879 4,756 3.3%
Closing Fund Balance 255 100 125 125 125 150 150
*FY16 does not account for statewide reductions.**Projection does not account for the fact that MDOT will assume the cost of the Watershed Implementation Plan.
F.6

Analysis of Proposed Budget
2016 Estimated Revenues (Bd. of Revenue Estimates - December, 2014) 16,245.0
Other on-going revenue adjustments:
Tax Credit Adjustments 17.4
Comptroller Tax Compliance Initiatives 12.0
Comptroller Limit REITC to in-state residents 2.0
Office of the Attorney General 5.3
Increased Premium Tax Revenues 1.5
Lottery Revenue Adjustment 1.1
Comptroller - Unclaimed property 0.6
Lottery Salary Savings 0.3
Total Ongoing Revenues 16,285.2
Total Spending 16,361.8
Less one-time spending:
Rainy Day Fund/Dedicated Purpose -150.0
Capital -30.8
Medicaid CRF funding 40.0
Hospital Deficit Assessment 14.5
Freeze the phase-in of NTI 12.1
VLT Impact Aid 3.9
Housing Counseling Fund 2.4
DNR PILOT payments 2.5
DNR Waterway Improvement Fund Swap 0.9
Delay Deaf Cultural Library legislation 0.2
Total Ongoing Spending 16,257.5
Structural Deficit/Balance 27.7
Spending Affordability Target -350.0
Difference 377.7
APPENDIX GSPENDING AFFORDABILITY ANALYSIS
FISCAL YEAR 2016 BUDGET($ in Millions)
G.1

Budget Code Agency Summary of Language
A15O00.01 Payments to Civil Divisions of the State- Disparity Grants
Specifies that the general fund appropriation shall be reduced by $2,111,335 contingent upon the enactment of the Budget Reconciliation and Financing Act.
D05E01.02 Board of Public WorksContingent Fund
Specifies uses of contingent fund.
D05E01.10 Board of Public WorksMiscellaneous Grants to Private Non-Profit Groups
Specifies grantees and amounts.
D15A05.16 Boards, Commissions and Offices- Governor's Office of Crime Control and Prevention
Specifies that the general fund appropriation shall be reduced by $3,720,710 contingent upon the enactment of legislation reducing the required appropriation for State Aid for Police Protection.
D78Y01.01 Maryland Health Benefit Exchange- Maryland Health Benefit Exchange
Specifies that the special fund appropriation shall be reduced by $1,498,276 contingent upon the enactment of legislation reducing the required appropriation of $35,000,000.
E00A05.01 Comptroller of Maryland- Compliance Division-Compliance Administration
Specifies that the special fund appropriation shall be reduced by $580,000 contingent upon the enactment of legislation to repeal the provisions of law related to the current notification procedure for abandoned property including the requirement to advertise abandoned property in local newspapers on an annual basis.
F10A02.08 Department of Budget and ManagementOffice of Personnel Services and Benefits - Statewide Expenses
General funds appropriated for State law enforcement officers' death benefits, regular and contractual employee health insurance, and Annual Salary Reviews (ASR) may be transferred to programs of other State agencies.
F10A02.08 Department of Budget and ManagementOffice of Personnel Services and Benefits - Statewide Expenses
Special funds appropriated for health insurance and Annual Salary Reviews (ASR) may be transferred to programs of other State agencies.
F10A02.08 Department of Budget and ManagementOffice of Personnel Services and Benefits - Statewide Expenses
Federal funds appropriated for health insurance may be transferred to programs of other State agencies.
APPENDIX HBUDGET BILL CONTINGENT AND RESTRICTIVE LANGUAGE
H.1

Budget Code Agency Summary of Language
APPENDIX HBUDGET BILL CONTINGENT AND RESTRICTIVE LANGUAGE
F50A01.01 Major Information Technology Development Project Fund -- Major Information Technology Development Project Fund
General funds appropriated for Major Information Technology Development Projects may be transferred to programs of other financial agencies.
F50A01.01 Major Information Technology Development Project Fund -- Major Information Technology Development Project Fund
Special funds appropriated for Major Information Technology Development Projects may be transferred to programs of other financial agencies.
H00G01.01 Department of General ServicesOffice of Facilities Planning, Design and Construction
Amounts appropriated for Maryland Environmental Service projects to transfer to the appropriate state facility effective July 1, 2015.
K00A01.01 Department of Natural Resources-Office of the Secretary - Secretariat
Specifies that the general fund appropriation shall be reduced by $148,750 contingent upon the enactment of legislation to increase the use of Waterway Improvement Funds for administration costs in the Department of Natural Resources.
K00A01.02 Department of Natural Resources-Office of the Secretary - Office of the Attorney General
Specifies that the general fund appropriation shall be reduced by $87,500 contingent upon the enactment of legislation to increase the use of Waterway Improvement Funds for administration costs in the Department of Natural Resources.
K00A01.03 Department of Natural Resources-Office of the Secretary - Finance and Administrative Services
Specifies that the general fund appropriation shall be reduced by $275,625 contingent upon the enactment of legislation to increase the use of Waterway Improvement Funds for administration costs in the Department of Natural Resources.
K00A01.04 Department of Natural Resources-Office of the Secretary - Human Resource Service
Specifies that the general fund appropriation shall be reduced by $56,875 contingent upon the enactment of legislation to increase the use of Waterway Improvement Funds for administration costs in the Department of Natural Resources.
K00A01.05 Department of Natural Resources-Office of the Secretary - Information Technology Service
Specifies that the general fund appropriation shall be reduced by $253,750 contingent upon the enactment of legislation to increase the use of Waterway Improvement Funds for administration costs in the Department of Natural Resources.
H.2

Budget Code Agency Summary of Language
APPENDIX HBUDGET BILL CONTINGENT AND RESTRICTIVE LANGUAGE
K00A01.06 Department of Natural Resources-Office of the Secretary - Office of Communications
Specifies that the general fund appropriation shall be reduced by $52,500 contingent upon the enactment of legislation to increase the use of Waterway Improvement Funds for administration costs in the Department of Natural Resources.
K00A04.01 Department of Natural Resources- Maryland Park Service- State-wide Operations
Specifies that the general fund appropriation shall be reduced by $2,448,953 contingent upon the enactment of legislation to eliminate the Maryland Park Service's payment in lieu of taxes to local jurisdictions.
K00A04.06 Department of Natural Resources- Maryland Park Service- Revenue Operations
Specifies that the general fund appropriation shall be reduced by $50,000 contingent upon the enactment of legislation to eliminate the Maryland Park Service's payment in lieu of taxes to local jurisdictions.
K00A05.10 Department of Natural ResourcesLand Acquisition and Planning - Outdoor Recreation Land Loan
Specifies that the special fund appropriation shall be reduced by $27,882,266 contingent upon the enactment of legislation crediting transfer tax revenues to the general fund.
K00A14.02 Department of Natural ResourcesChesapeake and Coastal Services- Chesapeake and Coastal Services
Specifies that the special fund appropriation shall be reduced by $8,639,632 contingent upon the enactment of legislation adjusting the revenue distribution to the Chesapeake and Atlantic Coastal Bays 2010 Trust Fund.
L00A11.11 Department of Agriculture- Office of the Secretary - Capital Appropriation
Specifies that the special fund appropriation shall be reduced by $9,830,434 contingent upon the enactment of legislation crediting transfer tax revenues to the general fund.
L00A12.20 Department of Agriculture- Office of Marketing, Animal Industries, and Consumer Services - Maryland Agricultural and Resource-Based Industry Development Corporation
Specifies that the general fund appropriation shall be reduced by $1,125,000 contingent upon the enactment of legislation reducing the required appropriation.
M00F02.07 Department of Health and Mental Hygiene -Health Systems and Infrastructure Administration- Core Public Health Services
Specifies that the general fund appropriation shall be reduced by $7,841,378 contingent upon the enactment of legislation reducing the required appropriation for Core Public Health Services.
H.3

Budget Code Agency Summary of Language
APPENDIX HBUDGET BILL CONTINGENT AND RESTRICTIVE LANGUAGE
M00F03.04 Department of Health and Mental Hygiene -Prevention and Health Promotion Administration- Family Health and Chronic Disease Services
Specifies that the special fund appropriation shall be reduced by $7,200,000 contingent upon the enactment of legislation reducing the required appropriation from the Cigarette Restitution Fund for Academic Health Centers.
M00M01.02 Department of Health and Mental Hygiene -Developmental Disabilities Administration- Community Services
Specifies that the general fund appropriation shall be reduced by $9,152,894 contingent upon the enactment of legislation reducing the required provider rate increase to 1.75 percent.
M00M01.02 Department of Health and Mental Hygiene -Developmental Disabilities Administration- Community Services
Specifies that the special fund appropriation shall be reduced by $6,181 contingent upon the enactment of legislation reducing the required provider rate increase to 1.75 percent.
M00M01.02 Department of Health and Mental Hygiene -Developmental Disabilities Administration- Community Services
Specifies that the federal fund appropriation shall be reduced by $7,259,616 contingent upon the enactment of legislation reducing the required provider rate increase to 1.75 percent.
M00Q01.03 Department of Health and Mental HygieneMedical Care Programs Administration - Medical Care Provider Reimbursements
Places certain conditions on the use of appropriation for abortions.
M00Q01.03 Department of Health and Mental HygieneMedical Care Programs Administration - Medical Care Provider Reimbursements
Specifies that the general fund appropriation shall be reduced by $7,200,000 contingent upon the enactment of legislation reducing funding for other programs supported by the Cigarette Restitution Fund. Authorization is hereby provided to process a special fund budget amendment up to $7,200,000 from the Cigarette Restitution Fund to support the Medical Assistance Program.
M00Q01.03 Department of Health and Mental HygieneMedical Care Programs Administration - Medical Care Provider Reimbursements
Specifies that the general fund appropriation shall be reduced by $14,500,000 contingent upon the enactment of legislation removing the requirement that the Medicaid Deficit Assessment be reduced by an amount equal to general fund savings to the Medicaid program attributable to implementation of the All-Payer Model contract
M00Q01.07 Department of Health and Mental HygieneMedical Care Programs Administration - Maryland Children's Health Program
Places certain conditions on the use of appropriation for abortions.
H.4

Budget Code Agency Summary of Language
APPENDIX HBUDGET BILL CONTINGENT AND RESTRICTIVE LANGUAGE
N00G00.01 Department of Human ResourcesLocal Department Operations - Foster Care Maintenance Payments
Funds may be used to develop a broad range of services for specified children.
P00E01.06 Department of Labor, Licensing and Regulation- Division of Racing- Share of Video Lottery Terminal Revenue for Local Impact Grants
Specifies that the special fund appropriation shall be reduced by $3,887,697 contingent upon the enactment of legislation transferring $3,887,697 in video lottery terminal revenue to the Education Trust Fund.
R00A01.17 State Department of Education- Headquarters - Division of Library Development and Services
Specifies that the general fund appropriation shall be reduced by $2,173,655 contingent upon theenactment of legislation repealing the requirement to establish a Deaf Culture Digital Library and phasing in the increased funding provided for the Maryland Library for the Blind per Chapter 498 of 2014 over ten years.
R00A02.01 State Department of Education- Aidto Education - State Share of Foundation Program
Specifies that the general fund appropriation shall be reduced by $52,788,580 contingent upon the enactment of legislation level funding the per pupil foundation amount at the fiscal year 2015 amount and freezing the net taxable income adjustment phase-in.
R00A02.01 State Department of Education- Aidto Education - State Share of Foundation Program
Specifies that the general fund appropriation shall be reduced by $3,887,697 contingent upon the enactment of legislation transferring video lottery terminal revenue to the Education Trust Fund.
R00A02.01 State Department of Education- Aidto Education - State Share of Foundation Program
Specifies that the special fund appropriation of$3,887,697 shall be increased contingent upon the enactment of legislation transferring $3,887,697 in video lottery terminal revenue to the Education Trust Fund.
R00A02.02 State Department of Education- Aidto Education - Compensatory Education
Specifies that the general fund appropriation shall be reduced by $17,799,024 contingent upon the enactment of legislation level funding the per pupil foundation amount at the fiscal year 2015 amount.
R00A02.04 State Department of Education- Aidto Education - Children at Risk
Specifies that the general fund appropriation shall be reduced by $139,007 contingent upon the enactment of legislation level funding the per pupil foundation amount at the fiscal year 2015 amount.
H.5

Budget Code Agency Summary of Language
APPENDIX HBUDGET BILL CONTINGENT AND RESTRICTIVE LANGUAGE
R00A02.07 State Department of Education- Aidto Education - Students with Disabilities
Specifies use of general fund appropriation and that funds may be used to develop a broad range of services for specified children.
R00A02.07 State Department of Education- Aidto Education - Students with Disabilities
Specifies that the general fund appropriation shall be reduced by $3,754,335 contingent upon the enactment of legislation level funding the per pupil foundation amount at the fiscal year 2015 amount.
R00A02.24 State Department of Education- Aidto Education - Limited English Proficient
Specifies that the general fund appropriation shall be reduced by $2,902,468 contingent upon the enactment of legislation level funding the per pupil foundation amount at the fiscal year 2015 amount.
R00A02.25 State Department of Education- Aidto Education - Guaranteed Tax Base
Specifies that the general fund appropriation shall be increased by $1,266,162 contingent upon the enactment of legislation level funding the per pupil foundation amount at the fiscal year 2015 amount.
R00A02.31 State Department of Education- Aidto Education - Public Libraries
Specifies that the general fund appropriation shall be reduced by $1,793,461 contingent upon the enactment of legislation phasing in the increase per resident amount over ten years.
R00A02.32 State Department of Education- Aidto Education - State Library Network
Specifies that the general fund appropriation shall be reduced by $526,083 contingent upon the enactment of legislation phasing in the increaseper resident amount over ten years.
R00A03.01 State Department of Education- Funding for Educational Organizations - Maryland School for the Blind
Specifies that the general fund appropriation shall be reduced by $199,591 contingent upon the enactment of legislation level funding the per pupil foundation amount at the fiscal year 2015 amount.
R00A03.03 State Department of Education- Funding for Educational Organizations - Other Institutions
Specifies grantees and amounts.
R00A03.04 State Department of EducationFunding for Educational Organizations - Aid to Non-Public Schools
Sets per pupil amounts for purchase of textbooks, computer software, hardware and other electronically delivered learning materials.Specifies requirements for a school to participate.
H.6
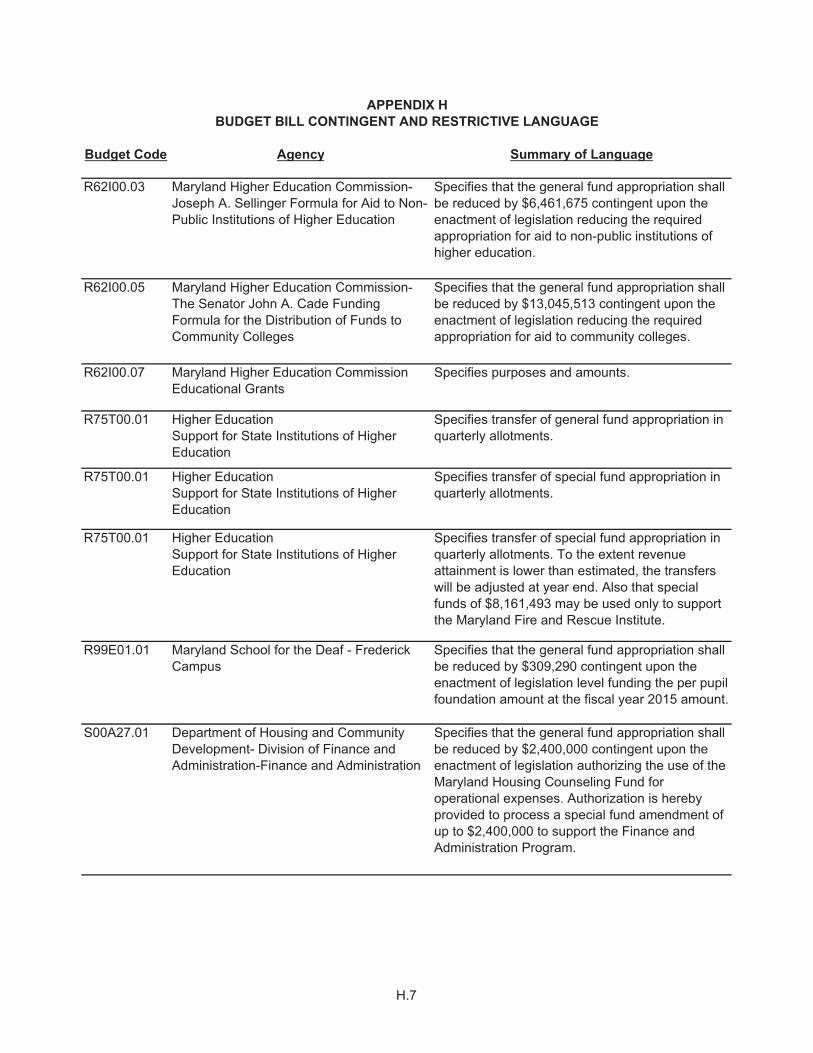
Budget Code Agency Summary of Language
APPENDIX HBUDGET BILL CONTINGENT AND RESTRICTIVE LANGUAGE
R62I00.03 Maryland Higher Education Commission-Joseph A. Sellinger Formula for Aid to Non-Public Institutions of Higher Education
Specifies that the general fund appropriation shall be reduced by $6,461,675 contingent upon theenactment of legislation reducing the required appropriation for aid to non-public institutions of higher education.
R62I00.05 Maryland Higher Education Commission-The Senator John A. Cade Funding Formula for the Distribution of Funds to Community Colleges
Specifies that the general fund appropriation shall be reduced by $13,045,513 contingent upon the enactment of legislation reducing the required appropriation for aid to community colleges.
R62I00.07 Maryland Higher Education CommissionEducational Grants
Specifies purposes and amounts.
R75T00.01 Higher EducationSupport for State Institutions of Higher Education
Specifies transfer of general fund appropriation in quarterly allotments.
R75T00.01 Higher EducationSupport for State Institutions of Higher Education
Specifies transfer of special fund appropriation in quarterly allotments.
R75T00.01 Higher EducationSupport for State Institutions of Higher Education
Specifies transfer of special fund appropriation in quarterly allotments. To the extent revenue attainment is lower than estimated, the transfers will be adjusted at year end. Also that special funds of $8,161,493 may be used only to support the Maryland Fire and Rescue Institute.
R99E01.01 Maryland School for the Deaf - Frederick Campus
Specifies that the general fund appropriation shall be reduced by $309,290 contingent upon the enactment of legislation level funding the per pupil foundation amount at the fiscal year 2015 amount.
S00A27.01 Department of Housing and Community Development- Division of Finance and Administration-Finance and Administration
Specifies that the general fund appropriation shall be reduced by $2,400,000 contingent upon the enactment of legislation authorizing the use of the Maryland Housing Counseling Fund for operational expenses. Authorization is hereby provided to process a special fund amendment of up to $2,400,000 to support the Finance and Administration Program.
H.7

Budget Code Agency Summary of Language
APPENDIX HBUDGET BILL CONTINGENT AND RESTRICTIVE LANGUAGE
T00F00.19 Department of Business and Economic Development- Division of Business and Enterprise Development- CyberMaryland Investment Incentive Tax Credit Program
Specifies that the general fund appropriation shall be reduced by $500,000 contingent upon the enactment of legislation reducing the required appropriation for the Tax Credit Program.
T00G00.05 Department of Business and Economic Development- Division of Tourism, Film and the Arts- Maryland State Arts Council
Specifies that the general fund appropriation shall be reduced by $1,361,571 contingent upon the enactment of legislation reducing the required appropriation for the Maryland State Arts Council.
V00G01.01 Department of Juvenile Services - Baltimore City Region-Baltimore City Region Operations
Specifies that the general fund appropriation shall be reduced by $302,331 contingent upon the enactment of legislation to cap the residential provider rate increase.
V00G01.01 Department of Juvenile Services - Baltimore City Region-Baltimore City Region Operations
Specifies that the special fund appropriation shall be reduced by $17,817 contingent upon the enactment of legislation to cap the residential provider rate increase.
V00G01.01 Department of Juvenile Services - Baltimore City Region-Baltimore City Region Operations
Specifies that the federal fund appropriation shall be reduced by $21,476 contingent upon the enactment of legislation to cap the residential provider rate increase.
V00I01.01 Department of Juvenile Services - Western Region-Western Region Operations
Specifies that the general fund appropriation shall be reduced by $218,964 contingent upon the enactment of legislation to cap the residential provider rate increase.
V00I01.01 Department of Juvenile Services - Western Region-Western Region Operations
Specifies that the special fund appropriation shall be reduced by $14,229 contingent upon the enactment of legislation to cap the residential provider rate increase.
V00I01.01 Department of Juvenile Services - Western Region-Western Region Operations
Specifies that the federal fund appropriation shall be reduced by $14,229 contingent upon the enactment of legislation to cap the residential provider rate increase.
H.8

Budget Code Agency Summary of Language
APPENDIX HBUDGET BILL CONTINGENT AND RESTRICTIVE LANGUAGE
V00L01.01 Department of Juvenile Services - Metro Region-Metro Region Operations
Specifies that the general fund appropriation shall be reduced by $285,366 contingent upon the enactment of legislation to cap the residential provider rate increase.
V00L01.01 Department of Juvenile Services - Metro Region-Metro Region Operations
Specifies that the special fund appropriation shall be reduced by $12,870 contingent upon the enactment of legislation to cap the residential provider rate increase.
V00L01.01 Department of Juvenile Services - Metro Region-Metro Region Operations
Specifies that the federal fund appropriation shall be reduced by $24,219 contingent upon the enactment of legislation to cap the residential provider rate increase.
Y01A02.01 State Reserve Fund-Dedicated Purpose Account
Specifies purpose and amount.
Y01A02.01 State Reserve Fund-Dedicated Purpose Account
Specifies that the general fund appropriation shall be reduced by $50,000,000 contingent on the enactment of the Budget Reconciliation and Financing Act.
FY 2015 Deficiency-M00Q01.03
Department of Health and Mental HygieneMedical Care Programs Administration - Medical Care Provider Reimbursements
Specifies that the general fund appropriation shall be reduced by $45,000,000 contingent upon the enactment of legislation authorizing the use of the Maryland Health Insurance Plan Fund for Medicaid provider reimbursements.
FY 2015 Deficiency-M00Q01.03
Department of Health and Mental HygieneMedical Care Programs Administration - Medical Care Provider Reimbursements
Specifies that the special fund appropriation of $45,000,000 is contingent upon the enactment of legislation authorizing the use of the Maryland Health Insurance Plan Fund for Medicaid provider reimbursements.
FY 2015 Deficiency-R00A02.01
State Department of Education- Aid to Education- State Share of Foundation Program
Specifies that the general fund appropriation reduction of $4,073,964 is contingent upon the enactment of legislation transferring Video Lottery Terminal revenue from local impact grants to the Education Trust Fund.
H.9

Budget Code Agency Summary of Language
APPENDIX HBUDGET BILL CONTINGENT AND RESTRICTIVE LANGUAGE
FY 2015 Deficiency-R00A02.01
State Department of Education- Aid to Education- State Share of Foundation Program
Specifies that the special fund appropriation of $4,073,964 is contingent upon the enactment of legislation transferring Video Lottery Terminal revenue from local impact grants to the Education Trust Fund.
SECTION 2 Authorizes Secretary of Budget and Management to allot funds and fix the number and classifications of positions.
SECTION 3 Lists non-classified per diem and flat rate positions.
SECTION 4 Prohibits payment of compensation for a second office of profit within the meaning of the Constitution.
SECTION 5 Permits the expenditure of block grants and money derived from sources not estimated or included in the budget by budget amendment.
SECTION 6 Permits appropriation to be transferred among programs by budget amendment.
SECTION 7 Permits the expenditure of special and federal fund revenues in excess of budgeted amounts by budget amendment.
SECTION 8 Authorizes transfer of general fund amounts for operation of state facilities by budget amendment.
SECTION 9 Authorizes transfer of funds provided for tort claims to be transferred to the State Insurance Trust Fund. Sets limits on payments of tort claims.
SECTION 10 Authorizes transfer of general fund amounts for indirect cost pools by budget amendment.
SECTION 11 Restricts the use of funds budgeted for Annapolis Data Center charges. Authorizes the transfer of these funds among agencies by budget amendment.
SECTION 12 Sets forth the salary schedule for the Executive Pay Plan.
SECTION 13 Sets forth the salary schedule for the Department of Transportation Executive Pay Plan.
H.10

Budget Code Agency Summary of Language
APPENDIX HBUDGET BILL CONTINGENT AND RESTRICTIVE LANGUAGE
SECTION 14 Allows the transfer of funds from certain agencies to the Medical Assistance Program for services to clients who become eligible for Medical Assistance.
SECTION 15 Provides that amounts budgeted to conduct administrative hearings shall transfer to the Office of Administrative Hearings on July 1, 2015 and may not be expended for any other purpose.
SECTION 16 Funds budgeted in certain agencies may be transferred to the Children's Cabinet InteragencyFund.
SECTION 17 Funds budgeted for health insurance, retirees health insurance, Workers' Compensation, contractual employee health insurance, DBM-paid telecommunications, Office of Attorney General Administrative Fee, DoIT IT Services Allocation,State Personnel System Allocation, and Rent Paid to Department of General Services (DGS) may not be expended for any other purpose without the prior approval of the Secretary of Budget and Management. Funds budgeted for health insurance and DBM-paid telecommunications may be transferred by budget amendment among agencies. Funds not spent for health insurance and retirees health insurance shall revert to a specific fund.
SECTION 18 Provides that amounts budgeted to support the Maryland State Retirement Agency shall transfer to the Maryland State Retirement agency on July 1, 2015 and may not be expended for any other purpose.
SECTION 19 Specifies that the general fund appropriation shall be reduced by $117,992,000 within Executive Branch agencies. Specifies the amount of the reduction within specific Executive Branch agencies.
H.11
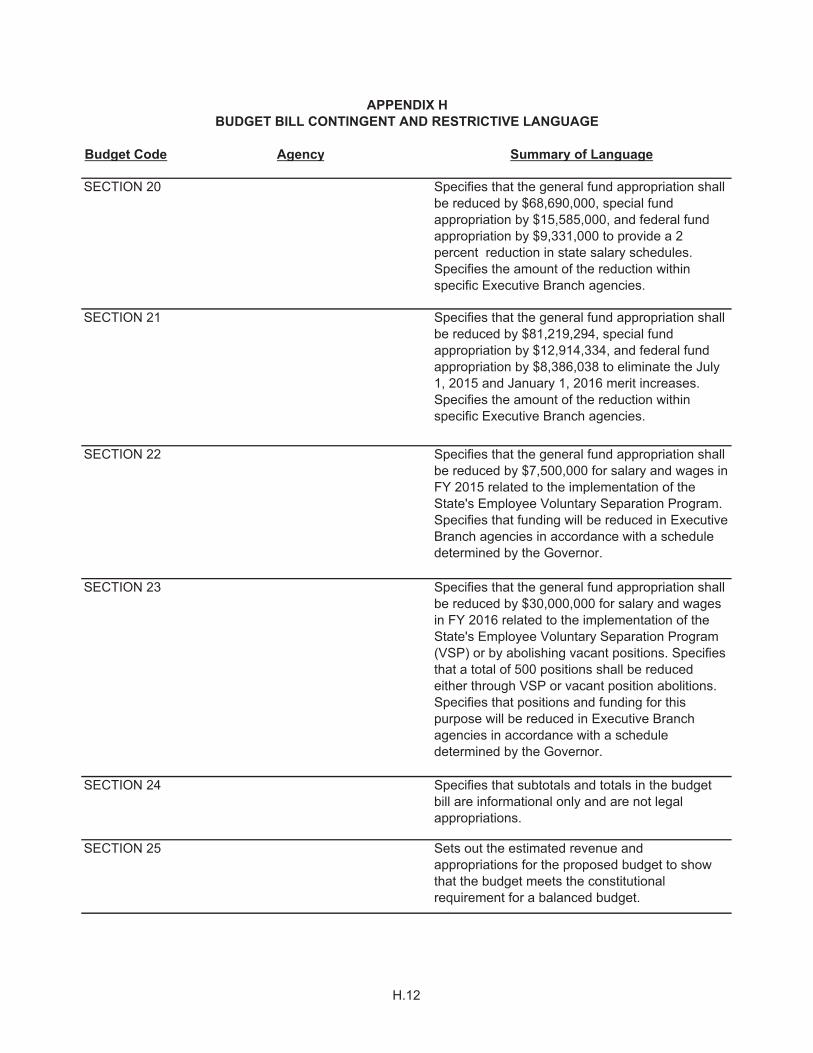
Budget Code Agency Summary of Language
APPENDIX HBUDGET BILL CONTINGENT AND RESTRICTIVE LANGUAGE
SECTION 20 Specifies that the general fund appropriation shall be reduced by $68,690,000, special fund appropriation by $15,585,000, and federal fund appropriation by $9,331,000 to provide a 2 percent reduction in state salary schedules.Specifies the amount of the reduction within specific Executive Branch agencies.
SECTION 21 Specifies that the general fund appropriation shall be reduced by $81,219,294, special fund appropriation by $12,914,334, and federal fund appropriation by $8,386,038 to eliminate the July 1, 2015 and January 1, 2016 merit increases. Specifies the amount of the reduction within specific Executive Branch agencies.
SECTION 22 Specifies that the general fund appropriation shall be reduced by $7,500,000 for salary and wages in FY 2015 related to the implementation of the State's Employee Voluntary Separation Program. Specifies that funding will be reduced in Executive Branch agencies in accordance with a schedule determined by the Governor.
SECTION 23 Specifies that the general fund appropriation shall be reduced by $30,000,000 for salary and wages in FY 2016 related to the implementation of the State's Employee Voluntary Separation Program (VSP) or by abolishing vacant positions. Specifies that a total of 500 positions shall be reduced either through VSP or vacant position abolitions. Specifies that positions and funding for this purpose will be reduced in Executive Branch agencies in accordance with a schedule determined by the Governor.
SECTION 24 Specifies that subtotals and totals in the budget bill are informational only and are not legal appropriations.
SECTION 25 Sets out the estimated revenue and appropriations for the proposed budget to show that the budget meets the constitutional requirement for a balanced budget.
H.12

APPENDIX IRECOVERIES OF INDIRECT COSTS FOR FISCAL YEAR 2014
Statewide Internal Reverted Recoveries Federally ApprovedFederally ApprovedIndirect Cost Indirect Cost to General Retained Indirect Cost Statewide Cost
Recoveries ($) Recoveries ($) Fund ($) by Agency ($) Recovery Rate Recovery Rate 1
Office of the Attorney General 2,980 345,208 348,188 - 13.30% 5.00%
Executive Department 2
Department of Disabilities 22,660 - 22,660 - General Administration 3,649 - 3,649 - 2.67% 2.67% MD Dev Disabilities Council 8,241 - 8,241 - 1.34% 1.34% Tech Access Program 10,770 - 10,770 - 2.67% 2.67%
Maryland Energy Administration 22,584 - 22,584 - 2.67% 2.67%
Boards, Commissions and Offices 50,626 - 50,626 - Governor's Office of Community Initiatives 9,085 - 9,085 - 2.67% 2.67% Governor's Office of Crime Control and Prev. 41,541 - 41,541 - 2.67% 2.67%
Military Department3 Maryland Emergency Management Agency 100,564 78,041 100,564 78,041 1.70% 22.40%
Dept. of Natural Resources 130,610 2,858,554 130,610 2,858,554 NA 44.57%
Forestry Service 6,980 152,735 6,980 152,735 22.57% 4.57%
Wildlife and Heritage Service 31,350 685,890 31,350 685,890 NA 4 4.57%
Natural Resources Police 5,080 111,198 5,080 111,198 NA 4 4.57%
Boating Services 1,420 31,102 1,420 31,102 NA 4 4.57% Resource Assessment Service 12,120 265,448 12,120 265,448 42.58% 4.57%
Chesapeake and Coastal Watershed 45,290 991,186 45,290 991,186 NA 4 4.57%
Fisheries Service 28,370 620,995 28,370 620,995 NA 4 4.57%
Dept. of Agriculture 14,830 309,592 14,830 309,592 18.30% 0.63%
Dept. of Health and Mental Hygiene 2,954,120 10,904,253 2,954,120 10,904,253 33.81% 7.08%
Dept. of Human Resources 538,091 67,734,507 538,091 67,734,507 NA 6 NA 6
Dept. of Labor, Licensing, and Regulation 633,739 7,105,227 633,739 7,105,227 10.98% 8.90%
Dept. of Public Safety and Correctional Services 282 3,585 282 3,585 NA 3 NA 3
Information Technology and Communications 181 3,401 181 3,401 14.33% 5.06% Patuxent Institution - - - - 0.00% 0.00% Police and Correctional Training Commissions 101 184 101 184 1.40% 35.32%
State Dept. of Education - 13,590,224 - 13,590,224 NA 9 NA 9
Restricted Funds 16.00% 0.00% Unrestricted Funds 15.00% 0.00% Disability Determination Services Funds 16.30% 0.00%
I.1
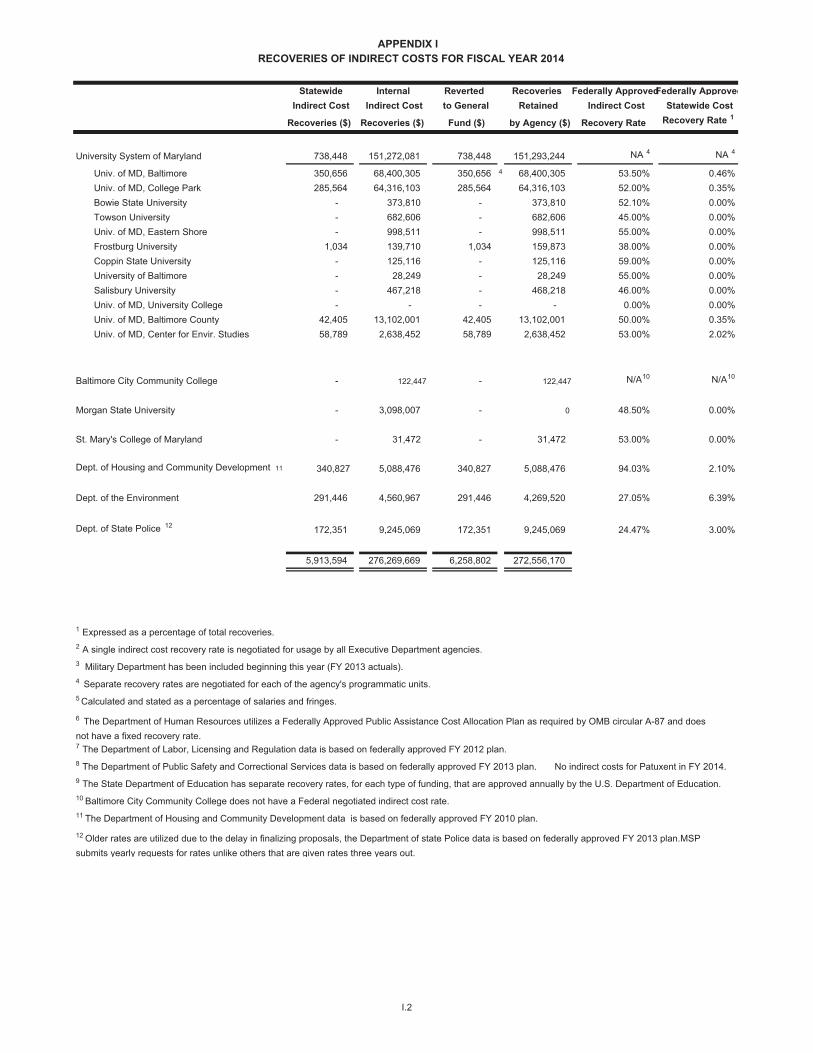
APPENDIX IRECOVERIES OF INDIRECT COSTS FOR FISCAL YEAR 2014
Statewide Internal Reverted Recoveries Federally ApprovedFederally ApprovedIndirect Cost Indirect Cost to General Retained Indirect Cost Statewide Cost
Recoveries ($) Recoveries ($) Fund ($) by Agency ($) Recovery Rate Recovery Rate 1
University System of Maryland 738,448 151,272,081 738,448 151,293,244 NA 4 NA 4
Univ. of MD, Baltimore 350,656 68,400,305 350,656 4 68,400,305 53.50% 0.46% Univ. of MD, College Park 285,564 64,316,103 285,564 64,316,103 52.00% 0.35% Bowie State University - 373,810 - 373,810 52.10% 0.00% Towson University - 682,606 - 682,606 45.00% 0.00% Univ. of MD, Eastern Shore - 998,511 - 998,511 55.00% 0.00% Frostburg University 1,034 139,710 1,034 159,873 38.00% 0.00% Coppin State University - 125,116 - 125,116 59.00% 0.00% University of Baltimore - 28,249 - 28,249 55.00% 0.00% Salisbury University - 467,218 - 468,218 46.00% 0.00% Univ. of MD, University College - - - - 0.00% 0.00% Univ. of MD, Baltimore County 42,405 13,102,001 42,405 13,102,001 50.00% 0.35% Univ. of MD, Center for Envir. Studies 58,789 2,638,452 58,789 2,638,452 53.00% 2.02%
Baltimore City Community College - 122,447 - 122,447 N/A10 N/A10
Morgan State University - 3,098,007 - 0 48.50% 0.00%
St. Mary's College of Maryland - 31,472 - 31,472 53.00% 0.00%
Dept. of Housing and Community Development 11 340,827 5,088,476 340,827 5,088,476 94.03% 2.10%
Dept. of the Environment 291,446 4,560,967 291,446 4,269,520 27.05% 6.39%
Dept. of State Police 12 172,351 9,245,069 172,351 9,245,069 24.47% 3.00%
5,913,594 276,269,669 6,258,802 272,556,170
1 Expressed as a percentage of total recoveries.2 A single indirect cost recovery rate is negotiated for usage by all Executive Department agencies.3 Military Department has been included beginning this year (FY 2013 actuals).4 Separate recovery rates are negotiated for each of the agency's programmatic units. 5 Calculated and stated as a percentage of salaries and fringes.
7 The Department of Labor, Licensing and Regulation data is based on federally approved FY 2012 plan. 8 The Department of Public Safety and Correctional Services data is based on federally approved FY 2013 plan. No indirect costs for Patuxent in FY 2014.9 The State Department of Education has separate recovery rates, for each type of funding, that are approved annually by the U.S. Department of Education.10 Baltimore City Community College does not have a Federal negotiated indirect cost rate.11 The Department of Housing and Community Development data is based on federally approved FY 2010 plan.
12 Older rates are utilized due to the delay in finalizing proposals, the Department of state Police data is based on federally approved FY 2013 plan.MSP submits yearly requests for rates unlike others that are given rates three years out.
6 The Department of Human Resources utilizes a Federally Approved Public Assistance Cost Allocation Plan as required by OMB circular A-87 and does not have a fixed recovery rate.
I.2

AGENCY ALLOCATIONGENERAL ASSEMBLY 73,479JUDICIARY 752,493OTHER JUDICIAL AGENCIES 1,665OFFICE OF THE PUBLIC DEFENDER 104,587OFFICE OF THE ATTORNEY GENERAL 43,110OFFICE OF THE STATE PROSECUTOR (397)MARYLAND TAX COURT 703PUBLIC SERVICE COMMISSION (1,199)SUBSEQUENT INJURY FUND 49,610UNINSURED EMPLOYERS' FUND 20,305WORKERS' COMPENSATION COMMISSION 22,594BOARD OF PUBLIC WORKS 89,794EXECUTIVE DEPARTMENT 248,798DEPARTMENT OF DISABILITIES 50,149MARYLAND ENERGY ADMINISTRATION (10,188)EXECUTIVE DEPARTMENT-BOARDS, COMMISSIONS AND OFFICES 81,248GOVERNOR'S OFFICE FOR CHILDREN (6,054)DEPARTMENT OF AGING 62,569MARYLAND COMMISSION ON CIVIL RIGHTS (1,560)MARYLAND STADIUM AUTHORITY 211,215MARYLAND BOARD OF ELECTIONS (163,889)MARYLAND STATE BOARD OF CONTRACT APPEALS 1,741DEPARTMENT OF PLANNING 25,948MARYLAND INSTITUTE FOR EMERGENCY MEDICAL SERVICES SYSTEMS (11,840)MILITARY DEPARTMENT (159,048)MARYLAND EMERGENCY MANAGEMENT AGENCY (9,602)DEPARTMENT OF VETERANS AFFAIRS 59,931STATE ARCHIVES 3,975MARYLAND AUTOMOBILE INSURANCE FUND (43,984)MARYLAND INSURANCE ADMINISTRATION 220,091OFFICE OF ADMINISTRATIVE HEARINGS 11,687COMPTROLLER OF THE TREASURY 6,476,929DATA PROCESSING 814,768INSURANCE MANAGEMENT 96,096STATE DEPARTMENT OF ASSESSMENTS AND TAXATION 148,103STATE LOTTERY AND GAMING CONTROL AGENCY 315,997REGISTERS OF WILLS 160,078MARYLAND STATE RETIREMENT AND PENSION SYSTEMS 168,052INJURED WORKERS' INSURANCE FUND 1,320DGS-REAL ESTATE 264,347DGS-FACILITIES/SECURITY 3,855,815DGS - SURPLUS PROPERTY (10,608)DEPARTMENT OF TRANSPORTATION 4,750,764DEPARTMENT OF NATURAL RESOURCES 750,698DEPARTMENT OF AGRICULTURE 101,119DEPARTMENT OF HEALTH AND MENTAL HYGIENE 10,015,955DEPARTMENT OF HUMAN RESOURCES 1,857,248DEPARTMENT OF LABOR, LICENSING, AND REGULATION 466,816DEPARTMENT OF PUBLIC SAFETY AND CORRECTIONAL SERVICES 5,042,246MARYLAND CORRECTIONAL ENTERPRISES 28,935STATE DEPARTMENT OF EDUCATION 4,816,548MORGAN STATE UNIVERSITY 513,860ST. MARY'S COLLEGE OF MARYLAND 146,862
APPENDIX JSTATEWIDE CENTRAL SERVICES COST ALLOCATION PLAN
FISCAL YEAR 2014(based on FY 2012 actual expenditures)
J.1

AGENCY ALLOCATION
APPENDIX JSTATEWIDE CENTRAL SERVICES COST ALLOCATION PLAN
FISCAL YEAR 2014(based on FY 2012 actual expenditures)
MARYLAND PUBLIC BROADCASTING COMMISSION 239,564UNIVERSITY SYSTEM OF MARYLAND 9,693,705UNIVERSITY OF MARYLAND MEDICAL SYSTEM (7,418)MARYLAND HIGHER EDUCATION COMMISSION 167,850HIGHER EDUCATION 54BALTIMORE CITY COMMUNITY COLLEGE 289,341MARYLAND SCHOOL FOR THE DEAF 349,491DEPARTMENT OF HOUSING AND COMMUNITY DEVELOPMENT 290,728DEPARTMENT OF BUSINESS AND ECONOMIC DEVELOPMENT 296,421MARYLAND DEPARTMENT OF THE ENVIRONMENT 822,674DEPARTMENT OF JUVENILE SERVICES 198,771DEPARTMENT OF STATE POLICE 466,092ALL OTHERS 13,561,075 TOTAL 68,878,227
J.2

FY 2012 FY 2013 FY 2014 FY 2015 FY 2016BY AGENCY: Expenditures Expenditures Expenditures Appropriation AllowanceGovernor's Office for Children 1,998,998 1,764,929 1,478,869 2,098,176 1,787,308 Interagency Committee for School Construction 1,514,276 84,363 84,273 42,102 - Dept. of Information Technology - - - 300,000 300,000 Dept. of Health and Mental Hygiene 2,396,516,171 2,381,692,143 2,256,003,492 2,370,652,754 2,294,744,037 Dept. of Human Resources (DHR) 1,820,752,366 1,943,482,986 1,894,742,839 2,026,523,970 1,916,398,094 Dept. of Labor, Licensing, and Regulation 13,701,620 14,981,048 16,221,214 16,183,045 16,041,103 Maryland State Dept. of Education 6,667,925,972 6,819,283,219 6,930,284,307 7,150,602,002 7,265,698,829 Maryland School for the Deaf 30,826,791 31,127,313 32,589,404 33,987,013 36,072,127 Dept. of Juvenile Services 286,219,936 281,909,956 287,840,162 296,265,623 303,913,442
Total 11,219,456,130 11,474,325,957 11,419,244,560 11,896,654,685 11,834,954,940
BY RESULT AREA:Healthy Babies and Children 2,948,225,354 2,948,440,530 2,690,204,162 2,860,300,883 2,797,837,205 Children Entering School Ready to Learn and Successful in School 6,623,526,352 6,801,681,307 7,080,804,635 7,308,618,588 7,414,489,365 Children Completing School 3,481,359,110 3,479,138,574 3,674,133,082 3,831,443,704 4,008,247,571 Children Safe in Their Families and Communities 1,013,751,091 1,066,890,995 1,118,784,890 1,174,649,708 1,211,250,953 Stable and Economically Independent Families 2,061,584,315 2,142,828,289 1,993,208,895 2,103,704,177 2,018,582,598
Subtotal 16,128,446,222 16,438,979,695 16,557,135,664 17,278,717,060 17,450,407,692
Less Program Funds Included in Multiple Result Areas: (4,908,990,092) (4,964,653,738) (5,137,891,104) (5,382,062,375) (5,615,452,752)
Total 11,219,456,130 11,474,325,957 11,419,244,560 11,896,654,685 11,834,954,940
APPENDIX KSHARE OF THE STATE BUDGET PROVIDING SERVICES TO CHILDREN, YOUTH AND FAMILIES
Note: The By Agency section of this presentation reflects FY 2015 deficiencies and FY 2016 contingent reductions. Other cost containment actions in FY 2015 and FY 2016 are only included for the Governor's Office for Children, the Department of Juvenile Services, and Maryland State Department of Education Local Aid. The dollar amount cannot be established for other appendix components. The By Result Area section does not reflect any of the above because the dollar amount cannot be reliably established.
K.1

FEDERAL FUNDS CFDA No. FY 2015* FY 2016 **Department of Agriculture 10 1,756,149,387 1,684,662,252 Department of Commerce 11 7,946,341 8,170,641 Department of Defense 12 20,360,638 52,931,469 Department of Housing and Urban Development 14 252,831,097 254,184,353 Department of the Interior 15 20,726,725 19,988,522 Department of Justice 16 22,700,337 23,972,893 Department of Labor 17 185,504,926 178,465,222 Department of Transportation 20 887,182,206 1,019,327,686 Appalachian Regional Commission 23 1,450,092 1,050,129 Equal Employment Opportunity Commission 30 358,313 402,687 National Foundation on the Arts and the Humanities 45 3,345,572 3,700,698 National Science Foundation 47 478,721 440,013 Department of Veterans Affairs 64 18,494,270 20,031,101 Environmental Protection Agency 66 70,590,066 74,037,354 Department of Energy 81 8,281,195 4,635,720 Department of Education 84 591,471,099 592,937,137 National Archives and Records Administration 89 64,563 95,837 Help America Vote 90 - 115,638 Department of Health and Human Services 93 7,753,381,030 7,459,775,486 Corporation for National and Community Service 94 4,610,205 4,790,012 Social Security Administration 96 42,119,274 53,710,811 Department of Homeland Security 97 62,008,471 46,943,949 Non-CFDA Sources 55,850,314 119,168,358 SUBTOTAL 11,765,904,842 11,623,537,968
FEDERAL RECOVERY FUNDS CFDA No. FY 2015 FY 2016Department of Energy 81 1,522,960 2,522,310 Department of Education 84 46,994,568 7,983,622 Non-CFDA Sources 11,489,645 11,477,263 SUBTOTAL 60,007,173 21,983,195
TOTAL OF ALL FEDERAL FUNDS 11,825,912,015 11,645,521,163
*FY 2015 does not include deficiency appropriations.
** FY 2016 does not include savings from across-the-board reductions.
APPENDIX LSUMMARY OF BUDGETED FEDERAL REVENUES BY MAJOR FEDERAL SOURCES
L.1

2014 2015 2016Balance - beginning of fiscal year* 6,316 9,275 1,592
SourcesMaster Settlement Agreement 191,404 191,404 191,404
Adjustments:
Inflation 125,369 135,499 145,932Volume reduction (167,532) (178,108) (188,527)Previously Settled States reduction (18,043) (18,047) (18,051)
Net Master Settlement Agreement payment 131,198 130,747 130,758
From escrow
Shortfall in payments due (16,900) (16,900) (16,900)
National Arbitration Panel award 5,283 5,283 5,283Strategic Contribution Settlement 29,189 29,189 29,189Tobacco Laws Enforcement Arbitration (66,556) 40,000FY 2014 Overpayment Adjustment (13,000)
Total Sources 82,213 135,319 188,329
Recovery of prior year expenditures 1,100 1,100 1,100
Planned uses (see detail) (80,354) (189,651) (188,543)Planned uses (deficiency) 45,550
Balance - end of fiscal year 9,275 1,592 2,478
*FY14 beginning of fiscal year balance corrected from last year's publication.Note: Totals may not add due to rounding
CIGARETTE RESTITUTION FUNDFISCAL YEARS 2014 - 2016
(in thousands of $)
Appendix M
M.1

2014 2015 2016*Crop ConversionL00 A1210 Agriculture - Marketing and Development** 4,303,000 4,323,000 5,173,000L00 A1213 Agriculture - Tobacco Transition Program 319,000 2,216,000 868,000
Total 4,622,000 6,539,000 6,041,000
Cancer Prevention/Screening/Treatment and Heart/LungM00 F0304 DHMH - Prevention and Disease Control
Local Public Health 7,547,472 7,547,472 7,547,472UM - Baltimore City 1,223,000 1,223,000 1,223,000Baltimore City Health Department 1,223,000 1,223,000 1,223,000Statewide Academic Health Centers***
University of Maryland - Cancer 11,206,897 5,000,000 5,000,000Johns Hopkins Institutions 1,793,103 800,000 800,000
Surveillance and Evaluation 1,169,085 1,232,590 1,239,276Administration 559,488 601,915 620,715Cancer screening data base 244,125 244,125 244,125Total 24,966,170 17,872,102 17,897,588
M00F0304 DHMH - Breast & Cervical Cancer 14,700,000 13,230,000 13,230,000
Tobacco Use Prevention and Cessation ProgramM00 F0304 DHMH - Prevention and Disease Control
Local Public Health 3,877,227 3,877,227 3,877,227Statewide Public Health 2,398,892 2,408,355 2,321,824Surveillance and Evaluation 971,072 935,611 1,022,142Tobacco Prevention and Cessation 216,478 216,478 216,478Administration 240,877 238,182 241,074
Total 7,704,546 7,675,853 7,678,745
Drug AddictionM00 K0201 DHMH - Alcohol and Drug Abuse 21,032,184 21,032,184 21,032,184
EducationR00 A0100 MSDE - Headquarters 25,641 75,877 69,000R00 A0304 MSDE - Aid to Non-public Schools 5,709,714 6,040,000 6,040,000
Total Education 5,735,355 6,115,877 6,109,000
Legal ExpensesC81 C0001 Office of the Attorney General - Legal Counsel and Advice 137,106 418,847 428,068C81 C0014 Office of the Attorney General - Civil Litigation Division 283,723 474,439 478,505
Total Legal Expenses 420,829 893,286 906,573
MedicaidM00 Q0103 DHMH - Medical Care Provider Reimbursements**** 1,173,104 116,293,073 115,648,000M00 Q0103 DHMH - Medical Care Provider Reimbursements Deficiency (45,550,000)
Total Uses 80,354,188 144,101,375 188,543,090
*FY16 does not account for statewide reductions.
***FY15 includes BPW reduction of $7.45 million. FY16 includes contingent reduction of $7.2 million.
APPENDIX M (CONT.)CIGARETTE RESTITUTION FUND
Detail of Planned Uses FISCAL YEARS 2014 - 2016
**FY14-FY15 includes approximately $3.32 million per year for Capital Bond Repayment. FY16 includes approximately $3.82 million for Capital Bond Repayment
M.2

--
-
-
-
-
MAJOR INFORMATION TECHNOLOGY DEVELOPMENT PROJECTS
“Development” does not include expenditures made after a new or enhanced system has been legally accepted by the user and is being used for the business process for which it was intended.
MITDPs must now follow a two-step process: Step 1) Planning and Step 2) Implementation. A project planning request defines the initial planning process for the project and estimates total cost and schedule required to complete Phases 1-4 of the State’s SDLC methodology. Step 1 (Planning) must be approved by DoIT before agencies can proceed to Step 2 (Implementation).
For fiscal year 2016, all General Fund allowances are contained in the MITDP Fund financial agency (F50). These allowances are included in the individual project sheets as 'Special MITDPF' for presentation of total project development funding and summarized at the end of this document. Funds appropriated from these sources will be placed in F50A0101 and transferred by the Department of Information Technology to the agency major project program in accordance with the oversight responsibilities contained in State Finance and Procurement Article § 3A-309. Projected operations and maintenance expenditures, excluding the first year, are not reflected in reported amounts.
Separate budget programs for information technology development spending are created during the budget cycle. The term “development” has been defined as follows:
Major Information Technology Development Projects (MITDPs) are separate, budgeted programs throughout the State Budget. The individual MITDPs are identified separately within each program for those agencies with MITDPs. The MITDPs are presented separately in this section in a manner similar to the capital budget program.
The project is undertaken to support a critical business function associated with the public health, education, safety or financial well being of the citizens of Maryland; or
The estimated total cost of development equals or exceeds $1 million;
The Secretary of the Department of Information Technology (DoIT) determines that the project requires the special attention and consideration given to a major IT development project due to the significance of the project’s potential benefits or risks, the impact of the project on the public or local governments, the public visibility of the project, or other reasons as determined by the Secretary.
An MITDP is any information technology development project that meets one or more of the following criteria:
“Development” means all expenditures for a new information technology system or an enhancement to an existing system, including system planning, procurement, creation, installation, testing and initial training.
The cost of FY 2016 Oversight Project Management (including all tiers of the oversight program) has been allocated to participating projects within the funding amounts indicated. DoIT and the participating agency will transfer funds at the end of the FY to cover Oversight expenses.
All MITDPs for the Maryland Department of Transportation are captured within the Capital Budget program, and thus are not included in this section.
Each information technology budget sub-program is based on spending for individual MITDPs. Individual project sheets are provided for each project. The aggregated costs of these projects equals the total proposed spending in the MITDP budget program for each agency.
“Development” does not include ongoing operating costs, software or hardware maintenance, routine upgrades, or modifications that merely allow for the continuation of the existing level of functionality.
N.1

D18 - Governor's Office for Children
D38 - State Board of Elections
D80 - Maryland Insurance Administration
E00- Comptroller of Maryland
F10 - Budget and Management, Department of
L00 - Agriculture, Department of
M00 - Health and Mental Hygiene, Department of
N00 - Human Resources, Department of
P00 - Labor, Licensing and Regulation, Department of
Q00 - Public Safety and Correctional Services, Department of
R00 - Education, Maryland State Department of
R95 - Baltimore City Community College
U00 - Environment, Department of the
V00- Juvenile Services, Department of
W00 - State Police, Department of
Summary by Agency
Summary by Fund
Summary of F50
Summary of Reclassified IT Projects
MAJOR INFORMATION TECHNOLOGY DEVELOPMENT PROJECTS
SUMMARIES
N.2

Fund Prior to Actual Appropriation Allowance Projected Projected Projected Total
Type FY 2014 FY 2014 FY 2015 FY 2016 FY 2017 FY 2018 FY 2019 General 105,784 300,000 300,000 705,784 Special excl MITDPF - Special MITDPF - Federal - Reimbursable - Total - 105,784 300,000 300,000 - - - 705,784
Fund Prior to Actual Projected Projected Projected Projected Projected Total
Type FY 2014 FY 2014 FY 2015 FY 2016 FY 2017 FY 2018 FY 2019 General 105,784 300,000 300,000 705,784 Special excl MITDPF - Special MITDPF - Federal - Reimbursable - Total - 105,784 300,000 300,000 - - - 705,784
The Governor’s Office for Children (GOC), on behalf of the Children’s Cabinet, utilizes the State Children, Youth and Families Information System (SCYFIS) to receive, track, and analyze information on children placed in out-of-home Residential Child Care Programs. This project was submitted outside of the regular budget cycle. Project costs shown here reflect those for the Project Planning Request (PPR) phase only. Full project design and implementation costs will be determined as part of the planning process, and total project cost will be adjusted at the conclusion of the PPR phase. FY 2016 Allowance includes $50,000 for oversight.
Sub-Program Code: 0000
D18 - Governor's Office for Children
Project Title: State Children, Youth and Families Information System (SCYFIS)Appropriation Code: D18A18.02
Project Summary:
To bring the SCYFIS system up to current technology standards and to build a modern database that will be accessible, reliable, and useful for GOC, the Children's Cabinet agencies, Residential Child Care Program providers and other key stakeholders. SCYFIS will be easily updated, upgraded and positioned to interface with other agency databases.
IT Project Funding
IT Project Development Costs
Step 1 (Planning) funding only
Program Strategic Goals:
N.3

Fund Prior to Actual Appropriation Allowance Projected Projected Projected Total
Type FY 2014 FY 2014 FY 2015 FY 2016 FY 2017 FY 2018 FY 2019 General 1,098,132 2,061,485 6,893,299 5,627,230 3,439,354 3,242,968 22,362,468 Special excl MITDPF 51,868 3,216,943 6,893,298 5,627,230 3,439,354 3,242,968 22,471,661 Special MITDPF 1,155,458 1,155,458 Federal - Reimbursable - Total - 1,150,000 6,433,886 13,786,597 11,254,460 6,878,708 6,485,936 45,989,587
Fund Prior to Actual Projected Projected Projected Projected Projected TotalType FY 2014 FY 2014 FY 2015 FY 2016 FY 2017 FY 2018 FY 2019
General 290,959 2,061,485 6,893,299 5,627,230 3,439,354 3,242,968 21,555,295 Special excl MITDPF 51,868 3,216,943 6,893,298 5,627,230 3,439,354 3,242,968 22,471,661 Special MITDPF - 1,155,458 1,155,458 Federal - Reimbursable - Total - 342,827 6,433,886 13,786,597 11,254,460 6,878,708 6,485,936 45,182,414
The Maryland State Board of Elections (SBE) has been mandated (see Election Law Article § 9-102 of the Annotated Code of Maryland) to select, certify, and implement a new statewide voting system to replace the existing voting system. SBE intends to have the system in place and ready for use in the 2016 Presidential Election cycle. Project costs shown here reflect both PPR and PIR (Full project design and implementation costs). The FY 2016 Allowance includes $500,000 for oversight. The amounts shown for FY 2015 include a deficiency appropriation of $2,310,916.
Sub-Program Code: 0003
D38 - State Board of Elections
Project Title: New Voting System Replacement (NVSR) (formerly known as Optical Scan Voting System Implementation)
Appropriation Code: D38I0002
Project Summary:
In 2007, the General Assembly enacted legislation requiring SBE to select and certify a voting system with a "voter-verfiiable paper record." Accordingly, SBE’s goal is to procure and implement a voting system that meets the requirements of §9-102 of the Election Law Article.
IT Project Funding
IT Project Development Costs
Program Strategic Goals:
N.4

Fund Prior to Actual Appropriation Allowance Projected Projected Projected Total
Type FY 2014 FY 2014 FY 2015 FY 2016 FY 2017 FY 2018 FY 2019 General - Special excl MITDPF 150,000 - 1,790,000 404,500 54,500 2,399,000 Special MITDPF - Federal - Reimbursable - Total 150,000 - 1,790,000 404,500 54,500 - - 2,399,000
Fund Prior to Actual Projected Projected Projected Projected Projected TotalType FY 2014 FY 2014 FY 2015 FY 2016 FY 2017 FY 2018 FY 2019
General - Special excl MITDPF 99,866 1,790,000 404,500 2,294,366 Special MITDPF 49,685 49,685 Federal - Reimbursable - Total 149,551 - 1,790,000 404,500 - - - 2,344,051
The MIA has identified the need to replace the current Enterprise Complaint Tracking System (ECTS) with a browser based document management technology that automates workflow by routing electronic documents and notifications across the organization, and enables on-line data entry, form creation, standard reports, ad-hoc queries and data exchange with internal and external systems. Project costs shown here reflect those for both the PPR and PIR phase only. The FY 2016 Allowance includes $50,000 for oversight.
Sub-Program Code: 1200
D80 - Maryland Insurance Administration
Project Title: Enterprise Complaint Tracking System (ECTS)Appropriation Code: D80Z0102
Project Summary:
Replacing the current Enterprise Complaint Tracking System (ECTS) with upgraded technology will provide the MIA with the ability to improve complaint resolution efficiency percentages beyond current targets.
IT Project Funding
IT Project Development Costs
Program Strategic Goals:
N.5

Fund Prior to Actual Appropriation Allowance Projected Projected Projected Total
Type FY 2014 FY 2014 FY 2015 FY 2016 FY 2017 FY 2018 FY 2019 General 1,500,000 13,200,000 13,200,000 1,500,000 Special excl MITDPF 1,000,000 8,800,000 8,800,000 1,000,000 Special MITDPF - Federal - Reimbursable - Total - - - 2,500,000 22,000,000 22,000,000 - 46,500,000
Fund Prior to Actual Projected Projected Projected Projected Projected TotalType FY 2014 FY 2014 FY 2015 FY 2016 FY 2017 FY 2018 FY 2019
General 1,500,000 13,200,000 13,200,000 1,500,000 Special excl MITDPF 1,000,000 8,800,000 8,800,000 1,000,000 Special MITDPF Federal Reimbursable - Total - - - 2,500,000 22,000,000 22,000,000 - 46,500,000
Sub-Program Code: 0440
E00 - Comptroller of Maryland
Project Title: Integrated Tax System (ITS)Appropriation Code: E00A0402
This project supports the primary mission of the COM – executive leadership for Maryland’s financial management services through the fair and efficient collection of taxes, regulation of businesses, accurate forecasting and accounting of revenues and expenses, and the provision of technological services to State agencies. The ITS will allow for efficient tax processing and collection necessary to support this mission and the Agency's strategic goals: (1) provide public services in ways that achieve the highest level of individual and business customer satisfaction; (2) take advantage of existing and emerging IT applications to enhance business processes that currently use little or no technology, and improve the infrastructure for efficient implementation of these new technologies; and (3) vigorously enforce tax laws essential to the fair treatment of all taxpayers. Internal analysis has shown that the ITS will support, improve, and streamline nearly all COM business processes.
Project Summary:The Integrated Tax System (ITS) project will replace the Agency’s State of Maryland Tax (SMART) system, Computer Assisted Collection System (CACS,) and other outdated tax processing systems and integrate with a robust data warehouse to both continue and expand revenue generating projects and provide enhanced reporting functionality. The integrated system will allow the Comptroller to efficiently administer all taxes and fees required by law. This includes the processing and collection of personal income tax and sales and use tax, the State’s largest sources of revenue. Successful implementation will bring the Comptroller of Maryland (COM) a modernized system which makes use of current technologies and is supported by and adaptable to the mainstream IT workforce. Uniformity in processing across tax types will simplify compliance by taxpayers and allow for a more dynamic use of Comptroller staff. The FY2016 allowance includes $100,000 for oversight.IT Project Funding
IT Project Development Costs
Program Strategic Goals:
N.6

Fund Prior to Actual Appropriation Allowance Projected Projected Projected TotalType FY 2014 FY 2014 FY 2015 FY 2016 FY 2017 FY 2018 FY 2019
General - Special excl MITDPF - Special MITDPF 1,276,000 1,276,000 Federal - Reimbursable 9,937,256 12,938,678 17,543,485 10,912,281 7,766,348 - 59,098,048 Total 11,213,256 12,938,678 17,543,485 10,912,281 7,766,348 - - 60,374,048
Fund Prior to Actual Projected Projected Projected Projected Projected TotalType FY 2014 FY 2014 FY 2015 FY 2016 FY 2017 FY 2018 FY 2019
General - Special excl MITDPF - Special MITDPF 1,276,000 1,276,000 Federal - Reimbursable 9,937,256 10,470,108 20,012,035 12,300,281 6,378,348 - 59,098,028 Total 11,213,256 10,470,108 20,012,035 12,300,281 6,378,348 - - 60,374,028
Program Strategic Goals:F10A0201 (DBM) Goal 1: Retain employees in the State Personnel Management System.
F10 - Budget and Management, Department of
IT Project Funding
IT Project Development Costs
Project Title: Statewide Personnel System (SPS)
The purpose of the SPS project is to obtain commercial off-the-shelf (COTS) solutions to replace the State’s legacy personnel systems. The new SPS will have high “cultural impact” on agencies and their users statewide. Because of this, to help lower the overall project risk profile, a multi-phased implementation strategy has been adopted, breaking the large project into two smaller project phases. The FY 2016 Allowance includes $500,000 for oversight.
Project Summary:
Appropriation Code: F50B0406Sub-Program Code: P006
N.7
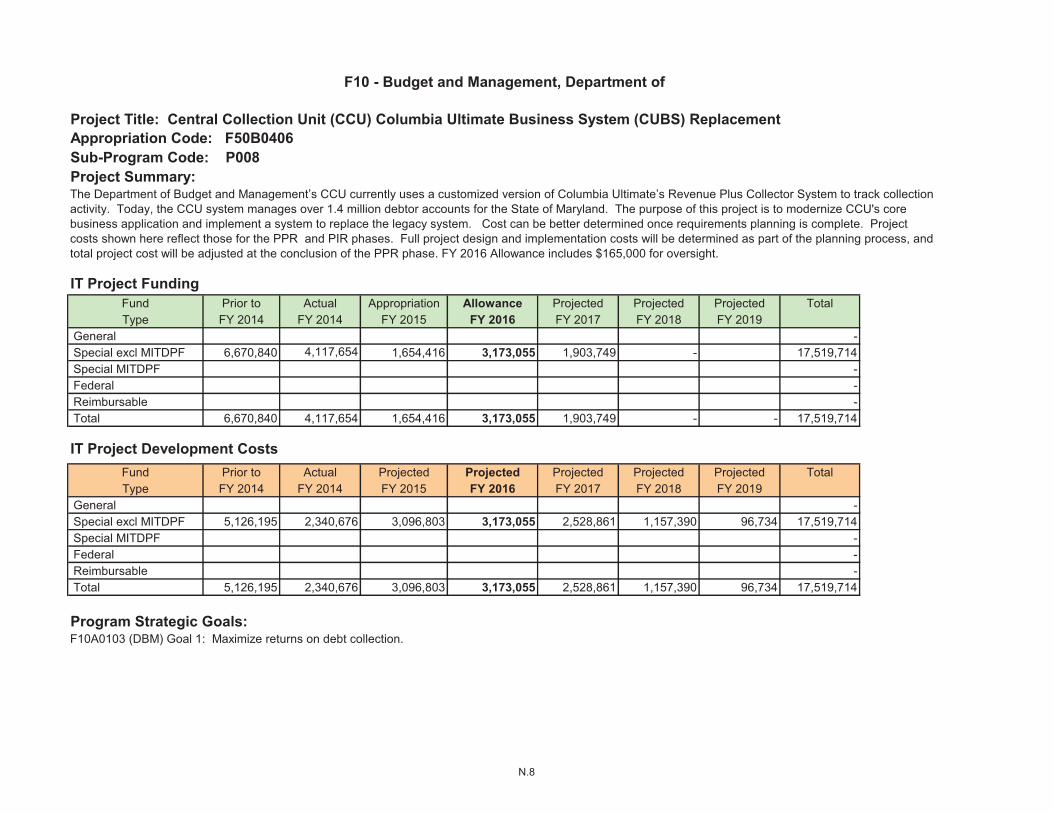
Fund Prior to Actual Appropriation Allowance Projected Projected Projected TotalType FY 2014 FY 2014 FY 2015 FY 2016 FY 2017 FY 2018 FY 2019
General - Special excl MITDPF 6,670,840 4,117,654 1,654,416 3,173,055 1,903,749 - 17,519,714 Special MITDPF - Federal - Reimbursable - Total 6,670,840 4,117,654 1,654,416 3,173,055 1,903,749 - - 17,519,714
Fund Prior to Actual Projected Projected Projected Projected Projected TotalType FY 2014 FY 2014 FY 2015 FY 2016 FY 2017 FY 2018 FY 2019
General - Special excl MITDPF 5,126,195 2,340,676 3,096,803 3,173,055 2,528,861 1,157,390 96,734 17,519,714 Special MITDPF - Federal - Reimbursable - Total 5,126,195 2,340,676 3,096,803 3,173,055 2,528,861 1,157,390 96,734 17,519,714
F10A0103 (DBM) Goal 1: Maximize returns on debt collection.Program Strategic Goals:
IT Project Funding
IT Project Development Costs
Sub-Program Code: P008Project Summary:The Department of Budget and Management’s CCU currently uses a customized version of Columbia Ultimate’s Revenue Plus Collector System to track collection activity. Today, the CCU system manages over 1.4 million debtor accounts for the State of Maryland. The purpose of this project is to modernize CCU's core business application and implement a system to replace the legacy system. Cost can be better determined once requirements planning is complete. Project costs shown here reflect those for the PPR and PIR phases. Full project design and implementation costs will be determined as part of the planning process, and total project cost will be adjusted at the conclusion of the PPR phase. FY 2016 Allowance includes $165,000 for oversight.
Appropriation Code: F50B0406Project Title: Central Collection Unit (CCU) Columbia Ultimate Business System (CUBS) Replacement
F10 - Budget and Management, Department of
N.8

Fund Prior to Actual Appropriation Allowance Projected Projected Projected TotalType FY 2014 FY 2014 FY 2015 FY 2016 FY 2017 FY 2018 FY 2019
General 550,000 1,500,000 2,050,000 Special excl MITDPF - Special MITDPF - Federal - Reimbursable 11,086,400 15,000,000 8,000,000 34,086,400 Total - 550,000 1,500,000 11,086,400 15,000,000 8,000,000 - 36,136,400
Fund Prior to Actual Projected Projected Projected Projected Projected TotalType FY 2014 FY 2014 FY 2015 FY 2016 FY 2017 FY 2018 FY 2019
General 319,525 1,427,155 10,000,000 15,000,000 8,000,000 34,746,680 Special excl MITDPF - Special MITDPF - Federal - Reimbursable - Total - 319,525 1,427,155 10,000,000 15,000,000 8,000,000 - 34,746,680
Program Strategic Goals:To ensure that the State has a fully functional and supportable budgeting system.
In 2005, DoIT commissioned the Statewide Application Risks Assessment (SARA) of 12 legacy statewide systems, including those supporting human resources, timekeeping, benefits, budgeting, purchasing, accounting, central collections and payroll. Three of those systems were assessed as high risk - human resources, budgeting and timekeeping. The high risk factor was assessed because these systems were at the end of their useful lives and based on old technologies, with a recommendation for replacement. Project costs shown here reflect those for both the PPR and PIR phases. Full project design and implementation costs will be determined as part of the planning process, and total project cost will be adjusted at the conclusion of the PPR phase. Beginning in FY 2016, the project will be funded through a State agency allocation using Comptroller Object 0897- EBS System Allocation. FY 2016 Allowance includes $500,000 for oversight.
Project Summary:
F10 - Budget and Management, Department of
Project Title: Enterprise Budgeting System (EBS)Appropriation Code: F50B0406Sub-Program Code: P010
IT Project Funding
IT Project Development Costs
N.9

Fund Prior to Actual Appropriation Allowance Projected Projected Projected TotalType FY 2014 FY 2014 FY 2015 FY 2016 FY 2017 FY 2018 FY 2019
General 156,600 156,600 Special excl MITDPF Special MITDPF Federal Reimbursable Total - - - 156,600 - - - 156,600
Fund Prior to Actual Projected Projected Projected Projected Projected TotalType FY 2014 FY 2014 FY 2015 FY 2016 FY 2017 FY 2018 FY 2019
General 156,600 156,600 Special excl MITDPF Special MITDPF Federal Reimbursable Total - - - 156,600 - - - 156,600
Many activities of the MDA are regulatory in nature, others are assigned to a category of public service and some are educational or promotional in scope. All are intended to provide the maximum protection possible for the consumer as well as promote the economic well-being of farmers, food and fiber processors and businesses engaged in agricultural related operations. MDA's telephone system and network are critical components for interfacing with constituents in a timely fashion.
Step 1 (Planning) funding only
Program Strategic Goals:
L00 - Agriculture, Department of
IT Project Funding
MDA’s aging infrastructure drives the need to upgrade and/or replace critical system components to include the MDA telephone system and network backbone. MDA’s network and telephone systems located in Annapolis, Salisbury, and Frederick will be upgraded/replaced with newer technology that will be supported and meet the changing needs of staff and constituents. The current telephone system hardware and software are no longer supported by the vendor and must be upgraded or replaced. Project costs shown here reflect those for the PPR phase only. Full project design and implementation costs will be determined as part of the planning process, and total project cost will be adjusted at the conclusion of the PPR phase. The FY2016 allowance includes $50,000 for oversight.
Project Title: MDA Telecomm/DataComm UpgradeAppropriation Code: L00A1106Sub-Program Code: 1610
IT Project Development Costs
Project Summary:
N.10

Fund Prior to Actual Appropriation Allowance Projected Projected Projected Total
Type FY 2014 FY 2014 FY 2015 FY 2016 FY 2017 FY 2018 FY 2019 General 4,055,941 1,373,915 5,884,161 7,775,410 7,769,211 26,858,638 Special excl MITDPF - Special MITDPF - Federal 36,503,472 12,365,236 32,083,358 49,741,715 28,565,707 159,259,488 Reimbursable - Total 40,559,413 13,739,151 37,967,519 57,517,125 36,334,918 - - 186,118,126
Fund Prior to Actual Projected Projected Projected Projected Projected TotalType FY 2014 FY 2014 FY 2015 FY 2016 FY 2017 FY 2018 FY 2019
General 4,055,941 1,373,915 5,884,161 7,775,410 7,769,211 26,858,638 Special excl MITDPF - Special MITDPF - Federal 36,503,472 12,365,236 32,083,358 49,741,715 28,565,707 159,259,488 Reimbursable - Total 40,559,413 13,739,151 37,967,519 57,517,125 36,334,918 - - 186,118,126
M00 - Health and Mental Hygiene, Department of
Appropriation Code: M00Q0108Sub-Program Code: T801, T802, T803
IT Project Funding
Project Title: Medicaid Enterprise Restructuring Project (MERP) - formerly Medicaid Management Information System (MMIS)
The State is required to align with the federally mandated Medicaid Information Technology Architecture requirements. This project will modernize existing system functions and significantly enhance the goals of the MMIS ensuring that eligible individuals receive the health care benefits to which they are entitled and that providers are reimbursed promptly and efficiently. DHMH intends to replace its legacy MMIS claims processing system with a new MMIS system, which will also support coordination of benefits, surveillance and utilization review, federal and management reporting, and case management. In conjunction with the MMIS replacement, DHMH intends to add a Decision Support System (DSS); improve and enhance the Pharmacy e-Prescriber solution; implement a Service Oriented Architecture (SOA) Integration Framework, and develop an eligibility portal. The FY 2016 Allowance includes $500,000 for oversight.
Project Summary:
IT Project Development Costs
M00Q0101 Goal 3: Maximize the efficiency and cost effectiveness of Medical Care Programs.
Program Strategic Goals:
N.11

Fund Prior to Actual Appropriation Allowance Projected Projected Projected TotalType FY 2014 FY 2014 FY 2015 FY 2016 FY 2017 FY 2018 FY 2019
General 4,352,649 5,190,000 5,500,000 7,350,000 4,537,500 2,875,000 29,805,149 Special excl MITDPF - Special MITDPF - Federal 4,228,196 4,350,000 5,000,000 8,750,000 4,762,500 3,625,000 30,715,696 Reimbursable - Total 8,580,845 9,540,000 10,500,000 16,100,000 9,300,000 6,500,000 - 60,520,845
Fund Prior to Actual Projected Projected Projected Projected Projected TotalType FY 2014 FY 2014 FY 2015 FY 2016 FY 2017 FY 2018 FY 2019
General 4,352,649 5,190,000 5,500,000 7,350,000 4,537,500 2,875,000 29,805,149
Special excl MITDPF -
Special MITDPF -
Federal 4,228,196 4,350,000 5,000,000 8,750,000 4,762,500 3,625,000 30,715,696
Reimbursable -
Total 8,580,845 9,540,000 10,500,000 16,100,000 9,300,000 6,500,000 - 60,520,845
Sub-Program Code: T807Project Summary:Maryland is implementing a tracking system (LTSS), a standardized assessment instrument (interRAI-HC), and an in-home services verification system (ISAS). FY 2016 Allowance includes $500,000 for oversight.
IT Project Funding
The major goal of this project is design, develop, migrate and implement an integrated Long Term Care tracking system in a multi-phased approach, in order to increase federal matching funds (FMAP), and meet the federal Balancing Incentive Program (BIP) and Community First Choice (CFC) program requirements.
Appropriation Code: M00Q0108Project Title: Long Term Supports and Services Tracking System (LTSS)
Program Strategic Goals:
IT Project Development Costs
M00 - Health and Mental Hygiene, Department of
N.12

Fund Prior to Actual Appropriation Allowance Projected Projected Projected TotalType FY 2014 FY 2014 FY 2015 FY 2016 FY 2017 FY 2018 FY 2019
General - Special excl MITDPF 64,000 570,000 684,000 1,318,000 Special MITDPF - Federal - Reimbursable - Total - 64,000 570,000 684,000 - - - 1,318,000
Fund Prior to Actual Projected Projected Projected Projected Projected TotalType FY 2014 FY 2014 FY 2015 FY 2016 FY 2017 FY 2018 FY 2019
General -
Special excl MITDPF 634,000 684,000 1,318,000
Special MITDPF -
Federal -
Reimbursable -
Total - - 634,000 684,000 - - - 1,318,000
The Board of Physicians (Board) is seeking a new more fully integrated medical licensure and investigation software system to replace its current antiquated systems. The Board’s needs have exceeded its 1995 vintage software capabilities. These shortcomings have been noted in the 2011 Sunset Audit Review and a recent Perman study. The new software will facilitate the generation of more accurate reports on ongoing and completed Board activities. It will also facilitate increased internet interactions, allowing applicants and clients to receive more timely status reports. Project costs shown here reflect those for the PPR phase only. Full project design and implementation costs will be determined as part of the planning process, and total project cost will be adjusted at the conclusion of the PPR phase. FY 2016 Allowance includes $50,000 for Oversight.
Project Summary:
Project Title: Maryland Board of Physicians (MPB) IT Licensure
Sub-Program Code: A803Appropriation Code: M00A0108
M00 - Health and Mental Hygiene, Department of
IT Project Funding
IT Project Development Costs
Step 1 (Planning) funding only
Program Strategic Goals:Short comings in our current system have been identified in both the 2011 Sunset Evaluation and an independent review (the Perman Report). The proposed system will correct these deficiencies and also greatly improve the work efficiency for the Board.
N.13

Fund Prior to Actual Appropriation Allowance Projected Projected Projected Total
Type FY 2014 FY 2014 FY 2015 FY 2016 FY 2017 FY 2018 FY 2019 General 676,500 676,500 Special excl MITDPF - Special MITDPF 182,000 240,000 422,000 Federal 168,000 240,000 676,500 1,084,500 Reimbursable - Total - 350,000 480,000 1,353,000 - - - 2,183,000
Fund Prior to Actual Projected Projected Projected Projected Projected TotalType FY 2014 FY 2014 FY 2015 FY 2016 FY 2017 FY 2018 FY 2019
General 676,500 676,500 Special excl MITDPF - Special MITDPF 422,000 422,000 Federal 408,000 676,500 1,084,500 Reimbursable - Total - - 830,000 1,353,000 - - - 2,183,000
Program Strategic Goals:This application is used state wide by the Locals' Finance offices. The primary Agency mission, goals or objectives that this project would support is the standardization of the development environment. With the completion of this project DHR will be able to centralize hardware, functionality and data to increase performance and decrease the cost associated with trying to maintain 24 instances of the same application running on six different physical servers.
Step 1 (Planning) funding only
The AFS is a computerized fiscal tracking system that allows DHR’s fiscal users to set up, print and track payments to various vendors, including payments to child care and foster care providers, maintains a history of financial transactions, generates a variety of fiscal reports including the 302A for assistance and the General Ledger; and produces annual 1099 data on disk for submission to Financial Management Information System (FMIS). AFS is written in an antiquated and unsupported Delphi technology. The application is outdated, prone to sensitive errors and difficult to enhance. Skills to support the application are not readily available. The system cannot take advantage of the newer technologies until it is moved to a more robust application language and the User Interface is modernized. Project costs shown here reflect those for the PPR phase only. Full project design and implementation costs will be determined as part of the planning process, and total project cost will be adjusted at the conclusion of the PPR phase. FY 2016 Allowance includes $67,650 for oversight.
IT Project Funding
IT Project Development Costs
Project Summary:
N00 - Human Resources, Department of
Project Title: Automated Financial System (AFS)Appropriation Code: N00F0002Sub-Program Code: 6B13
N.14

Fund Prior to Actual Appropriation Allowance Projected Projected Projected TotalType FY 2014 FY 2014 FY 2015 FY 2016 FY 2017 FY 2018 FY 2019
General - Special excl MITDPF - Special MITDPF - Federal 957,090 851,000 12,417,500 8,479,870 24,310,991 24,700,000 5,700,000 77,416,451 Reimbursable - Total 957,090 851,000 12,417,500 8,479,870 24,310,991 24,700,000 5,700,000 77,416,451
Fund Prior to Actual Projected Projected Projected Projected Projected TotalType FY 2014 FY 2014 FY 2015 FY 2016 FY 2017 FY 2018 FY 2019
General - Special excl MITDPF - Special MITDPF - Federal 714,329 215,800 12,867,500 8,314,870 24,310,991 24,700,000 5,700,000 76,823,490 Reimbursable - Total 714,329 215,800 12,867,500 8,314,870 24,310,991 24,700,000 5,700,000 76,823,490
IT Project Development Costs
Program Strategic Goals:P00H0101 Goal 1: To promptly determine eligibility and pay benefits to qualified unemployed individuals.
Sub-Program Code: HB10Project Summary:DLLR's UI Division will modernize the technology associated with its three largest functions: Benefits (paying unemployment insurance claimants), Contributions (taxes collected from employers that replenish the Trust Fund) and Appeals (the function that arbitrates disputes between claimants and employers on the validity of a claim). Includes $415,000 oversight for FY 2016.
IT Project Funding
P00 - Labor, Licensing and Regulation, Department of
Appropriation Code: P00H0102Project Title: Unemployment Insurance Technology Modernization
N.15

Fund Prior to Actual Appropriation Allowance Projected Projected Projected Total
Type FY 2014 FY 2014 FY 2015 FY 2016 FY 2017 FY 2018 FY 2019 General - Special excl MITDPF 46,795 93,589 850,000 750,000 250,000 1,990,384 Special MITDPF - Federal - Reimbursable - Total 46,795 93,589 850,000 750,000 250,000 - - 1,990,384
Fund Prior to Actual Projected Projected Projected Projected Projected TotalType FY 2014 FY 2014 FY 2015 FY 2016 FY 2017 FY 2018 FY 2019
General - Special excl MITDPF 46,795 93,589 850,000 750,000 250,000 1,990,384 Special MITDPF - Federal - Reimbursable - Total 46,795 93,589 850,000 750,000 250,000 - - 1,990,384
Q00 - Public Safety and Correctional Services, Department of
IT Project Funding
This initiative supports the following MCE goal: A solution whose basic core capabilities address, at a minimum, the needs for all the following functions: a) Enterprise Resource Planning, b) Customer Relationship Management, and c) Integrates with other state of Maryland systems primarily FMIS.
Project Summary:
Appropriation Code: Q00A0107Sub-Program Code: 1190
Project Title: Enterprise Resource Planning Implementation Project (ERPIP)
This initiative will provide the ability for Maryland Correctional Enterprises (MCE) to revise and update its backend IT infrastructure, paper driven financial and manufacturing processes to better meet the needs of Maryland's correctional industries program. This initiative will allow more efficient management of an agency that currently generates over $50M per year in sales and services and employs over 2,000 inmates daily in Maryland's correctional facilities. The current paper driven process and computing platform cannot keep up with the volume of information and sales being generated by MCE. Project costs shown here reflect those for the entire project now that it is in PIR phase. The FY 2016 Allowance includes $50,000 for oversight.
IT Project Development Costs
Program Strategic Goals:
N.16

Fund Prior to Actual Appropriation Allowance Projected Projected Projected Total
Type FY 2014 FY 2014 FY 2015 FY 2016 FY 2017 FY 2018 FY 2019 General - Special excl MITDPF - Special MITDPF - Federal 6,857,258 970,086 1,325,000 300,000 9,452,344 Reimbursable - Total 6,857,258 970,086 1,325,000 300,000 - - - 9,452,344
Fund Prior to Actual Projected Projected Projected Projected Projected TotalType FY 2014 FY 2014 FY 2015 FY 2016 FY 2017 FY 2018 FY 2019
General - Special excl MITDPF - Special MITDPF - Federal 1,394,362 1,054,833 4,673,675 2,329,474 9,452,344 Reimbursable - Total 1,394,362 1,054,833 4,673,675 2,329,474 - - - 9,452,344
R00 - Maryland State Department of Education
Project Title: Enhanced Child Care Administration Tracking System II (eCCATS)Appropriation Code: R00A0106
This follow-on to the CCATS project will define and implement enhancements to the base CCATS system. The goal is to improve the operational efficiency, system performance and end-to-end support of MSDE child care business processes responsibilities. Critical new functionality will provide for enhanced subsidy payments processing and tracking, correction of deficiencies in the credentialing interface to FMIS and completing business object report development and implementation of a robust reporting architecture. MSDE's approach is to implement enhancements as funds become available. FY 2016 Allowance includes $50,000 for oversight.
IT Project Funding
Project Summary:Sub-Program Code: F700
Program Strategic Goals:R00A0101 Goal 1. Achievement will improve for each student.
IT Project Development Costs
N.17

Fund Prior to Actual Appropriation Allowance Projected Projected Projected Total
Type FY 2014 FY 2014 FY 2015 FY 2016 FY 2017 FY 2018 FY 2019 General 550,000 650,000 1,383,771 2,583,771 Special excl MITDPF - Special MITDPF - Federal - Reimbursable - Total - 550,000 650,000 1,383,771 - - - 2,583,771
Fund Prior to Actual Projected Projected Projected Projected Projected TotalType FY 2014 FY 2014 FY 2015 FY 2016 FY 2017 FY 2018 FY 2019
General 14,652 31,986 1,153,362 1,383,771 2,583,771 Special excl MITDPF - Special MITDPF - Federal - Reimbursable - Total 14,652 31,986 1,153,362 1,383,771 - - - 2,583,771
IT Project Development Costs
Program Strategic Goals:The three main objectives of this project are to: 1.) Integrate platforms for simplification, 2.) Eliminate extraneous databases, and 3.) Improve workflows
Step 1 (Planning) funding only
Sub-Program Code: 6618Project Summary:Baltimore City Community College (BCCC) will be replacing its administrative system, which consists of archaic and no longer supported discrete siloed modules. This legacy system was cobbled together beginning in the late 90’s and is mainframe and COBOL based. Maintaining this system is no longer a viable option, as companies that developed these systems are no longer providing support or are no longer in business. Project costs shown here reflect those for the PPR phase only. Full project design and implementation costs will be determined as part of the planning process, and total project cost will be adjusted at the conclusion of the PPR phase. This project is funded by current restricted/unrestricted funds. FY 2016 Allowance includes $208,751 for oversight.
IT Project Funding
R95 - Baltimore City Community College
Appropriation Code: R95C0006Project Title: Enterprise Resource Planning (ERP) System
N.18

Fund Prior to Actual Appropriation Allowance Projected Projected Projected Total
Type FY 2014 FY 2014 FY 2015 FY 2016 FY 2017 FY 2018 FY 2019 General 550,000 500,000 800,000 1,490,000 3,340,000 Special excl MITDPF - Special MITDPF - Federal - Reimbursable - Total - 550,000 500,000 800,000 1,490,000 - - 3,340,000
Fund Prior to Actual Projected Projected Projected Projected Projected TotalType FY 2014 FY 2014 FY 2015 FY 2016 FY 2017 FY 2018 FY 2019
General 1,050,000 1,130,000 1,160,000 3,340,000 Special excl MITDPF - Special MITDPF - Federal - Reimbursable 41,722 41,722 Total - 41,722 1,050,000 1,130,000 1,160,000 - - 3,381,722
The Environmental Permit Tracking System Modernization Project will modernize how MDE currently captures Departmental permit data through the use of Dot NET technologies. This modernization effort will update the existing PowerBuilder user interface (UI) with one developed using current Dot Net technologies. This project also supports the Web Revamp Project by making services such as ePermitting and eCommerce accessible to Maryland citizens, businesses, and other stakeholders through the use of an interactive, customer-centric, web-based portal. FY 2016 Allowance includes $50,000 for oversight.
Sub-Program Code: 3205
U00 - Environment, Department of
Project Title: Environment Permit Tracking System ModernizationAppropriation Code: U00A1002
Project Summary:
MDE’s goal is to reduce the level of effort required to enter data into our centralized permit tracking system and ensure the technologies that support MDE’s mission are cost effective and sustainable.
IT Project Funding
IT Project Development Costs
Program Strategic Goals:
N.19

Fund Prior to Actual Appropriation Allowance Projected Projected Projected Total
Type FY 2014 FY 2014 FY 2015 FY 2016 FY 2017 FY 2018 FY 2019 General 399,315 25,000 425,000 849,315 Special excl MITDPF - Special MITDPF - Federal 150,000 150,000 Reimbursable - Total 549,315 - 25,000 425,000 - - - 999,315
Fund Prior to Actual Projected Projected Projected Projected Projected TotalType FY 2014 FY 2014 FY 2015 FY 2016 FY 2017 FY 2018 FY 2019
General 399,315 25,000 425,000 849,315 Special excl MITDPF - Special MITDPF - Federal 150,000 150,000 Reimbursable - Total 549,315 - 25,000 425,000 - - - 999,315
The Maryland Department of Juvenile Services (DJS) has the ASSIST application, which is the main DJS client case management system. This system allows secure information sharing across the Maryland State government enterprise as well as other Federal agencies and private vendors. Its current platform is programmed in code that is classified as a “sunset” development platform by the Enterprise Architecture (EA) Repository. ASSIST and incorporated small applications, handle all business functions related to juvenile case work as well as the administrative functions of the agency. DJS uses numerous free standing applications; the ASSIST application has reached a saturation point with the complexities of these free standing incorporated systems. This has caused and continues to cause system errors, outages and frequent needs for maintenance. The current ASSIST system requires enhancements to address the new system complexities and to provide system stability. The FY2016 Allowance includes $50,000 for oversight.
Sub-Program Code: 2200
V00 - Juvenile Services, Department of
Project Title: Automated Statewide Support and Information Systems Tools (ASSIST) System UpgradeAppropriation Code: V00D0202
Project Summary:
This project supports each DJS program strategic goal through: 1.) Reduction of duplicate data entry; maximizing use of employee time; 2.) Secure information sharing across the Maryland state government enterprise as well as with other State and Federal government agencies and private vendors; 3.) Consistent data collection and reporting, resulting in standardized measures of outcome for strategic program goal performance, and 4.) Team programming methodology that will improve the efficiency of maintenance and future programming projects, as well as improved stability for daily operations.
IT Project Funding
IT Project Development Costs
Step 1 (Planning) funding only
Program Strategic Goals:
N.20

Fund Prior to Actual Appropriation Allowance Projected Projected Projected TotalType FY 2014 FY 2014 FY 2015 FY 2016 FY 2017 FY 2018 FY 2019
General 400,000 500,000 250,000 3,000,000 2,000,000 - 6,150,000 Special excl MITDPF - Special MITDPF - Federal 584,400 - 584,400 Reimbursable - Total 400,000 1,084,400 250,000 3,000,000 2,000,000 - - 6,734,400
Fund Prior to Actual Projected Projected Projected Projected Projected TotalType FY 2014 FY 2014 FY 2015 FY 2016 FY 2017 FY 2018 FY 2019
General 390,949 150,000 3,000,000 2,100,000 5,640,949 Special excl MITDPF - Special MITDPF - Federal 584,400 584,400 1,168,800 Reimbursable - Total - 975,349 1,234,400 3,000,000 2,100,000 - - 6,809,749
Program Strategic Goals:This project supports the MSP mission of: “protecting the citizens of the State of Maryland from foreign and domestic security threats, to fight crime, and to promote safety by upholding the laws of the State of Maryland.” It also establishes the system foundation that will ultimately provide the MSP the ability to meet the legislative requirements included in SB0281, The Firearm Safety Act of 2013.
The Maryland State Police (MSP) have been charged with automating and streamlining the process by which a citizen of Maryland requests approval to purchase a firearm. This will involve automating the 77R Process, replacing the hardcopy application form with a web accessible form that may be submitted electronically to MSP headquarters. Project costs shown here reflect those for the PPR and PIR phases. Full project design and implementation costs will be determined as part of the planning process, and total project cost will be adjusted at the conclusion of the PIR phase. FY 2016 Allowance includes $150,000 for oversightIT Project Funding
IT Project Development Costs
Sub-Program Code: 1133Project Summary:
Appropriation Code: W00A0112
W00 - State Police, Department of
Project Title: Automated Licensing and Registration Tracking System (ALRTS)
N.21

Prior to Actual Approp Allowance Projected Projected ProjectedFY 2014 FY 2014 FY 2015 FY 2016 FY 2017 FY 2018 FY 2019
D18 - Governor's Office for Children - 105,784 300,000 300,000 - - - 705,784 D38 - Board of Elections - 1,150,000 6,433,886 13,786,597 11,254,460 6,878,708 6,485,936 45,989,587 D80 - Insurance Administration 150,000 - 1,790,000 404,500 54,500 - - 2,399,000 E00 - Comptroller - - - 2,500,000 22,000,000 22,000,000 - 46,500,000 F10 - Budget & Mgmt 17,884,096 17,606,332 20,697,901 25,171,736 24,670,097 8,000,000 - 114,030,162 L00 - Agriculture - - - 156,600 - - - 156,600 M00 - Health & Mental Hyg 49,140,258 23,343,151 49,037,519 74,301,125 45,634,918 6,500,000 - 247,956,971 N00 - Human Resources - 350,000 480,000 1,353,000 - - - 2,183,000 P00 - Labor, Licens, Reg 957,090 851,000 12,417,500 8,479,870 24,310,991 24,700,000 5,700,000 77,416,451 Q00 - Public Safety 46,795 93,589 850,000 750,000 250,000 - - 1,990,384 R00 - Education 6,857,258 970,086 1,325,000 300,000 - - - 9,452,344 R95 - Baltimore City Comm College - 550,000 650,000 1,383,771 - - - 2,583,771 U00 - Environment - 550,000 500,000 800,000 1,490,000 - - 3,340,000 V00- Juvenile Services 549,315 - 25,000 425,000 - - - 999,315 W00 - State Police 400,000 1,084,400 250,000 3,000,000 2,000,000 - - 6,734,400 Total 75,984,812 46,654,342 94,756,806 133,112,199 131,664,966 68,078,708 12,185,936 562,437,769
Prior to Actual Projected Projected Projected Projected ProjectedFY 2013 FY 2013 FY 2014 FY 2015 FY 2016 FY 2017 FY 2018
D18 - Governor's Office for Children - 105,784 300,000 300,000 - - - 705,784 D38 - Board of Elections - 342,827 6,433,886 13,786,597 11,254,460 6,878,708 6,485,936 45,182,414 D80 - Insurance Administration 149,551 - 1,790,000 404,500 - - - 2,344,051 E00 - Comptroller - - - 2,500,000 22,000,000 22,000,000 - 46,500,000 F10 - Budget & Mgmt 16,339,451 13,130,309 24,535,993 25,473,336 23,907,209 9,157,390 96,734 112,640,422 L00 - Agriculture - - - 156,600 - - - 156,600 M00 - Health & Mental Hyg 49,140,258 23,279,151 49,101,519 74,301,125 45,634,918 6,500,000 - 247,956,971 N00 - Human Resources - - 830,000 1,353,000 - - - 2,183,000 P00 - Labor, Licens, Reg 714,329 215,800 12,867,500 8,314,870 24,310,991 24,700,000 5,700,000 76,823,490 Q00 - Public Safety 46,795 93,589 850,000 750,000 250,000 - - 1,990,384 R00 - Education 1,394,362 1,054,833 4,673,675 2,329,474 - - - 9,452,344 R95 - Baltimore City Comm College 14,652 31,986 1,153,362 1,383,771 - - - 2,583,771 U00 - Environment - 41,722 1,050,000 1,130,000 1,160,000 - - 3,381,722 V00- Juvenile Services 549,315 - 25,000 425,000 - - - 999,315 W00 - State Police - 975,349 1,234,400 3,000,000 2,100,000 - - 7,309,749 Total 68,348,713 39,271,350 104,845,335 135,608,273 130,617,578 69,236,098 12,282,670 560,210,017
Agency Total
Summary of Major IT Development Projects Funding by Agency
Agency Total
Summary of Major IT Development Projects Costs by Agency
N.22

Agency General Special excl. MITDPF
SpecialMITDPF Federal Reimbursable Total
D18 - Governor's Office for Children 300,000 - - - - 300,000 D38 - Board of Elections 6,893,299 6,893,298 - - - 13,786,597 D80 - Insurance Administration - 404,500 - - - 404,500 E00 - Comptroller 1,500,000 1,000,000 - - - 2,500,000 F10 - Budget & Mgmt - 3,173,055 - - 21,998,681 25,171,736 L00 - Agriculture 156,600 - - - - 156,600 M00 - Health & Mental Hyg 15,125,410 684,000 - 58,491,715 - 74,301,125 N00 - Human Resources 676,500 - - 676,500 - 1,353,000 P00 - Labor, License and Reg - - - 8,479,870 - 8,479,870 Q00 - Public Safety - 750,000 - - - 750,000 R00 - Education - - - 300,000 - 300,000 R95 - Baltimore City Comm College 1,383,771 - - - - 1,383,771 U00 - Environment 800,000 - - - - 800,000 V00 - Juvenile Services 425,000 - - - - 425,000 W00 - State Police 3,000,000 - - - - 3,000,000 Total 30,260,580 12,904,853 - 67,948,085 21,998,681 133,112,199
Agency General Special excl. MITDPF
SpecialMITDPF Federal Reimbursable Total
D18 - Governor's Office for Children 300,000 - - - - 300,000 D38 - Board of Elections 6,893,299 6,893,298 - - - 13,786,597 D80 - Insurance Administration - 404,500 - - - 404,500 E00 - Comptroller 1,500,000 1,000,000 - - - 2,500,000 F10 - Budget & Mgmt 10,000,000 3,173,055 - - 12,300,281 25,473,336 L00 - Agriculture 156,600 - - - - 156,600 M00 - Health & Mental Hyg 15,125,410 684,000 - 58,491,715 - 74,301,125 N00 - Human Resources 676,500 - - 676,500 - 1,353,000 P00 - Labor, License and Reg - - - 8,314,870 - 8,314,870 Q00 - Public Safety - 750,000 - - - 750,000 R00 - Education - - - 2,329,474 - 2,329,474 R95 - Baltimore City Comm College 1,383,771 - - - - 1,383,771 U00 - Environment 1,130,000 - - - - 1,130,000 V00 - Juvenile Services 425,000 - - - - 425,000 W00 - State Police 3,000,000 - - - - 3,000,000 Total 40,590,580 12,904,853 - 69,812,559 12,300,281 135,608,273
Funding Summary of Major IT Development Projects by Agency by Fund for FY 2016
Cost Summary of Major IT Development Projects by Agency by Fund for FY 2016
N.23

Agency Project General MITDPF
Special MITDPF Total
D18 - Governor's Office for Children State Children, Youth and Families Information System (SCYFIS) 300,000 300,000
D38 - Board of ElectionsNew Voting System Replacement (NVSR) (formerly known as Optical Scan Voting System Implementation)
6,893,299 6,893,299
E00 - Comptroller Integrated Tax System (ITS) 1,500,000 1,500,000
L00 - Agriculture MDA Telecomm/DataComm Upgrade 156,600 156,600
M00 - Health & Mental Hygiene Medicaid Enterprise Restructuring Project (MERP) 7,775,410 7,775,410
M00 - Health & Mental Hygiene Long Term Supports and Services Tracking System (LTSS) 7,350,000 7,350,000
N00 - Human Resources Automated Financial System (AFS) 676,500 676,500
U00 - Environment Environment Permit Tracking System Modernization 800,000 800,000
V00 - Juvenile Services Automated Statewide System and Information System Tools (ASSIST) System Upgrade 425,000 425,000
W00 - State Police Automated Licensing and Registration Tracking System (ALRTS) 3,000,000 3,000,000
Total 28,876,809 0 28,876,809
Summary of Major Information Technology Development Project Fund FY16 Allowances
Note: Table does not include radio money for the Statewide Public Safety Wireless Communications System / Wireless Interoperability project.
N.24

Ag # Agency Project Comment
M00 Health & Mental Hygiene MERP (MMIS) ICD-10 Remediation This project is in O & M. No development funding for FY16.
M00 Health & Mental Hygiene Financial Restructuring of the Developmental Disabilities Administration (DDA)
This project has been merged with the LTSS project beginning FY16.
N00 Human Resources Enterprise Content Management Solution (ECMS) This project is in O & M. No development funding for FY16.
R00 Education Educator Information System (EIS) Expansion - RTTT 49 This project is in O & M. No development funding for FY15.
W00 State Police Computer Aided Dispatch/Records Management System (CAD/RMS) This project is in O & M. No development funding for FY16.
W00 State Police IP Enabled Network for ANI/ALI (E911) This project is cancelled. No development funding for FY16.
Summary of Reclassified IT Projects
N.25

APPENDIX OHEALTH PLAN REVENUES AND EXPENDITURES FOR FISCAL YEARS 2014 - 2016
($ Millions)
FY 2015 FY 2016Projected Projected
Beginning Fund Balance $287.8 $215.8 $42.0
ReceiptsState Agencies $955.1 $931.8 $1,177.3
Employee $152.0 $160.5 $201.9
Retiree $79.2 $78.6 $99.4
Prescription Rebates, Audit Recoveries & Interest for Fund, & Other Adjustments 1 $61.6 $64.4 $57.4Total Receipts $1,247.9 $1,235.3 $1,536.0
Expenditures ($1,319.9) ($1,409.1) ($1,504.2)
Ending Fund Balance $215.8 $42.0 $73.8
Estimated Liabilities and Reserves 2 (105.5) (105.5) (105.5)
Fund Balance after IBNR $110.3 ($63.5) ($31.7)
FY 2014Actual
1 Other adjustments include one-time revenues and repayments, net receipts from direct pay andsatellite participants and EGWP adjustments that affect prescription rebates. 2 This amount is an estimate of the cost of services provided at the end of one fiscal year that are not billed until the next fiscal year. These costs are deducted from the end of year balance to better reflect an "available balance" amount, but are not actually expended and are reflected in the beginning fund balance of the following year.
O.1

FY 2014 FY 2015 FY 2016 FY 2017 FY 2018 FY 2019 FY 2020 FY 2021Actuals Appropriation Estimate Estimate Estimate Estimate Estimate Estimate
Beginning Balance (7/1) 4,093,479 14,160,686 11,782,003 16,458,606 18,656,594 19,210,854 19,742,096 18,218,067
MVA Registration Fees 69,682,869 69,675,000 71,069,000 72,793,046 72,601,485 74,517,092 74,517,092 75,411,528 Interest Income 44,660 193,122 244,962 347,675 374,925 385,673 375,843 332,947 Moving Violations Surcharge 60,180 3,881,849 3,881,849 3,881,849 3,881,849 3,881,849 3,881,849 3,881,849Current Year Revenues 69,787,709 73,749,970 75,195,810 77,022,570 76,858,259 78,784,613 78,774,783 79,626,323
MD Fire & Rescue Institute (UMCP) 7,632,523 8,076,992 8,161,493 8,400,074 8,645,629 8,898,363 9,158,484 9,426,210
MD Inst. of Emergency Medical Services 12,687,911 12,970,421 13,932,257 14,185,057 14,442,444 14,704,501 14,971,313 15,242,966
MD State Police Aviation Command 24,616,496 29,021,047 30,144,372 31,475,447 32,865,297 34,316,519 35,831,821 37,414,034
Shock Trauma Center (UMMS) 3,000,000 3,200,000 3,200,000 3,200,000 3,200,000 3,200,000 3,200,000 3,200,000
Amoss Grants (MEMA) 10,000,000 11,700,000 13,300,000 15,000,000 15,000,000 15,000,000 15,000,000 15,000,000
MSPAC CADS/RMS 102,685 21,000 100,865 47,600 77,500 71,030 71,030 71,030MSPAC 700 MHz Radios 988,516 MSPAC FTD Operating Cost 811,903 330,368 267,915 217,269 176,196
MIEMSS Communications Upgrade 1,680,887 8,555,803 37,500 12,500MIEMSS Communication Maintenance 1,594,874 1,642,720 1,692,001 1,742,761 1,795,044 1,848,895 1,904,362
Current Year Expenditures 59,720,502 76,128,653 70,519,207 74,824,582 76,303,999 78,253,371 80,298,812 82,434,799
Ending Balance (6/30)* 14,160,686 11,782,003 16,458,606 18,656,594 19,210,854 19,742,096 18,218,067 15,409,592
*Does not reflect Budget Bill reductions to the increment and for the 2% reduction in state salary schedules
APPENDIX PMARYLAND EMERGENCY MEDICAL SYSTEM OPERATIONS FUND
P.1

APPENDIX QSHARE OF THE STATE BUDGET FOR PUBLIC SAFETY AND SECURITY PROGRAMS
FY 2012 FY 2013 FY 2014 FY 2015 FY 2016EXPENDITURES EXPENDITURES EXPENDITURES APPROPRIATION ALLOWANCE
EXECUTIVE DEPARTMENT - BOARDS, COMMISSIONS AND OFFICES GOVERNOR'S OFFICE OF CRIME CONTROL AND PREVENTION* 102,417,668 97,426,067 117,506,968 117,139,488 120,917,687
MILITARY DEPARTMENT 140,080,567 159,097,984 84,271,333 76,262,824 114,556,558
DEPARTMENT OF GENERAL SERVICES OFFICE OF FACILITIES SECURITY* 11,513,459 11,470,750 11,788,443 11,802,444 12,541,110
DEPARTMENT OF NATURAL RESOURCES NATURAL RESOURCES POLICE* 39,222,314 39,335,956 37,655,351 41,876,068 43,652,488
DEPARTMENT OF TRANSPORTATION VARIOUS UNITS* 105,022,214 116,559,817 122,129,251 128,833,379 129,539,763
DEPARTMENT OF HEALTH AND MENTAL HYGIENE OFFICE OF PREPAREDNESS AND RESPONSE* 17,771,541 18,228,048 16,540,619 15,424,312 16,249,096
DEPARTMENT OF PUBLIC SAFETY AND CORRECTIONAL SERVICES 1,261,587,710 1,280,680,350 1,303,829,980 1,341,380,983 1,364,574,382
DEPARTMENT OF JUVENILE SERVICES 286,220,049 281,909,956 287,840,162 290,585,279 290,997,874
DEPARTMENT OF STATE POLICE 289,692,352 321,462,055 319,340,313 354,060,959 342,882,267
TOTAL 2,253,527,874 2,326,170,983 2,300,902,420 2,377,365,736 2,435,911,225
Plus Unallocated Additions MAJOR INFORMATION TECHNOLOGY DEVELOPMENT PROJECTS ** 12,614,268
GRAND TOTAL 2,253,527,874 2,326,170,983 2,300,902,420 2,377,365,736 2,448,525,493
Annual Percent Change 4.3% 3.2% -1.1% 3.3% 3.0%
*The FY15 and FY16 amounts shown for these units do not reflect across-the-board budget reductions taken, as agencies may implement those reductions differently in various units.
** Reflects funding of $750,00 for an enterprise resource planning system for Maryland Correctional Enterprises, $425,000 for an offender case management system for the Department of Juvenile Services,$8.4 million for 700 MHz Public Safety Communications System radios, and $3 million for an Automated Licensing and Registration Tracking System (ALRTS) for firearms purchases
Q.1

FY 2011 FY 2012 FY 2013 FY 2014 FY 2015 FY 2016EXPENDITURES EXPENDITURES EXPENDITURES EXPENDITURES APPROPRIATION ALLOWANCE
DEPARTMENT OF HUMAN RESOURCESWORK OPPORTUNITIES 32,821,542 35,491,150 35,506,752 34,565,742 34,919,145 33,331,529
DEPARTMENT OF LABOR, LICENSING, AND REGULATIONEMPLOYMENT ADVANCEMENT RIGHT NOW PROGRAM - - - 4,498,385 4,500,000 4,500,000 GOVERNOR'S WORKFORCE INVESTMENT BOARD 777,949 714,429 657,264 689,242 759,268 759,945 APPRENTICESHIP AND TRAINING 302,378 290,763 281,448 283,569 456,077 482,477 WORKFORCE DEVELOPMENT* 103,340,572 98,104,263 95,631,139 119,387,091 114,229,983 109,149,133 UNEMPLOYMENT INSURANCE 68,937,993 79,929,042 68,850,953 76,467,738 91,963,917 85,596,710
SUBTOTAL 173,358,892 179,038,497 165,420,804 201,326,025 211,909,245 200,488,265 DEPARTMENT OF PUBLIC SAFETY AND CORRECTIONAL SERVICES
MARYLAND CORRECTIONAL ENTERPRISES 47,389,459 52,361,066 50,603,196 49,855,015 55,682,220 57,839,262 STATE DEPARTMENT OF EDUCATION
DIV OF CAREER AND COLLEGE READINESS 3,117,323 3,276,304 3,379,659 3,149,529 3,298,031 3,144,023 DIV OF REHAB SERVICES-CLIENT SERVICES 37,379,700 37,174,211 35,037,240 35,146,821 38,694,050 32,518,545 DIV OF REHAB SERVICES-WORKFORCE AND TECHNOLOGY CENTER 8,632,954 8,717,347 8,695,295 8,627,277 9,305,032 9,305,032 DIV OF REHAB SERVICES-BLINDNESS AND VISION SERVICES 7,661,871 8,580,319 8,020,897 7,463,935 8,152,638 8,928,601 CHILD CARE SUBSIDY PROGRAM 107,776,337 86,363,313 75,377,422 81,588,355 82,954,599 92,491,139
SUBTOTAL 164,568,185 144,111,494 130,510,513 135,975,917 142,404,350 146,387,340 MORGAN STATE UNIVERSITY 195,464,703 209,557,992 211,340,381 211,020,012 221,786,014 136,165,670 ST. MARY'S COLLEGE OF MARYLAND 62,966,663 67,510,815 66,598,827 65,038,363 71,571,104 72,799,470 UNIVERSITY SYSTEM OF MARYLAND 4,440,139,817 4,607,921,001 4,713,577,174 4,789,471,671 4,998,122,351 5,192,308,466 MARYLAND HIGHER EDUCATION COMMISSION 430,629,504 442,313,852 440,836,304 468,591,193 473,081,467 462,577,121 BALTIMORE CITY COMMUNITY COLLEGE 94,739,705 90,590,600 80,630,221 85,280,224 89,960,279 89,655,893 DEPARTMENT OF BUSINESS AND ECONOMIC DEVELOPMENT
MD BIOTECH CENTER 3,596,606 3,498,152 3,305,173 3,692,821 3,779,009 3,791,358 PARTNERSHIP FOR WORKFORCE QUALITY 234,024 143,212 113,664 124,989 100,000 -
SUBTOTAL 3,830,630 3,641,364 3,418,837 3,817,810 3,879,009 3,791,358
GRAND TOTAL 5,645,909,100 5,832,537,831 5,898,443,009 6,044,941,972 6,303,315,184 6,395,344,374 ANNUAL PERCENT CHANGE 3.9% 3.3% 1.1% 2.5% 4.3% 1.5%*Includes Adult Continuing Education and Correctional Education
Note: This presentation reflects FY 2015 deficiencies and cost containment items, and FY 2016 contingent reductions for the University System of Maryland, Morgan State University, St. Mary's College of Maryland, the Maryland Higher Education Commission, and Baltimore City Community College. These measures are not reflected in the other programs listed in this appendix, because the dollar amount cannot be reliably established on a program level.
APPENDIX RSHARE OF STATE BUDGET FOR WORKFORCE DEVELOPMENT PROGRAMS
R.1

FY 2014 Actual
FY 2015 Appropriation
FY 2016 Allowance
Percent Change From 2014-2016
Department of Natural Resources 101,327,759 113,781,430 87,758,710 -13.4%Program Open Space 27,065,000 15,072,000 19,000,000 -29.8%Rural Legacy 13,512,000 16,034,000 18,205,649 34.7%Department of Planning 5,069,335 5,441,294 5,818,752 14.8%Department of Agriculture 41,995,484 49,692,876 45,858,189 9.2%Maryland Agricultural Land Preservation Foundation 35,712,218 26,497,512 33,487,050 -6.2%Maryland Department of the Environment 301,151,064 285,954,448 289,533,472 -3.9%Maryland State Dept of Education 416,945 416,945 416,945 0.0%Maryland Higher Education 20,387,021 29,616,355 29,978,014 47.0%Maryland Department of Transportation 172,258,000 330,383,000 482,797,000 180.3%Total 718,894,826 872,889,860 1,012,853,781 40.9%
FY 2014 Actual
FY 2015 Appropriation
FY 2016 Allowance
Percent Change From 2014-2016
General Fund 31,983,477 35,492,837 35,999,188 12.6%Special Fund 309,761,628 289,132,986 287,283,443 -7.3%Federal Fund 57,695,355 53,525,847 52,761,370 -8.6%Reimbursable Funds 7,985,344 25,298,835 26,432,766 231.0%Current Unrestricted 11,573,308 19,039,522 24,168,139 108.8%Current Restricted 8,813,713 10,576,833 5,809,876 -34.1%GO Bonds 118,824,000 109,440,000 97,602,000 -17.9%MDOT 172,258,000 330,383,000 482,797,000 180.3%Total 718,894,826 872,889,860 1,012,853,781 40.9%
FY 2014 Actual
FY 2015 Appropriation
FY 2016 Allowance
Percent Change From 2014-2016
Land Preservation 77,321,632 59,240,016 72,079,449 -6.8%Septic Systems 29,249,269 21,941,294 21,318,752 -27.1%Wastewater Treatment 262,525,003 253,165,476 257,789,190 -1.8%Urban Stormwater 81,342,596 88,823,150 63,186,057 -22.3%Agricultural BMPs 41,995,484 49,735,456 45,900,769 9.3%Oyster Restoration 15,179,640 15,416,205 13,096,557 -13.7%Transit & Sustainable Transportation Alternatives 135,027,000 275,563,000 429,245,000 217.9%Living Resources 43,871,479 66,177,516 66,713,910 52.1%Education and Research 20,803,966 30,033,300 30,394,959 46.1%Other 11,578,757 12,794,447 13,129,138 13.4%Total 718,894,826 872,889,860 1,012,853,781 40.9%
Appendix S
Notes: This presentation only includes state agency programs that have more than 50% of their activities directly related to Chesapeake Bay restoration. The FY 2016 allowance reflects contingent reductions in the Department of Natural Resources, Program Open Space, Rural Legacy, and the Maryland Agricultural Land Preservation Foundation. Funds reported that support personnel do not reflect across-the-board reductions in FY 2015 or FY 2016 associated with cost containment actions.
Category Summary
Fund Type Summary
Chesapeake Bay Restoration Activities Funded in the Budget
Total Funds
S.1

FY 2014 FY 2015 FY 2016Actual Appropriation Allowance
1. Tax Credits and Dues: RGGI Inc. Dues 450,000 450,000 450,000Electric Vehicle Tax Credits 1,287,000 1,287,000 1,287,000Electric Vehicle Charging Equip Tax Credit 600,000 600,000 600,000
2. Energy Assistance: Department of Human Resources 39,036,236 37,151,302 34,793,8853. Residential Rate Relief: Maryland Energy Administration - - -4. Maryland Energy Administration 10,367,691 10,605,000 10,605,000
Dept. Housing and Community Development 1,000,000 500,000 1,000,0005. Maryland Energy Administration 13,564,247 12,605,240 9,030,206
Department of General Services 426,928 1,472,988 481,627Department of Health and Mental Hygiene 3,485,245 3,485,245 3,485,245
6. Maryland Energy Administration 17,128,920 32,148,500 19,910,563Maryland Department of the Environment 2,510,546 3,000,000 3,243,521Public Service Commission 1,000,000 2,000,000 2,000,000
7. Administration: Maryland Energy Administration 4,505,134 6,157,299 5,288,490Total 95,361,947 111,462,574 92,175,537
RGGI Auctions
Allowances Sold Allowance Price Total RGGI Revenue
Fiscal Year 2014
Fiscal Year 2015
Fiscal Year 2016
21 8,739,921 $2.67 $23,335,589 $23,335,58922 8,739,920 $3.00 $26,219,760 $26,219,76023 4,842,487 $4.00 $19,369,948 $19,369,94824 3,725,941 $5.02 $18,704,224 $18,704,22425 3,725,942 $4.88 $18,182,597 $18,182,59726 3,725,942 $5.21 $19,412,159 $19,412,15927 3,041,179 $4.60 $13,986,207 $13,986,20728 3,041,179 $4.60 $13,986,207 $13,986,20729 3,041,179 $5.67 $17,244,831 $17,244,83130 3,041,179 $5.67 $17,244,831 $17,244,83131 2,971,421 $7.40 $21,975,169 $21,975,16932 2,971,421 $7.40 $21,975,169 $21,975,169
Regional Greenhouse Gas Initiative Auction Revenue: $87,629,521 $65,567,170 $78,439,999Set Aside Allowances Revenue: $3,240,000 $3,280,000 $3,362,000
RPS Alternative Compliance Payment Revenue: $0 $0 $0 Customer Investment Fund (CIF) Revenue: $5,364,000 $5,855,240 $3,280,206
Fund Interest Revenue: $1,080,000 $1,200,000 $1,200,000FERC Revenue: $0 $0 0%
Total SEIF Revenue: $97,313,521 $75,902,410 $86,282,205
Prior Fund Balance: $79,105,934 $83,120,134 $47,810,045* Italicized Numbers are Estimates End of Year Fund Balance: $83,120,134 $47,810,045 $43,869,894
Renewable Energy, Climate Change:
Energy Efficiency in All Sectors:
Low and Moderate Income Energy Efficiency:
STRATEGIC ENERGY INVESTMENT FUND (SEIF)FISCAL YEAR 2016
APPENDIX T
T.1

DHREnergy
AssistancePrior Year Program Reserve 25,959,003 7,130,984 5,579,916 11,542,211 3,826,584 54,038,697 Actual Auction Revenue 41,270,736 10,952,320 10,952,320 21,904,638 4,000,000 2,398,818 91,478,832 Transfer to RGGI, Inc. - Dues (450,000)Transfer for Excise Tax (1,287,000) (1,287,000)Transfer for EVSE Tax Credit (600,000) (600,000)Transfer to DHR (39,036,236) (39,036,236)Transfer to MEA (3,194,576) (1,302,561) (4,801,827) (3,418,562) (12,717,526)Transfer to DHCD (1,000,000) (1,000,000)Transfer to DGS (426,928) (426,928)Transfer to DHMH (3,485,163) (3,485,163)Transfer to MDE (2,454,000) (2,454,000)End of Year Net RGGI Revenue 28,193,503 13,888,728 11,317,584 26,191,021 4,408,022 61,818 84,060,676
Outstanding Encumbrances as of 6/30/2014 6,746,274 5,827,859 9,726,493 147,188 22,447,814 Available RGGI Revenue 28,193,503 7,142,454 5,489,724 16,464,528 4,260,834 61,818 61,612,862
DHREnergy
AssistancePrior Year Program Reserve 28,193,503 7,142,454 5,489,724 16,464,528 4,260,834 61,818 61,612,862 Projected Auction Revenue 33,255,085 7,063,771 7,063,771 14,127,543 5,000,000 2,337,000 68,847,170 Transfer to RGGI, Inc. - Dues (450,000) (450,000)Transfer for Excise Tax (1,287,000) (1,287,000)Transfer for EVSE Tax Credit (600,000) (600,000)Transfer to DHR (37,151,302) (37,151,302)Transfer to MEA (10,605,000) (5,250,000) (24,098,710) (5,907,224) (44,600,934)Transfer to DHCD (500,000) (1,500,000) (2,000,000)Transfer to DGS (1,052,369) (420,619) (1,472,988)Transfer to DHMH (3,485,245) (3,485,245)Transfer to MDE (3,000,000) (3,000,000)End of Year Net RGGI Revenue 24,297,286 3,101,225 1,265,881 3,493,361 2,932,991 61,818 36,412,563
DHREnergy
AssistancePrior Year Program Reserve 24,297,286 3,101,225 1,265,881 3,493,361 2,932,991 61,818 36,412,563 Projected Auction Revenue 39,732,500 8,683,125 8,683,125 17,366,250 5,000,000 2,337,000 81,802,000 Transfer to RGGI, Inc. - Dues (450,000) (450,000)Transfer for Excise Tax (1,287,000) (1,287,000)Transfer for EVSE Tax Credit (600,000) (600,000)Transfer to DHR (34,793,885) (34,793,885)Transfer to MEA (10,605,000) (5,750,000) (17,300,000) (5,022,915) (38,677,915)Transfer to DHCD (1,000,000) (1,000,000)Transfer to DGS (61,008) (420,619) (481,627)Transfer to DHMH (3,485,245) (3,485,245)Transfer to MDE (3,000,000) (3,000,000)End of Year Net RGGI Revenue 29,235,901 179,350 652,753 559,611 2,489,457 61,818 34,438,891
APPENDIX TREGIONAL GREENHOUSE GAS INITIATIVE (RGGI) REVENUE REPORT
AdministrationDescription E&C L&M EE Other Renewable
FISCAL YEAR 2014
ClearingAccount Total
Description
FISCAL YEAR 2016
FISCAL YEAR 2015
RenewableEE OtherE&C L&M
Description E&C L&M EE Other Renewable Total
Total
Administration
Administration
ClearingAccount
ClearingAccount
T.2

Employees FundsMaryland State Police Personnel 25 2,505,941$
Maryland State Police Operations 0 500,000$
Maryland State Police Sub-Total 25 3,005,941$
Maryland Department of Transportation Police Personnel 4 179,441$
Maryland Department of Transportation Police Operations 0 -$
Maryland Department of Transportation Police Sub-Total 4 179,441$
Department of Natural Resources Police Personnel 1 74,446$
Department of Natural Resources Police Operations 0 -$
Department of Natural Resources Police Sub-Total 1 74,446$
Total Personnel 30 2,759,828$ Total Operations 0 500,000$ Total Appropriation 30 3,259,828$
APPENDIX UMARYLAND COORDINATION AND ANALYSIS CENTER PERSONNEL AND OPERATIONS BUDGET
FY 2015
U.1
Appropriation: Th e amount of spending for an item legally authorized by the General Assembly.
Appropriated Positions: Synonymous with “authorized positions” (see below).
Authorized Positions: The number of full-time equivalent employees that may be employed at any one time on the regular State payroll. Th e number of authorized positions includes vacant positions. An agency may not exceed its total of authorized positions. Only the State’s Board of Public Works may increase the number of authorized positions during the fi scal year.
Budget Bill: Presents the Governor’s allowance as a bill that will become the legally enacted budget aft er the General Assembly approves it, including any amendments.
Budget Books: A series of volumes published each January that present the Governor’s allowance to the General Assembly for all appropriated programs in the budget as well as information on non-budgeted agencies.
Budget Book Appropriation: Refl ects the Legislative appropriation plus/minus amendments approved during the fi scal year prior to the budget submission. Th e amount appears in the annual Budget Books.
Capital Expenditure: An expenditure for the acquisition or construction of buildings or other fi xed assets, or for other tangible assets with a useful life of at least fi ft een years.
Contractual Positions: Th e number of full-time equivalent employees working under employment contracts. Agencies generally use contractual employees for tasks of a limited duration or seasonal nature. Contractual employees are not eligible for most State fringe benefi ts.
Current Restricted Funds: Funds that may be used by higher education institutions only for restricted purposes. Th ese consist principally of research grants and donations for particular purposes (i.e., student aid).
Current Unrestricted Funds: Funds that may be used by higher education institutions without restriction. Th ese consist principally of the State appropriation, tuition and student fees.
Defi ciency Appropriation: An appropriation for an expense in the current fi scal year that is not covered by the existing budget. Defi ciency appropriations usually occur when workloads exceed projected amounts, new legislation requires expenditures not provided in the budget or unanticipated needs arise. Th e FY 2016 budget proposal includes defi ciency appropriations for FY 2015.
Federal Funds: Grants and other payments from the federal government that fl ow through the State budget and are subject to applicable federal laws and regulations. Federal funds often require a State funding match. Medicaid and transportation programs are the largest sources of federal funding in the State budget.
Fiscal Digest: Book published annually by July 1 which refl ects the State Budget enacted by the Legislature for the new fi scal year.
Fiscal Year (FY): Th e calendar on which the State operates for fi nancial purposes. Maryland’s fi scal year begins on July 1 and ends on June 30. Th us fi scal year 2016 (FY 2016) begins on July 1, 2015 and continues until June 30, 2016.
Full-Time Equivalent (FTE): A method of calculating employment, workloads, enrollments or caseloads to adjust for part-time or part-year participation.
Glossary

For example, part-time or part-year employees are factored according to the share of a full 2,080-hour year during which they are employed. A seasonal employee who works twenty hours a week for one-half of the year would count as a 0.25 full-time equivalent.
General Fund: State funds that may be used for any activity of the State. State income and sales tax revenues are the primary sources of General Funds. About half of State spending is attributable to the General Fund.
Governor’s Allowance: Th e amount proposed by the Governor for an item in the State budget. In most instances the General Assembly may subtract from but may not add to the allowance.
Non-budgeted Funds: Some agencies have independent authority to make expenditures without legislative appropriations. Examples include the Injured Workers’ Insurance Fund (which provides workers’ compensation insurance) and the Maryland Transportation Authority (which operates certain bridges, tunnels and other transportation facilities). Th ese agencies have independent revenue sources (i.e., insurance premiums, toll revenues) and are presented in the budget for information purposes only.
Operating Expenditure: As distinguished from “capital expenditures,” these are expenses of ongoing operations of government and other expenditures that do not result in a tangible fi xed asset with a useful life of at least fi ft een years.
Reimbursable Funds: Funds transferred among agencies as payments for services provided by one agency to another. Th is designation is used to avoid double-counting funds on a state-wide basis
as reimbursable funds are not generally included in budget totals. An example is telephone service. Each operating agency pays the Department of Information Technology for the actual cost of its telephone usage from its general, special or federal funds. Th e Department of Information Technology, in turn, pays the telephone service provider with reimbursable funds.
Request: In the fall State agencies submit a budget request at a targeted amount specifi ed for the next fi scal year.
Special Funds: Revenues dedicated to a specific purpose, such as licensing fees or certain tax revenues that may only be used for the purposes designated by law.
Abbreviations CRF - Current Restricted Funds
CUF - Current Unrestricted Funds
FF - Federal Funds
FY - Fiscal Year
FTE - Full-time Equivalent
GF - General Funds
NBF - Non-budgeted Funds
SF - Special Funds
RF - Reimbursable Funds
GlossaryGlossary

DEPT. OF INFORMATION TECHNOLOGYBruce Eikenberg, Director of DoIT/DBM Desktop ServicesJerome ArchibaldAntoine Wilson
OFFICE OF BUDGET ANALYSISMarc Nicole, Executive DirectorKurt Stolzenbach, Assistant DirectorJonathan Martin, Assistant DirectorCheri Gerard, Assistant DirectorAaron BarkerNathan BowenJordan ButlerMeredith DeckerCarolyn EllisonPhilip GallegosKimberly GrandyDonna LeeChristian LundJennifer McIlvaineAngela MillerTaylor MurrayVanessa Plante-McDonaldCarissa RalbovskyMatthew SchmidAshley Chunli ShenAshali SinghamShane SpencerAndrea Th omsonJaclin Warner Wiggins
OFFICE OF CAPITAL BUDGETTeresa Garraty Executive DirectorNeil Bergsman, Assistant DirectorNicholas AndersonKatherine Bryant Fiona BurnsJonathan FergusonSusan GoreSoren GraaeKwame KwakyeJordan RobertsShakia Word EDITORS
Robin SabatiniTeresa Milio Birge
EDITORIAL ASSISTANCESteve CrimAdam DubitskyCheri GerardHannah MaarJennifer McIlvaine Mark Newgent Craig Williams
David R. BrinkleySecretary of Budget and Management
DIVISION OF FINANCE AND ADMINISTRATIONKen Smith, DirectorMary O’Neill, Deputy DirectorRob HaydenKathrine Th omsonKyle Krannebitter
On behalf of the Budget Transition Team, I wish to acknowledge the extraordinary assistance and cooperation we received from the Department of Budget and Management, particularly from Secretary T. Eloise Foster, Marc Nicole, Jonathan Martin, and Terri Garraty.
I also thank Warren Deschenaux, Director of the Offi ce of Policy Analysis at the Department of Legislative Services, and his staff for their invaluable assistance and advice as well.
Preparing this budget simply could not have been completed without the superb work of a small group of volunteers whose experience and institutional knowledge made possible the creation of this transformative budget which is herein submitted.
A special recognition goes to Senator Bobby Neall, appointed by Governor Hogan to lead his budget transition team. His wisdom, dedication, and hard work were invaluable to completing this budget.
I also wish to thank my colleagues, Senator Joseph Getty, Senator Marty Madden, former Delegate Timothy Maloney, Louise Hayman and Nicki McCann, who worked tirelessly on this project. Th e task required a combination of cre-ativity and expertise, long hours and hard work from many people.
It is our expectation that this budget will be a strong fi rst step in remediating the State’s fi nances and will well serve the people of Maryland.
Acknowledgements
BUDGET TRANSITION TEAM
Senator Robert R. NeallSenator David R. BrinkleySenator Joseph M. Getty Senator Martin G. MaddenFormer Delegate Timothy F. MaloneyLouise L. HaymanNicole McCann