
th Annual Wisconsin Local Food Summit - · PDF file1. Hunger Task Force Mission 2. Scope of...
47
6 th Annual Wisconsin Local Food Summit January 27, 2012
Transcript of th Annual Wisconsin Local Food Summit - · PDF file1. Hunger Task Force Mission 2. Scope of...
6th Annual Wisconsin Local Food Summit
January 27, 2012

1. Hunger Task Force Mission
2. Scope of Hunger & Poverty
3. Impact & Cost of Hunger
4. Food Banking
5. Public Policy Advocacy
www.hungertaskforce.org

Mission: Ending Hunger Today…Preventing Hunger Tomorrow
Founded: 1974…Grassroots task force on school breakfast
Services: Dual purpose agency
Anti-Hunger Advocacy Work
www.hungertaskforce.org

Mission: Ending Hunger Today…Preventing Hunger Tomorrow
Founded: 1974…Grassroots task force on school breakfast
Services: Dual purpose agency
Anti-Hunger Advocacy Work
Emergency Food Provision
(1982)
www.hungertaskforce.org

DEFINITIONS

“Food security exists when all people, at
all times, have physical, social and
economic access to sufficient, safe and
nutritious food to meet their dietary
needs and food preferences for an active
and healthy life.”
United Nation's Food and Agriculture
Organization
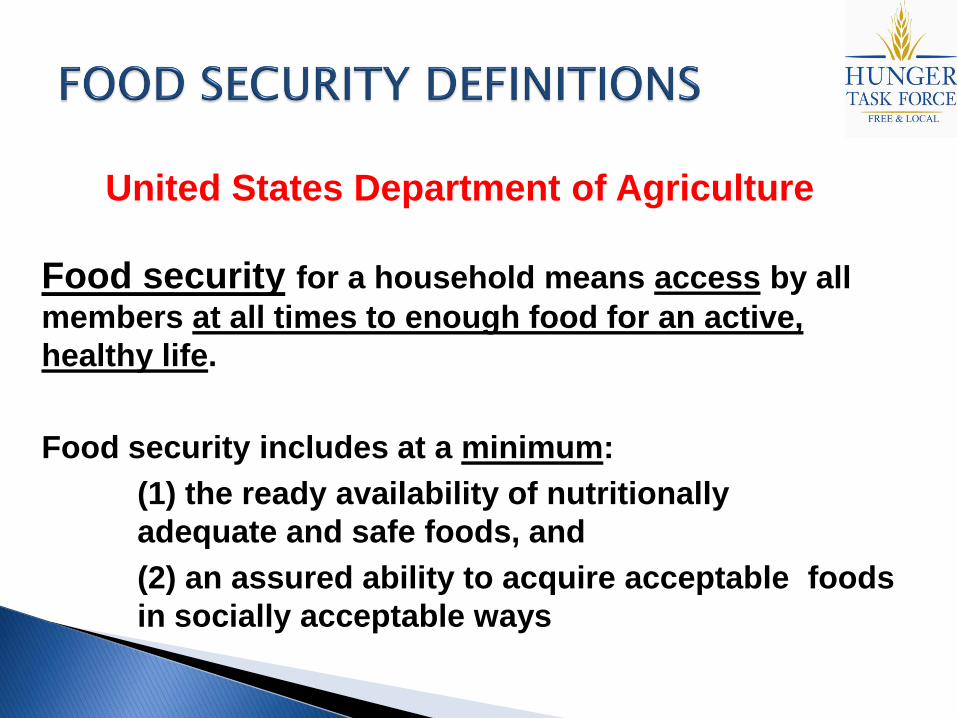
Food security for a household means access by all
members at all times to enough food for an active,
healthy life.
Food security includes at a minimum:
(1) the ready availability of nutritionally
adequate and safe foods, and
(2) an assured ability to acquire acceptable foods
in socially acceptable ways
United States Department of Agriculture

Very Low Food Security:
One or more people in the household
were hungry over the course of the
year because of the inability to afford
enough food.
United States Department of Agriculture

SCOPE OF
POVERTY
AND
HUNGER

NATIONAL STATISTICS - 2011
48.8 million people living in food insecure households (up from 36.2 million in 2007)
32.4 million adults 16.2 million children
17 million people lived in households that were considered to have “very low food security”
Data Source: U.S. Department of Agriculture 2012

NATIONAL STATISTICS
Very low food security had been getting worse even
before the current recession.
o The number of people in the Very low food category
in 2008 was more than double the number in 2000.
o Black (25.1 percent) and Hispanic (26.2 percent)
households experienced food insecurity at far higher
rates than the national average.
Data Source: U.S. Department of Agriculture 2011
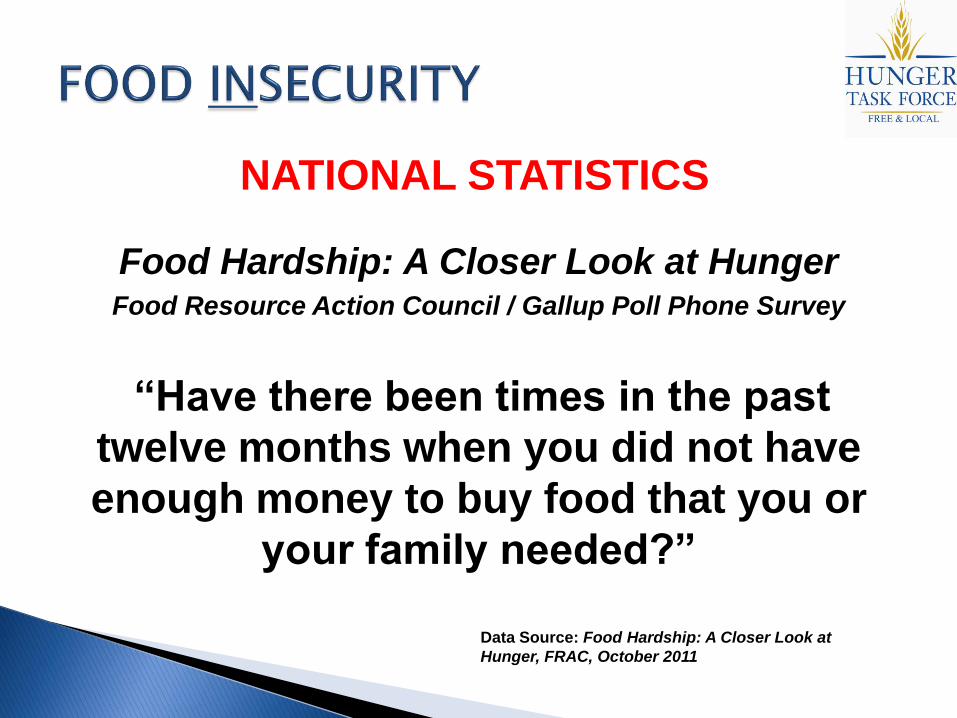
NATIONAL STATISTICS
Food Hardship: A Closer Look at Hunger Food Resource Action Council / Gallup Poll Phone Survey
“Have there been times in the past
twelve months when you did not have
enough money to buy food that you or
your family needed?”
Data Source: Food Hardship: A Closer Look at
Hunger, FRAC, October 2011

NATIONAL STATISTICS
Food Hardship: A Closer Look at Hunger
Food Hardship Rates for the Nation
2008 17.8 percent of households
2009 18.3 percent
2010 18.0 percent
Data Source: Food Hardship: A Closer Look at
Hunger, FRAC, August 2011

NATIONAL STATISTICS
“Food Hardship: A Closer Look at Hunger”
Food Hardship Rates Higher for Households With Children
2009 - 2010
23.4 percent of Households with Children
- vs. -
14.9 percent of Households without Children
Data Source: Food Hardship: A Closer Look at Hunger,
Food Resource Action Council, August 2011

WISCONSIN STATISTICS
“Food Hardship: A Closer Look at Hunger”
Food Hardship Rates for Wisconsin Households
2009 - 2010
22.1 percent of Households with Children
- vs. -
12.3 percent of Households without Children
Data Source: Food Hardship: A Closer Look at Hunger,
Food Resource Action Council, August 2011

2011 Federal Poverty Level Guidelines
Persons
in Household Annual Income Per Month
Hourly Wage
1 $10,890 $907.50 $5.67
2 14,710 1225.83 7.66
3 18,530 1544.17 9.65
4 22,350 1862.50 11.64
5 26,170 2180.83 13.63
6 29,990 2499.17 15.62
7 33,810 2817.50 17.61
8 37,630 3135.83 19.60
For each additional
person, add 3,820 318.33 1.99
www.hungertaskforce.org
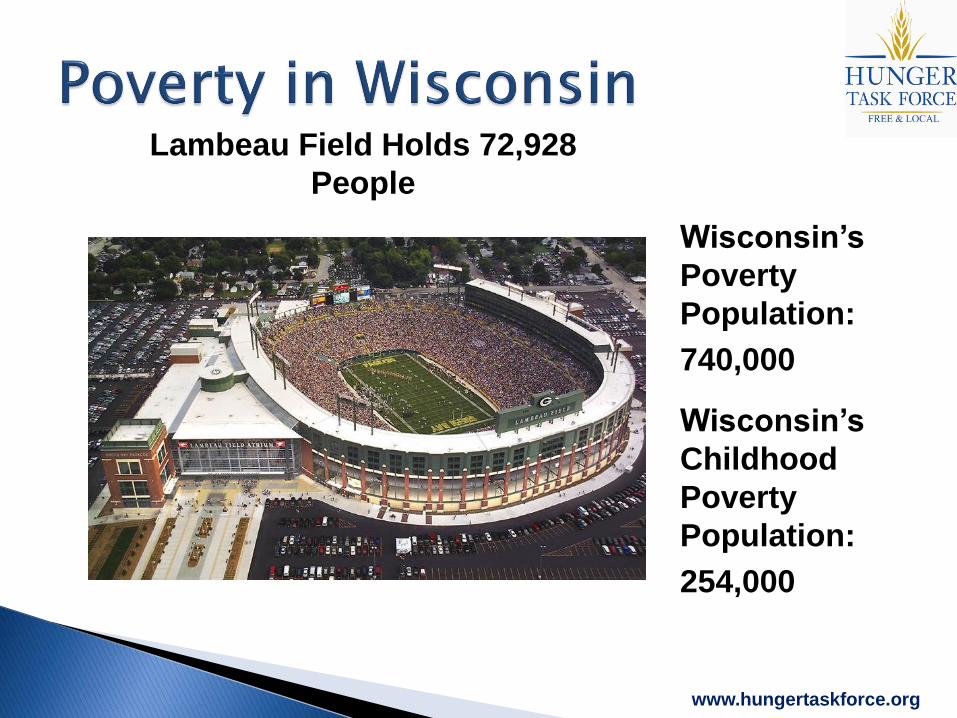
Wisconsin’s
Poverty
Population:
740,000
www.hungertaskforce.org
Lambeau Field Holds 72,928
People
Wisconsin’s
Childhood
Poverty
Population:
254,000

Wisconsin’s
740,000 Poor
Residents Would
Fill 10 Lambeau
Stadiums
www.hungertaskforce.org
Wisconsin’s 254,000 Poor
Children Would Fill 3 & 1/2
Lambeau Stadiums
22% of Wisconsin families with children
struggle to afford enough food.

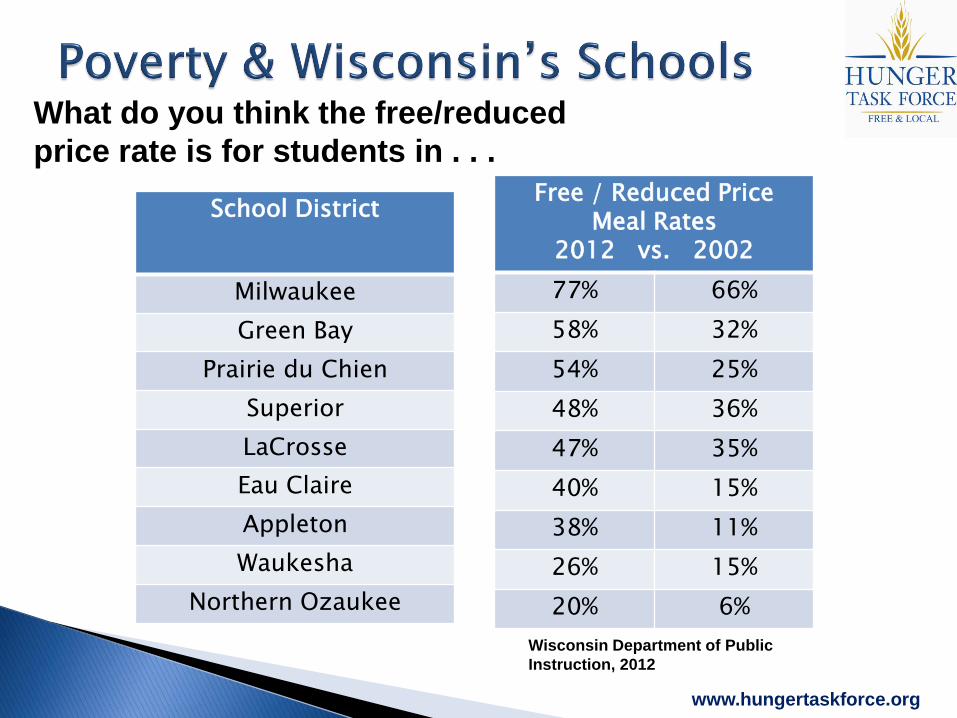
39% Wisconsin children currently eligible for free or reduced price school meals at their public schools Wisconsin Department of Public Instruction, 2012
www.hungertaskforce.org
www.hungertaskforce.org
School District
Milwaukee
Green Bay
Prairie du Chien
Superior
LaCrosse
Eau Claire
Appleton
Waukesha
Northern Ozaukee
Free / Reduced Price Meal Rates
2012 vs. 2002
77% 66%
58% 32%
54% 25%
48% 36%
47% 35%
40% 15%
38% 11%
26% 15%
20% 6%
What do you think the free/reduced
price rate is for students in . . .
Wisconsin Department of Public
Instruction, 2012
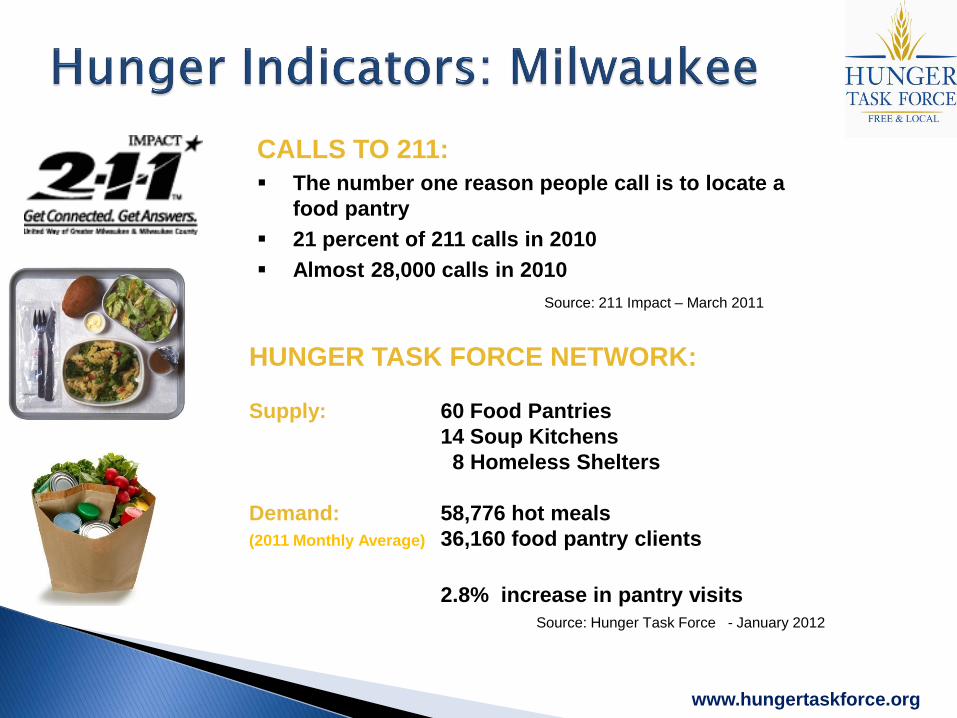
HUNGER TASK FORCE NETWORK:
Supply: 60 Food Pantries
14 Soup Kitchens
8 Homeless Shelters
Demand: 58,776 hot meals
(2011 Monthly Average) 36,160 food pantry clients
2.8% increase in pantry visits
Source: Hunger Task Force - January 2012
CALLS TO 211:
The number one reason people call is to locate a
food pantry
21 percent of 211 calls in 2010
Almost 28,000 calls in 2010
Source: 211 Impact – March 2011
www.hungertaskforce.org
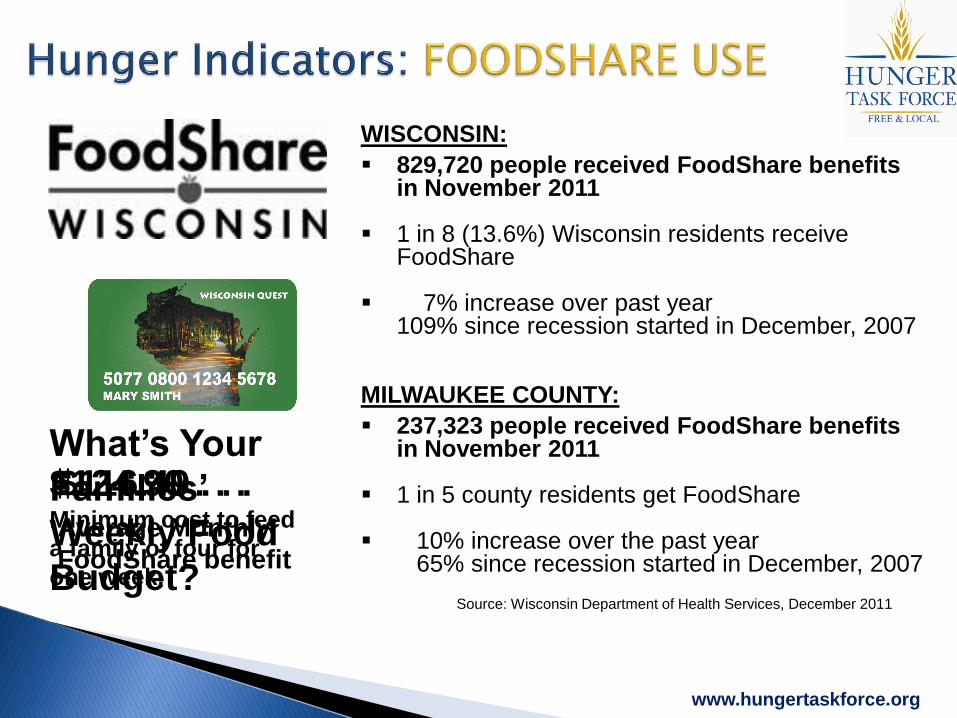
WISCONSIN:
829,720 people received FoodShare benefits in November 2011
1 in 8 (13.6%) Wisconsin residents receive FoodShare
7% increase over past year 109% since recession started in December, 2007
MILWAUKEE COUNTY:
237,323 people received FoodShare benefits in November 2011
1 in 5 county residents get FoodShare
10% increase over the past year 65% since recession started in December, 2007
Source: Wisconsin Department of Health Services, December 2011
$116.49 . . . Average Monthly
FoodShare benefit
$124.90 . . . Minimum cost to feed
a family of four for
one week.
www.hungertaskforce.org
What’s Your
Families’
Weekly Food
Budget?

WISCONSIN STATISTICS
“Food Hardship: A Closer Look at Hunger”
Food Hardship Rates for Wisconsin Households
2009 - 2010
22.1 percent of Households with Children
- vs. -
12.3 percent of Households without Children
Data Source: Food Hardship: A Closer Look at Hunger,
Food Resource Action Council, August 2011

HUNGER’S
COST

HUMAN IMPACT
Joint Analysis: Center on Hunger and Poverty at Brandeis
University and the Food Research and Action Center
Pregnant women who are undernourished:
Are more likely to have low-birthweight
babies
Experience higher infant mortality rates
On Mothers and Babies

HUMAN IMPACT
Joint Analysis: Center on Hunger and Poverty at Brandeis
University and the Food Research and Action Center (FRAC)
Hungry Children Suffer:
Two to four times as many individual health problems Stunting (low height for age) in children results from inadequate nutrition Higher rates of iron-deficiency anemia
On the Health of Children

HUMAN IMPACT
Joint Analysis: Center on Hunger and Poverty at Brandeis
University and the Food Research and Action Center (FRAC)
Hunger slows / delays the cognitive development
of children
Hungry children are more likely to be ill and absent
from school
Hunger diminishes children's ability to learn in
school
On the Education of Children

HUMAN IMPACT
Joint Analysis: Center on Hunger and Poverty at Brandeis
University and the Food Research and Action Center (FRAC)
Hungry children are more likely to ‘act out’ / cause
behavioral problems in school
Hungry children are less likely to interact with
other people or explore or learn from their
surroundings. This interferes with their ability to
learn from a very early age.
On the Education of Children
HUMAN IMPACT
Joint Analysis: Center on Hunger and Poverty at Brandeis
University and the Food Research and Action Center (FRAC)
Hunger causes lost knowledge, brainpower
and productivity for the nation
Hunger and malnutrition exacerbate chronic
and acute diseases and speed the onset of
degenerative diseases among the elderly.
On Adults

ECONOMIC IMPACT
Center for American Progress | Hunger in America: Suffering We Are All Paying For, October 2011, pg 9
Table 2
America’s hunger bill
Costs of hunger, 2007 and 2010 (In billions of 2010 dollars)
Component 2007 2010 Increased
cost
Percent increase
Illness costs $98.40 $130.50 $32.10 33%
Education and related costs $13.90 $19.20 $5.30 38%
Charity costs $13.20 $17.80 $4.60 35%
Total hunger bill $125.50 $167.50 $42.00 33%

ECONOMIC IMPACT
Center for American Progress | Hunger in America: Suffering We Are All Paying For, October 2011, pg. 1
“This $167.5 billion does not include the
cost of the Supplemental Nutrition
Assistance Program and the other key
federal nutrition programs, which run at
about $94 billion a year.”
TOTAL COST: $261.5 billion dollars

www.hungertaskforce.org

“My daughter is 10. She says, ‘Daddy, do you
wanna talk about it,’ I just tell her to eat up.”
“It’s about sacrificing. I guess you could say I’m
fasting ’cus I haven’t ate in 2 days.”
www.hungertaskforce.org

“I’m only 22. I had to
drop out of college to
get a job. I won’t stop
dreaming though.”
“I don’t have anyone to help me. One
week I fell down my porch stairs and
couldn’t get to the pantry. I don’t wanna
talk about how I ate that month.”
“If I make one dollar
over what SSI says,
they will cut my
disability off! If I get
food stamps I can’t pay
my rent. Rent or
food?”
www.hungertaskforce.org

“It’s hard to
make $100
worth of
groceries
stretch for a
month when
you have 2
boys. Most
days, I’ll skip
meals so my
boys can eat.”
“I’m a first
timer. I’m
ashamed to
come here. I
feel like
there are so
many other
people who
need this
food more
than I do.”
www.hungertaskforce.org

www.hungertaskforce.org
ENDING HUNGER TODAY

Federal Commodities
Purchasing
Donations
Farm & Fish Hatchery
82 Pantries,
Soup Kitchens &
Homeless Shelters
9.7 Million Lbs.
of Food in 2010 - 2011 Serving
9200+
Seniors
www.hungertaskforce.org 99 Sites
16% Increase Over
2009 - 2010

www.hungertaskforce.org
PREVENTING HUNGER
TOMORROW
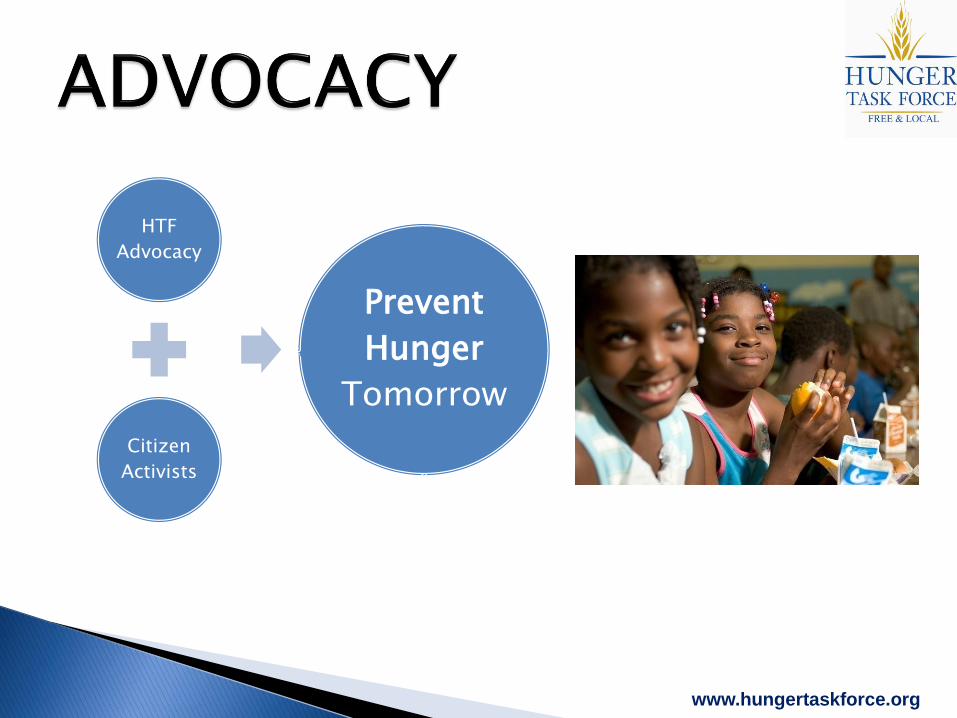
HTF
Advocacy
Citizen
Activists
Prevent
Hunger
Tomorrow
www.hungertaskforce.org

Summer Meals Women, Infants
and Children School Meals
Child and Adult Care
Food Program
Food Share The Emergency Food
Assistance Program
www.hungertaskforce.org
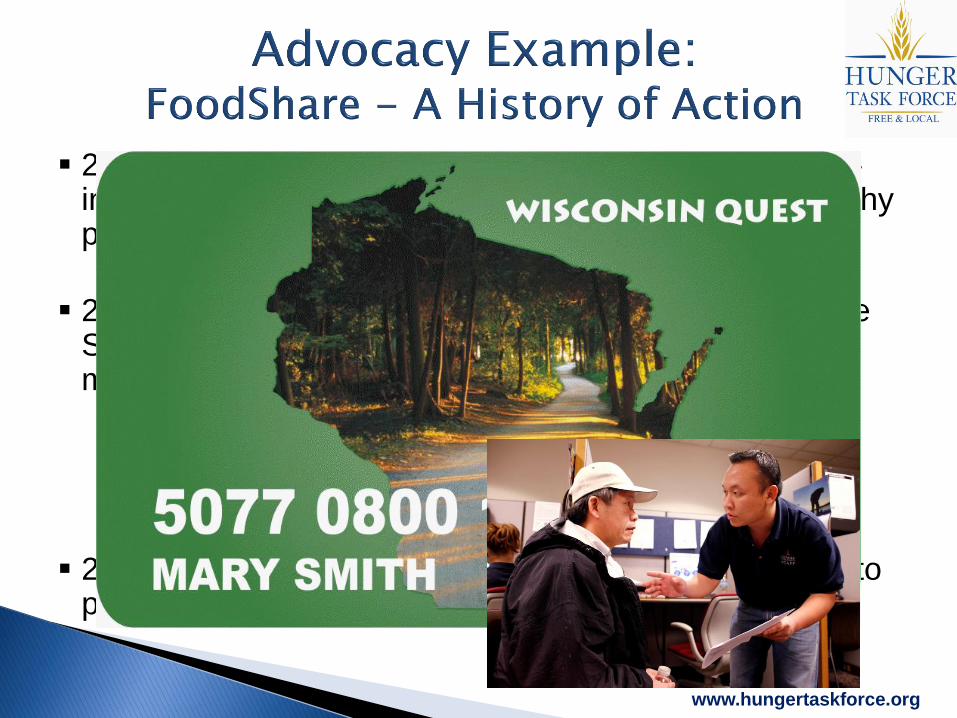
2000: Brought EBT technology to Fondy Food Center – increasing FoodShare customers access to fresh, healthy produce
2009 – Present: Tested and implemented a Self-Service Site strategy that allows FoodShare customers to manage their own cases using internet technology at: Marcia P. Coggs Human Service Center
Robles Center
UMOS
2001 & 2011: Successfully resisted efforts by the state to privatize FoodShare
www.hungertaskforce.org

FOODSHARE AT RISK
Governor Scott Walker Executive Order # 2 created the
Governor's Commission on Waste, Fraud and Abuse
Final report was released Friday January 6th
FoodShare is a targeted
www.hungertaskforce.org

What Are the Commission’s
FoodShare Recommendations?
Photo ID
Charging a fee for
replacement Quest
cards
More frequent re-
certification
More paperwork
Republicans want to require photos on FoodShare, BadgerCare Plus cards Backers say it will cut fraud; others cite cost By Jason Stein of the Journal Sentinel
May 5, 2011
Madison — Republican lawmakers want to reduce fraud by requiring photos on the
benefits cards used for food assistance and health care programs.
The proposed amendment to the state budget would require all participants in the programs to carry their photo on the FoodShare Quest card and BadgerCare Plus Forward card. In making the proposal Thursday, Rep. John Nygren (R-Marinette) and Rep. Howard Marklein (R-Spring Green) cited a recent Milwaukee Journal Sentinel investigation raising concerns about FoodShare participants selling their benefits to others.

FoodShare Advocacy - 2012:
Contact the Governor’s office and your state
representatives.
Tell them you are opposed to the report’s
recommendations that increase the size and
cost of state government.
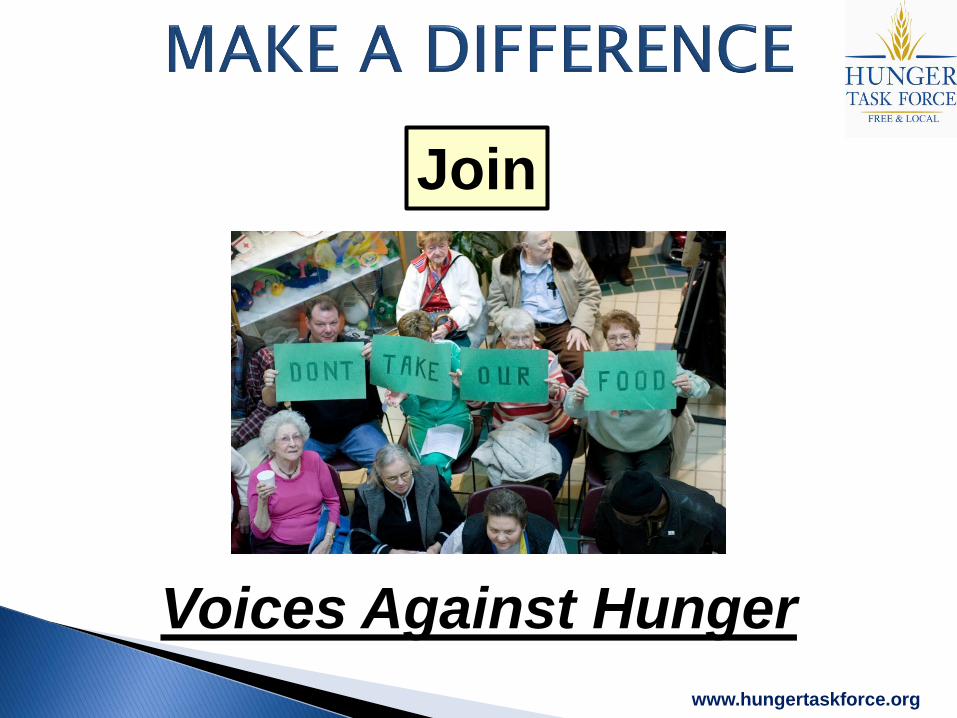
Voices Against Hunger
www.hungertaskforce.org
Join

Voices members receive regular updates on hunger issues, and training in how to be advocates.
www.hungertaskforce.org
Hunger Task Force provides advocacy training for Voices members.

Kevin Ronnie
Hunger Task Force
201 S. Hawley Court
Milwaukee, WI 53214
(414) 238-6470
www.hungertaskforce.org


