Hunger under nutrition and food security in India under nutrition and food... · Hunger,...
63
1 Draft Hunger, Under-nutrition and Food Security in India NC Saxena Contents 1 Executive Summary 2 1.1 Policy recommendations 3 2 Understanding hunger 5 3 Dimensions of hunger 8 3.1 Self-reported hunger 8 3.2 Measuring hunger by calorie consumption 10 3.2.1 How many calories are needed for healthy living? 13 3.2.2 The official poverty line 15 3.3 IFPRI’s composite index on hunger 16 3.4 BMI 17 3.5 Undernourished children 20 3.6 Women’s malnutrition 24 3.7 Child mortality 26 4 Food security 27 4.1 Consumption and prices 27 4.2 Food production, procurement and availability at the macro-level 29 4.2.1 Recent developments and imports 33 4.3 Global developments 34 4.3.1 Recent global financial crisis 34 4.4 Future scenario for India’s food production 36 5 Analysis of major programmes and policy options 36 5.1 Agricultural production 36 5.1.1 What needs to be done? 39 5.2 Agricultural labour and wage employment programmes 41 5.3 Public Distribution System (PDS) 43 5.3.1 Policy and procedural reforms 45 5.4 Fighting children’s malnutrition 47 5.5 Mid Day Meal Scheme (MDM) 50 5.6 Tribals and hunger 52 6 Supreme Court intervention 54 7 Improving accountability 56 7.1 Destitutes 56 7.2 Problems of delivery and implementation 58 8 Abbreviations 60 9 Bibliography 61
-
Upload
phungxuyen -
Category
Documents
-
view
218 -
download
1
Transcript of Hunger under nutrition and food security in India under nutrition and food... · Hunger,...

1
Draft
Hunger, Under-nutrition and Food Security in India NC Saxena
Contents
1 Executive Summary 2 1.1 Policy recommendations 3
2 Understanding hunger 5 3 Dimensions of hunger 8
3.1 Self-reported hunger 8 3.2 Measuring hunger by calorie consumption 10
3.2.1 How many calories are needed for healthy living? 13 3.2.2 The official poverty line 15
3.3 IFPRI’s composite index on hunger 16 3.4 BMI 17 3.5 Undernourished children 20 3.6 Women’s malnutrition 24 3.7 Child mortality 26
4 Food security 27 4.1 Consumption and prices 27 4.2 Food production, procurement and availability at the macro-level 29
4.2.1 Recent developments and imports 33 4.3 Global developments 34
4.3.1 Recent global financial crisis 34 4.4 Future scenario for India’s food production 36
5 Analysis of major programmes and policy options 36 5.1 Agricultural production 36
5.1.1 What needs to be done? 39 5.2 Agricultural labour and wage employment programmes 41 5.3 Public Distribution System (PDS) 43
5.3.1 Policy and procedural reforms 45 5.4 Fighting children’s malnutrition 47 5.5 Mid Day Meal Scheme (MDM) 50 5.6 Tribals and hunger 52
6 Supreme Court intervention 54 7 Improving accountability 56
7.1 Destitutes 56 7.2 Problems of delivery and implementation 58
8 Abbreviations 60 9 Bibliography 61

2
1 Executive Summary
This paper examines the hunger and nutrition situation prevailing in India and suggests policy measures for ensuring adequate food security at the household level, particularly for marginalised groups, destitutes, women and children.
Despite rapid economic growth in the last two decades India is likely to slip behind the MDG target of cutting the proportion of hungry people by half. Per capita availability as well as consumption of foodgrains in India has declined since 1996; the percentage of underweight children has remained stagnant between 1998 and 2006; and the calorie consumption of the bottom half of the population has been consistently going down since 1987. In short, all indicators point to the hard fact that endemic hunger continues to afflict a large proportion of Indian population.
Hunger in simple terms is the desire to consume food. However due to continued inadequacy in diet human body gets used to having less food than necessary for healthy development, and after a while the body does not even demand more food. In such cases hunger is not expressed, though lower intake of essential calories, proteins, fats, and micro-nutrients would result in under-development of the human mind and body. Thus objective indicators such as calorie consumption, body mass index (BMI), proportion of malnourished children, and child mortality capture hunger more scientifically than the subjective articulation by individuals.
Surveys on self-reported hunger depend on the responses of the head of the household, often a man, who may not admit that he cannot provide even two square meals to their dependents. Issues of pride, self-image and dignity are involved here, which leads to a deep sense of shame and reluctance on the part of the head of the households to publicly admit their incapacity to provide for their families. This may result in under-reporting on the number of meals family members are able to afford. Despite this limitation, a recent UNDP survey (2008) of 16 districts in the seven poor states of India showed that for 7.5 per cent of respondents access to food is highly inadequate, and for another 29 per cent of the households it is somewhat inadequate. A West Bengal government survey too reported 15 per cent families facing difficulties in arranging two square meals a day for all months in a year. These figures are far more gloomy than the NSSO survey of the Ministry of Programme Implementation and Statistics claiming a drastic decline in self-reported hunger in India from 16.1 to 1.9 percent in the last twenty years.
However, NSSO’s calorie data shows that at any given point of time calorie intake of the poorest quartile continues to be 30 to 50 percent less than the calorie intake of the top quartile of the population, despite the poor needing more calories because of harder manual work. The data also shows higher reliance of the poor on cereal based calories because of lack of access to fruits, vegetables and meat products. Second, daily calorie consumption of the bottom 25 per cent of the population has gone down from 1,683 in 1987-88 to 1,624 in 2004-05. These figures should be judged against a national norm of 2,400 and 2,100 kilo calories/day for rural and urban areas fixed by GOI in 1979. Similar downward trend is observed for cereal consumption too. As the relative price of food items has remained stable over the past twenty years, declining consumption can only be explained as due to weak purchasing power and contraction of effective demand by the poor, who are forced to spend a greater part of their limited incomes to non-food items like transport, fuel and light, health, and education, which have become as essential as food.

3
Calorie intake refers to the most proximate aspect of hunger, but it neglects other effects of hunger, such as under-weight and mortality. These are captured by the Global Hunger Index (GHI) that was designed by IFPRI based on three dimensions of hunger: lack of economic access to food, shortfalls in the nutritional status of children, and child mortality, which is to a large extent attributable to malnutrition. IFPRI estimated the hunger index for India as 23 per cent in 2008, which placed India in the category of nations where hunger was ‘alarming’, with Madhya Pradesh being categorised as ‘extremely alarming’. Worse, its score was poorer than many Sub-Saharan African counties, which have GDP less than India’s.
This is primarily because of the fact that anthropometric indicators of nutritional status for children in India are among the worst in the world. According to the National Family Health Survey, the proportion of underweight children remained virtually unchanged between 1998-99 and 2005-06 (from 47 to 46 percent for the age group of 0-3 years). These are appalling figures, which place India among the most “undernourished” countries in the world.
Higher child malnutrition rate in India (for that matter in the entire South Asia) is because of many factors. First, Indian women’s nutrition, feeding and caring practices for young children are inadequate. This is related to their status in society, early marriage, low weight at pregnancy and their lower level of education. The percentage of infants with low birth weight in 2006 was as high as 30. Underweight women produce low birth-weight babies which become further vulnerable to malnutrition because of low dietary intake, lack of appropriate care, poor hygiene, poor access to medical facilities, and inequitable distribution of food within the household.
Second, many unscientific traditional practices still continue, such as not immediately starting breast feeding after birth, no exclusively breastfeeding for the first five months, irregular and insufficient complementary feeding after between 6 months to two years of age, and lack of disposal of child’s excreta because of the practice of open defecation in or close to the house itself. Clearly government’s communication efforts in changing the age old practices are not working well.
And lastly, poor supply of government services, such as immunisation, access to medical care, and lack of priority to primary health care in government programmes also contributes to morbidity. These factors combined with poor food availability in the family, unsafe drinking water and lack of sanitation lead to high child under-nutrition and mortality. About 2.1 million deaths occur annually in under-5 year-old children in India. Seven out of every 10 of these are due to diarrhea, pneumonia, measles, or malnutrition and often a combination of these conditions.
1.1 Policy recommendations
First, rewamp small holder agriculture. Because of lack of growth in agriculture after the mid-1990s there has been employment decline, income decline and hence fall in aggregate demand by the rural poor. The most important intervention that is needed is more investment in irrigation, power, and roads in poorer regions. It is essential to realize the potential for production surpluses in Central and Eastern India, where concentration of poverty is increasing.
Two, launch watershed development programmes in uplands, where most tribals live. In a successful watershed programme the poor benefit in three ways. First, as net sown area and cropping intensity increases more opportunities for wage employment are created, which may also increase the wage rate besides the number of days of

4
employment. Second, increased water availability and reduced soil erosion increases production on small and marginal farmers’ lands. And last, higher productivity of CPRs improves access of the poor to more fodder, fuelwood, water and NTFPs.
Three, start a drive to plant fruit trees on degraded forests and homestead lands that belong to or have been allotted to the poor. This will not only make the poor people’s diet more nutritious, but will also diversify their livelihoods and reduce seasonal vulnerability.
Four, create more job opportunities by undertaking massive public works in districts of low agricultural productivity. The legal guarantee of 100 days wages available under the National Rural Employment Guarantee Act (NREGA), according to Comptroller and Auditor General of India (CAG), has been fulfilled in only 3 per cent of the cases. In addition to increased outlays, the scheme should have a food component, now that GOI has a comfortable stock of foodgrains. Monitor the inclusion of old people especially widows among the wage workers, who are often turned away (though illegally) from the worksite. Their work guarantee should be extended through an amendment in the Act to 150 days.
Five, provide separate ration cards as well as NREGA job cards for all ‘single’ women, regardless of whether they live alone, with dependents, or in their natal or husband’s home. Likewise for aged, infirm and disabled people who may or may not live with ‘able-bodied’ caregivers.
Six, improve the skills of the poor for market oriented jobs, so that they are absorbed in the sunrise industries, such as hospitality, security, health, and construction.
Seven, improve the distribution of subsidized foodgrains to the poor through the Public Distribution System (PDS). This would need correct listing of BPL families, as large errors of exclusion of BPL families and inclusion of above poverty line (APL) families are widely prevalent in the list. Launch a drive in collaboration with civil society to cover the poorest, as a large number of homeless and poor living in unauthorised colonies in urban areas have been denied ration cards, and are thus not able to avail of PDS, on the ground that they do not have an address!
Eight, restructure ICDS (Integrated Child Development Services). Despite a three-fold increase in its budget by GOI in the last five years and the contention of the Ministry of Women and Child Development that there are 1.5 early child-care centres (ICDS Centres) per village now, ICDS is reaching only 12.5 per cent children in the age group 6 months to 6 years. As the Centre is likely to be located in the richer part of the village, it may be out of reach for the vulnerable children of poorer households and lower castes and those living in remote areas. The programme targets children mostly after the age of three when malnutrition has already set in. It does not focus on the critical age group of children under three years, the age window during which health and nutrition interventions can have the most effect.
The focus of ICDS should be health and nutrition education, encouraging women to breastfeed exclusively for six months and after that add semi-solid family food four to six times a day in appropriate quantities for the infant, which alone can improve his/her nutrition levels. For nutrition to improve, we have to strengthen proper breastfeeding and complementary feeding, together with complete immunisation and prompt management of any illness.
Nine, cover all adolescent girls under ICDS. They need to be graded according to age, such as 10-15 group, 16-19 group and pregnant girls. Then they should be weighed

5
regularly, and given appropriate nutritious food containing all the desired micro-nutrients and iron. Similar initiative is needed for all women.
Ten, locate ICDS centres on priority within one year in all settlements of PTGs (primitive tribal groups) and most discriminated SC (Scheduled castes – previously the untouchable people) settlements, without any ceiling of minimum children; and all other hamlets with more than 50 per cent SC/ ST/minority population within two years. In all these centres, ICDS staff should be local from the discriminated communities, and two hot meals served instead of one to children of 3 to 6 years; and double weaning foods given to children below 3 years.
Eleven, every two years prepare a full list of all destitutes needing free or subsidized cooked food. Open up mid-day meals kitchen to these old, destitutes and hungry in the village. This is already being done in Tamil Nadu, and its replication in other states should be funded by GOI. Establish community kitchens across cities and urban settlements to provide inexpensive, subsidised nutritious cooked meals near urban homeless and migrant labour settlements.
Lastly, what India requires is a significant increase of targeted investments in nutrition programs, clinics, disease control, irrigation, rural electrification, rural roads, and other basic investments, especially in rural India as the current budgetary allocations are inadequate. Higher public investments in these areas need to be accompanied by systemic reforms that will help overhaul the present system of service delivery, including issues of control and oversight (Bajpai et al. 2005). Outlays should not be considered as an end in itself. Delivery of food based schemes requires increasing financial resources, but more importantly the quality of public expenditures in these areas. This in turn requires improving the governance, productivity and accountability of government machinery.
2 Understanding hunger
In the last decade and a half that India has successfully embraced economic reforms, a curious problem has haunted the country and vexed its policy makers: India’s excellent growth has made little impact on food security1 and nutrition levels of its population. Per capita availability as well as consumption of foodgrains has gone down; cereal intake of the bottom 30 percent continues to be 20 percent less than the cereal intake of the top two deciles of the population despite better access of the latter group to fruits, vegetables and meat products; calorie consumption of the bottom half of the population has been consistently going down since 1987; unemployment among agricultural labour households has sharply increased from 9.5 per cent in 1993-94 to 15.3 per cent in 2004-05 (Planning Commission 2006); the percentage of underweight children has remained stagnant between 1998 and 2006; and more than half of India’s women and three-quarters of children are anaemic with no decline in the last eight years. In short, all indicators point to the hard fact that endemic hunger continues to afflict a large proportion of Indian population. Internationally, India is shown to be suffering from alarming hunger, with its position being 66th out of the 88 developing countries studied (IFPRI 2008). India as part of the world community has pledged to halve hunger by 2015, as stated in the Millennium Development Goal 1, but the present trends show that this target is not likely to be met.
1 The commonly accepted definition adopted at the 1996 World Food Summit is: Food security is achieved when all people, at all times, have physical and economic access to sufficient, safe and nutritious food to meet their dietary needs and food preferences for an active and healthy life.

6
This paper examines the hunger and nutrition situation prevailing in the country and reviews the obligations and initiatives by the government of India (GOI) to ensure food security through various policies and schemes.
Scheme of the paper - In this section we look at various forms of hunger and make a distinction between explicit hunger and chronic or endemic hunger that manifests in lower intake of essential calories, proteins, fats, and micro-nutrients resulting in under-development of the human mind and body. Section three examines data, both from government and other sources on self-reported hunger. It also discusses India’s record in improving its position on various indicators that are generally used to measure hunger, such as calorie consumption, body mass index (BMI), proportion of malnourished children, and child mortality.
The fourth section analyses various aspects of food security both at the micro- and macro level. The reasons for decline in food consumption are analysed, followed by a brief discussion on the recent global trend of reduced availability and increasing prices. The fifth section is devoted to suggesting changes in some of the major policies and programmes that affect food security; such as agricultural production, public wage works, Public Distribution System, Mid-day Meals Scheme, and the Integrated Child Development Services (ICDS) programme for improving child malnutrition. Then there is a brief write-up on the Supreme Court intervention on hunger related matters followed by a discussion on issues of accountability.
Types of hunger - There are essentially two types of hunger (Gopaldas 2006). The first is overt (or raw) hunger, or the need to fill the belly every few hours. Hunger in simple terms is the desire to consume food. It can also be termed as self-reported hunger, whereby people judge their own ability to fulfil the physiological urge to satisfy their hunger.
The second type of hunger occurs when the human body gets used to having less food than necessary for healthy development, and after a while the body does not even demand more food. If people have always eaten less than their needs, their bodies adjust to less food in what is known as biostatis (Krishnaraj 2006). It is also possible to fill up the stomach with non-nutritious food, which does not provide the required calories or micro-nutrients2 (e g, vitamins, iron, iodine, zinc, calcium) that are required in tiny amounts. Another situation could be when the essential calories, proteins, fats and micronutrients are not absorbed in the body due to ill-health and poor hygiene. In all such cases hunger is not articulated.
The second kind of hunger may also be termed as chronic or endemic hunger as this is not felt, recognised or voiced by the child or adult. Chronic hunger does not translate into pangs of hunger, but into subtle changes in the way the human body develops. For instance, the under-fed child may be underweight or stunted for his age, if not consuming sufficient calories and fats. If the child is deficient in Vitamin A, he or she will not be able to see properly at dusk (“night blindness”), and respiratory ailments may also occur. In severe Vitamin A deficiency, the child may go totally blind. In the case of iron-deficiency anaemia, the child will slow down both mentally and physically, perform poorly in school and experience chronic tiredness. In the case of iodine deficiency, there will be mental retardation. In its severe form, a goitrous lump may grow at the base of the neck. Thus prolonged hunger leads to non-achievement of 2 Deficiency of micro-nutrients is often referred to as hidden hunger. However, micro-nutrients do not work unless the person is consuming sufficient calories through proper quantity of fat, protein, etc.

7
a predetermined ‘physiological requirement’ or ‘human potential’, defined in terms of norms for calorie and other essential nutrients and growth standards.
Subjective hunger, or the first kind of hunger is a matter of articulation – people or populations have to indicate in some fashion that they are going hungry. This means there must be a state of not being hungry, so that the state of being hungry can be recognised as such. What if, not having such a base level, they cannot recognise or articulate hunger? What if they have always had less food than they need? If body gets used to having less food then hunger may never be articulated. Self-reported hunger is also difficult to measure, since perceptions of hunger differ from one person to another. Therefore objective indicators offer a better measure for hunger, such as calorie consumption, body mass index, stunting, lack of sufficient variety in food intake, as it is perfectly possible to have a full belly and yet display every symptom of under-nutrition.
There is a link between nutritional status or health on the one hand and human effort and productivity. Hunger affects the ability of individuals to work productively, think clearly, and resist disease. Hunger may lead to low output and hence poor wages. Hunger is thus both cause and effect of poverty. Hunger in India has gender and age dimensions too. Women, children and the old people are less likely to get full nutritious meals needed for their development. Half of the country’s women suffer from anaemia and maternal under-nourishment, resulting in maternal mortality and underweight babies. There are important seasonal variations in nutritional and health status depending on the cycle of agricultural work. Hunger and starvation also have regional and geographical dimensions. Tribal regions in India have higher incidence of food insecurity than the non-tribal regions in the same state. The pattern of agriculture has brought uneven development across regions and is characterized by low levels of productivity and degradation of natural resources in tribal areas, leading to low crop output and reduced gathering from CPRs.
Hunger can also be equated with chronic food insecurity as both refer to a situation in which people consistently consume diets inadequate in calories and essential nutrients. This often happens due to the inability to ‘access’ food for lack of purchasing power. Destitution, leading in extreme cases to starvation deaths but in any case to a life in misery, is more endemic amongst certain groups. These include persons with disabilities, persons with stigmatizing illnesses such as leprosy or HIV/AIDS, the elderly and the young who lack family support and single women. Social and employment factors in destitution include scheduled caste population, tribal populations, manual scavengers, beggars, sex workers, landless labourers and artisans. Persons displaced by natural disasters or development projects are also often in this group. Due to prolonged deprivation of sufficient food and recurring uncertainty about its availability these people are forced to lose their dignity through foraging and begging, debt bondage and low end highly underpaid work; self denial; and sacrifice of other survival needs like medicine or children’s education, and thus transferring their misery to the next generation (Mander 2008).

8
3 Dimensions of hunger
3.1 Self-reported hunger
Various NSSO3 rounds in India from 1983 onwards have statistically measured4 the first type of hunger, by asking people on the availability of two square meals a day. The results are shown in Table 1.
Table 1: Trend in self-reported hunger in India from 1983 to 2004-05
Year Per cent of population reporting hunger
Rural Urban Total
1983 18.54 6.33 16.1
1993-94 5.1 1.6 4.2
1999-00 3.3 0.9 2.6
2004-05 2.4 0.5 1.9
Source: Kumaran 2008
Explicit hunger is especially severe in rural Orissa, West Bengal, Kerala, Assam and Bihar. Non-availability of two square meals a day peaks in the summer months from June to September with longer duration suffering in West Bengal and Orissa (Mehta and Shah 2002).
The data showed a drastic decline in self-reported hunger in India from 16.1 to 1.9 percent, which can be interpreted as decline in food insecurity in its severest form, while much was left undone on other fronts i.e., food and nutritional insecurity in its not so severe form. The question that remains unanswered however is how does one reconcile the above data with significant reduction in cereal intake (see Table 16) over the years? Is that a result of declining demand or sign of distress?
An Expert Group (GOI, 1993), while evaluating the suitability of use of subjective hunger data for inferring the extent of poverty arrived at two critiques which are useful for the present context. First commenting on the limited reliability of the data as an objective measure the Expert Group noted:
‘It has to be kept in mind that the information regarding the adequacy or inadequacy of food for consumption, elicited through a single probing question, may not always be free from subjectivity and at the same time may not be adequately precise and objective. For instance the size of 'square meal’ would differ not only from person to person but also from place to place’ (GOI 1993:53).
3 The National Sample Survey Organisaton of the Ministry of Programme Implementation and Statistics (GOI) conducts surveys on various socio-economic issues annually. The 61st round of the National Sample Survey (NSS) conducted between July 2004 to June 2005 collected data on household consumer expenditure on a large sample basis and was the seventh quinquennial survey on the subject. It covered a sample of 79,298 rural and 45,346 urban households in all the states and union territories of India. 4 In 1999-2000 and 2004-05 the question asked was, Do all members of your household ‘get enough food every day’? (NSSO 2007). In earlier surveys the responds were asked about the availability of two square meals a day for their family members.

9
Second important aspect, noted by the Expert Group, relates to the problem involved in relying on the male head of households for the information on hunger experienced by other family members.
‘Very often, particularly in rural India, the head of the family, usually a man, who is the main respondent in the survey, would not be sufficiently aware of the quantity and content of meal left for his wife and other female members of the house. Therefore, this data would probably give only a broad idea about the perceptions of the people on adequacy of food’ (GOI 1993:54).
There is yet another problem in interpreting the data given in Table 1. Often men, as bread-winners would hate to admit that they cannot provide even two square meals to their dependents (Kundu 2006: 120). Issues of pride, self-image and dignity are involved here, which leads to a deep sense of shame and reluctance on the part of the head of the households to publicly admit their incapacity to provide for their respective families. This may result in under-reporting on the number of meals family members are able to afford. For these reasons the NSSO data on decline in hunger over the years cannot be relied upon.
In addition to NSSO, there have been other empirical studies too on subjective hunger. Government of West Bengal conducted a rural household survey (Roy 2008) in 2006 through the panchayats and rural development department in which 3.5 per cent of the population reported that they are not assured of even one meal a day. Another 16.5 per cent face difficulties in arranging two square meals a day for all months in a year. In all around 12 million rural people5 (around 2.5 million rural families) do not get two square meals a day throughout the year.
A survey (UNDP 2007) was done of selected districts by Pratham, a reputed voluntary organization. The rural people were asked on the number of meals they consumed on most days in a year, and the number of clothes the young women in the family possessed. The results in shown in the figure below.
Fig 1: Percentage of rural households who
0
10
20
30
40
50
60
70
Bida
r (Ka
rntk
)
Ahm
edna
gar (
Maha
)
Mon
(Nag
a)
L Su
bans
iri (A
ss)
Cham
ba (H
P)
D Di
najp
ur (W
B)
Jalo
r (RJ
)
Dhem
aji (A
ss)
Mand
la (M
P)
Mewa
t (HR
)
Gajap
ati (
Ori)
eat less than 2 meals a day
own less than 3 sets ofclothes
This shows that the number of people consuming less than two meals a day varied from 5 to 23 per cent in the rural areas of selected districts, whereas the number of women having just one or two set of clothes was as high as 60 per cent in some districts.
5 The total population of West Bengal in 2001 was 80 million.

10
A recent UNDP study (2008) selected 16 districts (9 backward and 7 non-backward) from the backward states and conducted a perception study of households selected at random. The finding on access to food is given in Table 2.
Table 2: District-wise distribution of households according to adequacy of access to food State District Highly
AdequateSome what
Adequate
Average Some what Inadequate
Highly Inadequate
Total
Rajasthan Barmer 29.5 8.5 39.5 20.5 2 100
DungarPr 2 4.5 65.5 25.5 2.5 100
Uttar Pradesh Sitapur 8 24 10 49 9 100
Lalitpur 3.5 5 5.5 76.5 9.5 100
Azamgarh 6 15.5 21.5 41 16 100
MadhyaPradesh Mandla 0.5 2 43.5 50.5 3.5 100
Tikamgarh 14 45.5 23.5 10.5 6.5 100
Bihar Gaya 4 16.5 23.5 46 10 100
Muzz.Pur 5.5 4 14 46 30.5 100
Purnia 4.5 3.5 16.5 49.5 26 100
Jharkhand Palamu 17.5 35 40.5 7 0 100
Dumka 12 41.5 37.5 9 0 100
Chhattisgarh Kanker 10 45 35.5 9.5 0 100
BilasPur 14 69 16 1 0 100
Orissa Ganjam 5.5 45 37.5 10 2 100
Keonjhar 2.5 36.5 40 18 3 100
Total 8.69 25.06 29.38 29.34 7.53 100
Number 278 802 940 939 241 3200
Thus 7.5 per cent of respondents state that the access to food grains is highly inadequate, and in about 29 per cent of the households it is somewhat inadequate. It is only in about 9 per cent of the households which report that access to food grain is considered highly adequate. However, the district-wise variations are very stark, more than 76 per cent of the households in Lalitpur have somewhat inadequate access, but the situation in Muzaffarpur appears very bad with nearly 31 per cent of the households reporting highly inadequate access. This stresses the need for governance and monitoring at the district level as very critical.
3.2 Measuring hunger by calorie consumption
Hunger has many faces: loss of energy, apathy, increased susceptibility to disease, shortfalls in nutritional status, disability, and premature death. No single indicator can provide a complete picture, and that a variety of different indicators should be used in

11
analysing different aspects of the problem. One needs to measure dietary diversity, rather than just the consumption of food staples. Some aspects of hunger, such as the stability of food consumption between seasons and between years, are generally not captured by the existing data. In this paper we shall use several indicators – calorie consumption, BMI, low weight and height among children, and anaemia among women and children – to see how the picture has changed over the years in India.
In this section we focus on hunger-poverty, as measured by calorie deficiency – the inability to consume the energy required by the body. Mean per capita consumption of calories, protein, and fats as calculated by Deaton and Dreze (2008) for various NSS rounds is shown below:
Table 3: Mean per capita consumption of calories, protein, and fats. Calories (kc) Protein (gms) Fats (gms) Year Round Rural Urban Rural Urban Rural Urban 1983 38 2,240 2,070 63.5 58.1 27.1 37.1 1987-8 43 2,233 2,095 63.2 58.6 28.3 39.3 1993-4 50 2,153 2,073 60.3 57.7 31.1 41.9 1999-0 55 2,148 2,155 59.1 58.4 36.0 49.6 2000-1 56 2,083 2,027 56.8 55.3 34.6 46.1 2001-2 57 2,018 1,982 54.8 54.2 33.6 46.1 2002 58 2,025 2,014 55.4 54.9 34.7 47.0 2003 59 2,106 2,020 58.0 55.5 36.4 46.7 2004 60 2,087 2,036 56.9 55.9 35.5 46.8 2004-5 61 2,047 2,021 55.8 55.4 35.4 47.4
Thus, in spite of India’s rapid economic growth, there has been a sustained decline in per capita calorie and protein consumption during the last twenty-five years, indeed fats are the only major nutrient group whose per capita consumption is unambiguously increasing. Patnaik (2007)
points out that during the same period the
calorie intake at poverty line households was also declining. The calorie intake at poverty line was 2170 kcal in 1977-78, 2060 Kcal in 1983, 1980 Kcal in 1993-94 and 1820 Kcal in 2004-05.
The decline in calorie consumption of the top quartile could be due to more sedentary life style or increasing diversity in food intake, but the decline for the bottom quartile since 1987, as shown in Table 4, cannot be interpreted as a sign of prosperity.
Several inferences can be drawn from Table 4. First, at any given point of time calorie intake of the poorest quartile continues to be 30 to 50 percent less than the calorie intake of the top quartile of the population, despite the poor needing more calories because of harder manual work. Second, calorie consumption of the bottom fifty per cent of the population has been consistently going down since 1987, which is a matter of concern. And last, whereas the top quartile derived only 58 per cent calories from cereals in 2004-05, the bottom quartile still depended on cereals for 78 per cent of their calorie consumption.

12
Table 4: Total and cereal calorie consumption by decile and quartile of per capita expenditure, rural India, 1983 to 2004-05. Bottom
decile Bottom Quartile
Second Quartile
Third Quartile
Top Quartile
Total calories 1983 1,359 1,580 2,007 2,328 3,044 1987-88 1,488 1,683 2,056 2,334 2,863 1993-94 1,490 1,659 2,000 2,251 2,702 1999-00 1,496 1,658 1,978 2,250 2,707 2004-05 1,485 1,624 1,900 2,143 2,521 Cereal Calories 1983 1,150 1,309 1,589 1,738 1,974 1987-88 1,221 1,359 1,598 1,715 1,894 1993-94 1,203 1,316 1,504 1,591 1,690 1999-00 1,197 1,289 1,591 1,509 1,566 2004-05 1,189 1,259 1,690 1,430 1,471
Source: Deaton and Dreze 2008 Similar picture, of wide gap between the consumption of the bottom 30 per cent and top 30 per cent, as well as falling calorie consumption of all groups including the lower 30 per cent, emerges when one looks at variation for a longer period since 1972-73, as shown in figure 2.
Figure 2: time trends in average per capita energy intake by expenditure classes
(Ramachandran 2007)
Another study on hunger (Ahmed et al. 2007) based on the same NSSO data disaggregated those consuming fewer than 2,200 calories in India into three groups:
• Subjacent hungry: those consuming more than 1,800 but fewer than 2,200 kilocalories (kcal) a day
• Medial hungry: those consuming more than 1,600 but fewer than 1,800 kcal a day
• Ultra hungry: those consuming less than 1,600 kcal a day

13
The study found that in all 58 per cent people in India suffered from hunger in 1999, of which a good 17.4 per cent were classified as ultra hungry.
Table 5: Incidence of Hunger in India (1999)
National Rural Urban
Subjacent hungry 28.6 28.9 27.9
Medial hungry 12.1 12.1 12.3
Ultra hungry 17.4 17.1 18.0
Total 58.1 58.1 58.3
3.2.1 How many calories are needed for healthy living?
The calculation of calorie norms or requirements is complicated as the daily calorie requirement for healthy life is a function of age, sex and nature of work. The required average for the entire society will decline if rising incomes lead to a shift from manual to sedentary life style, but would go up if the proportion of children and old people increases as indeed is happening in India due to demographic changes. In the absence of well accepted norms of calorie consumption for different time periods valid for India it is difficult to come to any definite conclusion about the percentage of population that is not able to satisfy the minimum required calorie needs for healthy living in a particular year.
Planning Commission constituted a ‘Task Force on Projection of Minimum Needs and Effective Consumption Demand’ which on the basis of a systematic study of nutritional requirements recommended (GOI 1979) a national norm of 2,400 and 2,100 kilo calories/day for rural and urban areas (the difference being attributed to the lower rates of physical activity in the urban areas) respectively6. These are not arbitrary figures, but were derived from age-sex-occupation-specific nutritional norms by using the all-India demographic data from the 1971 Census. However, these have not been revised, and hence the confusion in interpreting subsequent data based on old norms of calorie consumption.
There is yet another problem in interpreting calorie data, when it is disaggregated to the Indian states. The diet of people in poorer states, such as Assam, Orissa and Bihar, is not diversified and they eat more cereals as contrasted with Kerala and Tamil Nadu where diets include more vegetables, fats, and fish. The result is that per capita calorie consumption is higher in Orissa and Bihar but in the absence of proteins and essential fats these states report higher malnutrition than Kerala and Tamil Nadu, as shown in column 3 of Table 9. Therefore calorie consumption cannot be the sole determinant of hunger. Because of these problems Deaton and Dreze (2008) concluded, ‘there is no tight link between the numbers of calories consumed and nutritional or health status. Although the number of calories is important, so are other factors, such as a balanced diet containing a reasonable proportion of fruits, vegetables, and fats, not just calories from cereals, as are factors that affect the need for and retention of calories, such as activity levels, clean water, sanitation, good hygiene practices, and vaccinations.’
6 The average calorie norm of 2,110 kcal per capita per day prescribed by the FAO for South Asia (Bajpai et al. 2005) in the eighties is much lower than the 2,400 kcal norm that has been typically used by government in India. The latest calorie norm used by FAO for India is 1820 kcal (IFPRI 2008).

14
The MDGs call for halving of hunger-poverty between 1990 and 2015. Assuming constant norms of 2400/2100 kcalories for India, this would mean bringing down the headcount ratio of calorie deficiency from 62.2 per cent in 1990 to 31.1 per cent in 2015. However, the number of people below the norm has consistently increased over the years, and more than three quarters of the population live in households whose per capita calorie consumption is less than the norm, as shown in Table 6.
Table 6: Fractions of the population living in households with per capita calorie consumption below 2,100 urban and 2,400 rural
Year Round Rural Urban All India 1983 38 66.1 60.5 64.8 1987-8 43 65.9 57.1 63.9 1993-4 50 71.1 58.1 67.8 1999-0 55 74.2 58.2 70.1 2004-5 61 79.8 63.9 75.8
(Deaton and Dreze 2008)
The mere consumption of an adequate number of calories may not ensure sufficient intake of other nutrients, such as proteins, fats and micro-nutrients, which are just as essential for human health. It can further be argued that there is a distinction between gross calorie intake and net calorie absorption, and that the relationship between the two may change over time depending upon the incidence and severity of gastro-intestinal disorders.
Table 7: Percentage of Undernourished Population in India Below the Threshold Levels of Protein and Fat, 1983 and 1999-2000
Year Bottom Group Upper Group
Rural Urban All India Rural Urban All India
Protein
1983 51 64 55 9 20 13
1999-00 65 65 65 14 14 14
Fats
1983 61 40 55 10 4 8
1999-00 48 16 36 4 2 3
(Kumar et al. 2007)
Notes: Bottom group : Below poverty line; Upper group : Above 150 per cent of poverty line
Table 7 reveals a general worsening of protein consumption, particularly in the bottom income group in rural areas7, where the population below threshold level had 7 The sample households were grouped into poor (bottom) and non-poor (upper) classes. The non-poor class comprised households which were above 150 per cent of the poverty line, whereas, the poor class consisted of households below the poverty line. The poverty line for rural and urban areas in different states corresponding to various NSS rounds, as defined and adopted by the Planning Commission, was used in the study.

15
increased from 51 per cent to 65 per cent in terms of protein intake. Ideally, the source of protein should be pulses and meat. But the data showed that cereals contributed 67 per cent of the protein source in rural India. It can perhaps be explained in terms of lack of purchasing power for procuring adequate quantity of high-value non-cereal commodities to compensate for loss in nutrition owing to replacement of cereals.
To conclude this section, there is strong evidence of a sustained decline in per-capita calorie and protein consumption in India during the last twenty five years. The proportionate decline was larger among better-off sections of the population, but also existed for the bottom quartile of the per-capita expenditure scale. While calorie deficiency is an extremely important aspect of nutritional deprivation, close attention needs to be paid to other aspects of food deprivation, such as the intake of vitamins and minerals, fat consumption, the diversity of the diet, and breastfeeding practices.
3.2.2 The official poverty line
The national-level official poverty lines for the base year (1973-74) expressed as monthly per capita consumption expenditure of Rs 49 in rural areas and Rs 57 in urban areas corresponded to a basket of goods and services, which satisfy the calorie norms of per capita daily requirement of 2400 Kcal in rural areas and 2100 Kcal in urban areas. These figures have been updated for price rise for the subsequent years. However, the new poverty lines do not correspond to the minimum calorie norm, as the poor have been forced to shift their priorities to essential non-food items.
Thus for the year 1999-00 the monetary cut-off corresponding to the minimum calorie requirements norms should have been Rs 565 in rural areas and Rs 628 in urban areas, whereas by the price updated methodology as used by Planning Commission the poverty line was Rs 328 and Rs 454 respectively. The current value of the poverty line does not permit the poverty line class to consume the calorific norm, and the periodic price corrections that have been carried out to update the poverty lines are inadequate and indeed may be even inappropriate (Sen 2005). Consequently, the poverty estimates made in the years after 1973-74 understate the true incidence of poverty in the country. There is a compelling case for re-estimating the poverty lines. The proportion of people living below the official poverty line has declined from 56 per cent in 1973-74 to 35 per cent in 1993-94, and further to 28 per cent in 2004-05, whereas there has been no decline in the number of people consuming less calories than the norm (Table 6). The set of food insecure in India is larger than the set of poor in India.
Several features of poverty in India stand out. First, poverty is getting concentrated in the poorer states. In terms of absolute numbers, Uttar Pradesh, Bihar and Jharkhand account for around 27 per cent of the country’s population but 30 per cent of India’s poor lived there in 1973-74, which has increased to over 41 per cent by 2005 (Himanshu 2007). Second, more than three-fourths of the poor live in rural areas. Third, more than three-fourths of the rural poor depend on agriculture. Agricultural growth will therefore have greatest potential of poverty reduction.
Fourth, poverty has many social dimensions. There has been hardly any decline in poverty for the Scheduled Tribe households, almost half of them continue to be below the poverty line. Although poverty among the Scheduled Castes has declined from 46 to 37 per cent during 1993-2004 (Planning Commission 2008), the caste system confines those from lower castes to a limited number of poorly paid, often socially stigmatised occupational niches from which there is little escape, except by migrating

16
to other regions or to towns where their caste identity is less well known. Many states, especially in the north and western part of the country, are characterised by long-standing and deeply entrenched social inequalities associated with gender. Gender cuts across class, leading to deprivations and vulnerabilities which are not necessarily associated with household income.
And lastly, poverty is intimately connected with vulnerability and shocks. Severe and chronic deprivation in India is compounded by general uncertainty with respect to livelihood and life, which threatens an even wider section of the population than might be counted as poor.
Thus poverty is an extremely complex phenomenon, which manifests itself in a range of overlapping and interwoven economic, political and social deprivations. These include lack of assets, low income levels, hunger, poor health, insecurity, physical and psychological hardship, social exclusion, degradation and discrimination, and political powerlessness and disarticulation. Therefore, policy instruments should be designed to address not only the low income and consumption aspect of poverty, but also the complex social dimensions (Sen and Himanshu 2004).
The existing types of poverty programmes may not be enough to tackle hunger and food insecurity. Important food security issues are often left out of poverty programmes, such as the stability of food consumption, dietary diversity, and food absorption and utilisation. Furthermore, poverty programmes may fail to recognise how hunger and malnutrition impair people's capacity to participate in productive activities and result in worse school performance. Hence there is need to mainstream hunger in the existing programmes.
3.3 IFPRI’s composite index on hunger
Calorie intake refers to the most proximate aspect of hunger, but it neglects other effects of hunger, such as under-weight and mortality. These are captured by the Global Hunger Index (GHI) that was designed to capture three dimensions of hunger: lack of economic access to food, shortfalls in the nutritional status of children, and child mortality, which is to a large extent attributable to malnutrition (Wiesmann et al. 2007). Accordingly, the Index includes the following three equally weighted indicators: the proportion of people who are food-energy deficient as estimated by the Food and Agriculture Organization of the United Nations (FAO8), the prevalence of underweight in children under the age of five as estimated by the World Health Organization, and the under-five mortality rate as estimated by UNICEF.
The Global Hunger Index recognizes the interconnectedness of these dimensions, and therefore captures performance on all the three of them. The index has been an effective advocacy tool which has brought the issue of global and national hunger to the fore in policy debates, especially in developing countries. The ranking of nations on the basis of their index scores has been a powerful tool to help focus attention on hunger, especially for countries like India which under�perform on hunger and malnutrition relative to their income levels.
8 According to FAO, after seeing a decline of 20 million in the number of undernourished between 1990–1992 and 1995–1997, the number of hungry people in India increased from 201.8 million in 1995-1997 to 212.0 million in 2001-2003.

17
IFPRI estimated9 that the hunger index for India had declined from 34 per cent in 1990 to 23 per cent in 2008, although India still continued to be in the category of nations where hunger was ‘alarming’. Worst, its score was poorer than many Sub-Saharan African counties, which have GDP less than India’s. This indicates continued poor performance at reducing hunger in India. Table 8. GDP per capita in relation to scores on the Global Hunger Index 2008 Country GHI 2008 GDP per Capita* Nigeria 18.4 1977 Cameroon 18.7 2124 Kenya 19.9 1535 Sudan 20.5 2088 India 23.7 2753
* Gross Domestic Product (GDP) dollar estimates at Purchasing Power Parity (PPP) per capita Source: World Development Indicators, 2007 (World Bank)
A recent IFPRI report (2008) estimated hunger index for 17 major states in India, covering more than 95 percent of the population of India, shown in Table 9. All 17 states have GHI scores that are well above the “low” and “moderate” hunger categories. Twelve of the 17 states fall into the “alarming” category, and one - Madhya Pradesh – into the “extremely alarming” category. The study concluded that GHI scores are closely aligned with poverty, but there is little association with state level economic growth. High levels of hunger are seen even in states that are performing well from an economic perspective, such as Gujarat and Karnataka.
3.4 BMI
A widely used measure of nutritional status is a combination of weight and height measurements known as the Body Mass Index (BMI). Low body weight, associated with low intakes, is an indication that people could not reach their growth potential and hence is essentially a sign of continued hunger and nutritional distress. This is defined as weight in kg divided by height in metre squared. A BMI of below 18.5 for adults indicates chronic energy deficiency (CED). It would be due to an intake of calories and other nutrients less than the requirement for a period of several months or years.
According to the XI Plan, volume 2 (Planning Commission 2008), in 1998–99 as much as 36 per cent of the adult population of India had a body mass index (BMI) below 18.5; eight years later (2005–06) that share had barely fallen to 33 per cent of the population, despite a decade of robust economic growth. These figures are based on the NFHS data, which is collected from all the states. Changes in BMI are also
9 IFPRI used a cut-off of 1,632 kcals per person per day as the national calorie under-nutrition norm which showed 20 per cent calorie deficient people in India. FAO has also used the norm of 1632 kcal, showing a reduction in the number of under-nourished population from 25 to 20 per cent during 1990-2005. Had it used 1,820 kcals per person per day as the cut-off the number of under-nourished population in 2005 would have been 34 per cent.

18
monitored by the National Nutrition Monitoring Bureau (NNMB, shown in Table 10), but it covers only ten10 states.
Table 9: Underlying components of India State Hunger Index and India State Hunger Index scores State Prevalenc
e of calorie under-
nourishment
Proportion of
underweight
among children<
5years
Under�five mortality
rate, reported as deaths per
hundred
India State Hunger
Index score
India Hunger
Index Ranking
per cent of people below
poverty line in 2004-05
1 2 3 4 5 6 7India 20.0 42.5 7.4 23.31 27.5 Andhra Pradesh 19.6 32.7 6.3 19.54 3 15.79Assam 14.6 36.4 8.5 19.85 4 19.73Bihar 17.3 56.1 8.5 27.30 15 41.35Chhattisgarh 23.3 47.6 9.0 26.65 14 40.88Gujarat 23.3 44.7 6.1 24.69 13 16.75Haryana 15.1 39.7 5.2 20.01 5 14.03Jharkhand 19.6 57.1 9.3 28.67 16 40.35Karnataka 28.1 37.6 5.5 23.74 11 24.98Kerala 28.6 22.7 1.6 17.66 2 15.04Madhya Pradesh
23.4 59.8 9.4 30.90 17 38.29
Maharashtra 27.0 36.7 4.7 22.81 10 30.75Orissa 21.4 40.9 9.1 23.79 12 46.37Punjab 11.1 24.6 5.2 13.64 1 8.41Rajasthan 14.0 40.4 8.5 20.99 7 22.06Tamil Nadu 29.1 30.0 3.5 20.88 6 22.53Uttar Pradesh 14.5 42.3 9.6 22.17 9 32.81West Bengal 18.5 38.5 5.9 21.00 8 24.72
(IFPRI 2008)
10 Andhra Pradesh, Karnataka, Kerala, Tamil Nadu, Maharashtra, Madhya Pradesh, Orissa, Uttar Pradesh, Gujarat, and West Bengal

19
Table 10: Nutrition Status of Indian Adults, 1975-9 to 2004-5 (Body Mass Index) Proportion ( per cent) of adults with BMI below 18.5 1975-79 1988-90 1996-97 2000-01 2004-05
per cent decline (1975-9 to 2004-5)
Men 56 49 46 37 33 41 Women 52 49 48 39 36 31
(Deaton and Dreze 2008)
Predictably the percentage of women in rural areas with BMI below 18.5 in 2004-05 was 41.2 according to NNMB, which is twice that among urban women 22.7 (Arnold et al. 2004). As regards age distribution, the percentage of women with BMI below 18.5 ranges from 41.7 for the age group 15-19 to 43.2 for 20-24, 39.4 for 25-29, 35.1 for 30-34 and 31.1 for 35-49. Ironically, at the most vulnerable ages when their reproductive demands are highest women are most deficient. So much for this country’s esteem for mothers!
The data for each social group is available for 1996-97, shown below:
Table 11: Percentage of population with BMI < 18.5
Overall 47
Scheduled castes 53.2
Scheduled tribes 60.9
Others 46.8
(Sen 2004)
The prevalence of undernutrition was thus relatively higher among low socio-economic category of households such as those belonging to SC and ST communities.
A 20-year trend (Sen 2004) based on a large number of studies and the NNMB surveys of Indians (1977-1996) show that there have been minimal improvements in the weights of populations (of the same age) in India. The mean weight of children at five years of age in 1977 was 12.7 kg and 14.1 kg (girls and boys); when compared to the NCHS (US National Centre for Health Statistics) median weights of 17.7 and 18.7 kg, this deficit is of about 4 kg at the age of five. This increased to a deficit of 14 and 23 kg by the age of 18, and the mean weights of Indian women and men were a mere 42.3 and 45.4 kg compared to the NCHS standard of 56.6 and 68.9 kg. There was a small improvement in the weights of Indians as they reached the age of 25 (42.8 and 49.9 kg), but it was still way below their desirable weight. At the age of 60+ they slipped back to mean weights of 39.7 and 47.6 kg. By the year 1996 the nutritional status of a large number of people had not changed, or perhaps had improved only marginally. After observing a average weight gain of 1.25 Kg to 2.5 kg at each age group, the author notes that these are mean weights, and approximately half the population in India has lower weights than these (weights as low as 38 kg) for adults, a condition very close to chronic energy deficiency or starvation’ (Shatrugna 2001:2). Fast economic growth did not help them to gain much height or weight for decades.
Similarly, Shatrugna found that the average height of children from 1977 to 1996 experienced no secular increase in heights or a minimal increase of 1 cm. Comparing the weight and height gain in high income groups in India, the author notes that there is a clear potential to improve height and weight of Indian population as reflected by

20
the considerable weight gain by high income groups, captured by the field studies. However there is a huge gap between actual and potential weight and height of the average Indian. In other words, the under-nutrition condition is severely distressing which is still forcing generations to remain stunted and remain thin, so they cannot engage in hard work, given the low level of the calorie intake.
3.5 Undernourished children
Just as for adults, for children too, anthropometric indicators of nutritional status in India are among the worst in the world. According to the National Family Health Survey, the proportion of underweight children remained virtually unchanged between 1998-99 and 2005-06 (from 47 to 46 percent for the age group of 0-3 years). These are appalling figures, which place India among the most undernourished countries in the world. The overall levels of child under-nutrition in India (including not only severe but also “moderate” under-nourishment) are shown in Table 12.
Table 12: Trends in Child Nutrition: NFHS Data Proportion ( per cent) of children under the age of three years who are undernourished
NCHS11 Standards New WHO Standards
1992-3 1998-9 2005-6 1998-9 2005-6 Weight-for-age Below 2 SD 52 47.0 45.9 42.7 40.4 Below 3 SD 20 18.0 n/a 17.6 15.8 Height-for-age Below 2 SD n/a 45.5 38.4 51.0 44.9 Below 3 SD n/a 23.0 n/a 27.7 22.0 Weight-for-height Below 2 SD n/a 15.5 19.1 19.7 22.9 Below 3 SD n/a 2.8 n/a 6.7 7.9
The data for children under five in 2005-2006 is similar to the above.
per cent of under-fives suffering from: underweight, moderate & severe 43
per cent of under-fives suffering from: underweight, severe 16
per cent of under-fives suffering from: wasting, moderate & severe 20
per cent of under-fives (suffering from: stunting, moderate & severe 48
source: http://www.unicef.org/infobycountry/india_statistics.html
11 Until 2006, the World Health Organization (WHO) recommended the US National Centre for Health Statistics (NCHS) standard, and this was used inter alia in the first and second rounds of the National Family Health Survey. In April 2006, the WHO released new standards based on children around the world (Brazil, Ghana, India, Norway, Oman, and the United States) who are raised in healthy environments, whose mothers do not smoke, and who are fed with recommended feeding practices. These new standards were used in the third National Family Health Survey.

21
Over 70 to 80% of the calories consumed by the children (even though inadequate) are derived from cereals and pulses. This results in two things: (i) Children cannot consume more cereals to make up for the calorie deficiency because of its sheer monotony and lack of energy density. (ii) In the absence of fats, milk, eggs, and sources of iron, children starve themselves. The resultant iron deficiency anaemia (IDA), further worsens their appetite. Therefore in the absence of foods other than cereals and pulses in the diets of children and the inability of children in the age groups of (1–18 years) to derive and satisfy their protein-calorie and other nutrient needs from cereals, the malnutrition scenario can only get worse. Even fats that provide energy density in the diets are not available in adequate quantities (normally fats should provide 30–40% of calorie needs). It is therefore not surprising that there is massive hunger leading to multiple nutrient deficiencies. This is not hidden hunger; it is hunger for nutrient rich foods (Planning Commission 2008).
The main reason that explains a higher child malnutrition rate in India (for that matter in the entire South Asia) than in poorer, conflict-plagued Sub-Saharan Africa is that Indian women’s nutrition, feeding and caring practices for young children are inadequate. This is related to their status in society, early marriage, low weight at pregnancy and their lower level of education. The percentage of infants with low birth weight in 2006 was as high as 30. Underweight women produce low birth-weight babies which become further vulnerable to malnutrition because of low dietary intake, lack of appropriate care, poor hygiene, poor access to medical facilities, and inequitable distribution of food within the household.
Estimates based on available data from institutional deliveries and smaller community-based studies suggest that even now nearly one-third of all Indian infants weigh less than 2.5 kg at birth. Studies (Ramachandran 2007) have shown that LBW children have a low trajectory for growth in infancy and childhood.
Indian mothers on average put on barely 5 kg of weight during pregnancy. This is a fundamental reason underlying the LBW problem. They should put on at least 10 kg of weight, which is the average for a typical African woman (Planning Commission 2008). Middle class Indian women tend to put on well over 10 kg weight during pregnancy. But this is not the only problem; LBW is also partly explained by low BMI of women in general, prior to their becoming pregnant. Small women (who are small before they become pregnant) give birth to small babies.
Worse is the story about the number of anaemic children, as their percentage during 1999-2006 has gone up from 74 to 79 per cent.
Table 13: Levels of Anaemia among Indian Children (Per cent)
NFHS-2 (1998-99) NFHS-3 (2005-06)
All India
Urban Rural Rural Urban Ratio
All India
Urban Rural Rural Urban Ratio
Children aged 6-35 months who are anaemic 74 71 75 1.1 79 73 81 1.1
(Kumar 2007)

22
When one looks at the Indian states, unlike calorie consumption which is only weakly co-related with poverty, child malnutrition has a strong correlation with poverty (see Table 9), with poorer states such as Madhya Pradesh, Bihar and Jharkhand showing high degree of malnutrition, whereas better-off states such as Punjab, Haryana, Tamil Nadu and Kerala show comparatively better performance on this indicator.
Determinants of Indian children’s malnourishment can be broadly divided in two categories. In the first list are factors such as the irrational traditional practices which still continue, not immediately starting breast feeding after birth, no exclusively breastfeeding for the first five months, irregular and insufficient complementary feeding after between 6 months to two years of age, and lack of disposal of child’s excreta because of the practice of open defecation in or close to the house itself. NFHS-3 data shows that only 21 per cent of mothers dispose of their children’s stool safely. There is wide variation between urban and rural households. Whereas 47.2 per cent urban mothers did so, this percentage was only 11.4 for rural mothers. Clearly government’s communication efforts in changing the age old practices are not working well, and critical public health messages are simply not reaching the families with children.
In the second category would fall factors relating to poor supply of government services, such as immunisation, access to medical care, and lack of priority12 to primary health care in government programmes. Table 14, based on NFHS-3 results, gives data on both, child rearing practices and government delivery.
Table 14: Access to and Reach of Basic Health Services for children 2005-06
Total Urban Rural
Children under three years breastfed within one hour of birth 23 29 22
Children aged 0-five months exclusively breastfed 46 40 48
Children aged six to nine months receiving solid or semi-solid food and breastmilk
56 62 54
Children 12-23 months fully immunised (BCG, measles and three doses each of polio/DPT)
44 58 39
Children aged 12-35 months who received a vitamin A dose in last six months
21 23 20
Children with diarrhoea in the last 2 weeks who received ORS 26 33 24
Children with diarrhoea in the last 2 weeks taken to a health facility
58 65 56
Mothers who had at least three antenatal care visits for their last birth
51 74 43
Mothers who consumed IFA (a vitamin A supplement tablet) for 90 days or more when they were pregnant with their last child
22 35 18
(Kumar 2007)
12 This however is changing with the introduction of NRHM (National Rural Health Mission) in 2006. Early evaluation results show optimistic progress in institutional delivery, new household toilets, and creation of infrastructure for primary health care.

23
Despite the importance of breastfeeding and appropriate feeding for preventing malnutrition, only 23 per cent of children under three years were breastfed within one hour of birth and less than half the babies (46 per cent) aged 0-5 months were exclusively breastfed. Equally striking is the low proportion of children of 6-9 months – 56 per cent – who received solid or semi-solid food and breast milk. It is well known that frequent illnesses during early childhood and failing to treat them properly seriously affects the nutritional well-being of children. With only one exception, namely, children aged 0-5 months exclusively breastfed, all other indicators reveal lower reach and access to health services and care in rural than in urban areas. And this explains at least partially the higher levels of under-nourishment in rural than in urban areas. Also affecting the health and nutritional well-being of children is the status of women’s health and their access to maternal care services.
Inter-state differences - By and large, in the four states with the lowest proportion of underweight children – Punjab, Kerala, Jammu and Kashmir and Tamil Nadu – provisioning of health services, care of children especially newborns and the nutritional status of women are better than in the four high malnutrition states of Chhattisgarh, Bihar, Jharkhand and Madhya Pradesh. For instance, the proportion of fully immunised children varied between 60 and 81 per cent in the low malnutrition states and between 33 and 49 per cent in the high malnutrition states. In the low malnutrition states, between 73 and 97 per cent of mothers received at least three antenatal care visits; this proportion varied between 17 and 55 per cent in the high malnutrition states. And whereas 14-24 per cent of women in the low malnutrition states have a BMI below normal, the proportion varied from 40-43 per cent in the high malnutrition states. There are, however, some exceptions that need more careful examination. Chhattisgarh and Jharkhand seem to be doing much better in their efforts to promote exclusive breastfeeding in the initial years of a child’s life. Eightytwo per cent of children of 0-5 months in Chhattisgarh and 58 per cent in Jharkhand are exclusively breastfed whereas in the low malnutrition states, the highest proportion is 56 per cent in Kerala. Also, it is disturbing to find that Gujarat ranks among the top five states reporting the highest proportion of underweight children – a phenomenon that needs a closer examination.
The proportion of fully immunised children during 1998-99 to 2005-06 has declined surprisingly, in eight states – Andhra Pradesh, Gujarat, Himachal Pradesh, Karnataka, Kerala, Maharashtra, Punjab and Tamil Nadu – generally regarded as better performing states in health and economically more prosperous than other states. On the other hand, immunisation coverage rates have shown a significant improvement in West Bengal, Bihar, Jharkhand and Chhattisgarh.
On the whole, children’s access to certain critical components of treatment of childhood diseases has declined over the past seven years. For instance, the proportion of children with diarrhoea who received ORS in the two weeks preceding the survey had risen from 18 per cent in 1992-93 to 27 per cent in 1998-99; but since then it has fallen to 26 per cent in 2005-06.
The contrast between India and China13 is also of some interest in this context. There is evidence of a steady growth in the heights of Chinese children in recent decades, not only during the period of fast economic growth that followed the “economic reforms” of the late 1970s, but also before that. For instance in a representative
13 This para is based on Deaton and Dreze 2008

24
sample of Chinese children aged 2-5 years, the average increase in height between 1992 and 2002 was 3 cm in rural areas (for both boys and girls), and even higher in urban areas (3.6 cm and 3.8 cm for boys and girls, respectively). According to an earlier study, “the average heights of Chinese children between the ages of 7 and 14 years increased by approximately 8.04 cm between 1951-8 and 1979”. NNMB data suggests much slower growth rates and heights of Indian children. The increase in children’s heights between 1975-9 and 2004-5 was a little below 2 cm per decade at age 3, and barely 1 cm per decade at age 5. The NNMB data also suggests that the growth rates of heights and weights were particularly slow in the later part of this period, with, for instance, very little growth in the heights of children at age 5 between 1996-7 and 2004-5.
3.6 Women’s malnutrition14
According to NFHS-3, while more than one-third of women suffer from CED during 2005-06, over half the women in the age group of 15-49 years suffer from iron deficiency anaemia. The incidence of anaemia among pregnant women is even higher: nearly 59 per cent.
The implications that women’s malnutrition have for human development are multiple and cumulative. It tends to increase the risk of maternal mortality. Maternal short stature and iron deficiency anaemia, which increase the risk of death of the mother at delivery, account for at least 20 per cent of maternal mortality. Additionally, maternal malnutrition impinges significantly on such important but interconnected aspects as intrauterine growth retardation, child malnutrition and rising emergence of chronic diseases, among others.
Why has malnutrition been so high among women in India? The reasons are multiple and complex. Seemingly, the discriminatory practices associated with the rigid social norms and the excessive demands made on the time and energies of women join hands with the usual determinants in blighting women’s nutrition. However, one of the usual determinants, namely poverty, seems equally important: not only is poverty one of the basic causes of malnutrition, but also malnutrition is considered to be both an outcome and a manifestation of poverty.
Table 15 gives the data for women’s nutrition for various social and economic groups, suggesting huge socio-economic disparities.
Thus nearly 47 and 68 per cent of women (15-49 years) from the scheduled tribes suffer from CED and anaemia, respectively. What is more, more than one-third of them suffer from the double burden of CED and anaemia together. The incidence of malnutrition declines with the so-called rise in social status. By extension, such decline also means huge disparities between social groups: more than 15 percentage points difference is found between women from ST and others. Thus, the proportion of women suffering from CED and anaemia together among ST comes closer to double the proportion of the same among advantaged social groups. More than 50 and 64 per cent of women from the poorest quintile suffer from CED and anaemia, respectively. Also, about one-third of them suffer from the double disadvantage of CED and anaemia. As we have observed among social groups, malnutrition among women goes down drastically with a rise in the household wealth status, creating equally large disparity between the wealth groups. The proportion of the poorest
14 This section is based on Jose and Navaneetham 2008.

25
women suffering from CED and anaemia together comes around to more than three times that found in the highest quintile.
Table 15: Women’s nutrition for Social and Economic Groups (in per cent)
CED Anaemia CED and Anaemia
Both Either Neither
Social groups
ST 46.6 68.5 33.5 47.8 18.7
SC 41.1 58.3 25.7 47.7 26.6
OBC 35.7 54.4 20.8 48.3 30.9
Others 29.2 51.1 16.8 46.6 36.6
ST/others 1.60 1.34 1.99 1.03 0.51
Wealth groups
Lowest 51.5 64.3 34.0 47.5 18.5
Second 46.3 60.3 29.0 48.3 22.7
Middle 38.3 56.0 22.9 48.2 28.9
Fourth 28.9 52.2 16.4 48.2 35.4
Highest 18.2 46.1 9.4 45.5 45.1
Lowest/highest 2.83 1.39 3.62 1.04 0.41
It is also important to add here that the proportion of women suffering from anaemia is not low even within the richest quintile. This suggests that a substantially large proportion of women in India, irrespective of the household wealth status, suffer from iron deficiency anaemia. The huge disparity in women’s malnutrition between economic and social groups in India is a matter of serious concern, as the levels of nutritional attainment appear to be not only unequal but also unjust.
Further analysis would suggest that though economic and social disparities matter significantly and independently, the former seems to matter more, at least as far as women’s malnutrition is concerned, than the latter. Eastern states, mainly Bihar, Jharkhand, Orissa and West Bengal, emerge as the repository of women’s malnutrition in India. Though these four states account for 22 per cent of women considered for the analysis, 30 per cent of women suffering from CED and anaemia together live in these states.
How does one change the situation? Ensuring equity in women’s rights to land, property, capital assets, wages and livelihood opportunities would undoubtedly impact positively on the issue, but underlying the deep inequity in woman’s access to nutrition is her own unquestioning acceptance of her status as an unequal member of the family and society. Eventually, gender empowerment alone is likely to be the key to the resolution of the hunger challenge amonst women in India (Ramachandran 2007)

26
3.7 Child mortality
Malnutrition in children weakens their immune system, making them more susceptible to disease and less able to fight off infection. It has been estimated that a child is almost ten times more likely to die from key diseases if he/she is severely underweight, and two and a half times more likely to die if he/she is moderately underweight, as compared to an average weight child (Black et al., 2008). Given the fact that more than 3.5 million children die globally on account of under-nutrition, it emerges as a major factor leading to child deaths. Therefore, under-five mortality has been taken by IFPRI as the third indicator for measuring Hunger Index.
Figure 2: Neonatal, infant , child and under-five mortality rates
About 2.1 million deaths occur annually in under-5 year-old children in India. Seven out of every 10 of these are due to diarrhea, pneumonia, measles, or malnutrition and often a combination of these conditions.
Child mortality is known to be the outcome of a wide variety of factors, such as nutritional status of the child and its mother, food availability in the family, level of immunization, availability of maternal and child health services, economic status, availability of safe drinking water, basic sanitation, and so on. India accounts for 21 percent of a total of 9.7 million children dying globally before they reach the age of five. This is despite the fact that child mortality has declined by 48 percent (from 142 to 74) between 1990 and 2006. Under-five mortality has strong co-relation with the education level of mother; while it was 94.7 for illiterate mothers, it was only 29.7 for those who had 12 years of education. As expected, child mortality is highest at 95.7 for ST social groups, followed by 88.1 for SCs, and 59.2 for others (excluding OBCs for whom it was 72.8).
NFHS-3, reflects, to a large extent, the limited access to and reach of public health services for women and children. In 2005-06, for instance, only 44 per cent of children of 12-23 months were fully immunised. The national immunisation coverage in urban areas has slipped over the past seven years from 61 per cent in 1998-99 to 58 per cent in 2005-06 and has increased only slightly in rural areas from 37 per cent to 39 per cent. Only 26 per cent of children with diarrhoea were given oral rehydration salt (ORS) and barely two-thirds (64 per cent) of children suffering from acute respiratory infection or fever were taken to a health facility. This shows both the poor reach of public health services and also the limited accessibility of such services to children. There are huge gaps in women’s access to and reach of maternal health
57.0
109.3
94.9
74.3
39.043.4
48.6
78.5
67.6
18.4
29.333.4
0
20
40
60
80
100
120
NFHS 1 NFHS 2 NFHS 3
Neo- natal mortality Infant mortality
Child mortality Under f ive mortailty

27
services. Improvements in women’s access to safe delivery, for instance, have been minimal. Between 1998-99 and 2005-06, the proportion of births assisted by a doctor, nurse, LHV, ANM or other health personnel went up marginally from 42 to 48 per cent; and institutional births went up from 36 per cent to 41 per cent over the same period.
A study conducted by Save the Children, which compares child mortality in a country to its per capita income, shows that India lags far behind its poorer neighbours like Bangladesh and Nepal, when it comes to reducing child deaths. A new Wealth and Survival Index, which is part of the study, has ranked 41 countries on the criterion of how well they use their resources to boost child survival rates. While Bangladesh and Nepal are listed in the top ten performers, India stands at a low 16th in the index. This can be elucidated by comparing India and Bangladesh. While India’s per capita income increased by 82 percent from 2000 to 2006, its child mortality rate declined from 94 to 76 per 1000 live births. As against that, over the same period, Bangladesh saw a much smaller increase in per capita income – only 23 percent – but its child mortality dropped from 92 to 69 (UNICEF 2007).
4 Food security
4.1 Consumption and prices
The NSSO data on consumer expenditure on food consumption indicates a declining trend in the annual per capita consumption of cereals, for all classes of people, as shown in Table 16.
Table 16: Trends in Cereal Consumption across Expenditure groups (kg per month)
RURAL Percentile
lowest 5 per cent
5 per cent-10 per cent
40 per cent-50 per cent
90 per cent- 95 per cent
95 per cent-100 per cent
1993-94 9.68 11.29 13.33 14.98 15.78
1999-00 9.78 11.15 12.89 13.73 14.19
2004-05 9.88 10.87 12.16 12.77 13.50
URBAN Percentile
lowest 5 per cent
5 per cent-10 per cent
40 per cent-50 per cent
90 per cent- 95 per cent
95 per cent-100 per cent
1993-94 8.91 10.11 10.99 10.19 10.29
1999-00 8.99 10.15 10.80 9.94 9.72
2004-05 9.25 10.04 10.25 9.50 9.10
NSSO 2007, 61st Round Report
The above Table clearly shows that as India moved to greater prosperity in the last twenty years the cereal consumption of the rich went down, but there was no increase for the poor. At any given point of time cereal intake of the bottom 10 percent in rural India continues to be at least 20 percent less than the cereal intake of the top decile of the population, despite better access of the latter group to fruits, vegetables and meat

28
products. Their sedentary life style too should be taken into account while assessing the difference between the two groups. For the upper segment of population the decline may be attributed to diversification in food consumption, easy access to supply of other high value agricultural commodities, changed tastes and preferences, and consumption of more expensive non-foodgrain products (Mittal, 2006). Higher economic growth and per capita incomes thus contribute to reduction in per capita demand for cereals for the rich.
However for those who are around the poverty line, this has to be understood as a distress phenomenon, as with marginal increase in their incomes over time they are forced to cut down on their food consumption to meet other pressing demands that were not perceived important in the past. For instance, as more schools open, the poor too wish to send their children to schools, where expenses are incurred on clothes, books, etc. despite the school fees being met by government. These expenses would thus become a new item on the household budget, and food expenditure may be curtailed to make room for it. Fighting sickness leads to another chunk of essential expenses, for which opportunities did not exist in the past, as there were no doctors in the vicinity. The share of fuel and light in total consumer expenditure has risen from under 6 per cent to 10 per cent in both rural and urban areas between 1972-73 and 2004-05. Finally, the rural labouring masses have to spend on transport in order to earn their livelihoods. Food is still needed, but not demanded.
A survey (Mander 2008) of 474 destitute people in eight villages found that intense food shortages often demand the most unreasonable choices, such as between food and medicines, between eating to save life and relieving unbearable pain. Most hungry people reported that their most hazardous tumble into pauperisation was because they, or a loved one, fell gravely ill. Many old people simply try to wait out an attack of illness, and if that does not work they consult a local untrained practitioner, who demands his fees in advance, never guaranteeing cure. They do this by cutting back their food intake even further.
Food prices - Between 1972-73 and 2004-05, the share of food in total consumer expenditure has fallen from 73 per cent to 55 per cent in rural areas and from 64 per cent to 42 per cent in urban areas15. Could the falling share of food expenses in the total budget of the poor be because of rising food prices? Not likely. In rural India, food (and therefore calorie) prices moved along with general prices from 1983 until about 2000, and then fell by a little less than five percent relative to general prices. In urban India, there was a slow secular increase in the relative price of food, by less than five percent, from 1983 until the late 1990s, followed by a more pronounced decline, by more than ten percent, until the end of the period. In both sectors, the relative price of food was lower in 2004-05 than at the start of the period in 1983. The decline in food consumption cannot therefore be attributed to any increase in the relative price of food. As already pointed out, food budget has been squeezed out because the cost of meeting the minimum non-food requirements has increased (Sen 2005). Thus, it is not possible for households around the poverty line to purchase their initial food basket within their current food budget.
15 NSSO 61st round (Report No. 508)

29
Figure 3: Changes in price index (1993-94=100)
100120140160180200220240
1994
-95
1995
-96
1996
-97
1997
-98
1998
-99
1999
-00
2000
-01
2001
-02
2002
-03
2003
-04
2004
-05
2005
-06
2006
-07
2007
-08
Primary articlesFood articlesAll commodities
However, as figure 4 shows, there has been faster increase in food prices after 2005-06. This has resulted in higher spending on cereals, but the quantity of cereals consumed has not increased. The average per capita monthly rural consumption of cereals fell from 11.92 to 11.69 kg, but the price increased from 106 to 115 Rupees between 2005-06 and 2006-07. For urban areas the figure was from 9.76 to 9.63 kg, and the increase in money spent was from 110 to 119 Rupees (Economic Times 11th November, 2008, based on NSSO 63rd round).
4.2 Food production, procurement and availability at the macro-level
At the macro level foodgrain availability in India is calculated as 87.5 per cent of gross production (the rest estimated as requirement for seeds, farm animal feed, and waste) plus net imports minus changes in government stocks. Assuming no net change in private stocks it could be taken as a good proxy for overall foodgrains consumption in the country.
During the last fifty years before Independence foodgrain availability declined from 545 grams to 407 grams per head per day. Considering five-year averages India saw a rise in the foodgrains availability per head from 416 grams during 1950-55 to 485 grams by 1989-91 (Patnaik 2004). However since then there has been the slide-back to a low of 445 gram per head per day by 2006, a level not seen since the early drought years of 1970s.
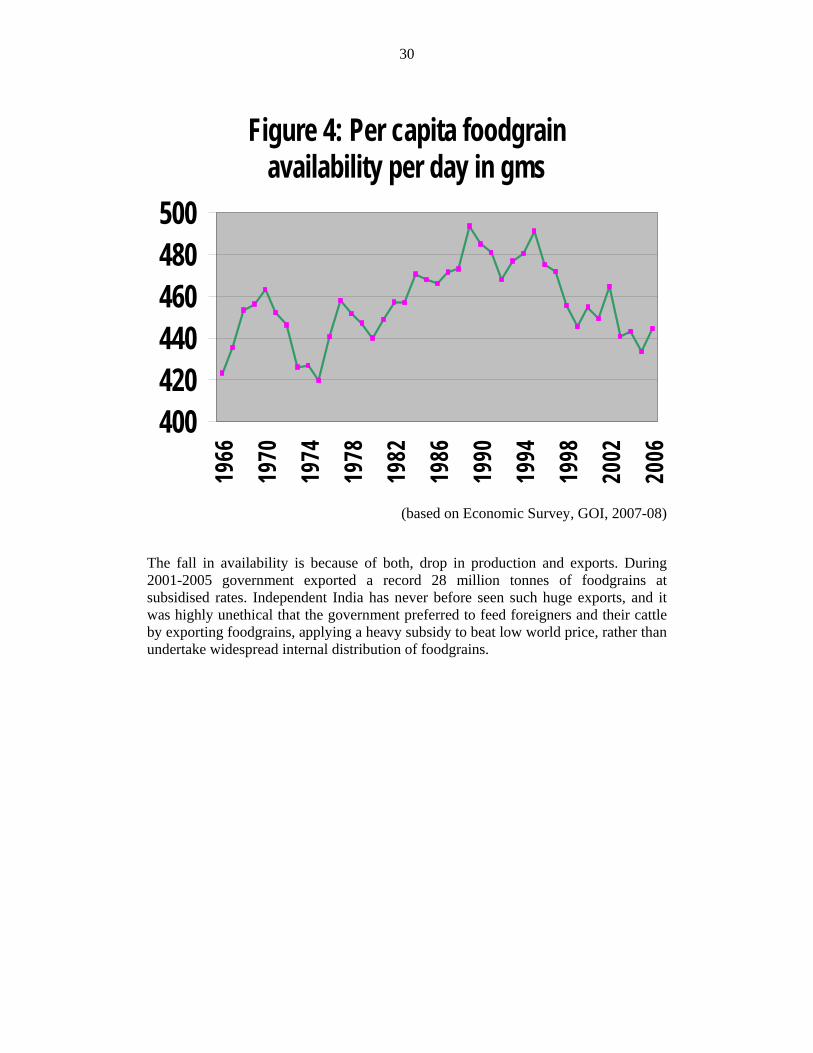
30
Figure 4: Per capita foodgrain availability per day in gms
400420440460480500
1966
1970
1974
1978
1982
1986
1990
1994
1998
2002
2006
(based on Economic Survey, GOI, 2007-08)
The fall in availability is because of both, drop in production and exports. During 2001-2005 government exported a record 28 million tonnes of foodgrains at subsidised rates. Independent India has never before seen such huge exports, and it was highly unethical that the government preferred to feed foreigners and their cattle by exporting foodgrains, applying a heavy subsidy to beat low world price, rather than undertake widespread internal distribution of foodgrains.

31
Figure 5: Annual per capita production of foodgrains (average of five years)
180
185
190
195
200
205
1990-95 1995-00 2001/04 2005/08
(based on Economic Survey, GOI, 2007-08)
Despite the fact that growth of foodgrain production in the period 1989-2004 was lower than the increase in population during the same period, procurement of cereals on government account went up, suggesting a decline in poor people’s consumption and their purchasing power. This may have happened because of the structural imbalances (high MSP, rising capital intensity, lack of land reforms, failure of poverty alleviation programmes, no new technological breakthrough in agriculture, etc.) created in the economy, as well as due to production problems in less endowed regions (erratic rainfall, soil erosion and water run-off, lack of access to credit and markets, poor communications) which led to a dangerous situation of huge surplus in FCI godowns during 2000-03 coupled with widespread hunger.

32
Figure 6: Average annual imports in Million Tonnes
-8
-6
-4
-2
0
2
4
6
8
1952-56
1957-61
1962-66
1967-71
1972-76
1977-81
1982-86
1987-91
1992-96
1997-01
2002-06
(based on Economic Survey, GOI, 2007-08)
Falling availability and increase in government procurement reflects a contraction of effective demand16, as the poor are forced to spend a greater part of their incomes to transport, health, and education. In other words, non-food items have become more “essential” than food in a particular sense. This argument is supported by empirical evidence from various sample surveys, as between 1972-73 and 2004-05 the share of food in total consumer expenditure has fallen from 73 per cent to 55 per cent in rural areas and from 64 per cent to 42 per cent in urban areas (Ramachandran 2008).
16 This is despite the fact that the expenditure of bottom three deciles increased by about 10 per cent during 1993-2005.

33
Figure 7: Stocks of foodgrains in government godowns in July in million tonnes
15
25
35
45
55
6519
98
1999
2000
2001
2002
2003
2004
2005
2006
2007
2008
(based on Economic Survey, GOI, 2007-08)
Because of lack of growth in agriculture after the mid-1990s there has been employment decline, income decline and hence fall in aggregate demand by the rural poor. Normally when there is a fall in per capita output and government stocks get depleted, net imports take place in order to maintain availability per head at an unchanged level; but precisely the opposite happened in India during 1999-2004. Despite falling per capita output, there were both rising net exports as well as huge addition to stocks year after year. This was a highly abnormal situation never seen before in independent India: it reflects the unprecedented magnitude of continuous demand-deflation of foodgrains, especially in the rural sector since 1996 (Sen 2004).
4.2.1 Recent developments and imports17
When GOI decided to open up wheat procurement for large companies in 2006 the official procurement fell from a high annual level of 15-19 million tonnes in 2002-05 to 9 million tonnes only in 2006. It had to resort to massive imports of 5.4 million tonnes in 2006 followed by 1.8 million tonnes in 2007 at a price higher than what it paid to its farmers. After these difficulties government became careful and banned export of wheat as early as February 2007, and the export of non-basmati varieties of rice in October 2007 to prevent domestic shortage due to export. The bumper foodgrain harvest in 2007-08 and various direct and indirect restrictions on large-scale purchases by the private sector in 2008 helped GOI procure an impressive 23 MT of wheat which also helped in controlling its market price. However, the biggest factor that prevented a sharp rise in food prices in India was that fertiliser prices and diesel prices were not increased in response to the increase in international prices. It is worth mentioning that about half of the increase in global food prices is due to the increase
17 Based on Chand 2007, 2008

34
in prices of crude oil. By providing a subsidy on fertiliser and diesel, India could ensure that the increase in global crude oil prices, which raised global food prices by 47 per cent, does not affect food prices in India.
4.3 Global developments
The per capita annual production of cereals in the world increased from 271 kg during 1961-65 to 295 kg during 1966-70, which were the initial years of the green revolution. The uptrend continued for about two decades and per capita cereal production peaked by the mid-1980s at a level of 334 kg per person per year. The growth rate of cereal production decelerated to 1.09 per cent after the mid-1980s, compared to 2.51 per cent in 1961-85. The recent growth rate turned out to be lower than the growth rate in population even though the growth rate in population was coming down. The per capita production of cereals declined to less than 315 kg in the first eight years of the 21st century (Chand 2008).
Though there is some improvement in per capita availability of cereals during the last four years (2003-07) this increase has not been available for use as food and feed, due to diversion of foodgrain for production of biofuel. When total production is netted out for the corn used for biofuel in the United States then per capita production falls to 307 kg, the lowest in any five-year period after 1966-70. This shows that the shortage of staple food has been building up over several years and it became quite large in the recent years.
The per capita consumption of cereals, meat, milk and eggs in India, China, US and the World averages are presented in Table 17.
Table 17: Per Capita Consumption during 2004-06 (kg/year)
India China US World
All cereals 175.1 287.9 953 316
Meat 5.3 56.8 126.6 40.2
Milk 84.5 22.7 Na 97.8
Eggs 1.8 21.6 15.2 9.7
Chand 2008
It is pertinent to mention that consumption here indicates total use as food and feed which thus captures the impact of dietary change on cereal demand as feed. The per capita consumption of cereals in the US is 953 kg, which is three times the World average, 3.3 times the average in China and 5.4 times the average in India. The main factor behind such a high level of cereal consumption in the US is their meat and egg consumption. An average US consumer consumes 127 kg of meat in a year, which is more than the quantity of meat consumed by 25 consumers in India. So much for President Bush’s statement that the international food prices are rising because of higher consumption in India and China!
4.3.1 Recent global financial crisis
The recent global meltdown in the financial and equity markets follows hard on the heels of soaring food price and energy crisis caused primarily on account of intensified bio-fuel programme. The global commodity prices, though still ruling high, has marked a dip due to good harvest in the current season. According to the latest issue of FAO's Crop Prospects and Food Situation report, global grain

35
production this year is forecast to increase 4.9 per cent to a record 2,232 million tonne. Commodity prices have dipped in recent times as investors have apprehended recession. Wheat futures for December delivery closed at recently at 62 per cent down from a record set in February. Corn futures dipped 53 per cent from their all-time high and soybean futures registered 47 per cent lower18.
Commodity prices are currently declining, mainly on the expectation of favourable crop prospects but also due to the threat of a global recession. It is feared that borrowing, bank lending, official development aid, foreign direct investment and workers' remittances may be compromised by a deepening financial crisis. The impact of the financial crisis may also be felt in developing countries at the macro level with potentially negative impact on agriculture and food security. The falling grain prices and liquidity problems may cause lower investment in agriculture and shrinkage in crop area and reduced harvest in the major exporting countries. Given the low grain stock, this situation can lead to another turn of record high food prices next year. Subprime meltdown, downturn in the equity market, intensification of bio-fuel programme leading to use of food for fuel and consequent rise in food prices, speculation in commodity futures, fluctuations in currency exchange rates, the threat of recession, increasing corporate monopoly over the farm sector and wilful distortion in global farm trade have collectively endangered food security.
However global financial crisis should not be used as an excuse for inaction in the worsening battle against wrenching hunger across the developing world. The world now has the responsibility of fulfilling the Millennium Developmental Goals (MDGs) by lifting nearly one billion people out of poverty, who do not have enough food to eat on a day-to-day basis. This is the time to think of an alternative model of development as the belief in the self-regulating market was no longer credible.
Implications for India - India has almost insulated itself against transmission of the current level of an abnormally high global prices of cereals. Wheat prices in India increased by about 20 per cent between December 2005 and 2006, which is considered quite high. International prices in the same period increased by 24 per cent. What is remarkable is that between December 2006 and December 2007 international wheat prices increased by 80 per cent, whereas domestic prices declined by 1.3 per cent. The annual rate of inflation estimated on a month-to-month basis shows that food price inflation in international markets19 in the first half of this year has crossed 40 per cent, whereas in India it has remained below 8 per cent. This was due to
• an increase in food production during 2006-07 and 2007-08 in which favourable weather also played an important role,
• timely and effective government intervention in the domestic market, and
• almost complete insulation of the cost of crop production from transmission of the increase in crude oil prices in the international market.
18 Based on http://www.financialexpress.com/news/global-meltdown-to-have-a-negative-impact-on-food-security/379640/0 19 There are indications of sharp fall in the international food prices in the last three months.

36
4.4 Future scenario for India’s food production
While in the short and medium term, there might be surplus of cereals in the country, primarily due to lack of purchasing power, these prospects are likely to diminish in the years to come (Mittal 2008; Chand 2007a).
Demand projections in general are estimated on the basis of assumptions about the base year demand, population, expenditure elasticity and economic growth. Assuming that GDP growth rates to be 8 per cent for the next twenty years, the total cereal demand projected for 2011 and 2026 is 188 and 274 million metric tonnes respectively. As regards projections of supply of cereals, it is estimated to be 210 mt in 2011, 242 mt in 2021 and 260 mt in 2026. Thus India may be somewhat surplus in the short run, but is likely to fall short of the demand in the long run. This situation is even more alarming for edible oil, sugarcane and pulses. To meet the future food requirements, the country shall have to either increase agricultural production, or depend on imports. If India wishes to avoid large scale imports the policy focus needs to be laid, towards productivity enhancement in agriculture, through public investment in irrigation, development of roads, power, and extension.
Unfortunately the trend so far has been disappointing. After recording unprecedented high growth of 4.7 per cent a year during the period of Eighth Five Year Plan (1992-1997), growth of the agriculture and allied sectors decelerated to 2.1 per cent during the Ninth Plan (1997-2002). It further dipped to 1.0 per cent during the Tenth Five year Plan (2002-07) against the targeted growth of 4 per cent per annum.
India’s low average wheat and rice yields compared with other major world producers suggest that there is significant scope to further boost yields and output. Rice yields are among the lowest for major producers and wheat yields remain near the world (and U.S.) average despite the fact that a relatively high share—about 87 percent—of Indian wheat area is irrigated. Although roughly 90 percent of wheat area and 75 percent of rice area is already planted to HYVs, average wheat yields in major States remain about 25 percent lower than levels achieved in experiment stations, while rice yields are about 50 percent lower (Jha et al 2007). Increasing the yields would however need new policies, discussed in section 5.1.1.
5 Analysis of major programmes and policy options
5.1 Agricultural production
The agricultural scene in India in the last fifteen years has four features that distinguish it from the earlier ‘green revolution’ phase (1970-85). First, the policy approach to agriculture in the 1990s has been to secure increase in production through subsidies on inputs such as power, water, and fertilizer, and by increasing the minimum support price (MSP) rather than through building new capital assets in irrigation, power and rural infrastructure. According to the Planning Commission, budgetary subsidies in agriculture increased from around 3 percent of agricultural GDP around the late-1970s to about 7 percent in the early 2000s. During the same period, public investment in agriculture declined from 3.4 percent of agricultural GDP to 1.9 percent (Bisaliah 2007).
This has shifted the production base from low-cost regions to high-cost ones, causing an increase in the cost of production, regional imbalance, and an increase in the burden of storage and transport of foodgrains. The equity, efficiency, and sustainability of the current approach are questionable. The subsidies do not improve income distribution or the demand for labour (Saxena 2004). The boost in output from

37
subsidy-stimulated use of fertilizer, pesticides and water has the potential to damage aquifers and soils – an environmentally unsustainable approach that may partly explain the rising costs and slowing growth and productivity in agriculture, notably in Punjab and Haryana. Although private investment in agriculture has grown, this has often involved macroeconomic inefficiencies (such as private investment in diesel generating sets instead of public investment in electricity supply). Public investment in agriculture has fallen dramatically since the 1980s and so has the share of agriculture in the total gross capital formation (GCF). Instead of promoting low-cost options that have a higher capital-output ratio, present policies have resulted in excessive use of capital on the farms, such as too many tubewells in water-scarce regions.
Second, the intensity of private capital is in fact increasing for all class of farmers, but at a faster pace in the ‘Green Revolution’ areas and for larger farmers. Thus, fertilisers, pesticides and diesel accounted for a mere 14.9 per cent of the total inputs in 1970–1 but 55.1 per cent in 1994–5. For a large farmer in commercialised regions their contribution may have now become as high as 80 per cent. But the proportion of output sold has increased at a much slower rate than the proportion of monetised inputs, including hired labour. The implication of this is a resource squeeze in agriculture. Whereas the need for resources to purchase these inputs has been increasing, the marketable surplus has been increasing at a slower rate to contribute to this, as the growth of non-farm employment has become very sluggish. It is not surprising that the repayment of loans is such a problem in Indian agriculture and has even led to suicides in some cases. A better strategy would be to concentrate on small and marginal farmers, and on eastern and rainfed areas where returns to both capital and labour are high. The need is also for better factor productivity in agriculture and for new technologies, which would be more labour intensive and would cut cash costs.
Whereas the use of capital has increased amongst the small and marginal farmers, markets in eastern and central India continue to be imperfect. Therefore the poor farmers are forced to sell part of their product to payoff their loans (mostly from informal sources) for purchased seeds, water and fertilizer, but they do not get a good price and market conditions benefit the trader and moneylender more than it benefits the producer.
Third, the proportion of total bank credit earmarked for agriculture has steadily fallen from near 18 per cent in the mid-1980s to 10.0 per cent in 2005-2006. This decline has been much sharper in direct lending. A substantial part of agricultural loans since the 1990s has been in the form of indirect credit, that is, lending for various intermediary agencies and instruments like the Rural Electrification Corporation (REC), the special bonds issued by NABARD (National Bank for Agriculture and Rural Development) and deposits placed by banks in Rural Infrastructure Development Fund (RIDF) in lieu of priority sector lending. In the same period there has been a precipitate fall in small borrowal accounts (credit limits of Rs 25,000 or below) from 62.55 million to 36.87 million or more pointedly, in terms of amount outstanding from 25 per cent to 5.4 per cent. Small loans are mostly agricultural loans.
Undoubtedly, institutional credit has been scarce for the agricultural sector rather significantly in the 1990s and in this decade. Are banks reluctant to offer agricultural loans because their earning potential from these loans has been relatively low? A

38
more palpable cause for the banks’ poor lending to agriculture or to small borrowers is their professional reluctance to operate in rural areas. And this is a more daunting issue to be addressed. Given the option, the scheduled commercial banks will not operate in rural areas. Since March 1995 after the disbanding of branch licensing policy and the grant of freedom to bank boards, the number of rural branches has declined from 32,981 to 32,137, i.e., the closure of roughly 840 rural branches instead of an addition of at least 8,000 branches under normal circumstances. This approach to rural banking has spawned a serious institutional vacuum in rural credit. It is no use goading banks to expand rural and agricultural credit base without ensuring that there is an adequate spread of the institutional network for rural lending.
And lastly, groundwater as opposed to surface and sub-soil (through shallow wells) water has become the main source of irrigation. Due to this nearly 30 percent of the blocks in the country are presently classified as semi-critical, critical or overexploited (mostly in ‘green revolution’ areas) as groundwater use exceeds the rate of groundwater recharge. As there is no effective control over digging of tubewells in water-scarce regions, farmers are borrowing money from informal sources at high interest rates to dig tubewells, but many such borings fail leading to indebtedness, and even suicides by some of them. Since sinking a bore well involves a heavy investment upfront, it is the rich and the affluent farmer that goes in for it, whereas the small farmer continues to depend on the shallow dug well that has been in existence for decades. Bore wells drain much larger quantities of water and it is usually from the same aquifers that feed the dug wells. It is the small farmer that gets adversely affected in the village when the richer farmers install bore wells fitted with electric motors. It is the affluent farmers owning bore wells and electric motors that corner most of the benefit of electricity subsidy. Ironically, they in turn sell their surplus water to the adjacent small farmers at commercial rates. The built-in biases of the green revolution strategy now stand exposed.
The impact of these four factors has been increasing landlessness, sharpened inequalities (both inter-state and inter-class), and stagnation in production. The index number of agricultural production rose by 4.4 per cent annually during the 1980’s, but dropped to 2.8 per cent during 1990-91 to 1996-97, and the growth rate further plummeted to just 0.5 per cent in the next ten years. Similar is the trend for foodgrains. During the eleven year period 1996-2007, foodgrain production increased only by 9 per cent, from 199 to 217 mT, or much less than one per cent a year as against an annual rate of growth of 3.5 percent achieved during the 1980s. The availability of cereals declined from a peak of 468 grams per capita per day in 1990-91 to 412 grams per capita per day in 2005-06, indicating a decline of 13 per cent during this period. The availability of pulses declined from 42 grams per capita per day (72 grams in 1956- 57) to 33 grams per capita per day during the same period.
Moreover, poverty reduction has become disconnected from agricultural growth because as opposed to substantial agricultural growth in the 1980s, there was little between 1997 and 2006. This has also resulted in a slower increase of real agricultural wages, with the poorer states showing no increase or even a decline in wages. In addition, the casualisation of a mass of rural workers without safety nets, the feminization of agricultural labour accompanied by low wages, and the persistence of child labour are worrying trends.
The stagnation is despite the soaring annual cost of food subsidies, which rose from Rs 61 billion in 1996-97 to Rs 120 billion in 2000-01 to Rs 310 billion in 2007-08. If

39
subsidies on free rural power and fertilisers are added the figure may well reach a staggering figure of 1000 billion Rs, or about Rs 70 per day per poor rural family.
5.1.1 What needs to be done?
It is thus obvious that Indian agriculture is in a serious crisis, and needs several innovative policy interventions, some are discussed below.
The most important intervention that is needed is more investment in irrigation, power, and roads in poorer regions. It is essential to realize the potential for production surpluses in Central and Eastern India, where most poor live. Many states in this region do not benefit from the MSP for rice, as FCI does not buy paddy from the farmers in these states, but buys rice from the millers20. A basic focus of policy should, therefore, be to ensure effective price support in states and areas with future production potential. To achieve the growth target of 4.5 per cent in agriculture, the investment should grow at an annual rate of about 12 per cent, as compared to the present level of about 5 per cent.
Since level of public investment is an important determinant of private investment through complementary/inducement effect, the choice of public sector investment portfolio is crucial. Public investment has to be considered as a policy instrument for reducing regional agricultural development disparities and for realizing full potential of small and marginal farmer. Any demand-induced diversification would place new demands on market infrastructure (like more investment on cold storage, rural roads, communication, marketing network, etc.) and institutions. In fact, price induced crop diversification is not sustainable in the absence of back up from non-price factors such as technology, irrigation and rural infrastructure.
Water is a critical input for achieving higher agricultural growth and ensuring greater food security. Only about 40 percent of cultivated area in India is currently irrigated. Greater emphasis should be put to shift the balance in favour of surface irrigation and on the more effective use of existing irrigation systems.
Many states, however, lack the policy, regulatory, and institutional framework for efficient, sustainable, and equitable allocation and use of water, or for articulating the environmental costs of inefficient use. Many states often do not allocate sufficient public funds for the operations and maintenance of canals. This leads to the rapid deterioration of irrigation canals and reduces the availability of water to farmers. Limited cost recovery also limits funds for operations and maintenance and undercuts farmer incentives to use water more efficiently, leading to waterlogging and salinity problems in some areas. Some states have adopted participatory irrigation management on a wide scale to improve the management and sustainability of surface irrigation systems. These need to be replicated on a large scale.
Free power to farmers by some states or highly subsidized power encourages the excessive use of ground water. This has led to an increase in the over-exploited areas in the country and large fiscal costs to state governments. This must be checked.
The bans or restrictions on land leasing limit the access to land by poor and landless rural households and drive tenancy underground. They also limit the productivity of land use. However, reverse tenancy from the poor to the rich should not be legalised. 20 FCI buys paddy from farmers only in Punjab, Haryana and Andhra Pradesh. In the last few years, some states, such as Chhattisgarh and UP have started buying paddy directly from the farmers, providing to them the much needed price support.

40
Regulated markets were supposed to improve efficiency, but many official market committees such as in UP, Punjab, and Haryana make it illegal for farmers to sell through alternative channels (i.e. selling directly to millers). The markets have thus emerged as taxing mechanisms, rather than facilitating farmers to get the best price. This needs to be changed and farmers be allowed to develop direct contact with large (and even corporate) buyers, with a complete ban on exports.
The present extraction rates for both wheat and rice are about 10 to 30 percent below the international standards due to reservation of agro-processing units for small sector which uses inefficient technologies. Therefore, remove licensing controls on Roller Flour Mills and other food processing industry. De-reserve food processing units, especially rapeseed and groundnut processing units, from the SSI list. On the whole, laws and controls have repressed private foodgrain marketing, undercutting its potential contribution to long-term food security.
Finally, pay more attention to rainfed areas, especially eastern plains, where land is fertile and groundwater is still unexploited. These regions need better infrastructure of markets, roads and power.
Agriculture – poverty linkage - How is poverty reduction correlated with agricultural production? Early pessimism with green revolution (Griffin 1974) was soon replaced by an agrarian optimism that connected poverty reduction with agricultural growth. Ahluwalia (1978) observed an inverse relationship between poverty and agricultural performance for rural India as a whole. According to Lipton (1989) this was because the new Modern Varieties became smallholder-friendly, they yielded more even with low inputs, were more pest-proof, and, unlike hybrids, did not need annual replenishment of seeds. They also raise labour use per acre-year, thus benefiting the poor. Therefore one needs to stress the fundamental role of the agricultural sector in supporting rural livelihoods, generating employment and providing food security.
However there could be situations where agriculture could immiserize some people (Bardhan 1985), and therefore one must take precautions against the following developments:
• adoption of labour-displacing machinery
• eviction of small tenants by large landlords
• driving some small farmers, with limited access to resources and credit, out of cultivation and into crowding the agricultural labour market
• a similar crowding of the agricultural labour market by displaced village artisans, as the demand pattern of the new rural rich shifts away from local handicrafts and services to mass-produced urban consumer goods and services
• the use of pump sets, enabling richer farmers to appropriate communal groundwater, resulting in a possible drop in water tables and making the traditional shallow well technology even less effective than before for poorer farmers without pump sets
• the increased political bargaining power of the rural rich and surplus regions, resulting in higher administered prices of foodgrains (of which the rural poor are net buyers), while typically wages lag behind the price rises (and as monetization of wage payments increases with agricultural progress).

41
5.2 Agricultural labour and wage employment programmes
Household food security is contingent on many factors – the ability to grow enough for self-sufficiency among farming households, and/or having enough income to buy food. Access to food then depends on prices at which food can be bought or prices at which the cost of cultivation is covered to yield a decent return for others. Problems of small farmers have already been discussed above, here we touch upon the plight of the agricultural labourers.
With falling agricultural growth rates and increasing capital intensity, the growth rate of employment has lagged behind (Lanjouw and Mugai 2008). Unemployment among agricultural labour households has sharply increased from 9.5 per cent in 1993-94 to 15.3 per cent in 2004-05. There is a secular decline in employment elasticity in agriculture over time (Bhalla and Hazell 2003). What is of special significance is the predominance of women among rural workers and their larger numbers as subsidiary and casual workers.
As per the NSS data, the proportion of households without any access to land in the total rural households has increased from 25.1 per cent in 1973-74 to 38.7 per cent in 1993-94 to 40.9 per cent in 1999-00 and further to 43.1 per cent during 2004-05. Due to the increase in supply, the rate of growth of real wages of adult casual labourers has seen a declining trend, as shown below.
Figure 8: Average daily earnings of workers in Agricultural Operations (Rs) at 1986-87 prices
0
2
4
6
8
10
12
14
16
1983 1987-88 1993-94 1999-2000 2004-05
Men Women
(Jha 2007)
At the same time, casual labour and self-employment in the non-farm sector reveals greater involvement by disadvantaged groups in 2004 than in the preceding rounds. The poor are thus pushed into low-return casual non-farm activities due to lack of opportunities in the agricultural sector rather than being pulled by high returns offered by the non-farm sector. This has resulted in a decline in the wages of adult casual labourers in the urban sector during 1999-2000 to 2004-05 by 0.51 per cent annually for men and by 0.74 per cent for women (Sundaram 2007).

42
As it may take time for agriculture to create more jobs at higher wages for the poor, government needs to step in with wage employment programmes in districts where wages are depressed. However, allocations under wage employment schemes have been grossly inadequate. The legal guarantee of 100 days wages under the National Rural Employment Guarantee Act (NREGA), according to CAG, has been fulfilled in only 3 per cent of the cases. West Bengal’s poor implementation of this project left at least Rs 650 crore unspent (Anandabazar Patrika, February 3, 2008; Statesman, February 11, 2008). A great number of people are not given job cards, those who have jobs are given (on an average) 12-14 days work. In backward villages, a government survey shows that only 38 per cent of people got work under the NREGA.
According to a recent press note by the Ministry of Programme Implementation and Statistics on ‘Employment and Unemployment Situation in India: 2005-06’, among the persons of age 15 years and above in the rural area, only 5 per cent got public works, 7 per cent sought but did not get public works. In addition to increased outlays, the scheme should have a food component, now that GOI has a comfortable stock of foodgrains.
The National Rural Employment Guarantee Act (NREGA), which in principle gives every person who is willing to work, the statutory right to 100 days of guaranteed wage labour at minimum wages per family, is legally open to all the destitute people. But in practice, a study (Mander 2008) found that it remains barred to most. Old people report that they are discouraged to apply for work, with remarks such as that “you are too old and will fall sick because of the heavy work involved”. Instead of identifying less physically demanding work like standing guard at the sites, taking care of children, filling stones and soil in baskets, and planting and irrigating saplings, they are given the most back-breaking work, and are therefore themselves eventually compelled to opt out of the work. Many older widows are turned away openly: ‘When I go to ask for work, they say that this is your age to relax, but if I do not work, how will I live?’ Others are again intentionally given work that they cannot manage, so they leave “voluntarily”. We suggest as follows:
1. Ensure that single women, aged and disabled people in practice enjoy at least equal legal claim to employment in NREGA works as households ‘led’ by able-bodied men, and that their work guarantee should be extended through an amendment in the Act to 150 days.
2. NREGA guidelines and handbooks in each state should carefully identify specific tasks in public works which can be undertaken by disabled adults and aged people; and they should be encouraged to undertake such tasks when people of these categories apply for work.
3. Provide separate NREGA job cards for all ‘single’ women, regardless of whether they live alone, with dependents, or in their natal or husband’s home. Likewise for aged, infirm and disabled people who may or may not live with ‘able-bodied’ caregivers.
As already discussed, there has been no real increase in per capita food expenditure for the poor, particularly after 1987–88. In fact, the food share has fallen at all levels of per-capita expenditure, including the poverty line. Both Dharm Narain (1979) and Saith (1981) have found a very strong positive association between rural poverty and the consumer price index for agricultural labourers, therefore the poor must get not

43
only more employment opportunities at higher wages but also cheap subsidized foodgrains21, as discussed below.
5.3 Public Distribution System (PDS)
With a network of more than 0.4 million Fair Price Shops (FPS) claiming to distribute annually commodities worth more than Rs 150 billion to about 160 million families, the PDS in India is perhaps the largest distribution network of its type in the world. These shops distribute a total of 35 kg of wheat and rice to about 65 million BPL families at Rs 4.2 per kg for wheat and Rs 5.6 for rice (present market rate is about double the PDS price). Another 25 million poorest families (referred to as AAY families) get 35 kg of foodgrains at a highly subsidized rate of Rs 2/ per kg. for wheat and Rs 3/ per kg for rice. In addition there are welfare schemes such as hot cooked mid-day meals (MDM) for school going children, and supplementary nutrition (SNP) for pre-school children.
The overall lifting under PDS and welfare schemes has shown considerable improvement in the last five years, at least on paper. The percentage offtake of BPL/AAY foodgrains as percentage of allocation has gradually improved since 2001-02 from 59 per cent to 78 per cent in 2007-08.
Table 19: Production, Procurement & Offtake of Foodgrains (in mT)
1997-98
2001-02
2002-03
2003-04
2004-05
2005-06
2006-07
2007-08
Food Subsidy in billion Rs
79 176 240 270 290 235 242 313
Production of foodgrains
192.3 212.9 174.8 213.2 198.4 208.6 217.3 230.7
Procurement of foodgrains
23.6 42.6 40.3 34.5 41.4 42.2 34.3 37.4
Distribution through FPS
17.0 13.8 20.1 24.2 29.7 31.4 31.6 33.5
Disposal though welfare schemes
2.1 8.9 11.4 13.5 10.6 9.7 5.1 3.9
Open market sale 0.06 5.6 5.66 9.66 0.25 1.1 .01 .02
Subsidised exports 0 4.7 12.5 10.3 1.0
(based on several issues of Monthly Food bulletin, Ministry of Food & Consumer Protection)
However, not all states lift their entire quota, Bihar and Orissa being the worst defaulters, lifting less than half their allotment. In 2006-07, they lifted only 22 per cent and 58 per cent of the allotted food grains for the BPL category. It is significant 21 Some marginal and small farmers may also be ‘net purchasers’ of cereals because either they do not produce enough to meet their needs, or they are forced to sell cereals soon after harvesting to meet other expenditures and buy back cereals for own consumption during lean season.
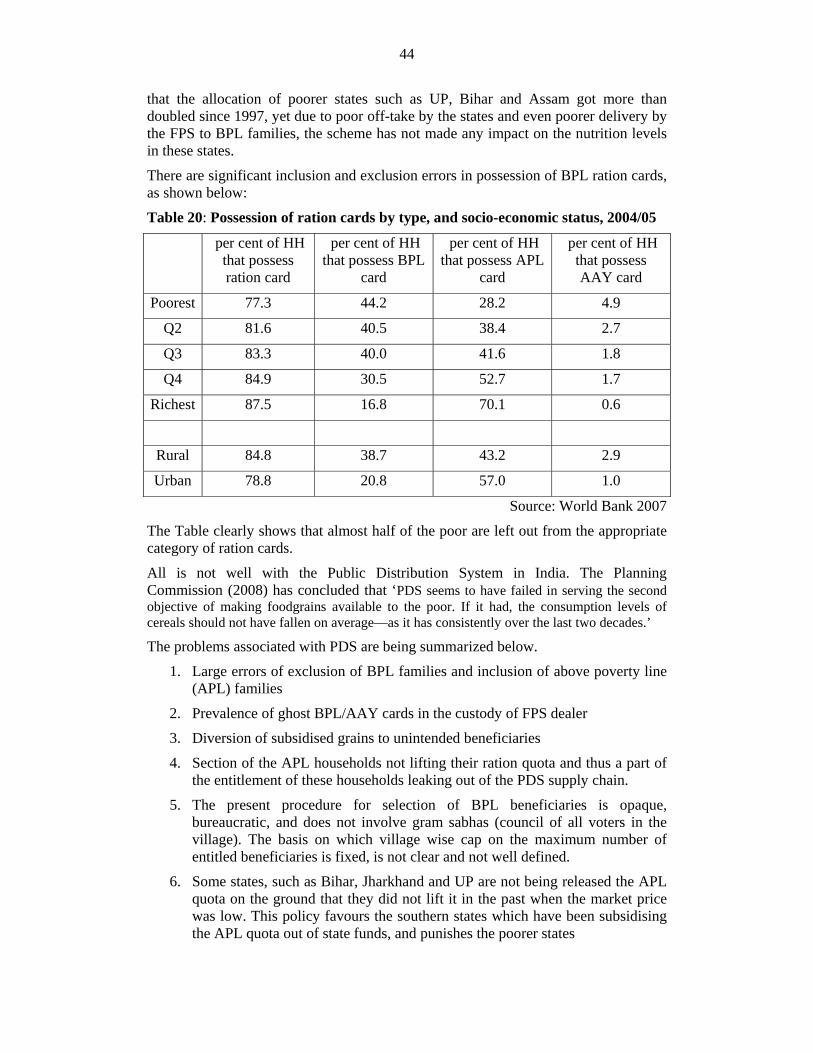
44
that the allocation of poorer states such as UP, Bihar and Assam got more than doubled since 1997, yet due to poor off-take by the states and even poorer delivery by the FPS to BPL families, the scheme has not made any impact on the nutrition levels in these states.
There are significant inclusion and exclusion errors in possession of BPL ration cards, as shown below:
Table 20: Possession of ration cards by type, and socio-economic status, 2004/05
per cent of HH that possess ration card
per cent of HH that possess BPL
card
per cent of HH that possess APL
card
per cent of HH that possess AAY card
Poorest 77.3 44.2 28.2 4.9
Q2 81.6 40.5 38.4 2.7
Q3 83.3 40.0 41.6 1.8
Q4 84.9 30.5 52.7 1.7
Richest 87.5 16.8 70.1 0.6
Rural 84.8 38.7 43.2 2.9
Urban 78.8 20.8 57.0 1.0
Source: World Bank 2007
The Table clearly shows that almost half of the poor are left out from the appropriate category of ration cards.
All is not well with the Public Distribution System in India. The Planning Commission (2008) has concluded that ‘PDS seems to have failed in serving the second objective of making foodgrains available to the poor. If it had, the consumption levels of cereals should not have fallen on average—as it has consistently over the last two decades.’ The problems associated with PDS are being summarized below.
1. Large errors of exclusion of BPL families and inclusion of above poverty line (APL) families
2. Prevalence of ghost BPL/AAY cards in the custody of FPS dealer
3. Diversion of subsidised grains to unintended beneficiaries
4. Section of the APL households not lifting their ration quota and thus a part of the entitlement of these households leaking out of the PDS supply chain.
5. The present procedure for selection of BPL beneficiaries is opaque, bureaucratic, and does not involve gram sabhas (council of all voters in the village). The basis on which village wise cap on the maximum number of entitled beneficiaries is fixed, is not clear and not well defined.
6. Some states, such as Bihar, Jharkhand and UP are not being released the APL quota on the ground that they did not lift it in the past when the market price was low. This policy favours the southern states which have been subsidising the APL quota out of state funds, and punishes the poorer states

45
7. Selection procedure of FPS dealers is not transparent, and often based on patronage or bribes
8. Inadequate storage capacity with FCI in some districts
9. Poor financial condition of many State Food Corporations who are supposed to reach grain from the FCI depot to the FPS
10. Allocations from GOI are valid only for a month, and if the state government is not able to lift within that time, its quota lapses.
11. The poor do not have cash to buy 35 kg at a time, and often they are not permitted to buy in instalments.
12. Low quality of foodgrains
13. Weak monitoring, lack of transparency and inadequate accountability of officials implementing the scheme
14. Price charged exceeds the official price
15. The shop does not open for more than 2-3 days in a month, and the card holders are not allowed to lift their quota of previous months, or in instalments during a month.
16. Ration cards are mortgaged to ration shop owners
17. No grievance redressal mechanism
18. A large number of homeless and poor living in unauthorised colonies in urban areas have been denied ration cards, and are thus not able to avail of PDS, despite being Indian citizens.
19. Seasonal and temporary migrants face problems in receiving their entitlements during the period they are out from the village.
5.3.1 Policy and procedural reforms
The following policy and procedural reforms may help in improving both the offtake of PDS rations and availability for the poor:
Improving procedure for selection of BPL –This must be changed in favour of a more transparent and participative procedure. The number of BPL cards should be fixed for each district, based on the percentage of SC, ST population and the inverse of agricultural production.
Separate cards for single women - Single adult women who live with our without dependents, as well as old people, who live with relatives by blood or marriage under the same roof, should be treated for purpose of all food schemes as separate families. Specifically this means that single adult women and old people will be eligible for separate ration cards, even if they live under the same roof and share the same kitchen. This will assure them greater dignity and autonomy. The same would of course apply to bonded workers who may stay with their employers.
Fixation of APL quota – The norm for release of APL quota should be transparent and realistic, and should be based on population and poverty. Some states, such as Bihar, Jharkhand and UP are not being released the APL quota on the ground that they did not lift it in the past when the market price was low. This policy favours the southern states which have been subsidising the APL quota out of state funds, and punishes the poorer states.

46
Abolish APL quota – One of the main reasons for the black marketing of the APL quota is the fact that GOI does not release full quota as per the number of APL cards, which gives a handle to the dealer to refuse supplies on the ground that the limited quota has already been lifted. A better option is to increase the number of BPL cards from 7.8 to 12 crores, and abolish the APL category. Including AAY, this policy would cover almost 70 to 75 per cent of the population. If the entitlement is reduced to 25 kg per card, the total requirement of foodgrains would be 14.5*12*25 =43.5 mT, which is the present level of annual procurement, and hence feasible. Small amounts can always be imported, whereas there should be complete ban on exports, except basmati rice. In its place, private traders should be allowed to import broken rice to stabilise market price of rice.
Elimination of Ghost Ration Cards – All card holders must be photographed, and their details along with their photographs should be in the public domain. This will make it easy for the civil society or consumers to check the list.
There should be only one annual order from the district indicating quota of each dealer, so that the dealer does not have to wait every month for the district to issue allotment order. The district office should also issue just one order in the beginning of the year in which quota of all the dealers can be mentioned.
Making it obligatory for dealers to sell non-cereal items: Dealers should be asked to improve their viability by selling items of mass consumption other than wheat and rice, as in Gujarat.
Selecting FPS dealer: In many states the selection needs approval by the Minister or a committee of MLAs and thus the process is highly subjective and opaque. FPS should be allotted to people who are already running a viable shop in the area. This will ensure that the shop remains open on all working days.
Reduce control of inspectors over shops: Whereas government should set up and strengthen transparent arrangements for social audit, it may be desirable to remove some of the irritants, such as no distribution can take place unless the arrival of the stock has been verified by the Inspector. The Inspectors should on the other hand meet the consumers regularly and collect Report Cards from them as regards the degree of consumer satisfaction.
Take photographs of the stock in the shop: Supply Inspectors should be supplied with cheap digital cameras so that they can show the stocks at the FPS along with that day’s newspaper and consumers, and send it to their superiors with a copy to the dealer. This would show that the grain had actually reached the shop, which often does not happen in the rural areas.
Oversight by citizens – There should be quarterly meeting of the dealer with all consumers which should be attended by senior staff.
Develop grievance redressal mechanism – State Governments should provide a free toll number, where complaints can be registered online. The entire operation should be outsourced and web-enabled, so that anyone could see how many complaints have come from each shop, and how many been satisfactorily disposed off.
Launch a drive to cover the poorest – A large number of homeless and poor living in unauthorised colonies in urban areas have been denied ration cards. A drive should be launched in collaboration with civil society to cover them in a timebound manner with ration cards, preferably AAY cards.

47
Provide cash subsidy – The economic price of foodgrains in FCI godowns (which is the cost to government after adding storage and transport) is between 9 to 11 Rs per kg. It is distributed to the consumers at Rs 2 to 6=50 per kg. Thus the Government spends about 2 to 8 Rs per kg on PDS. Since the entitlement is 35 kg per month, there is a subsidy of Rs 70 to 300 Rs per family per month. In certain urban areas government should try to give the subsidy amount as cash to the consumers and ask them to buy grain in the open market. The female head of the family should be asked to open a bank account and the amount should be centrally transferred from the bank to her without involving any intermediary or bureaucracy. The results of the pilot experiment should be carefully analysed before extending it.
Use e-governance - Banking and Information technologies have advanced rapidly and should enable governments to bring transparency and speed in all applications without extra expenditure. In addition, computerisation can help in modernising the PDS. A number of states are already innovating in PDS implementation, and improved performance can be seen in some cases. Although the introduction of modern tools such as smart cards may not be a panacea for all the evils, it can solve many of the problems particularly that of pilferage and spurious beneficiaries. They are like low hanging fruits which can be picked up easily.
5.4 Fighting children’s malnutrition
In 1993 the country evolved National Nutrition Goals for the year 2000. These included reduction by one-half of severe and moderate malnutrition among young children; reducing below 10 per cent the incidence of low birth weight; eliminating blindness due to vitamin A deficiency; reducing to 25 per cent iron deficiency anaemia in pregnant women; reducing iodine deficiency disorders to 10 per cent; producing 250 million tonnes of foodgrains; and improving household food security through poverty alleviation programmes. However these goals were not well disseminated, with the result that failure to achieve them did not attract criticism whether in legislatures or in the press.
While there have been some real success stories (Tamil Nadu), in most cases there is sufficient evidence to show that for fighting child malnutrition the GOI’s main early child development intervention, the Integrated Child Development Services (ICDS) programme, has not succeeded in making a significant dent in reducing child malnutrition. Tamil Nadu, for example, spends Rs 732 on every malnourished child annually, and West Bengal only Rs 36, which together with Rajasthan and Madhya Pradesh account for half the malnourished children in 12 major states.
ICDS, the main outlet for public spending on child nutrition, has been in existence since 1975. It operates through centers in villages, called anganwadi, where local workers are to provide nutrition and health services. While the government provides salaries for the anganwadi staff, state governments are responsible for procuring food for supplemental nutrition feeding (SNP). However, since 2005, as a result of Supreme Court direction, GOI meets half the cost of SNP.
Despite a three-fold increase in its budget by GOI in the last five years and the contention of the Ministry of Women and Child Development that there are 1.5 ICDS Centres per village now, according to the 61st round of the National Sample Survey done in 2005, ICDS is reaching only 12.5 per cent children in the age group 6 months to 6 years. As the Centre is likely to be located in the richer part of the village, it may be out of reach for the vulnerable children of poorer households and lower castes and

48
those living in remote areas. The programme targets children mostly after the age of three when malnutrition has already set in. It does not focus on the critical age group of children under three years, the age window during which health and nutrition interventions can have the most effect. Finally, ICDS faces substantial operational challenges, such as lack of monitoring.
The focus of ICDS should be health and nutrition education, encouraging women to breastfeed exclusively for six months and after that add semi-solid family food four to six times a day in appropriate quantities for the infant, which alone can improve his/her nutrition levels. We need to convert the ICDS into a true health, nutrition and development programme and not limit it to a food dole programme. For nutrition to improve, we have to strengthen proper breastfeeding and complementary feeding, together with complete immunisation and prompt management of any illness.
We propose the following measures to improve its implementation.
Shift focus to under two years: There should be increased spending on infant and young child nutrition during the first 24 months when malnutrition is frequent and disturbs the very foundation of life and development. The percentage of underweight children (moderate and severe) in 2005-06 by age is shown in Figure 8, clearly showing that malnutrition starts setting in quite fast in the age group 6 to 12 months, and that adequate precautions need to be taken at that age, otherwise malnutrition tends to become irreversible.
Figure 9: Percentage of underweight children by age
As already stated (Table 14), only 46 per cent of babies under the age of six months are exclusively breastfed. Each Centre should be given a target to increase this percentage to 90-100 per cent, and this should be monitored by independent sources.
Severe malnutrition: Rehabilitation facilities (e.g. Nutrition Rehabilitation Centres) should be available at the PHC level in each district for children suffering from Grade
4 4 .84 5 .64 4 .94 5 .9
4 0 .2
3 6 .7
2 9 .5
3 4 .7
2 0
2 5
3 0
3 5
4 0
4 5
5 0
< 6mo n th s
6 -8mo n th s
9 -1 1mo n th s
1 2 -1 7m o n th s
1 8 -2 3mo n th s
2 4 -3 5m o n th s
3 6 -4 7mo n th s
4 8 -5 9m o n th s

49
3 or 4 malnutrition, and their mothers. ICDS workers should be responsible for identifying such children and referring them to rehabilitation facilities.
Minimum infrastructure: Each Centre should have the minimum infrastructure and equipment required for effective delivery of ICDS services. A checklist of minimum facilities (including weighing scales, storage arrangements, drinking water, cooking utensils, medicine kits, child-friendly toilets, a kitchen shed, toys, etc.) should be drawn up.
Cooked food: For children aged 3-6 years, the supplementary nutrition programme (SNP) should consist of two hot cooked meals (breakfast and lunch) prepared at the Anganwadi, based on local foods and with some variation in the menu on different days of the week. ICDS should learn from the success of mid-day meals program that runs fairly well even in states not known for efficiency, whereas the supply of packaged food in the ICDS programme even in efficient states is not popular with the children, besides leading to grand corruption in procurement of packaged food.
Take-home rations: For children below the age of three years, nutritious and carefully designed locally prepared take-home rations (THR) based on locally procured food should be the recommended option, but there could be centre specific variations. The budget for weaning foods should be suitably enhanced.
Nutrition counselling: Supplementary nutrition should always be combined with extensive nutrition counselling, nutrition and health education, and home-based interventions (such as boiling water before drinking) for both growth and development, particularly for children under three.
Local involvement: The scheme will succeed only when the panchayats and other community groups have sufficient involvement and control over the programme, including selection of workers. In some states, the ICDS worker is appointed by a committee headed by the local MLA. This must change, and powers be given to the gram sabha (the council of all village adults).
Grading AWCs: GOI should introduce accreditation of AWCs based on well defined and transparent criteria through a consultative process by involving panchayats, mothers’ committees, and community groups. Some experiments have been done on Himachal Pradesh and Orissa which recognise good performance and reward them.
Adolescent girls: The programme components need to be expanded and sharply defined. First and foremost is the universal screening and weighing of adolescent girls. After screening, there is a need for gradation among adolescent girls such as 10-15 group, 16-19 group and pregnant girls among these groups. Then they should be weighed regularly, and given appropriate nutritious food containing all the desired micro-nutrients and iron. Similar initiative is needed for all women.
Special category of children: Children of migrant workers should be admitted and permitted to avail of all facilities and services in ICDS, regardless of their place of origin, with no paper work required by their parents/guardians. Data should be disaggregated at the ICDS level for enrolment and actual coverage, to reflect the numbers and proportion of disabled children; and children from vulnerable local SC /ST minority communities; and poor coverage should be penalised.
Expansion of the programme: State governments should be directed to ensure full coverage of urban slums within two years. In urban areas, ICDS should develop

50
prefabricated structures, to enable it to function in unauthorised slum settlements, or construction and brick kiln sites.
In rural areas, care should be taken to locate ICDS centres on priority within one year in all settlements of PTGs and most discriminated SC settlements, without any ceiling of minimum children; and all other hamlets with more than 50 per cent SC/ ST/minority population within a maximum of 2 years. In all these centres, ICDS staff should be local from the discriminated communities, and two hot meals served instead of one to children of 3 to 6 years; and double weaning foods given to children below 3 years.
ICDS centres should extend their nutrition and health services which at present cater to expectant and lactating mothers, also to all categories of single women, recognising them to be intensely nutritionally vulnerable.
Learn from International experience: Thailand has been one of the most outstanding success stories of reducing child malnutrition in the period 1980-1988 during which child malnutrition (underweight) rate was effectively reduced from 50 per cent to 25 per cent. This was achieved through a mix of interventions including intensive growth monitoring and nutrition education, strong supplementary feeding provision, high rates of coverage ensured by having high human resource intensity, Iron and Vitamin supplementation and salt Iodisation along with primary health care. The program used community volunteers on a huge scale (one per 20 children), and involved local people, so as to instil self-reliance and communicate effectively with target groups. Communities were involved in needs assessment, planning, program implementation, beneficiary selection, and seeking local financial contributions but central government control was kept over resource allocation, so as to ensure a coherent national program.
This has significance for nutrition programmes in India as the levels of per capita GDP, proportion of women in agricultural workforce and child malnutrition rates around 1980 in Thailand were similar to what we have in India in 2008.
It is absolutely crucial that the multidimensional nature of malnutrition be recognised and reflected in ICDS implementation: food intake is only one determinant of child nutritional status. It is however necessary, as it attracts children to other components of the programme. Therefore in addition to supplementary feeding, state resources should also be redirected towards effecting improvements in the delivery of other ICDS services. Supplementary feeding should be expanded and used strategically, i e, as an incentive for poor and malnourished children and their mothers, so that they receive health and nutrition education interventions.
5.5 Mid Day Meal Scheme (MDM)
The Mid Day Meal Scheme (MDM) provides a free cooked meal to every child in classes I-V of government, government aided and local body schools. This is a primarily a centrally assisted scheme with the state governments contributing partially towards the cooking costs.
Under the Mid Day Meal Scheme that was launched by the Central Government in 1995, the Government of India provided only free foodgrains while the cooking costs were entirely borne by the state governments. It was seen however that, many State Governments/ UT Administrations resorted to distribution of food grains, rather than providing cooked mid day meals because they were unable to provide adequate funding for meeting the cooking costs. Under orders from the Supreme Court (see

51
section 6) the scheme was revised in September 2004 to provide cooked mid day meal with 300 calories and 8–12 grams of protein to all children studying in classes I – V in Government and aided schools. Some states have extended the scheme to cover children in the upper primary schools.
The scheme is generally considered to be a great success, though there are problems. In 2005–2006, only 76.8 per cent of the grain allocated for the mid-day meal scheme was actually lifted by the state governments. Since the allocations are based on estimates of enrolments and attendance, this means that either not all institutions/children were covered under the mid-day meal scheme or that the quality of the mid-day meal was compromised in the sense that not enough quantity of food was given to the children or that mid-day meal was not provided on all working days.
A clear order was passed by the Supreme Court on April 20th, 2004 stating that preference must be given to SCs and STs in the appointment of cooks and helpers. However, only about half of the appointments are from that category.
CAG22 has recently audited the scheme and found that many states resort to over-reporting of the enrolment while projecting the requirement of funds. There is no system of cross checking the data of enrolment furnished by the state Governments. In most states the children were not administered micro nutrient supplements and de-worming medicines. The provisions for programme evaluation and regular monitoring and inspections in the scheme design were not effectively followed nor were the results analysed for review of errors and introduction of changes on the basis of lessons learnt. The Ministry failed to put in place an effective system to ensure that teachers are not assigned the responsibilities that would interfere with teaching activities. Many instances of the teachers spending considerable teaching time in supervising the cooking and serving of meals were noticed, resulting in loss of teaching hours. The CAG recommended that the Ministry needs to establish a system to ascertain the improvement in nutritional levels of the children. The Ministry should coordinate with the state governments and ensure maintenance of health cards in all the schools to monitor the health status of the children.
The Supreme Court Commissioners have made the following recommendations in their Seventh Report23 submitted in 2008.
• Currently the mid-day meal is provided only to children who are attending schools, whereas the most vulnerable children in the school going age are out of schools working as child labour, street children etc. The mid-day meal should be expanded to cover all children in the school-going age, irrespective of whether they are enrolled in school. The location of the meal served can continue to be the school, this might further encourage those out of school to join schools.
• The provision for cooking costs under the mid-day meal should be increased to Rs. 3/- per child per day (not including foodgrains costs) from the current Rs. 2/- per child per day in order to be able to provide a nutritious and filling
22 Performance Audit on National Programme for Nutritional Support to Primary Education (Midday Meal Scheme), Report no. PA 13 of 2008, available at cag.gov.in 23 http://www.sccommissioners.org/

52
meal to the child. Further this norm should be inflation-linked, in the sense that it is constantly reviewed based on the price indices.
• Mid-day meals should be linked with nutrition education and related educational activities. State governments should be encouraged to adapt their textbooks for this purpose, as the NCERT has already done for some textbooks. Nutritious items such as eggs and green leafy vegetables should be provided regularly.
• Proper infrastructure for mid-day meals should be mandatory, including cooking sheds, storage space, drinking water, ventilation, utensils, etc.
• Serious action should be taken in the event of any form of social discrimination in mid-day meals, such as discrimination against Dalit children or Dalit cooks.
• Priority should be given to disadvantaged communities (especially Dalits and Adivasis) in the appointment of cooks and helpers. All cooks and helpers should be paid no less than the statutory minimum wage.
• Community participation in the monitoring of mid-day meals should be strengthened, particularly to prevent corruption and ensure quality.
• Mid-day meals should be integrated with school health services, including immunization, deworming, growth monitoring, health checkups and micronutrient supplementation.
Orders of the Court are awaited.
5.6 Tribals and hunger
As pointed out in various sections of this paper, tribal groups are the worst sufferers from malnutrition and hunger. They live in agriculturally depressed areas, remote from roads, and the reach of administration and government programmes is weakest there.
A civil society �ones�izatio (CEFS 2005) covered a sample of 1000 randomly
selected tribal households from 40 sample villages in Rajasthan and Jharkhand and found that 25.2 per cent of surveyed tribal households reported not having two-square meal in the previous week of the survey. Of the surveyed tribal households 24.1 per cent did not have two square meal in the previous month of the survey and around 99 per cent of the tribal households were not able to manage two square meal at some point of time (at varied level) during the previous year.
From the viewpoint of policy, it is important to understand that tribal communities are vulnerable not only because they are poor, assetless and illiterate compared to the general population; often their distinct vulnerability arises from their inability to negotiate and cope with the consequences of their forced integration with the mainstream economy, society, cultural and political system, from which they were historically protected as the result of their relative isolation. Post-independence, the requirements of planned development brought with them the spectre of dams, mines, industries and roads on tribal lands. With these came the concomitant processes of displacement, both literal and metaphorical – as tribal institutions and practices were forced into uneasy existence with or gave way to market or formal State institutions (most significantly, in the legal sphere), tribal peoples found themselves at a profound disadvantage with respect to the influx of better-equipped outsiders into tribal areas.

53
The repercussions for the already fragile socio-economic livelihood base of the tribals were devastating – ranging from loss of livelihoods, and land alienation on a vast scale, to hereditary bondage (Saxena and Farrington 2003).
As tribal people in India perilously, sometimes hopelessly, grapple with these tragic consequences, a small clutch of official programmes has done little to assist the precipitous �ones�ization, exploitation and disintegration of tribal communities. Tribal people respond occasionally with anger and assertion, but often also in anomie and despair, because the following persistent problems have by and large remained unattended to:
• Land alienation
• Indebtedness
• Relation with forests, and government monopoly over Non-Timber Forest Products (NTFPs)
• Ineffective implementation of Panchayats (Extension to the Scheduled Areas) Act of 1996 for Schedule24 V areas
• Involuntary displacement due to development projects and lack of proper rehabilitation
• Shifting Cultivation
In at least one-third of tribal blocks in central India extremists groups are active and normal administration does not function.
Apart from policy failures listed above, tribals have also suffered because of the poor quality of governance. Programme delivery has deteriorated everywhere in India, but more so in tribal areas, where government servants are reluctant to work, and are mostly absent from their official duties. Government seems to have surrendered to political pressures from the staff, as many of their posts have now been officially transferred from tribal regions to non-tribal regions, where they can draw their salaries without doing any work! It is a pity that massive vacancies exist in tribal regions in the face of acute educated unemployment in the country.
Subsistence agriculture, gathering of non-timber forest produce and wage labour are the main sources of livelihood among tribal people. They are concentrated in the least developed, rain-fed, undulating and often in remote hilly regions of the country, largely untouched by ‘green revolution’. Thus, while landlessness is relatively low among tribal people compared to other poor communities, agriculture productivity is low and other farm-based avenues, such as dairy and horticulture are also poorly developed, leading to widespread food insecurity.
Rather than discuss these issues, howsoever crucial they may be, for lack of space, we will end this section by giving a few suggestions for improving their livelihoods.
First, launch watershed development programmes in uplands, where most tribals live. In a successful watershed programme the poor benefit in three ways. First, as net sown area and cropping intensity increases more opportunities for wage employment are created, which may also increase the wage rate besides the number of days of 24 Regions with significant tribal population in Central India have been specifically mentioned in the fifth Schedule of the Constitution, and have been provided with some safeguards, which however have not worked well because of political and administrative apathy.

54
employment. Second, increased water availability and reduced soil erosion increases production on small and marginal farmers’ lands. And last, higher productivity of CPRs improves access of the tribals to more fodder, fuelwood, water and NTFPs.
Two, start a drive to plant fruit trees on degraded forests and homestead lands that belong to or have been allotted to the tribals. This will not only make the poor people’s diet more nutritious, but will also diversify their livelihoods and reduce seasonal vulnerability.
Three, their work guarantee should be extended through an amendment in the NREGA to 150 days.
And lastly, promote civil society action in these districts, not only because the reach of administration is limited, but also because tribal societies are more homogeneous and respond well to the calls for collective action, which will improve their social capital so necessary for the success of many government programmes.
6 Supreme Court intervention
In April 2001, the Peoples’ Union for Civil Liberties (PUCL), a human rights organization, filed a Public Interest Litigation (PIL) in the Supreme court of India arguing that the right to food is a fundamental right of all Indian citizens, and demanded that the country’s gigantic food stocks (about 50 million �ones of grain at that time) should be used without delay to prevent hunger and starvation. It argued that the right to food should be seen as a corollary of the fundamental “right to life” (Article 21 of the Indian Constitution), in so far as it is impossible to live without food. Supreme Court hearings have been held at regular intervals since, and the case has attracted wide national and international attention. Although the final judgment is still awaited, significant “interim orders” have been passed from time to time.
For instance, the Supreme Court has passed orders directing the Indian government to:
(1) introduce hot cooked mid-day meals in all primary schools,
(2) provide 35 kgs of grain per month at highly subsidized prices to 15 million destitute households under the Antyodaya (AAY) component of the PDS,
(3) double the resource allocations for Sampoorna Grameen Rozgar Yojana (India’s largest rural employment programme at that time, now superseded by the Employment Guarantee Act),
(4) universalize the Integrated Child Development Services (ICDS) by increasing the number of centres from 0.6 million to 1.4 million, and
(5) identify SC and ST hamlets/habitations for new ICDS centres on a priority basis.
Realising the gravity of impact that lapses in implementation has on the well-being and even the survival of poor people, the Supreme Court in an interim order dated 28 November 2001, converted the benefits of nine food-related schemes into “legal entitlements” and directed all the State governments to fully implement these schemes.
The initial petition focused on the drought situation prevailing at that time, especially in Rajasthan, but the litigation now has a much broader scope. The main concern is to put in place permanent arrangements to prevent hunger and starvation. The Court itself noted in an interim order dated 2 May 2003, “reference can also be made to

55
Article 4725 which inter alia provides that the State shall regard the raising of the level of nutrition and the standard of living of its people and the improvement of public health as among its primary duties”.
The Supreme Court appointed two Commissioners, Dr. N.C. Saxena and Harsh Mander (also a former IAS officer), for the purpose of monitoring the implementation of the interim orders. The Commissioners present periodic reports to the Supreme Court. These typically deal with the implementation of Supreme Court orders. In addition these reports attempt to highlight issues that need further directions from the Court. These are based on extensive correspondence with governments, reports from the Commissioners’ Advisors, interaction with citizens’ organisations, and field visits made by the Commissioners. So far, eight reports and a few interim reports have been submitted. They are a rich source of information on the food situation in India, the implementation of interim orders, the functioning of various schemes, and so on. The reports also include detailed recommendations to the Court.
Experience shows that Court’s orders have been a useful tool for action. First and foremost, this is an opportunity to hold the state accountable. Court orders can also be used to help people to understand that they are entitled to certain forms of public support as a matter of right. And lastly, governments on their own have started giving higher priority to the monitored schemes and have often improved the design in order to increase the coverage of the schemes. For instance, the number of old age pensioners has been doubled and the scale of pension has increased from Rs 75 per month to Rs 20026 per month. Several improvements have been made in the contents of MDM, and in 2006, the calorie content has been increased from 300 calories to 450 calories and the protein content from 8-12 grams to 12 grams.
On the other side, the interim orders are far from being fully implemented, primarily because of poor delivery structure and weak implementation capacity. For instance, the Court directed that the AAY cards should be given to the following27:
(1) Aged, infirm, disabled, destitute men and women, pregnant and lactating destitute women;
(2) widows and other single women with no regular support;
(3) old persons (aged 60 or above) with no regular support and no assured means of subsistence;
(4) households with a disabled adult and no assured means of subsistence;
(5) households where due to old age, lack of physical or mental fitness, social customs, need to care for a disabled, or other reasons, no adult member is available to engage in gainful employment outside the house; and
25 Article 47 (Duty of the State to raise the level of nutrition and the standard of living and to improve public health) directs that ‘The State shall regard the raising of the level of nutrition and the standard of living of its people and the improvement of public health as among its primary duties and, in particular, the State shall endeavour to bring about prohibition of the consumption except for medicinal purpose of intoxicating drinks and of drugs which are injurious to health.’ The limitation has been that unlike the Fundamental Rights, which are unambiguously justiciable, the Directive Principles of state policy (of which Article 47 is a part) have moral rather than legal binding. 26 This is only the central government’s contribution. States are encouraged to add to the amount, with the result actual pension amount varies from Rs 200 to Rs 500 per month. 27 Most of the people in these catogories suffer from chronic hunger.

56
(6) primitive tribes.
However, in actual practice the commissioners have found gross violation of these orders, and there are serious errors of omission and inclusion, as shown in Table 20. Lapses have been reported to the Court, and twice the Court summoned and pulled up the States’ Chief Secretaries. On the whole, the case has certainly enhanced the profile of the hunger related schemes, and administrators at all levels give a much higher priority to these schemes than ever before.
Whereas there is remarkable improvement since the case commenced, the highly uneven performance of the majority of state governments confirms that the achievement of assured food security of all people, especially vulnerable social groups, cannot be left to executive discretion alone. It must become a judicial legal entitlement binding on every government, union, state and local, if the enormous human suffering, indignity, economic and social cost and enduring injustice associated with entirely preventable food denials and malnutrition is to be overcome, and hunger banished from every home in the country. 7 Improving accountability
The State in India implements massive food, livelihood and social security programmes – some of the largest in the world – which theoretically support vulnerable people from even before their birth to their survivors after death. Expectant mothers are fed in ICDS centres, along with infants, children up to the age of six, and adolescent girls. The child in school gets school meals. As adults, women receive maternity support, bread earners are guaranteed 100 days of wage employment in public works; and if identified to be poor, they can buy subsidised cereals from a massive network of half a million ration shops. The aged – and in many states widows and disabled people – are given pensions. And if an earning adult dies prematurely, the survivor is entitled to insurance.
These programmes are plagued by corruption, leakages, errors in selection, delays, poor allocations and little accountability. They also tend to discriminate against and exclude those who most need them, by social barriers of gender, age, caste, ethnicity, faith and disability; and State hostility to urban poor migrants, street and slum residents, and unorganised workers. Therefore, not only we need to identify the destitutes and run special programmes for them, but improve monitoring and accountability for all programmes that impinge on hunger.
7.1 Destitutes
Government programmes are also woefully inadequate to address destitution; in fact they tend to be blind to or in denial of the fact that large numbers of people lack even the elementary means and power to survive with dignity. Government needs to act, not after there is an emergency like a drought or flood, not even after people die of starvation, but pro-actively before people slip into destitution, and fail to access in an assured and reliable manner, with dignity, the nutritious and culturally appropriate food they require to lead healthy lives.
Identification – One feature which is common to public policy relating to the dispossessed groups28 is the fact that for almost all, there is very little authentic official data, about their numbers and lists. This is not a chance or random default. It
28 The six categories are mentioned in section 6.

57
is the outcome of what we describe as ‘invisibilisation’ of these powerless people by the state. We therefore recommend an effort at least once every two years to not just estimate these groups, but to conduct a full listing. This should be undertaken in each district of the country, led by the state government and district collectors, but with active participation of local bodies such as gram sabhas and municipalities, professionals, experts, civil society groups and representatives of these populations. These lists should be updated every two years, and should form the basis for them to receive the due entitlements.
Free food – All old people from the neighbourhood should be permitted to share in the school mid-day meal of hot cooked meal in schools or ICDS centres without any conditions, as practiced in the state of Tamil Nadu. This serves as a last defence against starvation of the aged destitute, without requiring any additional administrative costs.
Establish community kitchens across cities and urban settlements to provide inexpensive, subsidised nutritious cooked meals near urban homeless and migrant labour settlements, with committed source of external funds (preferably government funded or in partnership with civil society: both citizens and private sector), which are managed by community groups of homeless people, preferably women, and will provide employment as cooks to homeless people themselves (at least 50 such kitchens per city with population more than one million; and 100 with populations more than one million, and 500 in those more than ten million).
Residential Care for food security of most vulnerable children – For children of rural seasonal migrants, the village school should be converted into a community based temporary residential school, to enable the child to access food and education, without having to migrate every year with their guardians. The aged of the village, who are often left behind in destitute conditions, may take care of the children in return for sharing the food in the community based hostels. This model has been adopted by Orissa government for Bolangir district, and is widely recognised internationally as a best practice, applauded among others by Dr Amartya Sen.
For children who still migrate, it should be the duty of the education department of the host state to provide education in local language at work sites, and permit the child to access midday meals at the nearest government school. This is again a best practice adopted by the governments of Andhra Pradesh for migrant families from Orissa.
For children who live and work on the streets, the only way to secure their right to food (and with this their rights to education, health and protection), is to provide them alternatives to move decisively away from the streets and any kind of work. This is possible only through guarantees of comprehensive long term care in open voluntary residential homes. Every city would need a large network of such schools. This could be done by converging the Sarva Shiksha Abhiyan (a programme to bring every child to schools) and the Women and Child Department’s night shelter programmes, as well as Labour Department programmes for child workers, to pool resources to create hostels for urban street and working children, and greatly enhancing allocations. This best practice has been adopted by the governments of Andhra Pradesh and Delhi. The aim should be in the first phase of three years to start at least 100 such centres in all metropolises; and 50 in all other urban areas of population more than 5 lakhs.

58
7.2 Problems of delivery and implementation
Outlays should not be considered as an end in itself. Delivery of food based schemes requires increasing financial resources, but more importantly the quality of public expenditures in these areas. This in turn requires improving the governance, productivity and accountability of government machinery. We give below some suggestions.
Shift from input controls to monitoring of outcomes – Officials at all levels spend a great deal of time in collecting and submitting information, but these are not used for taking corrective and remedial action or for analysis, but only for forwarding it to a higher level, or for answering Parliament/ Assembly Questions. Often data on performance reaches late, or is not available district-wise, or is ‘doctored’, with the result that accountability cannot be enforced. For instance, we do not have district-wise figures on IMR, MMR, malnutrition, or poverty. Had this data been available every year and for each district, it would have been easier to fix responsibility and help in outcome monitoring.
It is not enough that the central government departments and the state governments use professional and academic organisations to undertake impact studies from time to time. Their findings must be publicised and discussed with key stakeholders so that improvements in design and delivery can be effected at the earliest. Governments should also put on its website findings of the impact studies, and distribute these in the workshops it organizes. Dissemination of results is critical for use.
Assess quality – There are unfortunately no indicators for assessing the quality of programme outcomes. GOI and civil society may like to fill this void and produce reports that assess the quality of outcomes. For instance, one would like to know how many newly constructed toilets are being used, and what impact has it had on peoples’ health and hygiene.
Measure absenteeism – While satisfaction may be subjective, and with economic progress people’s aspirations for high quality services may have increased, quantitative data on absenteeism of both service providers and service receivers (number of days the ration shops open, or women turning up for institutional deliveries) throws a great deal of light on the quality of service. For instance, a study of Rajasthan indicated that 45 per cent of doctors were absent from PHCs, and 56 per cent of the time sub-centres were closed. Worse, the patterns of absences and facility closures were essentially unpredictable, so people could not plan their visits.
Social audit – Governments should introduce social audit by assessing the experience of the people service providers are intended to serve. With community participation, the evidence should be collected from stakeholders, so as to promote accountability, equity, effectiveness, and value for money. Such an audit will supplement conventional audit and will often provide leads to it. Financial audit aims at making organizations accountable to the government and to the legislature. Social audit makes them accountable to their stakeholders especially in relation to the social objectives.
Promote public private partnership – The role of private sector in social sector is not sufficiently recognised in India. For instance, most health care is now given in the private sector and, for the poor, by very poorly or untrained practitioners. Rather than trying to replace private services, the Government should try to improve the private market, with the carrot of training and the stick of public information. Public funds

59
should be increased to combating communicable diseases and providing health insurance cover to all.
Link performance with fiscal transfers – Very little of GOI’s annual transfers to the states (roughly Rs 3,000 billion, not including subsidies, such as on food, kerosene, and fertilizers) is linked with performance and good delivery. The concept of good governance needs to be translated into a quantifiable annual index on the basis of certain agreed indicators such as infant mortality rate, extent of immunisation, feeding programmes for children, availability of safe drinking water supply, malnutrition, rural and urban unemployment, percentage of girls married below 18 years, percentage of villages not connected by all weather roads, and so on. Once these figures are publicized states may get into a competitive mode towards improving their score. Central transfers should be linked to such an index.
Summing up
In the ultimate analysis, the constraints to reduction in hunger are rooted in bad policies, faulty design, lack of appropriate M & E, poor governance and lack of political will. Action is needed on all the fronts. Economic growth alone is insufficient to bring about significant reductions in the prevalence of malnourishment among children, or increase in food intake of the poor. Without a major shake up in policy and an improvement in the effectiveness of its implementation, the attainment of the MDGs by India in this regard looks extremely unlikely.
Development is an outcome of efficient institutions rather than the other way around. Focus therefore must be shifted from maximising the quantity of development funding to maximising of development outcomes and effectiveness of public service delivery. Concerted policy action is needed to improve the hunger indicators of the marginalised groups, women and children, and of the 300 million poor increasingly concentrated in the poorer states. This requires additional resources, as well as better policies and sound delivery mechanisms. Unless ration shops open and distribute food, doctors attend health centres and provide health care, and incentives for them to do so are not perverse, mere increase in the social sector expenditure would only result in further leakages and swelling of the already non-functional parasitic bureaucracy.

60
8 Abbreviations AAY Antyodaya Anna Yojana APL Above Poverty Line AWCs Anganwadi Centres BMI Body Mass Index BPL Below Poverty Line CAG Comptroller and Auditor General of India CED chronic energy deficiency Dalits Oppressed, refers to the ex-untouchables FAO Food and Agricultural Organization of the United Nations FCI Food Corporation of India GDP Gross Domestic Product GHI Global Hunger Index GOI Government of India ICDS Integrated Child Development Services IFPRI International Food Policy Research Institute IMR Infant Mortality Rate LBW low birth weight MDG Millennium Development Goals MDM Mid Day Meal Scheme MPCE monthly per capita expenditure MSP Minimum Support Price MT Metric Tons NABARD National Bank for Agriculture and Rural Development NFHS National Family Health Surveys of India NGO Non Governmental Organization NNMB National Nutrition Monitoring Bureau NREGS National Rural Employment Guarantee Scheme NRHM National Rural Health Mission NSS National Sample Surveys of India OBC other backward castes PDS Public Distribution System PPP Purchasing Power Parity PTGs primitive tribal groups RCH Reproductive & Child Health REC Rural Electrification Corporation RIDF Rural Infrastructure Development Fund SC scheduled-castes SSI Small Scale Industries ST scheduled tribes UNDP United Nations Development Programme WCD Women and Child Development (Department of)

61
9 Bibliography Ahluwalia, Montek S 1978: Rural Poverty and Agricultural Performance in India, Journal of Development Studies, April
Ahmed, Akhter U., Ruth Vargas Hill, Lisa C. Smith, and Tim Frankenberger 2007: The World’s Most Deprived: Characteristics and Causes of Severe Poverty and Hunger, October, IFPRI, Washington
Arnold F, Nangia Parveen, Kapil Umesh 2004: Indicators of Nutrition for Women and Children Current Status and Recommendations. Economic and Political Weekly, XXXIV7: 14-20.
Bajpai Nirupam, Jeffrey D. Sachs, and Nicole Volavka 2005: India’s Challenge to Meet the Millennium Development Goals, CGSD Working Paper No. 24, April, Working Papers Series Center on Globalization and Sustainable Development, The Earth Institute at Columbia University www.earth.columbia.edu
Bardhan Pranab K. 1985 Poverty and "Trickle-Down" in Rural India: A Quantitative Analysis, http://www.ifpri.org/pubs/books/Mellor85/Mellor85ch08.pdf
Bhalla, G.S. and Peter Hazell 2003: Rural Employment and Poverty: A Strategy to Eliminate Rural Poverty within a Generation, Economic and Political Weekly, August 16-22, Vol. XXXVIII, No 35.
Bisaliah, S. 2007: Capital Formation In Indian Agriculture; Growth, Composition, Determinants And Policy Directions Asian Development Bank
Black, R.E, Allen, L.H, Bhutta, Z.A et al 2008: Maternal and child undernutrition: Global and regional exposures and health consequences. The Lancet 371: 243-60.
CEFS 2008: Key Findings of the Survey Research on Hunger and Poverty in Adivasi Areas of Rajasthan and Jharkhand, Centre for Environment and Food Security, New Delhi
Chand, Ramesh 2007: Wheat Import and Price Outlook for 2007-08; Separating the Grain from the Chaff, December 29, Economic & Political Weekly
Chand, Ramesh 2007a: Demand for Foodgrains, Economic and Political Weekly December 29
Chand, Ramesh 2008: The Global Food Crisis: Causes, Severity and Outlook Economic & Political Weekly June 28
Gopaldas, Tara 2006: The Problem of hidden Hunger and Possible Interventions, Economic and Political Weekly August 26,
Deaton Angus and Jean Drèze 2008: Nutrition in India: facts and interpretations, Princeton University,
Economic Survey, 2007-08: Finance Ministry, GOI
GOI 1993: ‘Report of the Expert Group on Estimation of Proportion and Number of Poor’, Perspective Planning Division, Planning Commission, New Delhi.
GOI 1979 Government of India 1979: Report of the Task Force on Projection of Minimum Needs and Effective Demand, Perspective Planning Division, Planning Commission, New Delhi.
GOI 2005: Evaluation of the TPDS, PEO, Planning Commission, New Delhi
Griffin, K. 1974: The Political Economy of Agrarian Change London: Macmillan.
Himanshu 2007: Recent Trends in Poverty and Inequality: Some Preliminary Results, Economic and Political Weekly February 10

62
IFPRI 2008: The India State Hunger Index: Comparisons Of Hunger Across States Purnima Menon, Anil Deolalikar, Anjor Bhaskar, October 14, New Delhi
Jha, Praveen 2007: Some Aspects of the Well-Being of India’s Agricultural Labour in the Context of Contemporary Agrarian Crisis
Jha, Shikha, PV Srinivasan, and Maurice Landes 2007: Indian wheat and rice sector policies and the implications of reform. Economic research report no. 41 (United States. Dept. of Agriculture)
Jose Sunny, K Navaneetham 2008: A Factsheet on Women’s Malnutrition in India, Economic and Political Weekly, Aug 18
Krishnaraj, Maithreyi 2006: Food Security, Agrarian Crisis and Rural Livelihoods, Implications for Women Economic and Political Weekly December 30,
Kumar, A K Shiva 2007: Why Are Levels of Child Malnutrition Not Improving? Economic and Political Weekly, April 14
Kumar, Praduman, Mruthyunjaya, Madan M Dey 2007: Long-term Changes in Indian Food Basket and Nutrition Economic and Political Weekly September 1
Kumaran M., 2008: Hunger and Under-Nutrition in Post-Liberalisation Rural India - A Review, Dissertation, Jawaharlal Nehru University, New Delhi
Kundu, Amitabh 2006: ‘Food Security System in India: Analysing a Few Conceptual Issues in the Contemporary Policy Debate’ in Nisha Srivastava and Pravesh Sharma eds, ‘Protecting the Vulnerable poor in India: The role of social safety net’ WFP, New Delhi
Lanjouw, Peter and Rinku Murgai 2008: Poverty Decline, Agricultural Wages and Non-Farm Employment in Rural India: 1983-2004
Lipton, M. with Longhurst, Richard 1989: New Seeds and Poor People ,London: Unwin Hyman
Mander, Harsh 2008: Living with Hunger: Deprivation among the aged, Single Women and people with Disability, Economic & Political Weekly April 26,
Mehta, Aasha Kapur and Amita Shah 2002: ‘Chronic poverty in India: Overview study -Defining the nature of chronic poverty in India’, Mimeo, Chronic Poverty Research Centre, UK.
Mittal, Surabhi 2008: Demand-Supply Trends and Projections of Food in India, Working Paper No. 209, March ICRIER, New Delhi
Navaneetham K 2008: A Factsheet on Women’s Malnutrition in India Sunny Jose, Economic & Political Weekly Economic & Political Weekly August 16,
NNMB. 2006: National Nutrition Monitoring Bureau. Reports Hyderabad: National Institute of Nutrition,. 1979-2006. Available from: http://www.nfhsindiaorg/nfhs2.html
NSSO 2007: ‘Perceived Adequacy of Food Consumption in Indian Households 2004-2005- NSS 61
st Round, July 2004- June 2005’, NSS Report No. 512, National Sample Survey
Organisation, Ministry of Statistics and Programme Implementation, Government of India, New Delhi.
Palmer-Jones Richard and Amaresh Dubey: Poverty Measurement, Poverty Lines and Consumer Price Indexes in India: A Critique
Palmer-Jones, R and Dubey, A, 2008: Poverty Incidence in India since 1993: Another View, Working Paper 08, DEV Working Paper Series, The School of Development Studies, University of East Anglia, UK.

63
Patnaik, Utsa 2004: The Republic Of Hunger, Public Lecture on the occasion of the 50th Birthday of Safdar Hashmi, organized by SAHMAT Safdar Hashmi Memorial Trust on April 10, , New Delhi
Patnaik, Utsa 2007: Neoliberalism and Rural Poverty in India, Economic & Political Weekly July 28
Planning Commission 2006, Mid-term Evaluation of the Tenth Plan, New Delhi
Planning Commission 2008: Eleventh Five Year Plan, volume 2, New Delhi
Ramachandran, Nira 2007: Women and Food Security in South Asia: Current Issues and Emerging Concerns, www.geocities.com/wduminder/healthinsouthasia
Ramachandran, Prema 2007: Poverty nutrition linkages, Indian J Med Res 126, October 2007, pp 249-261
Ramachandran, Prema 2008: Changing Food Consumption Patterns in India, Bulletin of the Nutrition Foundation of India, Volume 29 Number 2, April
Roy Rajat 2008: Endemic Hunger in West Bengal, Economic & Political Weekly May 3
Saxena N.C. 2004: Right to food – Supreme Court Intervention, in M.S. Swaminathan & Pedro Medrano ed, From Vision to Action, Madras
Saxena N.C. 2004: Synergizing Government Efforts for Food Security, in M.S. Swaminathan & Pedro Medrano ed, From Vision to Action, Madras
Saxena N.C. and John Farrington 2003: Trends and Prospects for Poverty Reduction in Rural India: Context and Options, Working Paper 198, Overseas Development Institute, London
Sen Ilina 2004: Hunger in Urban India Economic and Political Weekly October 9,
Sen Pronab 2005: Of Calories and Things: Reflections on Nutritional Norms, Poverty Lines and Consumption Behaviour in India, , Economic and Political Weekly October 22
Sen, Abhijit and Himanshu 2004: Poverty and Inequality in India–Widening Disparities during the 1990s, Economic and Political Weekly, Sept 18 and 25
Shatrugna, Veena 2001: The Nutrition Scenario – Micronutrient supplements in the absence of adequate proteins and calories – A Review; National Institute of Nutrition, Hyderabad
Sundaram K 2007: Employment and Poverty in India, 2000-2005 Economic and Political Weekly July 28,
UNDP 2007: People’s participation in generating District Human Development Report Cards PAHELI: New Delhi
UNDP 2008: Study on perception of disadvantaged in seven states of India, August, New Delhi
UNICEF 2007: State of the World’s Children 2007.
Weismann D, Sost AK, Schoeninger I, Dalzell H, Kiess L, Arnold T, Collins S. 2007: ‘The Challenge of Hunger 2007: Global Hunger Index: Facts, determinants, and trends. Measures being taken to reduce acute undernourishment and chronic hunger’. International Food Policy Research Institute, Concern.
World Bank 2007: Social Protection for a Changing India, Human Development Unit, South Asia World Bank, New Delhi