Testing the theoretical relationship between Taguchi’s...
22
1 Testing the theoretical relationship between Taguchi’s robust design philosophy and Lean to improve manufacturing performance through continual improvement – an empirical study involving a large apparel manufacturer Pramila Gamage, Nihal P. Jayamaha, Nigel P. Grigg Massey University, School of Engineering and Advanced Technology, Palmerston North, New Zealand [email protected] <[email protected]>, [email protected], [email protected] N. K. B. M. P. Nanayakkara Department of Production Engineering, University of Peradeniya, Sri Lanka, [email protected] Abstract By collecting data (N = 318) from 31 mature Lean apparel manufacturing plants in Sri Lanka, using structural equation modelling, we tested the hypothesis that the two seemingly compatible waste/loss elimination philosophies Lean and Taguchi’s robust design philosophy do correlate with one another and that they jointly explain manufacturing process outcomes through the mediating variable continual improvement. The results indicated that Taguchi’s robust design philosophy is correlated (r = 0.45) to the Lean manufacturing system to jointly explain 89% of the variability of manufacturing process outcomes. Our results indicated that continual improvement strongly mediates the relationship between Lean and manufacturing process outcomes but not the relationship between Taguchi’s robust design philosophy and manufacturing process outcomes. Practical implications of these results are also covered in our paper. Keywords: Lean; Taguchi’s Robust Design Philosophy; Item Parcelling in Structural Equation Modelling (SEM) Topics: Quality and performance Methodology: Empirical work Introduction One of the principal quality gurus of the 20th century, W. Edwards Deming once mentioned “the right quality and uniformity are foundations of commerce, prosperity and peace” of a society (cited in Howard, 1992). He also showed that cost to a company for losing customers due to poor quality is infinite (Gunter, 1987). Poor quality is caused due to the deviation of functional characteristics of the product from their expected (specified) values due to process variation. Quality can be improved by redesigning the manufacturing process through a major change or by making the process (or the product that the process manufactures) robust or insensitive to factors that cause the variation (noise), by setting the process input parameters (control factors) at particular levels (Allen, 2010; Joseph, 2007). Redesigning of the process is a costly option. Setting the process input parameters to achieve robustness on the other hand,
Transcript of Testing the theoretical relationship between Taguchi’s...
1
Testing the theoretical relationship between Taguchi’s robust design philosophy and Lean to improve manufacturing performance through continual
improvement – an empirical study involving a large apparel manufacturer
Pramila Gamage, Nihal P. Jayamaha, Nigel P. Grigg
Massey University, School of Engineering and Advanced Technology, Palmerston North, New Zealand [email protected] <[email protected]>, [email protected],
[email protected] N. K. B. M. P. Nanayakkara
Department of Production Engineering, University of Peradeniya, Sri Lanka, [email protected] Abstract By collecting data (N = 318) from 31 mature Lean apparel manufacturing plants in Sri Lanka, using structural equation modelling, we tested the hypothesis that the two seemingly compatible waste/loss elimination philosophies Lean and Taguchi’s robust design philosophy do correlate with one another and that they jointly explain manufacturing process outcomes through the mediating variable continual improvement. The results indicated that Taguchi’s robust design philosophy is correlated (r = 0.45) to the Lean manufacturing system to jointly explain 89% of the variability of manufacturing process outcomes. Our results indicated that continual improvement strongly mediates the relationship between Lean and manufacturing process outcomes but not the relationship between Taguchi’s robust design philosophy and manufacturing process outcomes. Practical implications of these results are also covered in our paper. Keywords: Lean; Taguchi’s Robust Design Philosophy; Item Parcelling in Structural Equation Modelling (SEM) Topics: Quality and performance Methodology: Empirical work Introduction One of the principal quality gurus of the 20th century, W. Edwards Deming once mentioned “the right quality and uniformity are foundations of commerce, prosperity and peace” of a society (cited in Howard, 1992). He also showed that cost to a company for losing customers due to poor quality is infinite (Gunter, 1987). Poor quality is caused due to the deviation of functional characteristics of the product from their expected (specified) values due to process variation. Quality can be improved by redesigning the manufacturing process through a major change or by making the process (or the product that the process manufactures) robust or insensitive to factors that cause the variation (noise), by setting the process input parameters (control factors) at particular levels (Allen, 2010; Joseph, 2007). Redesigning of the process is a costly option. Setting the process input parameters to achieve robustness on the other hand,

2
is a lower cost option as it does not require financial capital investment; making a product or process robust against the noise is known as the robust engineering (RE) approach or the robust design (RD) approach (Allen, 2010). RE is a revolutionary approach in quality engineering, and “the robustness of products are more a function of good design than of on-line quality control” (Taguchi and Clausing, 1990). Genichi Taguchi, an engineer turned industry consultant, is widely regarded as the father of RD (or RE). He introduced his philosophical paradigm and the associated methodology in Japan (since 1950s to 1980s) to improve the quality of Japanese Products (Taguchi et al., 2005; Montgomery, 2013; Nair et al., 1992). In Japan, Taguchi received the same respect as Deming for contributing knowledge and knowhow to the Japanese industry (Sullivan, 1987, Gunter, 1987, Taguchi et al., 2005).
In general, RE (or RD) can be defined as an engineering approach that aims to minimise sensitivity of products and processes to variations which transmit from the external and internal environmental factors (e.g. the user conditions, temperature, variability of material) (Box et al., 1988; Box and Bisgaard, 1987; Roy, 2010). A robust design can be achieved through statistically designed experiments, more commonly known as design of experiments (DOE). Since Taguchi introduced his RD philosophy and the associated DOE methods to achieve a RD, DOE has been receiving increasing attention among both practitioners and statisticians as an efficient methodology to improve quality (Nair et al., 1992; Song et al., 1995). Consequently DOE as a discipline became enriched by both Taguchi’s approach and subsequent approaches proposed by statisticians as alternative RD approaches (Myers et al., 1992; Engelhardt, 2001; Montgomery, 2013; Khuri and Mukhopadhyay, 2010).
The philosophy behind the Taguchi method is that any deviation of a quality characteristic from its desired value causes overall “loss to society” (Byrne and Taguchi, 1987; Roy, 2010). Taguchi used a quadratic loss function (the loss being proportional to the square of the amount of deviation from the target) to model the losses, in which the losses rise in a quadratic fashion as the quality characteristic moves from the target value (Byrne and Taguchi, 1987; Ross, 1996; Roy, 2010; Sauers, 1999; Taguchi and Clausing, 1990). Taguchi also argued that deviation from the target value occurs as a result of failing to make products and processes robust (invariant) against the variation of actual environmental conditions in which the product or process operates (Myers et al., 1992; Taguchi et al., 2000; Taguchi and Clausing, 1990; Wang and Huang, 2007). For example, the performance of an automobile should be robust (invariant) against the variations of tyre pressure (low/high), road surface (smooth/rough), ambient temperature (low/high), and so on. On the same token, the performance of an electric appliance (e.g. a TV) should be robust against voltage fluctuations.
Even though most products are mass produced, they are received as single items to the ultimate user (customer). While the factory records may show that products were within the specification limits, the only proof of the product’s quality is the product being able to meet customer’s expectations once the product is in the customer’s hand (Womack and Jones, 2005b). “Lean consumption” (Womack and Jones, 2005 a, p.8) is a newer concept that takes a holistic approach to Lean product development. Lean consumption is viewed as a “win-win-win” situation for the employees, the organisation, and the customers to whom the value is delivered (Womack and Jones, 2005a; Gummesson, 2008; Truch, 2006).
Lean manufacturing is a set of manufacturing practices (Jayaram et al., 2010; Shah and Ward, 2007) that have been brought forth through application of tools and techniques such as Just-In-Time, Kaizen, One-Piece–Flow, Jidoka, Heijunka, Shingo-Shingo/Single Minute Exchange of Die (SMED) system that were developed under the leadership of late Taiichi Ohno, the inventor of the Toyota Production System (TPS) (Hines et al., 2004; Liker, 2004) at the Toyota Motor Corporation (TMC), Japan. Lean can also be viewed as an operational philosophy of adding value to the customer (Liker, 2004; Womack and Jones, 2005b).

3
It has been well argued in operations management literature that combining and integrating overlapping manufacturing management practices lead to superior performance (Flynn et al., 1995; Huang et al., 1991). Taguchi’s robust design philosophy (and the methods he prescribed to achieve a robust design) and Lean manufacturing are waste/loss elimination approaches. For this reason and because both approaches rely on teamwork (e.g. barnstorming), there is scope to integrate Taguchi’s robust design philosophy within a Lean manufacturing environment. The aim of this study was to develop and test a theory that predicts and explains Lean manufacturing performance through Lean and Taguchi’s robust design philosophy. Covariance-based Structural Equation Modelling method was used to statistically determine the extent to which Taguchi’s robust design philosophy co-vary with Lean manufacturing (from a conceptual standpoint) to explain manufacturing performance. This paper is also covered the state-of-the art SEM protocols such as “item parcelling” (Matsunaga, 2008; Little, 2002; Bandalos, 2002; Hall et al., 1999) to overcome problems associated with using a large number of indicators to reflect a latent variable.
The remainder of this paper has been structured as follows. The next section covers the literature that was necessary to develop our theoretical model. The literature review is followed by the methodology section, which begins with framing of the hypotheses to form the theoretical model. The methodology section also describes how the data were collected and analysed to test the proposed model. This is followed by the results section which presents the statistical information pertaining to the model. The results section is followed by the discussion section where the findings (statistical information) are discussed from a theoretical and practical perspective. Finally, in the conclusions section, the findings are summarised along with directions for future research.
Literature review A background on DOE Sir Ronald A. Fisher ,who started conducting factorial experiments in the 1920s to improve the agricultural productivity in England, is regarded as the founder of DOE. In statistically designed experiments the experimental factors are varied simultaneously, setting each factor at a specific level to record the value of the response variable, which may be a production output (e.g. yield) or a quality characteristic of a product (e.g. a specific measurement, amount of impurity found) (Montgomery, 2013; Box and Bisgaard, 1987). DOE projects are designed to gather maximum information from a least number of experimental runs, something that cannot be archived by varying one-factor-at-a-time (OFAT) by holding the levels of the other factors fixed (Box and Bisgaard, 1987; Gunter, 1987). At the time Taguchi studied DOE in the 1950s, traditional DOE methods were not designed to model product or process variability against the environmental noise; for example, variations in the actual use condition of a product, and variability in the production inputs such as raw material that actually causes product or process performance variation (Roy, 2010; Taguchi et al., 2005; Box et al., 1988; Taguchi et al., 2000 ). Traditional DOE methods were grounded (and they still are, in most cases) in multiple linear regressions approach, where a researcher aims to predict a point value of the response variable or the average value of the response variable (Montgomery, 2013). Taguchi observed that DOE projects aimed at predicting or explaining a point value or the average value are not very useful in designing products (and processes) to become robust against the environmental noise (Roy, 2010; Antony, 2006). Subsequent western researchers are becoming aware of Taguchi’s innovations on designing easily understood (and analysed) experiments that simultaneously model variability and the average of a response variable. Many statisticians have become interested in designing DOE projects to achieve the same experimental objectives that Taguchi-style DOE projects did. However, they used more sophisticated statistical techniques, in part due to some shortcomings that they found in

4
statistical techniques used by Taguchi (Gunter, 1987, Myers et al., 1992). This campain was led by George Box and his collegues at the University of Wisconsin in late 1980s (Montgomery, 2013; Myers et al., 1992). Thanks to Taguchi’s contributions and subsequent reserch by the statisticians, today there is a rich base of literature on desiging experiments to make products or processes robust against the envionmenal noise. Taguchi’s quality philosophy and designing experiments to achieve quality objectives Dr Taguchi was an engineer by profession. He worked in many different industries in Japan, China, US, and elsewhere in the capacity of an engineer and a quality consultant (Myers et al., 1992).
Taguchi observed that conventional quality planning and quality control of a process was based on the notion that a capable process would result in a product (or process) whose quality characteristic would stay within the specified tolerance range or the specification limits (upper and lower specification limits), nearly all the time. Taguchi viewed quality and tolerance from a different perspective (Gunter, 1987; Roy, 2010; Taguchi et al., 2000 ). To his thinking, holding the quality characteristic of a product (or process) at any value with the specification limits (tolerance band) was not sufficient, because the greater the quality characteristic departed from its target (ideal) value, the greater the loss to producer and the customer (“loss to society”) (Gunter, 1987; Roy, 2010; Taguchi et al., 2000 ).
Taguchi asserted that a products (or processes) quality characteristic deviates from its target (ideal) value because the environmental noises transmit its variations to the response of the system. Taguchi emphasised on identifying specific environmental factors that create the noise. He argued that noise factors and control factors (the factors that can be altered in an experiment to achieve optimum performance) are the two major types of factors that govern the system and hence, the focus of an experimental designs (Montgomery, 2013; Roy, 2010). Taguchi developed a DOE methodology—commonly known as Taguchi methods—to reduce the variability of the quality characteristic of a product (or process) to enable it to stay close to its target value under typical operating conditions. Designing products using Taguchi method is commonly called “robust parameter design” (Myers et al., 1992). This approach departs from traditional (classical) DOE techniques due to both statistical tools Taguchi prescribed to achieve a so-called “robust parameter design” and the experimental objectives; as mentioned earlier, traditional DOE does not usually model the variability of the response variable (Gunter, 1987; Unal and Dean, 1991). Taguchi defined robustness as “the state where the technology, product, or process performance is minimally sensitive to factors causing variability (either in the manufacturing or user’s environment) and aging at the lowest unit manufacturing cost” (Taguchi et al., 2000 ).
Many (if not all) researchers and practitioners view Taguchi methods as an effective method of designing experiments (Park and Ha, 2005; Bañuelas and Antony, 2003). Proponents of Taguchi methods argue that Taguchi methods are effective because they are easy to understand (that is, they are user-centred than statistician-centred), quick (traditional DOE relies on building knowledge sequentially by way of conducting several smaller experiments) and less capital intensive (Roy, 2010; Phadke et al., 1987; Kim and Cho, 2000).
Application of Taguchi methods in the apparel/textile industry is quite new (Mavruz and Ogulata, 2010). Park and Ha (2005) applied Taguchi methods to optimise the sewing condition to reduce the ‘seam pucker’ using four control factors (swing speed, stitch length, needle tread tension, and presser foot pressure). Mavruz and Ogulata (2010) used Taguchi methods to optimise the bursting strength of knitted fabric by using certain yarn and fabric parameters as the control factors.
Nicholas (1998) stated that staying the product (or process) at standard or target value results in zero variability, which equates to zero waste and zero defects. According to

5
Nicholas, Taguchi method and Lean manufacturing are waste elimination approaches having some parallels to one another. Similar sentiments have been expressed by Wheeler (2010).
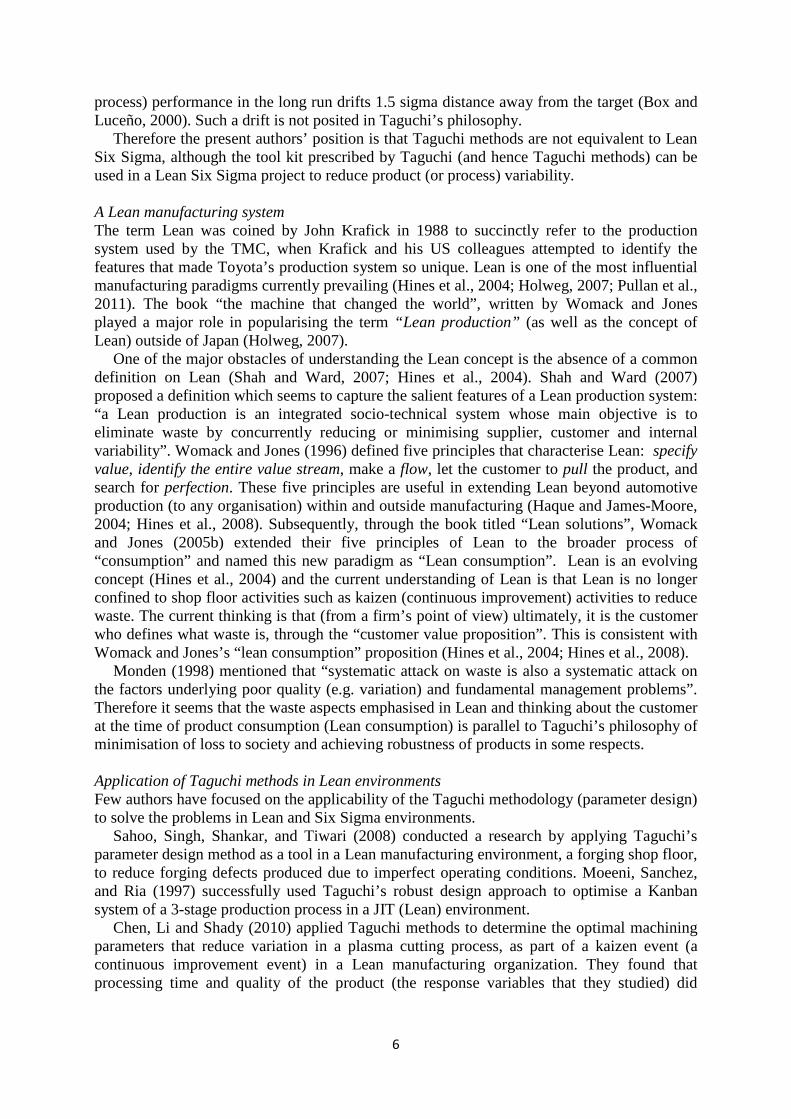
The term “Taguchi methods” is frequently used in the literature to mean two facets of a robust design: (a) Taguchi’s robust design philosophy and (b) the statistical tools prescribed by Taguchi to achieve a robust design. The latter is a subset of former as illustrated in Figure 1. Almost invariably, criticisms of Taguchi methods (e.g. Nair et al., 1992; Box et al., 1988; Jeyapaul et al., 2005) are only levelled at the statistical tools prescribed by Taguchi to achieve a robust design.
In this paper we examine Taguchi’s Robust Design Philosophy (presented in short form as Taguchi Philosophy) only. Taguchi vs traditional DOE and Lean Six Sigma In traditional DOE methods, the error (the difference between the actual and predicted response) is considered to vary at random and no distinction is made between control factors and noise factors (Taguchi et al., 2000). An index known as the signal to noise (S/N) ratio is used in Taguchi methods to combine the average and the variability (standard deviation) of the response variable (Taguchi et al., 2000 ). The control factor combination that achieves the highest S/N ratio is treated as the optimum factor combination that achieves the most robust design (Roy, 2010; Phadke et al., 1987; Taguchi and Clausing, 1990). Apart from the S/N ratio, Taguchi proposed several other accessories that are considered unique to Taguchi methods: custom-made orthogonal arrays to manipulate control factors and noise factors, linear graphs, and ad hoc analysis of variance (ANOVA) techniques that are not favoured by statisticians (Roy, 2010; Phadke et al., 1987; Rowlands et al., 2000).
There may be argument that the robust design approach advocated by Taguchi falls within a Lean Six Sigma paradigm as a Lean Six Sigma project can also be designed to minimise variability around a target value. However, literature shows that there are two major differences between Taguchi’s paradigm and Lean Six Sigma. The first major difference is that robust design aims to make products right first time (and every time) by building quality into the product in the first place (in Taguchi’s jargon through off-line quality control) whereas Lean Six Sigma projects are usually commissioned to overcome a (major) quality problem that has been detected through online quality control tools, such as run charts and control charts (Taguchi et al., 2005; Box and Luceño, 2000). Taguchi, Chowdhury & Wu (2005) described (Lean) Six Sigma as a “finding and fix methodology” which causes two types of disappointments: recurrences of same problem and solution for one problem pop up another problem, which in fact signals lack of robustness. The second major difference is that Lean Six Sigma paradigm recognises that while variability needs to be reduced to unprecedented levels, it is not possible to achieve a target value since the average product (or
Taguchi’s Robust Design Philosophy: “Simple, easy to understand statistically designed experiments need to be designed to make products or process to become
robust against environmental noise”
Prescribed Statistical Tools (by Taguchi) to Achieve a Robust Design: S/N ratio, readymade orthogonal arrays, linear graphs, ad hoc ANOVA techniques etc.
Figure 1 - Taguchi’s robust design philosophy and his prescribed statistical tools
6
process) performance in the long run drifts 1.5 sigma distance away from the target (Box and Luceño, 2000). Such a drift is not posited in Taguchi’s philosophy.
Therefore the present authors’ position is that Taguchi methods are not equivalent to Lean Six Sigma, although the tool kit prescribed by Taguchi (and hence Taguchi methods) can be used in a Lean Six Sigma project to reduce product (or process) variability. A Lean manufacturing system The term Lean was coined by John Krafick in 1988 to succinctly refer to the production system used by the TMC, when Krafick and his US colleagues attempted to identify the features that made Toyota’s production system so unique. Lean is one of the most influential manufacturing paradigms currently prevailing (Hines et al., 2004; Holweg, 2007; Pullan et al., 2011). The book “the machine that changed the world”, written by Womack and Jones played a major role in popularising the term “Lean production” (as well as the concept of Lean) outside of Japan (Holweg, 2007).
One of the major obstacles of understanding the Lean concept is the absence of a common definition on Lean (Shah and Ward, 2007; Hines et al., 2004). Shah and Ward (2007) proposed a definition which seems to capture the salient features of a Lean production system: “a Lean production is an integrated socio-technical system whose main objective is to eliminate waste by concurrently reducing or minimising supplier, customer and internal variability”. Womack and Jones (1996) defined five principles that characterise Lean: specify value, identify the entire value stream, make a flow, let the customer to pull the product, and search for perfection. These five principles are useful in extending Lean beyond automotive production (to any organisation) within and outside manufacturing (Haque and James-Moore, 2004; Hines et al., 2008). Subsequently, through the book titled “Lean solutions”, Womack and Jones (2005b) extended their five principles of Lean to the broader process of “consumption” and named this new paradigm as “Lean consumption”. Lean is an evolving concept (Hines et al., 2004) and the current understanding of Lean is that Lean is no longer confined to shop floor activities such as kaizen (continuous improvement) activities to reduce waste. The current thinking is that (from a firm’s point of view) ultimately, it is the customer who defines what waste is, through the “customer value proposition”. This is consistent with Womack and Jones’s “lean consumption” proposition (Hines et al., 2004; Hines et al., 2008).
Monden (1998) mentioned that “systematic attack on waste is also a systematic attack on the factors underlying poor quality (e.g. variation) and fundamental management problems”. Therefore it seems that the waste aspects emphasised in Lean and thinking about the customer at the time of product consumption (Lean consumption) is parallel to Taguchi’s philosophy of minimisation of loss to society and achieving robustness of products in some respects. Application of Taguchi methods in Lean environments Few authors have focused on the applicability of the Taguchi methodology (parameter design) to solve the problems in Lean and Six Sigma environments.
Sahoo, Singh, Shankar, and Tiwari (2008) conducted a research by applying Taguchi’s parameter design method as a tool in a Lean manufacturing environment, a forging shop floor, to reduce forging defects produced due to imperfect operating conditions. Moeeni, Sanchez, and Ria (1997) successfully used Taguchi’s robust design approach to optimise a Kanban system of a 3-stage production process in a JIT (Lean) environment.
Chen, Li and Shady (2010) applied Taguchi methods to determine the optimal machining parameters that reduce variation in a plasma cutting process, as part of a kaizen event (a continuous improvement event) in a Lean manufacturing organization. They found that processing time and quality of the product (the response variables that they studied) did

7
improve when the control factors were set at the optimal settings which determined by applying Taguchi methods. Continual Improvement Continual improvement is a combination of Kaizen (gradual improvement) and Kaikaku (radical improvement or innovation) (Gåsvaer and AxelsoNair, 2012). Kaizen is a Japanese word which means “change for the better” which is interpreted by most western companies as continuous improvement (CI) (Malik et al., 2007). Every organisation needs to continually improve to compete in continuously changing manufacturing environments, where product or processes need to be changed rapidly, to cater new demands to sustain manufacturing competitiveness (Singh and Singh, 2012; Love et al., 1998).
In recent years, several types of organisations/industries have employed CI approaches as a management paradigm to improve business outcomes, such as reducing waste/scrap and improving productivity (Bessant et al., 2001; Caffyn, 1999; Singh and Singh, 2012). Several definitions have been given for CI by the academia as well as by the industry. Bessant et al. (1994) viewed CI as a “company-wide process of focused and continuous incremental innovation”. The CI concept underlying the Deming management method was exemplified as “the propensity of the organisation to pursue incremental and innovative improvements of its processes, product, and services” by Anderson, Rungtusanatham and Schroder (1994).
CI is typically used in conjunction with another quality or process improvement approach such as Lean manufacturing, Six Sigma etc. (Bhuiyan and Baghel, 2005). These hybrid approaches have found to overcome the weakness of using one approach alone (Bhuiyan and Baghel, 2005). In fact, CI becomes part and parcel of Lean by definition, because adding value to the customer or waste elimination is an on-going process in Lean manufacturing entity (Jayamaha, 2014; Jayaram et al., 2010; Shah and Ward, 2007).
CI is embedded in all aspects of working life (Caffyn, 1999), which is important for any organisation as an integral part of the organisational life (Caffyn, 1999) to survive in a competitive manufacturing/service environment. Womack and Jones (2003) asserted that application of a combination of Kaizen and Kaikaku (continual improvement) do produce endless improvement, if correctly used.
The purpose of the study and the research question Taguchi approach has not been viewed as a strong component of Lean, even though both methods originated in Japan, a society that does not tolerate waste, having a large population relative to its resources and landmass (Bhasin and Burcher, 2006; Holweg, 2007; Liker, 2004). At philosophical level, both Lean and Taguchi methods can be viewed as waste/loss elimination methods. Taguchi methods (the philosophical element shown in Figure 1) view waste as a by-product of failing to produce a product (or design a process) that is robust against the variations of the environmental factors (noise) that affect the product (or process) whilst in use. Both Lean and Taguchi methods are based on the premise that waste is undesirable.The logical research question that follows from Taguchi methods and Lean, which seem to share a common theme, is:
Does Taguchi’s robust design philosophy (in short form Taguchi Philosophy) complement a Lean Manufacturing System to explain Manufacturing Process Outcomes?
The overall hypothesis is that “Taguchi Philosophy does complement Lean Manufacturing”.
Given the above overall hypothesis, this research was undertook to empirically investigate how Taguchi philosophy co-vary with Lean manufacturing in a selected industry—the apparel industry, which is invaluable to Sri Lanka and other developing countries—to explain manufacturing process outcomes.
8
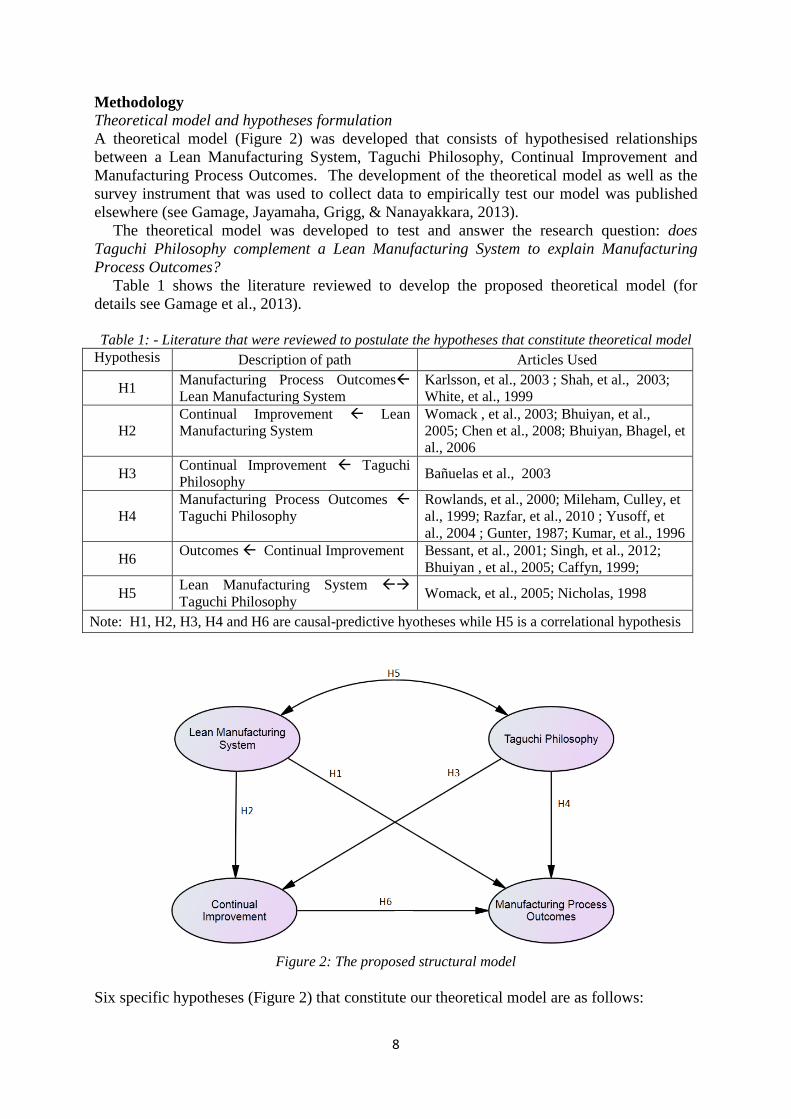
Methodology Theoretical model and hypotheses formulation A theoretical model (Figure 2) was developed that consists of hypothesised relationships between a Lean Manufacturing System, Taguchi Philosophy, Continual Improvement and Manufacturing Process Outcomes. The development of the theoretical model as well as the survey instrument that was used to collect data to empirically test our model was published elsewhere (see Gamage, Jayamaha, Grigg, & Nanayakkara, 2013).
The theoretical model was developed to test and answer the research question: does Taguchi Philosophy complement a Lean Manufacturing System to explain Manufacturing Process Outcomes?
Table 1 shows the literature reviewed to develop the proposed theoretical model (for details see Gamage et al., 2013).
Table 1: - Literature that were reviewed to postulate the hypotheses that constitute theoretical model
Hypothesis Description of path Articles Used
H1 Manufacturing Process Outcomes Lean Manufacturing System
Karlsson, et al., 2003 ; Shah, et al., 2003; White, et al., 1999
H2 Continual Improvement Lean Manufacturing System
Womack , et al., 2003; Bhuiyan, et al., 2005; Chen et al., 2008; Bhuiyan, Bhagel, et al., 2006
H3 Continual Improvement Taguchi Philosophy Bañuelas et al., 2003
H4 Manufacturing Process Outcomes Taguchi Philosophy
Rowlands, et al., 2000; Mileham, Culley, et al., 1999; Razfar, et al., 2010 ; Yusoff, et al., 2004 ; Gunter, 1987; Kumar, et al., 1996
H6 Outcomes Continual Improvement Bessant, et al., 2001; Singh, et al., 2012; Bhuiyan , et al., 2005; Caffyn, 1999;
H5 Lean Manufacturing System Taguchi Philosophy Womack, et al., 2005; Nicholas, 1998
Note: H1, H2, H3, H4 and H6 are causal-predictive hyotheses while H5 is a correlational hypothesis
Figure 2: The proposed structural model Six specific hypotheses (Figure 2) that constitute our theoretical model are as follows:

9
H1: A Lean Manufacturing System has a positive effect on Manufacturing Process Outcomes H2: A Lean Manufacturing System has a positive effect on Continual Improvement H3: Taguchi Philosophy has a positive effect on Continual Improvement H4: Taguchi Philosophy has a positive effect on Manufacturing Process Outcomes H5: Taguchi Philosophy is positively related to a Lean Manufacturing System H6: Continual Improvement has a positive effect on Manufacturing Process Outcomes
Each construct was captured through multiple questionnaire items in the survey instrument. There were sixteen, nine, eight and seven questionnaire items to capture the Lean Manufacturing System, Continual Improvement, Manufacturing Process Outcomes and Taguchi Philosophy respectively. Data collection instrument The 4-page survey instrument (questionnaire) was developed (for details see Gamage et al, 2013) which consisted of two parts. Part A of the questionnaire covered the demographic information about the respondent. Part B covered 40 statements related to the production environment of the respondent’s manufacturing facility. In part B of the questionnaire, a 7-point Likert scale was used to seek agreement or disagreement to 40 statements on several facets related to the four constructs of our theoretical model (Figure 2). In the Likert scale that we used, code 1 indicated “Strongly Disagree” while code 7 indicated “Strongly Agree”. Codes 2, 3, 4, 5 and 6 referred to “Disagree”, “Somewhat Disagree”, Neither Disagree nor Agree”, “Somewhat Agree”, and “Agree” respectively. A seven point Likert scale was used to improve the reliability of the measurement scale (Nunnally and Bernstein, 1994). For the statistical analysis, we considered the Likert scale as “interval”.
In administering the survey, the anonymity of the respondents was maintained at all times. The English and Sinhala (the mother language of the respondents) version of the questionnaires were signed by the lead researcher. Fowler (Fowler Jr., 2009) has mentioned the “almost anything that makes a mail questionnaire look more professional, more personalised, or more attractive will have some positive effect on response rate”. Validating the questionnaire items The draft survey questionnaire was first content-reviewed by a panel of experts (academics and practitioners) who were knowledgeable about the contents in the questionnaire. This questionnaire as well as the theoretical model used in this study has been published (see Gamage et al., 2013). Upon content review, emendations were made to the questionnaire, and a Sinhala translation was prepared by the lead author of this paper for the benefit of those respondents who do only speak their native language (the majority of frontline workers in Sri Lanka do only understand very basic sentences in English). The Sinhala translation was back translated to English by an independent person and the back translated version was tallied with the original English version to make sure that the Sinhala version is identical to the English version in meaning. The questionnaire (both Sinhala and English versions) was further tested through a subsample (n = 20) of the relevant population (i.e. pilot testing) for improving the clarity of the questionnaire and to identify any issues associated with the questionnaire and subsequently revised to make it more user friendly. The subsample consisted of 10 managers and 10 frontline workers. Sample In survey research, the sample selection process is as important as the data collection process (Fowler Jr., 2009). This is because the quality of sample data depends on the proportion of people from whom the data are actually collected.

10
This research was conducted in an apparel manufacturing context. A disproportionate stratified random sample representing a greater proportion of line managers relative to blue collar workers (approximately 80% are blue collar workers in apparel manufacturing facilities) was chosen from a manufacturing facility so that an approximately 50-50 representation from both managers and blue collar workers were represented. The reader may note that the strategy of obtaining a sizable representation of managers has been adopted by other researchers also (e.g. Evans, 2004; Flynn and Saladin, 2001) to get a more balanced view on the statements made in a survey instrument. In the case of this research, as mentioned earlier, the 40 Likert-type survey questionnaire items provide 40 statements related to the four constructs of the theoretical model (Figure 2).
Data were collected from 31 production facilities owned by one of the largest apparel manufacturing company in Sri Lanka (the facilities were located across all but the northern and eastern provinces of Sri Lanka). This organisation (the identity is not disclosed due to confidentiality agreements between the lead researcher’s employer and the said organisation) is a mature Lean apparel manufacturing organisation, which chose “Lean” as their competitive strategy ten years ago. There are many parallels between the Toyota Production System (TPS) and the Lean operations system adapted by this organisation for their own production management system. The Lean apparel organisation which was chose exports apparel under the labels of ‘flagship apparel brands’ to the US and European markets.
There was sufficient diversity within a facility (each facility has a cutting department, production/sewing department, quality control department, work study department that provide value addition to the garments being produced) as well as between facilities of the organisation that we chose. Different facilities produce different garments and more importantly, they compete with each other to outperform in Lean key performance indicators (KPIs). This diversity was deemed necessary as there should be sufficient variability in the responses received.
There were 1240 copies of questionnaire which were dispatched (along with blank envelopes to enclose the duly completed questionnaires) in October/November 2013 from Sri Lanka using a local bulk mail system to the 31 human resource (HR) managers in each manufacturing facility. Consequently, each HR manager received 40 copies of the questionnaire to be distributed in their manufacturing facility. The HR managers, who acted as coordinators of the project during the data collection phase, were asked to pick 40 potential respondents at random from their facility, maintaining a 50-50 balance between managers and front line workers. The HR managers were also asked to accept only sealed envelopes as responses. Further, they were asked to dispatch the completed questionnaires that they collected (as bulk mail) within 4 weeks from receipt to a central Sri Lankan address. Responses were received at the Sri Lankan address within 5-8 weeks from dispatching the questionnaires (a gentle reminder was sent in the third week and a two-week extension of time had to be given to those who requested for an extension of time). The responses (duly completed questionnaires) were then relayed back to New Zealand using a reputed international courier company.
The data received were analysed using IBM SPSS 21 and AMOS 21 software packages. The first software package was used to conduct principal components analysis (PCA) and scale reliability assessment (Cronbach’s alpha only) while the second software package was used to conduct confirmatory factor analysis (CFA) and structural equation modelling (SEM) involving the hypothesised theoretical model (Figure 2). Measurement Item Parcelling in SEM Conventional SEM is conducted with a limited number of indicators per construct (latent variable). In most SEM applications, 3 to 5 indicators per latent variable are deemed optimal

11
(Bollen, 1989; Byrne, 2010 ; Kline, 2011). Unlike principal components regression and other component-based regression methods such as partial least squares path modelling, a large number of measurement items are not required in SEM for a latent variable to achieve consistency (Kline, 2011; Bollen, 1989; MacCallum and Browne, 1993). Research shows that SEM models use a large number of measurement items to reflect a latent variable usually result in a poor covariance model fit (Byrne, 2010; Matsunaga, 2008). For this reason, in applications where a larger number of measures are used to reflect a latent variable, a strategy known as “item parcelling” is used. In item parcelling used in SEM, measurement items are aggregated (typically the average is taken) to form a fewer number of indicators per latent variable (Bandalos and Finney, 2001; Byrne, 2010; Matsunaga, 2008). In this research, the parcelling strategy was used to reduce the number of indicators in the constructs. While there are several parcel-building algorithms—for example, factorial algorithm, random algorithm, correlational algorithm, and radial algorithm—we used the factorial algorithm (Matsunaga, 2008) for parcel-building.
As it is important to inform the reader that item parcelling is prevalent in SEM-based applied research, the following is paraphrased from Bandalos and Finny (2001, p. 269).
“We found that of 317 applied SEM or CFA studies, 62 (19.6%) employed some type of parcelling procedure. More specifically, we found the following percentages with each journal: Journal of Educational Measurement, 60%; Journal of Education Psychology, 23%: Applied Psychological Measurement, 25%; American Educational Research Journal, 33%; Educational and Psychology Measurement, 18%; Structural Equation Modelling, 13%; and Journal of Marketing Research, 9%.”
Results In total 332 completed questionnaires were received from all 31 but from 3 manufacturing facilities, returning a response rate of 29.6% at the time of writing this paper. There were 14 numbers of unengaged questionnaires which has large number of unanswered survey items; any completed questionnaire that had more than 12 unanswered survey items (30%) were regarded as unusable for the purpose of this research. Therefore the net response rate was 28.4% after removed unusable questionnaires. Descriptive statistics of the sample Figure 3 presents some useful descriptive statistics pertaining to the respondents. It is not surprising that female respondents outnumber the male respondents as the apparel industry is well represented by females. About 90% of the workforces in the apparel industry in Sri Lanka are females (Safa, 1981; Arsenault, 2009). The results also show that the respondents do possess a satisfactory education level (note that the GCE (AL) qualification in Sri Lanka is equivalent to NCEA level 3 qualification in New Zealand) with good representation of blue collar and white collar workforce.

12
Figure 3: Presentation of descriptive statistics of the respondents
Testing the survey responses for the absence of substantial common method bias Harman’s single factor test (Podsakoff and Organ, 1986) was conducted by factor analysing the 40 survey items in the questionnaire using the PCA method to make sure that the data are not reduced to a single factor or component (the 40 survey items were reduced to 6 components, having eigenvalues greater than 1.0); had a single component emerged, according to Harman’s single factor test, that would have indicated substantial common method bias of the survey responses. Testing for relevance of each survey item, unidimensionality, and survey item pacelling The scale unidimensionality was verified using PCA as a prerequisite for item parcelling. Six questionnaire items (strikethrough in Table 2) were removed due to least contribution to the overall internal consistency of relevant construct and due to low factor loadings (< 0.04). Thereafter, the factor loadings for each construct were re-generated (using PCA after removing the said poorly relating survey items) and were arranged in the ascending order (Table 2). We then aggregated survey items to reduce them to a fewer number of indicators, using the factorial algorithm. As an example for aggregation, the 14 survey items which belong to ‘Lean Manufacturing System’ were reduced to 5 indicators (L1 through to L5) as shown in Table 2. Staying with the construct ‘Lean Manufacturing System’ to explain the factorial algorithm further, using an example, the first parcel (L1) of the said construct was created by taking the average of the scores of the questionnaire items with the first highest, sixth highest and eleventh highest factor loadings (hence the average of the scores for Q34, Q23 and Q5); the second parcel (L2) was created by taking the average of the scores of the questionnaire items with the second highest, seventh highest and twelfth highest factor loadings (hence the average of the scores for Q32, Q40 and Q30), and so on. The reader may note that the factorial algorithm evenly distributes the item-specific components across the parcels (Matsunaga, 2008, Rogers and Schmitt, 2004). The application of the factorial algorithm resulted in the constructs Lean Manufacturing System, Continual Improvement, Taguchi Philosophy, and Manufacturing Process Outcomes possessing 5, 4, 3 and 3 indicators respectively (Table 2).
Male, 106, 33% Female,
212, 67%
Categorisation by gender
67 199
44 8
0 50 100 150 200 250
At least GEC (OL)GCE (AL)
BachelorsPostgraduate
Number of employees
Categorisation by educational qualifications
Blue Collar, 180, 57%
White Collar, 138, 43%
Categorisation by status
33 80
110 95
0 50 100 150
Less than 2 yrs2-5 yrs
5-10 yrsMore than 10 yrs
Number of employees
Categorisation by work experience

13
Table 2 - Indicators of the measurement scales and factor loadings Q
uest
ion
No.
in th
e Q
uest
ionn
aire
A Brief Description of Each Survey Item (Question) in the Questionnaire
Indi
cato
r to
Whi
ch
a Q
uest
ion
Belo
ngs
to A
fter P
arce
lling
Fact
or L
oadi
ng
Lean Manufacturing System Q34 Develop exceptional people and teams to follow company’s philosophy L1 0.750 Q32 Process support the strategic objectives of our organisation L2 0.746 Q39 Employees become multi-skilled through frequent job rotation L3 0.695 Q31 Standardised methods to identify problems L4 0.677 Q25 Visual control systems to indicate problems in the production floor L5 0.674 Q23 Managing the production using “pull” production system L1 0.668 Q40 Company provides opportunities for my growth and development L2 0.665 Q33 We use cross-functional teams to solve the problems L3 0.614 Q24 Organisation has a system that enables learning through experience L4 0.611 Q18 Supplier relationships L5 0.578 Q5 Maintain our plant in a clean and orderly manner L1 0.560
Q30 Predictive and preventive maintenance programme L2 0.530 Q37 Use value stream map to achieve improvements L3 0.517 Q14 The ultimate judge of our products and services is customer L4 0.437
Continual Improvement Q17 Employees use appropriate tools and techniques to support CI CI1 0.683 Q7 Ongoing assessment to that the organisation’s structure and infrastructure
support the corporate and departmental strategy CI2 0.680
Q16 Managers lead by example CI3 0.673 Q22 Employees understand department’s strategies, goals and objectives CI4 0.654 Q21 We attempt to continuously reduce the change-over time CI1 0.649 Q4 Improvement tasks are embedded in employers’ everyday a activities CI2 0.639 Q8 Company design the plant layout to improve the material flow CI3 0.631
Q15 The mechanism used to enable CI effort in our company are monitored CI4 0.562 Q3 Standardisation of process and task CI1 0.506
Q11 The employees in our plant are rewarded appropriately Q36 Employees are encouraged to learn from mistakes
Manufacturing Process Outcomes Q38 The risk and uncertainty that the final product will not meet customer
requirement has been reduced by our company PO1 0.697
Q6 Progress in reducing the manufacturing cycle time PO2 0.678 Q35 Improvement in reducing new product development time PO3 0.677 Q2 Effectiveness of product development PO1 0.616
Q28 Progress in reducing internal scrap and rework PO2 0.605 Q9 The customer complaints about product quality PO3 0.532 Q1 Effectiveness of process development
Q26 Unit cost of production compare to competitors Taguchi Philosophy
Q20 Any deviation from the target value as a loss to our company T1 0.808 Q19 Any deviation from the target value as a loss to our external customer T2 0.755

14
Q13 The term “quality” to mean little or no deviation from the target value T3 0.556 Q27 Products robust under varying user conditions T1 0.507 Q29 Quality cannot be achieved only through inspecting T2 0.494 Q10 Get optimum process setting by changing OFAT (reverscoded) Q12 Try to make our manufacturing process robust
Testing scale reliability Scale reliability is a precondition for validity of the constructs. Three most widely used coefficients of reliability, Cronbach’s coefficient alpha (α) (Cronbach, 1951), composite reliability coefficient (ρ) (Werts et al., 1974), and the average variance extracted (AVE) (Fornell and Larcker, 1981) were determined. The reader may note that the values of the last two reliability coefficients ρ and AVE were obtained after conducting CFA/SEM (covered later) as it is not possible to determine these values otherwise (Chin, 1998).
Table 3: Measures of scale reliability Construct With Item Parcelling Without Item Parcelling
No. of indi-cators
Cron-bach’s Alpha
AVE
Composite Reliability
(ρ)
No. of indi-cators
Cron-bach’s Alpha
AVE
Composite Reliability
(ρ)
Lean Manufacturing System
5 0.84 0.62 0.83 14 0.89 0.40 0.93
Continual Improvement 4 0.75 0.58 0.80 9 0.82 0.40 0.90
Manufacturing Process Outcomes 3 0.69 0.60 0.75 6 0.71 0.41 0.85
Taguchi Philosophy 3 0.60 0.54 0.74 5 0.64 0.41 0.82 Notes: (a) Without item parcelling scenario (not used) is shown for baseline purposes only.
(b) The minimum values for Cronbach’s coefficient alpha and composite reliability coefficient (ρ) is 0.70 for an established (mature) construct and 0.60 for a new (or emerging) construct. The minimum value for AVE is 0.50 (lower values may also be acceptable). For more details of the cut-off values of Cronbach’s α, ρ, and AVE see Nunnally, (1994); Werts, Linn and Jöreskog (1974), and Chin (1998) respectively.
Table 3 depicts the above mentioned reliability coefficients taking into account “with item
parceling” and “without item parceling” scenarios (without item parceling scenario, as justified later, is given as a baseline condition only). Comparing the values of the coefficients for the four constructs with minimum values prescribed (Table 3), it becomes clear that all but the construct Taguchi Philosophy meet the minimum values prescribed for an established construct. Given that Taguchi Philosophy is in fact a new construct, the Cronbach’s α value of 0.60 obtained was deemed acceptable. Moreover, it is well documented that Cronbach’s α can significantly underestimate scale reliability if a condition known as Tau equivalency is violated; Tau equivalency approximately translates to having to have equal variance across all indicators (measures) of the construct (Graham, 2006, Peterson and Kim, 2013) in this reserch the varaince of all three indicators of Taguchi Philosophy was not equal, which explians why the reliability of Taguchi Philosophy is under estimated through Cronbach’s α. The reader will note that the values of the reliability coefficients ρ and AVE of Taguchi Philosophy

15
exceed the minimum values prescribed for a mature construct. For these reasons it was considered that this construct too shows adequate scale reliability.
Having established scale reliability, the validity of the constructs/scales is assessed next. Confirmatory factor analysis to establish factorial validity of the constructs Confirmatory factor analysis (CFA) was conducted to establish factorial validity. Factorial validity is an important aspect of construct validity. Factorial validity establishes that the constructs (factors), as operationalised by their measurement scales, do represent (in a factorial/statistical sense) what they purport to represent (Bollen, 1989, Nunnally and Bernstein, 1994). It is important to note that factorial validity is only one aspect (and an important one at that) of construct validity (Nunnally and Bernstein, 1994).
A CFA model is created by a researcher by correlating each construct with every other construct of his/her model (Byrne, 2010). In the case of our research, this equates to replacing the single headed arrows in Figure 2 with double headed arrows. This also raises a perennial oddity in SEM—equivalent models—where two models do show the exact same global goodness of fit (Steiger, 2001; Stelzl, 1986; Lee and Hershberger, 1990). Using the rules prescribed by Lee and Hershberger (1990) it can be shown that the model which used for CFA in this research and the theoretical model (Figure 2) are equivalent models.
Table 4 shows the extent to which the CFA model as well as the theoretical model (Figure 2) fit to data—after item parcelling and before item parcelling—in a covariance sense; the covariance fit is formally known as the “global goodness-of-fit” (Byrne, 2010; Kline, 2011). There are numerous global goodness-of-fit measures to assess the covariance fit; the frequently used fit indices are covered in Table 4.
Table 4 - The global goodness-of-fit statistics of the CFA and the theoretical model Indicator Value when Items
are parcelled Value when items are not parcelled
Prescribed cut-off values
Discrepancy (χ2)/df 143.391/84 = 1.71
1050.963/523 = 2.01
Less than 3 desired
RMSEA 0.047 0.056 < 0.05 for a good fit; > 0.05 and < 0.08 for
a satisfactory fit CFI 0.963 0.834 > 0.90 for good fit NFI 0.918 0.721 > 0.90 for good fit PCLOSE 0.621 0.02 > 0.50 for a good fit Note: Based on the results shown in this table, the model with parcelled items was
treated as the model for further analysis. For prescribed cut off values of global goodness-of-fit measures see Byrne (2010 ).
As shown in Table 4, the global goodness-of-fit indicators for the CFA model and the theoretical model are a good fit to data (in a covariance sense), when the survey items are not parcelled the covariance fit (the global goodness-of-fit). This justifies the use of item parcelling.
Having established factorial validity through CFA, the convergent and discriminant validity of the constructs—another important aspect in construct validity—was established by tabulating the correlations and cross-correlations between the constructs (latent variables) and the indicators (measures) of the constructs. Table 5 shows the loadings (correlations) and cross-loadings (cross correlations) concerned.

16
Convergent validity and discriminant validity An indicator (or a measure) of a construct is said to be showing convergent validity if that indicator is strongly correlated (this correlation is known as the loading) with its assigned construct (Byrne, 2010; Chin, 1998). An indicator (or a measure) of a construct is said to be showing discriminant validity if the correlations between the indicator and the other constructs to which the indicator is not assigned to (these correlations are known as cross-loadings) are not as strong as the correlation between the indicator and its assigned construct (i.e. loading) (Byrne, 2010; Chin, 1998).
Table 5 - The factor loadings and cross loadings
Construct
Indicator
Lean Manufacturing System
Continual Improvement
Manufacturing Process Outcomes
Taguchi Philosophy
L1 0.81 0.68 0.58 0.36 L2 0.78 0.65 0.57 0.28 L3 0.78 0.61 0.60 0.33 L4 0.79 0.58 0.59 0.33 L5 0.73 0.62 0.45 0.41 CI1 0.65 0.78 0.54 0.34 CI2 0.56 0.73 0.50 0.23 CI3 0.60 0.76 0.48 0.39 CI4 0.61 0.74 0.49 0.34 PO1 0.58 0.54 0.79 0.38 PO2 0.52 0.53 0.76 0.33 PO3 0.45 0.45 0.73 0.40 T1 0.34 0.32 0.39 0.82 T2 0.28 0.23 0.33 0.74 T3 0.19* 0.29 0.34 0.57 Notes: (a) All the correlations were significant at 0.001 level except the one with * which is only significant at 0.05 level
Based on the loadings and cross-loadings shown in Table 5, it becomes clear that the indicators of the constructs show convergent and discriminant validity.
Having established scale reliability and having established the factorial validity, the convergent validity, and discriminant validity it is concluded that the scales are a valid operationalisation of the constructs (Byrne, 2010; Nunnally and Bernstein, 1994).
Having established the validity of the constructs of the theoretical model (i.e. construct validity), the next section discusses the structural relationships between the constructs along with test results on the six research hypotheses from a theoretical and practical perspective. Discussion Test results on the research hypotheses It was shown earlier that the theoretical model is a good fit to data (Table 4). Figure 4 shows the structural coefficients between the constructs; except for the double headed arrow showing the correlation between the Lean Manufacturing System and Taguchi Philosophy, all other coefficients are standardised regression coefficients.

17
Figure 4 - The structural model and parameter estimates
Of the six hypotheses posited two hypotheses—H1: “A Lean Manufacturing System has a positive effect on Manufacturing Process Outcomes”; H3: “Taguchi Philosophy has a positive effect on Continual Improvement”—were not supported by data. The implications of these non-supported hypotheses are discussed in turn.
Not supporting H1 implies that, in the setting in which the data were collected (apparel manufacturing), the Lean Manufacturing System has no direct effect on Manufacturing Process Outcomes. However, Lean Manufacturing System’s effect on Process Outcomes is strongly felt through the mediating effect Continual Improvement plays in the Lean Manufacturing System Manufacturing Process Outcomes relationship. This conclusion is based on the high standardised regression coefficients in the following paths: Lean Manufacturing System Continual Improvement (0.91, p = 0.000), and Continual Improvement Manufacturing Process Outcomes (0.76, p = 0.000).
From a practical perspective, the strong mediating role played by Continual Improvement in the Lean Manufacturing System Manufacturing Process Outcomes causality could mean that for apparel manufacturing firms that espouse Lean, any continual improvement activity that is perceived to be resulting in improving the process outcomes is Lean. This proposition should be supported by qualitative data collected from Lean apparel manufacturing plants. In any case, the literature (e.g. Bhuiyan and Baghel, 2005; Chen et al., 2010; Bhuiyan et al., 2006; Shah and Ward, 2003) supports that Continual Improvement is an integral part of a Lean Manufacturing System, which explains the strong support for H2. It could be quite possible that in the apparel industry which uses Lean, CI is synonymous with Lean. This again is something that needs to be verified by qualitative data.
Not supporting H3 implies that Continual Improvement does not mediate the causal relationship between Taguchi Philosophy and Manufacturing Process Outcomes. In practice Taguchi methods are frequently used in Continual Improvement projects—with or without the banner Lean Six Sigma—to reduce product or process variability (Shang et al., 2004; Taguchi et al., 2005; Park and Ha, 2005). The fact that a positive (albeit small) causal predictive relationship was found in the path Taguchi Philosophy Manufacturing Process Outcomes (0.17, p = 0.047), without any mediation from Continual Improvement actually supports Taguchi’s robust design philosophy (in short form Taguchi Philosophy as mentioned earlier) and its nexus to a Lean Manufacturing System, given the fact that Taguchi Philosophy was found to be positively correlated with the Lean Manufacturing System (0.45, p =0.000).

18
Taguchi Philosophy is based on the notion that achieving high system quality levels economically requires “quality to be designed”, meaning pushing quality back to the product/process design stage (Unal and Dean, 1991, Gunter, 1987). Improving the product or process by applying DOE to solve existing quality problems—with or without the banner Lean Six Sigma—as is not what Taguchi advocated, although Taguchi himself had to help the Japanese industry in solving existing and ongoing quality problems associated with products and processes (Roy, 2010; Taguchi and Clausing, 1990).
In essence Taguchi’s quality control approaches mainly focus on offline quality control (Gunter, 1987; Taguchi and Clausing, 1990; Unal and Dean, 1991; Roy, 2010). Implementing Taguchi’s DOE philosophy is a simple and less costly strategy of achieving robustness in the products and processes (hence quality) on two counts. Firstly Taguchi’s DOE philosophy enables firms to manufacture a high quality product upfront using less resource (e.g. less financial expenditure in buying expensive raw material and machinery). Secondly, because Taguchi methods aim at producing the product (or process) the right first time, they greatly eliminate the need to correct problems found in the products later through capital intensive quality improvement projects such a Lean Six Sigma projects (Hoerl and Gardner, 2010, Snee, 2010). One can also argue that non-support of H3 could be due to respondents not having experience in using Taguchi methods to improve quality in CI projects such as Lean Six Sigma.
Given the above, the overall hypothesis in our study, “Taguchi Philosophy does complement Lean Manufacturing”, was supported by data. However, the high R2 for Manufacturing Process Outcomes (0.89) warrants an explanation as such high R2 values are not very common in published studies (for an exception see Jayamaha et al., (2014)) in social sciences. The high R2 can be attributed to employee’s perceived knowledge on the actual outcomes. As a part of the visual management system of their own production management system, all apparel manufacturing plants from which the data were collected were required to visually display (e.g. through histograms, trend lines etc.) how they have been achieving Lean outcomes. In conducting fieldwork (Taguchi-style experiments) by the lead researcher of this paper in one of the manufacturing facilities of the sample, it was found that visual displays that the manufacturing plants have been displaying invariably showed positive trends over the last three years. Therefore it is quite possible that the respondents may have had perceived that the Lean production systems of their respective plants have been doing well, thus resulting in a high R2 for Manufacturing Process Outcomes. Conclusions In this paper, a theoretical model that predicts and explains process outcomes (manufacturing performance) through Lean and Genichi Taguchi’s robust design philosophy on robust product/process design was empirically tested using structural equation modelling (SEM). Specifically we tested the extent to which Taguchi’s quality paradigm (robust design philosophy) integrates with Lean to explain Lean manufacturing performance. This model was tested through survey data (N = 318) collected from mature Lean apparel manufacturing facilities (plants) located in Sri Lanka belonging to one of Sri Lanka’s largest apparel manufacturer. The plants we surveyed do not use robust design methods in their day to day operations. As such our study can be viewed as a study that determines the acceptance of Taguchi’s robust design philosophy by Lean apparel manufacturers as a way of improving their performance.
We found that our theoretical model (Figure 2) was a good fit to the data in terms of the major global goodness-of-fit indices used in SEM (Byrne, 2010 , Blunch, 2008). Four out of the six of the hypotheses were supported by data and the non-support of the remaining two hypotheses (see Figure 4) was interpreted from a practical perspective. Our findings

19
supported the overall hypothesis of the study: “Taguchi Philosophy does complement Lean Manufacturing”. We also interpreted the model parameters that were estimated from a practical perspective. However, the impact of Taguchi’s robust design philosophy on the Lean production system appeared to be small practically. This could be either due to lack of experience or exposure (on the part of frontline workers and their managers) to improve quality (more specifically reduce variation) through design of experiments or lack of opportunities to use Taguchi-style experiments in the apparel industry. This may be something that has to be investigated through field studies. Limitations and future research Our study has three limitations. These should be addressed in future research. Firstly, the findings were based on cross-section data to support a theoretical model that has not been tested before. Our research, as is the case with many published studies that used SEM, is essentially correlational. The findings of this study should be supported with field studies to enrich the study’s findings on cause-effect relationships. Secondly, the findings of this study may be specific to the particular industry (apparel), from which the data were collected. Therefore the proposed theoretical model may not be applicable (generalisable) beyond the apparel industry. Future work needs to be done to test the generalisability of the proposed theory beyond the apparel industry. Thirdly, this study was conducted in 31 manufacturing facilities belonging to one particular Sri Lankan-owned organisation; even though this organisations has manufacturing plants in other South Asian countries and Latin America, data were not collected from respondents in plants outside Sri Lanka. This was because we assumed that employees in these plants may be used to an organisational culture that is very different to what is found in the 31 manufacturing facilities (plants) in Sri Lanka. Also it was not possible to verify whether the plants outside Sri Lanka were actually Lean manufacturing plants. Organisational culture can possibly moderate the hypothesised relationships in this paper. Future research may also be directed towards studying the moderating relationships by culture and other factors.
In spite of the limitations mentioned above, this study does serve as a foundation for future research on the relationship between Lean and Taguchi’s robust design paradigm in explaining manufacturing process outcomes. References Allen, T. T. (2010). " Introduction to engineering statistics and lean sigma: statistical quality control and design
of experiments and systems " London; New York Springer. Anderson, J. C., Rungtusanatham, M. and Schroeder, R. G. (1994). "A Theory of Quality Management
Underlying the Deming Management Method," The Academy of Management Review, Vol. 19, No. 3, pp. 472-509
Antony, J. (2006). "Taguchi or classical design of experiments: a perspective from a practitioner," Sensor Review, Vol. 26, No. 3, pp. 227-230.
Arsenault, N., Rose, C., Azulay, A., Meyer, R. . (2009). "Restoring women to world studies." Bandalos, D. L. (2002). "The effects of item parceling on goodness-of-fit and parameter estimate bias in
structural equation modeling " Structural Equation Modeling, Vol. 9, No. 1, pp. 78-102. Bandalos, D. L. and Finney, S. J. (2001). "Item parceling issues in structural equation modeling," New
developments and techniques in structural equation modeling, Vol. 269. Bañuelas, R. and Antony, J. (2003). "Going from six sigma to design for six sigma: an exploratory study using
analytic hierarchy process," The TQM Magazine, Vol. 15, No. 5, pp. 334-344. Bessant, J., Caffyn, S. and Gallagher, M. (2001). "An evolutionary model of continuous improvement
behaviour," Technovation, Vol. 21, pp. 67-77. Bessant, J., Caffyn, S., Gilbert, J., Harding, R. and Webb, S. (1994). "Rediscovering continuous improvement "
Technovation, Vol. 14, No. 1, pp. 17-29. Bhasin, S. and Burcher, P. (2006). "Lean viewed as a philosophy," Journal of Manufacturing Technology
Management, Vol. 17, No. 1, pp. 56-72.

20
Bhuiyan, N. and Baghel, A. (2005). "An overview of continuous improvement: from the past to the present," Management Decision, Vol. 43, No. 5, pp. 761-771.
Bhuiyan, N., Baghel, A. and Wilson, J. (2006). "A sustainable continuous improvement methodology at an aerospace company," International Journal of Productivity and Performance Management, Vol. 55, No. 8, pp. 671-687.
Blunch, N. J. (2008). "Introduction to structural equation modelling using SPSS and AMOS," London, Sage. Bollen, K. A. (1989). "Structural equations with latent variables," New York, Wiley. Box, G., Bisgaard, S. and Fung, C. (1988). "An explanation and critique of Taguchi's contributions to quality
engineering," Quality and reliability engineering international, Vol. 4, No. 2, pp. 123-131. Box, G. and Luceño, A. (2000). "Quality Quandarie: Six Sigma, Process Drift, Capability Indices, and Feedback
Adjustment," Quality Engineering, Vol. 12, No. 3, pp. 297-302. Box, G. E. P. and Bisgaard, S. (1987). The scientific context of quality improvement. Quality progress. Center
for Quality and Productivity Improvement, University of Wisconsin-Madison. Byrne, B. M. (2010 ). "Structural equation modeling with AMOS: basic concepts, applications, and
programming," New York, NY, Routledge Byrne, D. M. and Taguchi, S. (1987). Taguchi approach to parameter design. Quality progress. Caffyn, S. (1999). "Development of a continuous improvement self-assessment tool," International Journal of
Operations & Production Management, , Vol. 19, No. 11, pp. 1138 - 1153. Chen, J. C., Li, Y. and Shady, B. D. (2010). "From value stream mapping toward a lean/sigma continuous
improvement process: an industrial case study," International Journal of Production Research, Vol. 48, No. 4, pp. 1069-1086.
Chin, W. W. (1998). "The partial least squares approach to structural equation modeling," Modern methods for business research, Vol. 295, No. 2, pp. 295-336.
Cronbach, L. J. (1951). "Coefficient alpha and the internal structure of tests," Psychometrika, Vol. 16, No. 3, pp. 297-334.
Engelhardt, F. (2001). Robust product development by combining engineering design and designed experiments. Royal Institute of Technology.
Evans, J. R. (2004). "An exploratory study of performance measurement systems and relationships with performance results," Journal of Operations Management, Vol. 22, No. 3, pp. 219-232.
Flynn, B. B., Sakakibara, S. and Schroeder, R. G. (1995). "Relationship between JIT and TQM: Practices and Performance," The Academy of Management Journal Vol. 38, No. 5, pp. 1325-1360
Flynn, B. B. and Saladin, B. (2001). "Further evidence on the validity of the theoretical models underlying the Baldrige criteria," Journal of Operations Management, Vol. 19, pp. 617–652.
Fornell, C. and Larcker, D. F. (1981). "Evaluating structural equation models with unobservable variables and measurement error," Journal of Marketing Research (JMR), Vol. 18, No. 1.
Fowler Jr., F. J. (2009). "Survey research methods," London, UK, New Delhi, India, Sage Publications. Gamage, P., Jayamaha, N. P., Grigg, N. P. and Nanayakkara, N. K. B. M. P. (2013). Developing and testing a
theoretical model integrating taguchi’s quality philosophy in a lean manufacturing context. 11th ANZAM. Brisbane, Austrailia.
Gåsvaer, D. and Axelsonair, J. V. (2012). "Kaikaku - Radical Improvement in Production " World Academy of Science, Engineering and Technoloy, Vol. 1, No. 6, pp. 09-22.
Graham, J. M. (2006). "Congeneric and (Essentially) Tau-Equivalent Estimates of Score Reliability What They Are and How to Use Them " Educational and Psychological Measurement, Vol. 66, No. 6, pp. 930-944.
Gummesson, E. (2008). "Extending the service-dominant logic: from customer centricity to balanced centricity," Journal of the Academy of Marketing Science, Vol. 36, No. 1, pp. 15-17.
Gunter, B. (1987). A perspective on the Taguchi methods. Quality progress. Hall, R. J., Snell, A. F. and Foust, M. S. (1999). "Item parceling strategies in SEM: Investigating the subtle
effects of unmodeled secondary constructs," Organizational Research Methods, Vol. 2, No. 3, pp. 233-256. Haque, B. and James-Moore, M. (2004). "Applying lean thinking to new product introduction " Journal of
Engineering Design, Vol. 15, No. 1, pp. 1-31. Hines, P., Found, P., Griffiths, G. and Harrison, R. (2008). "Staying Lean: thriving, not just surviving," Lean
Enterprise Research Centre. Hines, P., Holweg, M. and Rich, N. (2004). "Learning to evolve: a review of contemporary lean thinking,"
International Journal of Operations & Production Management, Vol. 24, No. 10, pp. 994-1011. Hoerl, R. W. and Gardner, M. M. (2010). "Lean Six Sigma, creativity, and innovation," International Journal of
Lean Six Sigma, Vol. 1, No. 1, pp. 30-38. Holweg, M. (2007). "The genealogy of lean production," Journal of Operations Management, Vol. 25, pp. 420-
437. Howard, D. (1992). "An approach to improving management performance. II. Knowledge-the fabric of
understanding " Engineering Management Journal, Vol. 2, No. 3, pp. 123-130.
21
Huang, P. Y., Moore, L. J. and Shin, S. (1991). "World-Class Manufacturing in the 1990s: Integrating TQC, JIT, FA, and TPM With Worker Participation.."
Jayamaha, N. P., Wagner, J. P., Grigg, N. P., Campbell-Allen, N. M., & Harvie, W. (2014). "Testing a theoretical model underlying the ‘Toyota Way’ – An empirical study involving a large global sample of Toyota facilities," International Journal of Production Research Vol.
Jayaram, J., Das, A. and Nicolae, M. (2010). "Looking beyond the obvious: Unraveling the Toyota production system," International Journal of Production Economics, Vol. 128, No. 1, pp. 280-291.
Jeyapaul, R., Shahabudeen, P. and Krishnaiah, K. (2005). "Quality management research by considering multi-response problems in the Taguchi method–a review," The International Journal of Advanced Manufacturing Technology, Vol. 26, No. 11-12, pp. 1331-1337.
Joseph, V. R. (2007). "Taguchi's approach to robust parameter design: A new perspective," IIE Transactions, Vol. 39, No. 8, pp. 805 - 810.
Khuri, A. I. and Mukhopadhyay, S. (2010). "Response surface methodology," Wiley Interdisciplinary Reviews: Computational Statistics, Vol. 2, No. 2, pp. 128-149.
Kim, Y. J. and Cho, B. R. (2000). "Economic considerations on parameter design," Quality and Reliability Engineering International, Vol. 16, No. 6, pp. 501-514.
Kline, R. B. (2011). "Principles and practice of structural equation modeling. ," Guilford press. Lee, S. and Hershberger, S. (1990). "A simple rule for generating equivalent models in covariance structure
modeling," Multivariate Behavioral Research, Vol. 25, No. 3, pp. 313-334. Liker, J. K. (2004). "The Toyota Way – fourteen management principles from the world’s greatest
manufacturer," New York, NY: London, McGraw-Hill Little, T. D., Cunningham, W. A., & Shahar, G. (2002). "To Parcel or Not to Parcel: Exploring the Question,
Weighing the Merits," Structural Equation Modeling, Vol., pp. 151–173. Love, P. E. D., Gunasekaran, A. and Li, H. (1998). Improving the competitiveness of manufacturing companies
by continuous incremental change. The TQM Magazine. Maccallum, R. C. and Browne, M. W. (1993). "The use of causal indicators in covariance structure models:
some practical issues " Psychological bulletin, Vol. 114, No. 3, pp. 533-541. Malik, S. A., Li-Bin, L., Ye-Zhuang, T. and Xiao-Lin, S. (2007). Continuous improvement practices in Asian
developing countries a comparative analysis between Chinese & Pakistani manufacturing Industry. Management Science and Engineering, 2007. ICMSE 2007. International Conference on.
Matsunaga, M. (2008). "Item Parceling in Structural Equation Modeling: A Primer," Communication Methods and Measures, Vol., pp. 260-293.
Mavruz, S. and Ogulata, R. T. (2010). "Taguchi approach for the optimisation of the bursting strength of knitted fabrics," Fibres and Textiles in Eastern Europe, Vol. 18, No. 2, pp. 78-83.
Moeeni, F., Sanchez, S. M. and Ria, A. J. V. (1997). "A robust design methodology for Kanban system design," International Journal of Production Research, Vol. 35, No. 10, pp. 2821-2838.
Monden, Y. (1998). "Toyota Production System: An Integrated Approach to Just-In-Time," Norcross, Georgia, Engineering & Management Press.
Montgomery, D. C. (2013). "Design and analysis of experiments," Hoboken, NJ, John Wiley & Sons. Myers, R. H., Khuri, A. I. and Vining, G. (1992). "Response surface alternatives to the Taguchi robust parameter
design approach," The American Statician, Vol. 46, No. 2, pp. 131-139. Nair, V. N., Abraham, B., Mackay, J., Nelder, J. A., Box, G., Phadke, M. S., Kacker, R. N., Sacks, J., Welch, W.
J., Lorenzen, T. J., Shoemaker, A. C., Tsui, K. L., Lucas, J. M., Taguchi, S., Myers, R. H., G.G., V. and J., W. C. F. (1992). "Taguchi's Parameter Design: A Panel Discussion," Technometrics, Vol. 34, No. 2, pp. 127-161.
Nicholas, J. M. (1998). "Competitive manufacturing management: continuous improvement," Boston Irwin/McGraw-Hill.
Nunnally, J. C. and Bernstein, I. H. (1994). "Psychometric Theory," NY, McGRAW-HILL. Park, C. K. and Ha, J. Y. (2005). "A process for optimizing sewing conditions to minimize seam pucker using
the Taguchi method," Textile research journal, Vol. 75, No. 3, pp. 245-252. Peterson, R. A. and Kim, Y. (2013). "On the relationship between coefficient alpha and composite reliability,"
Journal of Applied Psychology, Vol. 98, No. 1, pp. 194-198. Phadke, M. S., Kackar, R. N., Speeney, D. V. and Grieco, M. J. (1987). Off-line quality control in integrated
circuit fabrication using experimental design. In Microlithography Conference. Podsakoff, P. M. and Organ, D. W. (1986). "Self-reports in organizational research: Problems and prospects,"
Journal of management, Vol. 12, No. 4, pp. 531-544. Pullan, T. T., Bhasi, M. and Madhu, G. (2011). "Decision support tool for lean product and process
development," Production Planning and Control: The Management of Operations, Vol.

22
Rogers, W. M. and Schmitt, N. (2004). "Parameter recovery and model fit using multidimensional composites: A comparison of four empirical parceling algorithms," Multivariate Behavioral Research, Vol. 39, No. 3, pp. 379-412.
Ross, P. J. (1996). "Taguchi techniques for quality engineering: loss function, orthogonal experiments, parameter and tolerance design," New York, NY, McGraw-Hill.
Rowlands, H., Antony, J. and Knowles, G. (2000). "An application of experimental design for process optimisation," The TQM Magazine, Vol. 12, No. 2, pp. 78-84.
Roy, R. K. (2010). "A primer on the Taguchi method " Dearborn, Mich. Safa, H. I. (1981). "Runaway shops and female employment: the search for cheap labor," Chicago Journals, Vol.
7, pp. 418-433. Sahoo, A. K., Singh, N. K., Shankar, R. and Tiwari, M. K. (2008). "Lean philosophy: implementation in a
forging company," The International Journal of Advanced Manufacturing Technology, Vol. 36, No. 5-6, pp. 451-462.
Sauers, D. G. (1999). "Using the Taguchi loss function to reduce common-cause variation," Quality Engineering, Vol. 12, No. 2, pp. 245-252.
Shah, R. and Ward, P. T. (2003). "Lean manufacturing: context, practice bundles, and performance," Journal of Operations Management, Vol. 21, pp. 129-149.
Shah, R. and Ward, P. T. (2007). "Defining and developing measures of lean production," Journal of Operations Management, Vol. 25, No. 4, pp. 785-805.
Shang, J. S., Li, S. and Tadikamalla, P. (2004). "Operational design of a supply chain system using the Taguchi method, response surface methodology, simulation, and optimization," International Journal of Production Research, Vol. 42, No. 18, pp. 3823-3849.
Singh, J. and Singh, H. (2012). "Continuous improvement approach: state-of-art review and future implications," International Journal of Lean Six Sigma, Vol. 3, No. 2, pp. 88-111.
Snee, R. D. (2010). "Lean Six Sigma–getting better all the time. ," International Journal of Lean Six Sigma, Vol. 1, No. 1, pp. 9-29.
Song, A. A., Mathur, A. and Pattipati, K. R. (1995). "Design of process parameters using robust design techniques and multiple criteria optimization " Systems, Man and Cybernetics, IEEE Transactions on, Vol. 25, No. 11, pp. 1437 - 1446
Steiger, J. H. (2001). "Driving fast in reverse," Journal of the American Statistical Association, Vol. 96, No. 453, pp. 331-338.
Stelzl, I. (1986). "Changing a causal hypothesis without changing the fit: Some rules for generating equivalent path models," Multivariate Behavioral Research, Vol. 21, No. 3, pp. 309-331.
Sullivan, L. P. (1987). The Power Of Taguchi Methods To Impact Change In US Companies.. Quality Progress. Taguchi, G., Chowdhury, S. and Taguchi, S. (2000 ). "Robust Engineering," New York, NY, McGraw-Hill. Taguchi, G., Chowdhury, S. and Wu, Y. (2005). "Taguchi's quality engineering handbook," Hoboken, NJ, John
Wiley & Sons. Taguchi, G. and Clausing, D. (1990). "Robust quality," Harvard Business Review, Vol. Truch, E. (2006). "Lean consumption and its influence on brand," Journal of Consumer Behaviour, Vol. 5, No.
2, pp. 157-165. Unal, R. and Dean, E. B. (1991). "Taguchi approach to design optimization for quality and cost: an overview,"
In: International societyof parametric analysts, 1991. Wang, T.-Y. and Huang, C.-Y. (2007). "Improving forecasting performance by employing the Taguchi method,"
European journal of operational research, Vol. 176, No. 2, pp. 1052-1065. Werts, C. E., Linn, R. L. and Jöreskog, K. G. (1974). "Intraclass reliability estimates: testing structural
assumptions," Educational and Psychological measurement, Vol. 34, No. 1, pp. 25-33. Wheeler, D. J. and Chambers, D. S. (2010). " Understanding Statistical Process Control," Knoxville, Tennessee
SPC Press. Womack, J. P. and Jones, D. T. (1996). "Lean Thinking: Banish Waste and Create Wealth in Your Corporation,"
New York, Simon & Schuster. Womack, J. P. and Jones, D. T. (2003). "Lean thinking: banish waste and create wealth in your corporation,"
New York, NY Simon & Schuster. Womack, J. P. and Jones, D. T. (2005a). "Lean consumption," Harvard business review, Vol. 83, No. 3, pp. 58-
68. Womack, J. P. and Jones, D. T. (2005b). "Lean solutions: how companies and customers can create value and
wealth together," Brookline, Mass., Free Press.


![CHAPTER 3 THEORY RELATED TO TAGUCHI’S …shodhganga.inflibnet.ac.in/bitstream/10603/89659/5...[27] CHAPTER 3 THEORY RELATED TO TAGUCHI’S METHOD 3.1 TAGUCHI’S BRIEF BIOGRAPHY](https://static.fdocuments.net/doc/165x107/5b304a3c7f8b9ac06e8e12cc/chapter-3-theory-related-to-taguchis-27-chapter-3-theory-related-to-taguchis.jpg)