Testing Multi-Dimensional Markets for Electricity and Ancillary Services Using PowerWeb Tim Mount...
30
Testing Multi-Dimensional Markets for Electricity and Ancillary Services Using PowerWeb Tim Mount Department of Applied Economics and Management Cornell University Ithaca, NY 14853-7801 607-255-4512 [email protected] CERTS - DOE TR Peer Review, Jan 27-29 in Washington DC
-
Upload
margaret-jennings -
Category
Documents
-
view
215 -
download
0
Transcript of Testing Multi-Dimensional Markets for Electricity and Ancillary Services Using PowerWeb Tim Mount...

Testing Multi-Dimensional Markets for Electricity and Ancillary Services Using
PowerWeb
Tim MountDepartment of Applied Economics and Management
Cornell University
Ithaca, NY 14853-7801
607-255-4512
CERTS - DOE TR Peer Review, Jan 27-29 in Washington DC

Page 2
2
PSERC Research at Cornell University
FACULTY PARTICIPANTS
Engineers Economists Bob Thomas (Director) Duane Chapman Jim Thorp Tim Mount Ray Zimmerman Dick Schuler Bill SchulzeCollaborators Shmuel Oren (UC, Berkeley) Bernie Lesieutre (LBNL) Chris Marnay (LBNL)

Page 3
3
Why Use PowerWeb to Test Markets?
• Market structures for electricity auctions are too complicated to derive analytical results.
• PowerWeb tests are inexpensive compared to experimenting directly on the public.
• Paying participants in market tests on the basis of their performance duplicates market behavior effectively.
• The effects of specific market characteristics can be isolated and tested.
• PowerWeb supports a full AC network, so that the market implications of congestion and ancillary services -- as well as real power -- can be studied.
• Our motto: TEST NOW or PAY LATER
Page 4
4
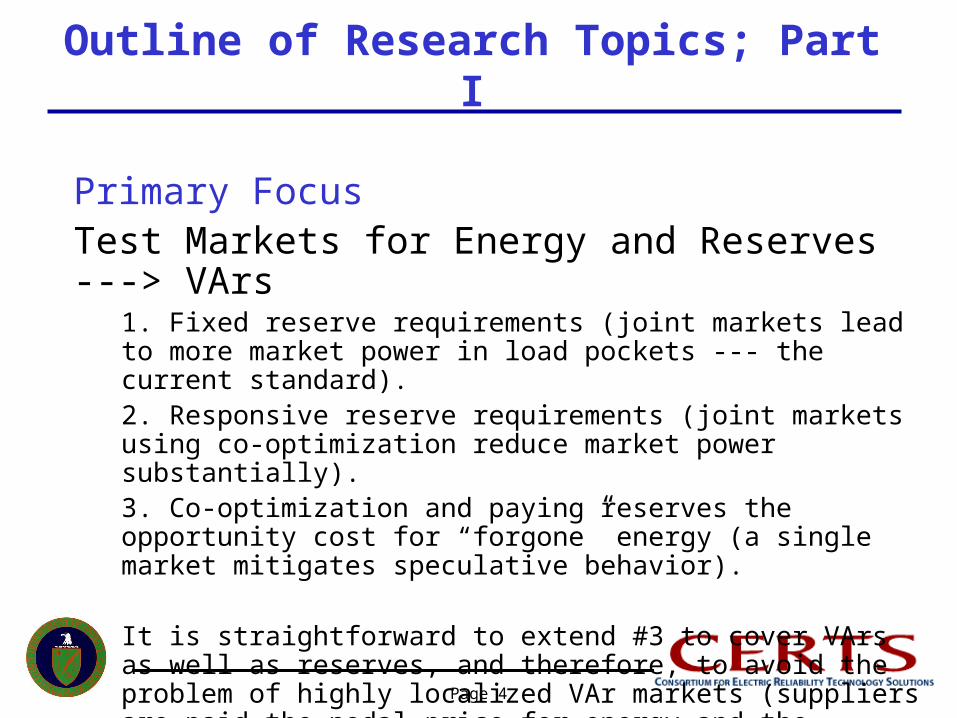
Outline of Research Topics; Part I
Primary FocusTest Markets for Energy and Reserves ---> VArs
1. Fixed reserve requirements (joint markets lead to more market power in load pockets --- the current standard).2. Responsive reserve requirements (joint markets using co-optimization reduce market power substantially).3. Co-optimization and paying reserves the opportunity cost for “forgone” energy (a single market mitigates speculative behavior).
It is straightforward to extend #3 to cover VArs as well as reserves, and therefore, to avoid the problem of highly localized VAr markets (suppliers are paid the nodal price for energy and the opportunity cost for all ancillary services).

Page 5
5
Outline of Research Topics; Part II
Emerging TopicsGlobal Optimization across Power Pools (Seams)
Efficient procedures for solving a distributed Optimal Power Flow.Minimal information needed to solve the seams problem.
Can extend co-optimization to share ancillary services across pools.
Forward Markets ---> The Time Dimension
Day-Ahead and Real-Time markets (two-settlement markets).The effects of forward contracts on behavior in the spot market.Markets for Transmission Congestion Credits (TCC).Investment decisions for new generating and transmission capacity.
Testing Markets with Computer Agents Replicate and supplement PowerWeb tests using people.Explain salient features of deregulated markets for electricity.

Page 6
6
Part I Markets for Energy and Ancillary Services
• The primary goal was to test different markets using a full AC version of PowerWeb.
• The underlying principle for all markets tested was to ensure that suppliers were paid for all services provided.
• Theoretical issues about how to pay opportunity costs for ancillary services were evaluated.
• Computational procedures for determining the optimal dispatch and nodal prices with co-optimization were improved substantially.
• Co-optimization was extended to cover VArs as well as reserves and energy.
Page 7
7
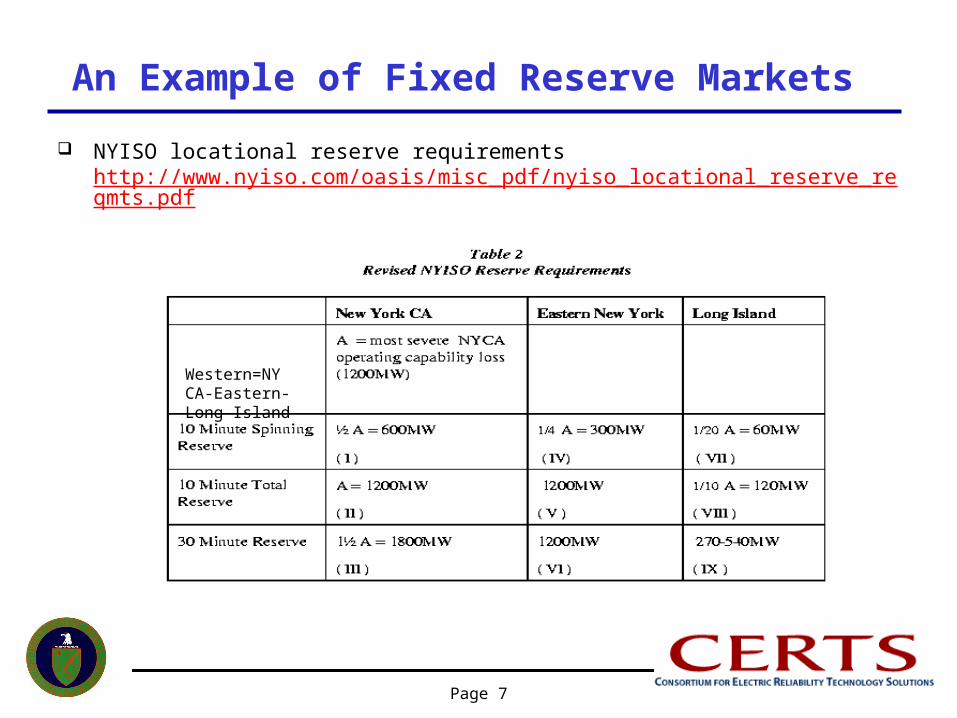
An Example of Fixed Reserve Markets
NYISO locational reserve requirements http://www.nyiso.com/oasis/misc_pdf/nyiso_locational_reserve_reqmts.pdf
Western=NY CA-Eastern-Long Island
Page 8
8
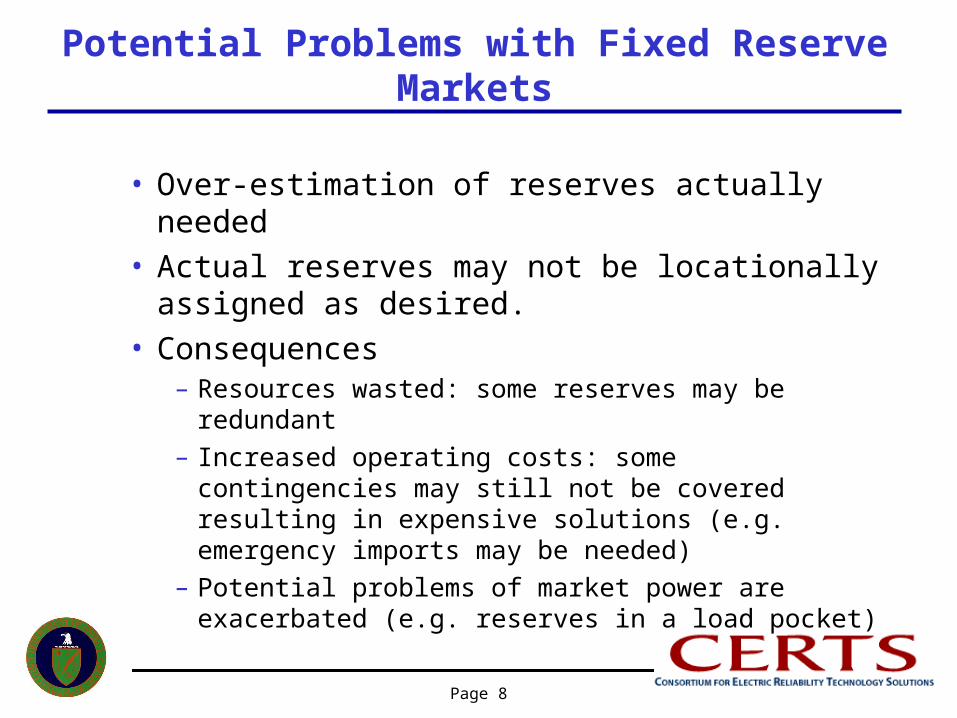
Potential Problems with Fixed Reserve Markets
• Over-estimation of reserves actually needed• Actual reserves may not be locationally assigned
as desired. • Consequences
– Resources wasted: some reserves may be redundant– Increased operating costs: some contingencies may still
not be covered resulting in expensive solutions (e.g. emergency imports may be needed)
– Potential problems of market power are exacerbated (e.g. reserves in a load pocket)

Page 9
9
A Better Market Alternative? A Responsive Reserve (RR) Market
• No predetermined reserve requirements• Reserves are required to cover an explicit list of
credible contingencies ( unit failure, line-out, sudden load growth, etc. )
• The expected cost of meeting the load in all specified contingencies and the base case is minimized (co-optimization)
• The optimum pattern of energy and reserves varies with different system demands and the offers for energy and reserves in the auction (reserves respond to market conditions)

Page 10
10
The Basic Scheduling Algorithm for Co-optimization
• Objective– Minimize the total expected cost (operating energy cost plus
the spinning reserve cost) for N generators over the predefined base case and K credible contingencies
• Subject to network and system constraints – Generation capacity limits– Voltage limits– Line flow limits– Ramping limits
1pK
0kk

Page 11
11
Properties of the Co-optimization Solution
• The co-optimization has K+1 Optimal Power Flows (OPF) coupled by the reserve costs and the dependence of reserves on generation.
• The solution is generally different than K+1 separate OPF’s which do not consider the cost of reserves.
• The important features of the solution are the optimum “Generator response intervals” for the N generators.
• The optimum limits are within but NOT the same as the physical generator limits and they are determined by the co-optimization. K+1 separate OPF’s give large generator response intervals, and co-optimization reduces the size of these intervals substantially.
maxikimini GGG

Page 12
12
Generator Response Intervalsfor Two Generators
G1
G2
100 115 140
300
210
245
Separate OPF’sCo-Optimization

Page 13
13
Augmented Optimal Power Flow (AOPF)
• Cost-minimizing optimization for any one of the specified K+1 cases (base case or a contingency)
• All system constraints from the co-optimization still apply (Generation capacity limits, Voltage limits, Line flow limits, Ramping limits)
• New (non-physical) generator constraints are added
• Reserves are defined as
maxikimini GGG
Rik Gimax Gik

Page 14
14
Properties of the AOPF
• If Gik is the solution of the co-optimization, it is also the solution of the kth AOPF – Proof: like the principle of optimality
• Consequence: – If a new contingency can be met with the reserves from the
co-optimization then the corresponding AOPF gives the optimal solution.
– Deals with forecast errors and unanticipated contingencies. – Co-optimization done off-line, AOPF done in real time.– Only need to repeat the co-optimization when a new
contingency can not be covered.– BUT nodal prices for a specific contingency must consider
the full co-optimization. (This can be done with a relatively fast algorithm using a “sensitivity” matrix).

Page 15
15
Computing Nodal Prices
• Previously, prices were obtained by perturbation, but the procedure was complicated and very time-consuming
• Now, prices can be obtained by direct computation – Much faster computations
where s are from the Augmented OPF
and obtained using a sensitivity matrix
from the co-optimization
load
GpriceEnergy and
GandGenergymaxmin
maxmin
load
G or
maxmin

Page 16
16
Paying the Opportunity Cost for Reserves
• C is the nodal price for real energy in a given contingency (or the base case, i.e. it is specific to the observed case).
• Gmin < G < Gmax is the actual dispatch.• The payment for real energy is C x G. • Offer is the price for real energy submitted into the
auction by the generator• The payment for reserves is (C - Offer)(Gmax - G).• Two methods of determining C were tested:
– 1) East coast method --- use G in the sensitivity matrix– 2) West coast method --- use the highest energy offer
needed to meet Gmax (makes C bigger)

Page 17
17
Resolving a Potential Problem
• Some expensive generators (i.e. with high offers for energy) may be needed to meet specific contingencies, but in most situations, they are dispatched at their PHYSICAL minimum (= Gmin).
• Generators dispatched at the physical minimum do not set the market price (i.e. they are out of merit order, and C = Max[Offer, Nodal Price]).
• If G = Gmin and C = Offer, the opportunity cost for (Gmax - Gmin) reserves is ZERO, and the generator is only paid Gmin x Offer for energy.
• The GOOD news: This is an effective way to discourage speculative behavior by generators.
• The BAD news: Legitimate standby (startup) costs may not be covered. – 1) East coast method --- use G to determine prices and add a “make-whole”
payment for standby costs (Pay (G x Offer + Max[Standby Cost, Gmax(C - Offer)] = (Gmin x Offer + Standby Cost) when G = Gmin and C = Offer)
– 2) West coast method --- use Gmax to determine prices (makes C bigger)

Page 18
18
Extending Opportunity Cost Payments to Cover Reactive Power (VArs) and Reserves
• Generator Capability Curve:– P is real energy– Q is reactive power
• Do two dispatches:– One with only a P limit – - get x– One with the capability curve – - get y– Pay nodal price for P2 energy– and the opportunity cost for – (P1 - P2) VArs and – (Pmax - P1) reserves
P
Q Pmaxx
y
P1P2

Page 19
19
The PowerWeb Network (Area B is a load pocket)
Reserve req=40MW
Total Reserve req =60 MW
17
18
Area AArea B

Page 20
20
The Problem Description
Each one of the six firms has two units:
Area A Large Unit Small Unit------------ ----------- ------------Max Output 40 MW 20 MWMin Output 8 MW 0 MWVariable Cost $20/MWh $50/MWhReserve Cap 5 MW 10 MWStandby Cost $5/MW $5/MWFixed Cost $250/period $50/period
Area B Large Unit Small Unit------------ ----------- ------------Max Output 40 MW 20 MWMin Output 8 MW 4 MWVariable Cost $45/MWh $55/MWhReserve Cap 20 MW 16 MWStandby Cost $5/MW $5/MWFixed Cost $0/period $0/period
All firms in Area A submit marginal cost offers.Two students represent the firms in Area B. There are imports available at $150/MWhr.When imports are needed (due to capacity
withholding in Area B), the AOPF is computed by first solving the problem normally with imported energy at $150/MWh and imported reserves at $75/MWh to find the optimum quantities of imports. Then the import generators are modified to set Gmin = the optimum import of energy, and the AOPF is solved again. Since the new Gmin limits on the import generators will be binding, imports will not set the market price of energy and the market price will reflect the behavior of firms in the load pocket. Without this modification, there is a strong incentive for firms to withhold capacity in Area B and let imports set the price.Students were able to identify and exploit this flaw in the initial design of the market: a very good example of how testing can improve the design of a market.

Page 21
21
PowerWeb Screen for Submitting Offers (Firm 6: East Coast Method with Standby Offers)
Page 22
22
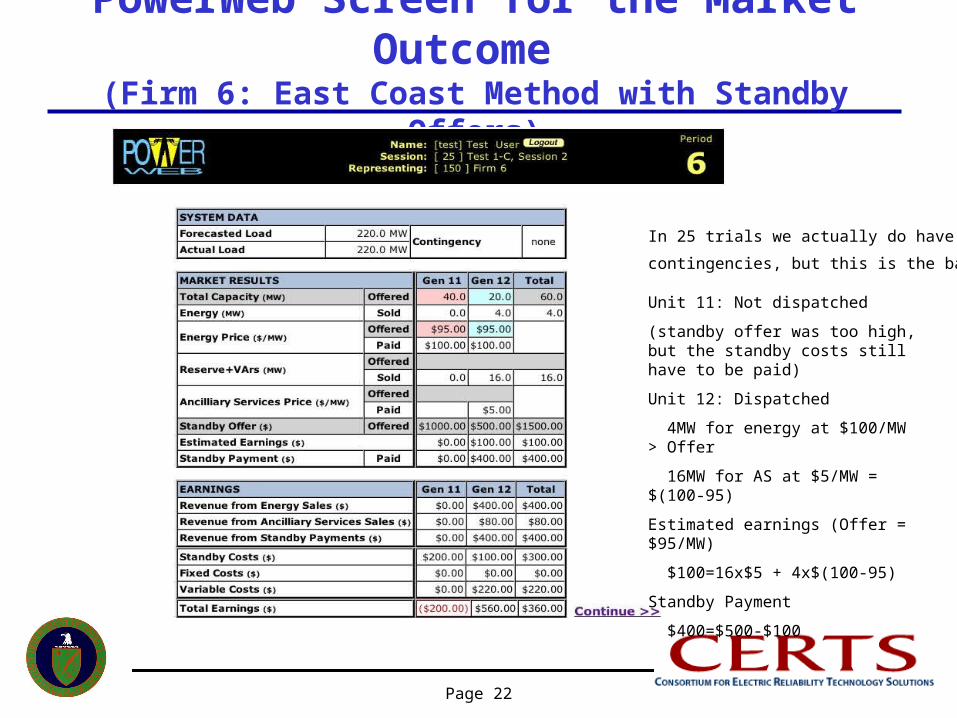
PowerWeb Screen for the Market Outcome (Firm 6: East Coast Method with Standby Offers)
Unit 11: Not dispatched
(standby offer was too high, but the standby costs still have to be paid)
Unit 12: Dispatched
4MW for energy at $100/MW > Offer
16MW for AS at $5/MW = $(100-95)
Estimated earnings (Offer = $95/MW)
$100=16x$5 + 4x$(100-95)
Standby Payment
$400=$500-$100
In 25 trials we actually do have some
contingencies, but this is the base case.

Page 23
23
Average Prices of Energy (includes all costs) (for 9 Market Tests with 25 Periods each)
Average Prices Paid and Received
$0.00
$10.00
$20.00
$30.00
$40.00
$50.00
$60.00
$70.00
$80.00
$90.00
Test2D (West Coast) Test2E (East Coast)
$/M
Wh
A: Generators in Region A ($/MWh generated)B: Generators in Region B ($/MWh generated)ISO: Independent System Operator ($/MWh purchased)

Page 24
24
Allocation of ISO Price to Energy and Ancillary Services By Source(Test 2-D: Pay Opportunity Cost Using WEST Coast Method)
Allocation of ISO Price to Energy and Ancillary Services By Source(Test 2-D: Pay Opportunity Cost Using WEST Coast Method)
30.00 40.00 50.00 60.00 70.00 80.00 90.00
103
104
105
106
107
108
109
110
111
Comp
AVG
sess
ion
s
$/MWh
EN-A: Revenue of Energy in Region A/Total System Load EN-B: Revenue of Energy in Region B/Total System LoadEN-I: Revenue of Imported Energy/Total System Load AS-A: Revenue of Ancillary Services in Region A/Total System LoadAS-B: Revenue of Ancillary Services in Region B/Total System Load AS-I: Revenue of Imported Ancillary Services/Total System Load
Page 25
25
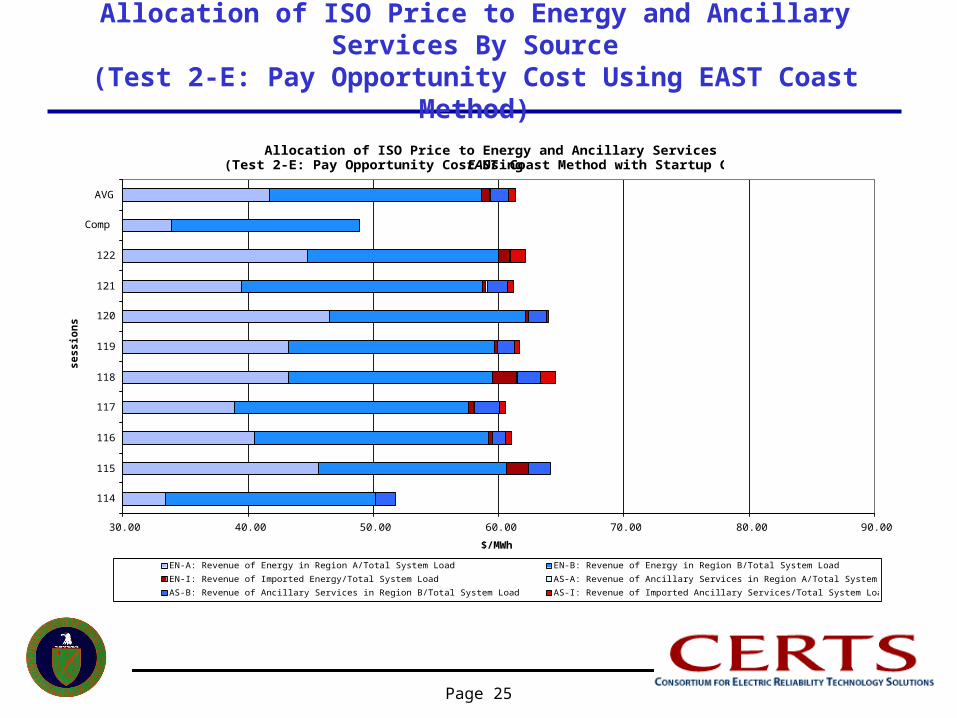
Allocation of ISO Price to Energy and Ancillary Services By Source(Test 2-E: Pay Opportunity Cost Using EAST Coast Method with Startup Costs)
30.00 40.00 50.00 60.00 70.00 80.00 90.00
114
115
116
117
118
119
120
121
122
Comp
AVG
se
ss
ion
s
$/MWh
EN-A: Revenue of Energy in Region A/Total System Load EN-B: Revenue of Energy in Region B/Total System Load
EN-I: Revenue of Imported Energy/Total System Load AS-A: Revenue of Ancillary Services in Region A/Total System Load
AS-B: Revenue of Ancillary Services in Region B/Total System Load AS-I: Revenue of Imported Ancillary Services/Total System Load
Allocation of ISO Price to Energy and Ancillary Services By Source(Test 2-E: Pay Opportunity Cost Using EAST Coast Method)

Page 26
26
Part I: Conclusions
• Joint markets for energy and FIXED Reserves are relatively easy to exploit (i.e. get high market prices) because the demand for reserves in a load pocket is perfectly inelastic and not all generators can supply these reserves.
• Using co-optimization, joint markets for energy and RESPONSIVE Reserves exhibit less market power and lower market prices.
• Instead of using joint markets for energy and reserves, a single energy market (using co-optimization) with payments for reserves based on the OPPORTUNITY COST mitigates speculative behavior even more.
• The payment of opportunity costs can be extended to cover VArs as well as reserves. This provides compensation for all ancillary services without falling into the potential trap of excessive market power in highly localized VAr markets (VArs do not travel).
• It may be necessary to allow generators to submit both energy and standby (startup) offers.
• The results are timely for current discussions of how to pay for reserves and VArs in the Northeastern ISOs.

Page 27
27
Part IIA: Global Optimization across Power Pools (The Seams Problem)
• THE PROBLEM: The current limited coordination of real-time operations across power pools is inefficient (expensive) and undermines system reliability.
• Use parallel processing to solve an OPF faster– The issue is to divide the problem into a number of smaller OPFs each run
on a different processor.• One algorithm was faster by a factor of 5 for a 1777 bus system (ERCOT) using
8 processors (Kim and Baldick, “A Comparison of Distributed OPF Algorithms, IEEE Trans. On Power Systems, May 2000).
• Solve the OPF for each power pool on one or more processors --- a straightforward application of the distributed OPF algorithm.
• The distributed OPF’s for the base case and all contingencies can be linked in a single co-optimization to give the global optimum dispatch for energy and ancillary services and consistent nodal prices in all power pools (paying opportunity costs for ancillary services).
• A paper was presented at HICSS (1/04).• Currently, we are working with the New York ISO on this problem.

Page 28
28
Part IIB: Forward Markets ---> The Time Dimension and Investment Decisions
• THE PROBLEM: Real energy is a private good BUT system reliability is a public good. As a result, there is no guarantee that markets will lead to adequate or efficient investment in generation and transmission capacity.
• Build on the substantial literature about equilibrium (efficient hedging) in two-settlement markets, markets for financial transmission rights (FTR), and forward markets for real energy to understand investment decisions.
• Determine how many different locations should be traded in a forward market to hedge all nodal prices effectively (the fewer, the better for liquidity). In New York, for example, over 200 distinct FTRs are traded but only 4 are needed to hedge effectively (consistent with existing NYMEx contracts).
• Demonstrate how weather derivatives can be used to hedge forward contracts for critical peak pricing (these contracts provide the “correct” price signals to support PRL but are financially risky unless they are hedged).
• Evaluate alternative ways to encourage investment in new generating capacity (after identifying a future shortfall because current spot prices are “too low”). 1) Direct contracting (how big is the price premium needed in a forward contract?) 2) Cover capital costs by increased payments in capacity auctions (an expensive US approach) 3) High price caps in the spot market (a risky Australian approach)
• Papers will be presented at PES (6/04), Rutgers West (6/04) and a power conference in Brisbane, Australia (2/04).
• We plan to work with the ISO New England on the effects of virtual positions in day-ahead markets and the New York ISO on proposed modifications to capacity auctions.

Page 29
29
Part IIC: Testing Markets with Computer Agents
• The primary goal is to increase the use of PowerWeb for testing markets by: i) having individuals compete with agents ii) running supplementary tests with all agents iii) creating new training sessions for individuals
• Can explain why “hockey- stick” offer curves are rational, and typically inevitable, in deregulated markets for electricity.
• Can explain how the structure (sizes and objectives) of firms determines the type of price behavior observed in a market like PJM.
• Can explain when and how effectively holding a forward contract will mitigate speculative behavior (and replicate PowerWeb tests).
• Can show why price-responsive load (PRL) is a more effective way to mitigate high prices compared to other popular policies.
• A paper was presented at HICSS (1/04).• We plan to work with Neenan Associates, LBL and the New York ISO/PSC to develop
a training platform to help industrial customers test the effectiveness of different PRL programs.

Page 30
30
Summary of Results
• Real Time Operations• Co-optimization + Paying opportunity costs
– makes reserves responsive to actual conditions– has a simple market structure– can be extended to include VArs– can be extended across power pools
• Next step: test with actual system data
• Forward Contracts and Investment Decisions• Can evaluate different types of forward contracts
– incentives for load response when load is high– incentives for building new generating capacity
• New issues– the spatial design of forward markets– incentive payments for transmission services– how to ensure that generation and transmission capacities are adequate to maintain reliability