Terrestrial locomotion in the Svalbard ptarmigan … · Terrestrial locomotion in the Svalbard...
43
Terrestrial locomotion in the Svalbard ptarmigan (Lagopus muta hyperborea) How does treadmill running compare with running overground? Photo: Bob van Oort Anne Marit Vik BIO-3910 Master`s thesis in Biology May 2013
Transcript of Terrestrial locomotion in the Svalbard ptarmigan … · Terrestrial locomotion in the Svalbard...

Terrestrial locomotion in the Svalbard ptarmigan (Lagopus muta hyperborea)
How does treadmill running compare with running overground?
Photo: Bob van Oort
Anne Marit Vik
BIO-3910 Master`s thesis in Biology
May 2013


Table of Contents
Abstract…………………………………………………………………………………………….- 1 -
I:Introduction……………………………………………………………………………..….- 2 - Study species: the Svalbard ptarmigan………………………………………………- 2 - Locomotory biomechanics…………………………………………………………………- 5 - Problems and hypotheses………………………………………………………………….- 8 -
II: Materials and Methods…………………………………………………………- 10 -
Biomechanics of locomotion……………………………………………………………- 10 - Animals……………………………………………………………………………………………..- 10 - Running……………………………………………………………………………………………..- 10 - Tracker analysis…………………………………………………………………………………..- 11 - Blood chemistry analysis………………………………………………………………… - 12 - Animals……………………………………………………………………………………………..- 12 - Blood sampling and blood gas analysis…………………………………………………….- 13 - Lactate analysis……………………………………………………………………………………- 13 - Data analysis……………………………………………………………………………………- 14 -
III: Results……………………………………………………………………………………..- 15 -
Biomechanics…………………………………………………………………………………..- 15 - Blood gases and lactate……………………………………………………………………- 20 -
IV: Discussion……………………………………………………………………………….- 23 -
Biomechanics…………………………………………………………………………………..- 23 - Blood gases and lactate……………………………………………………………………- 30 -
V: Conclusion………………………………………………………………………………..- 32-
Adknowledgements…………………………………………………………………………- 33 - References……………………………………………………………………………………….- 34 -


1
Abstract
The Svalbard rock ptarmigan (Lagopus muta hyperborea) is a resident bird on the
Svalbard achipelago, living in an environment where it experiences extreme climatic
and photoperiodic conditions. The bird’s most striking adaption to this environment
is, prior to the onset of winter, its deposition of fat, comprising up to 30% of body
mass. Moving around with this excess mass may prove difficult as it is likely to infer
an extra energetic cost, especially at a time of food deprivation and low
temperatures, where saving of energy is at prime concern. In order to study the
impact of locomotion on the birds’ energy budget, treadmill studies have previously
been carried out looking into both the bird’s energetics and biomechanical
parameters. To validate these treadmill studies, I have conducted overground
running studies to compare the running patterns of the two experimental
environments. Do the birds display the same biomechanical patterns on the
treadmill and in the natural environment? Additionally, blood gas and lactate
analysis have been carried out while birds ran on the treadmill in order to assess
their aerobic capacity, to validate the use of indirect calorimetry in the previous
energetic studies.
2
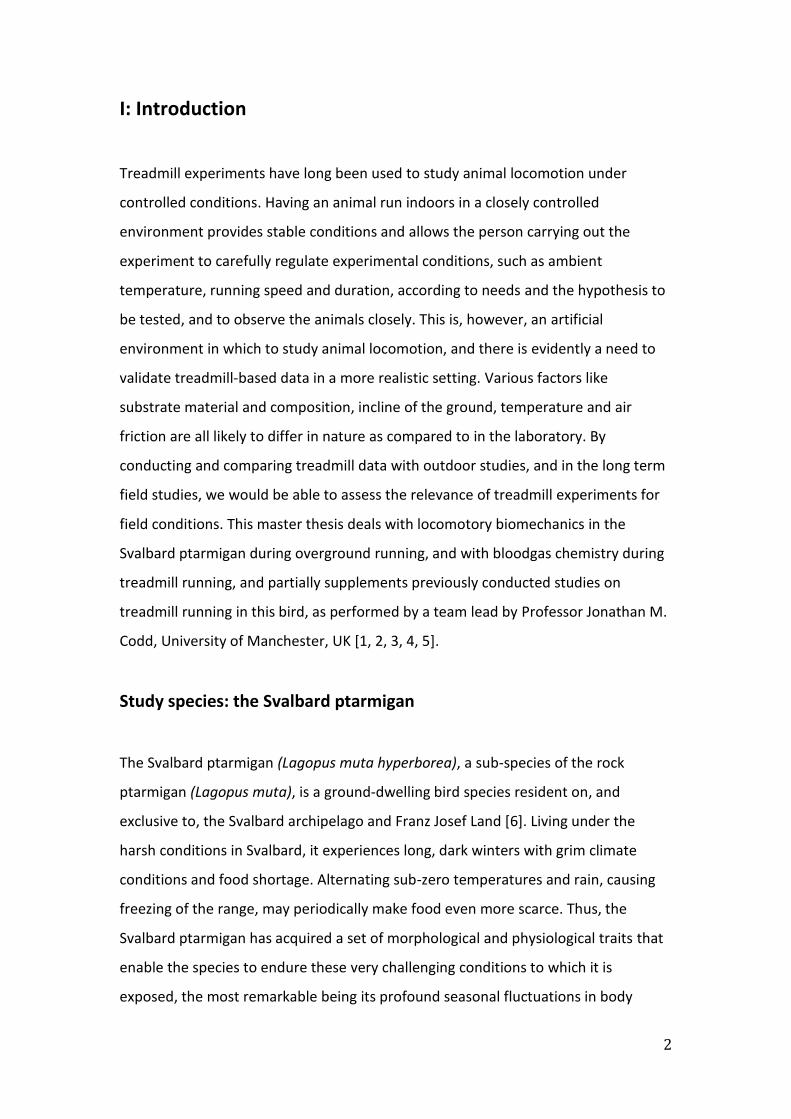
I: Introduction
Treadmill experiments have long been used to study animal locomotion under
controlled conditions. Having an animal run indoors in a closely controlled
environment provides stable conditions and allows the person carrying out the
experiment to carefully regulate experimental conditions, such as ambient
temperature, running speed and duration, according to needs and the hypothesis to
be tested, and to observe the animals closely. This is, however, an artificial
environment in which to study animal locomotion, and there is evidently a need to
validate treadmill-based data in a more realistic setting. Various factors like
substrate material and composition, incline of the ground, temperature and air
friction are all likely to differ in nature as compared to in the laboratory. By
conducting and comparing treadmill data with outdoor studies, and in the long term
field studies, we would be able to assess the relevance of treadmill experiments for
field conditions. This master thesis deals with locomotory biomechanics in the
Svalbard ptarmigan during overground running, and with bloodgas chemistry during
treadmill running, and partially supplements previously conducted studies on
treadmill running in this bird, as performed by a team lead by Professor Jonathan M.
Codd, University of Manchester, UK [1, 2, 3, 4, 5].
Study species: the Svalbard ptarmigan
The Svalbard ptarmigan (Lagopus muta hyperborea), a sub-species of the rock
ptarmigan (Lagopus muta), is a ground-dwelling bird species resident on, and
exclusive to, the Svalbard archipelago and Franz Josef Land [6]. Living under the
harsh conditions in Svalbard, it experiences long, dark winters with grim climate
conditions and food shortage. Alternating sub-zero temperatures and rain, causing
freezing of the range, may periodically make food even more scarce. Thus, the
Svalbard ptarmigan has acquired a set of morphological and physiological traits that
enable the species to endure these very challenging conditions to which it is
exposed, the most remarkable being its profound seasonal fluctuations in body

3
mass. The birds are between 35-40 cm long, and weigh between 500-550g in
summer, and 900-1200g in winter [7]. Birds also undergo changes in plumage (fig. 1),
with summer birds displaying a golden brown molt much like that of the willow
ptarmigan (Lagopus lagopus) (females) or white molt, and winter birds (both female
and male) having a white plumage with black outer tail feathers.
Figure 1: Svalbard ptarmigan. Hen in summer plumage (left) and cock in winter plumage (right).
(Photos: Eirik Reierth (left) and Bob van Oort (right).
Males additionally display red coloured supraorbital combs above the eyes during
the breeding season [8]. Both seasons plumages provide the birds with excellent
camouflage, with the white snow during winter and rocky terrain during summer.
Molting is casually related to changes in daylength [9, 10]. Mating takes place in late
May, and egglaying takes place in early to mid-June. These eggs are usually hatched
in late June to early July. All this takes place in a period when ambient temperature
is favourable, and plants are most nutritious, ensuring increased survival for the
chicks [8]. From late August to mid November, body mass increases by up to 50-
100% [9, 7], with fat comprising up to 30% of total body mass [7]. The fat reserves
are used during the long winter, and are almost all gone by late February, by which
time birds are very lean and continue to be so throughout the spring and summer
months. Interestingly, body mass increase coincides with a decrease in feed intake
during the autumn. Feeding resumes in April, to peak in June [9]. Metabolic rate is
reduced during the winter months [11]. Since the birds still keep feeding to some
extent during winter, the fat reserves are thus more of a safety margin during
periods of acute food shortage than a pure reservoir [12]. The mass and feeding

4
changes coincide with conspicious day length changes on Svalbard (fig.2), and
appears to be brought about by a photoperiodically controlled endocrine pathway,
via melatonin and metabolic hormones like GH or thyroid hormone [13, 14, 15].
Figure 2: Seasonal changes in body mass (BM) (closed circles) and food intake expressed as gram · Kg total BM
-0.75· day
-1 (open circles) and as gram · Kg fat free BM
-1· day
-1 (open squares) (bottom) in
captive Svalbard rock ptarmigan exposed to natural temperature and light (top) conditions for 13 mo at Svalbard (79°N). During this period, birds were given standardized high-quality feed and snow or water ad libitum. Period when sun is above horizon is shown in white, night in black, and civil twilight by hatched area. Number of birds is indicated on abscissa, and vertical bars indicate SE (Stokkan et al., 1986).
Having all this excess body mass in autumn/winter may theoretically impose extra
energetic costs for the birds when it comes to moving around. Even though the birds
are fairly inactive during winter [9, 16], lying still in snow burrows which also
protects them from wind and predators and give extra insulation against the cold,
they must occasionally move around to search for what little food is available, often
in places where patches of grass have been exposed by the digging activities of the
Svalbard reindeer (Rangifer tarandus platyrhynchus) [6]. This poses yet another
problem when it comes to the birds’ energy requirement, which is crucial to
maintain at a minimum during this time of food scarcity, so there is a dilemma
between finding fuel and not using too much energy. Excess mass would seem to
imply that it is energetically more costly for the animal to move around, especially in

5
the snowy terrain, and also put excess strain on the respiratory system, considering
respiration is mostly brought about through sternal movements [17]. Since the fat is
predominantly deposited around the sternum and trunk walls, structures that play a
vital part in respiration, a heavier load has to be lifted during respiration inferring an
increased energetic cost in the form of heavier muscle work [18], and loading
experiments in other species have already shown that excess weight on the sternum
may have substantial impact on energy use during respiration [17]. The use of more
energy could be fatal if the search for food is inadequate or if it fails altogether. Still,
these birds survive the winter and manage to overcome these problems, posing a
question related to whether they may display different locomotory mechanics at
different times of the year, depending on body mass.
Recent treadmill experiments suggest that this is indeed the case, as the birds,
somewhat paradoxically, have been shown to use less energy when moving during
winter than during summer, despite them being up to 47% heavier [1].
Locomotory biomechanics
For all animals, locomotion is a normal activity of daily life, and essential to the
survival of the species. Being able to move allow animals to hunt, graze, migrate and
escape from potential predators. Like previously stated, locomotion is an
energetically costly process that needs to be balanced by energy intake in order for
the body to be in energy homeostasis, and this is particularly challenging in species
experiencing extreme climates. The mechanics of locomotion are therefore closely
related to the energetic costs of an organism, and it is thought that animals are gait-
selective for various speeds in order to minimize energy expenditure during
locomotion [19]. Most of the existing studies on terrestrial locomotion and on the
cost of transport (COT), have been done on humans (walk and run), horses (walk,
trot, gallop) and kangaroos (hopping) (fig. 3), but in later years more focus has been
directed towards birds. COT is mainly determined by the force that must be
generated during stance phase to support and accelerate the animals centre of mass
(COM), coupled with the time available for generation of this force [20]. Variations of

6
this parameter with speed U are steeped in the optimality approach, and this may
give indication to evolutionary significant speeds (fig. 3). Being a bipedal species,
birds typically walk at lower speeds, and adopt an aerial running phase, in which
both feet are off the ground at once, at top running speeds. In addition, there is an
intermediate gait known as grounded running, or ”groucho running”, used at
intermediate speeds [21, 22, 23]. The birds are then running, but without an aerial
phase.
Figure 3: Generalized relationships between the COT (J kg-1
m-1
) and forward speed (U) across
different gaits for: (a) horse; (b) human, donkey and camel; (c) ostrich and kangaroo; and (d) barnacle
goose (dotted line), and platypus and small mammals (solid line). In (c) grounded and aerial running
refers to the ostrich, and hopping refers to the kangaroo. In (d) the type of running (grounded or
aerial) is not known. (Nudds et al., 2011).
The body can be viewed in light of models of physics. When an animal moves at its
lowest speeds, essentially walking, the body behaves like an inverted pendulum,
where the gravitational kinetic and potential energies of the body’s COM relative to
the limbs fluctuate close to 180° out of phase, causing a transfer of energy between
kinetic energy, Ek and potential energy, Ep, resulting in saving of metabolic energy

7
[19]. At higher speeds, the phase relationships goes awry, more active muscle power
is invested, and Ek and Ep are no longer exchanged to the same extent (fig. 4).
Instead, during running, energy is saved from the transfer between the COMs Ek and
the elastic energy stored in elastic muscles and tendons [24], thus leading to the
body acting like a spring.
Figure 4: Examples of typical COM energy fluctuations for (a) walking at 0.50 m s-1
and (b) grounded
running at 1.11 m s-1
. The solid lines and right y-axis represent potential plus vertical kinetic energy,
and the dashed lines and left y-axis the horizontal kinetic energy of the COM. (Nudds et al., 2011).
Along with this mechanical explanation between the walk-run transition, another
unit-less variable known as duty factor (DF), the proportion of time of a stride cycle
when one foot is on the ground, is used. A DF > 0.5 corresponds to walking, while a
DF < 0.5 is related to aerial running [25]. Still, many argue that a shift in DF is not
clear enough to describe the walk-run transition, especially in the transition between
grounded and aerial running seen in birds [26]. In some species, this decrease in duty
factor towards aerial running occurs gradually [22], while in others the transition is
more abrupt [27].

8
Other kinetic parameters commonly investigated during locomotion studies are
stride frequency (SF), stride length (SL), swing phase (tswing) and stance phase (tstance).
Stride frequency is the number of strides taken in unit time. In order for an animal to
increase its speed, it must either increase its stride length, its stride frequency or
both [25]. Stride length is the distance travelled in a stride, seen defined as a
complete cycle of movements, i. e. from one foot leaves the ground until it again
touches and leaves the ground [25]. Swing phase, the time that one foot is off the
ground, is more or less even throughout all speeds, while stance phase, which is the
time one foot is in contact with the ground, decreases with increasing speed. All
these variables are normally quantified in studies of the biomechanics of locomotion,
including in the treadmill studies of Svalbard ptarmigan [1, 2]. Indeed, the birds
display a lowered cost of locomotion when adopting an aerial running mode during
summer when they are able to reach their top running speeds [2]. Furthermore,
male birds have been shown to run with an increased locomotor performance and a
lower cost of locomotion at high speeds than females [3]. This may be due to
differences in morphology, specifically the shorter leg length in females compared to
males, and sexual selection for improved male performance, but the exact
mechanisms still remain unclear [3].
Problems and hypotheses
The process of making the birds run in the lab, however, may not coincide with
reality. On Svalbard, the birds navigate through uneven, sometimes rocky terrain
during summer, and often on snow in winter. The purpose of the present study was
to investigate the biomechanics of locomotion in ptarmigans during overground
running on a natural substrate, without the influence of the mechanically driven
treadmill, in order to give some insights to the extent to which artificial laboratory
conditions represent a reliable model for ptarmigan locomotion in the field.
In addition to investigate kinematics, studies have also been conducted of the
energetics of the Svalbard ptarmigan’s locomotion, both during the birds’ lean
summer months, and fat winter months [1, 2]. In these studies, indirect calorimetry

9
recordings of O2-uptake were used to assess metabolic rate during running, and for
this method to be useful it is a requirement that the birds work aerobically. To
validate this, I also investigated the blood gas chemistry of summer- and winter-
adapted birds running on a treadmill, and measured blood plasma lactate levels for
the same speeds at which the birds were running in the study by Lees et. al., using
the very same individuals. The main goals of this study were:
1. To compare laboratory and semi-field studies of biomechanical parameters
of birds running on a treadmill and birds running outside on a natural
substrate, to investigate to what extent running in a more natural
environment coincide with the artificial conditions of treadmill-running.
2. Validate the use of indirect calorimetry as a method of measuring energy
expenditure in running birds by investigating their blood gas chemistry and
blood plasma lactate levels at different speeds, to conclude to what extent
the birds work aerobically.

10
II: Materials and Methods
Biomechanics of locomotion
Animals
10 individuals – 6 females and 4 males, all juveniles that were hatched and raised in
captivity at the animal research facilities of the Department of Arctic and Marine
Biology, University of Tromsø (69°, 46’N) (mean body mass s.e. = 0.465 0.015 kg
(females), = 0.556 0.024 kg (males))– were used for the outside running trials. The
trials were carried out in August and December of 2010, and the birds were yearlings
hatched during the summer of 2010. Between experiments, all birds were housed in
double outdoor cages (2x90x90cm) at the animal research facility, where they were
exposed to natural climate conditions and light cycles at Tromsø, with ad libitum
access to high quality feed (Prydfugl Rype Komplett, TKM αNO00000324 C) and
water or snow.
All use of animals had been approved by the Norwegian National Animal Research
Authority (approval no. 2636).
Running
Birds were run several times back and forth in a running tunnel on a grass field
outside the animal facility, in order to study running biomechanics on a natural
substrate. The tunnel measured 6.0 m length/0.5 m height/0.5 m width and
consisted of wood and netting that allowed visual inspection. One end of the tunnel
was closed, while the other was open, making catching easier and motivating the
birds to run in that direction. The back of the mid-section was lined with marks every
20cm, as a scale for later data analysis. A camera (Sony Handycam HDR-SR12E,
SONY Japan) was placed away from the tunnel in lateral view, zooming in to fit the
entire middle section with the markers. To make the birds run, a broomstick was
used to tap the side of the cages, provoking the running. As they ran, the camera

11
took high-speed footage of each run. Each bird was allowed to rest 5 minutes prior
to running, and ran continuously for no more than 30 minutes, or until at least 15-20
acceptable runs at various speeds determined/chosen by the birds, were filmed.
Acceptable films were defined as trials where the birds ran in the middle of the
runway, and contained at least 3 continuous stride cycles, one stride cycle being foot
on ground-foot off ground-foot on ground.
All experiments were conducted at the same time of day, for a total period of 8
hours a day for two-three weeks, in summer (August/September) and winter
(December). In addition to run on level ground the birds were allowed to run on
inclines.
Tracker analysis
Videos of acceptable running trials were converted from a Sony .mte format to
Quickplayer .mov files, and analysed using TRACKER software v. 4.0 (Open Source
Physics, Cabrillo, CA, USA) by tracking the foot nearest the camera over a minimum
of 3 continuous strides (fig. 5). Stride frequency, stride length, swing and stance
time, duty factor and average speed were the parameters calculated.

12
Figure 5: Screencapture of video analysis using Tracker software v. 4.0 (Open Source Physics, Cabrillo,
CA, USA). The blue marker in the back adjusts analysis to the actual measurements taken (in this case,
20 cm between each bar). Markers were placed on the foot nearest to the camera (red dots) when
foot was on ground, and at foot take-off, then touch down again. One stride consists of “foot on-foot
off-foot on”, and this was done for a minimum of 3 strides. Additionally, a marker was placed on the
birds beak at the first and last foot on, to calculate the distance and time run, thus calculating average
speed.
Stride frequency is the number of strides taken by the bird over a certain time period
measured in Hz. In this case the number of strides taken by the bird during the time
spent running from the analysis started to it ended.
Stride length is the distance between two successive placements of the same foot,
consisting of two step lengths.
Swing time is measured as the time used by the foot in the air during each stride.
Likewise, stance time is the time used by this foot on ground during each stride.
Together swing and stance time make up the period of one stride.
Duty factor was calculated as the fraction of one stride cycle where the foot is on the
ground.
Lastly, running speed was calculated by dividing the distance (x) ran by the bird, by
the time (t) used to run this distance.
Blood chemistry analysis
Animals
Indoor treadmill trials were conducted according to the same exact protocol as
employed in Lees et al., 2010, for energetic study, and using the very same birds, all
males, (9 birds in winter (mean body mass s.e. = 0.615 0.1042 kg), and 8 birds in
summer (mean body mass s.e. = 0.703 0.0629 kg)). These individuals were kept
in cages inside the department (90x90cm), under controlled thermoneutral
conditions [28] and simulated light cycles of Tromsø (69°46’N) for summer and
winter birds. The birds had ad libitum access to (Prydfugl Rype Komplett, TKM
αNO00000324 C) and water.

13
Blood sampling and blood gas analysis
The birds were run on a treadmill (Bremshey Trail Sport, Finland) at various speeds in
winter (0, 0.8, 2.7, 3.3 and 4.5 km/h)/(0, 0.22, 0.75, 0.92 and 1.25 m/s-1) and summer
(0, 1.8, 4.5 and 6.8 km/h)/(0, 0.5, 1.25 and 1.89 m/s-1) for 5 minutes, each bird
running only at one speed per day. Animals were collected individually for their
respective trials, straight from the cage and immediately placed in a Perspex®
chamber (30 x 26 x 61.7cm) placed on the treadmill edges, through which air was
pulled at a fixed flow rate of ~52 l min-1, by use of a vacuum pump. The birds were
left to rest for initially 5 minutes before the running or control (0 km/h), to allow
them to settle after the initial handling [1]. Then the birds ran (or rested as in case of
the control run at 0 km/h) for 5 min.
After each run or control, the birds were immediately secured by wrapping them in a
blanket with either their right or left wing exposed, and a blood sample was taken
from the exposed branchial vein in one of the two wings within 1-3 min of end of
running, using a 1ml heparinized syringe. The blood was then promptly (within max.
15 sec of sampling), injected into a blood analyzing machine (Radiometer ABL 700
(Bergmann Diagnostika AS, Oslo, Norway)) for analysis of plasma O2-tension (pO2),
plasma pCO2-tension (pCO2), hematocrit (Hct) and pH. The analyzer was calibrated as
per usual protocol (Radiometer ABL 700 User Manual) prior to analysis and running
of the birds. Care was taken to prevent blood from coming into contact with air. The
remaining blood was transferred to Eppendorff tubes and then on ice for up to 2
hours, sentrifuged and plasma was extracted, to be frozen at -78 degrees for later
lactate assay.
Lactate analysis
Analyses were carried out using a lactate assay kit (BioVision, Inc.; Mountain View,
CA, USA) 18 (winter) and 10 (summer) months after sampling. A standard curve was
made using lactate standard, and the plasma was then thawed and used to prepare
the lactate samples as per standard protocol (BioVision). After a 30 minute

14
incubation at room temperature, the samples were measured
spectrophotometrically at a wavelength of 570nm in a colorimetric assay using
SpectraMax® PLUS384 (Molecular Devices, Sunnyvale, CA, USA) and sample
readings were applied to the standard curve, to give the amount of lactate in each of
the samples. Lactate concentration (mM/l) in each of the samples were plotted
against their respective collection speeds. The amount of plasma only allowed for
duplicates to be tested.
Data analysis
The data from the kinematics trials included 10 birds, 6 females and 4 males, which
each gave a different amount of runs each. Because of this uneven amount of trials
per individual, a linear mixed model approach was used with a p-value of 0.05 (95%
confidence level) set as threshold. Since the term individual*speed was found
insignificant, and thus showed no signs of pseudoreplication, we ran an analysis of
covariance (ANCOVA) for the samples. We then checked if the interaction term
gender*speed was significant, and since the interaction term was found insignificant,
we removed it and the ANCOVA was re-run without it.
Lactate and blood gas data were displayed as mean + s.d.
Test for statistical analysis were conducted using SPSS v.19.0 (SPSS inc, Chicago, IL,
USA), while plots were made using Sigmaplot v.12 (Systat Software Inc., Chicago, IL,
USA).

15
III: Results
Biomechanics
Although experiments were carried out both during summer and winter, the winter
trials yielded no usable data material as the birds would not run steadily enough, or
even at all even though provoked to do so. Likewise, running on inclines proved to
be impossible, as the birds either stayed put when provoked or started taking off.
Our data is solely based on the data from the summer trials and it is this data I have
compared to the treadmill studies by Nudds et al. [2].
The same kinematic parametres (stride frequency, stride length, duty factor, swing
time and stance time) that were quantified in the initial study [2] were measured
while the birds ran overground.
Figure 6: Stride frequency (SF) plotted against running speed (U) for males (open circles) and females
(filled circles). The regression line fitted through the data is derived from the linear regression output,
and is SF = 1.54 + 1.23U (n = 389, r2= 0.840, p < 0.0001)
0,5 1,0 1,5 2,0 2,5
1,5
2,0
2,5
3,0
3,5
4,0
4,5
5,0
U (m s-1)
str
ide f
requency (
s-1)

16
Stride frequency displayed an expected and typical linear relationship with running
speed (U) (fig. 6). The regression line was described by SF = 1.54 + 1.23U (n = 389, r2=
0.840, p < 0.0001) for both genders pooled together. There were no obvious gender
differences, although statistics comparison showed that gender was an important
factor describing stride frequency when plotted against U (F397,2 = 24.88, p = 0.0001).
Their respective regression lines were given by SFF = 1.59 + 1.21U (n = 240, r2= 0.850,
p < 0.0001) and SFM = 1.46 + 1.24U (n = 149, r2= 0.826, p < 0.0001).
Figure 7: Stride length (SL) plotted against running speed (U) for males (open circles) and females
(filled circles). The regression line fitted through the data is derived from the linear regression output,
and is SL = 0.20 + 0.16U (n = 389, r2= 0.831, p < 0.0001).
Also, stride length (SL) showed a close linear relationship with U, with SL = 0.20 +
0.16U (n = 389, r2= 0.831, p < 0.0001, (fig. 7). Again, the increase in SL with increasing
U were different for the genders (F397,2= 32.91, p = 0.0001). Their respective
regression lines were given by SFF = 0.20 + 0.16U (n = 240, r2= 0.858, p < 0.0001) and
SFM = 0.22 + 0.16U (n = 149, r2= 0.788, p < 0.0001).
0,5 1,0 1,5 2,0 2,5
0,25
0,30
0,35
0,40
0,45
0,50
0,55
0,60
U (m s-1)
str
ide length
(m
)

17
Figure 8: Duty factor (DF) plotted against running speed (U) for males (open circles) and females
(filled circles). The regression line fitted through the data is derived from the linear regression output,
and is DF = 0.55 – 0.17U (n = 389, r2= 0.470, p < 0.0001).
Duty factor (DF) was inversely related to U (fig. 8), as expected, described by the
equation DF = 0.55 – 0.17U (n = 389, r2= 0.470, p < 0.0001). There were no significant
differences between genders in the relationship between DF and U (F397,2= 0.465, p
= 0.496).
0,5 1,0 1,5 2,0 2,5
duty
facto
r
0,1
0,2
0,3
0,4
0,5
0,6
U (m s-1)

18
Figure 9: Swing time (tswing) plotted against running speed (U) for males (open circles) and females
(filled circles). The regression line fitted through the data is derived from the nonlinear regression
output, and is tswing = 0.25 – 0.03U (n = 389, r2= 0.185, p < 0.0001).
In accordance with previous studies and that of the treadmill, swing time (tswing) did
not change much during the various speeds and remained around 0.2-0.25 s (fig. 9).
The relation is described by the equation tswing = 0.25 – 0.03U (n = 389, r2= 0.185, p <
0.0001). There were significant differences between genders in the relationship
between tswing and U (F397,2= 6.698, p = 0.010). Their respective regression lines were
given by SFF = 0.25 – 0.03U (n = 240, r2= 0.156, p < 0.0001) and SFM = 0.26 – 0.03U (n
= 149, r2= 0.250, p < 0.0001).
0,5 1,0 1,5 2,0 2,5
sw
ing t
ime (
s)
0,0
0,1
0,2
0,3
0,4
0,5
0,6
U (m s-1)
19
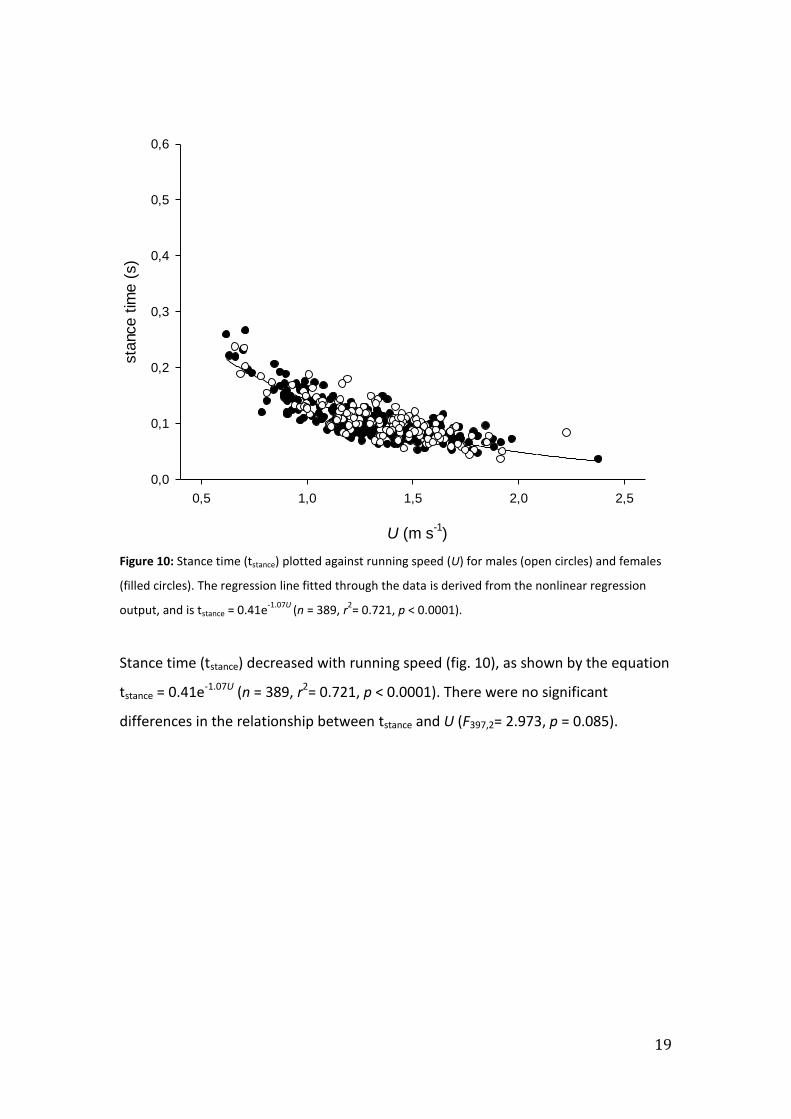
Figure 10: Stance time (tstance) plotted against running speed (U) for males (open circles) and females
(filled circles). The regression line fitted through the data is derived from the nonlinear regression
output, and is tstance = 0.41e-1.07U
(n = 389, r2= 0.721, p < 0.0001).
Stance time (tstance) decreased with running speed (fig. 10), as shown by the equation
tstance = 0.41e-1.07U (n = 389, r2= 0.721, p < 0.0001). There were no significant
differences in the relationship between tstance and U (F397,2= 2.973, p = 0.085).
0,5 1,0 1,5 2,0 2,5
sta
nce t
ime (
s)
0,0
0,1
0,2
0,3
0,4
0,5
0,6
U (m s-1)

20
Blood gases and lactate
Figure 11: Plasma venous O2 tension (pO2) (a) and plasma venous CO2 tension (pCO2) (b) in mmHg
plotted against speed (U). Open circles display results for summer and filled circles display results for
U (m s-1)
0 2 4 6 8
pO
2 (
mm
Hg)
0
10
20
30
40
50
60
70
U (m s-1)
0 2 4 6 8
pC
O2 (
mm
Hg)
0
10
20
30
40
50
60
(9)
(6) (8) (9)
(3)
(8) (8)
(8)
(7)
(8)
(8)
(8)(7)
(3)
(9)(8)
(6)
(9)
a)
b)

21
winter. Data points are displayed as means ± s.d. Numbers in parantheses indicate number of
individuals used (n).
U (m s-1)
0,0 0,5 1,0 1,5 2,0
pH
7,15
7,20
7,25
7,30
7,35
7,40
7,45
(8)
(8)
(8)
(7)
(8)
(6)
(8)
(9)
(3)
Figure 12: Blood venous pH values plotted against speed (U). The open circles display summer data
while filled circles display winter data. Data points are displayed as means ± s.d. Numbers in
parantheses indicate number of individuals used (n).
From figure 11 (a) one can see that pO2 showed a somewhat stable course with
increasing speed, both during winter and summer. At the same time, there was a
tendency for pCO2 to decrease with increasing speed during both seasons (fig. 11, b),
while pH tended to increase (fig. 12).

22
U (m s-1)
0,0 0,5 1,0 1,5 2,0
lacta
te (
mM
)
0,0
0,5
1,0
1,5
2,0
(8)
(8)
(8)(7)
(6)
(6)
(6)
(6)
(5)
Figure 13: Plasma venous lactate levels (mM) plotted against speed (U). Open circles display winter
data, while filled circles display summer data. Data points are displayed in mean ± s.d. Numbers in
parantheses indicate number of individuals used (n).
Mean plasma lactate levels remained between 1 and 2mM for all speeds used (fig.
13), both during winter and summer trials.

23
IV: Discussion
Biomechanics
In order to better visualize the comparison between my studies and that of Nudds et
al. [2], I have made a combine plot of their and mine regression lines for all the
kinematic parameters (fig. 14). Note that in these regression plots we have used
both females (n=6) and males (n=4), while their study used only males (n=6) [2],
since I either found that differences between genders were non-significant, or in
those cases where a significant gender effect was observed (stride frequency, stride
length and swing time), this was very small (see figs. 6, 7 and 9).

24
0,5 1,0 1,5 2,0 2,5
2,0
2,5
3,0
3,5
4,0
4,5
5,0
U (m s-1)
str
ide f
requency (
s-1)
0,5 1,0 1,5 2,0 2,5
0,2
0,3
0,4
0,5
0,6
0,7
U (m s-1)
str
ide length
(m
)
0,5 1,0 1,5 2,0 2,5
0,1
0,2
0,3
0,4
0,5
0,6
0,7
U (m s-1)
duty
facto
r
U (m s-1)
0,5 1,0 1,5 2,0 2,5
0,00
0,05
0,10
0,15
0,20
0,25
0,30
0,35
sw
ing t
ime (
s)
U (m s-1)
0,5 1,0 1,5 2,0 2,5
sta
nce t
ime (
s)
0,00
0,05
0,10
0,15
0,20
0,25
0,30
0,35
Figure 14: Comparison regression lines between my studies (solid lines) and those of Nudds et al.
(2011) (dotted lines) for stride frequency (a), stride length (b) and duty factor (c), swing time (d) and
stance time (e), plotted against speed (U) – within the range of speeds that were represented in both
studies.
Comparing the present study’s results with those of Nudds et al. [2], we can see
more or less the same qualitative trends for all parameters.
There are, however, differences in values, and in particular for duty factor (fig. 14, c)
and stance time (fig. 14, e). Thus, while Nudds’ values for duty factor were in consent
a) b)
c) d)
e)
25
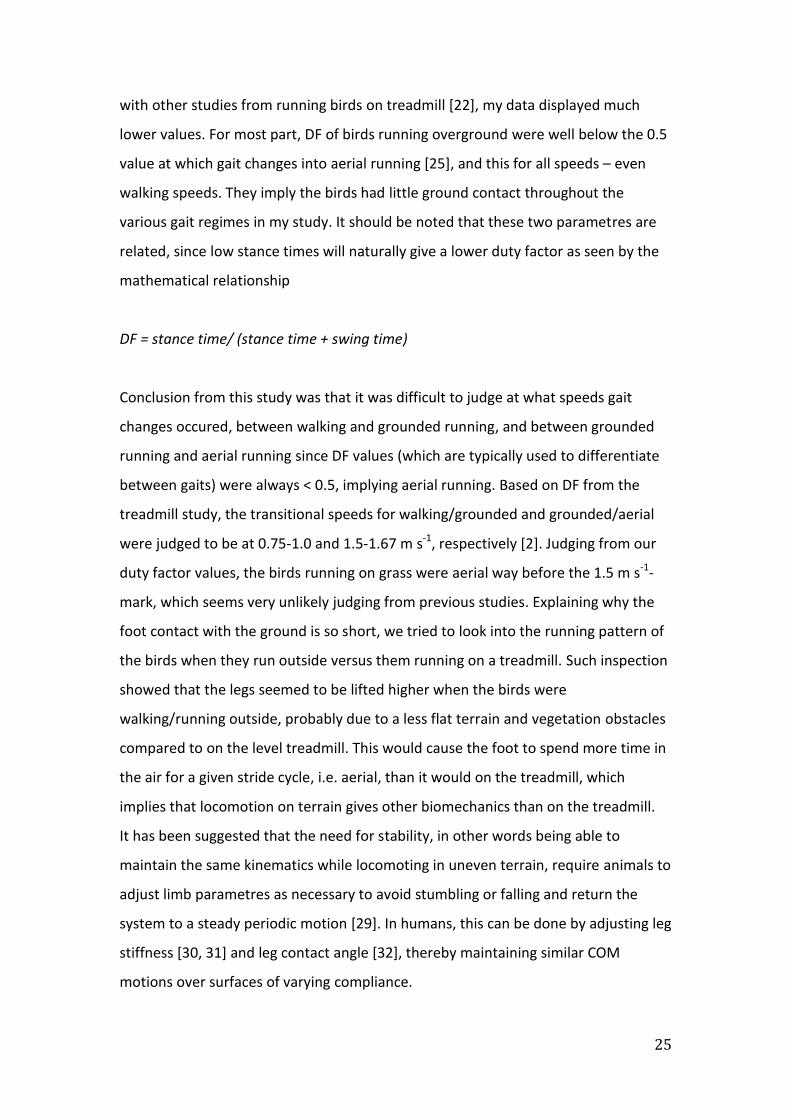
with other studies from running birds on treadmill [22], my data displayed much
lower values. For most part, DF of birds running overground were well below the 0.5
value at which gait changes into aerial running [25], and this for all speeds – even
walking speeds. They imply the birds had little ground contact throughout the
various gait regimes in my study. It should be noted that these two parametres are
related, since low stance times will naturally give a lower duty factor as seen by the
mathematical relationship
DF = stance time/ (stance time + swing time)
Conclusion from this study was that it was difficult to judge at what speeds gait
changes occured, between walking and grounded running, and between grounded
running and aerial running since DF values (which are typically used to differentiate
between gaits) were always < 0.5, implying aerial running. Based on DF from the
treadmill study, the transitional speeds for walking/grounded and grounded/aerial
were judged to be at 0.75-1.0 and 1.5-1.67 m s-1, respectively [2]. Judging from our
duty factor values, the birds running on grass were aerial way before the 1.5 m s-1-
mark, which seems very unlikely judging from previous studies. Explaining why the
foot contact with the ground is so short, we tried to look into the running pattern of
the birds when they run outside versus them running on a treadmill. Such inspection
showed that the legs seemed to be lifted higher when the birds were
walking/running outside, probably due to a less flat terrain and vegetation obstacles
compared to on the level treadmill. This would cause the foot to spend more time in
the air for a given stride cycle, i.e. aerial, than it would on the treadmill, which
implies that locomotion on terrain gives other biomechanics than on the treadmill.
It has been suggested that the need for stability, in other words being able to
maintain the same kinematics while locomoting in uneven terrain, require animals to
adjust limb parametres as necessary to avoid stumbling or falling and return the
system to a steady periodic motion [29]. In humans, this can be done by adjusting leg
stiffness [30, 31] and leg contact angle [32], thereby maintaining similar COM
motions over surfaces of varying compliance.

26
Another possible theory may be the effects of the treadmill itself, and the friction
created between the foot and the substrate. The moving band of the treadmill might
leave the foot on the moving belt as it moves, thereby actively elongating the stance
time by causing the foot to stay in contact with the band for a longer period of time.
Outside, in the grassy terrain, we don’t have this effect, and the foot leaves the
ground earlier. A moving band might also cause the foot to make contact with the
substrate earlier than on natural ground, also increasing the duration of foot contact
with the substrate. This all leads to the foot spending a substantial longer time of the
stride cycle on the band, leading to a higher stance time and thus a larger duty
factor. Indeed, in one study comparing overground and treadmill running in humans,
it was found that the runners tended to stretch out the lead leg and let the support
foot move with the belt backwards, leading to an increased time of support and thus
a longer stance time [33]. Although these findings were seen in human subjects,
both birds and humans locomote bipedally and there would be no reason they
should differ too much in this aspect.
The active effect of the treadmill may also have an impact on stride length, as one
would think such an elongation of the contact with the leg would produce a longer
stride length on the treadmill. However, our results correlate very well with the
treadmill results for stride length.
Stride frequency is also very well correlated with the treadmill results, if not a little
bit higher in our studies (fig. 14, a). Usually larger birds like the ostrich and emu tend
to increase stride frequency as a mean of achieving greater speed, more so than
smaller birds like the quail and kiwi, which increase speed mainly by increasing stride
length relative to their size [23]. These differences have also been found to be
related to posture, where a more upright posture, like that of the ostrich, leads to
shorter strides than the more “horizontal”, crouched posture of the quail [34]. The
Svalbard ptarmigan utilizes a more upright posture and judging from the videos of
the birds running on the treadmill and those of them running outside on the grass, it
seems like they run more upright in the latter case than on the treadmill (fig. 15).

27
Figure 15: Screenshots of ptarmigan running on (a) treadmill and (b) grass.
One reason for this might, again, come from the need for stability when moving
around. The Svalbard ptarmigan’s natural habitat consists of uneven and partly rocky
terrain, both summer and winter, with the latter season adding the problem of snow
and slippery ice. Birds, like the Svalbard ptarmigan, possess several interesting
mechanical features in their locomotor system (fig. 16). They have a lower center of
gravity due to the fact that their COM is located under the hip near the knee, and
this should confer a higher level of stability [35].
a)
b)

28
Figure 16: (Side view) X-ray image of quail with lead balls to mark vertebral column anterior point (VCa), vertebral column posterior point (VCp), hip joint (H), knee joint (K), ankle joint (A), foot joint (F), toe tip (T), head point (Hd), and sternum keel point (StK). The center of mass is located approximately between the knees. Lead balls were stuck along one leg only to avoid confusion during the coordinate-extraction process. Coordinate frame is fixed to the hip joint. X0 is in the direction of motion. Z0 is the vertical axis. (from Hugel et al. 2011.)
Another point where treadmill studies may deviate from overground studies is in the
intrastride variations observed on the treadmill caused by energy transfer between
the runner and the treadmill [36]. This happens because the vertical component of
the ground reaction force (GRF) increases friction between the belt and the
supporting surface, resisting sliding movements, while the horizontal component of
the GRF opposes the movement of the belt during the terminal stance. The force and
the horizontal velocity emounts to mechanical power, in essence the rate of energy
transfer between the runner and the treadmill, and all this is caused by speed
variations between different treadmills, and it may very well contribute to the many
conflicting results seen in the studies between treadmill and overground running
biomechanics.
Errors in judging the time when the foot is on or off the ground during analyzing -
mainly putting on the foot markers - poses yet another problem that may account
for the conflicting results seen. If there is a delay in the prediction of foot-on/-off,
29
one might overestimate the stance phase, and the opposite happens when one is
too quick [36]. This may very well be the case in my study, were the birds ran in the
grass, which may have impaired detailed visibility when analyzing movies.
The accomodation to running, both on the treadmill and overground, may have yet
an effect of the differences. In my study and those of Lees et al. [1], birds were
trained to run for weeks prior to the experiments on the treadmill. As I ran my
bloodsampling experiments right after they ended their experiments, the birds was
well accustomed to run on the treadmill. For the birds running overground they
were trained for a few days prior to filming, mostly to see which individuals could be
used for the trials. These birds were also used for treadmill experiments indoors just
prior to the outside experiments [2]. It has been experienced that trained runners
may adjust better to the mechanical differences in surface between treadmill and
running overground, than novice runners, indicating that training and experience
most likely can influence results [36].
Running stability in uneven terrain is another plausible explanation to the
differences between the treadmill and overground running. Stability is defined as the
system’s ability to reduce a deviation in the COM trajectory caused by onetime
perturbation [37]. Unlike humans, birds do not adjust leg stiffness to accomodate for
varying substrates [22]. Adjusting leg stiffness reduces the perturbations
experienced by the runner when changing underlayers, and is most caused by
inherent properties of the animals muscoskeletal system [30]. This means the runner
can maintain similar running kinematics (i.e. same SF, stance time etc.) despite the
difference in forward speed. If not adjusted, the ground contact time and
displacement of COM will increase as surface stiffness decreases. As stated, birds
cannot use this strategy for coping with surfaces of different properties and heights.
Instead, they utilize a crouched leg posture both able of shortening and lengthening,
providing a greater robustness for changes in terrain height, like that typically
experienced by the Svalbard ptarmigan in its natural environment.
This is done by lengthening the leg before foot touchdown, thus coping with a large
amount of distrurbances [37], for example as demonstrated by bird in fig. 15 (b.
Also, by running upright, the Svalbard ptarmigan aligns its sternal mass, which is
significantly increased during winter due to fat accumulation, with their COM, and

30
this may improve their mechanical advantage. The findings of a more upright
posture were also seen on the treadmill during the winter experiments when the
birds were at their fattest [1]. The birds, although at this time they weren’t able to
reach the aerial phase of running, were found to overall locomote more
economically per unit body mass during winter than summer, despite being twice as
heavy. The theory of posture influencing the mechanics of running were found as the
most plausible argument that the birds could carry this excess weight as
economically as they did [1].
Blood gases and lactate
From the results we got from the blood gas sampling (fig. 11 and 12) and lactate (fig.
13), there was nothing to indicate that the birds were relying on anaerobic
metabolism during the range of speeds tested (the same speeds used during the
calorimetry experiments by Lees et al., [1].
Lactate levels, which were probably the most interesting factor in this respect, were
all under 2 mM, with the exception of a few outliers, and showed no clear relation to
speed. Higher intensity of mechanical work will increase the production of lactic
acid, causing its concentration in the blood to rise, and the animal will rely on
anaerobic metabolism. The anaerobic threshold is the body’s inability to rid itself of
excess lactic acid that has accumulated in the blood, and a threshold of 4mM is set
as a typical approximate for aerobic capacity [38]. Thus, my data indicate that the
birds were relying on aerobic metabolism throughout [26]. On this basis it is
concluded that the use of indirect calorimetry was appropriate for the range of
speeds employed by Lees et al. [1]. The declining levels of pCO2 (fig. 11) with
increasing speed, accompanied by an increase in pH (fig. 12) might indicate that the
birds effectively are getting rid of more CO2 in the expired air as they run faster, and
that this may be tuned to increase with increased activity. Indeed, birds have a very
effective respiratory system to begin with more so than mammals [39], and this
supports the theory that locomotion and respiration may be coupled in order to
reduce energy expenditure [40]. Getting rid of excess pCO2 will also lower the acidity

31
and thus the pH effects of possible increases in lactate concentration, which may be
one beneficial consequence of the observed speed-related changes in both pCO2 and
pH.
32
V: Conclusion
The results of my study imply that there is indeed a difference in locomotor
mechanics between treadmill and overground running in these birds. Running
outside on a natural substrate gives data that would represent a more natural
situation for studying locomotion, as opposed to the artificial environment of the
treadmill. This concern DF and stance time in particular, which were significantly
lower overground than on the treadmill. This does not mean that the results of the
treadmill experiments on Svalbard ptarmigan, on which my study was based, are
non-valid, since they revealed between-season, between-gender and between-age
class results that presumably apply both in the “treadmill” and the natural situation.
Use of treadmill is not an ideal way of studying natural locomotion in the Svalbard
ptarmigan, which underlines that supplementary field experiments are required to
fully understand the locomotion energetics and biomechanics of these birds.
Nevertheless the treadmill remains an important tool to study locomotion energetics
and biomechanics due to the close control of exercise conditions that it offers, but
its limitations, such as those revealed in the present study, must be appreciated!
33
Adknowledgements
I am really grateful to all who supported and had the patience with me in completing
my thesis.
I want to express my sincerest gratitude to my supervisor Prof. Lars P. Folkow, for
giving me the opportunity to undertake a project under his outstanding supervision,
as well to my co-supervisor Prof. Karl-Arne Stokkan for encouraging me in my work.
I would also like to thank my co-supervisor Prof. Jonathan Codd (University of
Manchester) for allowing me to participate in his project, as well as his PhD students
John Lees and Peter Tickle for great help in using experimental techniques and
providing excellent advice.
Furthermore I would like to thank Tanja Hanebrekke for helping me with the lactate
analysis, and Geir Rudolfsen for invaluable help with biostatistics.
I am especially grateful to the staff responsible for technical issues and animal
husbandry at the department, John Ness, Hans Lian and Hans-Arne Solvang.
Lastly I am indebted to my family, who put up with me and offered help during this
period.

34
References
1. Lees J, Nudds R, Stokkan KA, Folkow L, Codd J. Reduced metabolic cost of
locomotion in Svalbard rock ptarmigan (Lagopus muta hyperborea) during
winter. PLoS ONE [Internet]. 2010 [cited 2013 May 8]; 5: e15490. Available
from:
http://www.plosone.org/article/info:doi/10.1371/journal.pone.0015490
2. Nudds RL, Folkow LP, Lees JJ, Tickle PG, Stokkan K A, Codd JR. Evidence for
energy savings from aerial running in the Svalbard rock ptarmigan (Lagopus
muta hyperborea). Proc Biol Sci [Internet]. 2011 Sep; [cited 2013 May 8];
278(1718): 2654-61. Available from:
http://www.ncbi.nlm.nih.gov/pmc/articles/PMC3136837/pdf/rspb2010274
2.pdf
3. Lees JJ, Nudds RL, Folkow LP, Stokkan KA, Codd JR. Understanding sex
differences in the cost of terrestrial locomotion. Proc Biol Sci [Internet].
2012 Feb; [cited May 16]; 27(1729): 826-32. Available from:
http://rspb.royalsocietypublishing.org/content/279/1729/826.full.pdf+htm
l
4. Lees JJ, Stokkan KA, Folkow LP, Codd JR. Locomotor development in the
Svalbard rock ptarmigan (Lagopus muta hyperborea). Polar Biol [Internet].
2012 Jun; [cited May 16]; 35(6): 867-74. Available from:
http://link.springer.com/article/10.1007/s00300-011-1131-x
5. Lees J, Folkow L, Stokkan KA, Codd J. The metabolic cost of incline
locomotion in the Svalbard rock ptarmigan (Lagopus muta hyperborea): the
effects of incline grade and seasonal fluctuations in body mass. J Exp Biol
[Internet]. 2013 Apr; [cited May 16]; 216(pt 8): 1355-63. Available from:
http://jeb.biologists.org/content/216/8/1355.full.pdf+html
6. Pedersen ÅØ, Lier M., Routti H, Christiansen HH, Fuglei E. Co-feeding
between Svalbard rock ptarmigan (Lagopus muta hyperborea) and Svalbard
reindeer (Rangifer tarandus platyrhynchus). Arctic [Internet]. 2006 Mar;

35
[cited 2013 May]; 59(1): 61-4. Available from:
http://www.jstor.org/stable/40512768
7. Mortensen A, Unander S, Kolstad M, Blix AS. Seasonal changes in body
composition and crop content of Spitzbergen ptarmigan Lagopus mutus
hyperboreus. Ornis Scandinavica [Internet]. 1983 Jun; [cited 2013 May 8];
14(2): 144-8. Available from: http://www.jstor.org/stable/3676018
8. Steen JB, Unander S. Breeding biology of the Svalbard rock ptarmigan
Lagopus mutus hyperboreus. Ornis Scandinavica [Internet]. 1985 Oct;
[cited 2013 May 16]; 16(3): 191-7. Available from:
http://www.jstor.org/stable/3676630
9. Stokkan KA, Mortensen A, Blix AS. Food-intake, feeding rhythm, and body-
mass regulation in Svalbard rock ptarmigan. Am J Physiol [Internet]. 1986
Aug; [cited 2013 May 8]; 251(2 Pt. 2): R264-R267. Available from:
http://ajpregu.physiology.org/content/251/2/R264.full.pdf+html
10. Lindgård K, Stokkan KA. Daylength control of food intake and body weight
in Svalbard ptarmigan Lagopus mutus hyperboreus. Ornis Scandinavica
[Internet]. 1989 Sep; [cited 2013 May 16]; 20(3): 176-80. Available from:
http://www.jstor.org/stable/3676910
11. Mortensen A, Blix AS. Seasonal changes in resting metabolic rate and
mass-specific conductance in Svalbard ptarmigan, Norwegian rock
ptarmigan and willow ptarmigan. Ornis Scandinavica [Internet]. 1986 Mar;
[cited 2013 May 8]; 17(1): 8-13. Available from:
http://www.jstor.org/stable/3676746
12. Mortensen A, Blix AS. Seasonal changes in energy intake, energy
expenditure, and digestibility in captive Svalbard rock ptarmigan and
Norwegian willow ptarmigan. Ornis Scandinavica [Internet]. 1989 Mar;
[cited 2013 May 16]; 20(1): 22-8. Available from:
http://www.jstor.org/stable/3676703
13. Reierth E, Stokkan KA. Dual entrainment by light and food in the Svalbard
ptarmigan (Lagopus mutus hyperboreus). J Biol Rhythms [Internet]. 1998
Oct; [cited 2013 May 8]; 13(5): 393-402. Available from:
http://jbr.sagepub.com/content/13/5/393.full.pdf+html

36
14. Reierth E, Van’t Hof TJ, Stokkan KA. Seasonal and daily variations in plasma
melatonin in the high-arctic Svalbard ptarmigan (Lagopus mutus
hyperboreus). J Biol Rhythms [Internet]. 1999 Aug; [cited 2013 May 8];
14(4): 314-9. Available from:
http://jbr.sagepub.com/content/14/4/314.full.pdf+html
15. Stokkan KA, Harvey S, Klandorf H, Unander S, Blix AS. Endocrine changes
associated with fat deposition and mobilization in Svalbard ptarmigan
(Lagopus mutus hyperboreus). Gen Comp Endocrinol [Internet]. 1985 Apr;
[cited 2013 May 16]; 58(1): 76-80. Available from:
http://www.sciencedirect.com/science/article/pii/001664808590137
6
16. Lindgård K, Näslund S, Stokkan KA. Annual changes in body mass in captive
Svalbard ptarmigan: role of changes in locomotor activity and food intake.
J Comp Physiol B [Internet]. 1995 Dec; [cited 2013 May 8]; 165(6): 445-9.
Available from: http://link.springer.com/article/10.1007/BF00261298
17. Tickle PG, Richardson MF, Codd JR. Load carrying during locomotion in the
barnacle goose (Branta leucopsis): the effect of load placement and size.
Comp Biochem Physiol A Mol Integr Physiol. 2010 Jul; 156 (3), 309-17.
18. Claessens LPAM. The skeletal kinematics of lung ventilation in three basal
bird taxa (emu, tinamou and guinea fowl). J Exp Zool [Internet]. 2009 Oct;
[cited 2013 May 8]; 311A(8): 586-99. Available from:
http://onlinelibrary.wiley.com/doi/10.1002/jez.501/pdf
19. Cavagna GA, Heglund NC, Taylor CR. Mechanical work in terrestrial
locomotion: two basic mechanisms for minimizing energy expenditure. Am
J Physiol [Internet]. 1977 Nov; [cited 2013 May 8]; 233(5): R243-R261.
Available from: http://ajpregu.physiology.org//content/233/5/R243
20. Kram R, Taylor CR. Energetics of running: a new perspective. Nature
[Internet]. 1990 Jul; [cited 2013 May 16]; 346(6281) 265-7. Available from:
http://www.nature.com/nature/journal/v346/n6281/pdf/346265a0.

37
21. McMahon TA, Valiant G, Frederick EC. Groucho running. J Appl Physiol
[Internet]. 1987 Jun; [cited 2013 May 8]; 62(6): 2326-37. Available from:
http://jap.physiology.org/content/62/6/2326.full.pdf+html
22. Gatesy SM, Biewener AA. Bipedal locomotion—effects of speed, size and
limb posture in birds and humans. J Zool. 1991 May; 224(1): 127–47.
23. Abourachid A. Kinematic parameters of terrestrial locomotion in cursorial
(ratites), swimming (ducks), and striding birds (quail and guinea fowl).
Comp Biochem Physiol A Mol Integr Physiol [Internet]. 2001 Dec; [cited
2013 May 8]; 131:113-9. Available from:
http://www.sciencedirect.com/science/article/pii/S1095643301004718
24. Taylor CR. Force development during sustained locomotion: a determinant
of gait, speed and metabolic power. J Exp Biol [Internet]. 1985 Mar; [cited
2013 May 8]; 115: 252-62. Available from:
http://jeb.biologists.org/content/115/1/253.full.pdf+html
25. Alexander, RM. Terrestrial locomotion. In: Goldspink G, Alexander RM
editors. Mechanics and energetics of animal locomotion. London:
Chapman & Hall; 1977. p 168-203.
26. Rubenson J, Heliams DB, Lloyd DG, Fournier PA. Gait selection in the
ostrich: mechanical and metabolic characteristics of walking and running
with and without an aerial phase. Proc Biol Sci [Internet]. 2004 May; [cited
2013 May 8]; 271(1543), 1091-9. Available from:
http://www.jstor.org/stable/4142537
27. Verstappen M, Aerts P. Terrestrial locomotion in the black-billed magpie. I.
Spatio-temporal gait characteristics. Motor Control. 2000 Apr; 4(2):150-64.
28. Stokkan KA, Lindgård K, Reierth E. Photoperiodic and ambient
temperature control of the annual body mass cycle in Svalbard ptarmigan.
J Comp Physiol B [Internet]. 1995 Oct; [cited 2013 May 16]; 165(5): 359-65.
Available from: http://link.springer.com/article/10.1007%2FBF00387306
29. Daley MA, Usherwood JR, Felix G, Biewener AA. Running over rough
terrain: guinea fowl maintain dynamic stability despite a large unexpected
change in substrate height. J Exp Biol [Internet]. 2006 Jan; [cited 2013 May

38
8]; 209 (Pt 1): 171-87. Available from:
http://jeb.biologists.org/content/209/1/171.full.pdf+html
30. Ferris DP, Louie M, Farley CT. Running in the real world: adjusting leg
stiffness for different surfaces. Proc R Soc Lond B Biol Sci [Internet]. 1998
Jun; [cited 2013 May 8]; 265: 989-94.* Available from:
http://rspb.royalsocietypublishing.org/content/265/1400/989.full.pdf
31. Ferris DP, Liang K, Farley CT. Runners adjust leg stiffness for their first step
on a new running surface. J Biomech [Internet]. 1999 Aug; [cited 2013 May
8]; 32: 787-94. Available from:
http://www.sciencedirectec.com/science/article/pii/S0021929099000780
32. Seyfarth A, Geyer H, Günther M, Blickhan R. A movement criterion for
running. J Biomech [Internet]. 2002 May; [cited 2013 May 16]; 35(5): 649-
55. Available from:
http://www.sciencedirect.com/science/article/pii/S0021929001002457
33. Nelson RC, Dillman CJ, Lagasse P, Bickett P. Biomechanics of overground
versus treadmill running. Med Sci Sports [Internet]. 1972 [cited 2013 May
8]; 4(4): 233-40. Available from: http://www.setantacollege.com/wp-
content/uploads/Journal_db/biomechanics%20of%20overground%20vers
us%20treadmill%20running.pdf
34. Abourachid A. Bipedal locomotion in birds: the importance of functional
parameters in terrestrial adaptation in Anatidae. Can J Zool [Internet].
2000 Nov; [cited 2013 May 8]; 78(11):1994-8. Available from:
http://www.nrcresearchpress.com/doi/pdf/10.1139/z00-112
35. Hugel V, Hackert R, Abourachid A. Kinematic modeling of bird locomotion
from experimental data. IEEE Trans Robot [Internet]. 2011 Apr [cited 2013
May 8]; 27(2): 185-200. Available from:
http://ieeexplore.ieee.org/stamp/stamp.jsp?tp=&arnumber=5722043
36. Scache AG, Blanch PD, Rath DA, Wrigley TV, Starr R, Bennell K L. A
comparison of overground and treadmill running for measuring the three-
dimensional kinematics of the lumbo-pelvic-hip complex. Clin Biomech
[Internet]. 2001 Oct; [cited 2013 May 8]; 16(8): 667-80. Available from:
http://www.sciencedirect.com/science/article/pii/S0268003301000614

39
37. Blum Y, Birn-Jeffery,A., Daley MA, Seyfarth A. Does a crouched leg posture
enhance running stability and robustness? J Theor Biol [Internet]. 2011 Jul;
[cited 2013 May 8]; 281: 97-106. Available from:
http://www.sciencedirect.com/science/article/pii/S002251931100230X
38. Yoshida T, Chida M, Ichioka M, Suda Y. Blood lactate parameters related to
aerobic capacity and endurance performance. Eur J Appl Physiol Occup
Physiol [Internet]. 1987; [cited May 16]; 56(1): 7-11. Available from:
http://link.springer.com/article/10.1007/BF00696368
39. Calder WA, Schmidt-Nielsen K. Panting and blood carbon dioxide in birds.
Am j Physiol [Internet]. 1968 Aug; [cited May 16]; 215(2): 477-82. Available
from: http://ajplegacy.physiology.org/content/215/2/477.full.pdf
40. Baudinette RV. The energetics and cardiorespiratory correlates of
mammalian terrestrial locomotion. J Exp Biol [Internet]. 1991 Oct; [cited
2013 May 16]; 160: 209-31. Available from:
http://jeb.biologists.org/content/160/1/209.full.pdf+html