Tecpro Systems Ltd. - Business...
13
COMPANY October 4, 2011 Tecpro Systems Ltd. Diversified business mix enhances visibility COMPANY REPORT CMP Rs220 Target Price Rs269 Potential Upside/Downside +22% Relative to Sensex Summary Against a backdrop of sharp slowdown in the Power Equipment sector, we initiate BUY on Tecpro Systems Ltd. (TPRO) with DCF based target price of Rs269 based on 1) Robust O/B of Rs45 bn (1.8x FY12E revenue) assuring visibility over next 2 years 2) diversified orders inflows from Power, Material handling (Steel and Cement) sectors and 3) rising in-house manufacturing led by technological tie-ups enabling higher backward integration and increased order inflows (including WHR). We expect TPRO’s OPM to contract to 13.0% led by shift in revenue-mix towards large BoP contracts by FY13E. We estimate TPRO’s revenue/earnings CAGR at 29/20% over FY11-13E. BoP projects such as Rayalaseema, CSPGCL Korba and Kakatiya cumulatively contribute 32/27% of FY12/13E revenue. At CMP of Rs220, the stock trades at 6.8/5.9x of our FY12/13E EPS of Rs32.5/37.5 respectively. Investment Highlights 12th plan fuel linkage ~50GW; order inflow healthy despite coal shortage We expect the 12th plan (FY13-17) thermal capacity addition to be lower i.e. ~62.5GW (CEA target of 76GW) on the back of 1) domestic coal shortage 2) SEB financial problems and 3) unavailability of import coal based projects. TPRO posted an impressive O/B/revenue CAGR of 74%/71% to Rs43.7/19.4 bn over FY07-11. Further, it gradually moved-up the value chain to become a full-fledged BoP player from small scale package manufacturer in 2007. The 12th plan thermal capacity addition translates to BoP opportunity worth Rs1,250 bn (CHP/AHP, BoP and MHP orders). For TPRO this translates to Rs24-69 bn p.a. opportunity over FY12-16E, respectively. No overcapacity scenario in BoP There is no overcapacity in the BoP segment vis-à-vis BTG implying comparatively lower pricing pressure. The large players like BHEL and L&T are focusing more on higher margin BTG portion in the BTG-BoP or EPC contracts. Secondly, utility owned players (Lanco, Tata Projects and Reliance Infra) are busy executing contracts for their flagship companies and are hardly bidding outside. Finally, smaller players are relegated to lower scale due to large number of packages involved in BoP. Thus, competitive environment is still benign for a dedicated BoP player like TPRO with only few meaningful competitors (McNally, TPRO, BGR, Indure and Elecon).Thus, going forward, TPRO is likely to restrict margin compression. O/B - Rs45 bn translates to earnings CAGR of 20% over FY11/13E TPRO’s O/B grew 87% to Rs45 bn (1.8x FY12E revenue) post IPO (Sept. ‘10) with average execution of 25 months. The company bagged two BoP orders worth Rs19.8 bn from APGENCO recently. These two BoP projects, Rayalaseema and Kakatiya (1*600MW each), are worth Rs12.5 bn and Rs7.3 bn, respectively and have average execution period of 30 months. We estimate revenue/earnings CAGR at 29/20% over FY11/13E (v/s management revenue guidance of 35%). Outlook and Valuation: Potential upside 22% – BUY With three BoP projects under execution, TPRO is well positioned to capture the 12th plan BoP opportunity. However, we estimate margin contraction of 350bps to 13.0% by FY13E owing to revenue-mix shift towards BoP. Presently, its peer group companies (BGR, McNally, TRF and Elecon) are trading at an average of 6.1x P/E and 4.9x EV/EBITDA on FY13E. We believe TPRO can command a premium over peers owing to 1) Higher return ratios 2) Strong visibility led by sustained order inflows 3) Technological tie-ups to consistently improve scope of operations and 4) Increased backward integration with entry into civil works and water segment. We have assigned a DCF-based TP of Rs269, translating to 7.2x FY13E EPS of Rs37.5. Initiate with BUY. Source: Capitaline BUY Nifty: 4,850; Sensex: 16,151 Analyst Piyush Nimgaonkar +91-22-4322 1187 [email protected] Sector Capital Goods Bloomberg / Reuters TPRO IN / TPSL.BO Shares o/s (mn) 50.5 Market cap. (Rs mn) 11,104 Market cap. (US$ mn) 225 3-m daily average vol. 14,137 Key Stock Data 52-week high/low Rs454/215 -1m -3m -12m Absolute (%) (11) (21) (46) Rel to Sensex (%) (7) (6) (26) Price Performance Promoters 52.6 FIIs/NRIs/OCBs/GDR 33.5 MFs/Banks/FIs 8.1 Non Promoter Corporate 2.1 Public & Others 3.7 Shareholding Pattern (%) 50 60 70 80 90 100 110 Oct-10 Nov-10 Dec-10 Jan-11 Feb-11 Mar-11 Apr-11 May-11 Jun-11 Jul-11 Aug-11 Sep-11 TPRO Sensex Table: Financial snapshot (Rs mn) Year Revenue EBITDA EBITDA (%) Adj. PAT EPS (Rs) P/E (x) EV/EBITDA (x) RoE (%) RoCE (%) FY10 14,549 2,262 15.5 1,097 24.8 8.9 5.6 42.8 39.8 FY11 19,673 3,243 16.5 1,325 26.2 8.4 5.4 31.7 30.3 FY12E 25,265 3,660 14.5 1,639 32.5 6.8 4.2 29.0 25.8 FY13E 32,671 4,243 13.0 1,893 37.5 5.9 4.7 25.5 24.2 Source: Company; IDBI Capital Research
Transcript of Tecpro Systems Ltd. - Business...
COMPANY
REPORT
October 4, 2011
Tecpro Systems Ltd. Diversified business mix enhances visibility
COMPANY
REPORT
CMP Rs220
Target Price Rs269
Potential Upside/Downside +22%
Relative to Sensex
Summary
Against a backdrop of sharp slowdown in the Power Equipment sector, we initiate BUY on Tecpro Systems Ltd. (TPRO) with DCF based target price of Rs269 based on 1) Robust O/B of Rs45 bn (1.8x FY12E revenue) assuring visibility over next 2 years 2) diversified orders inflows from Power, Material handling (Steel and Cement) sectors and 3) rising in-house manufacturing led by technological tie-ups enabling higher backward integration and increased order inflows (including WHR). We expect TPRO’s OPM to contract to 13.0% led by shift in revenue-mix towards large BoP contracts by FY13E.
We estimate TPRO’s revenue/earnings CAGR at 29/20% over FY11-13E. BoP projects such as Rayalaseema, CSPGCL Korba and Kakatiya cumulatively contribute 32/27% of FY12/13E revenue. At CMP of Rs220, the stock trades at 6.8/5.9x of our FY12/13E EPS of Rs32.5/37.5 respectively.
Investment Highlights
12th plan fuel linkage ~50GW; order inflow healthy despite coal shortage
We expect the 12th plan (FY13-17) thermal capacity addition to be lower i.e. ~62.5GW (CEA target of 76GW) on the back of 1) domestic coal shortage 2) SEB financial problems and 3) unavailability of import coal based projects. TPRO posted an impressive O/B/revenue CAGR of 74%/71% to Rs43.7/19.4 bn over FY07-11. Further, it gradually moved-up the value chain to become a full-fledged BoP player from small scale package manufacturer in 2007. The 12th plan thermal capacity addition translates to BoP opportunity worth Rs1,250 bn (CHP/AHP, BoP and MHP orders). For TPRO this translates to Rs24-69 bn p.a. opportunity over FY12-16E, respectively.
No overcapacity scenario in BoP
There is no overcapacity in the BoP segment vis-à-vis BTG implying comparatively lower pricing pressure. The large players like BHEL and L&T are focusing more on higher margin BTG portion in the BTG-BoP or EPC contracts. Secondly, utility owned players (Lanco, Tata Projects and Reliance Infra) are busy executing contracts for their flagship companies and are hardly bidding outside. Finally, smaller players are relegated to lower scale due to large number of packages involved in BoP. Thus, competitive environment is still benign for a dedicated BoP player like TPRO with only few meaningful competitors (McNally, TPRO, BGR, Indure and Elecon).Thus, going forward, TPRO is likely to restrict margin compression.
O/B - Rs45 bn translates to earnings CAGR of 20% over FY11/13E
TPRO’s O/B grew 87% to Rs45 bn (1.8x FY12E revenue) post IPO (Sept. ‘10) with average execution of 25 months. The company bagged two BoP orders worth Rs19.8 bn from APGENCO recently. These two BoP projects, Rayalaseema and Kakatiya (1*600MW each), are worth Rs12.5 bn and Rs7.3 bn, respectively and have average execution period of 30 months. We estimate revenue/earnings CAGR at 29/20% over FY11/13E (v/s management revenue guidance of 35%).
Outlook and Valuation: Potential upside 22% – BUY
With three BoP projects under execution, TPRO is well positioned to capture the 12th plan BoP opportunity. However, we estimate margin contraction of 350bps to 13.0% by FY13E owing to revenue-mix shift towards BoP. Presently, its peer group companies (BGR, McNally, TRF and Elecon) are trading at an average of 6.1x P/E and 4.9x EV/EBITDA on FY13E. We believe TPRO can command a premium over peers owing to 1) Higher return ratios 2) Strong visibility led by sustained order inflows 3) Technological tie-ups to consistently improve scope of operations and 4) Increased backward integration with entry into civil works and water segment. We have assigned a DCF-based TP of Rs269, translating to 7.2x FY13E EPS of Rs37.5. Initiate with BUY.
Source: Capitaline
BUY
Nifty: 4,850; Sensex: 16,151
Analyst
Piyush Nimgaonkar
+91-22-4322 1187
Sector Capital Goods
Bloomberg / Reuters TPRO IN / TPSL.BO
Shares o/s (mn) 50.5
Market cap. (Rs mn) 11,104
Market cap. (US$ mn) 225
3-m daily average vol. 14,137
Key Stock Data
52-week high/low Rs454/215
-1m -3m -12m
Absolute (%) (11) (21) (46)
Rel to Sensex (%) (7) (6) (26)
Price Performance
Promoters 52.6
FIIs/NRIs/OCBs/GDR 33.5
MFs/Banks/FIs 8.1
Non Promoter Corporate 2.1
Public & Others 3.7
Shareholding Pattern (%)
50
60
70
80
90
100
110
Oct
-10
Nov
-10
Dec
-10
Jan-
11
Feb
-11
Mar
-11
Apr
-11
May
-11
Jun-
11
Jul-1
1
Aug
-11
Sep
-11
TPRO Sensex
Table: Financial snapshot (Rs mn)
Year Revenue EBITDA EBITDA (%) Adj. PAT EPS (Rs) P/E (x) EV/EBITDA (x) RoE (%) RoCE (%)
FY10 14,549 2,262 15.5 1,097 24.8 8.9 5.6 42.8 39.8
FY11 19,673 3,243 16.5 1,325 26.2 8.4 5.4 31.7 30.3
FY12E 25,265 3,660 14.5 1,639 32.5 6.8 4.2 29.0 25.8
FY13E 32,671 4,243 13.0 1,893 37.5 5.9 4.7 25.5 24.2
Source: Company; IDBI Capital Research
2
Company Report – Tecpro Systems Ltd.
Investment Positives
12th plan fuel linkage ~50GW; order inflow healthy despite coal shortage
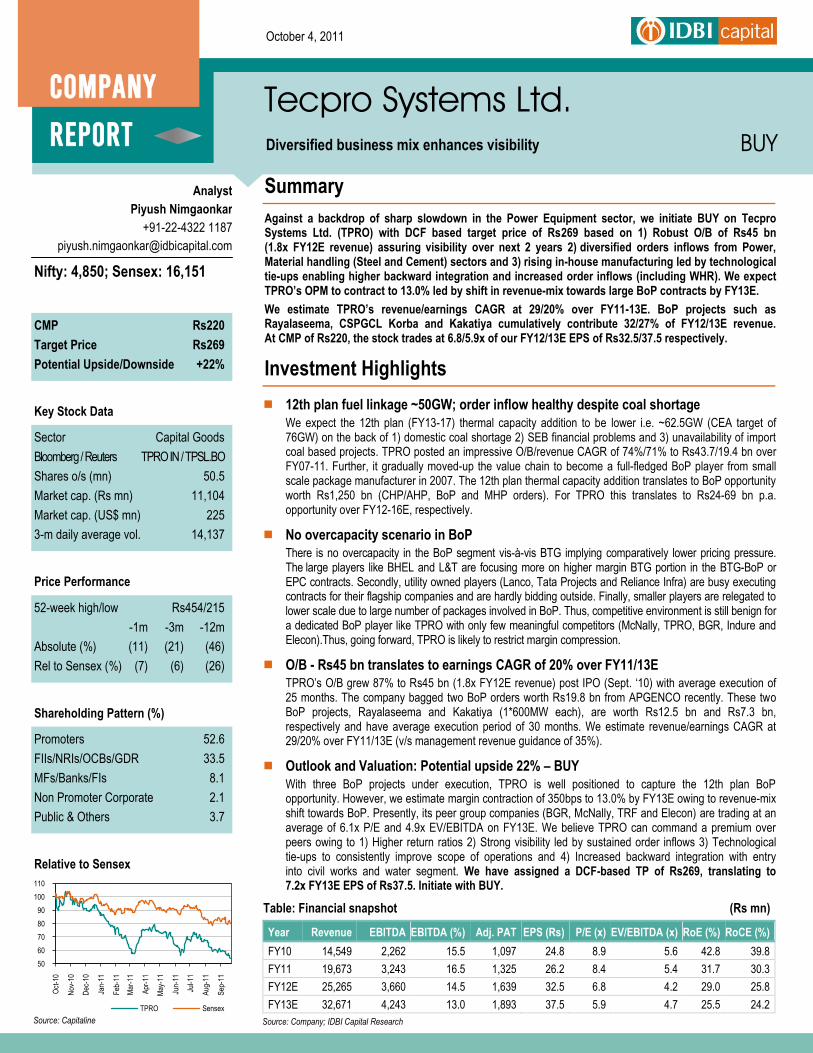
TPRO’s O/B/revenue grew impressively by 62%/85% CAGR to Rs20/14 bn over FY07-10. Further, its EBITDA/net
margins grew 96%/117% CAGR respectively over the same period. Thus, it maintained operating margin at ~1415%
while growing at a fast pace over the last four years.
Figure: O/B trend (Rs mn) Figure: Revenue trend (Rs mn)
* Post merger TAL and TPSL with TSL
Source: Company; IDBI Capital Research
12th plan (FY13-17) entails BoP opportunity worth Rs1,250 bn, good news for TPRO
As per CEA, the 12th plan capacity addition is targeted to be 100GW, of which 76.5GW is thermal. Despite domestic coal
shortage, land acquisition issues and environmental clearance delays, more than 50GW of capacity had already got coal
linkages or captive coal block allocation. However, our top down analysis suggests that the realistic thermal (coal +
lignite) capacity addition is likely to be ~80% of 76GW i.e. ~62.5GW. We have assumed higher 12th plan capacity
addition (v/s 63.5% in the 11th plan) primarily on back of 1) 12th plan BTG tendering of ~115-118GW (including UMPPs)
till date 2) delivery compression of 5-6 months for supercritical packages by entry of private BTG suppliers such as L&T,
BGR etc. and 3) increased BTG supply due to domestic capacity addition from private players.
Table: Expected capacity addition
Plan period Target Actual Achievement (%)
8th (92-97) 30,538 16,423 53.8
9th (97-02) 40,225 19,015 47.3
10th (02-07) 41,110 21,190 51.5
11th (07-12)* 78,700 50,000 63.5
12th (13-17)* 100,000 70,000 70.0
* Estimated capacity addition
Source: Company; IDBI Capital Research
It is pertinent to note that while BTG ordering process for the 12th plan is already over. The BoP ordering will commence
only now, with NTPC bulk tender related package tenders being first off the block. In our view, the ordering will get a leg
up in H2FY12, which is a near term positive for TPRO.
4,763
20,140
0
5,000
10,000
15,000
20,000
25,000
FY07 FY08 FY09 FY10*
Power (EPC+BoP+packages) Steel Cement Others
2,300
14,549
0
2,000
4,000
6,000
8,000
10,000
12,000
14,000
16,000
18,000
FY07 FY08 FY09 FY10*
Power (EPC+BoP+ packages) Steel Cement Others
CAGR
62% CAGR
85%
TPRO’s
revenue/earnings
grew secularly over
the last four years
Our assumption of
12th plan capacity
addition of 62.5GW is
conservative

Company Report – Tecpro Systems Ltd.
3
Table: Plan-wise BoP opportunity
10th Plan-A 11th Plan-UA 12th Plan-E
Thermal capacity addition 21,180 50,570 62,500
Coal Handling Plant (CHP) 23 68 70
Ash Handling Plant (AHP) 23 69 70
De-mineralized Water Plant (DM) 32 69 70
Cooling Tower 41 79 70
Chimney/ Stack 36 79 77
Fuel Oil System (FO) 22 71 70
PT Plant 36 76 70
Sub-total 213 511 497
BoP opportunity (Rs bn) 424 1,012 1,250
Source: Company; IDBI Capital Research
The BoP and CHP/AHP packages opportunity grew at 13% CAGR over the last decade and is estimated to be worth
Rs1,250 bn in the 12th plan. TPRO moved up the value chain successfully to BoP from single package orders and
bagged its first BoP project in 2007 from Chhattisgarh Electricity Board.
As per Aug-09 CEA report, TPRO commanded a market share of 19% in coal handling and 15% in Ash handling
business in the 11th plan. Overall, the company’s share for full-fledged BoP contracts has average ~7%in the 11th plan.
We have assumed TPRO’s market share for full-fledged BoP contracts as 8% for FY12 and 10% thereafter owing to big
size order wins like Rayalaseema and Kakatiya. This translates into order intake of Rs17-60 bn p.a. over FY12-16E.
Further, our assumptions of Rs2 bn for small EPC orders are based on the management guidance.
Table: Major order inflow assumptions from various segments (Rs mn)
FY12E FY13E FY14E FY15E FY16E
BoP expected ordering (MW) 6,250 9,375 12,500 15,625 18,750
Opportunity @ Rs20 mn/MW 125,000 187,500 250,000 312,500 375,000
CHP scope (%) 20 20 20 20 20
CHP opportunity 25,000 37,500 50,000 62,500 75,000
TPRO's share (%) 19 19 19 19 19
CHP order inflows 4,750 7,125 9,500 11,875 14,250
AHP scope (%) 15 15 15 15 15
AHP opportunity 18,750 28,125 37,500 46,875 56,250
TPRO's share (%) 15 15 15 15 15
CHP order inflows 2,813 4,219 5,625 7,031 8,438
CHP + AHP order inflows 7,563 11,344 15,125 18,906 22,688
BoP market share (%) 8 10 10 10 10
BoP order inflows 10,000 18,750 25,000 31,250 37,500
Total BoP orders 17,563 30,094 40,125 50,156 60,188
Small EPC orders 2,000 2,120 2,247 2,382 2,573
MHP orders (including WHR) 5,000 5,000 5,500 5,940 6,415
Sub-total order inflows 24,563 37,214 47,872 58,478 69,175
Source: Company; IDBI Capital Research
TPRO has also regularly won orders from material handling industry especially from Steel and Cement industry. The
company is also eyeing waste heat recovery (WHR) orders primarily from Cement and Steel industry driven by system
based power consumption.
AHP/CHP package
orders and BoP to
remain key focus areas
for TPRO
While assumptions on
opportunity are
conservative our market
share assumption for
TPRO are in line with
11th plan trend
4
Company Report – Tecpro Systems Ltd.
Table: Steel demand outlook
Company Capacity addition (mn tonnes) Total 12th plan outlay (Rs bn) Expected commissioning
SAIL 10.8 619 2015
TATA Steel 9.2 400 2016
JSW Steel 14.2 350 2015
JSPL 12.0 500 2015
Total Capex 46.2 1,869
Source: Company; IDBI Capital Research
The aforesaid green field capacity addition entails a capex of Rs1.9 trn over next 5-6 years. Thus, the coal handling
portion has scope of 8-9% in the total capex translating to ~Rs30 bn order inflow opportunity p.a. from Steel sector
alone.
Further, Cement and Port sector capex is also expected to provide material handling opportunities for TPRO going
forward. However, the management expects steel orders to recover first followed by cement in 1-2 years. We have
assumed order inflows of Rs5 bn in MHP orders (including WHR orders). Thus, we modeled total order inflow
assumption of Rs24-69 bn p.a. over FY12-16E.
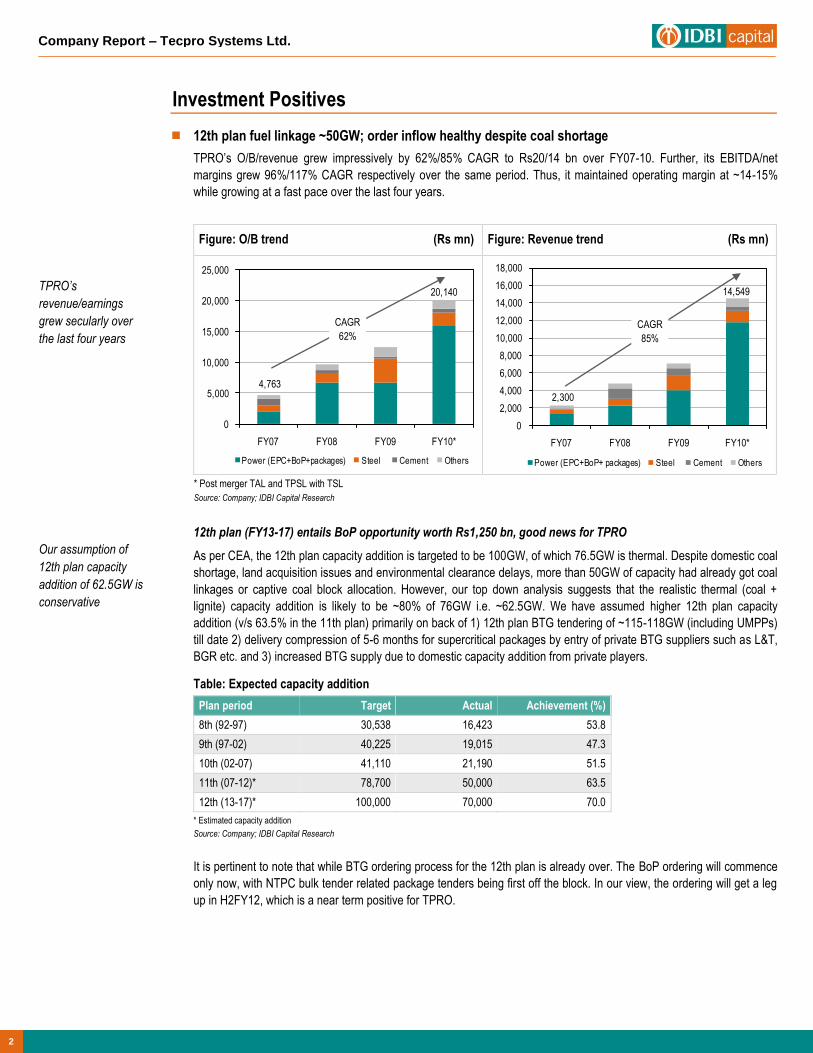
Figure: Revenue break-up (FY11) Figure: Revenue break-up (FY12E)
Source: Company; IDBI Capital Research
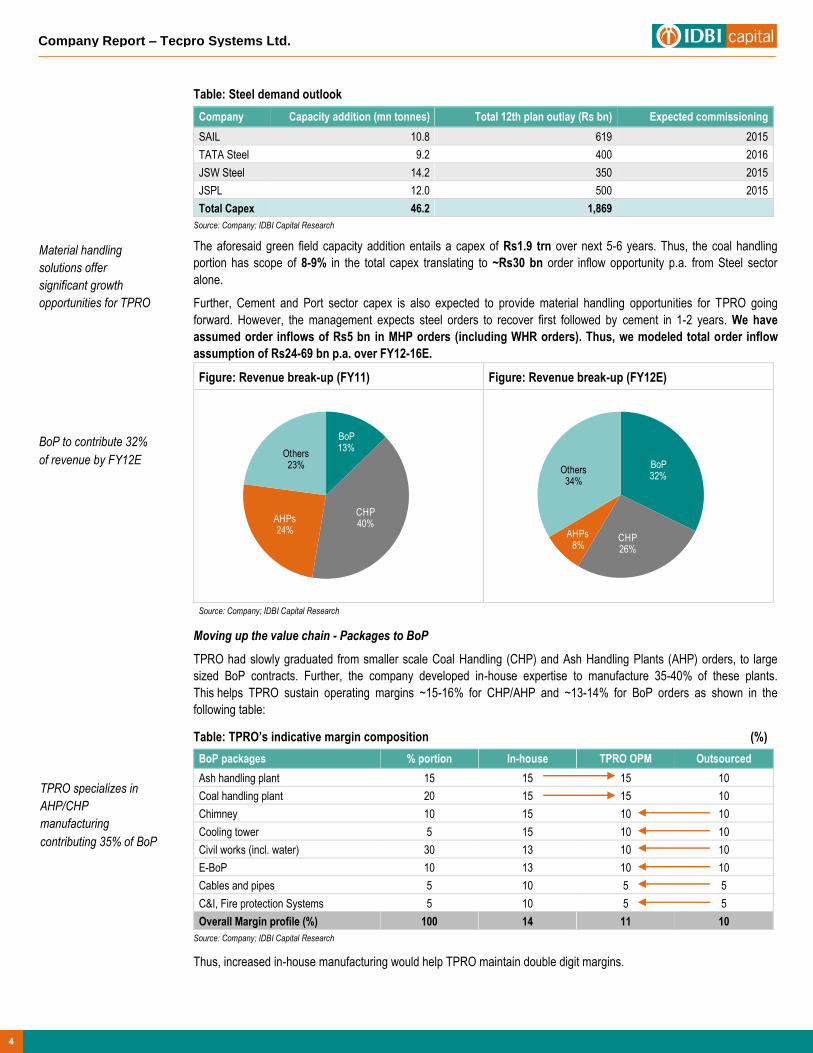
Moving up the value chain - Packages to BoP
TPRO had slowly graduated from smaller scale Coal Handling (CHP) and Ash Handling Plants (AHP) orders, to large
sized BoP contracts. Further, the company developed in-house expertise to manufacture 35-40% of these plants.
This helps TPRO sustain operating margins ~15-16% for CHP/AHP and ~13-14% for BoP orders as shown in the
following table:
Table: TPRO’s indicative margin composition (%)
BoP packages % portion In-house TPRO OPM Outsourced
Ash handling plant 15 15 15 10
Coal handling plant 20 15 15 10
Chimney 10 15 10 10
Cooling tower 5 15 10 10
Civil works (incl. water) 30 13 10 10
E-BoP 10 13 10 10
Cables and pipes 5 10 5 5
C&I, Fire protection Systems 5 10 5 5
Overall Margin profile (%) 100 14 11 10
Source: Company; IDBI Capital Research
Thus, increased in-house manufacturing would help TPRO maintain double digit margins.
BoP13%
CHP40%AHPs
24%
Others23% BoP
32%
CHP26%
AHPs8%
Others34%
Material handling
solutions offer
significant growth
opportunities for TPRO
BoP to contribute 32%
of revenue by FY12E
TPRO specializes in
AHP/CHP
manufacturing
contributing 35% of BoP
Company Report – Tecpro Systems Ltd.
5
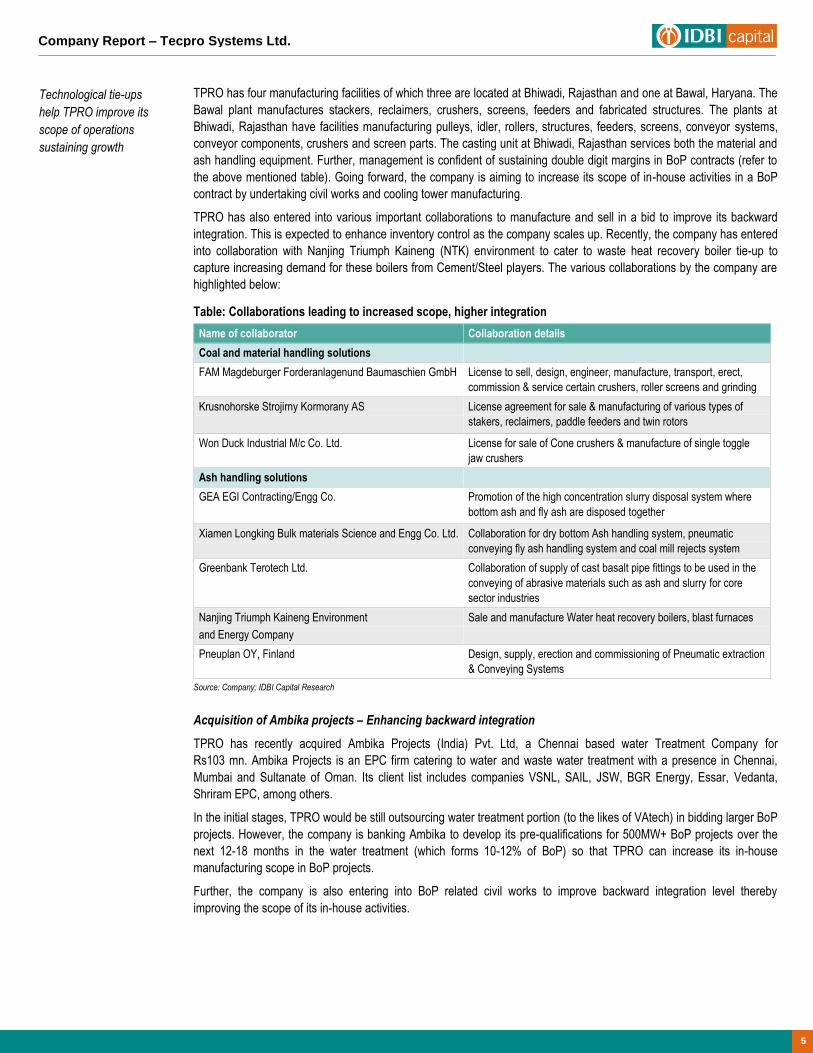
TPRO has four manufacturing facilities of which three are located at Bhiwadi, Rajasthan and one at Bawal, Haryana. The
Bawal plant manufactures stackers, reclaimers, crushers, screens, feeders and fabricated structures. The plants at
Bhiwadi, Rajasthan have facilities manufacturing pulleys, idler, rollers, structures, feeders, screens, conveyor systems,
conveyor components, crushers and screen parts. The casting unit at Bhiwadi, Rajasthan services both the material and
ash handling equipment. Further, management is confident of sustaining double digit margins in BoP contracts (refer to
the above mentioned table). Going forward, the company is aiming to increase its scope of in-house activities in a BoP
contract by undertaking civil works and cooling tower manufacturing.
TPRO has also entered into various important collaborations to manufacture and sell in a bid to improve its backward
integration. This is expected to enhance inventory control as the company scales up. Recently, the company has entered
into collaboration with Nanjing Triumph Kaineng (NTK) environment to cater to waste heat recovery boiler tie-up to
capture increasing demand for these boilers from Cement/Steel players. The various collaborations by the company are
highlighted below:
Table: Collaborations leading to increased scope, higher integration
Name of collaborator Collaboration details
Coal and material handling solutions
FAM Magdeburger Forderanlagenund Baumaschien GmbH License to sell, design, engineer, manufacture, transport, erect,
commission & service certain crushers, roller screens and grinding
Krusnohorske Strojirny Kormorany AS
License agreement for sale & manufacturing of various types of
stakers, reclaimers, paddle feeders and twin rotors
Won Duck Industrial M/c Co. Ltd. License for sale of Cone crushers & manufacture of single toggle
jaw crushers
Ash handling solutions
GEA EGI Contracting/Engg Co.
Promotion of the high concentration slurry disposal system where
bottom ash and fly ash are disposed together
Xiamen Longking Bulk materials Science and Engg Co. Ltd. Collaboration for dry bottom Ash handling system, pneumatic
conveying fly ash handling system and coal mill rejects system
Greenbank Terotech Ltd. Collaboration of supply of cast basalt pipe fittings to be used in the
conveying of abrasive materials such as ash and slurry for core
sector industries
Nanjing Triumph Kaineng Environment
and Energy Company
Sale and manufacture Water heat recovery boilers, blast furnaces
Pneuplan OY, Finland Design, supply, erection and commissioning of Pneumatic extraction
& Conveying Systems
Source: Company; IDBI Capital Research
Acquisition of Ambika projects – Enhancing backward integration
TPRO has recently acquired Ambika Projects (India) Pvt. Ltd, a Chennai based water Treatment Company for
Rs103 mn. Ambika Projects is an EPC firm catering to water and waste water treatment with a presence in Chennai,
Mumbai and Sultanate of Oman. Its client list includes companies VSNL, SAIL, JSW, BGR Energy, Essar, Vedanta,
Shriram EPC, among others.
In the initial stages, TPRO would be still outsourcing water treatment portion (to the likes of VAtech) in bidding larger BoP
projects. However, the company is banking Ambika to develop its pre-qualifications for 500MW+ BoP projects over the
next 12-18 months in the water treatment (which forms 10-12% of BoP) so that TPRO can increase its in-house
manufacturing scope in BoP projects.
Further, the company is also entering into BoP related civil works to improve backward integration level thereby
improving the scope of its in-house activities.
Technological tie-ups
help TPRO improve its
scope of operations
sustaining growth

6
Company Report – Tecpro Systems Ltd.
No overcapacity scenario in BoP
BoP competitive intensity is expected to remain lower vis-a-vis to BTG on back of 1) lack of Chinese presence
2) High entry barriers with very few dedicated BoP players as competitors and 3) Lower profitability (12-13%) vis-à-vis
BTG (15-16%). The competitive scenario for TPRO still remains comparatively benign in the foreseeable future on back
of large BoP/package opportunity available in the 12th plan. There are four types of players present as follows:
Large EPC/BTG players: Also engage in BoP – BHEL, L&T and Punj Lloyd
Mid-sized players: BGR, Tecpro, Thermax, Indure, TRF, ThyssenKrupp, McNally and Elecon who are backward
integrated and have ability to execute BoP and smaller EPC/CPP projects
Power utility owned EPC players: Reliance EPC, Tata Projects, Lanco Infrastructure etc. – who are focused on
only in-house EPC/BoP projects
Small/midsized package manufacturers: Paharpur Cooling Towers, Simplex, VA Tech Wabag, Gammon etc
Table: Package-wise key manufacturers
Name of BoP package Key players
Coal handling plant (CHP) Tecpro, L&T, Elecon, TRF, ThyssenKrupp, McNally
Ash handling plant (AHP) Indure, Mecawber, Tecpro, McNally , DC Industrial
De-mineralized water plant Driplex Water, Doshi Ion Exchange, Thermax, Triveni
Fuel oil system BHEL, Techno Electric, Unitech M/C
Cooling tower Paharpur, Gammon, BGR, NBCC
Chimney Gammon, NBCC, Simplex
Control & instrumentations BHEL, Yokogawa, ABB, Honeywell
Switchyard/Switchgear (HT/LT) BHEL, Areva, ABB, L&T
Fire protection system Minimax, Lloyds, Tyco, Unitech M/C
Source: Company; IDBI Capital Research
Large EPC/BTG players such as L&T and BHEL mostly outsource BoP components to above mentioned players.
Further, few players such as Tata Projects, Reliance and Lanco Infrastructure generally execute EPC for their own
flagship utility companies and don’t bid for third party BoP/ EPC projects. ThyssenKrupp also scarcely bids for BoP
projects in India. Thus, it reduces competitive intensity for mid-sized players such as TPRO and BGR. Additionally,
Lanco and Tata Projects have awarded CHP/AHP packages to TPRO in the past.
Further, NBPPL (NTPC-BHEL BoP JV) is unlikely to create significant competition for TPRO as it would take another
2-3 years to compete meaningfully. NBPPL is seeking technology partners for coal and Ash handling plants. The
company is setting up its manufacturing plant in Chittoor district, near Tirupati. The company has been seen some delay
in land acquisition of 720 acres. Its BoP manufacturing plant is expected to come-up by 2013-14. Thus, the company’s
expansion plans are moving at a slow pace and there is no immediate competition to TPRO.
There are very few BoP/material handling players like McNally, BGR, TRF and Elecon, which are real competitors for
TPRO. Thus, the company’s competitive advantage lies in its in-house manufacturing of critical components of
AHP/CHPs, which contribute 35-40% of the total BoP contract. Thus, backward integration would help TPRO
maintain double digit margins in BoP/small EPC contracts.
Going forward, TPRO aims to maintain its market share of 19%/15% in both CHP/AHPs respectively and subsequently
aims to improve its market share in the BoP segment. Further, it has already pre-qualified for 500/600MW BoP projects.
However, as TPRO gains scale, we expect the company’s margins to moderate to 13.0% by FY13E driven by revenue-
mix shift towards large BoP projects.
Very few mid-sized BoP
players are real
competitors for TPRO
implying lower pricing
pressure
Company Report – Tecpro Systems Ltd.
7
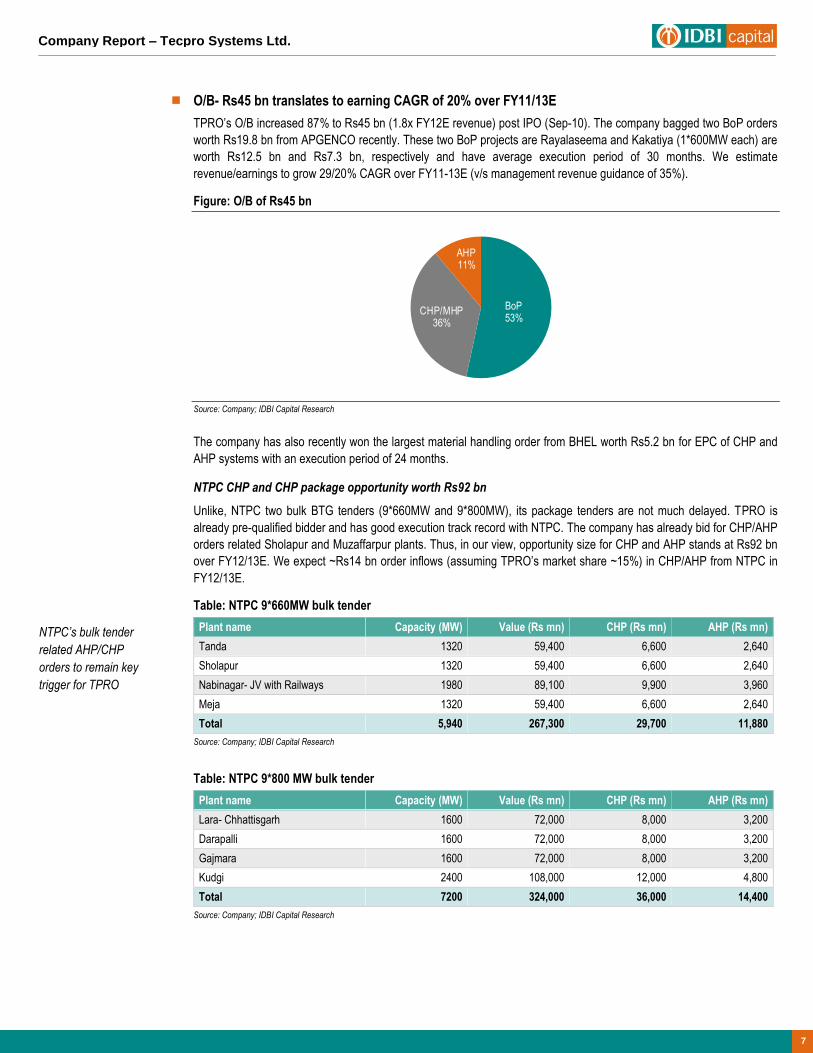
O/B- Rs45 bn translates to earning CAGR of 20% over FY11/13E
TPRO’s O/B increased 87% to Rs45 bn (1.8x FY12E revenue) post IPO (Sep-10). The company bagged two BoP orders
worth Rs19.8 bn from APGENCO recently. These two BoP projects are Rayalaseema and Kakatiya (1*600MW each) are
worth Rs12.5 bn and Rs7.3 bn, respectively and have average execution period of 30 months. We estimate
revenue/earnings to grow 29/20% CAGR over FY11-13E (v/s management revenue guidance of 35%).
Figure: O/B of Rs45 bn
Source: Company; IDBI Capital Research
The company has also recently won the largest material handling order from BHEL worth Rs5.2 bn for EPC of CHP and
AHP systems with an execution period of 24 months.
NTPC CHP and CHP package opportunity worth Rs92 bn
Unlike, NTPC two bulk BTG tenders (9*660MW and 9*800MW), its package tenders are not much delayed. TPRO is
already pre-qualified bidder and has good execution track record with NTPC. The company has already bid for CHP/AHP
orders related Sholapur and Muzaffarpur plants. Thus, in our view, opportunity size for CHP and AHP stands at Rs92 bn
over FY12/13E. We expect ~Rs14 bn order inflows (assuming TPRO’s market share ~15%) in CHP/AHP from NTPC in
FY12/13E.
Table: NTPC 9*660MW bulk tender
Plant name Capacity (MW) Value (Rs mn) CHP (Rs mn) AHP (Rs mn)
Tanda 1320 59,400 6,600 2,640
Sholapur 1320 59,400 6,600 2,640
Nabinagar- JV with Railways 1980 89,100 9,900 3,960
Meja 1320 59,400 6,600 2,640
Total 5,940 267,300 29,700 11,880
Source: Company; IDBI Capital Research
Table: NTPC 9*800 MW bulk tender
Plant name Capacity (MW) Value (Rs mn) CHP (Rs mn) AHP (Rs mn)
Lara- Chhattisgarh 1600 72,000 8,000 3,200
Darapalli 1600 72,000 8,000 3,200
Gajmara 1600 72,000 8,000 3,200
Kudgi 2400 108,000 12,000 4,800
Total 7200 324,000 36,000 14,400
Source: Company; IDBI Capital Research
BoP53%
CHP/MHP36%
AHP11%
NTPC’s bulk tender
related AHP/CHP
orders to remain key
trigger for TPRO

8
Company Report – Tecpro Systems Ltd.
Outlook and Valuation
With three BoP projects under execution, TPRO is well positioned to capture the 12th plan BoP opportunity.
We estimate TPRO’s revenue/earnings CAGR of 29/20% over FY11-13E (v/s management guidance of 35% revenue
CAGR) on account of strong O/B of Rs45 bn till date (1.8x FY12E revenue). We believe that order inflow scenario
could improve in H2FY12 on back of 1) finalization of NTPC CHP/AHP orders related to bulk tenders and 2) pick-up
in private/SEB BoP orders. We believe that TPRO is likely to benefit from State/Central PSU orders in FY12E.
Presently, its peer group companies (BGR, McNally, TRF and Elecon) are trading at an average of 6.1x P/E and
4.9x EV/EBITDA on FY13E. We believe TPRO can command a premium over peers owing to 1) Higher return ratios
2) Strong visibility led by sustained order inflows 3) Technological tie-ups to consistently improve scope of
operations and 4) Increased backward integration with entry into civil works and water segment. We have assigned
a DCF-based TP of Rs269, translating to 7.2x FY13E EPS of Rs37.5. Initiate with BUY.
DCF value at Rs269
We have assigned the risk free rate of 8.3% (10-yr G-sec yield rate), market risk premium is taken at 6% (to factor risk
for w/c and higher growth) and beta at 1.13x (13% premium to broader market), which gives a WACC of 12.6%. We have
assumed terminal value as 5.0x FY16E EBITDA multiple, which we believe is conservative. This translates to DCF value
of Rs269/share, at 7.2x FY13E EPS of Rs37.5.
Table: DCF valuation
(Rs mn) FY12E FY13E FY14E FY15E FY16E FY17E FY18E FY19E FY20E FY21E
Explicit FCFF 2,174 (3,633) (989) (213) 698 3,062 2,589 3,134 3,695 4,336
Terminal Value
60,173
FCFF 2,174 (3,633) (989) (213) 698 3,062 2,589 3,134 3,695 64,508
Discounting year 0.5 1.5 2.5 3.5 4.5 5.5 6.5 7.5 8.5 9.5
PV 2,051 (3,052) (740) (141) 414 1,630 1,228 1,326 1,394 1,458
NPV 13,602
No. of shares (mn) 50
NPV/Share (Rs) 269
Source: Company; IDBI Capital Research
Table: WACC Calculation
Risk-free rate 8.3%
Risk premium 6.0%
Beta (x) 1.13
Cost of Equity 15.1%
Weight of equity 0.6
Cost of Debt 12.2%
Tax Rate 34.5%
Post-tax cost of debt 8.0%
Weight of debt 0.6
WACC 12.6%
Source: Company; IDBI Capital Research
DCF value at
Rs269/share implies
target multiple of 7.2x
FY13E EPS of Rs37.5
Company Report – Tecpro Systems Ltd.
9
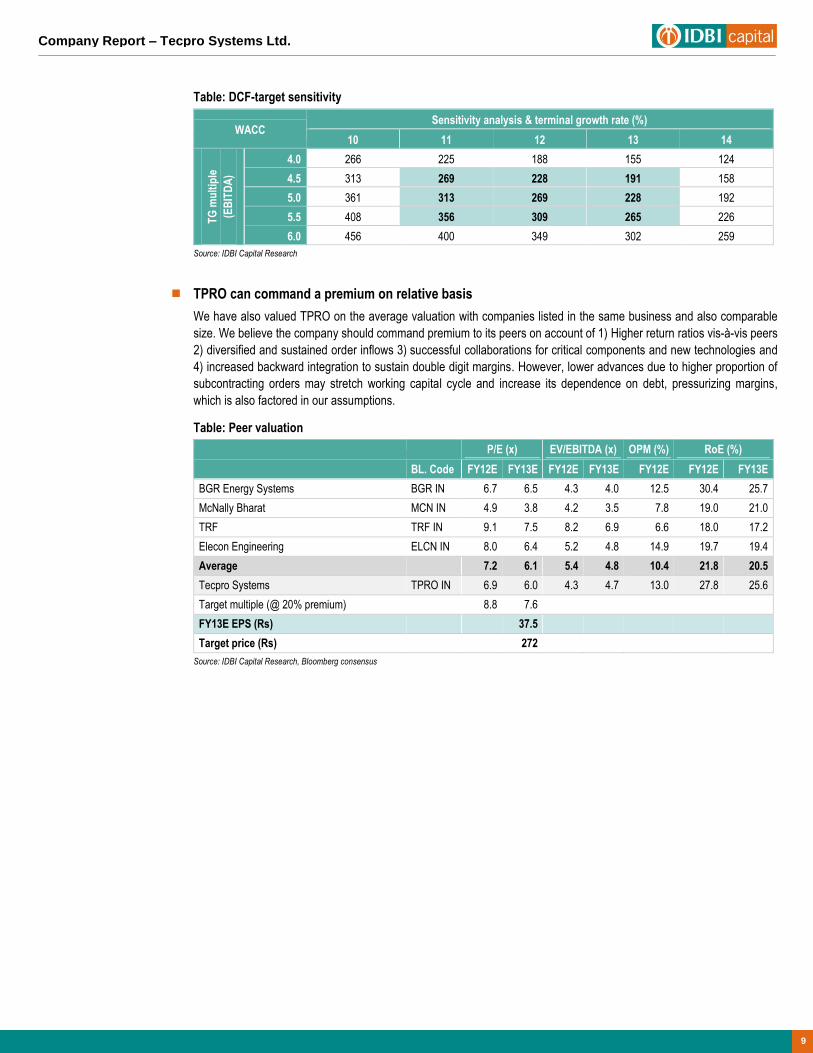
Table: DCF-target sensitivity
WACC Sensitivity analysis & terminal growth rate (%)
10 11 12 13 14
TG
mu
ltip
le
(EB
ITD
A)
4.0 266 225 188 155 124
4.5 313 269 228 191 158
5.0 361 313 269 228 192
5.5 408 356 309 265 226
6.0 456 400 349 302 259
Source: IDBI Capital Research
TPRO can command a premium on relative basis
We have also valued TPRO on the average valuation with companies listed in the same business and also comparable
size. We believe the company should command premium to its peers on account of 1) Higher return ratios vis-à-vis peers
2) diversified and sustained order inflows 3) successful collaborations for critical components and new technologies and
4) increased backward integration to sustain double digit margins. However, lower advances due to higher proportion of
subcontracting orders may stretch working capital cycle and increase its dependence on debt, pressurizing margins,
which is also factored in our assumptions.
Table: Peer valuation
P/E (x) EV/EBITDA (x) OPM (%) RoE (%)
BL. Code FY12E FY13E FY12E FY13E FY12E FY12E FY13E
BGR Energy Systems BGR IN 6.7 6.5 4.3 4.0 12.5 30.4 25.7
McNally Bharat MCN IN 4.9 3.8 4.2 3.5 7.8 19.0 21.0
TRF TRF IN 9.1 7.5 8.2 6.9 6.6 18.0 17.2
Elecon Engineering ELCN IN 8.0 6.4 5.2 4.8 14.9 19.7 19.4
Average 7.2 6.1 5.4 4.8 10.4 21.8 20.5
Tecpro Systems TPRO IN 6.9 6.0 4.3 4.7 13.0 27.8 25.6
Target multiple (@ 20% premium)
8.8 7.6
FY13E EPS (Rs)
37.5
Target price (Rs)
272
Source: IDBI Capital Research, Bloomberg consensus

10
Company Report – Tecpro Systems Ltd.
Risks and Concerns
Fuel linkage – A big worry
Power sector outlook is marred due to coal linkage problems faced by many greenfield and brownfield power projects.
Coal India Ltd. (CIL) is incrementally committing only 50-60% long term coal linkages for new power projects (under FSA
agreements). Further, CIL production growth is slated to be 5-6% CAGR v/s 9-10% CAGR for thermal capacity addition.
Additionally, importing coal is expensive for Power plants. Thus, if CIL is not able improve coal production, it could result
into lower capacity addition for the 12th plan implying reduced BoP ordering. Keeping this in mind, our assumption on
capacity addition at 62.5GW is conservative.
Delays in ordering process
The key risk that most of the power equipment/EPC players facing are tender delays in Central/State utilities, resulting
into lower revenue visibility. Though, TPRO’s O/B grew 105% YoY to Rs45 bn (1.8x FY12E revenue). Going forward, the
company may face delay in winning orders especially, large BoP orders. Further, TPRO risks lower orders from private
IPPs who’s funding cost have increased by 200-250bps in the last one year.
Compromising on advances for order inflows can pressurize margins
The company has compromised on advances (v/s Industry standard of ~10%) to gain maximum orders especially
subcontracting orders and MHP orders, where the advances are minimal or low. Thus, advances are expected to remain
in 3-4%, which is lower compared to ~10% advance for BoP segment. Thus, TPRO’s working capital cycle may get
stretched and increase its dependence on borrowings pressurizing margins.
Table: Advances as a proportion of O/B
O/B break-up (Rs mn) FY09 FY10 FY11 FY12E FY13E
Advances 206 656 661 2,769 1,790
% of O/B 1.6 3.3 1.5 5.7 2.9
Order book 12,529 20,140 43,710 48,817 60,765
Source: Company; IDBI Capital Research
Korba contract litigation unlikely to have much impact
CSPGCL's* award of Rs9.9 bn Korba project to the company has been contested by Indure, one of the other bidders to
the tender, alleging that its bid was arbitrarily and discriminatorily rejected by CSPGCL. Its writ petition was dismissed by
the High Court of Chhattisgarh in December 10, 2009, but Indure has filed a special leave petition in the Supreme Court.
The CSPGCL' Korba order accounts for 10% of the O/B as on 31st March, 2011. However, TPRO is already in advanced
execution stage and has already recognized 50% of revenue in this project. This puts it legally in a strong position.
* Chhattisgarh State Power Generation Company Ltd.
Dependence on technical collaborations
TPRO relies on technical collaborations with leading international companies to facilitate its business operations.
The company currently has technical collaborations with companies such as FAM Magdeburger, Forderanlagen und
Baumaschinen GmbH, PEYTEC Material Handling GmbH, Maschinenfabrik Liezen und Giesserei GmbH and Won Duck
Industrial Machinery Company Limited. This dependence on collaborations is a long term risk.
Fuel, order delay and
lower advances are key
risks for TPRO
FY11 advances figure
appears low as
company received
advance to the tune of
Rs2 bn in FY12
(May11)

Company Report – Tecpro Systems Ltd.
11
Company Profile
Tecpro Systems Ltd. (TPRO) is an established material handling company in India, engaged in providing turnkey solutions in
material handling, ash handling, Balance of Plant (BoP) and Engineering, Procurement and Construction (EPC) contracts.
The company designs, engineers, manufactures, sells, commissions and services a range of systems and equipment for the
core infrastructure related sectors like power, steel, cement and other industries. Over the years it has developed in-house
capabilities for providing comprehensive solutions in material handling and ash handling systems. With a vision to build an
integrated business serving the power sector, the company has expanded into various complimentary businesses across
different segments of the power sector.
Figure: Business model
Source: Company; IDBI Capital Research
TPRO was incorporated in 1990 and is promoted by Mr. Ajay Kumar Bishnoi and Mr. Amul Gabrani who are first generation
entrepreneurs with more than 25 years of experience in the material handling industry. The company started operations in the
material handling business in 2001 and up to March 31, 2010 it has executed 1,042 material handling orders and currently
has 269 material handling orders under execution. In order to expand its scope of services, it has integrated the ash handling
business of Tecpro Ashtech Limited (TAL, previously known as Mahindra Ashtech Limited) with its existing material handling
operations pursuant to the merger of TAL with TPRO. TAL was engaged in the business of ash handling systems for over
40 years.
Leveraging its capabilities in coal handling and ash handling, TPRO established project management track record and had
begun to focus on turnkey BoP contracts in the thermal power generation sector. The scope of services for BoP contracts
includes design and engineering, manufacturing and sourcing of equipment and packages, project management and
commissioning. TPRO was awarded the first BoP contract worth Rs9.9 bn by the CSGPCL for a 1x500 MW thermal power
plant at Korba West in August 2009 through a consortium.
TPRO had also entered the EPC segment for thermal power projects in 2007. The company manages erection and
commissioning of the Boiler, Turbine and Generator (BTG) packages along with undertaking the engineering, design, supply
and commissioning of other equipment and services in an EPC contract. The company either collaborates or outsources to a
third party supplier for providing BTG packages in EPC contracts. Currently, TPRO undertakes EPC contracts for small
thermal power plants. It has entered into technical collaborations and license agreements with several international
companies to strengthen its technical credentials and provide access to advanced technologies. TPRO has eight
collaborations for various material handling solutions and technologies and three collaborations in relation to ash handling
operations.
Tecpro Systems
Material handling solutions
Manufacture and sale of material handling equipment
Undertake turnkey material handling
contracts Focus on infrastructure
sector: Power, steel and
cement
Ash handling solutions
Manufacture and sale of ash handling equipment
Undertake turnkey ash
handling contracts Focus on infrastructure
sector: Power, steel and cement
BoP/EPC contracts for thermal power projects
Undertake BoP contracts for thermal power projects
Undertake EPC contracts for small
thermal power projects
Other businesses –through 100% Subsidiaries
Supply of air pollution control equipment
Turnkey solutions for
waste processing and biomass power generation
13% 30% 50% 7%
FY10 % revenue
12
Company Report – Tecpro Systems Ltd.
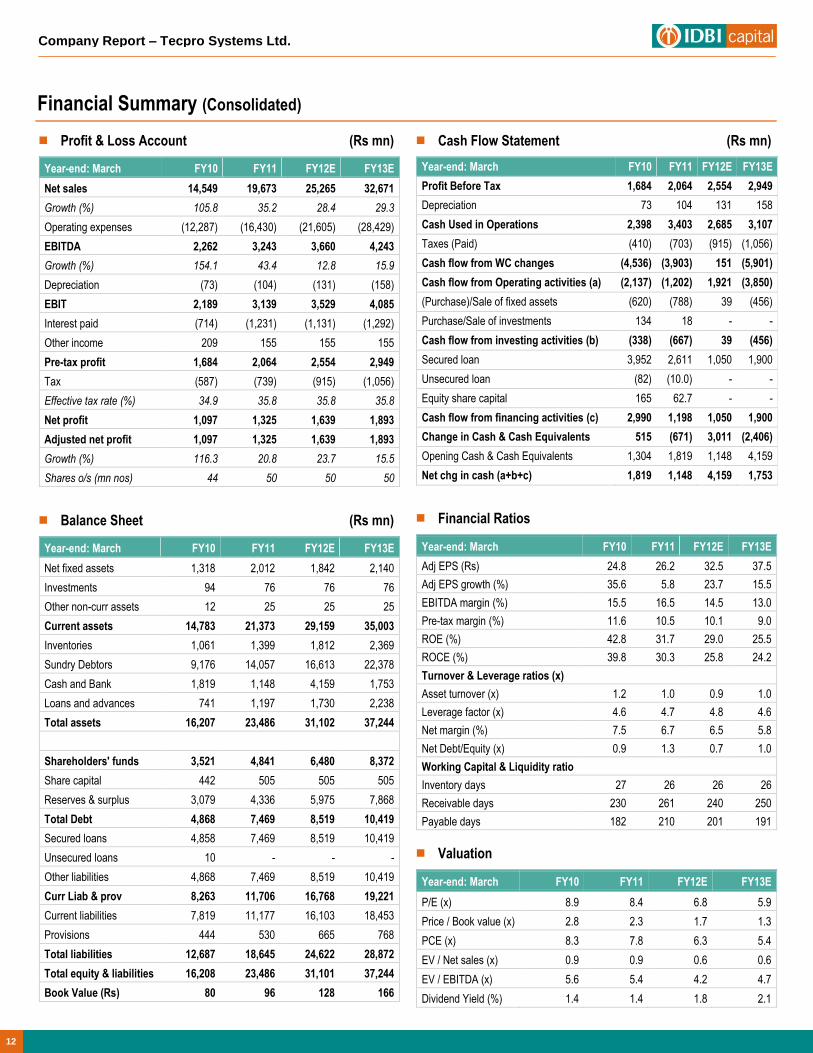
Financial Summary (Consolidated)
Profit & Loss Account (Rs mn)
Year-end: March FY10 FY11 FY12E FY13E
Net sales 14,549 19,673 25,265 32,671
Growth (%) 105.8 35.2 28.4 29.3
Operating expenses (12,287) (16,430) (21,605) (28,429)
EBITDA 2,262 3,243 3,660 4,243
Growth (%) 154.1 43.4 12.8 15.9
Depreciation (73) (104) (131) (158)
EBIT 2,189 3,139 3,529 4,085
Interest paid (714) (1,231) (1,131) (1,292)
Other income 209 155 155 155
Pre-tax profit 1,684 2,064 2,554 2,949
Tax (587) (739) (915) (1,056)
Effective tax rate (%) 34.9 35.8 35.8 35.8
Net profit 1,097 1,325 1,639 1,893
Adjusted net profit 1,097 1,325 1,639 1,893
Growth (%) 116.3 20.8 23.7 15.5
Shares o/s (mn nos) 44 50 50 50
Balance Sheet (Rs mn)
Year-end: March FY10 FY11 FY12E FY13E
Net fixed assets 1,318 2,012 1,842 2,140
Investments 94 76 76 76
Other non-curr assets 12 25 25 25
Current assets 14,783 21,373 29,159 35,003
Inventories 1,061 1,399 1,812 2,369
Sundry Debtors 9,176 14,057 16,613 22,378
Cash and Bank 1,819 1,148 4,159 1,753
Loans and advances 741 1,197 1,730 2,238
Total assets 16,207 23,486 31,102 37,244
Shareholders' funds 3,521 4,841 6,480 8,372
Share capital 442 505 505 505
Reserves & surplus 3,079 4,336 5,975 7,868
Total Debt 4,868 7,469 8,519 10,419
Secured loans 4,858 7,469 8,519 10,419
Unsecured loans 10 - - -
Other liabilities 4,868 7,469 8,519 10,419
Curr Liab & prov 8,263 11,706 16,768 19,221
Current liabilities 7,819 11,177 16,103 18,453
Provisions 444 530 665 768
Total liabilities 12,687 18,645 24,622 28,872
Total equity & liabilities 16,208 23,486 31,101 37,244
Book Value (Rs) 80 96 128 166
Cash Flow Statement (Rs mn)
Year-end: March FY10 FY11 FY12E FY13E
Profit Before Tax 1,684 2,064 2,554 2,949
Depreciation 73 104 131 158
Cash Used in Operations 2,398 3,403 2,685 3,107
Taxes (Paid) (410) (703) (915) (1,056)
Cash flow from WC changes (4,536) (3,903) 151 (5,901)
Cash flow from Operating activities (a) (2,137) (1,202) 1,921 (3,850)
(Purchase)/Sale of fixed assets (620) (788) 39 (456)
Purchase/Sale of investments 134 18 - -
Cash flow from investing activities (b) (338) (667) 39 (456)
Secured loan 3,952 2,611 1,050 1,900
Unsecured loan (82) (10.0) - -
Equity share capital 165 62.7 - -
Cash flow from financing activities (c) 2,990 1,198 1,050 1,900
Change in Cash & Cash Equivalents 515 (671) 3,011 (2,406)
Opening Cash & Cash Equivalents 1,304 1,819 1,148 4,159
Net chg in cash (a+b+c) 1,819 1,148 4,159 1,753
Financial Ratios
Year-end: March FY10 FY11 FY12E FY13E
Adj EPS (Rs) 24.8 26.2 32.5 37.5
Adj EPS growth (%) 35.6 5.8 23.7 15.5
EBITDA margin (%) 15.5 16.5 14.5 13.0
Pre-tax margin (%) 11.6 10.5 10.1 9.0
ROE (%) 42.8 31.7 29.0 25.5
ROCE (%) 39.8 30.3 25.8 24.2
Turnover & Leverage ratios (x)
Asset turnover (x) 1.2 1.0 0.9 1.0
Leverage factor (x) 4.6 4.7 4.8 4.6
Net margin (%) 7.5 6.7 6.5 5.8
Net Debt/Equity (x) 0.9 1.3 0.7 1.0
Working Capital & Liquidity ratio
Inventory days 27 26 26 26
Receivable days 230 261 240 250
Payable days 182 210 201 191
Valuation
Year-end: March FY10 FY11 FY12E FY13E
P/E (x) 8.9 8.4 6.8 5.9
Price / Book value (x) 2.8 2.3 1.7 1.3
PCE (x) 8.3 7.8 6.3 5.4
EV / Net sales (x) 0.9 0.9 0.6 0.6
EV / EBITDA (x) 5.6 5.4 4.2 4.7
Dividend Yield (%) 1.4 1.4 1.8 2.1
Company Report – Tecpro Systems Ltd.
13
Notes
Vikrant Oak – Head Institutional Equities (91-22) 4322 1385 [email protected]
Sonam H. Udasi – Head Research (91-22) 4322 1375 [email protected]
Dealing (91-22) 6637 1150 [email protected]
Key to Ratings
Stocks:
BUY: Absolute return of 15% and above; ACCUMULATE: 5% to 15%; HOLD: Upto ±5%; REDUCE: -5% to -15%; SELL: -15% and below.
IDBI Capital Market Services Ltd. (A wholly owned subsidiary of IDBI Ltd.) Equity Research Desk
3rd Floor, Mafatlal Centre, Nariman Point, Mumbai – 400 021. Phones: (91-22) 4322 1212; Fax: (91-22) 2285 0785; Email: [email protected]
SEBI Registration: NSE CM – INB230706631, NSE F&O – INF230706631, BSE CM – INB010706639, BSE F&O – INF010706639, NSDL – IN-DP-NSDL-12-96
Compliance Officer: Christina Fernandes; Email: [email protected]; Telephone: (91-22) 4322 1212 Disclaimer This document has been prepared by IDBI Capital Market Services Ltd (IDBI Capital) and is meant for the recipient only for use as intended and not for circulation. This document should not be reproduced or copied or made available to others. No person associated with IDBI Capital is obligated to call or initiate contact with you for the purposes of elaborating or following up on the information contained in this document.
Recipients may not receive this report at the same time as other recipients. IDBI Capital will not treat recipients as customers by virtue of their receiving this report.
The information contained herein is from the public domain or sources believed to be reliable. While reasonable care has been taken to ensure that information given is at the time believed to be fair and correct and opinions based thereupon are reasonable, due to the very nature of research it cannot be warranted or represented that it is accurate or complete and it should not be relied upon as such. In so far as this report includes current or historical information, it is believed to be reliable, although its accuracy and completeness cannot be guaranteed.
Opinions expressed are current opinions as of the date appearing on this material only. While we endeavor to update on a reasonable basis, the information discussed in this material, IDBI Capital, its directors, employees are under no obligation to update or keep the information current. Further there may be regulatory, compliance, or other reasons that prevent us from doing so.
Prospective investors and others are cautioned that any forward-looking statements are not predictions and may be subject to change without notice.
IDBI Capital, its directors and employees and any person connected with it, will not in any way be responsible for the contents of this report or for any losses, costs, expenses, charges, including notional losses/lost opportunities incurred by a recipient as a result of acting or non acting on any information/material contained in the report .
This is not an offer to sell or a solicitation to buy any securities or an attempt to influence the opinion or behaviour of investors or recipients or provide any investment/tax advice.
This report is for information only and has not been prepared based on specific investment objectives. The securities discussed in this report may not be suitable for all investors. Investors must make their own investment decision based on their own investment objectives, goals and financial position and based on their own analysis.
Trading in stocks, stock derivatives, and other securities is inherently risky and the recipient agrees to assume complete and full responsibility for the outcomes of all trading decisions that the recipient makes, including but not limited to loss of capital.
Opinions, projections and estimates in this report solely constitute the current judgment of the author of this report as of the date of this report and do not in any way reflect the views of IDBI Capital, its directors, officers, or employees.
This report is not directed or intended for distribution to, or use by, any person or entity who is a citizen or resident of or located in any locality, state, country or other jurisdiction, where such distribution, publication, availability or use would be contrary to law, regulation or which would subject IDBI Capital and affiliates to any registration or licensing requirement within such jurisdiction. The securities described herein may or may not be eligible for sale in all jurisdictions or to certain category of investors. Persons in whose possession this document may come are required to inform themselves of and to observe such restriction.
IDBI Capital, its directors or employees or affiliates, may from time to time, have positions in, or options on, and buy and sell securities referred to herein. IDBI Capital or its affiliates, during the normal course of business, from time to time, may solicit from or perform investment banking or other services for any company mentioned in this document or their connected persons or be engaged in any other transaction involving such securities and earn brokerage or other compensation or act as a market maker in the financial instruments of the company(ies) discussed herein or their affiliate companies or act as advisor or lender / borrower to such company(ies)/affiliate companies or have other potential conflict of interest.
This report may provide hyperlinks to other websites. Except to the extent to which the report refers to the website of IDBI Capital, IDBI Capital states that it has not reviewed the linked site and takes no responsibility for the content contained in such other websites. Accessing such websites shall be at recipient's own risk.
E-mail is not a secure method of communication. IDBI Capital Market Services Limited cannot accept responsibility for the accuracy or completeness of any e-mail message or any attachment(s). This transmission could contain viruses, be corrupted, destroyed, incomplete, intercepted, lost or arrive late. IDBI Capital, its directors or employees or affiliates accept no liability for any damage caused, directly or indirectly, by this email.